Afghan vs Cherokee Hearing Disability
COMPARE
Afghan
Cherokee
Hearing Disability
Hearing Disability Comparison
Afghans
Cherokee
2.7%
HEARING DISABILITY
97.6/ 100
METRIC RATING
72nd/ 347
METRIC RANK
4.2%
HEARING DISABILITY
0.0/ 100
METRIC RATING
331st/ 347
METRIC RANK
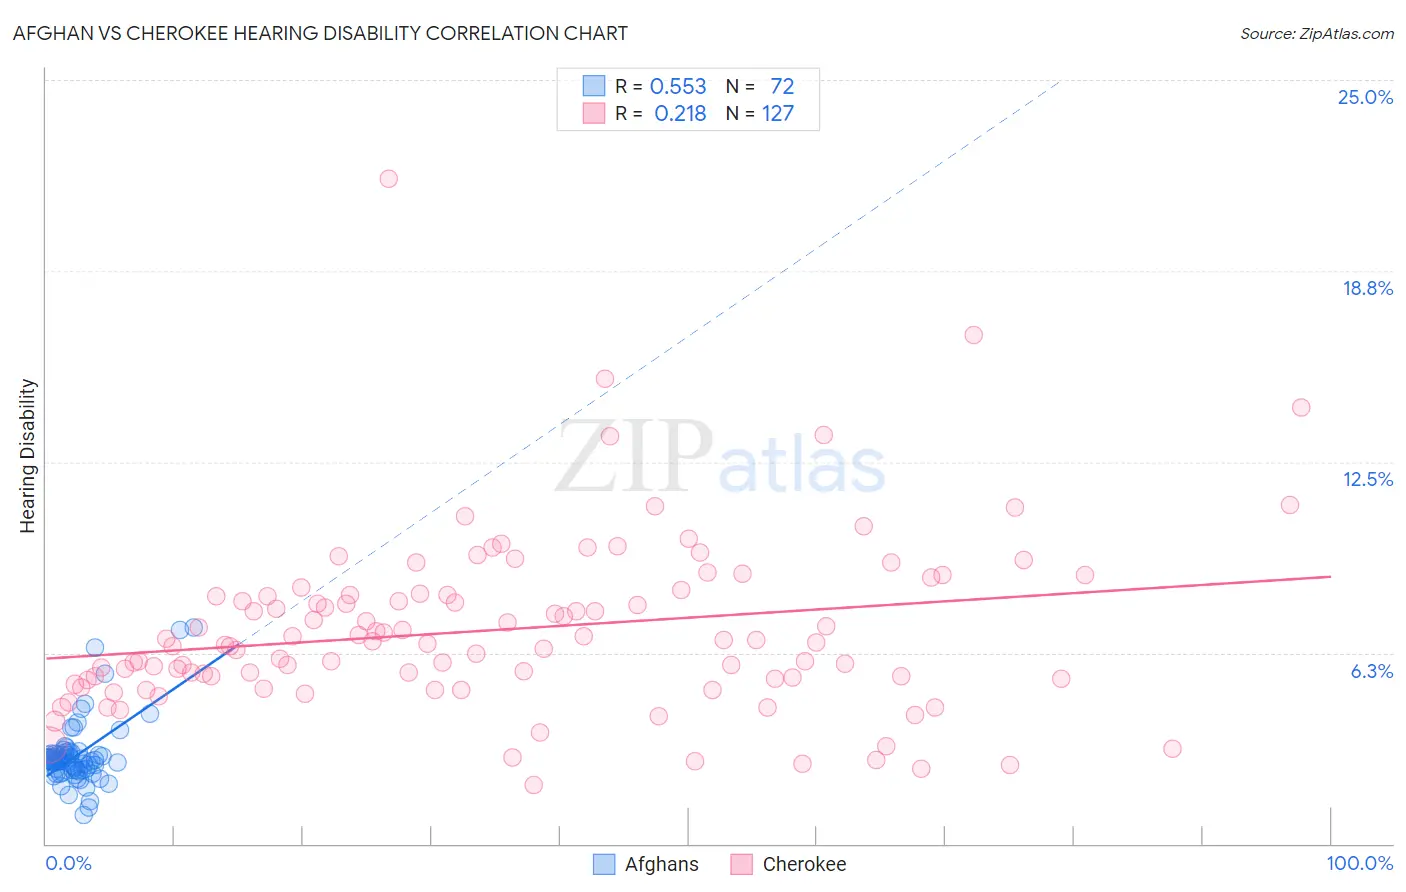
Afghan vs Cherokee Hearing Disability Correlation Chart
The statistical analysis conducted on geographies consisting of 148,839,750 people shows a substantial positive correlation between the proportion of Afghans and percentage of population with hearing disability in the United States with a correlation coefficient (R) of 0.553 and weighted average of 2.7%. Similarly, the statistical analysis conducted on geographies consisting of 493,388,222 people shows a weak positive correlation between the proportion of Cherokee and percentage of population with hearing disability in the United States with a correlation coefficient (R) of 0.218 and weighted average of 4.2%, a difference of 53.8%.
Hearing Disability Correlation Summary
| Measurement | Afghan | Cherokee |
| Minimum | 0.95% | 1.9% |
| Maximum | 7.1% | 21.8% |
| Range | 6.1% | 19.8% |
| Mean | 2.9% | 7.0% |
| Median | 2.7% | 6.6% |
| Interquartile 25% (IQ1) | 2.4% | 5.4% |
| Interquartile 75% (IQ3) | 3.0% | 8.1% |
| Interquartile Range (IQR) | 0.55% | 2.8% |
| Standard Deviation (Sample) | 1.1% | 2.9% |
| Standard Deviation (Population) | 1.1% | 2.9% |
Similar Demographics by Hearing Disability
Demographics Similar to Afghans by Hearing Disability
In terms of hearing disability, the demographic groups most similar to Afghans are Argentinean (2.7%, a difference of 0.080%), Immigrants from Korea (2.7%, a difference of 0.080%), Central American (2.7%, a difference of 0.10%), Immigrants from Saudi Arabia (2.7%, a difference of 0.11%), and Asian (2.7%, a difference of 0.11%).
| Demographics | Rating | Rank | Hearing Disability |
| Immigrants | Nepal | 98.3 /100 | #65 | Exceptional 2.7% |
| Immigrants | Belize | 98.2 /100 | #66 | Exceptional 2.7% |
| Egyptians | 98.1 /100 | #67 | Exceptional 2.7% |
| Immigrants | Africa | 98.0 /100 | #68 | Exceptional 2.7% |
| Nicaraguans | 97.9 /100 | #69 | Exceptional 2.7% |
| Peruvians | 97.7 /100 | #70 | Exceptional 2.7% |
| Central Americans | 97.7 /100 | #71 | Exceptional 2.7% |
| Afghans | 97.6 /100 | #72 | Exceptional 2.7% |
| Argentineans | 97.5 /100 | #73 | Exceptional 2.7% |
| Immigrants | Korea | 97.5 /100 | #74 | Exceptional 2.7% |
| Immigrants | Saudi Arabia | 97.5 /100 | #75 | Exceptional 2.7% |
| Asians | 97.5 /100 | #76 | Exceptional 2.7% |
| Immigrants | Malaysia | 97.5 /100 | #77 | Exceptional 2.7% |
| Mongolians | 97.4 /100 | #78 | Exceptional 2.7% |
| Colombians | 97.4 /100 | #79 | Exceptional 2.7% |
Demographics Similar to Cherokee by Hearing Disability
In terms of hearing disability, the demographic groups most similar to Cherokee are Native/Alaskan (4.2%, a difference of 0.15%), Houma (4.2%, a difference of 0.68%), Crow (4.2%, a difference of 0.94%), Tohono O'odham (4.2%, a difference of 0.95%), and Dutch West Indian (4.3%, a difference of 1.3%).
| Demographics | Rating | Rank | Hearing Disability |
| Osage | 0.0 /100 | #324 | Tragic 4.1% |
| Lumbee | 0.0 /100 | #325 | Tragic 4.1% |
| Potawatomi | 0.0 /100 | #326 | Tragic 4.1% |
| Arapaho | 0.0 /100 | #327 | Tragic 4.1% |
| Tohono O'odham | 0.0 /100 | #328 | Tragic 4.2% |
| Crow | 0.0 /100 | #329 | Tragic 4.2% |
| Natives/Alaskans | 0.0 /100 | #330 | Tragic 4.2% |
| Cherokee | 0.0 /100 | #331 | Tragic 4.2% |
| Houma | 0.0 /100 | #332 | Tragic 4.2% |
| Dutch West Indians | 0.0 /100 | #333 | Tragic 4.3% |
| Aleuts | 0.0 /100 | #334 | Tragic 4.3% |
| Kiowa | 0.0 /100 | #335 | Tragic 4.3% |
| Creek | 0.0 /100 | #336 | Tragic 4.4% |
| Chickasaw | 0.0 /100 | #337 | Tragic 4.5% |
| Alaska Natives | 0.0 /100 | #338 | Tragic 4.5% |