Zip Codes with the Highest Percentage of Population Employed in Office & Administration in Green Valley, AZ
RELATED REPORTS & OPTIONS
Office & Administration
Green Valley
Compare Zip Codes
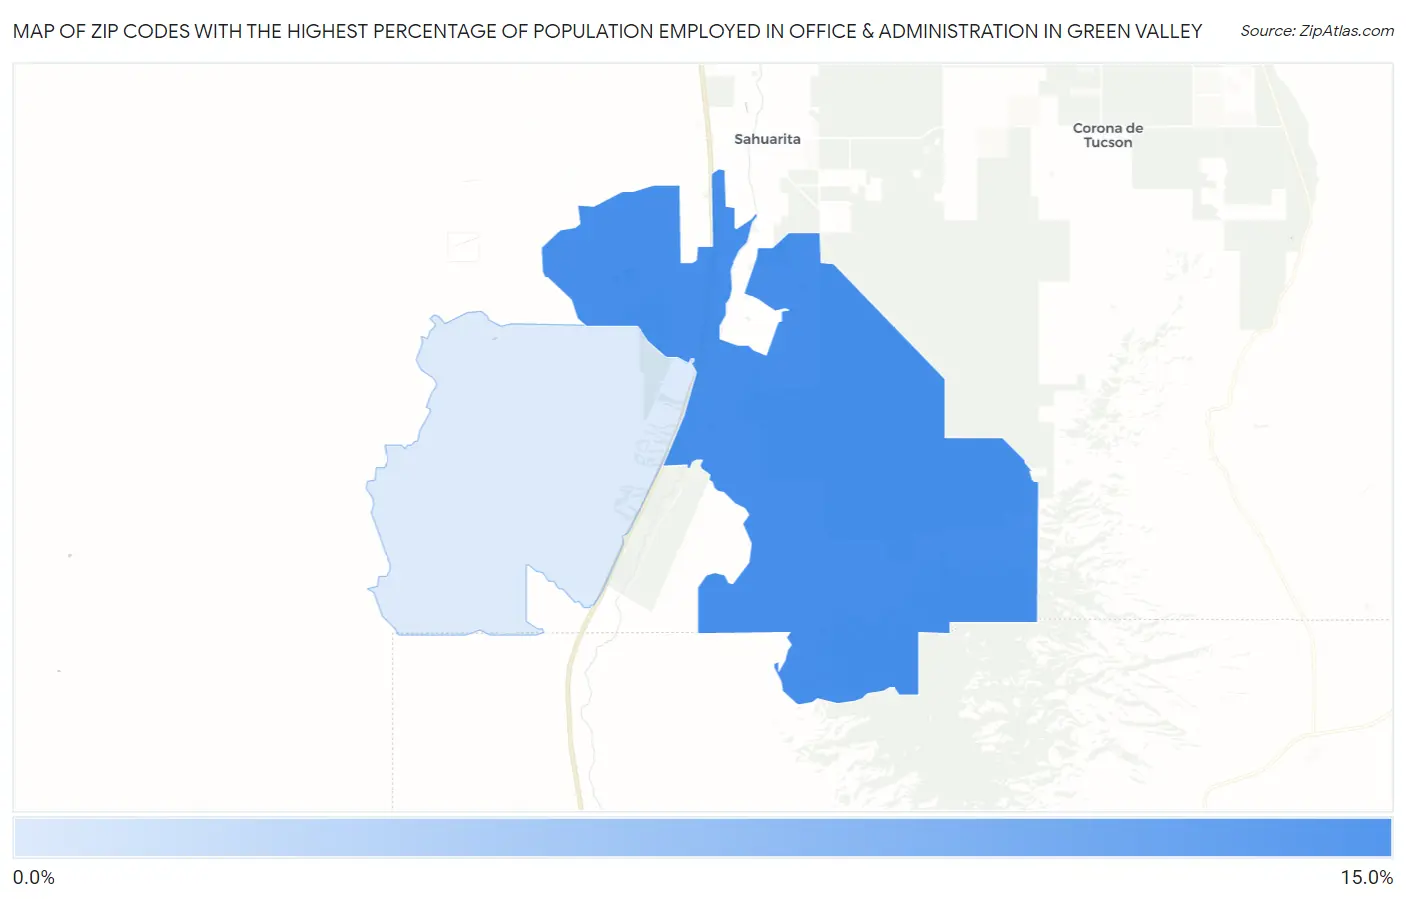
Map of Zip Codes with the Highest Percentage of Population Employed in Office & Administration in Green Valley
4.6%
13.0%
Zip Codes with the Highest Percentage of Population Employed in Office & Administration in Green Valley, AZ
| Zip Code | % Employed | vs State | vs National | |
| 1. | 85614 | 13.0% | 12.6%(+0.437)#155 | 10.9%(+2.17)#8,008 |
| 2. | 85622 | 4.6% | 12.6%(-7.99)#353 | 10.9%(-6.25)#28,470 |
1
Common Questions
What are the Top Zip Codes with the Highest Percentage of Population Employed in Office & Administration in Green Valley, AZ?
Top Zip Codes with the Highest Percentage of Population Employed in Office & Administration in Green Valley, AZ are:
What zip code has the Highest Percentage of Population Employed in Office & Administration in Green Valley, AZ?
85614 has the Highest Percentage of Population Employed in Office & Administration in Green Valley, AZ with 13.0%.
What is the Percentage of Population Employed in Office & Administration in Green Valley, AZ?
Percentage of Population Employed in Office & Administration in Green Valley is 9.1%.
What is the Percentage of Population Employed in Office & Administration in Arizona?
Percentage of Population Employed in Office & Administration in Arizona is 12.6%.
What is the Percentage of Population Employed in Office & Administration in the United States?
Percentage of Population Employed in Office & Administration in the United States is 10.9%.