Success, AR Map & Demographics
Success Map
Success Overview
$21,560
PER CAPITA INCOME
$50,625
AVG FAMILY INCOME
$51,250
AVG HOUSEHOLD INCOME
36.3%
WAGE / INCOME GAP [ % ]
63.7¢/ $1
WAGE / INCOME GAP [ $ ]
0.37
INEQUALITY / GINI INDEX
126
TOTAL POPULATION
61
MALE POPULATION
65
FEMALE POPULATION
93.85
MALES / 100 FEMALES
106.56
FEMALES / 100 MALES
51.9
MEDIAN AGE
2.9
AVG FAMILY SIZE
2.2
AVG HOUSEHOLD SIZE
68
LABOR FORCE [ PEOPLE ]
65.4%
PERCENT IN LABOR FORCE
14.7%
UNEMPLOYMENT RATE
Success Zip Codes
Success Area Codes
Income in Success
Income Overview in Success
Per Capita Income in Success is $21,560, while median incomes of families and households are $50,625 and $51,250 respectively.
| Characteristic | Number | Measure |
| Per Capita Income | 126 | $21,560 |
| Median Family Income | 29 | $50,625 |
| Mean Family Income | 29 | $50,662 |
| Median Household Income | 58 | $51,250 |
| Mean Household Income | 58 | $46,888 |
| Income Deficit | 29 | $0 |
| Wage / Income Gap (%) | 126 | 36.26% |
| Wage / Income Gap ($) | 126 | 63.74¢ per $1 |
| Gini / Inequality Index | 126 | 0.37 |
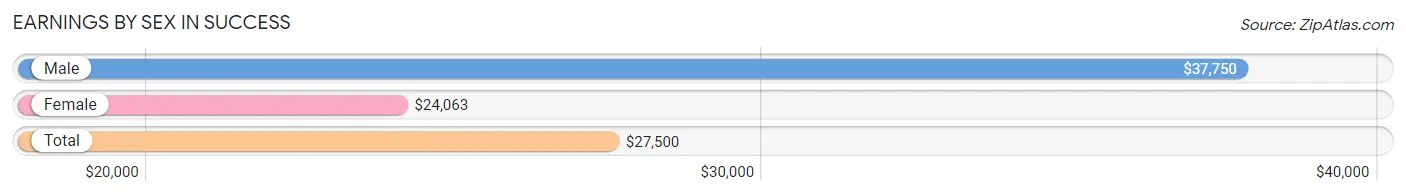
Earnings by Sex in Success
Average Earnings in Success are $27,500, $37,750 for men and $24,063 for women, a difference of 36.3%.
| Sex | Number | Average Earnings |
| Male | 35 (53.0%) | $37,750 |
| Female | 31 (47.0%) | $24,063 |
| Total | 66 (100.0%) | $27,500 |
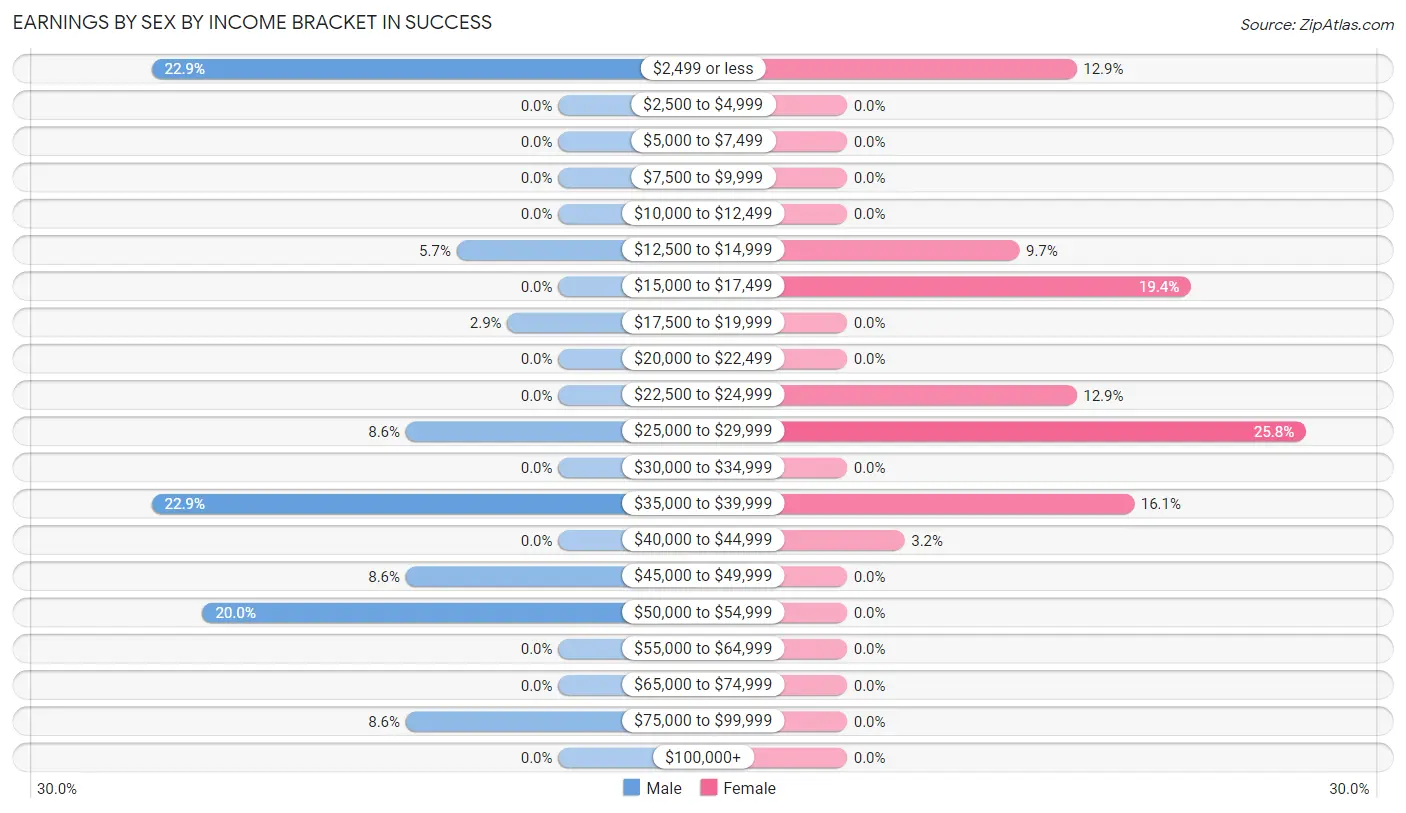
Earnings by Sex by Income Bracket in Success
The most common earnings brackets in Success are $2,499 or less for men (8 | 22.9%) and $25,000 to $29,999 for women (8 | 25.8%).
| Income | Male | Female |
| $2,499 or less | 8 (22.9%) | 4 (12.9%) |
| $2,500 to $4,999 | 0 (0.0%) | 0 (0.0%) |
| $5,000 to $7,499 | 0 (0.0%) | 0 (0.0%) |
| $7,500 to $9,999 | 0 (0.0%) | 0 (0.0%) |
| $10,000 to $12,499 | 0 (0.0%) | 0 (0.0%) |
| $12,500 to $14,999 | 2 (5.7%) | 3 (9.7%) |
| $15,000 to $17,499 | 0 (0.0%) | 6 (19.4%) |
| $17,500 to $19,999 | 1 (2.9%) | 0 (0.0%) |
| $20,000 to $22,499 | 0 (0.0%) | 0 (0.0%) |
| $22,500 to $24,999 | 0 (0.0%) | 4 (12.9%) |
| $25,000 to $29,999 | 3 (8.6%) | 8 (25.8%) |
| $30,000 to $34,999 | 0 (0.0%) | 0 (0.0%) |
| $35,000 to $39,999 | 8 (22.9%) | 5 (16.1%) |
| $40,000 to $44,999 | 0 (0.0%) | 1 (3.2%) |
| $45,000 to $49,999 | 3 (8.6%) | 0 (0.0%) |
| $50,000 to $54,999 | 7 (20.0%) | 0 (0.0%) |
| $55,000 to $64,999 | 0 (0.0%) | 0 (0.0%) |
| $65,000 to $74,999 | 0 (0.0%) | 0 (0.0%) |
| $75,000 to $99,999 | 3 (8.6%) | 0 (0.0%) |
| $100,000+ | 0 (0.0%) | 0 (0.0%) |
| Total | 35 (100.0%) | 31 (100.0%) |
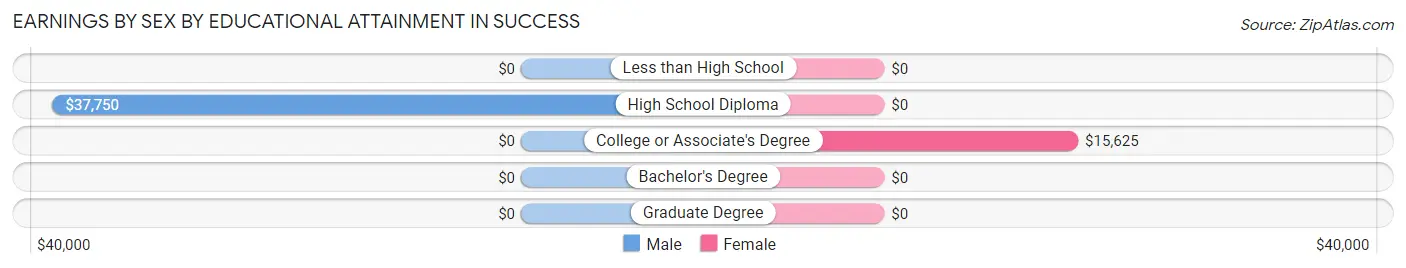
Earnings by Sex by Educational Attainment in Success
Average earnings in Success are $37,750 for men and $24,063 for women, a difference of 36.3%. Men with an educational attainment of high school diploma enjoy the highest average annual earnings of $37,750, while those with high school diploma education earn the least with $37,750. Women with an educational attainment of college or associate's degree earn the most with the average annual earnings of $15,625, while those with college or associate's degree education have the smallest earnings of $15,625.
| Educational Attainment | Male Income | Female Income |
| Less than High School | - | - |
| High School Diploma | $37,750 | $0 |
| College or Associate's Degree | - | - |
| Bachelor's Degree | - | - |
| Graduate Degree | - | - |
| Total | $37,750 | $24,063 |
Family Income in Success
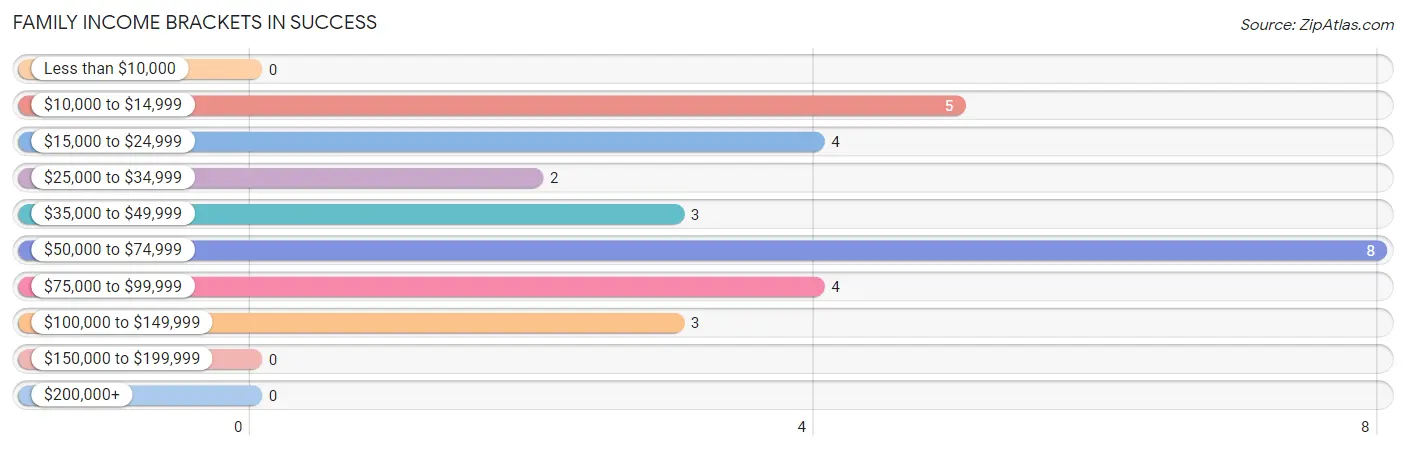
Family Income Brackets in Success
According to the Success family income data, there are 8 families falling into the $50,000 to $74,999 income range, which is the most common income bracket and makes up 27.6% of all families.
| Income Bracket | # Families | % Families |
| Less than $10,000 | 0 | 0.0% |
| $10,000 to $14,999 | 5 | 17.2% |
| $15,000 to $24,999 | 4 | 13.8% |
| $25,000 to $34,999 | 2 | 6.9% |
| $35,000 to $49,999 | 3 | 10.3% |
| $50,000 to $74,999 | 8 | 27.6% |
| $75,000 to $99,999 | 4 | 13.8% |
| $100,000 to $149,999 | 3 | 10.3% |
| $150,000 to $199,999 | 0 | 0.0% |
| $200,000+ | 0 | 0.0% |
Family Income by Famaliy Size in Success
| Income Bracket | # Families | Median Income |
| 2-Person Families | 19 (65.5%) | $0 |
| 3-Person Families | 2 (6.9%) | $0 |
| 4-Person Families | 4 (13.8%) | $0 |
| 5-Person Families | 0 (0.0%) | $0 |
| 6-Person Families | 2 (6.9%) | $0 |
| 7+ Person Families | 2 (6.9%) | $0 |
| Total | 29 (100.0%) | $50,625 |
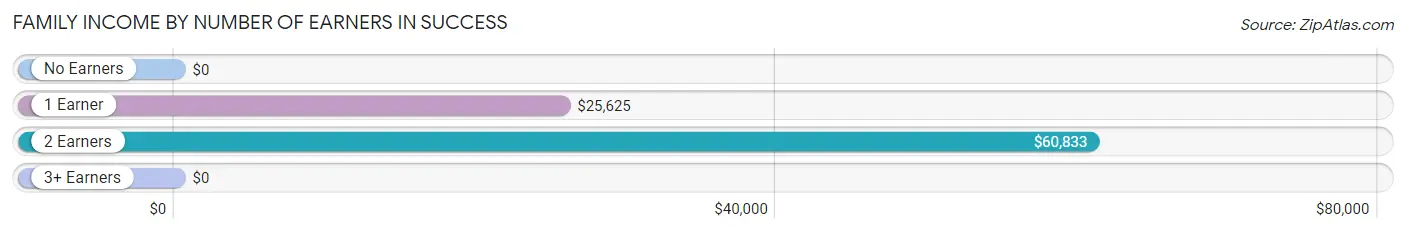
Family Income by Number of Earners in Success
| Number of Earners | # Families | Median Income |
| No Earners | 6 (20.7%) | $0 |
| 1 Earner | 5 (17.2%) | $25,625 |
| 2 Earners | 18 (62.1%) | $60,833 |
| 3+ Earners | 0 (0.0%) | $0 |
| Total | 29 (100.0%) | $50,625 |
Household Income in Success
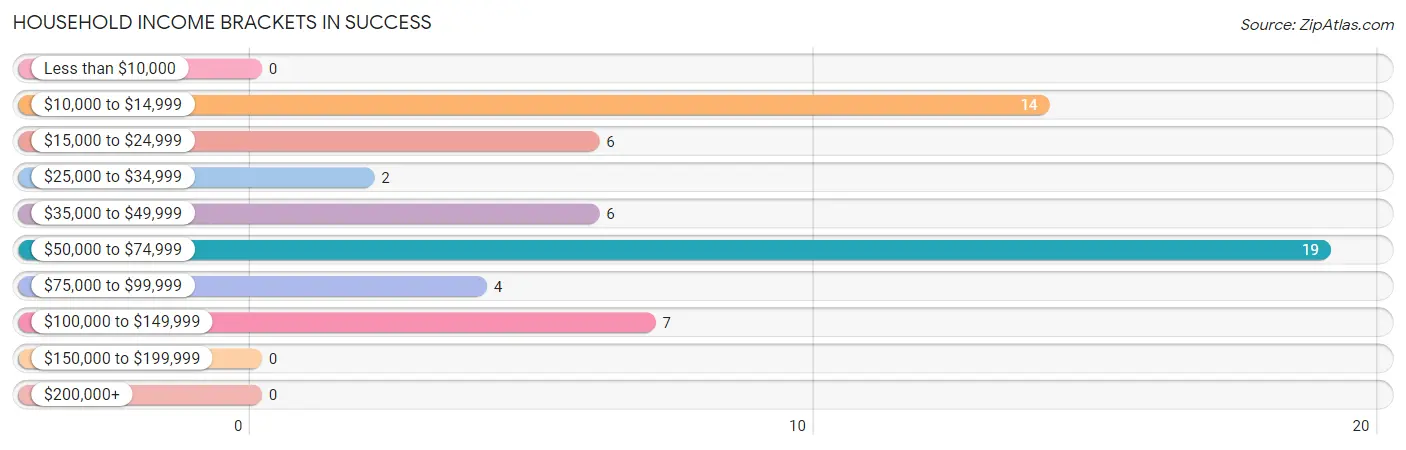
Household Income Brackets in Success
With 19 households falling in the category, the $50,000 to $74,999 income range is the most frequent in Success, accounting for 32.8% of all households.
| Income Bracket | # Households | % Households |
| Less than $10,000 | 0 | 0.0% |
| $10,000 to $14,999 | 14 | 24.1% |
| $15,000 to $24,999 | 6 | 10.3% |
| $25,000 to $34,999 | 2 | 3.4% |
| $35,000 to $49,999 | 6 | 10.3% |
| $50,000 to $74,999 | 19 | 32.8% |
| $75,000 to $99,999 | 4 | 6.9% |
| $100,000 to $149,999 | 7 | 12.1% |
| $150,000 to $199,999 | 0 | 0.0% |
| $200,000+ | 0 | 0.0% |
Household Income by Householder Age in Success
The median household income in Success is $51,250, with the highest median household income of $52,500 found in the 25 to 44 years age bracket for the primary householder. A total of 12 households (20.7%) fall into this category.
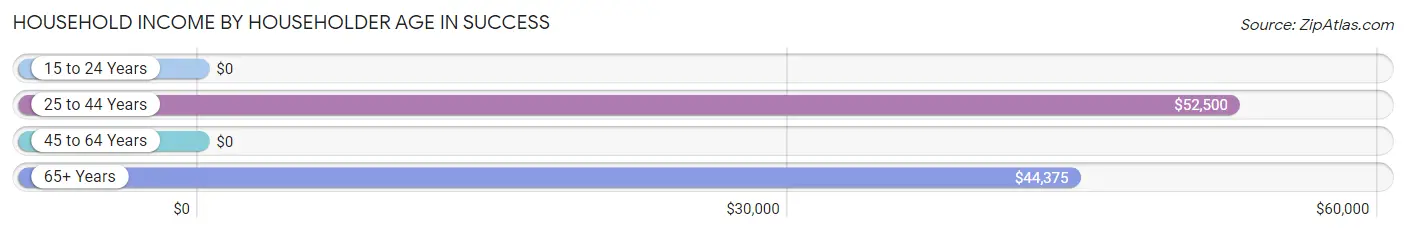
| Income Bracket | # Households | Median Income |
| 15 to 24 Years | 0 (0.0%) | $0 |
| 25 to 44 Years | 12 (20.7%) | $52,500 |
| 45 to 64 Years | 21 (36.2%) | $0 |
| 65+ Years | 25 (43.1%) | $44,375 |
| Total | 58 (100.0%) | $51,250 |
Poverty in Success
Income Below Poverty by Sex and Age in Success
With 16.4% poverty level for males and 29.2% for females among the residents of Success, 35 to 44 year old males and 75 year old and over females are the most vulnerable to poverty, with 6 males (60.0%) and 7 females (63.6%) in their respective age groups living below the poverty level.
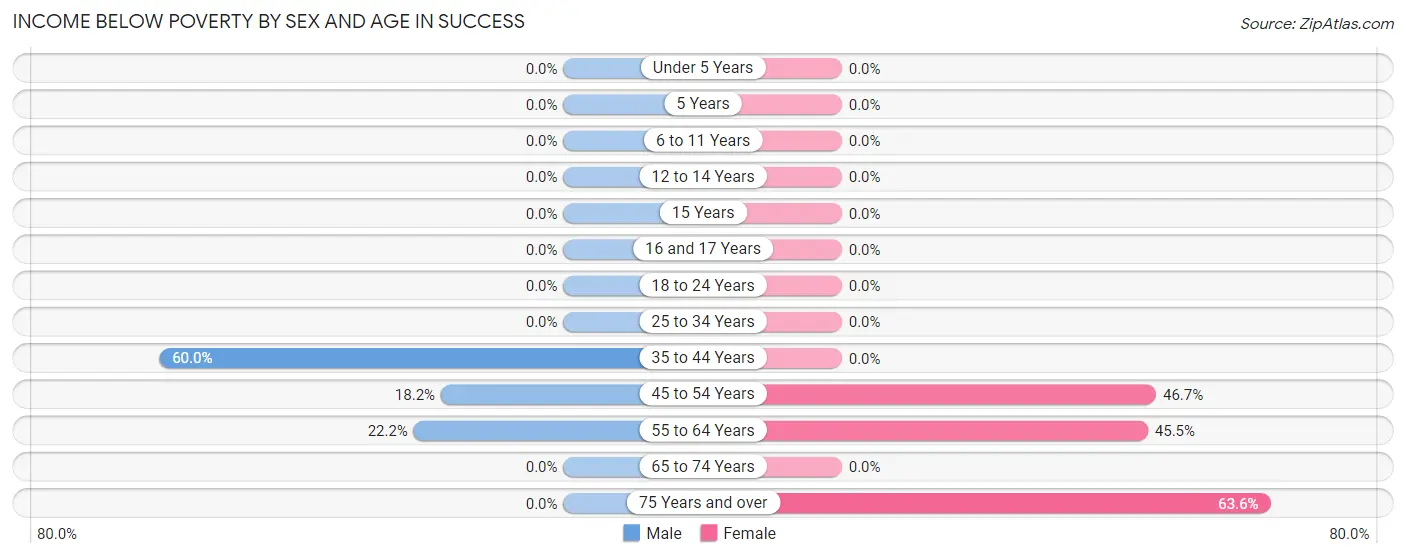
| Age Bracket | Male | Female |
| Under 5 Years | 0 (0.0%) | 0 (0.0%) |
| 5 Years | 0 (0.0%) | 0 (0.0%) |
| 6 to 11 Years | 0 (0.0%) | 0 (0.0%) |
| 12 to 14 Years | 0 (0.0%) | 0 (0.0%) |
| 15 Years | 0 (0.0%) | 0 (0.0%) |
| 16 and 17 Years | 0 (0.0%) | 0 (0.0%) |
| 18 to 24 Years | 0 (0.0%) | 0 (0.0%) |
| 25 to 34 Years | 0 (0.0%) | 0 (0.0%) |
| 35 to 44 Years | 6 (60.0%) | 0 (0.0%) |
| 45 to 54 Years | 2 (18.2%) | 7 (46.7%) |
| 55 to 64 Years | 2 (22.2%) | 5 (45.5%) |
| 65 to 74 Years | 0 (0.0%) | 0 (0.0%) |
| 75 Years and over | 0 (0.0%) | 7 (63.6%) |
| Total | 10 (16.4%) | 19 (29.2%) |
Income Above Poverty by Sex and Age in Success
According to the poverty statistics in Success, males aged under 5 years and females aged 6 to 11 years are the age groups that are most secure financially, with 100.0% of males and 100.0% of females in these age groups living above the poverty line.
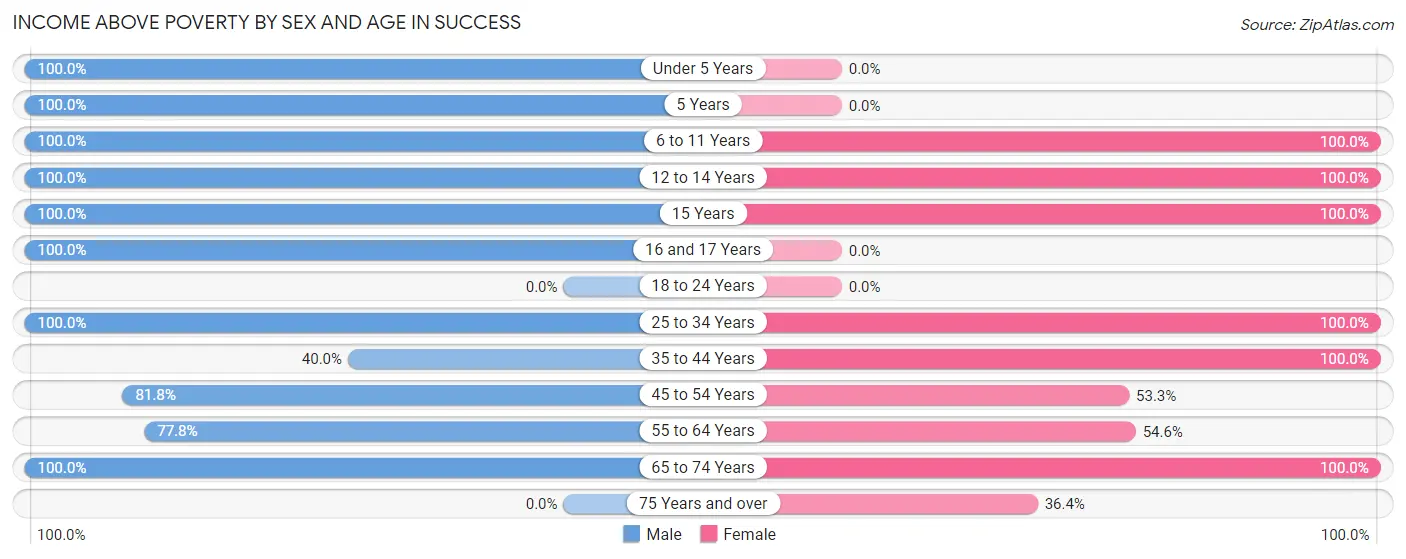
| Age Bracket | Male | Female |
| Under 5 Years | 2 (100.0%) | 0 (0.0%) |
| 5 Years | 2 (100.0%) | 0 (0.0%) |
| 6 to 11 Years | 4 (100.0%) | 6 (100.0%) |
| 12 to 14 Years | 1 (100.0%) | 2 (100.0%) |
| 15 Years | 2 (100.0%) | 3 (100.0%) |
| 16 and 17 Years | 3 (100.0%) | 0 (0.0%) |
| 18 to 24 Years | 0 (0.0%) | 0 (0.0%) |
| 25 to 34 Years | 7 (100.0%) | 7 (100.0%) |
| 35 to 44 Years | 4 (40.0%) | 2 (100.0%) |
| 45 to 54 Years | 9 (81.8%) | 8 (53.3%) |
| 55 to 64 Years | 7 (77.8%) | 6 (54.5%) |
| 65 to 74 Years | 10 (100.0%) | 8 (100.0%) |
| 75 Years and over | 0 (0.0%) | 4 (36.4%) |
| Total | 51 (83.6%) | 46 (70.8%) |
Income Below Poverty Among Married-Couple Families in Success
The poverty statistics for married-couple families in Success show that 10.5% or 2 of the total 19 families live below the poverty line. Families with no children have the highest poverty rate of 18.2%, comprising of 2 families. On the other hand, families with 1 or 2 children have the lowest poverty rate of 0.0%, which includes 0 families.
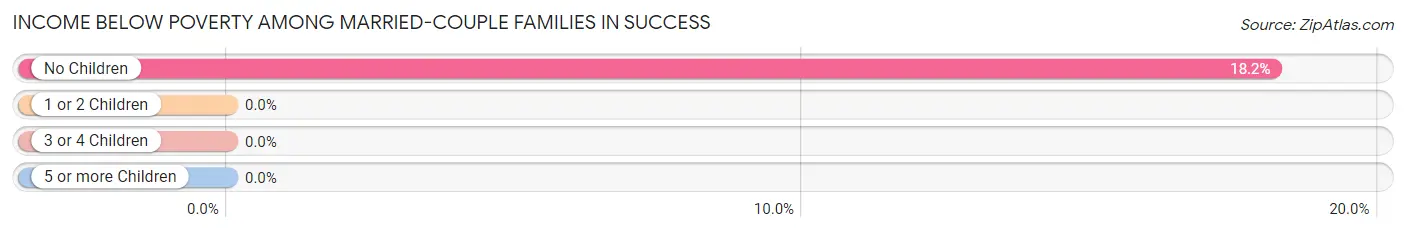
| Children | Above Poverty | Below Poverty |
| No Children | 9 (81.8%) | 2 (18.2%) |
| 1 or 2 Children | 4 (100.0%) | 0 (0.0%) |
| 3 or 4 Children | 2 (100.0%) | 0 (0.0%) |
| 5 or more Children | 2 (100.0%) | 0 (0.0%) |
| Total | 17 (89.5%) | 2 (10.5%) |
Income Below Poverty Among Single-Parent Households in Success
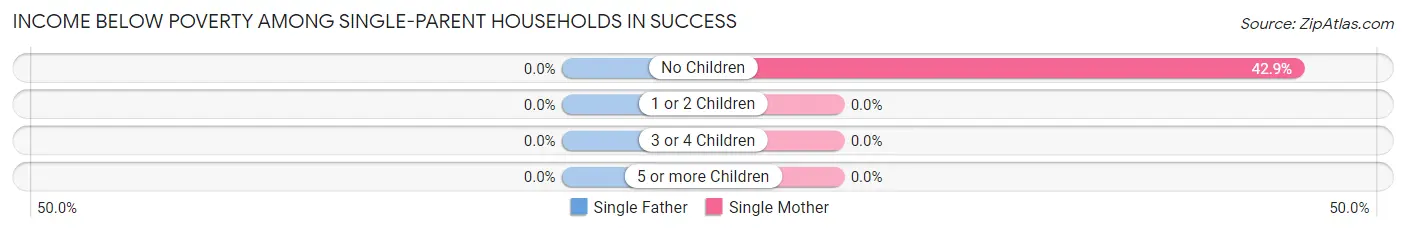
| Children | Single Father | Single Mother |
| No Children | 0 (0.0%) | 3 (42.9%) |
| 1 or 2 Children | 0 (0.0%) | 0 (0.0%) |
| 3 or 4 Children | 0 (0.0%) | 0 (0.0%) |
| 5 or more Children | 0 (0.0%) | 0 (0.0%) |
| Total | 0 (0.0%) | 3 (42.9%) |
Income Below Poverty Among Married-Couple vs Single-Parent Households in Success
The poverty data for Success shows that 2 of the married-couple family households (10.5%) and 3 of the single-parent households (30.0%) are living below the poverty level. Within the married-couple family households, those with no children have the highest poverty rate, with 2 households (18.2%) falling below the poverty line. Among the single-parent households, those with no children have the highest poverty rate, with 3 household (33.3%) living below poverty.
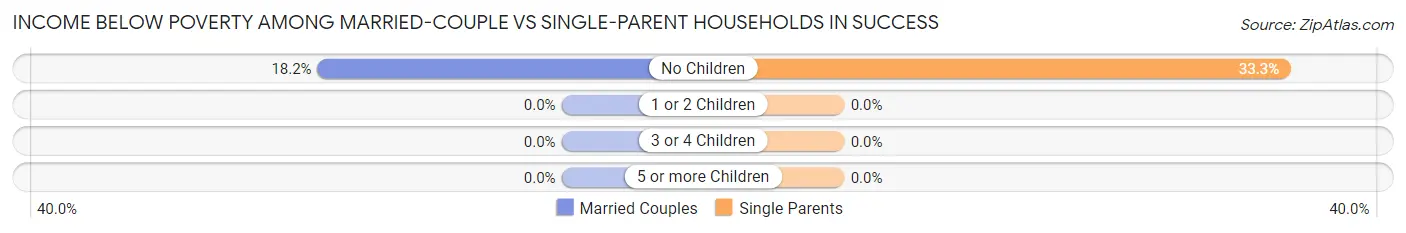
| Children | Married-Couple Families | Single-Parent Households |
| No Children | 2 (18.2%) | 3 (33.3%) |
| 1 or 2 Children | 0 (0.0%) | 0 (0.0%) |
| 3 or 4 Children | 0 (0.0%) | 0 (0.0%) |
| 5 or more Children | 0 (0.0%) | 0 (0.0%) |
| Total | 2 (10.5%) | 3 (30.0%) |
Race in Success
The most populous races in Success are , and White / Caucasian (126 | 100.0%).
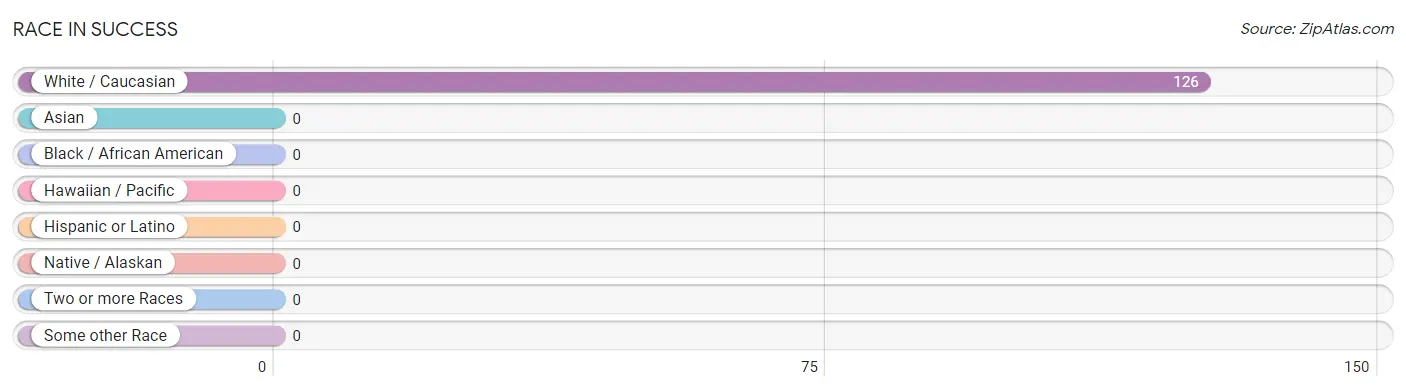
| Race | # Population | % Population |
| Asian | 0 | 0.0% |
| Black / African American | 0 | 0.0% |
| Hawaiian / Pacific | 0 | 0.0% |
| Hispanic or Latino | 0 | 0.0% |
| Native / Alaskan | 0 | 0.0% |
| White / Caucasian | 126 | 100.0% |
| Two or more Races | 0 | 0.0% |
| Some other Race | 0 | 0.0% |
| Total | 126 | 100.0% |
Ancestry in Success
The most populous ancestries reported in Success are American (19 | 15.1%), German (17 | 13.5%), English (6 | 4.8%), Irish (5 | 4.0%), and French (2 | 1.6%), together accounting for 38.9% of all Success residents.
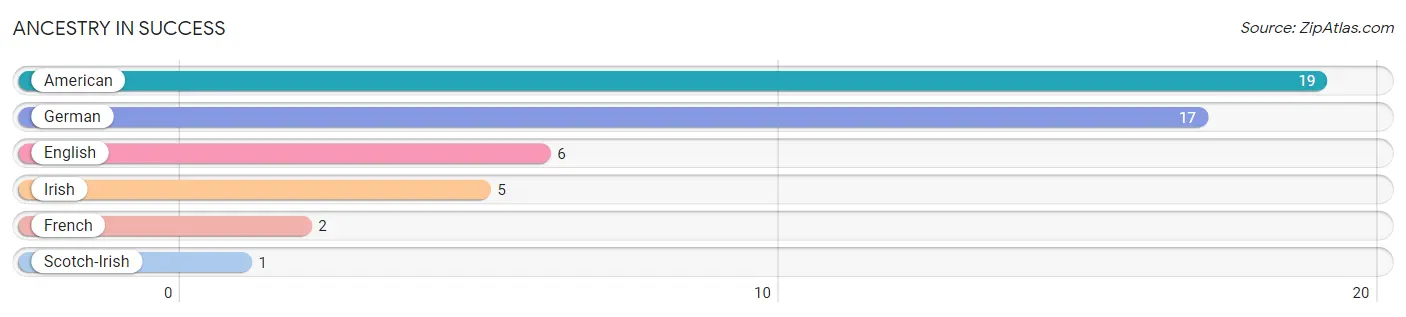
| Ancestry | # Population | % Population |
| American | 19 | 15.1% |
| English | 6 | 4.8% |
| French | 2 | 1.6% |
| German | 17 | 13.5% |
| Irish | 5 | 4.0% |
| Scotch-Irish | 1 | 0.8% | View All 6 Rows |
Immigrants in Success

| Immigration Origin | # Population | % Population | View All 0 Rows |
Sex and Age in Success
Sex and Age in Success
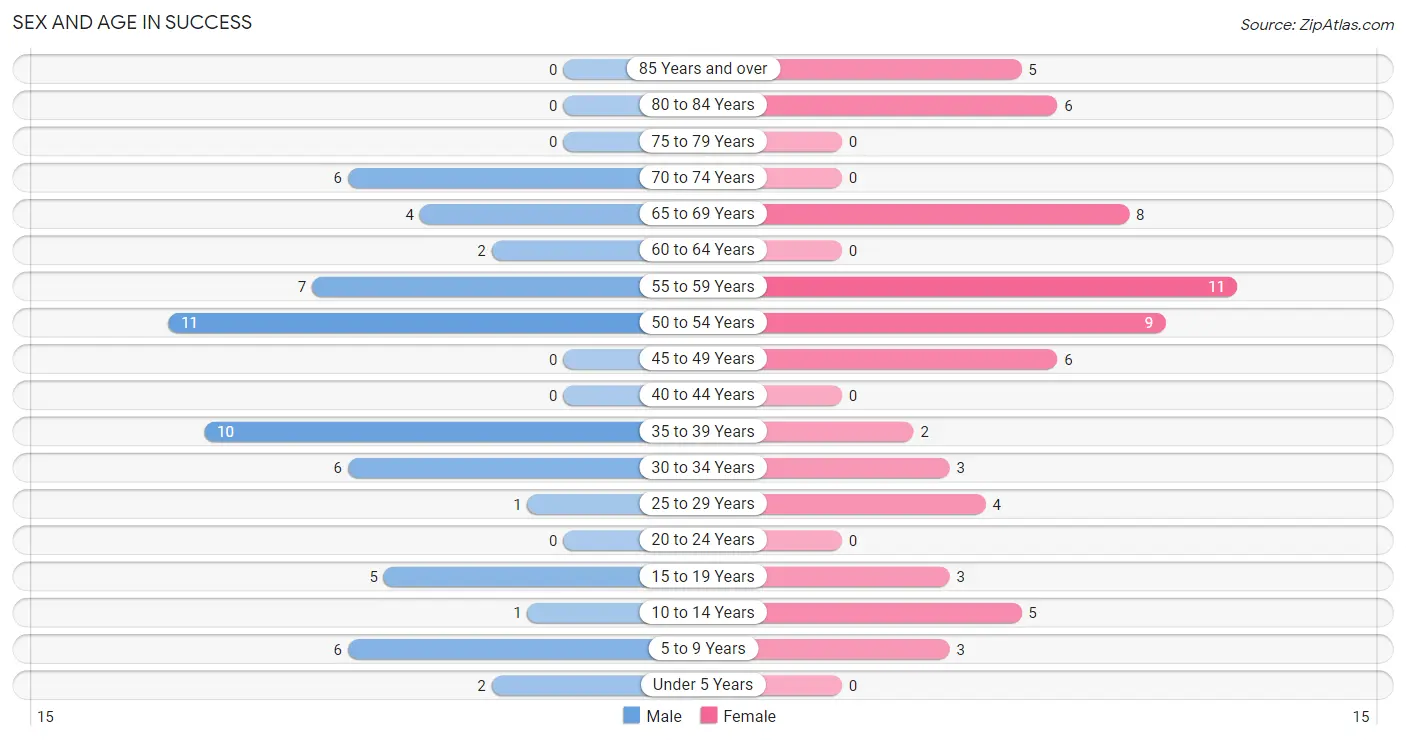
The most populous age groups in Success are 50 to 54 Years (11 | 18.0%) for men and 55 to 59 Years (11 | 16.9%) for women.
| Age Bracket | Male | Female |
| Under 5 Years | 2 (3.3%) | 0 (0.0%) |
| 5 to 9 Years | 6 (9.8%) | 3 (4.6%) |
| 10 to 14 Years | 1 (1.6%) | 5 (7.7%) |
| 15 to 19 Years | 5 (8.2%) | 3 (4.6%) |
| 20 to 24 Years | 0 (0.0%) | 0 (0.0%) |
| 25 to 29 Years | 1 (1.6%) | 4 (6.1%) |
| 30 to 34 Years | 6 (9.8%) | 3 (4.6%) |
| 35 to 39 Years | 10 (16.4%) | 2 (3.1%) |
| 40 to 44 Years | 0 (0.0%) | 0 (0.0%) |
| 45 to 49 Years | 0 (0.0%) | 6 (9.2%) |
| 50 to 54 Years | 11 (18.0%) | 9 (13.9%) |
| 55 to 59 Years | 7 (11.5%) | 11 (16.9%) |
| 60 to 64 Years | 2 (3.3%) | 0 (0.0%) |
| 65 to 69 Years | 4 (6.6%) | 8 (12.3%) |
| 70 to 74 Years | 6 (9.8%) | 0 (0.0%) |
| 75 to 79 Years | 0 (0.0%) | 0 (0.0%) |
| 80 to 84 Years | 0 (0.0%) | 6 (9.2%) |
| 85 Years and over | 0 (0.0%) | 5 (7.7%) |
| Total | 61 (100.0%) | 65 (100.0%) |
Families and Households in Success
Median Family Size in Success
The median family size in Success is 2.93 persons per family, with married-couple families (19 | 65.5%) accounting for the largest median family size of 3.11 persons per family. On the other hand, single female/mother families (7 | 24.1%) represent the smallest median family size with 2.57 persons per family.
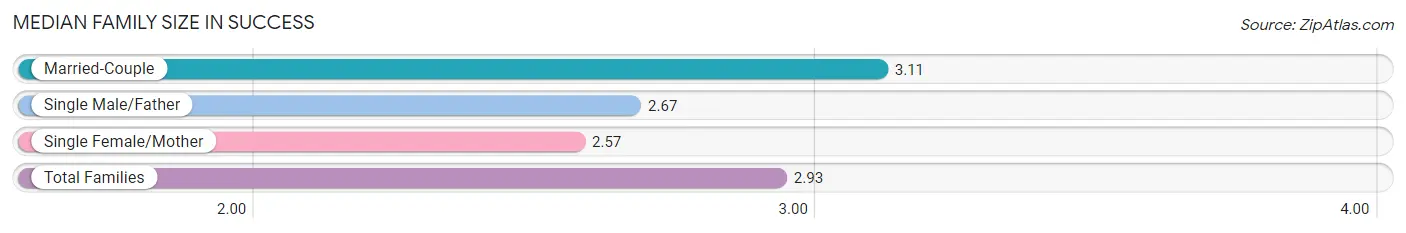
| Family Type | # Families | Family Size |
| Married-Couple | 19 (65.5%) | 3.11 |
| Single Male/Father | 3 (10.3%) | 2.67 |
| Single Female/Mother | 7 (24.1%) | 2.57 |
| Total Families | 29 (100.0%) | 2.93 |
Median Household Size in Success
The median household size in Success is 2.17 persons per household, with married-couple households (19 | 32.8%) accounting for the largest median household size of 3.11 persons per household. non-family households (29 | 50.0%) represent the smallest median household size with 1.41 persons per household.
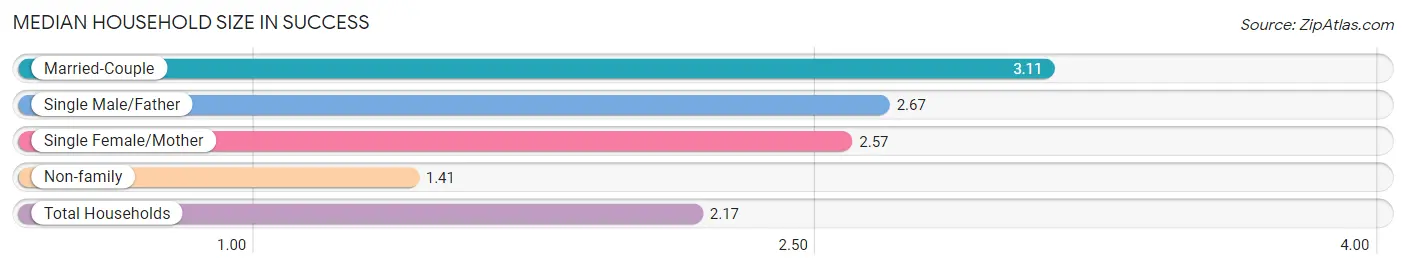
| Household Type | # Households | Household Size |
| Married-Couple | 19 (32.8%) | 3.11 |
| Single Male/Father | 3 (5.2%) | 2.67 |
| Single Female/Mother | 7 (12.1%) | 2.57 |
| Non-family | 29 (50.0%) | 1.41 |
| Total Households | 58 (100.0%) | 2.17 |
Household Size by Marriage Status in Success
Out of a total of 58 households in Success, 29 (50.0%) are family households, while 29 (50.0%) are nonfamily households. The most numerous type of family households are 2-person households, comprising 19, and the most common type of nonfamily households are 1-person households, comprising 22.
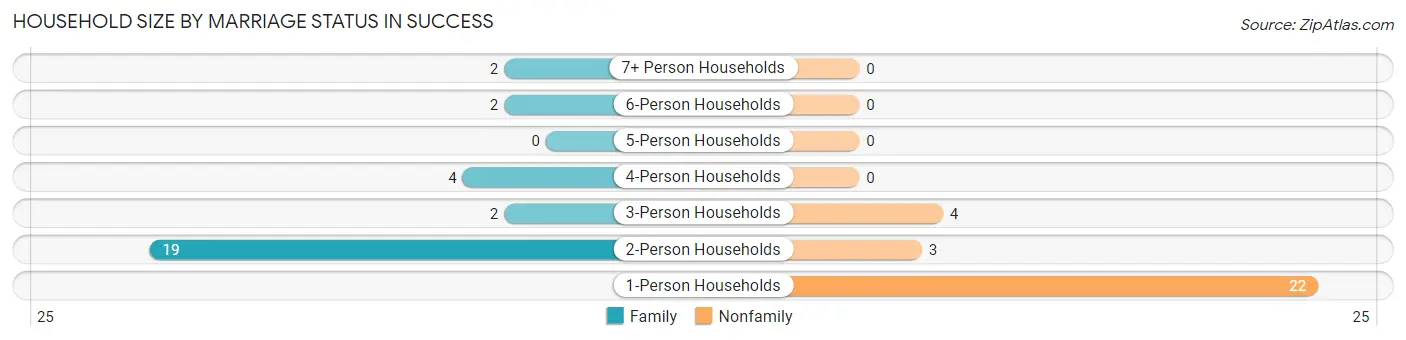
| Household Size | Family Households | Nonfamily Households |
| 1-Person Households | - | 22 (37.9%) |
| 2-Person Households | 19 (32.8%) | 3 (5.2%) |
| 3-Person Households | 2 (3.5%) | 4 (6.9%) |
| 4-Person Households | 4 (6.9%) | 0 (0.0%) |
| 5-Person Households | 0 (0.0%) | 0 (0.0%) |
| 6-Person Households | 2 (3.5%) | 0 (0.0%) |
| 7+ Person Households | 2 (3.5%) | 0 (0.0%) |
| Total | 29 (50.0%) | 29 (50.0%) |
Female Fertility in Success
Fertility by Age in Success
| Age Bracket | Women with Births | Births / 1,000 Women |
| 15 to 19 years | 0 (0.0%) | 0.0 |
| 20 to 34 years | 0 (0.0%) | 0.0 |
| 35 to 50 years | 0 (0.0%) | 0.0 |
| Total | 0 (0.0%) | 0.0 |
Fertility by Age by Marriage Status in Success
| Age Bracket | Married | Unmarried |
| 15 to 19 years | 0 (0.0%) | 0 (0.0%) |
| 20 to 34 years | 0 (0.0%) | 0 (0.0%) |
| 35 to 50 years | 0 (0.0%) | 0 (0.0%) |
| Total | 0 (0.0%) | 0 (0.0%) |
Fertility by Education in Success
| Educational Attainment | Women with Births | Births / 1,000 Women |
| Less than High School | 0 (0.0%) | 0.0 |
| High School Diploma | 0 (0.0%) | 0.0 |
| College or Associate's Degree | 0 (0.0%) | 0.0 |
| Bachelor's Degree | 0 (0.0%) | 0.0 |
| Graduate Degree | 0 (0.0%) | 0.0 |
| Total | 0 (0.0%) | 0.0 |
Fertility by Education by Marriage Status in Success
| Educational Attainment | Married | Unmarried |
| Less than High School | 0 (0.0%) | 0 (0.0%) |
| High School Diploma | 0 (0.0%) | 0 (0.0%) |
| College or Associate's Degree | 0 (0.0%) | 0 (0.0%) |
| Bachelor's Degree | 0 (0.0%) | 0 (0.0%) |
| Graduate Degree | 0 (0.0%) | 0 (0.0%) |
| Total | 0 (0.0%) | 0 (0.0%) |
Employment Characteristics in Success
Employment by Class of Employer in Success
Among the 51 employed individuals in Success, private company employees (34 | 66.7%), local government employees (11 | 21.6%), and federal government employees (5 | 9.8%) make up the most common classes of employment.
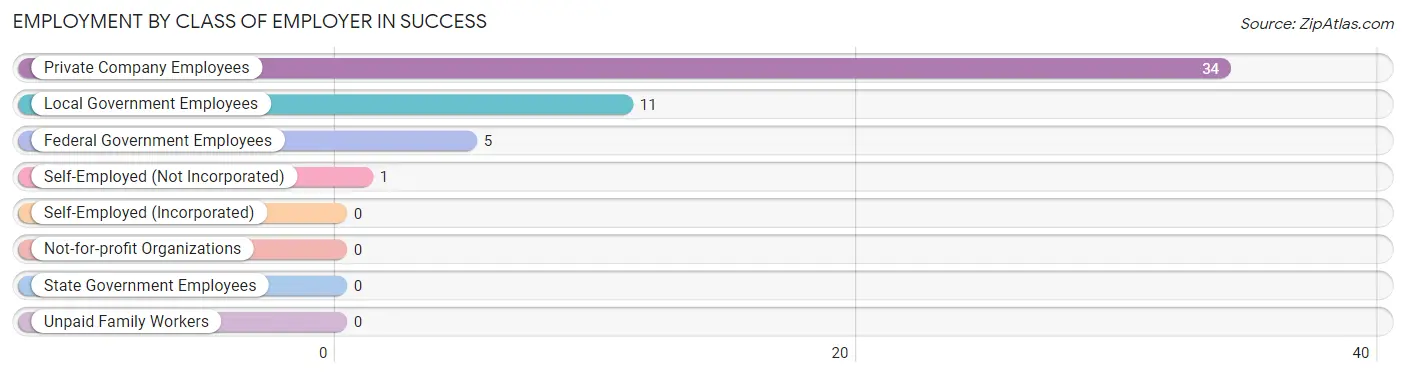
| Employer Class | # Employees | % Employees |
| Private Company Employees | 34 | 66.7% |
| Self-Employed (Incorporated) | 0 | 0.0% |
| Self-Employed (Not Incorporated) | 1 | 2.0% |
| Not-for-profit Organizations | 0 | 0.0% |
| Local Government Employees | 11 | 21.6% |
| State Government Employees | 0 | 0.0% |
| Federal Government Employees | 5 | 9.8% |
| Unpaid Family Workers | 0 | 0.0% |
| Total | 51 | 100.0% |
Employment Status by Age in Success
According to the labor force statistics for Success, out of the total population over 16 years of age (104), 65.4% or 68 individuals are in the labor force, with 14.7% or 10 of them unemployed. The age group with the highest labor force participation rate is 30 to 34 years, with 100.0% or 9 individuals in the labor force. Within the labor force, the 35 to 44 years age range has the highest percentage of unemployed individuals, with 50.0% or 6 of them being unemployed.
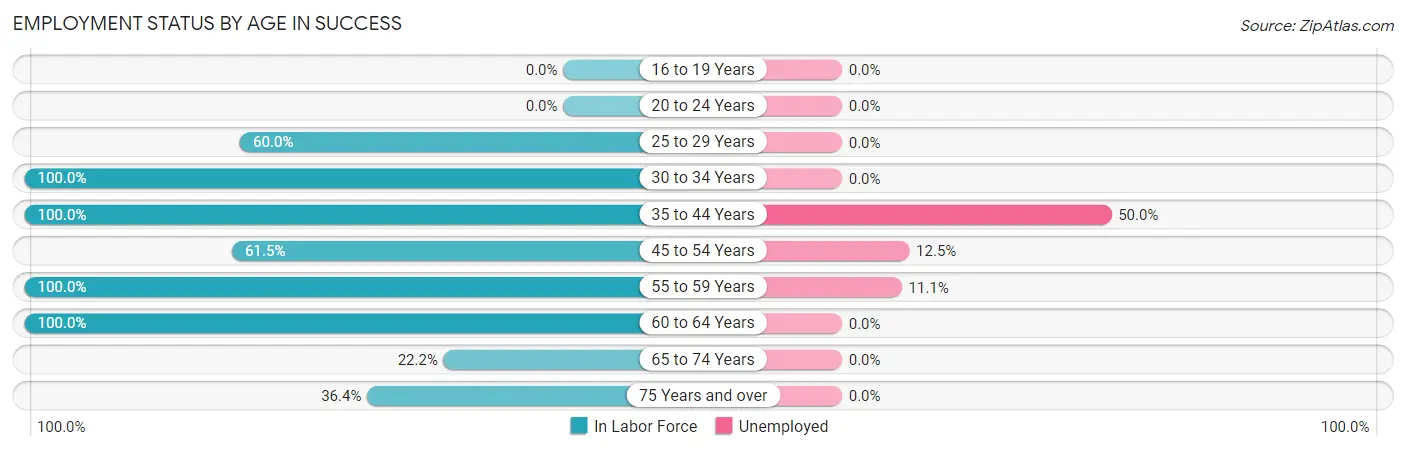
| Age Bracket | In Labor Force | Unemployed |
| 16 to 19 Years | 0 (0.0%) | 0 (0.0%) |
| 20 to 24 Years | 0 (0.0%) | 0 (0.0%) |
| 25 to 29 Years | 3 (60.0%) | 0 (0.0%) |
| 30 to 34 Years | 9 (100.0%) | 0 (0.0%) |
| 35 to 44 Years | 12 (100.0%) | 6 (50.0%) |
| 45 to 54 Years | 16 (61.5%) | 2 (12.5%) |
| 55 to 59 Years | 18 (100.0%) | 2 (11.1%) |
| 60 to 64 Years | 2 (100.0%) | 0 (0.0%) |
| 65 to 74 Years | 4 (22.2%) | 0 (0.0%) |
| 75 Years and over | 4 (36.4%) | 0 (0.0%) |
| Total | 68 (65.4%) | 10 (14.7%) |
Employment Status by Educational Attainment in Success
According to labor force statistics for Success, 83.3% of individuals (60) out of the total population between 25 and 64 years of age (72) are in the labor force, with 16.7% or 10 of them being unemployed. The group with the highest labor force participation rate are those with the educational attainment of bachelor's degree or higher, with 100.0% or 5 individuals in the labor force. Within the labor force, individuals with high school diploma education have the highest percentage of unemployment, with 31.3% or 10 of them being unemployed.
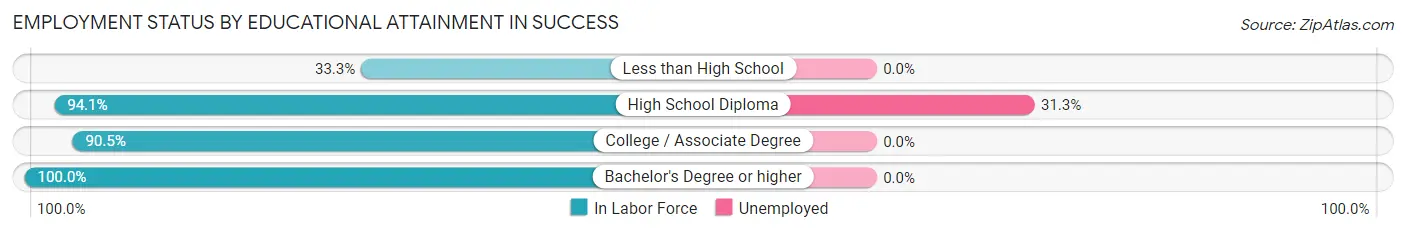
| Educational Attainment | In Labor Force | Unemployed |
| Less than High School | 4 (33.3%) | 0 (0.0%) |
| High School Diploma | 32 (94.1%) | 11 (31.3%) |
| College / Associate Degree | 19 (90.5%) | 0 (0.0%) |
| Bachelor's Degree or higher | 5 (100.0%) | 0 (0.0%) |
| Total | 60 (83.3%) | 12 (16.7%) |
Employment Occupations by Sex in Success
Management, Business, Science and Arts Occupations
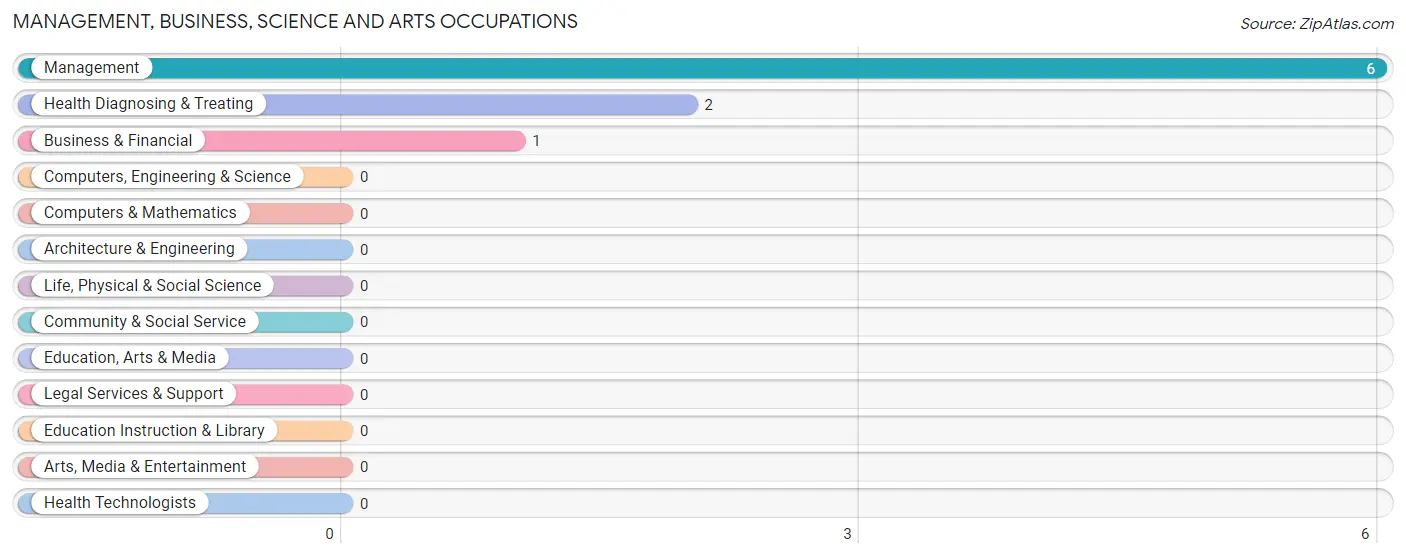
The most common Management, Business, Science and Arts occupations in Success are Management (6 | 10.3%), Health Diagnosing & Treating (2 | 3.5%), and Business & Financial (1 | 1.7%).
Management, Business, Science and Arts Occupations by Sex
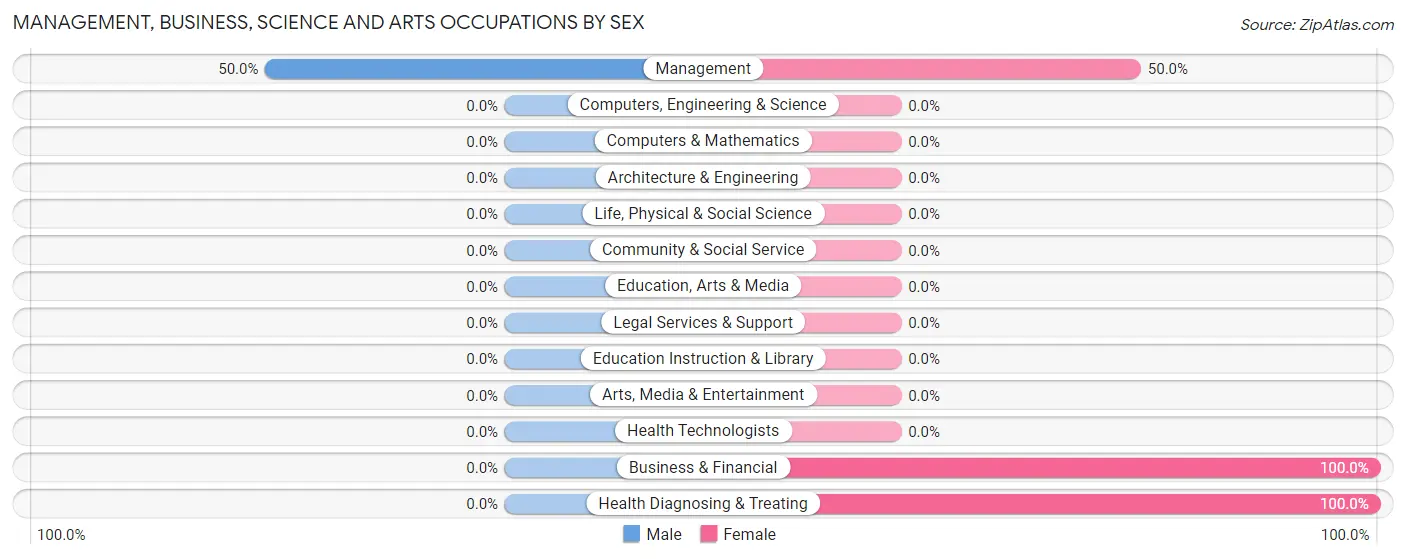
| Occupation | Male | Female |
| Management | 3 (50.0%) | 3 (50.0%) |
| Business & Financial | 0 (0.0%) | 1 (100.0%) |
| Computers, Engineering & Science | 0 (0.0%) | 0 (0.0%) |
| Computers & Mathematics | 0 (0.0%) | 0 (0.0%) |
| Architecture & Engineering | 0 (0.0%) | 0 (0.0%) |
| Life, Physical & Social Science | 0 (0.0%) | 0 (0.0%) |
| Community & Social Service | 0 (0.0%) | 0 (0.0%) |
| Education, Arts & Media | 0 (0.0%) | 0 (0.0%) |
| Legal Services & Support | 0 (0.0%) | 0 (0.0%) |
| Education Instruction & Library | 0 (0.0%) | 0 (0.0%) |
| Arts, Media & Entertainment | 0 (0.0%) | 0 (0.0%) |
| Health Diagnosing & Treating | 0 (0.0%) | 2 (100.0%) |
| Health Technologists | 0 (0.0%) | 0 (0.0%) |
| Total (Category) | 3 (33.3%) | 6 (66.7%) |
| Total (Overall) | 27 (46.6%) | 31 (53.4%) |
Services Occupations
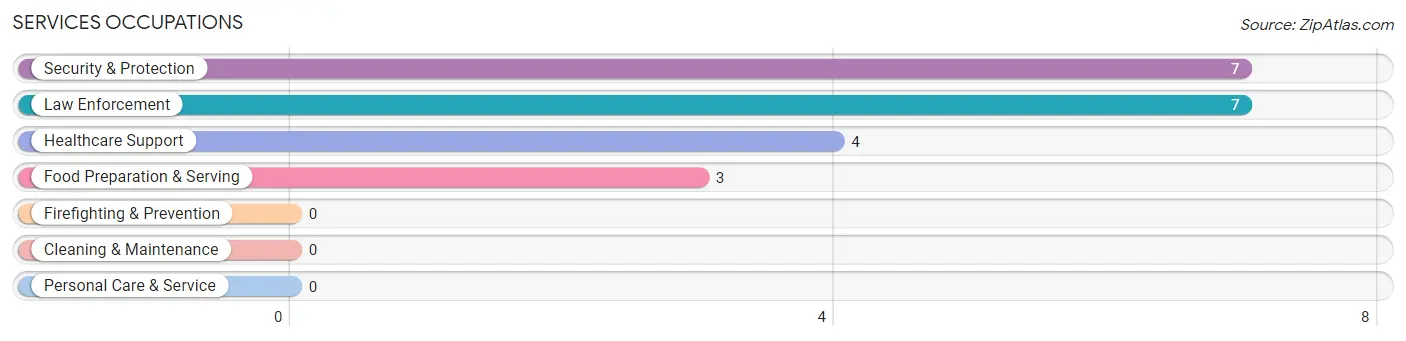
The most common Services occupations in Success are Security & Protection (7 | 12.1%), Law Enforcement (7 | 12.1%), Healthcare Support (4 | 6.9%), and Food Preparation & Serving (3 | 5.2%).
Services Occupations by Sex
Within the Services occupations in Success, the most male-oriented occupations are Food Preparation & Serving (100.0%), Security & Protection (28.6%), and Law Enforcement (28.6%), while the most female-oriented occupations are Healthcare Support (100.0%), Security & Protection (71.4%), and Law Enforcement (71.4%).
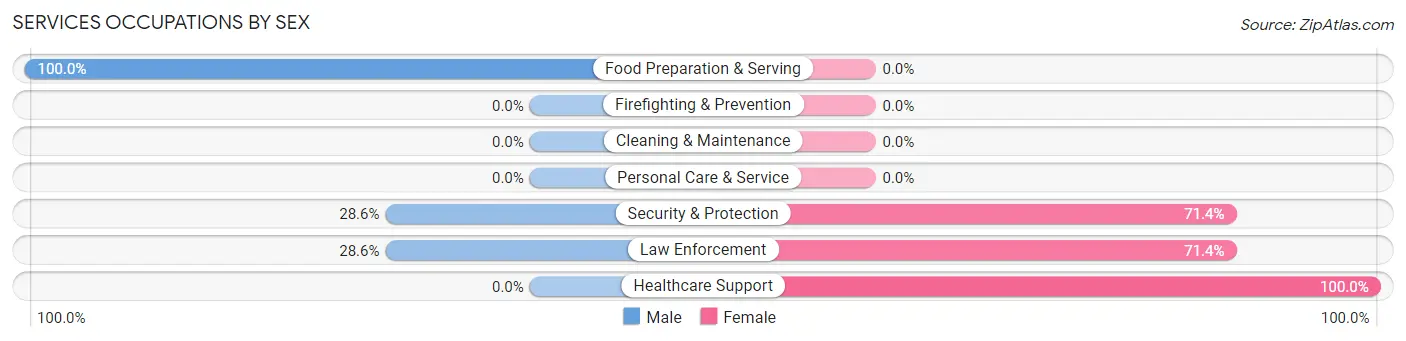
| Occupation | Male | Female |
| Healthcare Support | 0 (0.0%) | 4 (100.0%) |
| Security & Protection | 2 (28.6%) | 5 (71.4%) |
| Firefighting & Prevention | 0 (0.0%) | 0 (0.0%) |
| Law Enforcement | 2 (28.6%) | 5 (71.4%) |
| Food Preparation & Serving | 3 (100.0%) | 0 (0.0%) |
| Cleaning & Maintenance | 0 (0.0%) | 0 (0.0%) |
| Personal Care & Service | 0 (0.0%) | 0 (0.0%) |
| Total (Category) | 5 (35.7%) | 9 (64.3%) |
| Total (Overall) | 27 (46.6%) | 31 (53.4%) |
Sales and Office Occupations
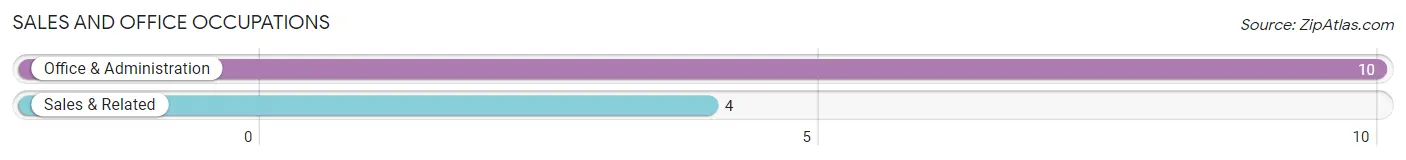
The most common Sales and Office occupations in Success are Office & Administration (10 | 17.2%), and Sales & Related (4 | 6.9%).
Sales and Office Occupations by Sex
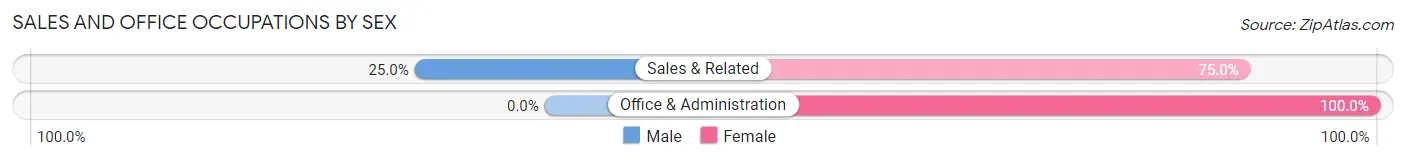
| Occupation | Male | Female |
| Sales & Related | 1 (25.0%) | 3 (75.0%) |
| Office & Administration | 0 (0.0%) | 10 (100.0%) |
| Total (Category) | 1 (7.1%) | 13 (92.9%) |
| Total (Overall) | 27 (46.6%) | 31 (53.4%) |
Natural Resources, Construction and Maintenance Occupations
The most common Natural Resources, Construction and Maintenance occupations in Success are , and Installation, Maintenance & Repair (3 | 5.2%).
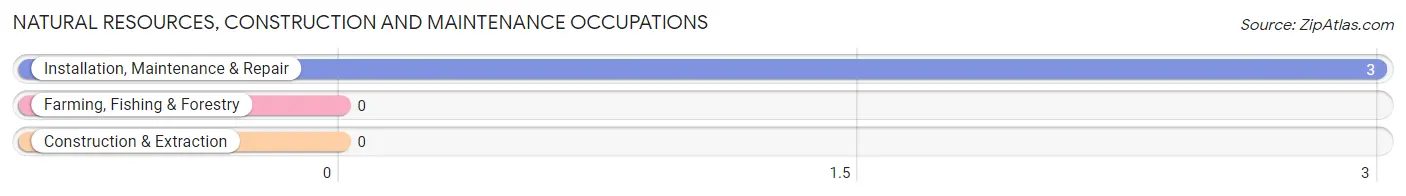
Natural Resources, Construction and Maintenance Occupations by Sex
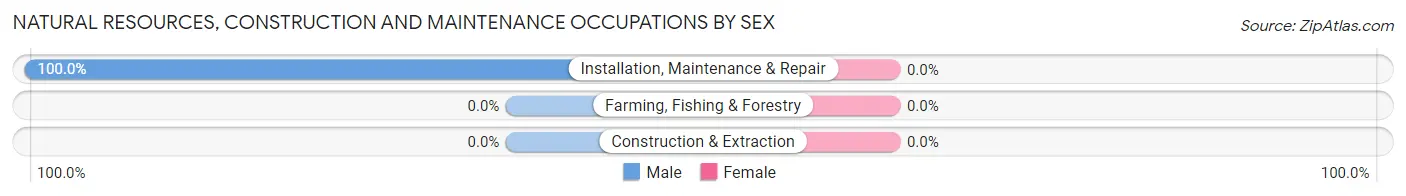
| Occupation | Male | Female |
| Farming, Fishing & Forestry | 0 (0.0%) | 0 (0.0%) |
| Construction & Extraction | 0 (0.0%) | 0 (0.0%) |
| Installation, Maintenance & Repair | 3 (100.0%) | 0 (0.0%) |
| Total (Category) | 3 (100.0%) | 0 (0.0%) |
| Total (Overall) | 27 (46.6%) | 31 (53.4%) |
Production, Transportation and Moving Occupations
The most common Production, Transportation and Moving occupations in Success are Production (13 | 22.4%), and Transportation (5 | 8.6%).
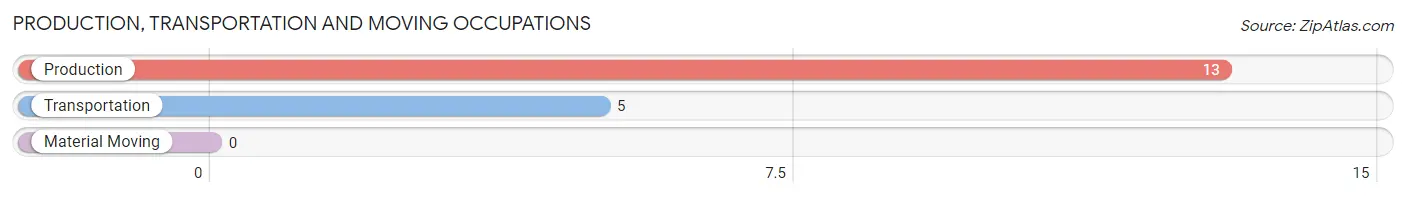
Production, Transportation and Moving Occupations by Sex
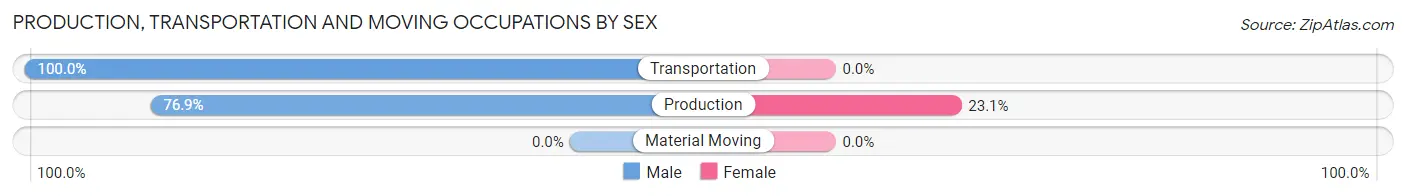
| Occupation | Male | Female |
| Production | 10 (76.9%) | 3 (23.1%) |
| Transportation | 5 (100.0%) | 0 (0.0%) |
| Material Moving | 0 (0.0%) | 0 (0.0%) |
| Total (Category) | 15 (83.3%) | 3 (16.7%) |
| Total (Overall) | 27 (46.6%) | 31 (53.4%) |
Employment Industries by Sex in Success
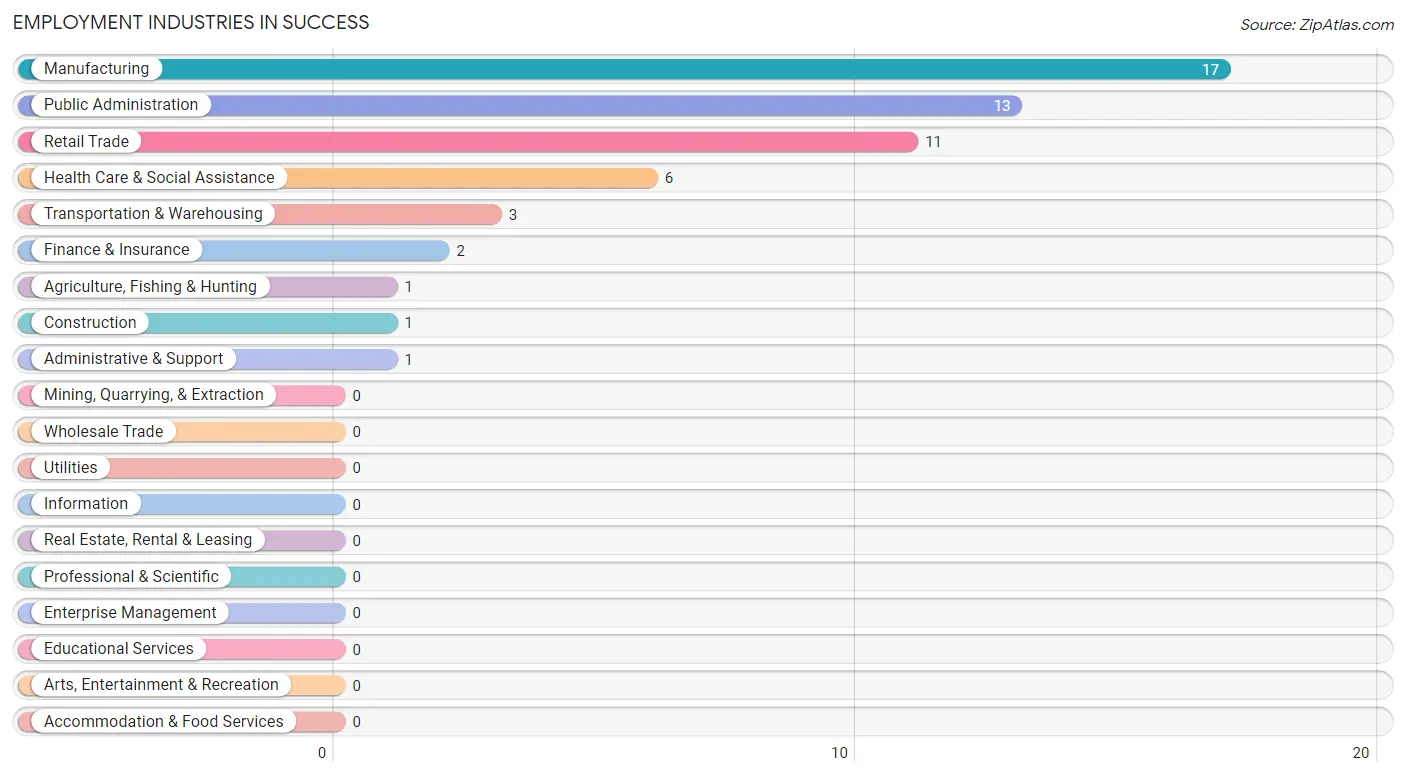
Employment Industries in Success
The major employment industries in Success include Manufacturing (17 | 29.3%), Public Administration (13 | 22.4%), Retail Trade (11 | 19.0%), Health Care & Social Assistance (6 | 10.3%), and Transportation & Warehousing (3 | 5.2%).
Employment Industries by Sex in Success
The Success industries that see more men than women are Agriculture, Fishing & Hunting (100.0%), Construction (100.0%), and Manufacturing (82.4%), whereas the industries that tend to have a higher number of women are Transportation & Warehousing (100.0%), Finance & Insurance (100.0%), and Administrative & Support (100.0%).
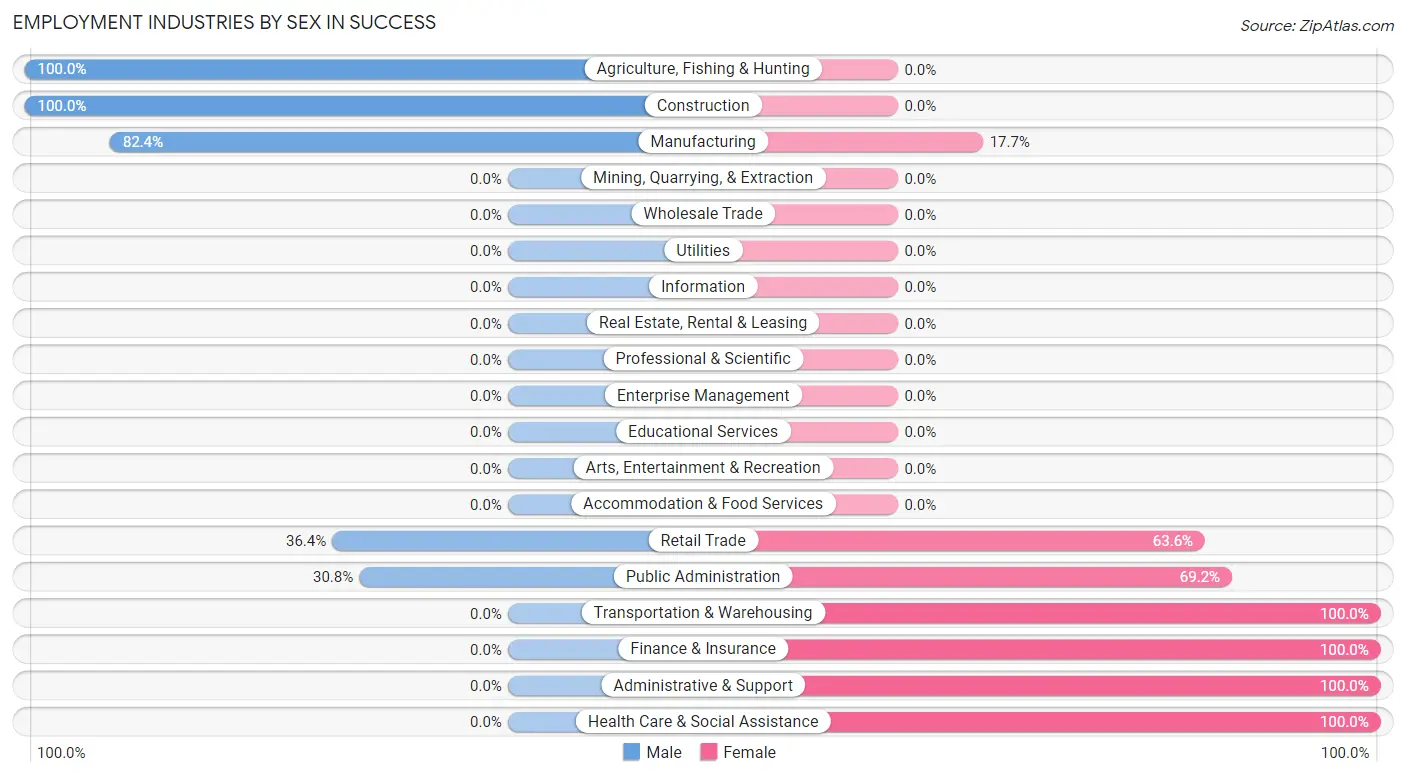
| Industry | Male | Female |
| Agriculture, Fishing & Hunting | 1 (100.0%) | 0 (0.0%) |
| Mining, Quarrying, & Extraction | 0 (0.0%) | 0 (0.0%) |
| Construction | 1 (100.0%) | 0 (0.0%) |
| Manufacturing | 14 (82.4%) | 3 (17.6%) |
| Wholesale Trade | 0 (0.0%) | 0 (0.0%) |
| Retail Trade | 4 (36.4%) | 7 (63.6%) |
| Transportation & Warehousing | 0 (0.0%) | 3 (100.0%) |
| Utilities | 0 (0.0%) | 0 (0.0%) |
| Information | 0 (0.0%) | 0 (0.0%) |
| Finance & Insurance | 0 (0.0%) | 2 (100.0%) |
| Real Estate, Rental & Leasing | 0 (0.0%) | 0 (0.0%) |
| Professional & Scientific | 0 (0.0%) | 0 (0.0%) |
| Enterprise Management | 0 (0.0%) | 0 (0.0%) |
| Administrative & Support | 0 (0.0%) | 1 (100.0%) |
| Educational Services | 0 (0.0%) | 0 (0.0%) |
| Health Care & Social Assistance | 0 (0.0%) | 6 (100.0%) |
| Arts, Entertainment & Recreation | 0 (0.0%) | 0 (0.0%) |
| Accommodation & Food Services | 0 (0.0%) | 0 (0.0%) |
| Public Administration | 4 (30.8%) | 9 (69.2%) |
| Total | 27 (46.6%) | 31 (53.4%) |
Education in Success
School Enrollment in Success
The most common levels of schooling among the 23 students in Success are elementary school (9 | 39.1%), high school (8 | 34.8%), and middle school (4 | 17.4%).
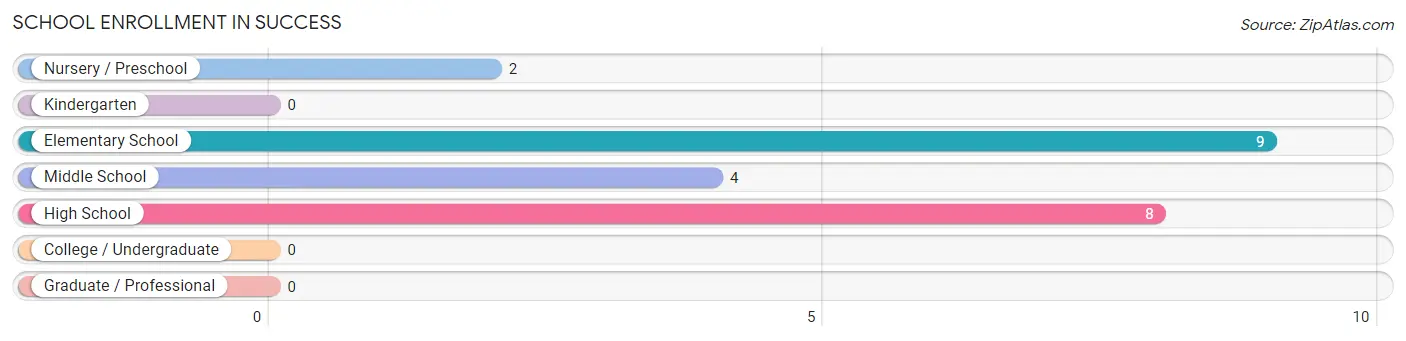
| School Level | # Students | % Students |
| Nursery / Preschool | 2 | 8.7% |
| Kindergarten | 0 | 0.0% |
| Elementary School | 9 | 39.1% |
| Middle School | 4 | 17.4% |
| High School | 8 | 34.8% |
| College / Undergraduate | 0 | 0.0% |
| Graduate / Professional | 0 | 0.0% |
| Total | 23 | 100.0% |
School Enrollment by Age by Funding Source in Success
Out of a total of 23 students who are enrolled in schools in Success, 3 (13.0%) attend a private institution, while the remaining 20 (87.0%) are enrolled in public schools. The age group of 15 to 17 year olds has the highest likelihood of being enrolled in private schools, with 3 (37.5% in the age bracket) enrolled. Conversely, the age group of 5 to 9 year old has the lowest likelihood of being enrolled in a private school, with 9 (100.0% in the age bracket) attending a public institution.
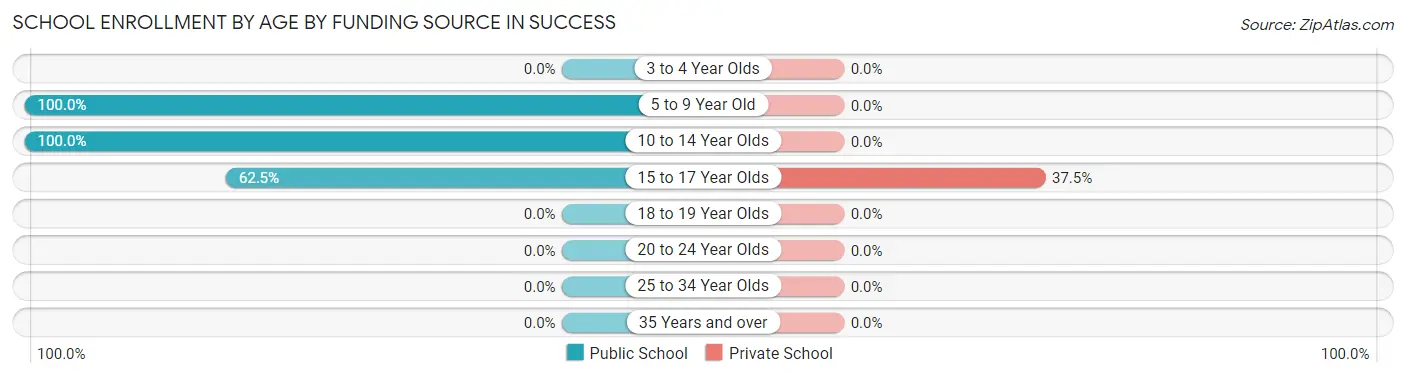
| Age Bracket | Public School | Private School |
| 3 to 4 Year Olds | 0 (0.0%) | 0 (0.0%) |
| 5 to 9 Year Old | 9 (100.0%) | 0 (0.0%) |
| 10 to 14 Year Olds | 6 (100.0%) | 0 (0.0%) |
| 15 to 17 Year Olds | 5 (62.5%) | 3 (37.5%) |
| 18 to 19 Year Olds | 0 (0.0%) | 0 (0.0%) |
| 20 to 24 Year Olds | 0 (0.0%) | 0 (0.0%) |
| 25 to 34 Year Olds | 0 (0.0%) | 0 (0.0%) |
| 35 Years and over | 0 (0.0%) | 0 (0.0%) |
| Total | 20 (87.0%) | 3 (13.0%) |
Educational Attainment by Field of Study in Success
, and education (5 | 100.0%) are the most common fields of study among 5 individuals in Success who have obtained a bachelor's degree or higher.
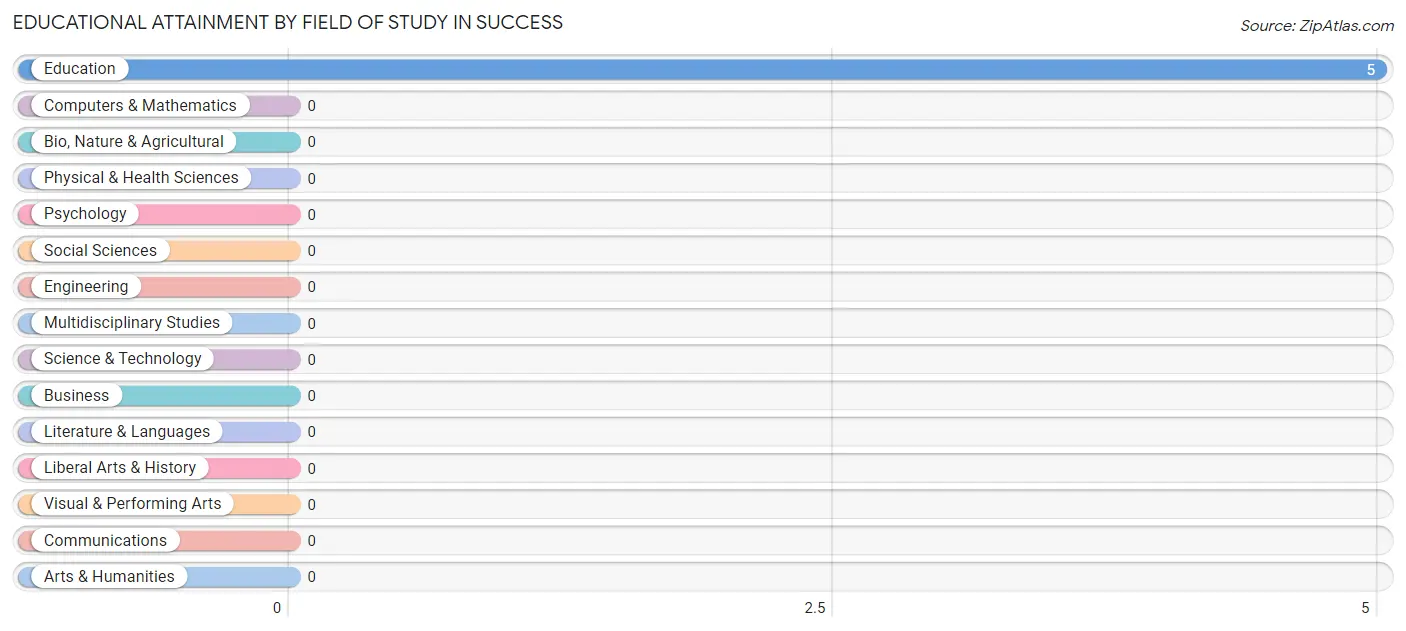
| Field of Study | # Graduates | % Graduates |
| Computers & Mathematics | 0 | 0.0% |
| Bio, Nature & Agricultural | 0 | 0.0% |
| Physical & Health Sciences | 0 | 0.0% |
| Psychology | 0 | 0.0% |
| Social Sciences | 0 | 0.0% |
| Engineering | 0 | 0.0% |
| Multidisciplinary Studies | 0 | 0.0% |
| Science & Technology | 0 | 0.0% |
| Business | 0 | 0.0% |
| Education | 5 | 100.0% |
| Literature & Languages | 0 | 0.0% |
| Liberal Arts & History | 0 | 0.0% |
| Visual & Performing Arts | 0 | 0.0% |
| Communications | 0 | 0.0% |
| Arts & Humanities | 0 | 0.0% |
| Total | 5 | 100.0% |
Transportation & Commute in Success
Vehicle Availability by Sex in Success
The most prevalent vehicle ownership categories in Success are males with 1 vehicle (10, accounting for 50.0%) and females with 1 vehicle (11, making up 32.3%).
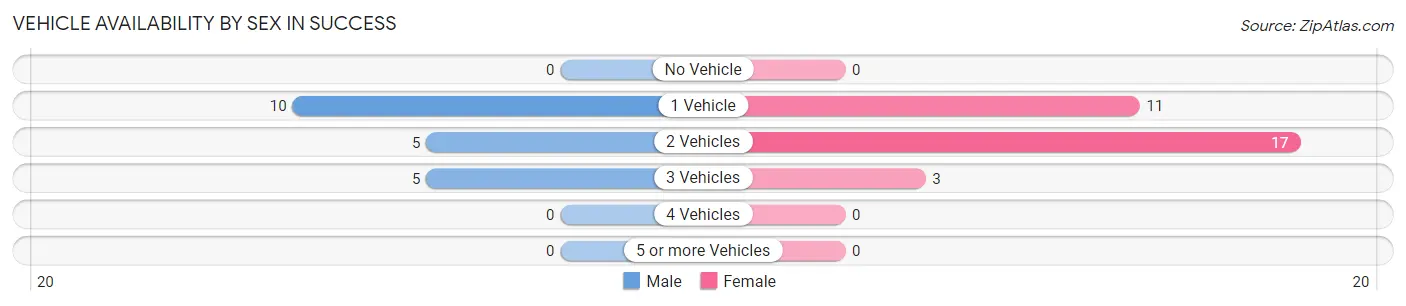
| Vehicles Available | Male | Female |
| No Vehicle | 0 (0.0%) | 0 (0.0%) |
| 1 Vehicle | 10 (50.0%) | 11 (35.5%) |
| 2 Vehicles | 5 (25.0%) | 17 (54.8%) |
| 3 Vehicles | 5 (25.0%) | 3 (9.7%) |
| 4 Vehicles | 0 (0.0%) | 0 (0.0%) |
| 5 or more Vehicles | 0 (0.0%) | 0 (0.0%) |
| Total | 20 (100.0%) | 31 (100.0%) |
Commute Time in Success
The most frequently occuring commute durations in Success are 30 to 34 minutes (10 commuters, 20.8%), less than 5 minutes (7 commuters, 14.6%), and 10 to 14 minutes (6 commuters, 12.5%).
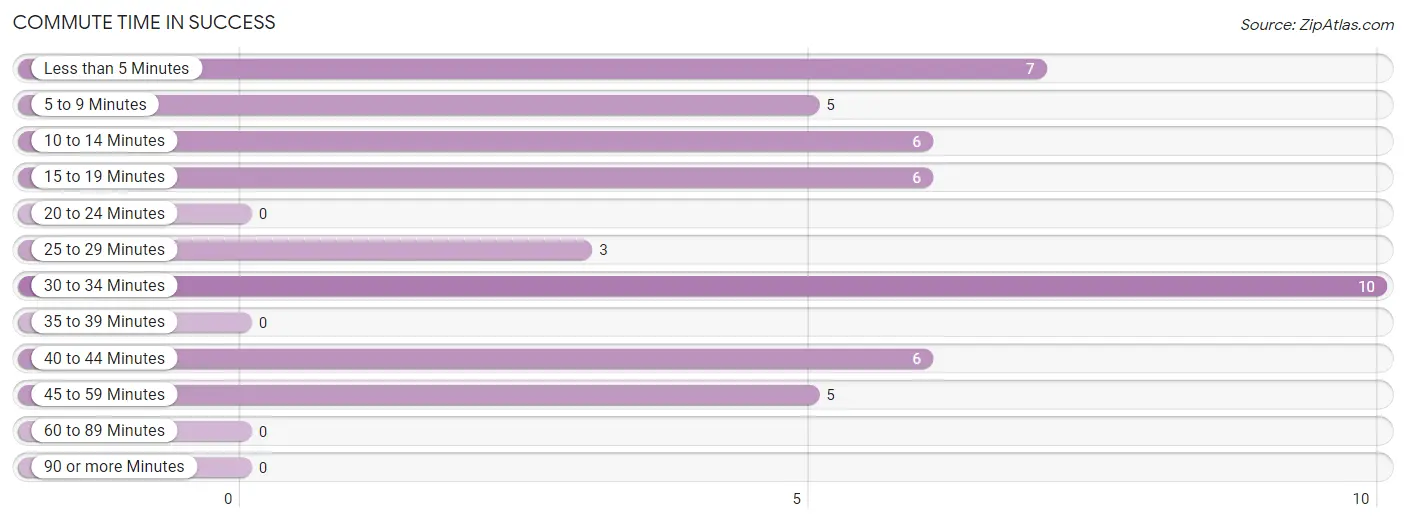
| Commute Time | # Commuters | % Commuters |
| Less than 5 Minutes | 7 | 14.6% |
| 5 to 9 Minutes | 5 | 10.4% |
| 10 to 14 Minutes | 6 | 12.5% |
| 15 to 19 Minutes | 6 | 12.5% |
| 20 to 24 Minutes | 0 | 0.0% |
| 25 to 29 Minutes | 3 | 6.2% |
| 30 to 34 Minutes | 10 | 20.8% |
| 35 to 39 Minutes | 0 | 0.0% |
| 40 to 44 Minutes | 6 | 12.5% |
| 45 to 59 Minutes | 5 | 10.4% |
| 60 to 89 Minutes | 0 | 0.0% |
| 90 or more Minutes | 0 | 0.0% |
Commute Time by Sex in Success
The most common commute times in Success are 30 to 34 minutes (7 commuters, 36.8%) for males and 10 to 14 minutes (6 commuters, 20.7%) for females.
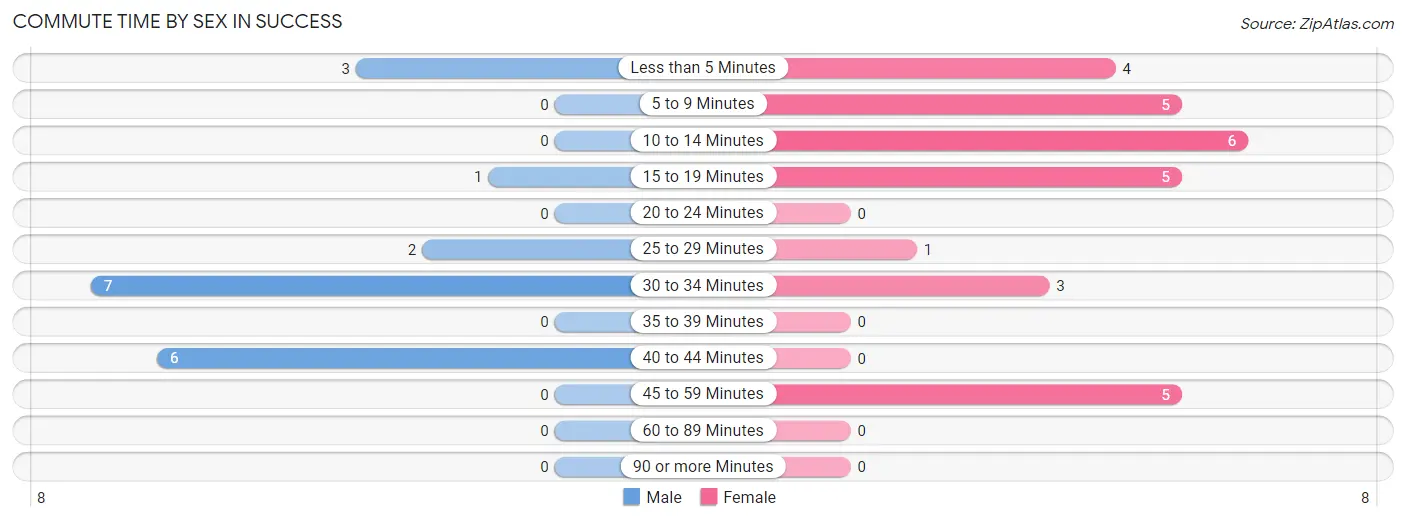
| Commute Time | Male | Female |
| Less than 5 Minutes | 3 (15.8%) | 4 (13.8%) |
| 5 to 9 Minutes | 0 (0.0%) | 5 (17.2%) |
| 10 to 14 Minutes | 0 (0.0%) | 6 (20.7%) |
| 15 to 19 Minutes | 1 (5.3%) | 5 (17.2%) |
| 20 to 24 Minutes | 0 (0.0%) | 0 (0.0%) |
| 25 to 29 Minutes | 2 (10.5%) | 1 (3.5%) |
| 30 to 34 Minutes | 7 (36.8%) | 3 (10.3%) |
| 35 to 39 Minutes | 0 (0.0%) | 0 (0.0%) |
| 40 to 44 Minutes | 6 (31.6%) | 0 (0.0%) |
| 45 to 59 Minutes | 0 (0.0%) | 5 (17.2%) |
| 60 to 89 Minutes | 0 (0.0%) | 0 (0.0%) |
| 90 or more Minutes | 0 (0.0%) | 0 (0.0%) |
Time of Departure to Work by Sex in Success
The most frequent times of departure to work in Success are 5:00 AM to 5:29 AM (4, 21.0%) for males and 6:30 AM to 6:59 AM (9, 31.0%) for females.
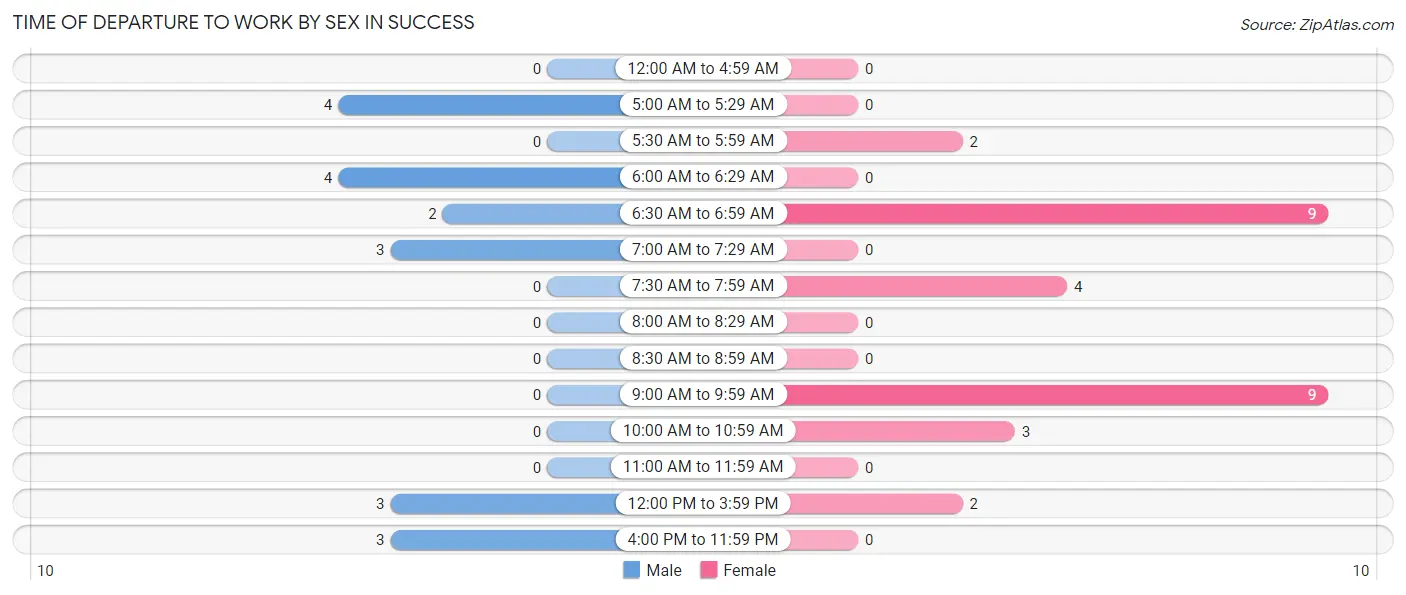
| Time of Departure | Male | Female |
| 12:00 AM to 4:59 AM | 0 (0.0%) | 0 (0.0%) |
| 5:00 AM to 5:29 AM | 4 (21.0%) | 0 (0.0%) |
| 5:30 AM to 5:59 AM | 0 (0.0%) | 2 (6.9%) |
| 6:00 AM to 6:29 AM | 4 (21.0%) | 0 (0.0%) |
| 6:30 AM to 6:59 AM | 2 (10.5%) | 9 (31.0%) |
| 7:00 AM to 7:29 AM | 3 (15.8%) | 0 (0.0%) |
| 7:30 AM to 7:59 AM | 0 (0.0%) | 4 (13.8%) |
| 8:00 AM to 8:29 AM | 0 (0.0%) | 0 (0.0%) |
| 8:30 AM to 8:59 AM | 0 (0.0%) | 0 (0.0%) |
| 9:00 AM to 9:59 AM | 0 (0.0%) | 9 (31.0%) |
| 10:00 AM to 10:59 AM | 0 (0.0%) | 3 (10.3%) |
| 11:00 AM to 11:59 AM | 0 (0.0%) | 0 (0.0%) |
| 12:00 PM to 3:59 PM | 3 (15.8%) | 2 (6.9%) |
| 4:00 PM to 11:59 PM | 3 (15.8%) | 0 (0.0%) |
| Total | 19 (100.0%) | 29 (100.0%) |
Housing Occupancy in Success
Occupancy by Ownership in Success
Of the total 58 dwellings in Success, owner-occupied units account for 48 (82.8%), while renter-occupied units make up 10 (17.2%).
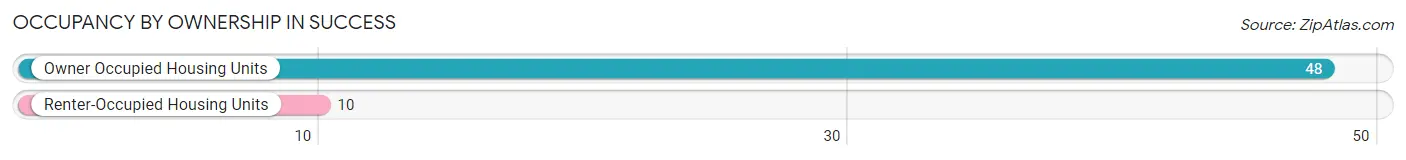
| Occupancy | # Housing Units | % Housing Units |
| Owner Occupied Housing Units | 48 | 82.8% |
| Renter-Occupied Housing Units | 10 | 17.2% |
| Total Occupied Housing Units | 58 | 100.0% |
Occupancy by Household Size in Success
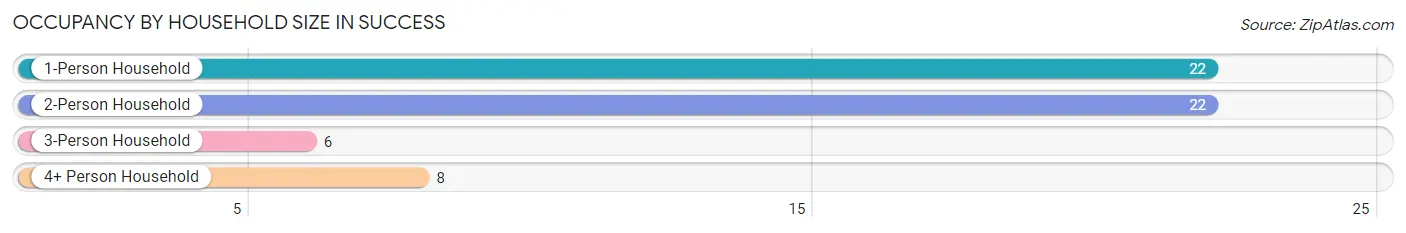
| Household Size | # Housing Units | % Housing Units |
| 1-Person Household | 22 | 37.9% |
| 2-Person Household | 22 | 37.9% |
| 3-Person Household | 6 | 10.3% |
| 4+ Person Household | 8 | 13.8% |
| Total Housing Units | 58 | 100.0% |
Occupancy by Ownership by Household Size in Success
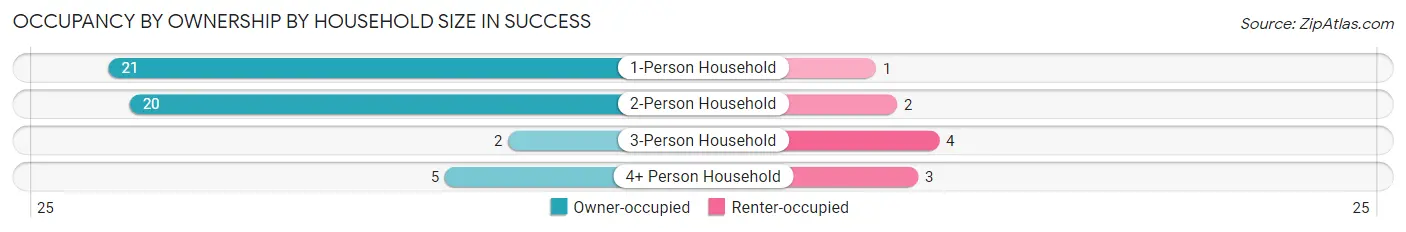
| Household Size | Owner-occupied | Renter-occupied |
| 1-Person Household | 21 (95.5%) | 1 (4.5%) |
| 2-Person Household | 20 (90.9%) | 2 (9.1%) |
| 3-Person Household | 2 (33.3%) | 4 (66.7%) |
| 4+ Person Household | 5 (62.5%) | 3 (37.5%) |
| Total Housing Units | 48 (82.8%) | 10 (17.2%) |
Occupancy by Educational Attainment in Success
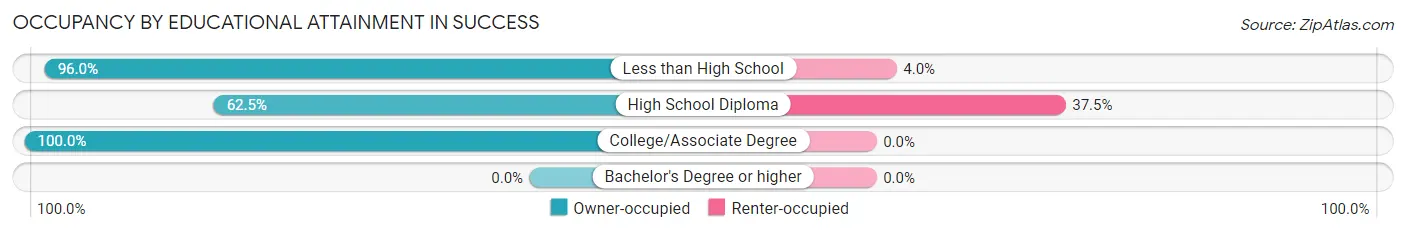
| Household Size | Owner-occupied | Renter-occupied |
| Less than High School | 24 (96.0%) | 1 (4.0%) |
| High School Diploma | 15 (62.5%) | 9 (37.5%) |
| College/Associate Degree | 9 (100.0%) | 0 (0.0%) |
| Bachelor's Degree or higher | 0 (0.0%) | 0 (0.0%) |
Occupancy by Age of Householder in Success
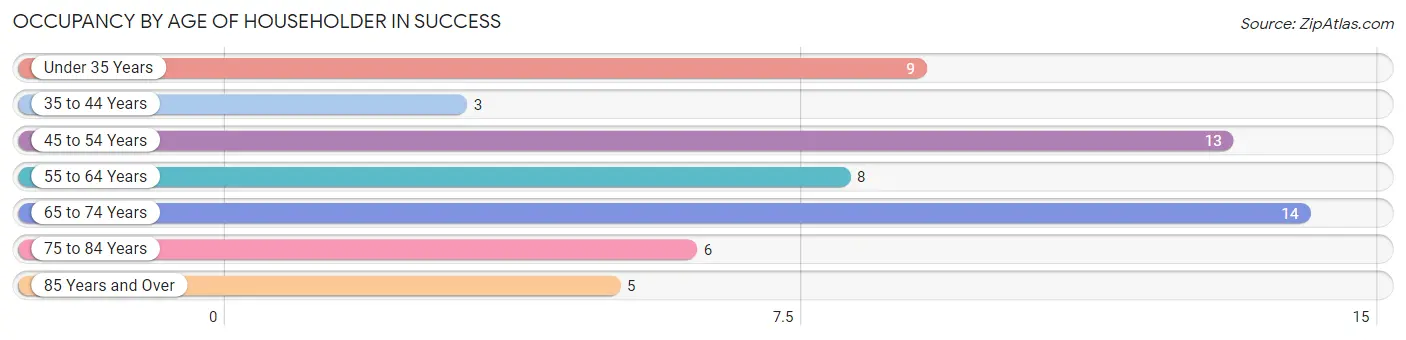
| Age Bracket | # Households | % Households |
| Under 35 Years | 9 | 15.5% |
| 35 to 44 Years | 3 | 5.2% |
| 45 to 54 Years | 13 | 22.4% |
| 55 to 64 Years | 8 | 13.8% |
| 65 to 74 Years | 14 | 24.1% |
| 75 to 84 Years | 6 | 10.3% |
| 85 Years and Over | 5 | 8.6% |
| Total | 58 | 100.0% |
Housing Finances in Success
Median Income by Occupancy in Success
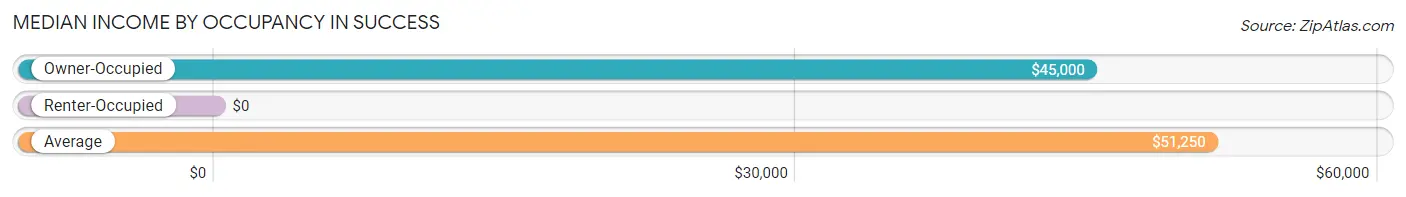
| Occupancy Type | # Households | Median Income |
| Owner-Occupied | 48 (82.8%) | $45,000 |
| Renter-Occupied | 10 (17.2%) | $0 |
| Average | 58 (100.0%) | $51,250 |
Occupancy by Householder Income Bracket in Success
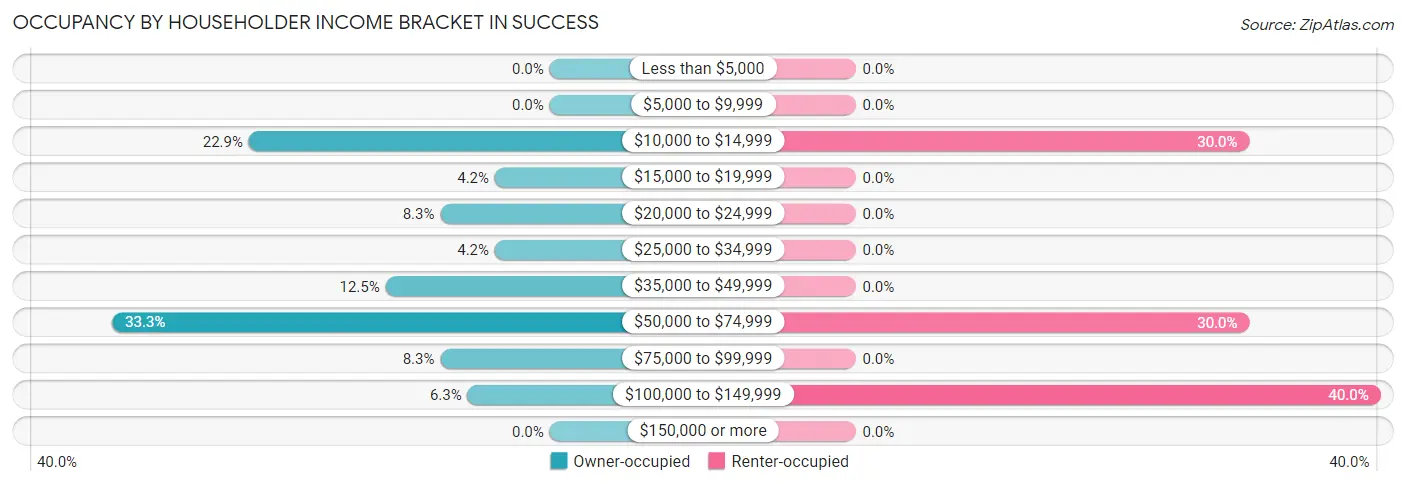
| Income Bracket | Owner-occupied | Renter-occupied |
| Less than $5,000 | 0 (0.0%) | 0 (0.0%) |
| $5,000 to $9,999 | 0 (0.0%) | 0 (0.0%) |
| $10,000 to $14,999 | 11 (22.9%) | 3 (30.0%) |
| $15,000 to $19,999 | 2 (4.2%) | 0 (0.0%) |
| $20,000 to $24,999 | 4 (8.3%) | 0 (0.0%) |
| $25,000 to $34,999 | 2 (4.2%) | 0 (0.0%) |
| $35,000 to $49,999 | 6 (12.5%) | 0 (0.0%) |
| $50,000 to $74,999 | 16 (33.3%) | 3 (30.0%) |
| $75,000 to $99,999 | 4 (8.3%) | 0 (0.0%) |
| $100,000 to $149,999 | 3 (6.2%) | 4 (40.0%) |
| $150,000 or more | 0 (0.0%) | 0 (0.0%) |
| Total | 48 (100.0%) | 10 (100.0%) |
Monthly Housing Cost Tiers in Success
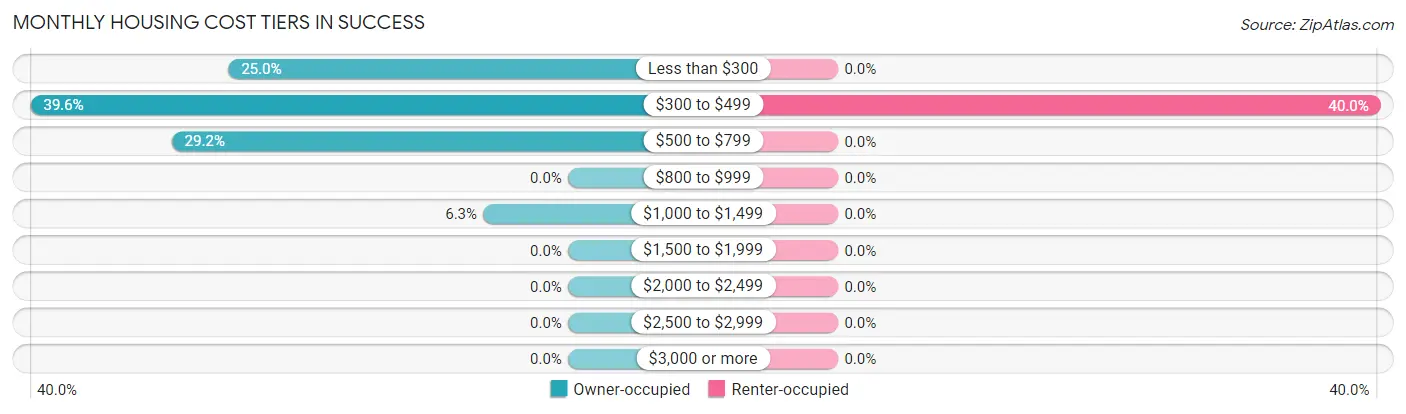
| Monthly Cost | Owner-occupied | Renter-occupied |
| Less than $300 | 12 (25.0%) | 0 (0.0%) |
| $300 to $499 | 19 (39.6%) | 4 (40.0%) |
| $500 to $799 | 14 (29.2%) | 0 (0.0%) |
| $800 to $999 | 0 (0.0%) | 0 (0.0%) |
| $1,000 to $1,499 | 3 (6.2%) | 0 (0.0%) |
| $1,500 to $1,999 | 0 (0.0%) | 0 (0.0%) |
| $2,000 to $2,499 | 0 (0.0%) | 0 (0.0%) |
| $2,500 to $2,999 | 0 (0.0%) | 0 (0.0%) |
| $3,000 or more | 0 (0.0%) | 0 (0.0%) |
| Total | 48 (100.0%) | 10 (100.0%) |
Physical Housing Characteristics in Success
Housing Structures in Success
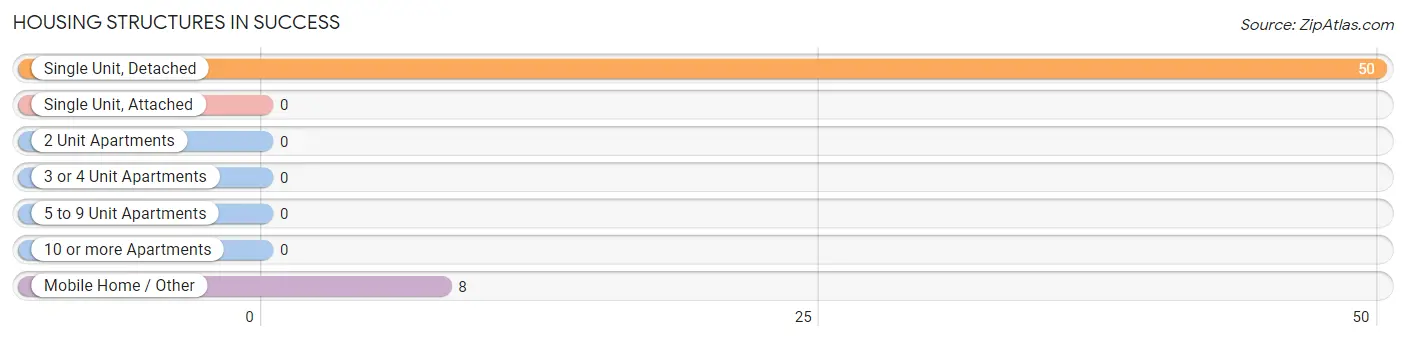
| Structure Type | # Housing Units | % Housing Units |
| Single Unit, Detached | 50 | 86.2% |
| Single Unit, Attached | 0 | 0.0% |
| 2 Unit Apartments | 0 | 0.0% |
| 3 or 4 Unit Apartments | 0 | 0.0% |
| 5 to 9 Unit Apartments | 0 | 0.0% |
| 10 or more Apartments | 0 | 0.0% |
| Mobile Home / Other | 8 | 13.8% |
| Total | 58 | 100.0% |
Housing Structures by Occupancy in Success
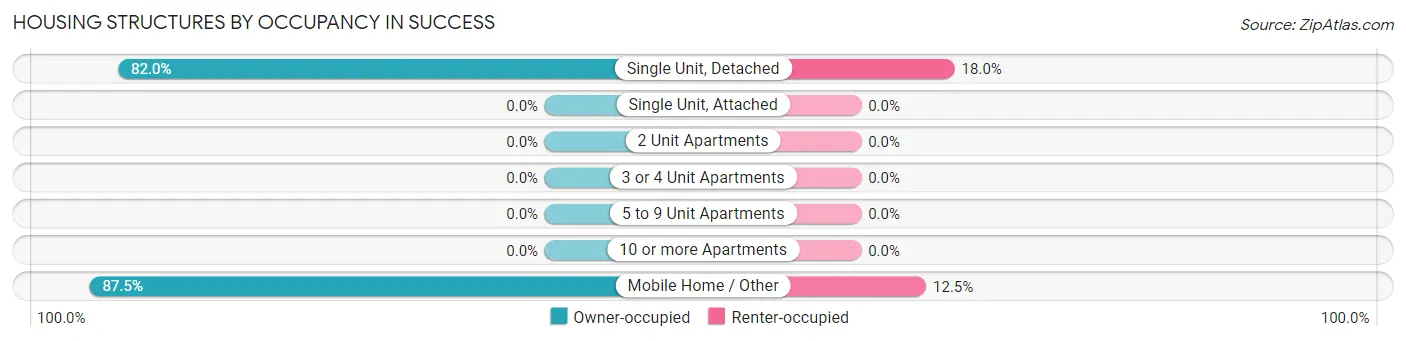
| Structure Type | Owner-occupied | Renter-occupied |
| Single Unit, Detached | 41 (82.0%) | 9 (18.0%) |
| Single Unit, Attached | 0 (0.0%) | 0 (0.0%) |
| 2 Unit Apartments | 0 (0.0%) | 0 (0.0%) |
| 3 or 4 Unit Apartments | 0 (0.0%) | 0 (0.0%) |
| 5 to 9 Unit Apartments | 0 (0.0%) | 0 (0.0%) |
| 10 or more Apartments | 0 (0.0%) | 0 (0.0%) |
| Mobile Home / Other | 7 (87.5%) | 1 (12.5%) |
| Total | 48 (82.8%) | 10 (17.2%) |
Housing Structures by Number of Rooms in Success
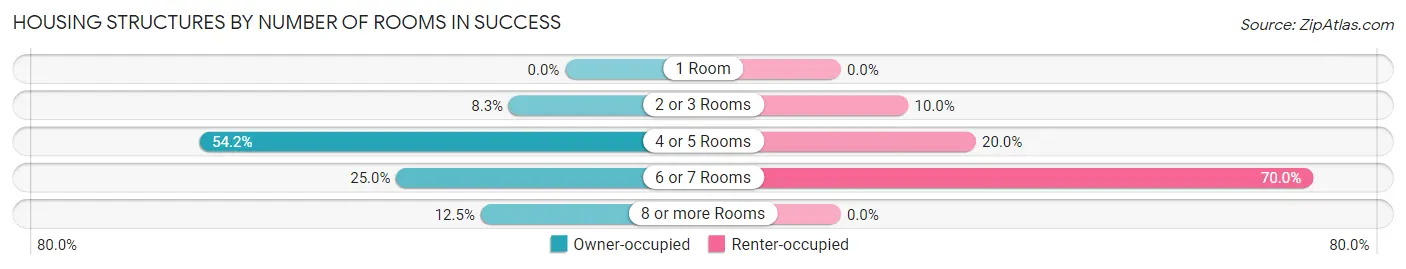
| Number of Rooms | Owner-occupied | Renter-occupied |
| 1 Room | 0 (0.0%) | 0 (0.0%) |
| 2 or 3 Rooms | 4 (8.3%) | 1 (10.0%) |
| 4 or 5 Rooms | 26 (54.2%) | 2 (20.0%) |
| 6 or 7 Rooms | 12 (25.0%) | 7 (70.0%) |
| 8 or more Rooms | 6 (12.5%) | 0 (0.0%) |
| Total | 48 (100.0%) | 10 (100.0%) |
Housing Structure by Heating Type in Success
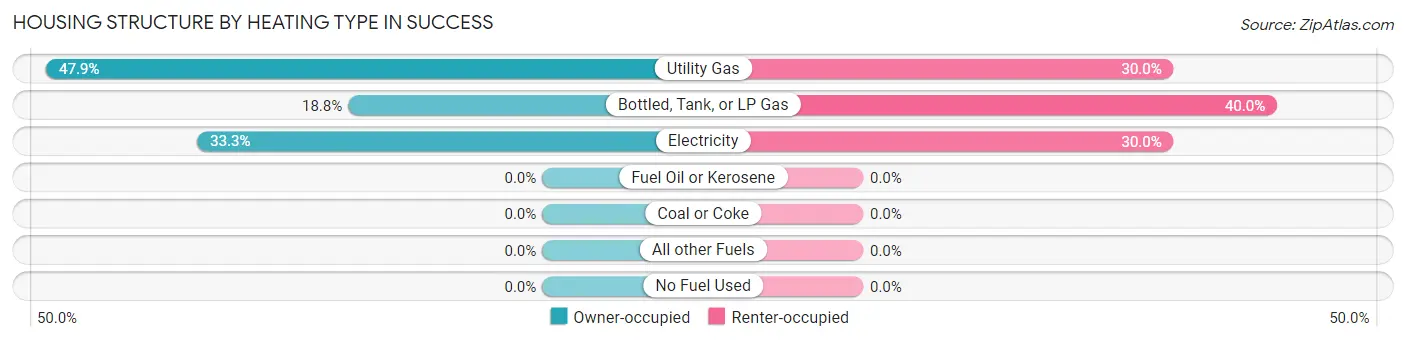
| Heating Type | Owner-occupied | Renter-occupied |
| Utility Gas | 23 (47.9%) | 3 (30.0%) |
| Bottled, Tank, or LP Gas | 9 (18.8%) | 4 (40.0%) |
| Electricity | 16 (33.3%) | 3 (30.0%) |
| Fuel Oil or Kerosene | 0 (0.0%) | 0 (0.0%) |
| Coal or Coke | 0 (0.0%) | 0 (0.0%) |
| All other Fuels | 0 (0.0%) | 0 (0.0%) |
| No Fuel Used | 0 (0.0%) | 0 (0.0%) |
| Total | 48 (100.0%) | 10 (100.0%) |
Household Vehicle Usage in Success
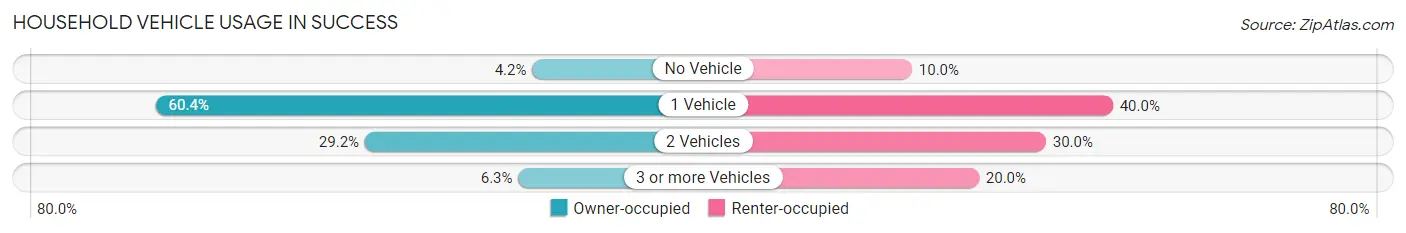
| Vehicles per Household | Owner-occupied | Renter-occupied |
| No Vehicle | 2 (4.2%) | 1 (10.0%) |
| 1 Vehicle | 29 (60.4%) | 4 (40.0%) |
| 2 Vehicles | 14 (29.2%) | 3 (30.0%) |
| 3 or more Vehicles | 3 (6.2%) | 2 (20.0%) |
| Total | 48 (100.0%) | 10 (100.0%) |
Real Estate & Mortgages in Success
Real Estate and Mortgage Overview in Success
| Characteristic | Without Mortgage | With Mortgage |
| Housing Units | 41 | 7 |
| Median Property Value | - | - |
| Median Household Income | $44,375 | $0 |
| Monthly Housing Costs | $391 | $0 |
| Real Estate Taxes | $200 | $0 |
Property Value by Mortgage Status in Success
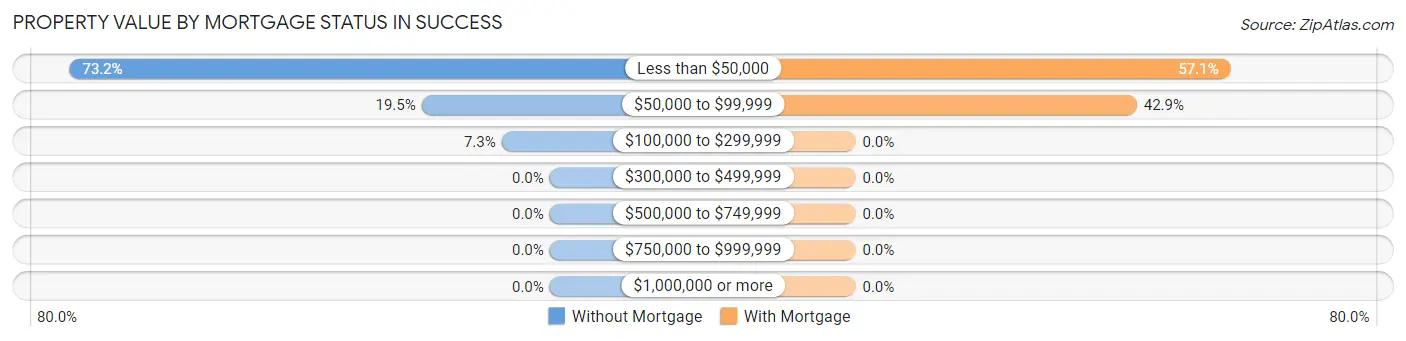
| Property Value | Without Mortgage | With Mortgage |
| Less than $50,000 | 30 (73.2%) | 4 (57.1%) |
| $50,000 to $99,999 | 8 (19.5%) | 3 (42.9%) |
| $100,000 to $299,999 | 3 (7.3%) | 0 (0.0%) |
| $300,000 to $499,999 | 0 (0.0%) | 0 (0.0%) |
| $500,000 to $749,999 | 0 (0.0%) | 0 (0.0%) |
| $750,000 to $999,999 | 0 (0.0%) | 0 (0.0%) |
| $1,000,000 or more | 0 (0.0%) | 0 (0.0%) |
| Total | 41 (100.0%) | 7 (100.0%) |
Household Income by Mortgage Status in Success
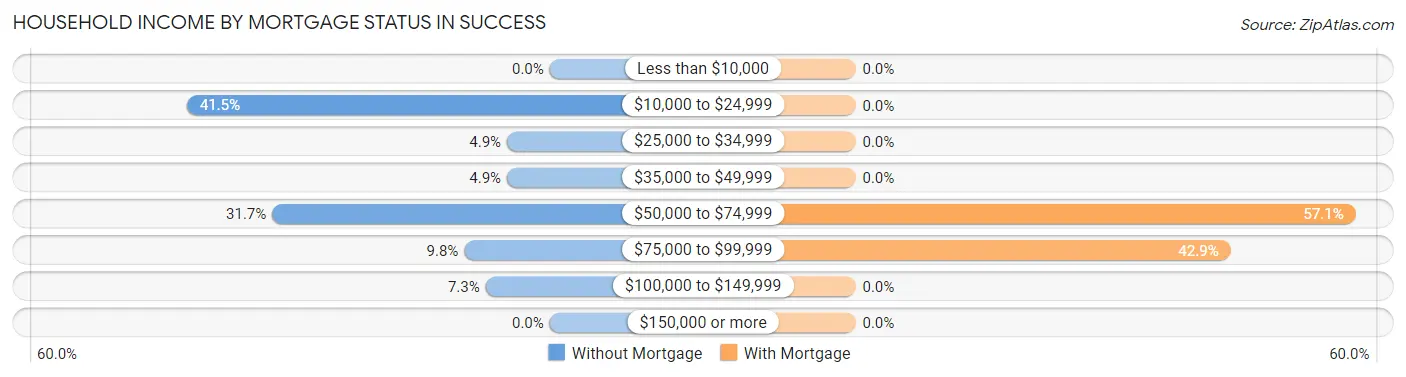
| Household Income | Without Mortgage | With Mortgage |
| Less than $10,000 | 0 (0.0%) | 0 (0.0%) |
| $10,000 to $24,999 | 17 (41.5%) | 0 (0.0%) |
| $25,000 to $34,999 | 2 (4.9%) | 0 (0.0%) |
| $35,000 to $49,999 | 2 (4.9%) | 0 (0.0%) |
| $50,000 to $74,999 | 13 (31.7%) | 4 (57.1%) |
| $75,000 to $99,999 | 4 (9.8%) | 3 (42.9%) |
| $100,000 to $149,999 | 3 (7.3%) | 0 (0.0%) |
| $150,000 or more | 0 (0.0%) | 0 (0.0%) |
| Total | 41 (100.0%) | 7 (100.0%) |
Property Value to Household Income Ratio in Success
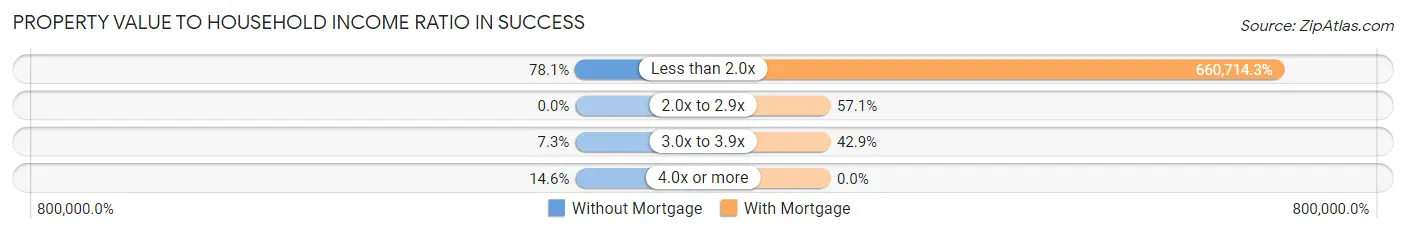
| Value-to-Income Ratio | Without Mortgage | With Mortgage |
| Less than 2.0x | 32 (78.0%) | 46,250 (660,714.3%) |
| 2.0x to 2.9x | 0 (0.0%) | 4 (57.1%) |
| 3.0x to 3.9x | 3 (7.3%) | 3 (42.9%) |
| 4.0x or more | 6 (14.6%) | 0 (0.0%) |
| Total | 41 (100.0%) | 7 (100.0%) |
Real Estate Taxes by Mortgage Status in Success
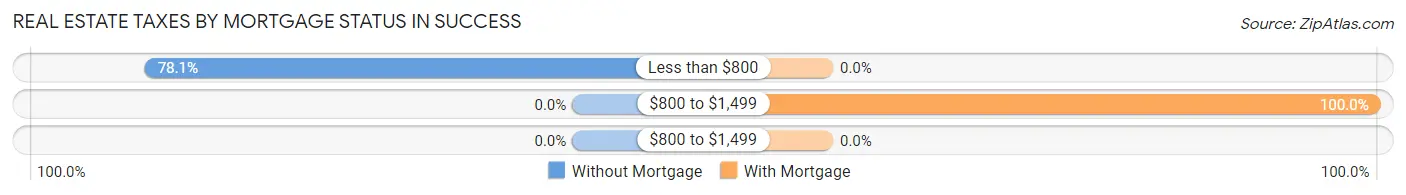
| Property Taxes | Without Mortgage | With Mortgage |
| Less than $800 | 32 (78.0%) | 0 (0.0%) |
| $800 to $1,499 | 0 (0.0%) | 7 (100.0%) |
| $800 to $1,499 | 0 (0.0%) | 0 (0.0%) |
| Total | 41 (100.0%) | 7 (100.0%) |
Health & Disability in Success
Health Insurance Coverage by Age in Success
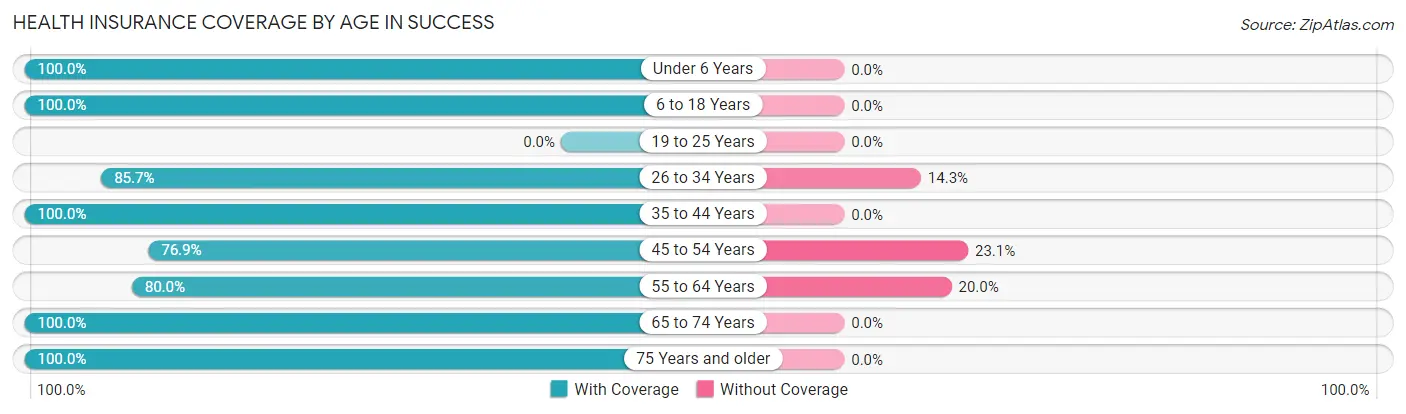
| Age Bracket | With Coverage | Without Coverage |
| Under 6 Years | 4 (100.0%) | 0 (0.0%) |
| 6 to 18 Years | 21 (100.0%) | 0 (0.0%) |
| 19 to 25 Years | 0 (0.0%) | 0 (0.0%) |
| 26 to 34 Years | 12 (85.7%) | 2 (14.3%) |
| 35 to 44 Years | 12 (100.0%) | 0 (0.0%) |
| 45 to 54 Years | 20 (76.9%) | 6 (23.1%) |
| 55 to 64 Years | 16 (80.0%) | 4 (20.0%) |
| 65 to 74 Years | 18 (100.0%) | 0 (0.0%) |
| 75 Years and older | 11 (100.0%) | 0 (0.0%) |
| Total | 114 (90.5%) | 12 (9.5%) |
Health Insurance Coverage by Citizenship Status in Success
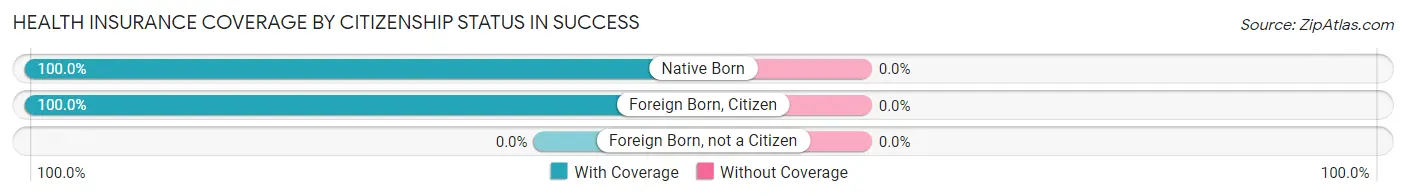
| Citizenship Status | With Coverage | Without Coverage |
| Native Born | 4 (100.0%) | 0 (0.0%) |
| Foreign Born, Citizen | 21 (100.0%) | 0 (0.0%) |
| Foreign Born, not a Citizen | 0 (0.0%) | 0 (0.0%) |
Health Insurance Coverage by Household Income in Success
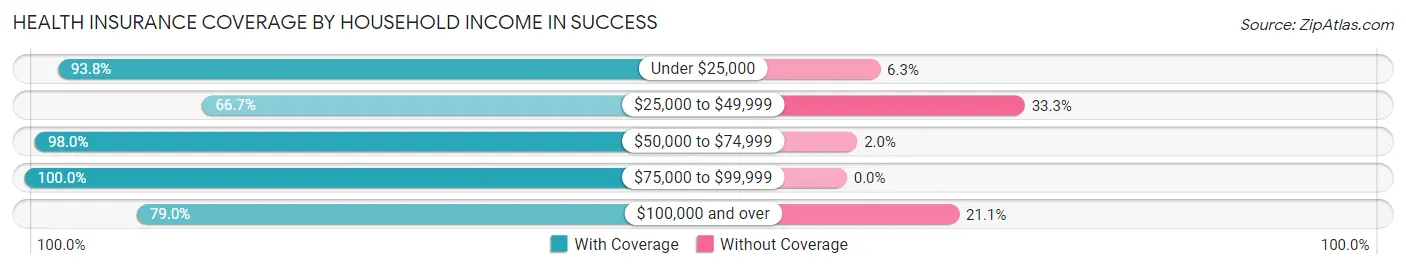
| Household Income | With Coverage | Without Coverage |
| Under $25,000 | 30 (93.8%) | 2 (6.2%) |
| $25,000 to $49,999 | 10 (66.7%) | 5 (33.3%) |
| $50,000 to $74,999 | 50 (98.0%) | 1 (2.0%) |
| $75,000 to $99,999 | 9 (100.0%) | 0 (0.0%) |
| $100,000 and over | 15 (78.9%) | 4 (21.0%) |
Public vs Private Health Insurance Coverage by Age in Success
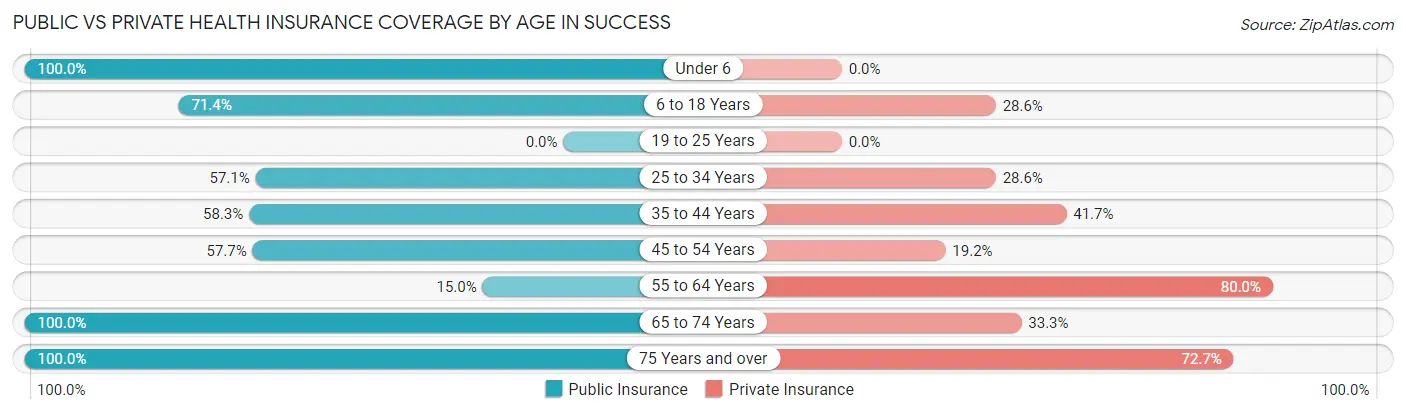
| Age Bracket | Public Insurance | Private Insurance |
| Under 6 | 4 (100.0%) | 0 (0.0%) |
| 6 to 18 Years | 15 (71.4%) | 6 (28.6%) |
| 19 to 25 Years | 0 (0.0%) | 0 (0.0%) |
| 25 to 34 Years | 8 (57.1%) | 4 (28.6%) |
| 35 to 44 Years | 7 (58.3%) | 5 (41.7%) |
| 45 to 54 Years | 15 (57.7%) | 5 (19.2%) |
| 55 to 64 Years | 3 (15.0%) | 16 (80.0%) |
| 65 to 74 Years | 18 (100.0%) | 6 (33.3%) |
| 75 Years and over | 11 (100.0%) | 8 (72.7%) |
| Total | 81 (64.3%) | 50 (39.7%) |
Disability Status by Sex by Age in Success
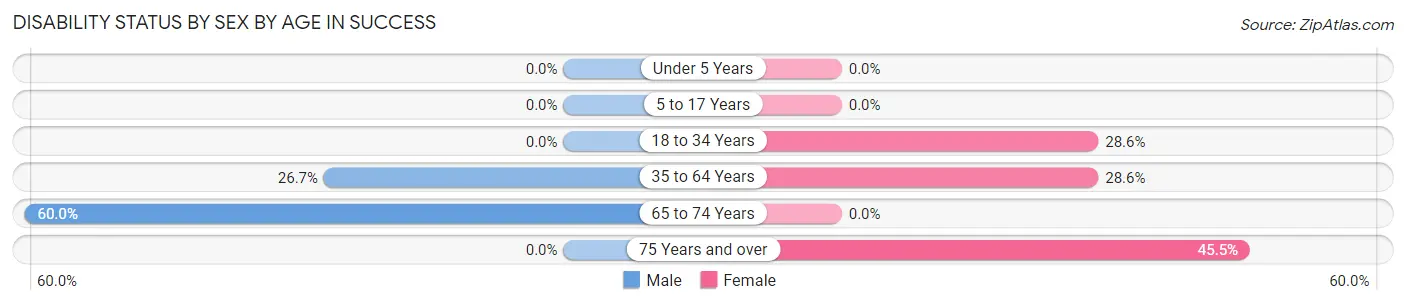
| Age Bracket | Male | Female |
| Under 5 Years | 0 (0.0%) | 0 (0.0%) |
| 5 to 17 Years | 0 (0.0%) | 0 (0.0%) |
| 18 to 34 Years | 0 (0.0%) | 2 (28.6%) |
| 35 to 64 Years | 8 (26.7%) | 8 (28.6%) |
| 65 to 74 Years | 6 (60.0%) | 0 (0.0%) |
| 75 Years and over | 0 (0.0%) | 5 (45.5%) |
Disability Class by Sex by Age in Success
Disability Class: Hearing Difficulty
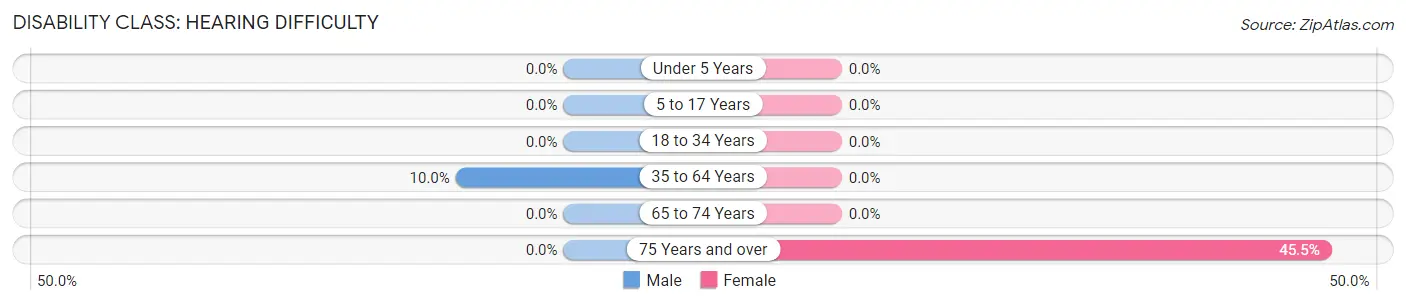
| Age Bracket | Male | Female |
| Under 5 Years | 0 (0.0%) | 0 (0.0%) |
| 5 to 17 Years | 0 (0.0%) | 0 (0.0%) |
| 18 to 34 Years | 0 (0.0%) | 0 (0.0%) |
| 35 to 64 Years | 3 (10.0%) | 0 (0.0%) |
| 65 to 74 Years | 0 (0.0%) | 0 (0.0%) |
| 75 Years and over | 0 (0.0%) | 5 (45.5%) |
Disability Class: Vision Difficulty
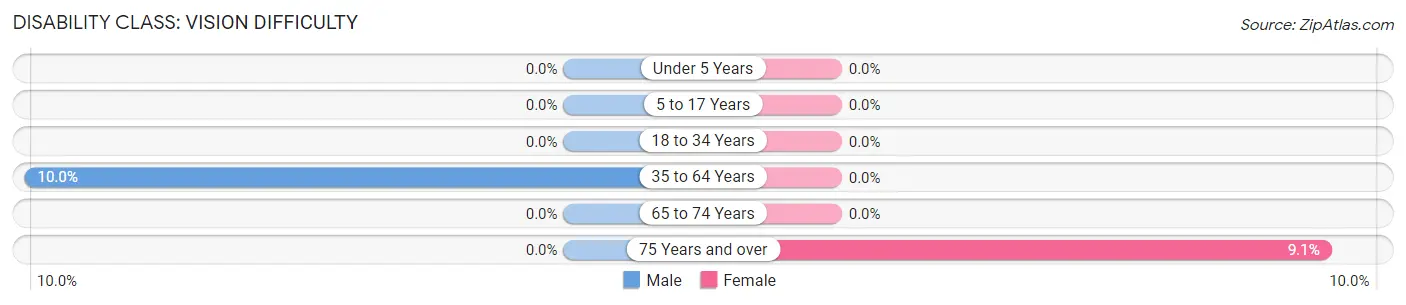
| Age Bracket | Male | Female |
| Under 5 Years | 0 (0.0%) | 0 (0.0%) |
| 5 to 17 Years | 0 (0.0%) | 0 (0.0%) |
| 18 to 34 Years | 0 (0.0%) | 0 (0.0%) |
| 35 to 64 Years | 3 (10.0%) | 0 (0.0%) |
| 65 to 74 Years | 0 (0.0%) | 0 (0.0%) |
| 75 Years and over | 0 (0.0%) | 1 (9.1%) |
Disability Class: Cognitive Difficulty
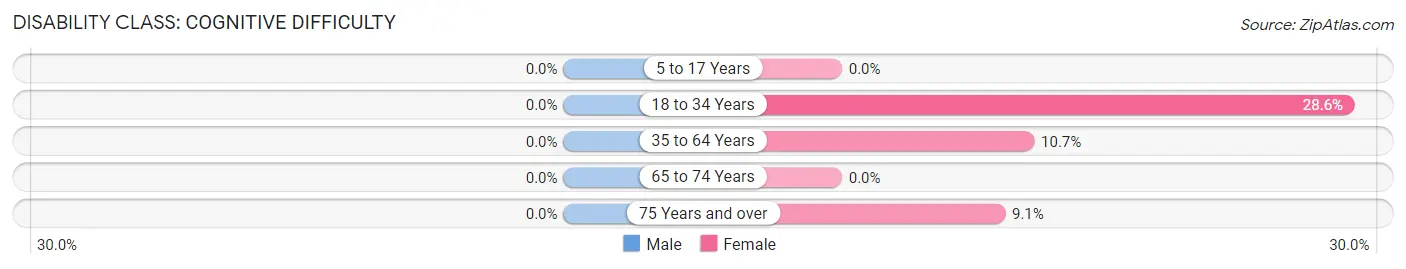
| Age Bracket | Male | Female |
| 5 to 17 Years | 0 (0.0%) | 0 (0.0%) |
| 18 to 34 Years | 0 (0.0%) | 2 (28.6%) |
| 35 to 64 Years | 0 (0.0%) | 3 (10.7%) |
| 65 to 74 Years | 0 (0.0%) | 0 (0.0%) |
| 75 Years and over | 0 (0.0%) | 1 (9.1%) |
Disability Class: Ambulatory Difficulty
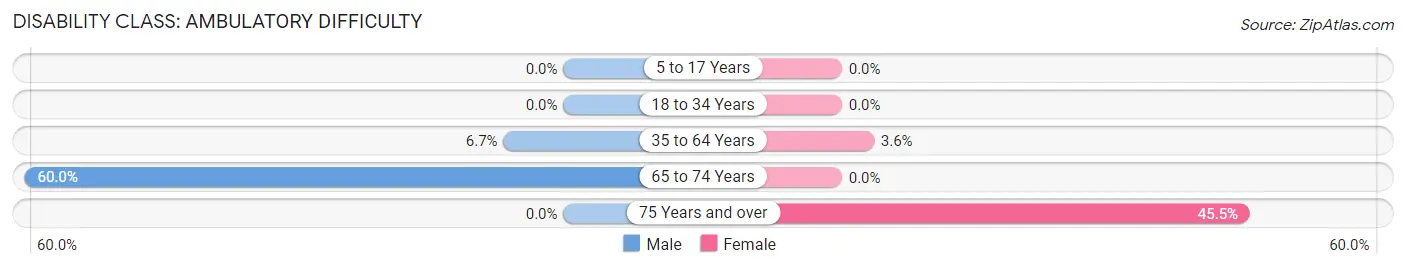
| Age Bracket | Male | Female |
| 5 to 17 Years | 0 (0.0%) | 0 (0.0%) |
| 18 to 34 Years | 0 (0.0%) | 0 (0.0%) |
| 35 to 64 Years | 2 (6.7%) | 1 (3.6%) |
| 65 to 74 Years | 6 (60.0%) | 0 (0.0%) |
| 75 Years and over | 0 (0.0%) | 5 (45.5%) |
Disability Class: Self-Care Difficulty
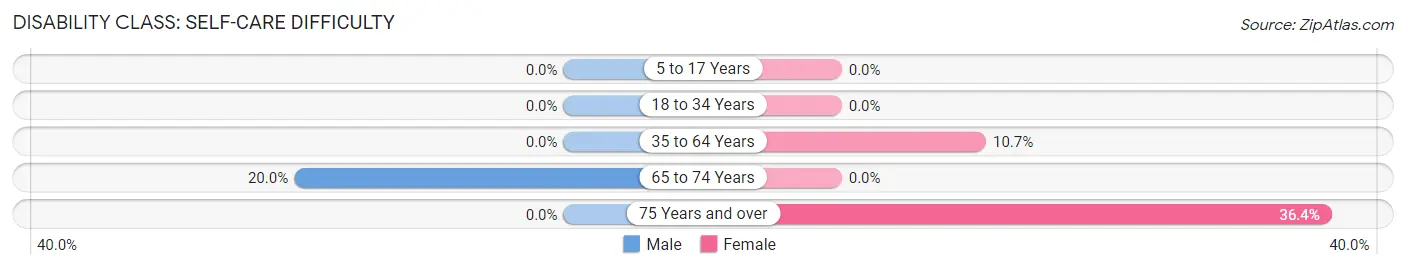
| Age Bracket | Male | Female |
| 5 to 17 Years | 0 (0.0%) | 0 (0.0%) |
| 18 to 34 Years | 0 (0.0%) | 0 (0.0%) |
| 35 to 64 Years | 0 (0.0%) | 3 (10.7%) |
| 65 to 74 Years | 2 (20.0%) | 0 (0.0%) |
| 75 Years and over | 0 (0.0%) | 4 (36.4%) |
Technology Access in Success
Computing Device Access in Success
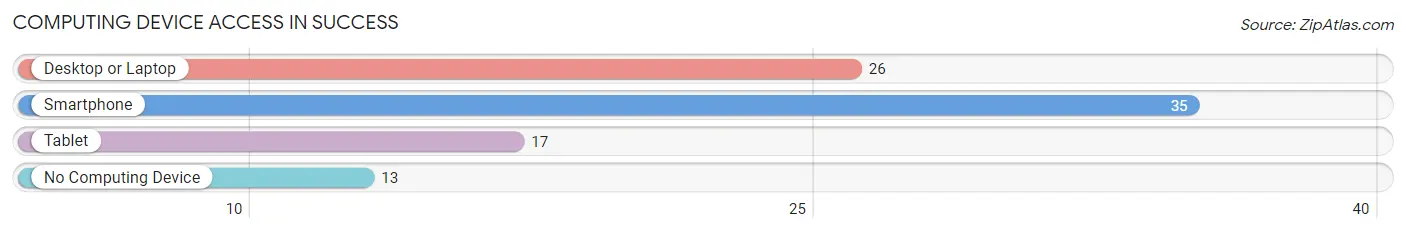
| Device Type | # Households | % Households |
| Desktop or Laptop | 26 | 44.8% |
| Smartphone | 35 | 60.3% |
| Tablet | 17 | 29.3% |
| No Computing Device | 13 | 22.4% |
| Total | 58 | 100.0% |
Internet Access in Success
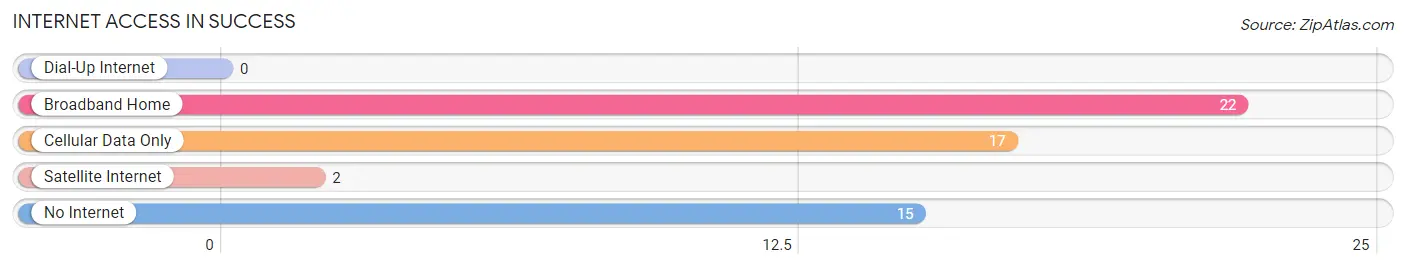
| Internet Type | # Households | % Households |
| Dial-Up Internet | 0 | 0.0% |
| Broadband Home | 22 | 37.9% |
| Cellular Data Only | 17 | 29.3% |
| Satellite Internet | 2 | 3.5% |
| No Internet | 15 | 25.9% |
| Total | 58 | 100.0% |
Success Summary
AR History
The history of Arkansas is a long and varied one, stretching back to the earliest days of the United States. The first inhabitants of the area were Native American tribes, including the Caddo, Osage, Quapaw, and Cherokee. These tribes were eventually displaced by European settlers, who began to arrive in the early 1800s. The first permanent settlement in Arkansas was established in 1819, and the state was admitted to the Union in 1836.
Throughout the 19th century, Arkansas was a largely agricultural state, with cotton and rice being the primary crops. The state also had a strong timber industry, and the lumber industry was a major source of employment. During the Civil War, Arkansas was a Confederate state, and the state was the site of several major battles. After the war, the state experienced a period of Reconstruction, during which the economy was rebuilt and the state’s infrastructure was improved.
In the early 20th century, Arkansas experienced a period of industrialization, with the development of the state’s natural resources, such as oil and natural gas. The state also experienced a period of population growth, as people from other parts of the country moved to Arkansas in search of work. During the Great Depression, Arkansas was hit hard, and the state’s economy suffered.
In the post-World War II era, Arkansas experienced a period of economic growth, as the state’s natural resources were developed and the state’s infrastructure was improved. The state also experienced a period of population growth, as people from other parts of the country moved to Arkansas in search of work. In the late 20th century, Arkansas experienced a period of economic diversification, as the state’s economy shifted away from its reliance on agriculture and natural resources.
Geography
Arkansas is located in the south-central United States, bordered by six states: Missouri, Tennessee, Mississippi, Louisiana, Texas, and Oklahoma. The state is divided into 75 counties, and its capital is Little Rock. Arkansas is a land of mountains and valleys, with the Ozark Mountains in the northwest and the Ouachita Mountains in the south. The state is also home to several rivers, including the Arkansas River, the White River, and the Red River.
The climate of Arkansas is generally mild, with hot summers and mild winters. The state receives an average of 50 inches of rain per year, and the average temperature in the summer is around 80 degrees Fahrenheit.
Economy
The economy of Arkansas is largely based on agriculture, with the state’s main crops being cotton, rice, soybeans, and wheat. The state is also a major producer of poultry, and the poultry industry is a major source of employment. Other important industries in the state include manufacturing, tourism, and energy production.
The state’s unemployment rate is currently 4.2%, which is slightly lower than the national average. The median household income in Arkansas is $45,869, which is slightly lower than the national average.
Demographics
As of 2019, the population of Arkansas was estimated to be 3 million. The state is predominantly white, with 79.3% of the population identifying as white. The state is also home to a large African American population, with 15.4% of the population identifying as African American. Other racial groups in the state include Native American (1.2%), Asian (1.2%), and Hispanic or Latino (3.7%).
The median age in Arkansas is 37.7, and the state has a higher-than-average percentage of people over the age of 65 (15.3%). The state also has a higher-than-average percentage of people living in poverty (17.2%).
Common Questions
What is Per Capita Income in Success?
Per Capita income in Success is $21,560.
What is the Median Family Income in Success?
Median Family Income in Success is $50,625.
What is the Median Household income in Success?
Median Household Income in Success is $51,250.
What is Income or Wage Gap in Success?
Income or Wage Gap in Success is 36.3%.
Women in Success earn 63.7 cents for every dollar earned by a man.
What is Inequality or Gini Index in Success?
Inequality or Gini Index in Success is 0.37.
What is the Total Population of Success?
Total Population of Success is 126.
What is the Total Male Population of Success?
Total Male Population of Success is 61.
What is the Total Female Population of Success?
Total Female Population of Success is 65.
What is the Ratio of Males per 100 Females in Success?
There are 93.85 Males per 100 Females in Success.
What is the Ratio of Females per 100 Males in Success?
There are 106.56 Females per 100 Males in Success.
What is the Median Population Age in Success?
Median Population Age in Success is 51.9 Years.
What is the Average Family Size in Success
Average Family Size in Success is 2.9 People.
What is the Average Household Size in Success
Average Household Size in Success is 2.2 People.
How Large is the Labor Force in Success?
There are 68 People in the Labor Forcein in Success.
What is the Percentage of People in the Labor Force in Success?
65.4% of People are in the Labor Force in Success.
What is the Unemployment Rate in Success?
Unemployment Rate in Success is 14.7%.