Rye, AR Map & Demographics
Rye Map
Rye Overview
$25,467
PER CAPITA INCOME
0.28
INEQUALITY / GINI INDEX
185
TOTAL POPULATION
89
MALE POPULATION
96
FEMALE POPULATION
92.71
MALES / 100 FEMALES
107.87
FEMALES / 100 MALES
47.0
MEDIAN AGE
2.6
AVG FAMILY SIZE
1.9
AVG HOUSEHOLD SIZE
52
LABOR FORCE [ PEOPLE ]
38.8%
PERCENT IN LABOR FORCE
Income in Rye
Income Overview in Rye
| Characteristic | Number | Measure |
| Per Capita Income | 185 | $25,467 |
| Median Family Income | 55 | $0 |
| Mean Family Income | 55 | $57,064 |
| Median Household Income | 95 | $0 |
| Mean Household Income | 95 | $56,423 |
| Income Deficit | 55 | $0 |
| Wage / Income Gap (%) | 185 | 0.00% |
| Wage / Income Gap ($) | 185 | 100.00¢ per $1 |
| Gini / Inequality Index | 185 | 0.28 |
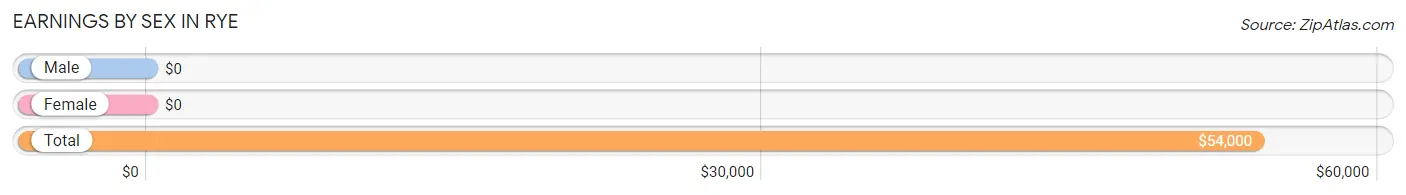
Earnings by Sex in Rye
| Sex | Number | Average Earnings |
| Male | 39 (75.0%) | $0 |
| Female | 13 (25.0%) | $0 |
| Total | 52 (100.0%) | $54,000 |
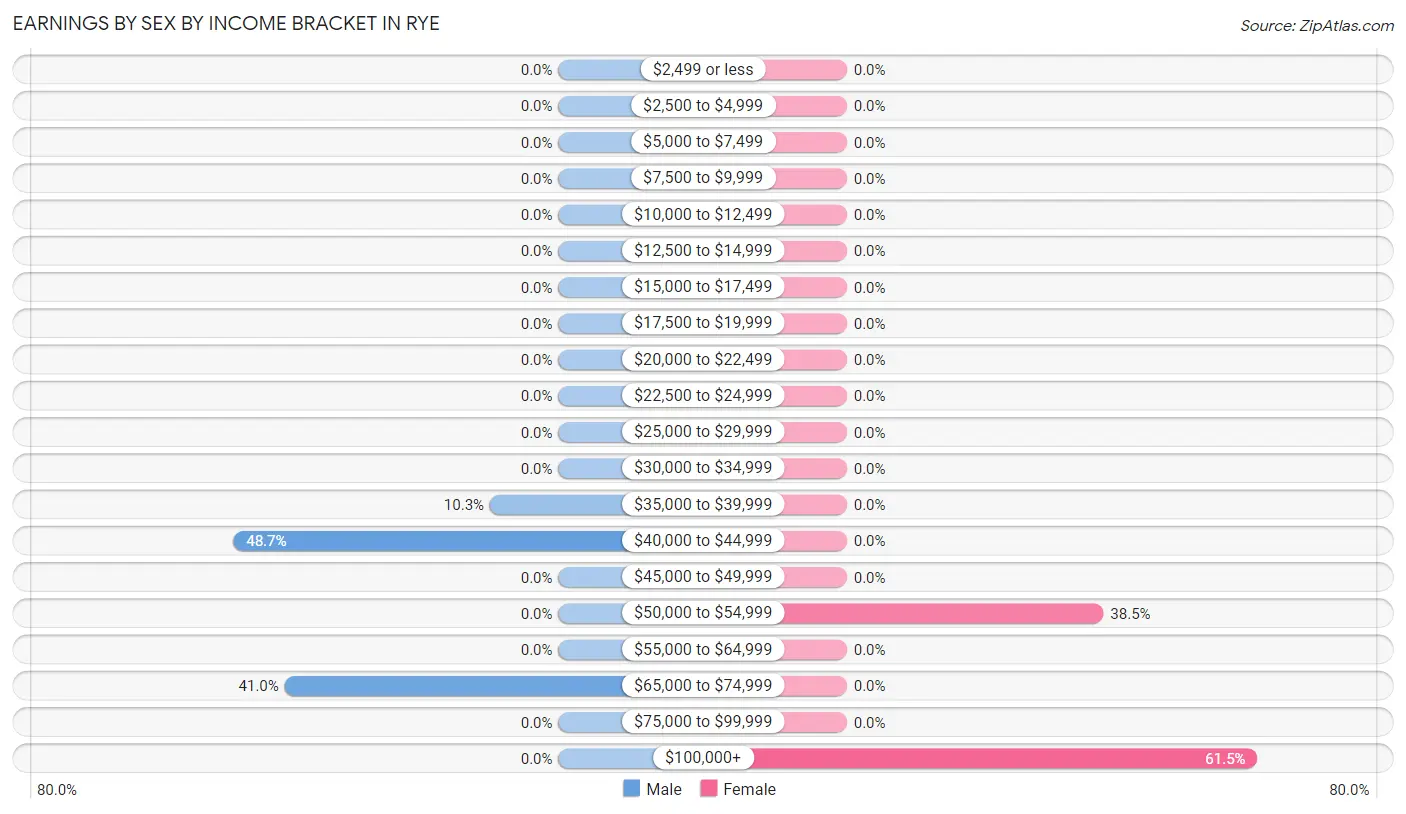
Earnings by Sex by Income Bracket in Rye
The most common earnings brackets in Rye are $40,000 to $44,999 for men (19 | 48.7%) and $100,000+ for women (8 | 61.5%).
| Income | Male | Female |
| $2,499 or less | 0 (0.0%) | 0 (0.0%) |
| $2,500 to $4,999 | 0 (0.0%) | 0 (0.0%) |
| $5,000 to $7,499 | 0 (0.0%) | 0 (0.0%) |
| $7,500 to $9,999 | 0 (0.0%) | 0 (0.0%) |
| $10,000 to $12,499 | 0 (0.0%) | 0 (0.0%) |
| $12,500 to $14,999 | 0 (0.0%) | 0 (0.0%) |
| $15,000 to $17,499 | 0 (0.0%) | 0 (0.0%) |
| $17,500 to $19,999 | 0 (0.0%) | 0 (0.0%) |
| $20,000 to $22,499 | 0 (0.0%) | 0 (0.0%) |
| $22,500 to $24,999 | 0 (0.0%) | 0 (0.0%) |
| $25,000 to $29,999 | 0 (0.0%) | 0 (0.0%) |
| $30,000 to $34,999 | 0 (0.0%) | 0 (0.0%) |
| $35,000 to $39,999 | 4 (10.3%) | 0 (0.0%) |
| $40,000 to $44,999 | 19 (48.7%) | 0 (0.0%) |
| $45,000 to $49,999 | 0 (0.0%) | 0 (0.0%) |
| $50,000 to $54,999 | 0 (0.0%) | 5 (38.5%) |
| $55,000 to $64,999 | 0 (0.0%) | 0 (0.0%) |
| $65,000 to $74,999 | 16 (41.0%) | 0 (0.0%) |
| $75,000 to $99,999 | 0 (0.0%) | 0 (0.0%) |
| $100,000+ | 0 (0.0%) | 8 (61.5%) |
| Total | 39 (100.0%) | 13 (100.0%) |
Earnings by Sex by Educational Attainment in Rye
| Educational Attainment | Male Income | Female Income |
| Less than High School | - | - |
| High School Diploma | - | - |
| College or Associate's Degree | - | - |
| Bachelor's Degree | - | - |
| Graduate Degree | - | - |
| Total | - | - |
Family Income in Rye
Family Income Brackets in Rye
According to the Rye family income data, there are 33 families falling into the $35,000 to $49,999 income range, which is the most common income bracket and makes up 60.0% of all families.
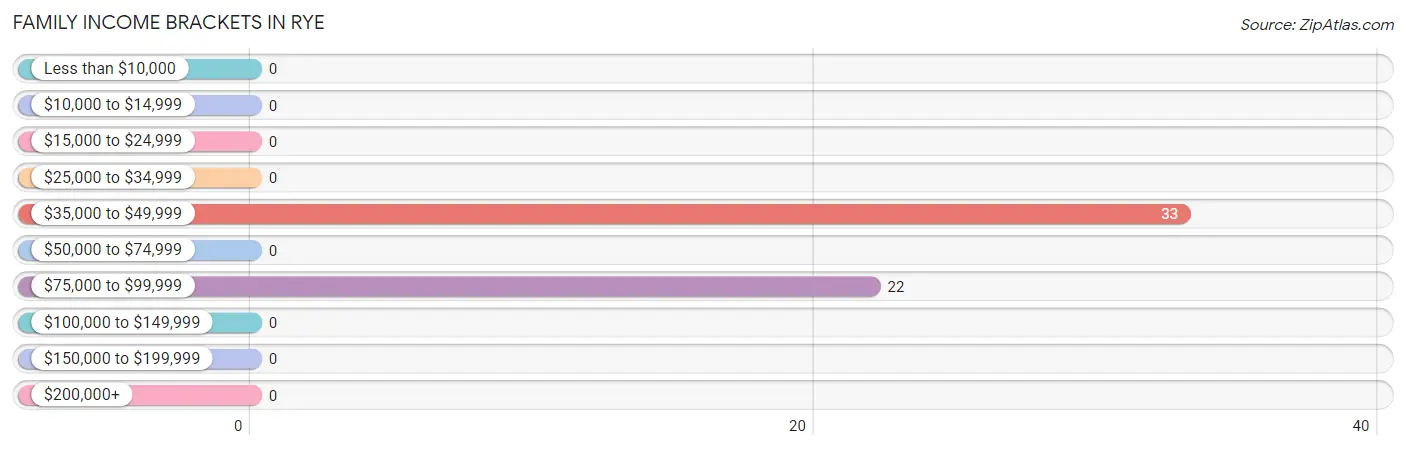
| Income Bracket | # Families | % Families |
| Less than $10,000 | 0 | 0.0% |
| $10,000 to $14,999 | 0 | 0.0% |
| $15,000 to $24,999 | 0 | 0.0% |
| $25,000 to $34,999 | 0 | 0.0% |
| $35,000 to $49,999 | 33 | 60.0% |
| $50,000 to $74,999 | 0 | 0.0% |
| $75,000 to $99,999 | 22 | 40.0% |
| $100,000 to $149,999 | 0 | 0.0% |
| $150,000 to $199,999 | 0 | 0.0% |
| $200,000+ | 0 | 0.0% |
Family Income by Famaliy Size in Rye
| Income Bracket | # Families | Median Income |
| 2-Person Families | 0 (0.0%) | $0 |
| 3-Person Families | 55 (100.0%) | $0 |
| 4-Person Families | 0 (0.0%) | $0 |
| 5-Person Families | 0 (0.0%) | $0 |
| 6-Person Families | 0 (0.0%) | $0 |
| 7+ Person Families | 0 (0.0%) | $0 |
| Total | 55 (100.0%) | $0 |
Family Income by Number of Earners in Rye
| Number of Earners | # Families | Median Income |
| No Earners | 17 (30.9%) | $0 |
| 1 Earner | 33 (60.0%) | $0 |
| 2 Earners | 5 (9.1%) | $0 |
| 3+ Earners | 0 (0.0%) | $0 |
| Total | 55 (100.0%) | $0 |
Household Income in Rye
Household Income Brackets in Rye
With 33 households falling in the category, the $35,000 to $49,999 income range is the most frequent in Rye, accounting for 34.7% of all households.
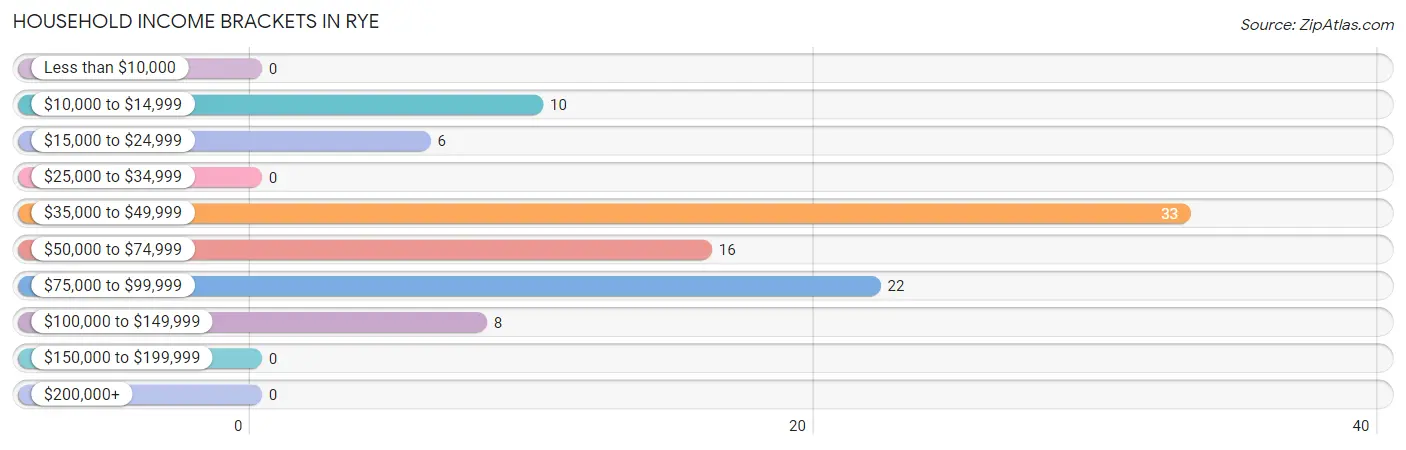
| Income Bracket | # Households | % Households |
| Less than $10,000 | 0 | 0.0% |
| $10,000 to $14,999 | 10 | 10.5% |
| $15,000 to $24,999 | 6 | 6.3% |
| $25,000 to $34,999 | 0 | 0.0% |
| $35,000 to $49,999 | 33 | 34.7% |
| $50,000 to $74,999 | 16 | 16.8% |
| $75,000 to $99,999 | 22 | 23.2% |
| $100,000 to $149,999 | 8 | 8.4% |
| $150,000 to $199,999 | 0 | 0.0% |
| $200,000+ | 0 | 0.0% |
Household Income by Householder Age in Rye
The median household income in Rye is $0, with the highest median household income of $41,970 found in the 45 to 64 years age bracket for the primary householder. A total of 62 households (65.3%) fall into this category.
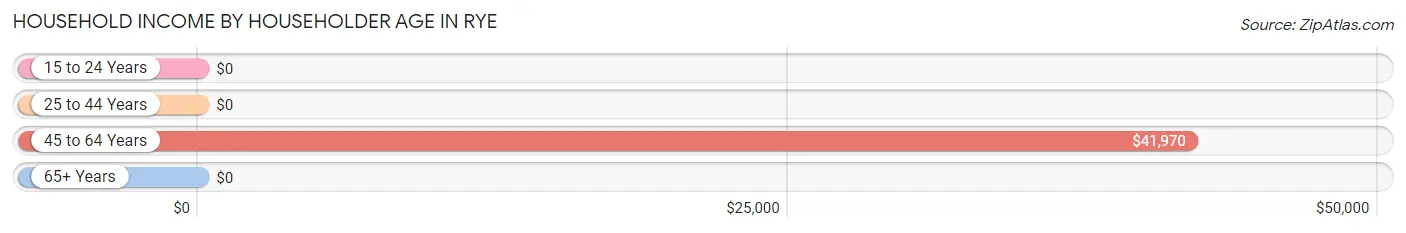
| Income Bracket | # Households | Median Income |
| 15 to 24 Years | 0 (0.0%) | $0 |
| 25 to 44 Years | 5 (5.3%) | $0 |
| 45 to 64 Years | 62 (65.3%) | $41,970 |
| 65+ Years | 28 (29.5%) | $0 |
| Total | 95 (100.0%) | $0 |
Poverty in Rye
Income Below Poverty by Sex and Age in Rye
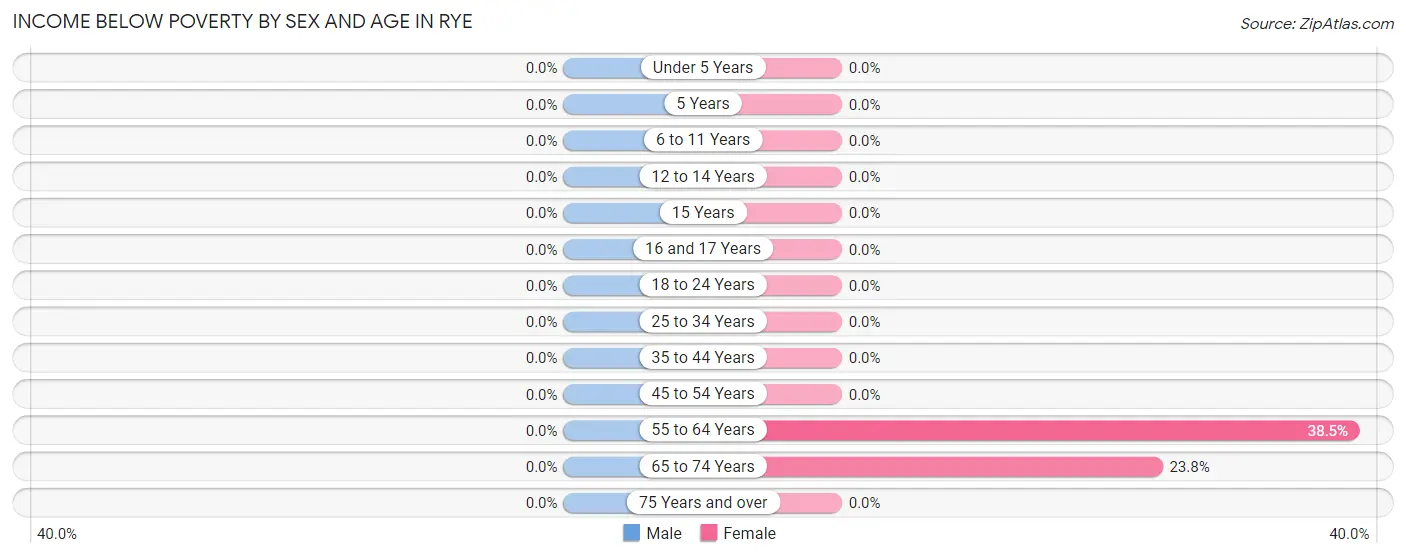
| Age Bracket | Male | Female |
| Under 5 Years | 0 (0.0%) | 0 (0.0%) |
| 5 Years | 0 (0.0%) | 0 (0.0%) |
| 6 to 11 Years | 0 (0.0%) | 0 (0.0%) |
| 12 to 14 Years | 0 (0.0%) | 0 (0.0%) |
| 15 Years | 0 (0.0%) | 0 (0.0%) |
| 16 and 17 Years | 0 (0.0%) | 0 (0.0%) |
| 18 to 24 Years | 0 (0.0%) | 0 (0.0%) |
| 25 to 34 Years | 0 (0.0%) | 0 (0.0%) |
| 35 to 44 Years | 0 (0.0%) | 0 (0.0%) |
| 45 to 54 Years | 0 (0.0%) | 0 (0.0%) |
| 55 to 64 Years | 0 (0.0%) | 5 (38.5%) |
| 65 to 74 Years | 0 (0.0%) | 5 (23.8%) |
| 75 Years and over | 0 (0.0%) | 0 (0.0%) |
| Total | 0 (0.0%) | 10 (10.4%) |
Income Above Poverty by Sex and Age in Rye
According to the poverty statistics in Rye, males aged 12 to 14 years and females aged 6 to 11 years are the age groups that are most secure financially, with 100.0% of males and 100.0% of females in these age groups living above the poverty line.
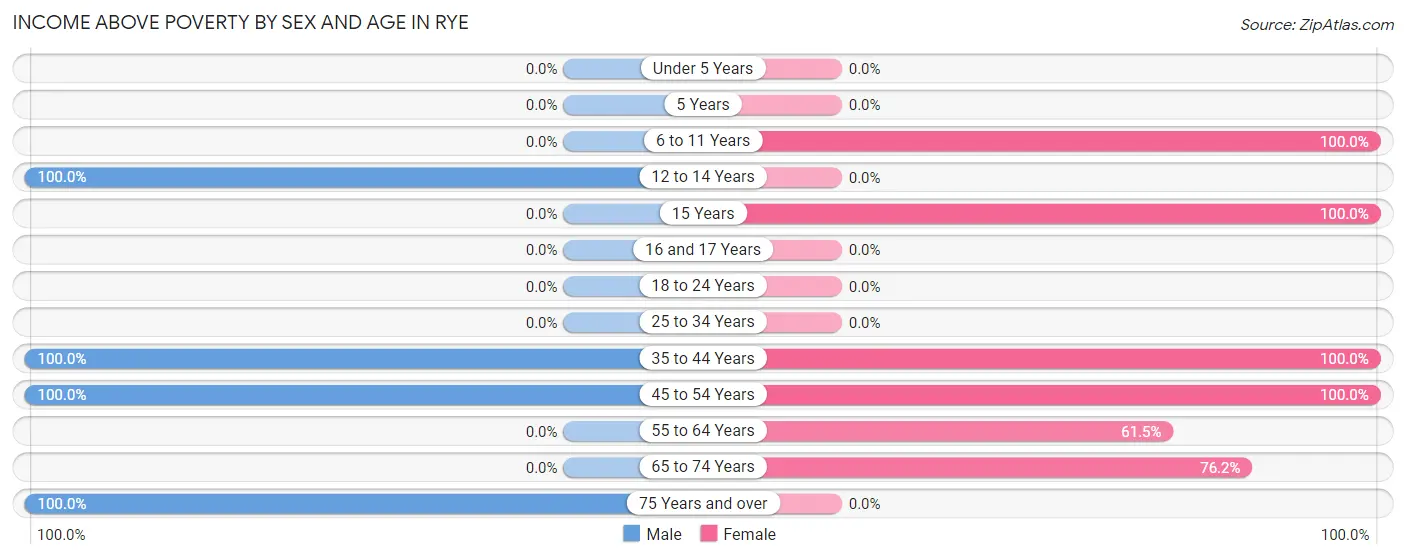
| Age Bracket | Male | Female |
| Under 5 Years | 0 (0.0%) | 0 (0.0%) |
| 5 Years | 0 (0.0%) | 0 (0.0%) |
| 6 to 11 Years | 0 (0.0%) | 3 (100.0%) |
| 12 to 14 Years | 27 (100.0%) | 0 (0.0%) |
| 15 Years | 0 (0.0%) | 21 (100.0%) |
| 16 and 17 Years | 0 (0.0%) | 0 (0.0%) |
| 18 to 24 Years | 0 (0.0%) | 0 (0.0%) |
| 25 to 34 Years | 0 (0.0%) | 0 (0.0%) |
| 35 to 44 Years | 4 (100.0%) | 5 (100.0%) |
| 45 to 54 Years | 35 (100.0%) | 33 (100.0%) |
| 55 to 64 Years | 0 (0.0%) | 8 (61.5%) |
| 65 to 74 Years | 0 (0.0%) | 16 (76.2%) |
| 75 Years and over | 23 (100.0%) | 0 (0.0%) |
| Total | 89 (100.0%) | 86 (89.6%) |
Income Below Poverty Among Married-Couple Families in Rye
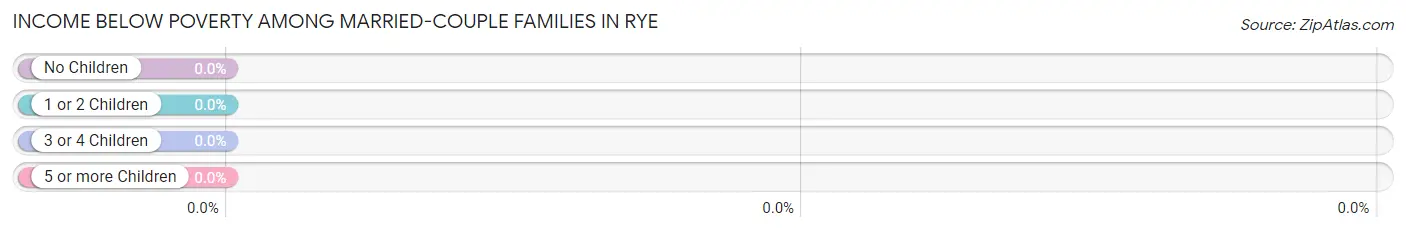
| Children | Above Poverty | Below Poverty |
| No Children | 0 (0.0%) | 0 (0.0%) |
| 1 or 2 Children | 55 (100.0%) | 0 (0.0%) |
| 3 or 4 Children | 0 (0.0%) | 0 (0.0%) |
| 5 or more Children | 0 (0.0%) | 0 (0.0%) |
| Total | 55 (100.0%) | 0 (0.0%) |
Income Below Poverty Among Single-Parent Households in Rye
| Children | Single Father | Single Mother |
| No Children | 0 (0.0%) | 0 (0.0%) |
| 1 or 2 Children | 0 (0.0%) | 0 (0.0%) |
| 3 or 4 Children | 0 (0.0%) | 0 (0.0%) |
| 5 or more Children | 0 (0.0%) | 0 (0.0%) |
| Total | 0 (0.0%) | 0 (0.0%) |
Income Below Poverty Among Married-Couple vs Single-Parent Households in Rye
| Children | Married-Couple Families | Single-Parent Households |
| No Children | 0 (0.0%) | 0 (0.0%) |
| 1 or 2 Children | 0 (0.0%) | 0 (0.0%) |
| 3 or 4 Children | 0 (0.0%) | 0 (0.0%) |
| 5 or more Children | 0 (0.0%) | 0 (0.0%) |
| Total | 0 (0.0%) | 0 (0.0%) |
Race in Rye
The most populous races in Rye are , and White / Caucasian (185 | 100.0%).
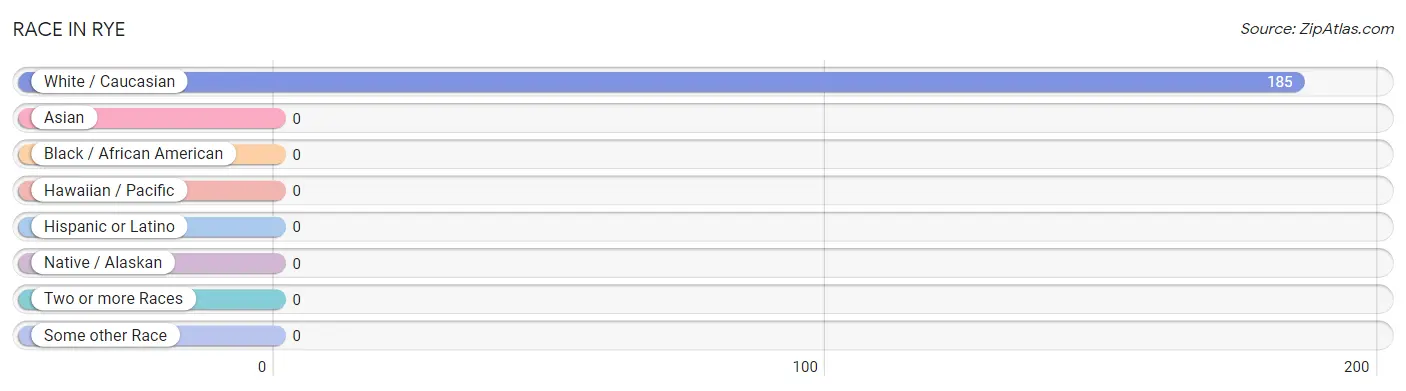
| Race | # Population | % Population |
| Asian | 0 | 0.0% |
| Black / African American | 0 | 0.0% |
| Hawaiian / Pacific | 0 | 0.0% |
| Hispanic or Latino | 0 | 0.0% |
| Native / Alaskan | 0 | 0.0% |
| White / Caucasian | 185 | 100.0% |
| Two or more Races | 0 | 0.0% |
| Some other Race | 0 | 0.0% |
| Total | 185 | 100.0% |
Ancestry in Rye
The most populous ancestries reported in Rye are , and European (14 | 7.6%), together accounting for 7.6% of all Rye residents.

| Ancestry | # Population | % Population |
| European | 14 | 7.6% | View All 1 Rows |
Immigrants in Rye

| Immigration Origin | # Population | % Population | View All 0 Rows |
Sex and Age in Rye
Sex and Age in Rye
The most populous age groups in Rye are 50 to 54 Years (35 | 39.3%) for men and 45 to 49 Years (33 | 34.4%) for women.
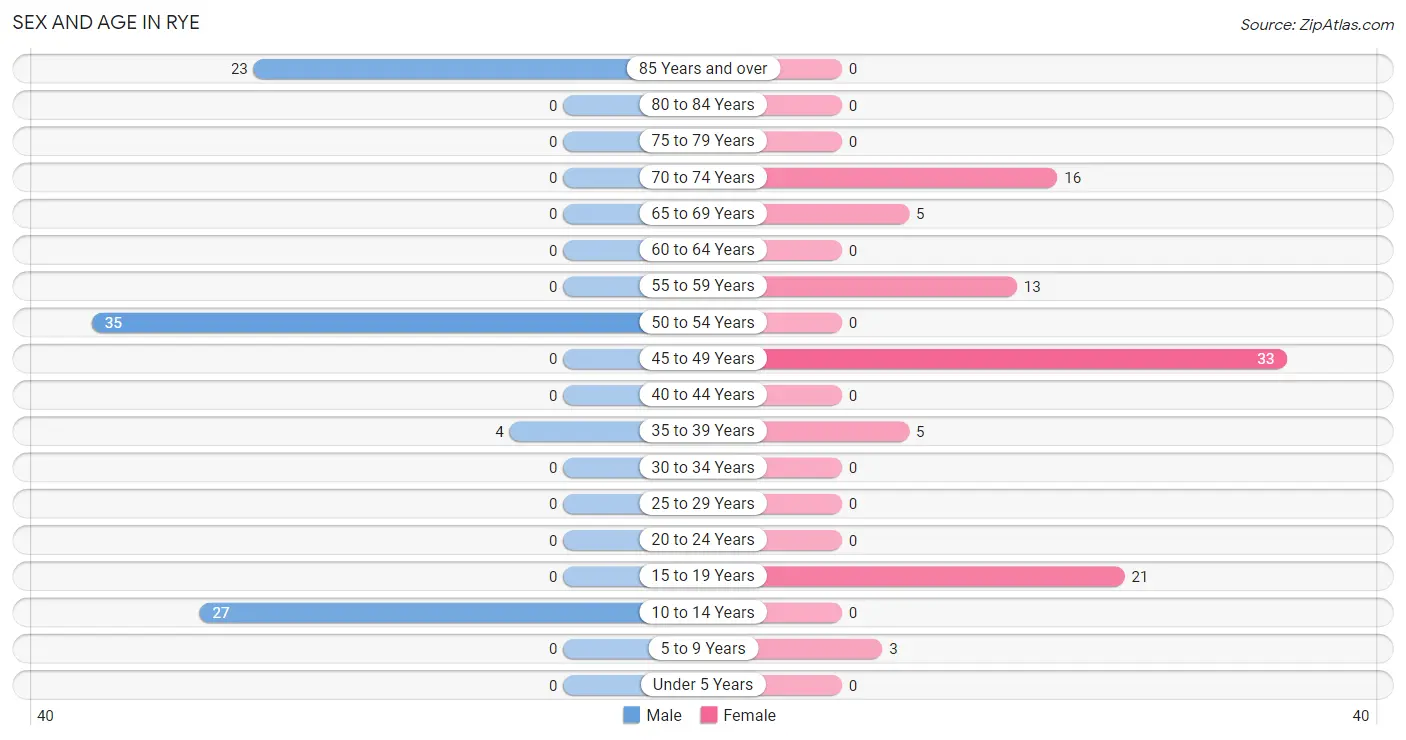
| Age Bracket | Male | Female |
| Under 5 Years | 0 (0.0%) | 0 (0.0%) |
| 5 to 9 Years | 0 (0.0%) | 3 (3.1%) |
| 10 to 14 Years | 27 (30.3%) | 0 (0.0%) |
| 15 to 19 Years | 0 (0.0%) | 21 (21.9%) |
| 20 to 24 Years | 0 (0.0%) | 0 (0.0%) |
| 25 to 29 Years | 0 (0.0%) | 0 (0.0%) |
| 30 to 34 Years | 0 (0.0%) | 0 (0.0%) |
| 35 to 39 Years | 4 (4.5%) | 5 (5.2%) |
| 40 to 44 Years | 0 (0.0%) | 0 (0.0%) |
| 45 to 49 Years | 0 (0.0%) | 33 (34.4%) |
| 50 to 54 Years | 35 (39.3%) | 0 (0.0%) |
| 55 to 59 Years | 0 (0.0%) | 13 (13.5%) |
| 60 to 64 Years | 0 (0.0%) | 0 (0.0%) |
| 65 to 69 Years | 0 (0.0%) | 5 (5.2%) |
| 70 to 74 Years | 0 (0.0%) | 16 (16.7%) |
| 75 to 79 Years | 0 (0.0%) | 0 (0.0%) |
| 80 to 84 Years | 0 (0.0%) | 0 (0.0%) |
| 85 Years and over | 23 (25.8%) | 0 (0.0%) |
| Total | 89 (100.0%) | 96 (100.0%) |
Families and Households in Rye
Median Family Size in Rye
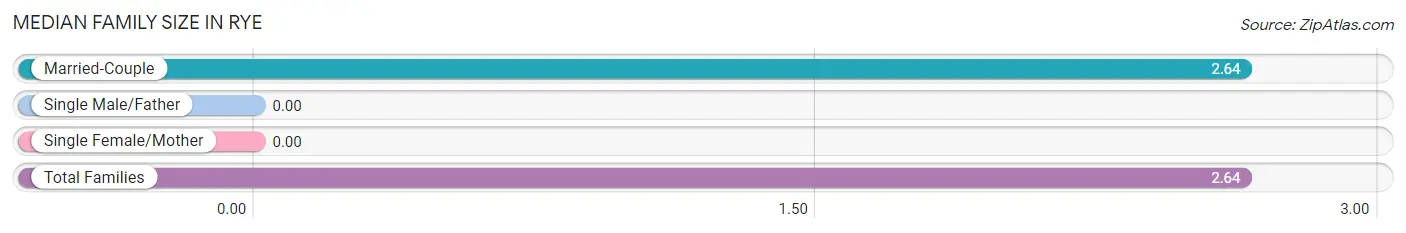
| Family Type | # Families | Family Size |
| Married-Couple | 55 (100.0%) | 2.64 |
| Single Male/Father | 0 (0.0%) | - |
| Single Female/Mother | 0 (0.0%) | - |
| Total Families | 55 (100.0%) | 2.64 |
Median Household Size in Rye
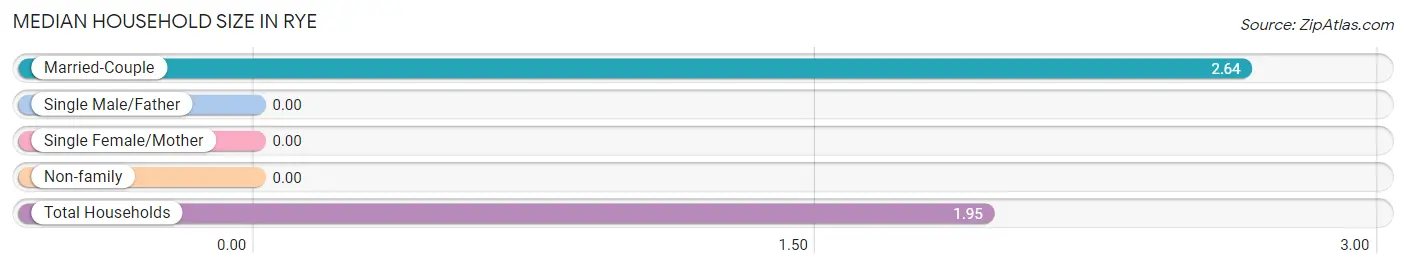
| Household Type | # Households | Household Size |
| Married-Couple | 55 (57.9%) | 2.64 |
| Single Male/Father | 0 (0.0%) | - |
| Single Female/Mother | 0 (0.0%) | - |
| Non-family | 40 (42.1%) | - |
| Total Households | 95 (100.0%) | 1.95 |
Household Size by Marriage Status in Rye
Out of a total of 95 households in Rye, 55 (57.9%) are family households, while 40 (42.1%) are nonfamily households. The most numerous type of family households are 3-person households, comprising 55, and the most common type of nonfamily households are 1-person households, comprising 40.
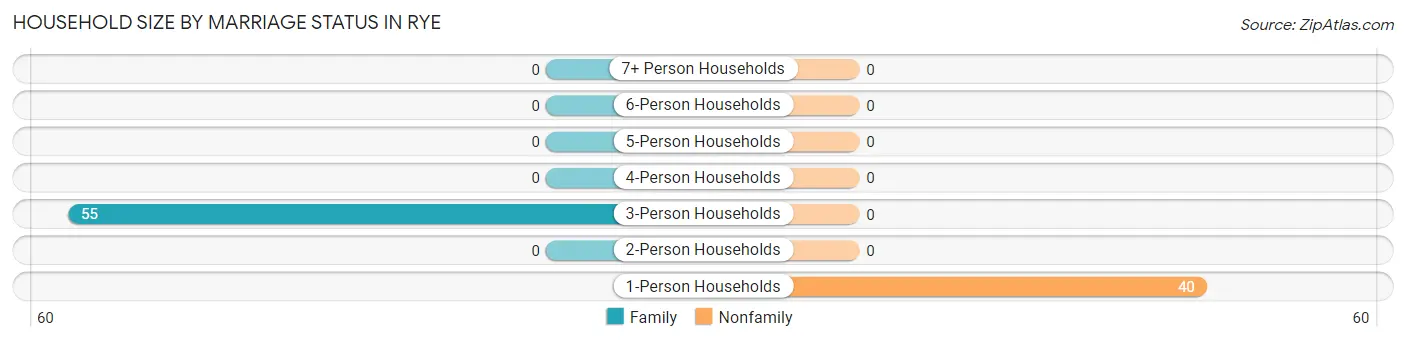
| Household Size | Family Households | Nonfamily Households |
| 1-Person Households | - | 40 (42.1%) |
| 2-Person Households | 0 (0.0%) | 0 (0.0%) |
| 3-Person Households | 55 (57.9%) | 0 (0.0%) |
| 4-Person Households | 0 (0.0%) | 0 (0.0%) |
| 5-Person Households | 0 (0.0%) | 0 (0.0%) |
| 6-Person Households | 0 (0.0%) | 0 (0.0%) |
| 7+ Person Households | 0 (0.0%) | 0 (0.0%) |
| Total | 55 (57.9%) | 40 (42.1%) |
Female Fertility in Rye
Fertility by Age in Rye
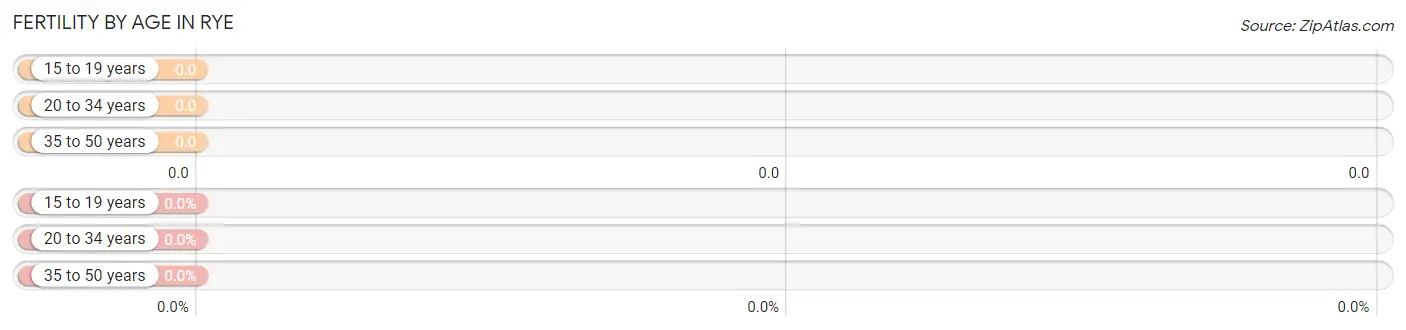
| Age Bracket | Women with Births | Births / 1,000 Women |
| 15 to 19 years | 0 (0.0%) | 0.0 |
| 20 to 34 years | 0 (0.0%) | 0.0 |
| 35 to 50 years | 0 (0.0%) | 0.0 |
| Total | 0 (0.0%) | 0.0 |
Fertility by Age by Marriage Status in Rye
| Age Bracket | Married | Unmarried |
| 15 to 19 years | 0 (0.0%) | 0 (0.0%) |
| 20 to 34 years | 0 (0.0%) | 0 (0.0%) |
| 35 to 50 years | 0 (0.0%) | 0 (0.0%) |
| Total | 0 (0.0%) | 0 (0.0%) |
Fertility by Education in Rye
| Educational Attainment | Women with Births | Births / 1,000 Women |
| Less than High School | 0 (0.0%) | 0.0 |
| High School Diploma | 0 (0.0%) | 0.0 |
| College or Associate's Degree | 0 (0.0%) | 0.0 |
| Bachelor's Degree | 0 (0.0%) | 0.0 |
| Graduate Degree | 0 (0.0%) | 0.0 |
| Total | 0 (0.0%) | 0.0 |
Fertility by Education by Marriage Status in Rye
| Educational Attainment | Married | Unmarried |
| Less than High School | 0 (0.0%) | 0 (0.0%) |
| High School Diploma | 0 (0.0%) | 0 (0.0%) |
| College or Associate's Degree | 0 (0.0%) | 0 (0.0%) |
| Bachelor's Degree | 0 (0.0%) | 0 (0.0%) |
| Graduate Degree | 0 (0.0%) | 0 (0.0%) |
| Total | 0 (0.0%) | 0 (0.0%) |
Employment Characteristics in Rye
Employment by Class of Employer in Rye
Among the 52 employed individuals in Rye, , and private company employees (52 | 100.0%) make up the most common classes of employment.
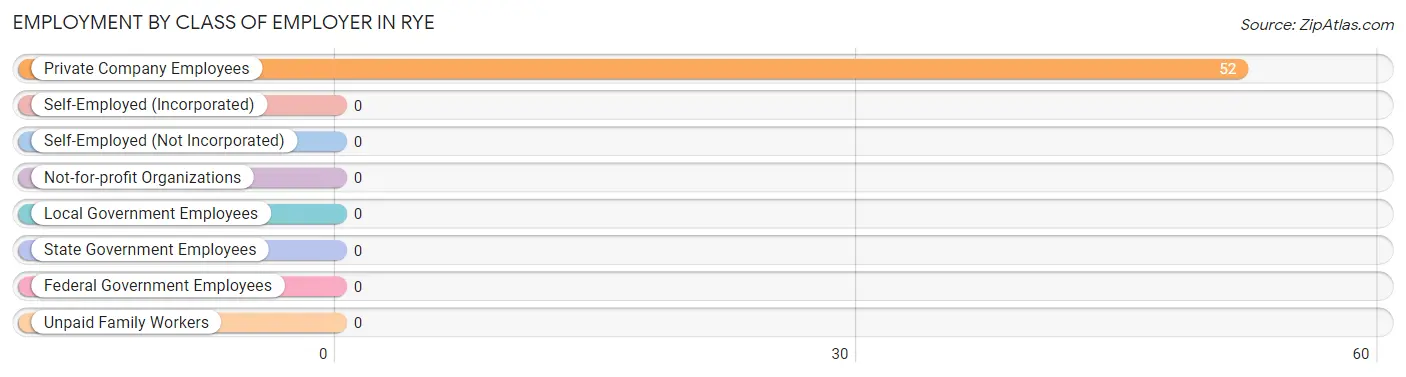
| Employer Class | # Employees | % Employees |
| Private Company Employees | 52 | 100.0% |
| Self-Employed (Incorporated) | 0 | 0.0% |
| Self-Employed (Not Incorporated) | 0 | 0.0% |
| Not-for-profit Organizations | 0 | 0.0% |
| Local Government Employees | 0 | 0.0% |
| State Government Employees | 0 | 0.0% |
| Federal Government Employees | 0 | 0.0% |
| Unpaid Family Workers | 0 | 0.0% |
| Total | 52 | 100.0% |
Employment Status by Age in Rye
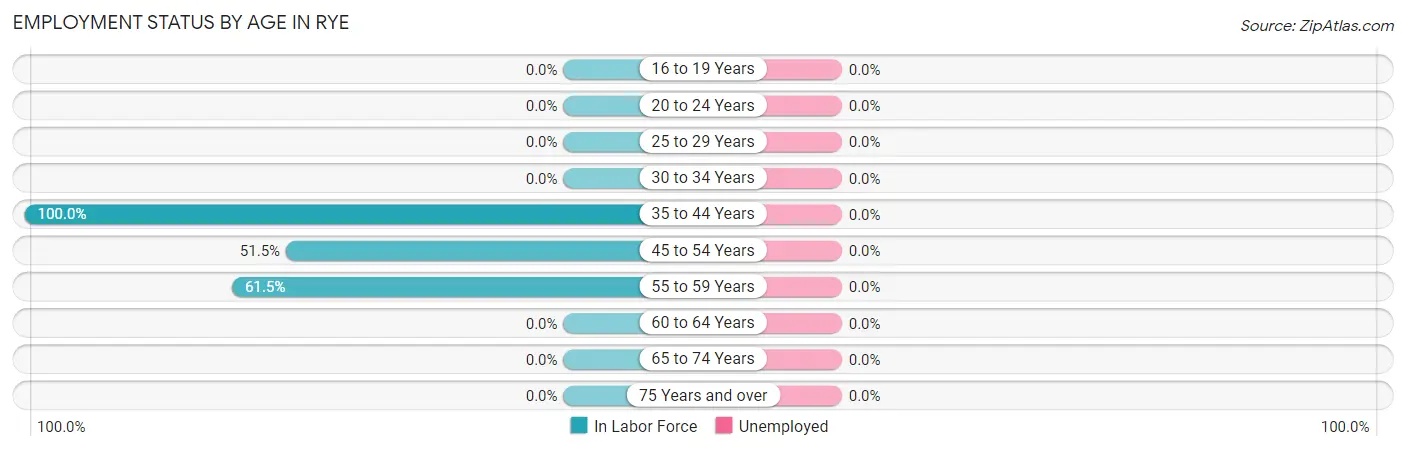
| Age Bracket | In Labor Force | Unemployed |
| 16 to 19 Years | 0 (0.0%) | 0 (0.0%) |
| 20 to 24 Years | 0 (0.0%) | 0 (0.0%) |
| 25 to 29 Years | 0 (0.0%) | 0 (0.0%) |
| 30 to 34 Years | 0 (0.0%) | 0 (0.0%) |
| 35 to 44 Years | 9 (100.0%) | 0 (0.0%) |
| 45 to 54 Years | 35 (51.5%) | 0 (0.0%) |
| 55 to 59 Years | 8 (61.5%) | 0 (0.0%) |
| 60 to 64 Years | 0 (0.0%) | 0 (0.0%) |
| 65 to 74 Years | 0 (0.0%) | 0 (0.0%) |
| 75 Years and over | 0 (0.0%) | 0 (0.0%) |
| Total | 52 (38.8%) | 0 (0.0%) |
Employment Status by Educational Attainment in Rye
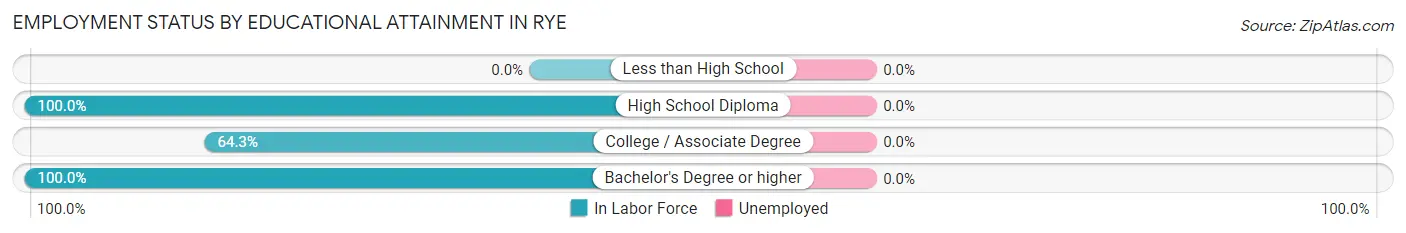
| Educational Attainment | In Labor Force | Unemployed |
| Less than High School | 0 (0.0%) | 0 (0.0%) |
| High School Diploma | 35 (100.0%) | 0 (0.0%) |
| College / Associate Degree | 9 (64.3%) | 0 (0.0%) |
| Bachelor's Degree or higher | 8 (100.0%) | 0 (0.0%) |
| Total | 52 (57.8%) | 0 (0.0%) |
Employment Occupations by Sex in Rye
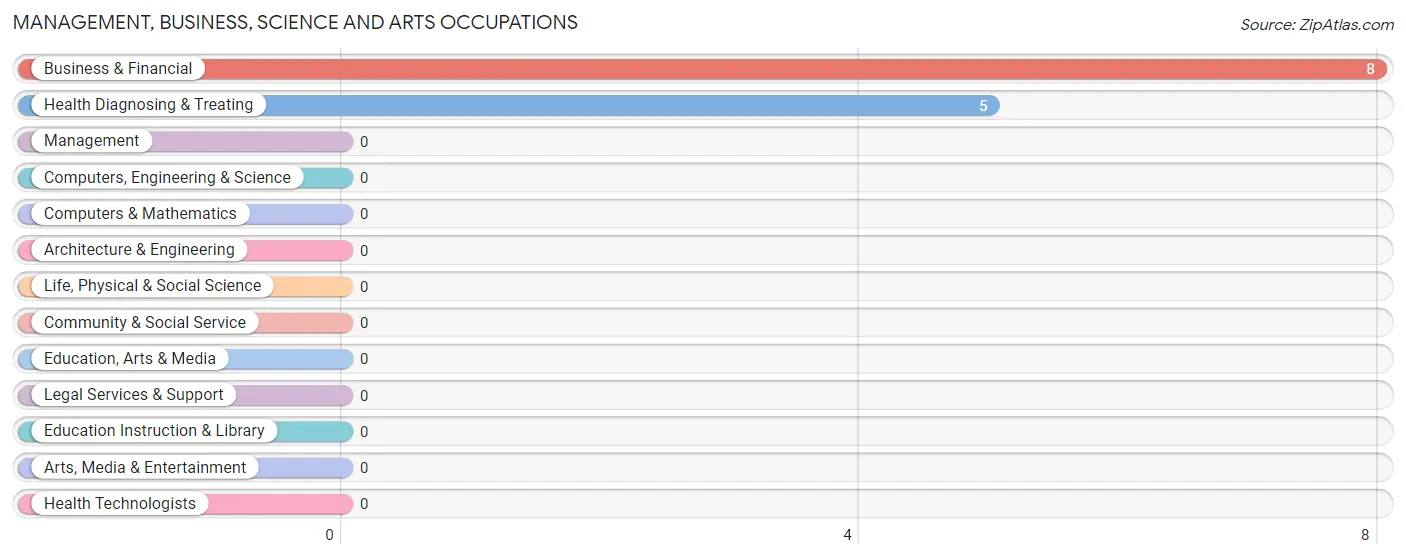
Management, Business, Science and Arts Occupations
The most common Management, Business, Science and Arts occupations in Rye are Business & Financial (8 | 15.4%), and Health Diagnosing & Treating (5 | 9.6%).
Management, Business, Science and Arts Occupations by Sex
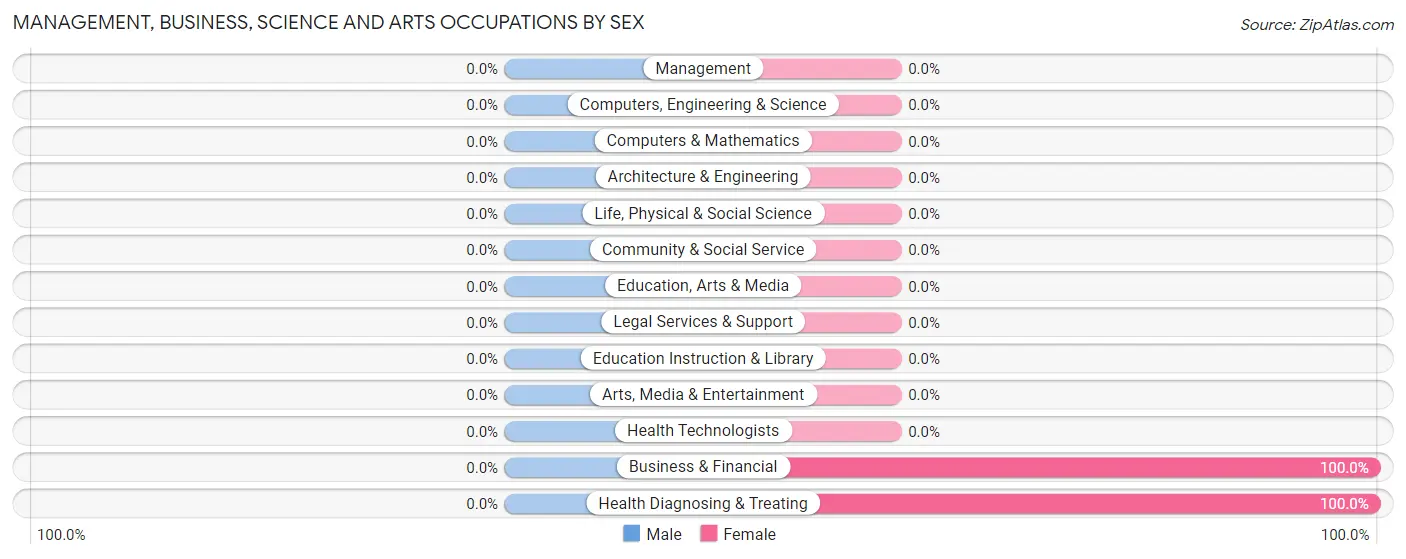
| Occupation | Male | Female |
| Management | 0 (0.0%) | 0 (0.0%) |
| Business & Financial | 0 (0.0%) | 8 (100.0%) |
| Computers, Engineering & Science | 0 (0.0%) | 0 (0.0%) |
| Computers & Mathematics | 0 (0.0%) | 0 (0.0%) |
| Architecture & Engineering | 0 (0.0%) | 0 (0.0%) |
| Life, Physical & Social Science | 0 (0.0%) | 0 (0.0%) |
| Community & Social Service | 0 (0.0%) | 0 (0.0%) |
| Education, Arts & Media | 0 (0.0%) | 0 (0.0%) |
| Legal Services & Support | 0 (0.0%) | 0 (0.0%) |
| Education Instruction & Library | 0 (0.0%) | 0 (0.0%) |
| Arts, Media & Entertainment | 0 (0.0%) | 0 (0.0%) |
| Health Diagnosing & Treating | 0 (0.0%) | 5 (100.0%) |
| Health Technologists | 0 (0.0%) | 0 (0.0%) |
| Total (Category) | 0 (0.0%) | 13 (100.0%) |
| Total (Overall) | 39 (75.0%) | 13 (25.0%) |
Services Occupations
The most common Services occupations in Rye are , and Cleaning & Maintenance (19 | 36.5%).
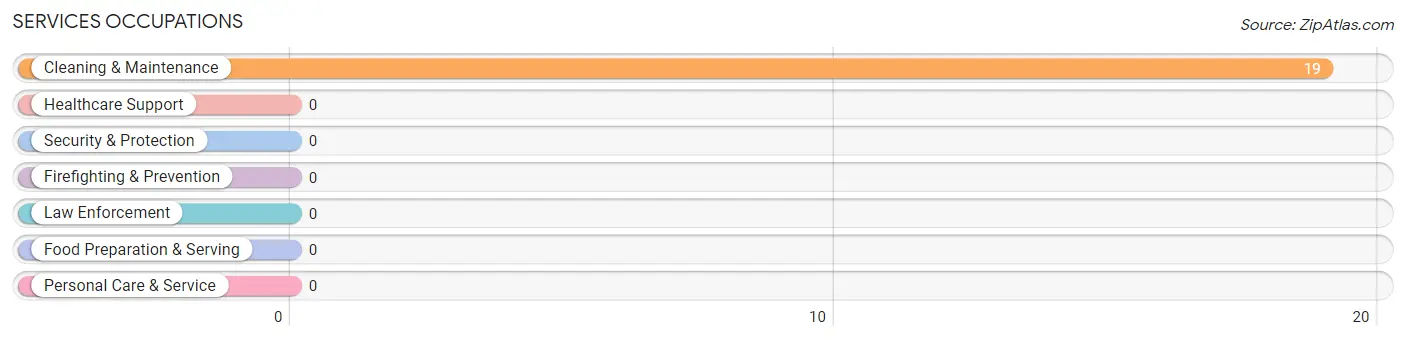
Services Occupations by Sex
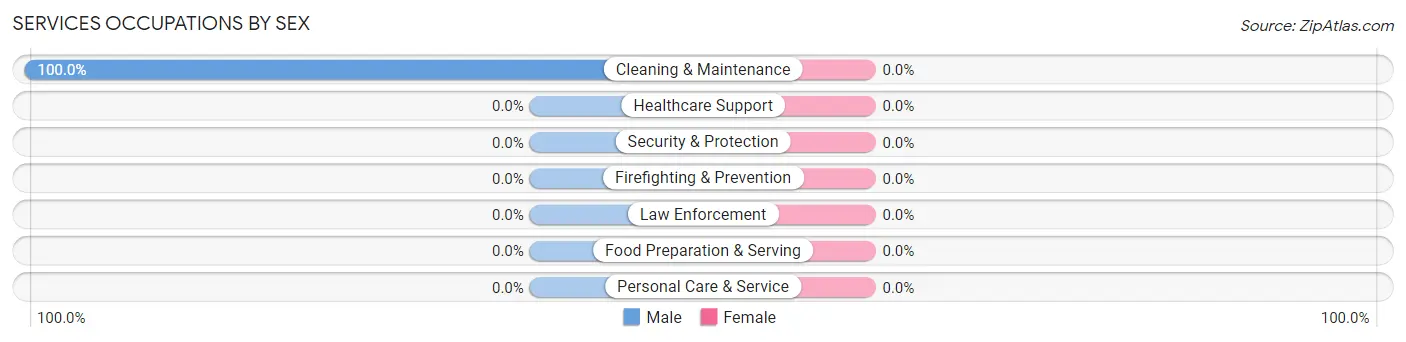
| Occupation | Male | Female |
| Healthcare Support | 0 (0.0%) | 0 (0.0%) |
| Security & Protection | 0 (0.0%) | 0 (0.0%) |
| Firefighting & Prevention | 0 (0.0%) | 0 (0.0%) |
| Law Enforcement | 0 (0.0%) | 0 (0.0%) |
| Food Preparation & Serving | 0 (0.0%) | 0 (0.0%) |
| Cleaning & Maintenance | 19 (100.0%) | 0 (0.0%) |
| Personal Care & Service | 0 (0.0%) | 0 (0.0%) |
| Total (Category) | 19 (100.0%) | 0 (0.0%) |
| Total (Overall) | 39 (75.0%) | 13 (25.0%) |
Sales and Office Occupations
The most common Sales and Office occupations in Rye are , and Office & Administration (4 | 7.7%).
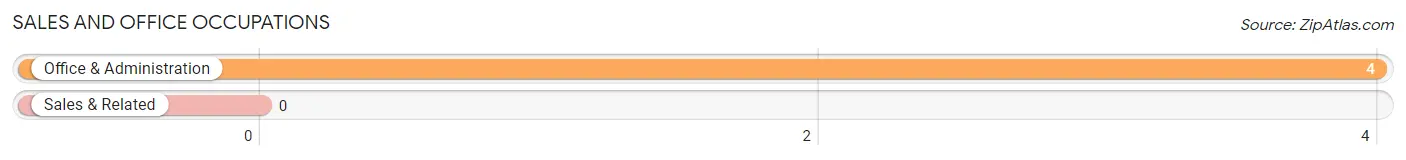
Sales and Office Occupations by Sex
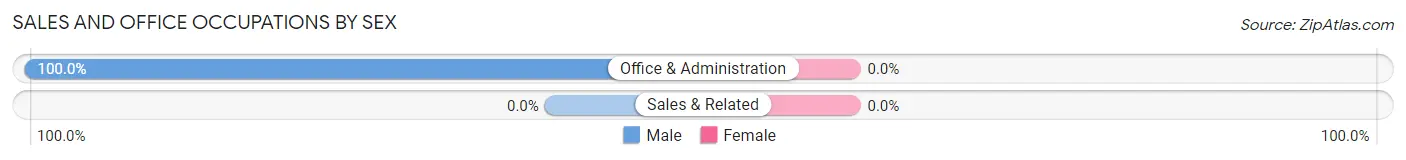
| Occupation | Male | Female |
| Sales & Related | 0 (0.0%) | 0 (0.0%) |
| Office & Administration | 4 (100.0%) | 0 (0.0%) |
| Total (Category) | 4 (100.0%) | 0 (0.0%) |
| Total (Overall) | 39 (75.0%) | 13 (25.0%) |
Natural Resources, Construction and Maintenance Occupations
The most common Natural Resources, Construction and Maintenance occupations in Rye are , and Construction & Extraction (16 | 30.8%).
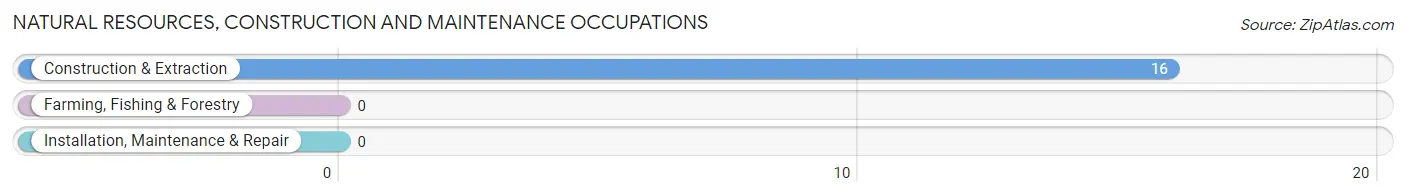
Natural Resources, Construction and Maintenance Occupations by Sex
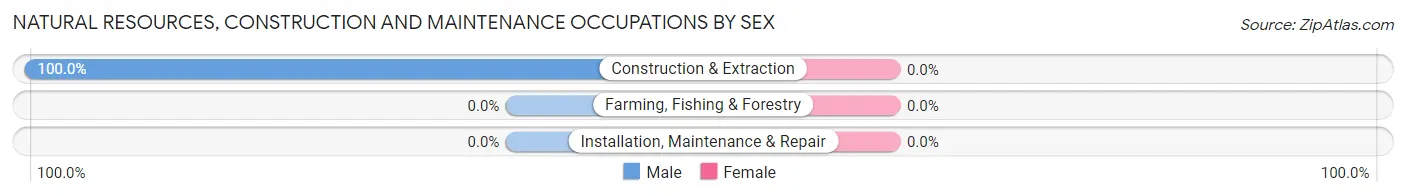
| Occupation | Male | Female |
| Farming, Fishing & Forestry | 0 (0.0%) | 0 (0.0%) |
| Construction & Extraction | 16 (100.0%) | 0 (0.0%) |
| Installation, Maintenance & Repair | 0 (0.0%) | 0 (0.0%) |
| Total (Category) | 16 (100.0%) | 0 (0.0%) |
| Total (Overall) | 39 (75.0%) | 13 (25.0%) |
Production, Transportation and Moving Occupations
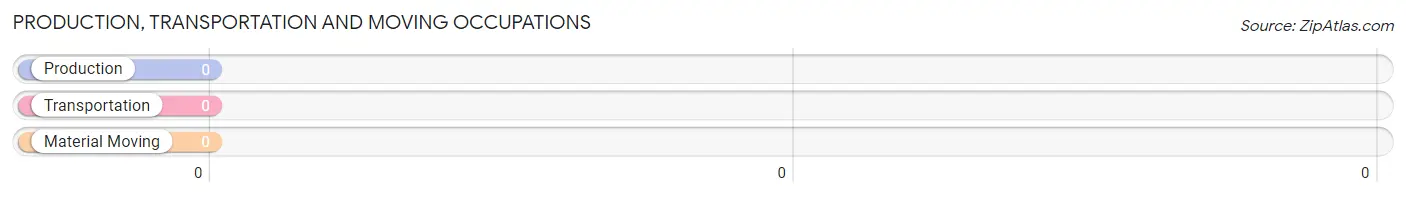
Production, Transportation and Moving Occupations by Sex
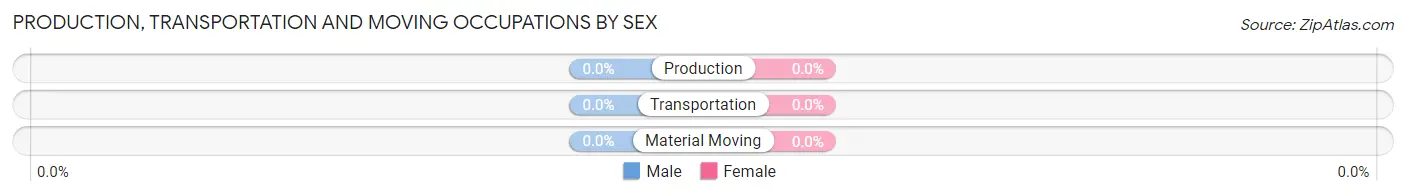
| Occupation | Male | Female |
| Production | 0 (0.0%) | 0 (0.0%) |
| Transportation | 0 (0.0%) | 0 (0.0%) |
| Material Moving | 0 (0.0%) | 0 (0.0%) |
| Total (Category) | 0 (0.0%) | 0 (0.0%) |
| Total (Overall) | 39 (75.0%) | 13 (25.0%) |
Employment Industries by Sex in Rye
Employment Industries in Rye
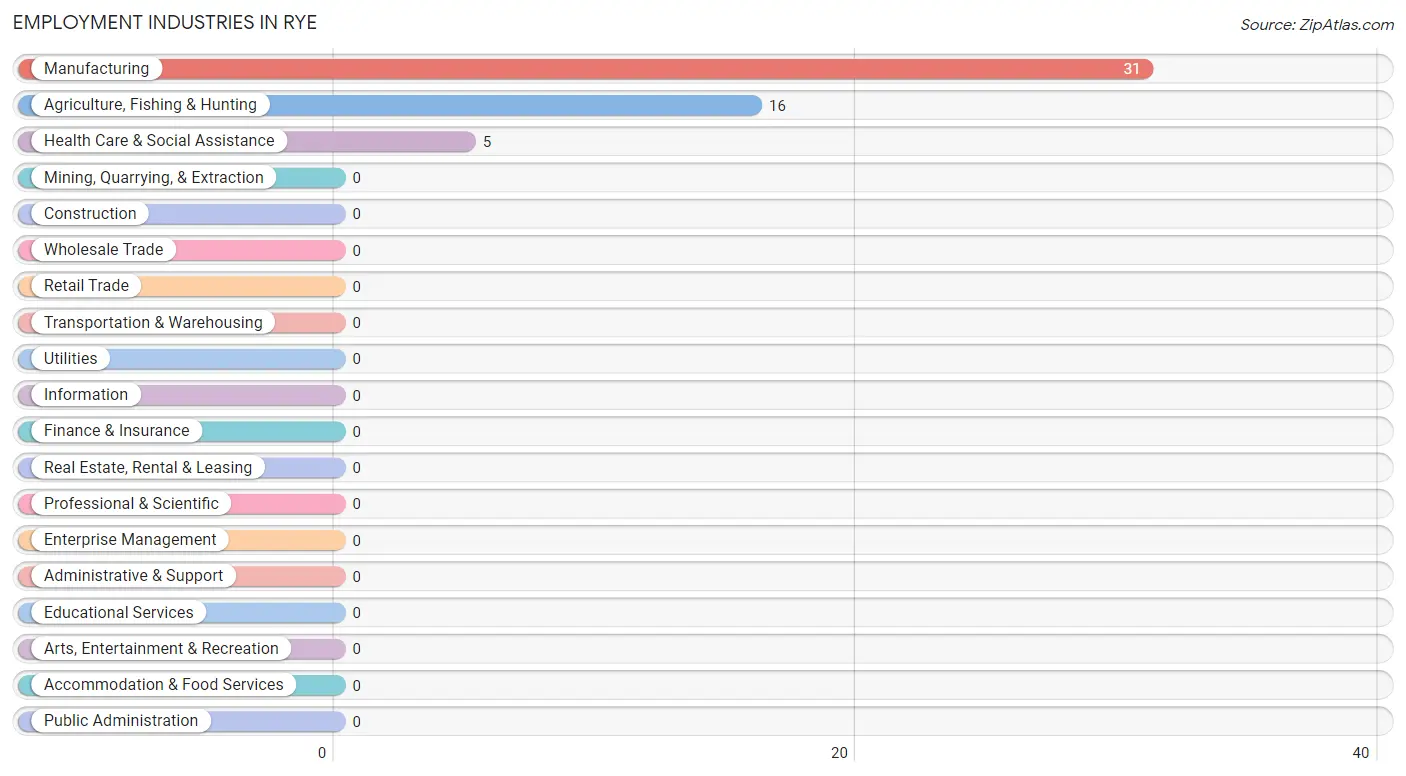
The major employment industries in Rye include Manufacturing (31 | 59.6%), Agriculture, Fishing & Hunting (16 | 30.8%), and Health Care & Social Assistance (5 | 9.6%).
Employment Industries by Sex in Rye
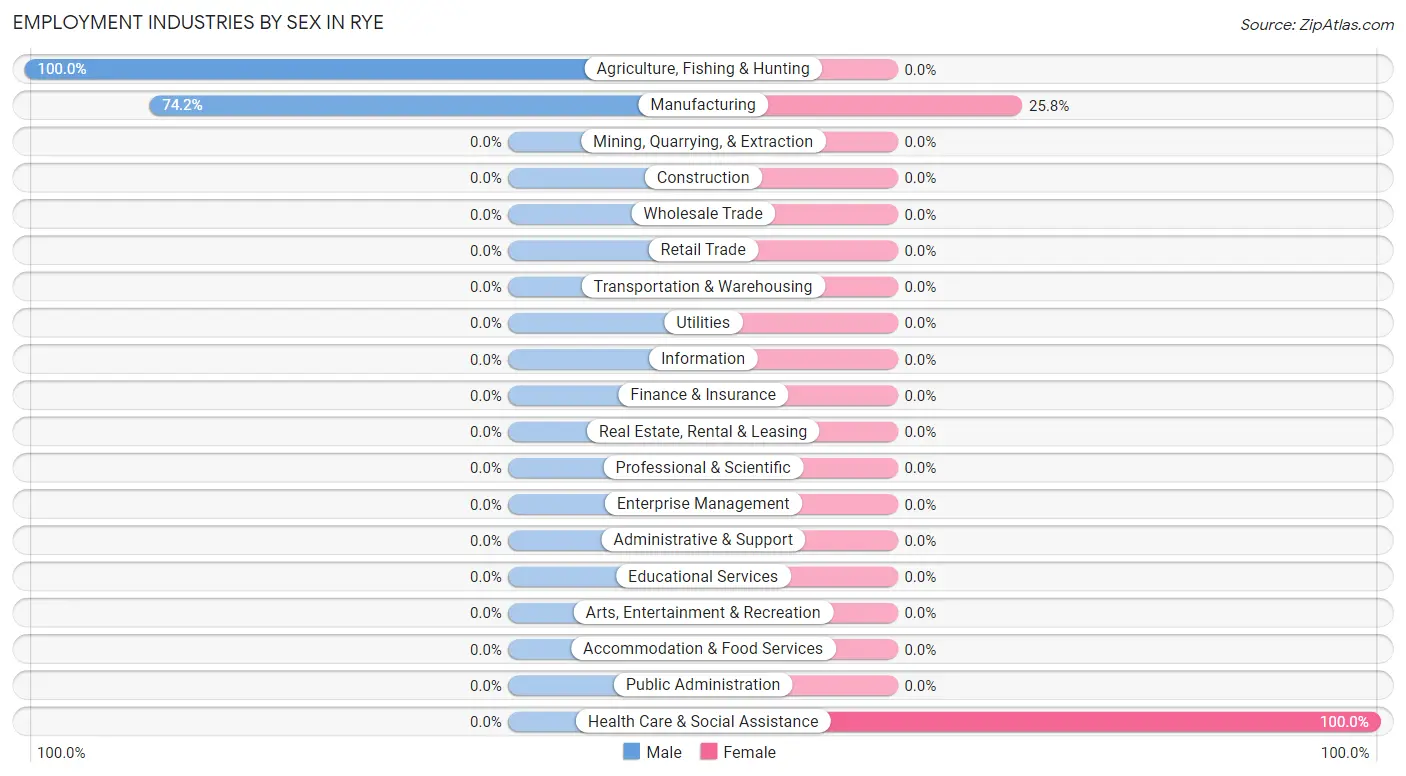
The Rye industries that see more men than women are Agriculture, Fishing & Hunting (100.0%), and Manufacturing (74.2%), whereas the industries that tend to have a higher number of women are Health Care & Social Assistance (100.0%), and Manufacturing (25.8%).
| Industry | Male | Female |
| Agriculture, Fishing & Hunting | 16 (100.0%) | 0 (0.0%) |
| Mining, Quarrying, & Extraction | 0 (0.0%) | 0 (0.0%) |
| Construction | 0 (0.0%) | 0 (0.0%) |
| Manufacturing | 23 (74.2%) | 8 (25.8%) |
| Wholesale Trade | 0 (0.0%) | 0 (0.0%) |
| Retail Trade | 0 (0.0%) | 0 (0.0%) |
| Transportation & Warehousing | 0 (0.0%) | 0 (0.0%) |
| Utilities | 0 (0.0%) | 0 (0.0%) |
| Information | 0 (0.0%) | 0 (0.0%) |
| Finance & Insurance | 0 (0.0%) | 0 (0.0%) |
| Real Estate, Rental & Leasing | 0 (0.0%) | 0 (0.0%) |
| Professional & Scientific | 0 (0.0%) | 0 (0.0%) |
| Enterprise Management | 0 (0.0%) | 0 (0.0%) |
| Administrative & Support | 0 (0.0%) | 0 (0.0%) |
| Educational Services | 0 (0.0%) | 0 (0.0%) |
| Health Care & Social Assistance | 0 (0.0%) | 5 (100.0%) |
| Arts, Entertainment & Recreation | 0 (0.0%) | 0 (0.0%) |
| Accommodation & Food Services | 0 (0.0%) | 0 (0.0%) |
| Public Administration | 0 (0.0%) | 0 (0.0%) |
| Total | 39 (75.0%) | 13 (25.0%) |
Education in Rye
School Enrollment in Rye
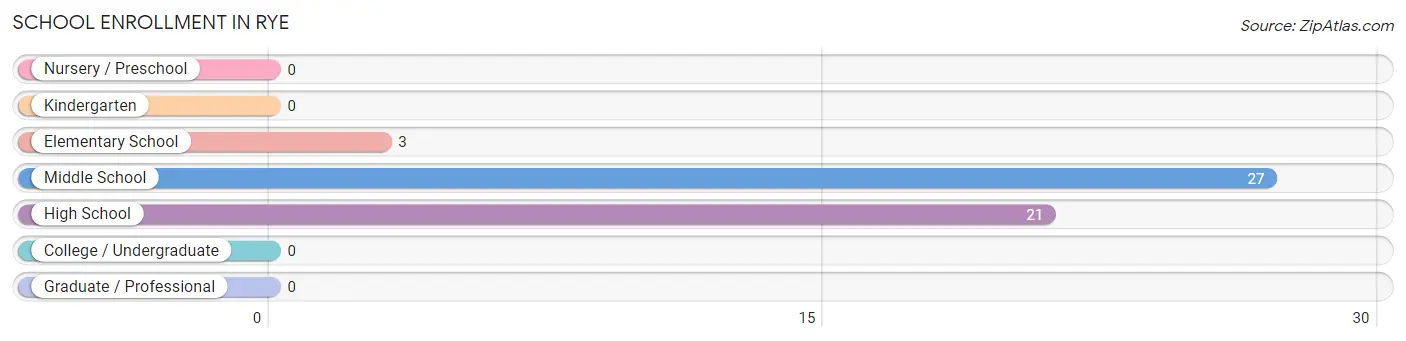
The most common levels of schooling among the 51 students in Rye are middle school (27 | 52.9%), high school (21 | 41.2%), and elementary school (3 | 5.9%).
| School Level | # Students | % Students |
| Nursery / Preschool | 0 | 0.0% |
| Kindergarten | 0 | 0.0% |
| Elementary School | 3 | 5.9% |
| Middle School | 27 | 52.9% |
| High School | 21 | 41.2% |
| College / Undergraduate | 0 | 0.0% |
| Graduate / Professional | 0 | 0.0% |
| Total | 51 | 100.0% |
School Enrollment by Age by Funding Source in Rye
| Age Bracket | Public School | Private School |
| 3 to 4 Year Olds | 0 (0.0%) | 0 (0.0%) |
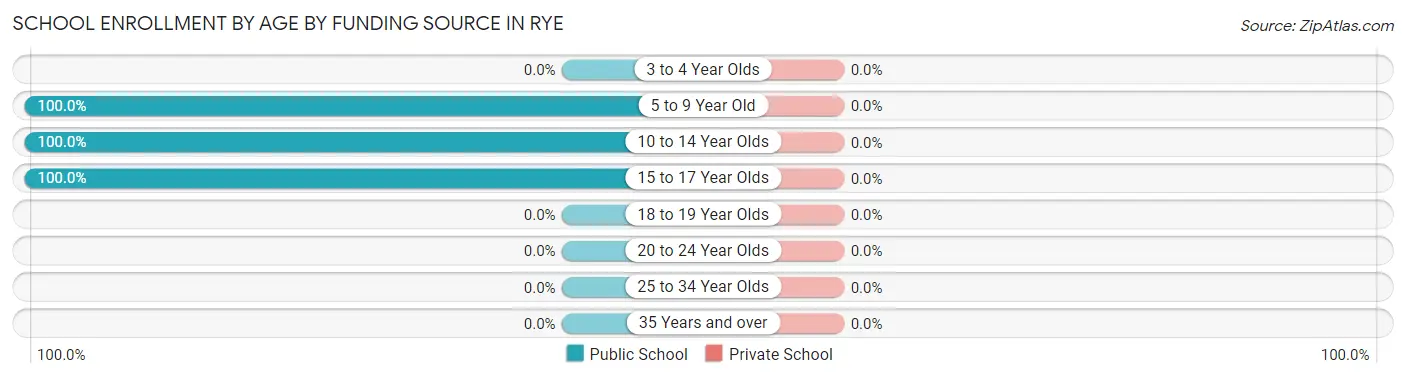
| 5 to 9 Year Old | 3 (100.0%) | 0 (0.0%) |
| 10 to 14 Year Olds | 27 (100.0%) | 0 (0.0%) |
| 15 to 17 Year Olds | 21 (100.0%) | 0 (0.0%) |
| 18 to 19 Year Olds | 0 (0.0%) | 0 (0.0%) |
| 20 to 24 Year Olds | 0 (0.0%) | 0 (0.0%) |
| 25 to 34 Year Olds | 0 (0.0%) | 0 (0.0%) |
| 35 Years and over | 0 (0.0%) | 0 (0.0%) |
| Total | 51 (100.0%) | 0 (0.0%) |
Educational Attainment by Field of Study in Rye
Education (16 | 66.7%), and business (8 | 33.3%) are the most common fields of study among 24 individuals in Rye who have obtained a bachelor's degree or higher.
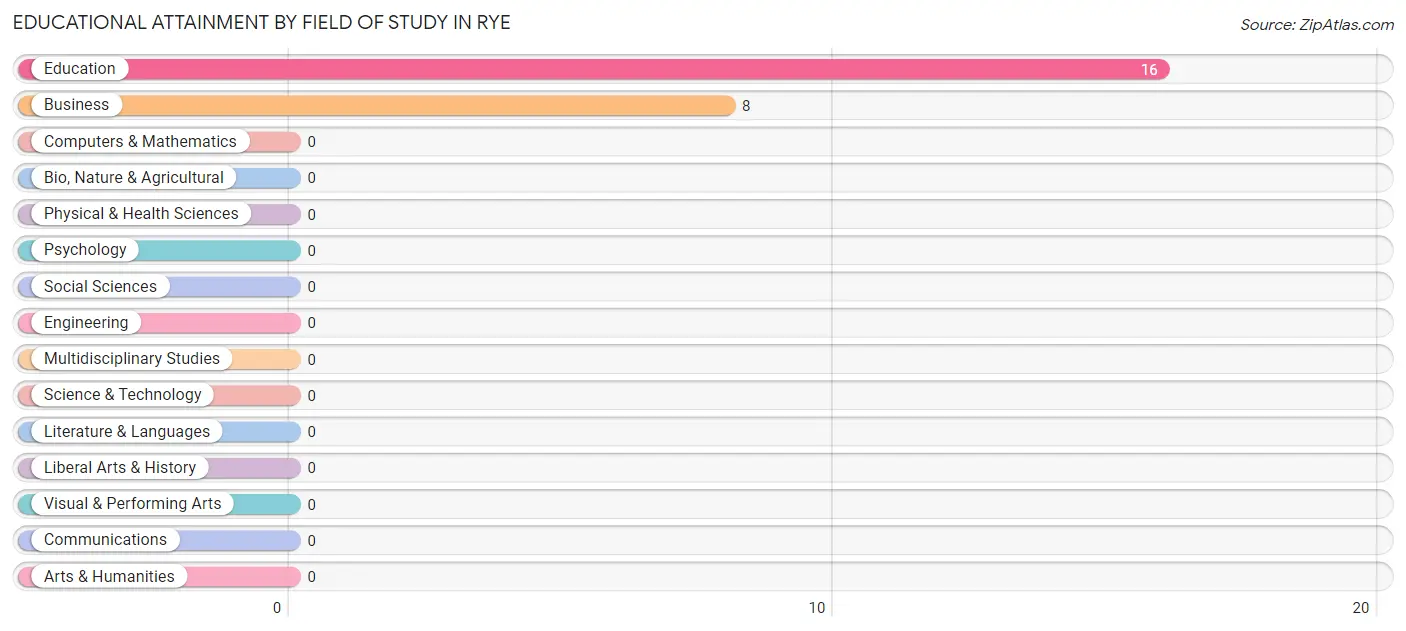
| Field of Study | # Graduates | % Graduates |
| Computers & Mathematics | 0 | 0.0% |
| Bio, Nature & Agricultural | 0 | 0.0% |
| Physical & Health Sciences | 0 | 0.0% |
| Psychology | 0 | 0.0% |
| Social Sciences | 0 | 0.0% |
| Engineering | 0 | 0.0% |
| Multidisciplinary Studies | 0 | 0.0% |
| Science & Technology | 0 | 0.0% |
| Business | 8 | 33.3% |
| Education | 16 | 66.7% |
| Literature & Languages | 0 | 0.0% |
| Liberal Arts & History | 0 | 0.0% |
| Visual & Performing Arts | 0 | 0.0% |
| Communications | 0 | 0.0% |
| Arts & Humanities | 0 | 0.0% |
| Total | 24 | 100.0% |
Transportation & Commute in Rye
Vehicle Availability by Sex in Rye
The most prevalent vehicle ownership categories in Rye are males with 2 vehicles (35, accounting for 89.7%) and females with 2 vehicles (0, making up 269.2%).
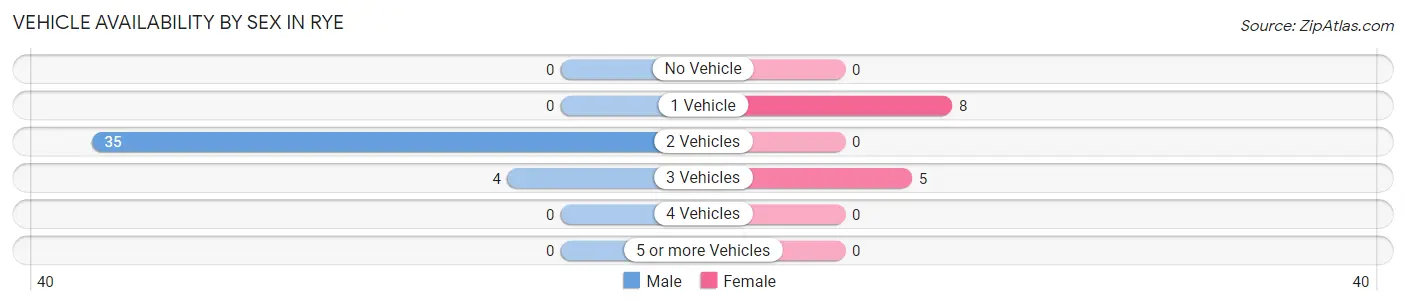
| Vehicles Available | Male | Female |
| No Vehicle | 0 (0.0%) | 0 (0.0%) |
| 1 Vehicle | 0 (0.0%) | 8 (61.5%) |
| 2 Vehicles | 35 (89.7%) | 0 (0.0%) |
| 3 Vehicles | 4 (10.3%) | 5 (38.5%) |
| 4 Vehicles | 0 (0.0%) | 0 (0.0%) |
| 5 or more Vehicles | 0 (0.0%) | 0 (0.0%) |
| Total | 39 (100.0%) | 13 (100.0%) |
Commute Time in Rye
The most frequently occuring commute durations in Rye are 15 to 19 minutes (19 commuters, 52.8%), 10 to 14 minutes (9 commuters, 25.0%), and 25 to 29 minutes (8 commuters, 22.2%).
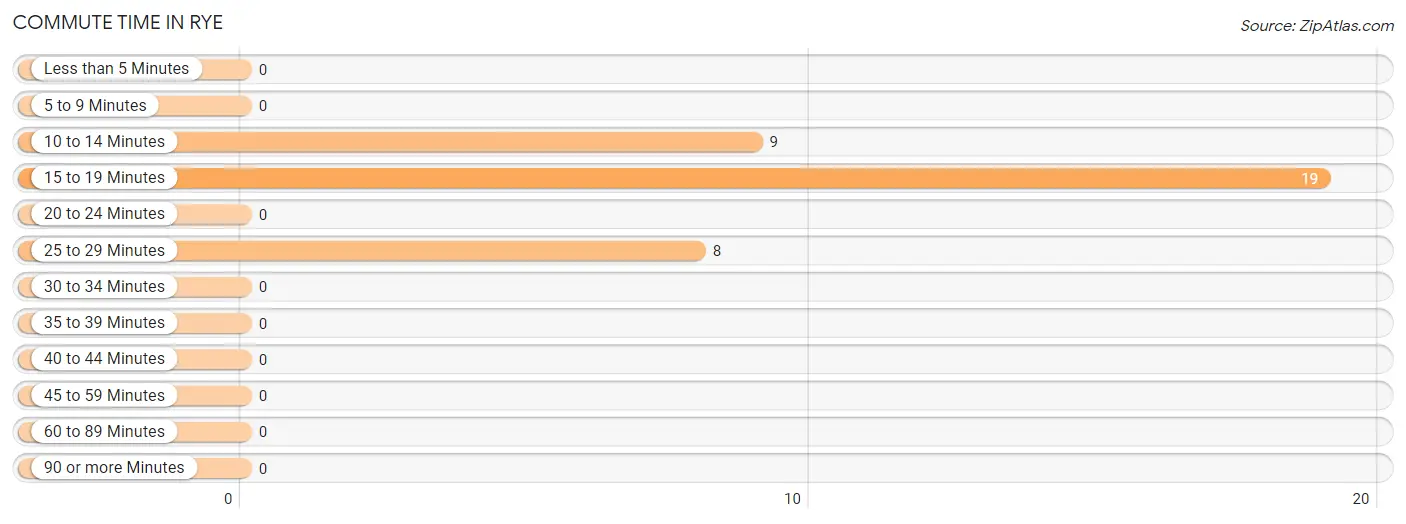
| Commute Time | # Commuters | % Commuters |
| Less than 5 Minutes | 0 | 0.0% |
| 5 to 9 Minutes | 0 | 0.0% |
| 10 to 14 Minutes | 9 | 25.0% |
| 15 to 19 Minutes | 19 | 52.8% |
| 20 to 24 Minutes | 0 | 0.0% |
| 25 to 29 Minutes | 8 | 22.2% |
| 30 to 34 Minutes | 0 | 0.0% |
| 35 to 39 Minutes | 0 | 0.0% |
| 40 to 44 Minutes | 0 | 0.0% |
| 45 to 59 Minutes | 0 | 0.0% |
| 60 to 89 Minutes | 0 | 0.0% |
| 90 or more Minutes | 0 | 0.0% |
Commute Time by Sex in Rye
The most common commute times in Rye are 15 to 19 minutes (19 commuters, 82.6%) for males and 25 to 29 minutes (8 commuters, 61.5%) for females.
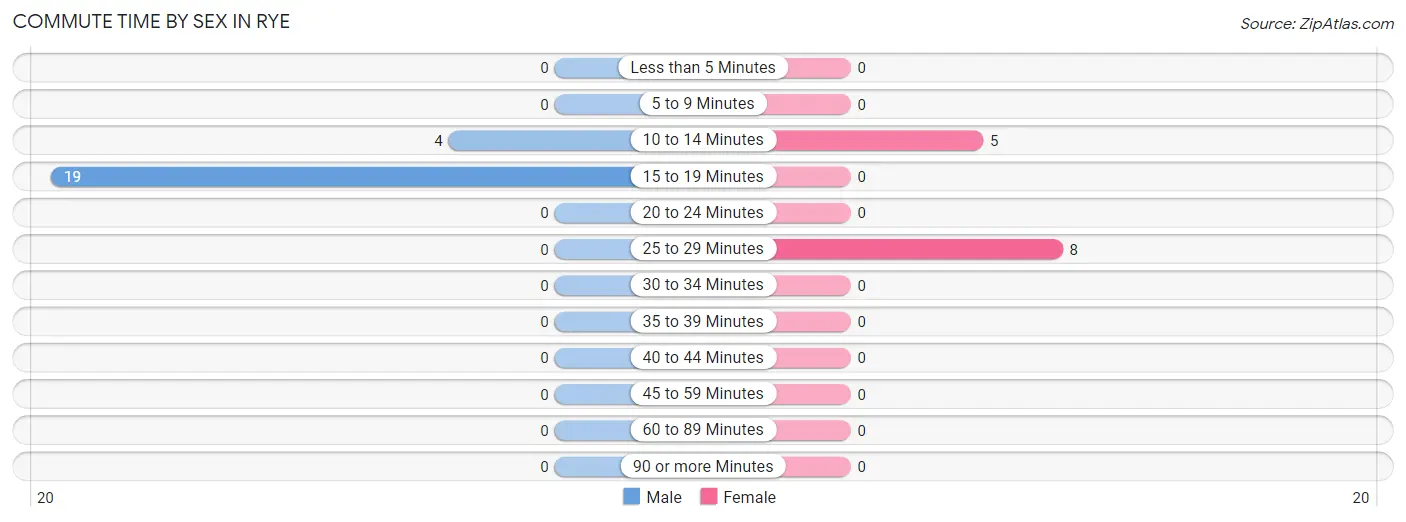
| Commute Time | Male | Female |
| Less than 5 Minutes | 0 (0.0%) | 0 (0.0%) |
| 5 to 9 Minutes | 0 (0.0%) | 0 (0.0%) |
| 10 to 14 Minutes | 4 (17.4%) | 5 (38.5%) |
| 15 to 19 Minutes | 19 (82.6%) | 0 (0.0%) |
| 20 to 24 Minutes | 0 (0.0%) | 0 (0.0%) |
| 25 to 29 Minutes | 0 (0.0%) | 8 (61.5%) |
| 30 to 34 Minutes | 0 (0.0%) | 0 (0.0%) |
| 35 to 39 Minutes | 0 (0.0%) | 0 (0.0%) |
| 40 to 44 Minutes | 0 (0.0%) | 0 (0.0%) |
| 45 to 59 Minutes | 0 (0.0%) | 0 (0.0%) |
| 60 to 89 Minutes | 0 (0.0%) | 0 (0.0%) |
| 90 or more Minutes | 0 (0.0%) | 0 (0.0%) |
Time of Departure to Work by Sex in Rye
The most frequent times of departure to work in Rye are 5:00 AM to 5:29 AM (19, 82.6%) for males and 7:30 AM to 7:59 AM (8, 61.5%) for females.
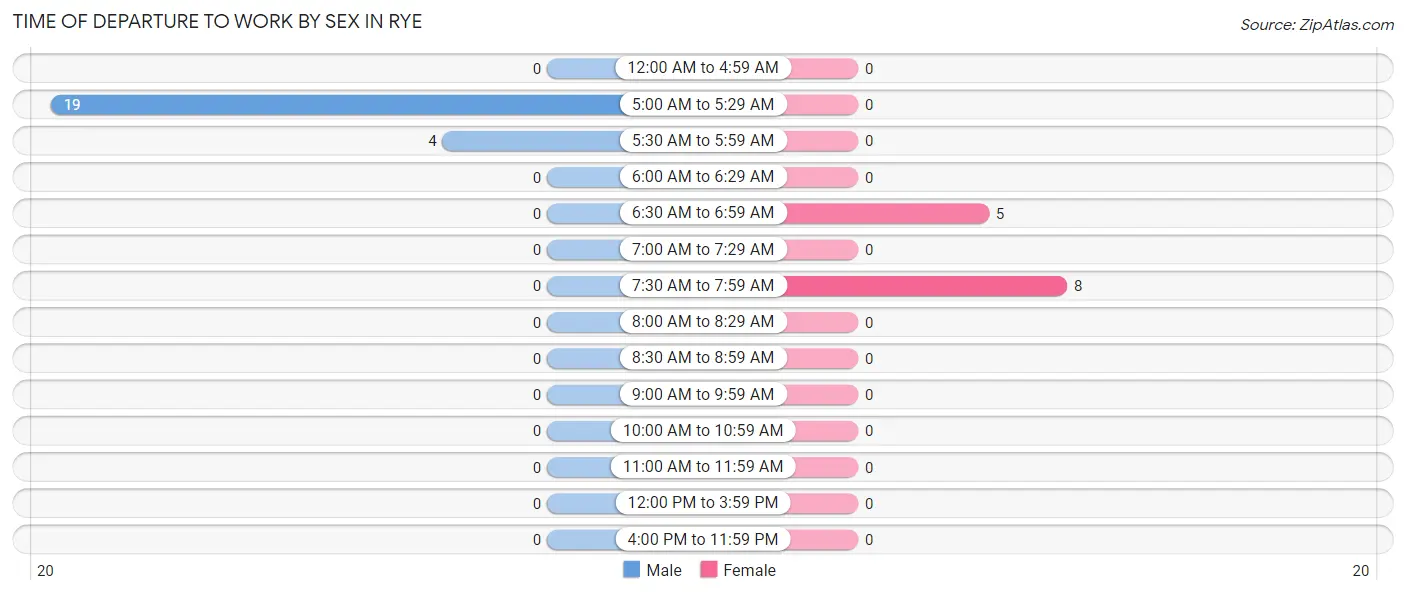
| Time of Departure | Male | Female |
| 12:00 AM to 4:59 AM | 0 (0.0%) | 0 (0.0%) |
| 5:00 AM to 5:29 AM | 19 (82.6%) | 0 (0.0%) |
| 5:30 AM to 5:59 AM | 4 (17.4%) | 0 (0.0%) |
| 6:00 AM to 6:29 AM | 0 (0.0%) | 0 (0.0%) |
| 6:30 AM to 6:59 AM | 0 (0.0%) | 5 (38.5%) |
| 7:00 AM to 7:29 AM | 0 (0.0%) | 0 (0.0%) |
| 7:30 AM to 7:59 AM | 0 (0.0%) | 8 (61.5%) |
| 8:00 AM to 8:29 AM | 0 (0.0%) | 0 (0.0%) |
| 8:30 AM to 8:59 AM | 0 (0.0%) | 0 (0.0%) |
| 9:00 AM to 9:59 AM | 0 (0.0%) | 0 (0.0%) |
| 10:00 AM to 10:59 AM | 0 (0.0%) | 0 (0.0%) |
| 11:00 AM to 11:59 AM | 0 (0.0%) | 0 (0.0%) |
| 12:00 PM to 3:59 PM | 0 (0.0%) | 0 (0.0%) |
| 4:00 PM to 11:59 PM | 0 (0.0%) | 0 (0.0%) |
| Total | 23 (100.0%) | 13 (100.0%) |
Housing Occupancy in Rye
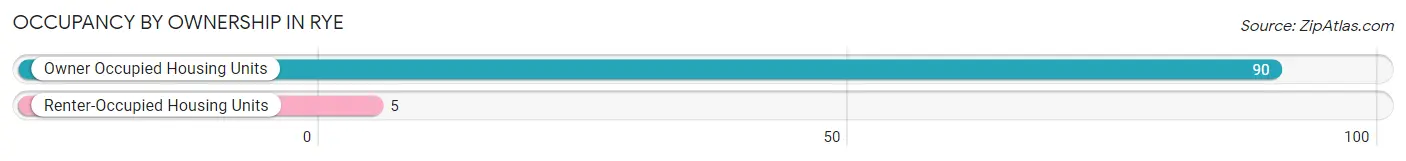
Occupancy by Ownership in Rye
Of the total 95 dwellings in Rye, owner-occupied units account for 90 (94.7%), while renter-occupied units make up 5 (5.3%).
| Occupancy | # Housing Units | % Housing Units |
| Owner Occupied Housing Units | 90 | 94.7% |
| Renter-Occupied Housing Units | 5 | 5.3% |
| Total Occupied Housing Units | 95 | 100.0% |
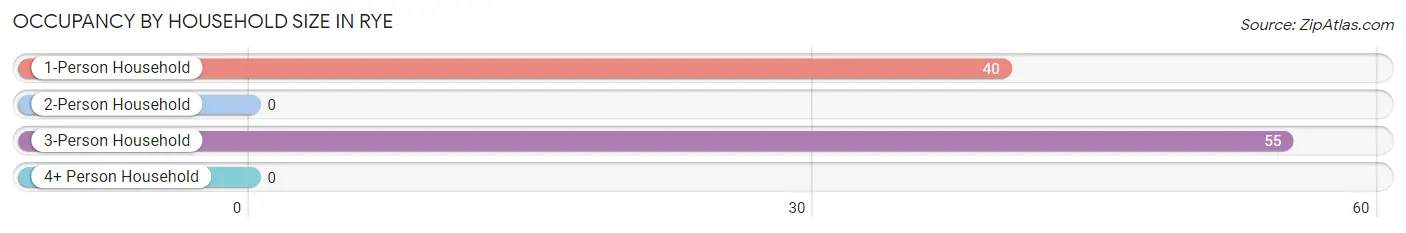
Occupancy by Household Size in Rye
| Household Size | # Housing Units | % Housing Units |
| 1-Person Household | 40 | 42.1% |
| 2-Person Household | 0 | 0.0% |
| 3-Person Household | 55 | 57.9% |
| 4+ Person Household | 0 | 0.0% |
| Total Housing Units | 95 | 100.0% |
Occupancy by Ownership by Household Size in Rye
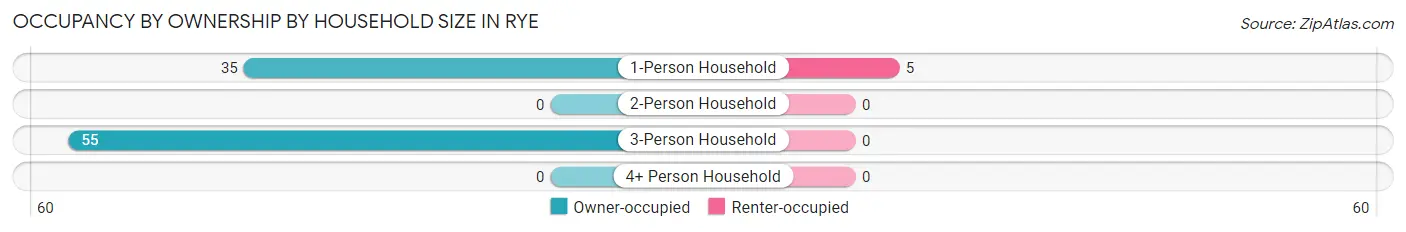
| Household Size | Owner-occupied | Renter-occupied |
| 1-Person Household | 35 (87.5%) | 5 (12.5%) |
| 2-Person Household | 0 (0.0%) | 0 (0.0%) |
| 3-Person Household | 55 (100.0%) | 0 (0.0%) |
| 4+ Person Household | 0 (0.0%) | 0 (0.0%) |
| Total Housing Units | 90 (94.7%) | 5 (5.3%) |
Occupancy by Educational Attainment in Rye
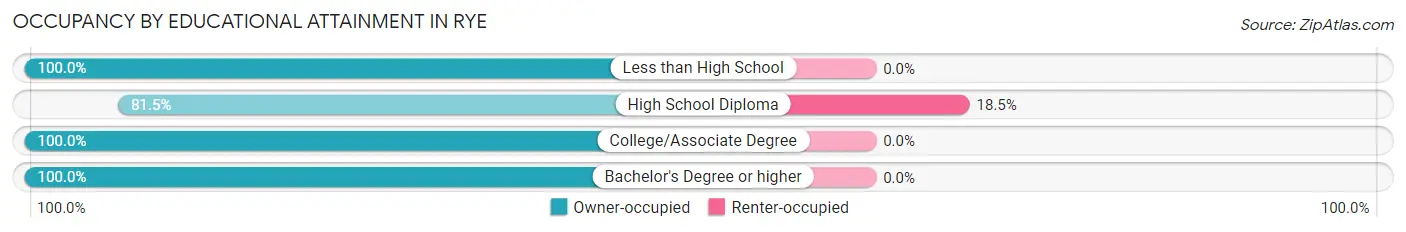
| Household Size | Owner-occupied | Renter-occupied |
| Less than High School | 33 (100.0%) | 0 (0.0%) |
| High School Diploma | 22 (81.5%) | 5 (18.5%) |
| College/Associate Degree | 27 (100.0%) | 0 (0.0%) |
| Bachelor's Degree or higher | 8 (100.0%) | 0 (0.0%) |
Occupancy by Age of Householder in Rye
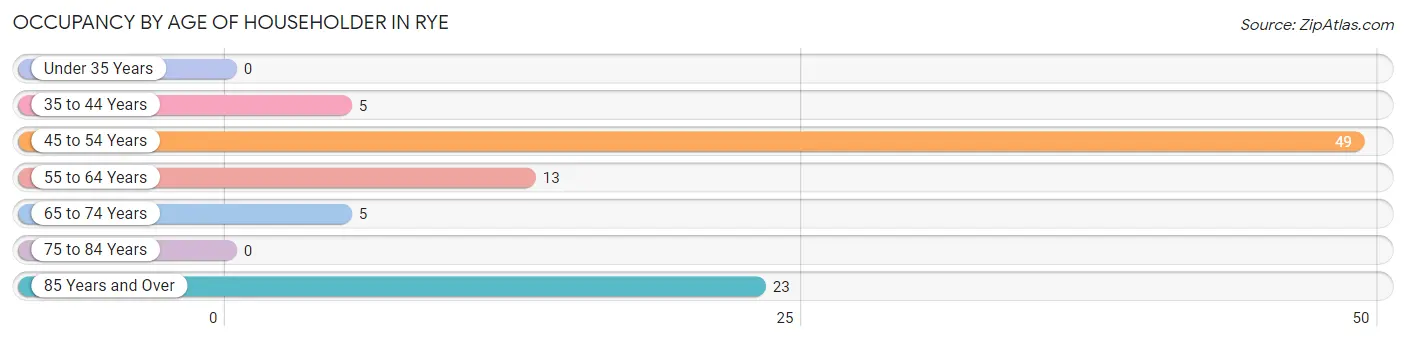
| Age Bracket | # Households | % Households |
| Under 35 Years | 0 | 0.0% |
| 35 to 44 Years | 5 | 5.3% |
| 45 to 54 Years | 49 | 51.6% |
| 55 to 64 Years | 13 | 13.7% |
| 65 to 74 Years | 5 | 5.3% |
| 75 to 84 Years | 0 | 0.0% |
| 85 Years and Over | 23 | 24.2% |
| Total | 95 | 100.0% |
Housing Finances in Rye
Median Income by Occupancy in Rye
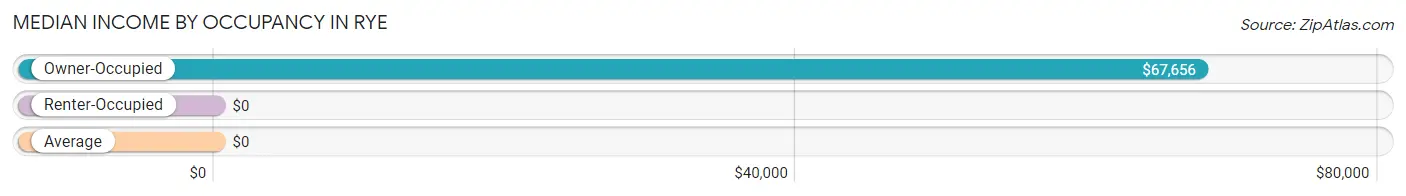
| Occupancy Type | # Households | Median Income |
| Owner-Occupied | 90 (94.7%) | $67,656 |
| Renter-Occupied | 5 (5.3%) | $0 |
| Average | 95 (100.0%) | $0 |
Occupancy by Householder Income Bracket in Rye
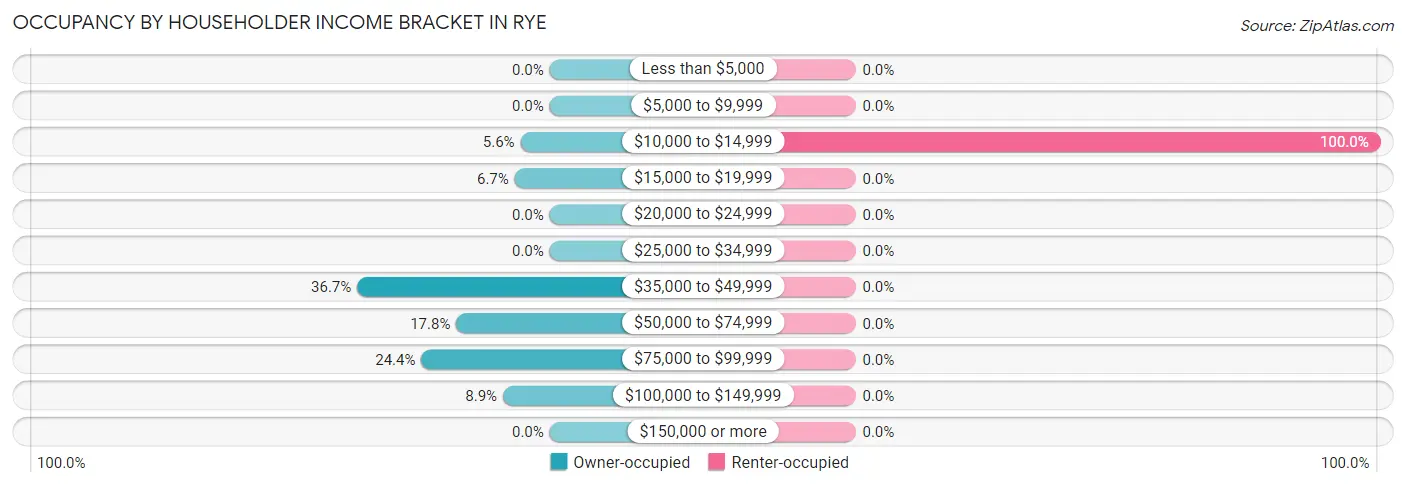
| Income Bracket | Owner-occupied | Renter-occupied |
| Less than $5,000 | 0 (0.0%) | 0 (0.0%) |
| $5,000 to $9,999 | 0 (0.0%) | 0 (0.0%) |
| $10,000 to $14,999 | 5 (5.6%) | 5 (100.0%) |
| $15,000 to $19,999 | 6 (6.7%) | 0 (0.0%) |
| $20,000 to $24,999 | 0 (0.0%) | 0 (0.0%) |
| $25,000 to $34,999 | 0 (0.0%) | 0 (0.0%) |
| $35,000 to $49,999 | 33 (36.7%) | 0 (0.0%) |
| $50,000 to $74,999 | 16 (17.8%) | 0 (0.0%) |
| $75,000 to $99,999 | 22 (24.4%) | 0 (0.0%) |
| $100,000 to $149,999 | 8 (8.9%) | 0 (0.0%) |
| $150,000 or more | 0 (0.0%) | 0 (0.0%) |
| Total | 90 (100.0%) | 5 (100.0%) |
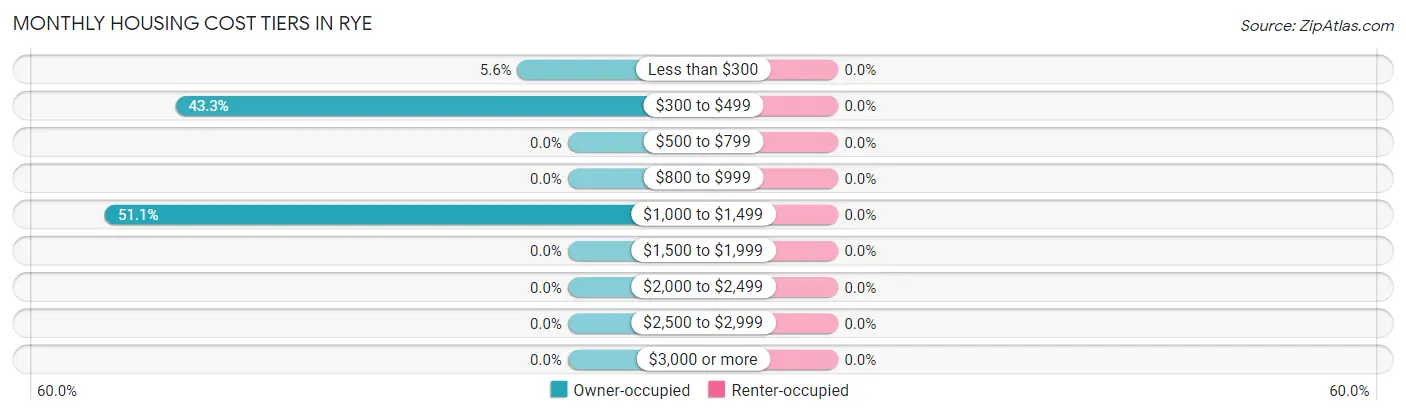
Monthly Housing Cost Tiers in Rye
| Monthly Cost | Owner-occupied | Renter-occupied |
| Less than $300 | 5 (5.6%) | 0 (0.0%) |
| $300 to $499 | 39 (43.3%) | 0 (0.0%) |
| $500 to $799 | 0 (0.0%) | 0 (0.0%) |
| $800 to $999 | 0 (0.0%) | 0 (0.0%) |
| $1,000 to $1,499 | 46 (51.1%) | 0 (0.0%) |
| $1,500 to $1,999 | 0 (0.0%) | 0 (0.0%) |
| $2,000 to $2,499 | 0 (0.0%) | 0 (0.0%) |
| $2,500 to $2,999 | 0 (0.0%) | 0 (0.0%) |
| $3,000 or more | 0 (0.0%) | 0 (0.0%) |
| Total | 90 (100.0%) | 5 (100.0%) |
Physical Housing Characteristics in Rye
Housing Structures in Rye
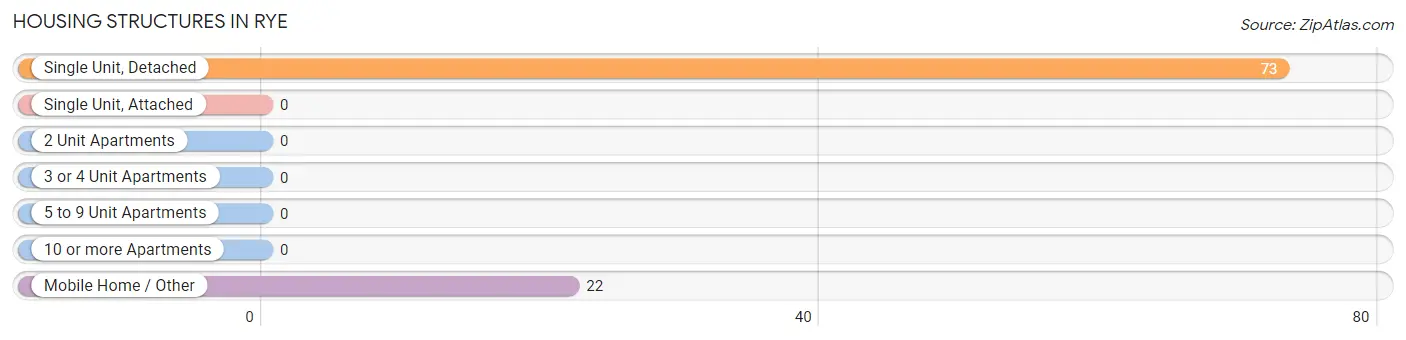
| Structure Type | # Housing Units | % Housing Units |
| Single Unit, Detached | 73 | 76.8% |
| Single Unit, Attached | 0 | 0.0% |
| 2 Unit Apartments | 0 | 0.0% |
| 3 or 4 Unit Apartments | 0 | 0.0% |
| 5 to 9 Unit Apartments | 0 | 0.0% |
| 10 or more Apartments | 0 | 0.0% |
| Mobile Home / Other | 22 | 23.2% |
| Total | 95 | 100.0% |
Housing Structures by Occupancy in Rye
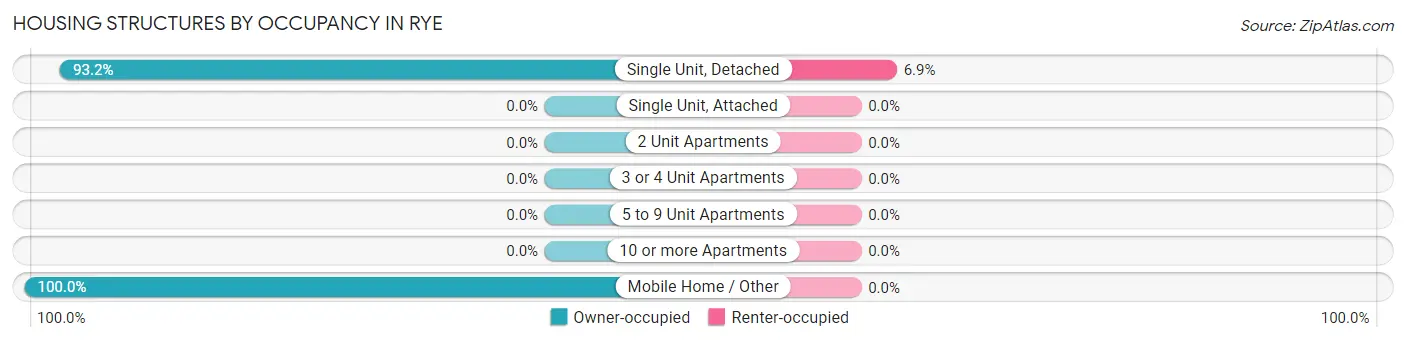
| Structure Type | Owner-occupied | Renter-occupied |
| Single Unit, Detached | 68 (93.1%) | 5 (6.9%) |
| Single Unit, Attached | 0 (0.0%) | 0 (0.0%) |
| 2 Unit Apartments | 0 (0.0%) | 0 (0.0%) |
| 3 or 4 Unit Apartments | 0 (0.0%) | 0 (0.0%) |
| 5 to 9 Unit Apartments | 0 (0.0%) | 0 (0.0%) |
| 10 or more Apartments | 0 (0.0%) | 0 (0.0%) |
| Mobile Home / Other | 22 (100.0%) | 0 (0.0%) |
| Total | 90 (94.7%) | 5 (5.3%) |
Housing Structures by Number of Rooms in Rye
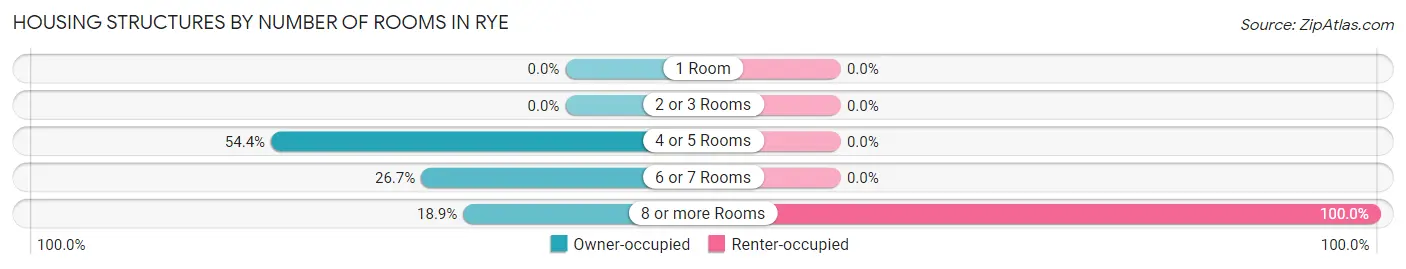
| Number of Rooms | Owner-occupied | Renter-occupied |
| 1 Room | 0 (0.0%) | 0 (0.0%) |
| 2 or 3 Rooms | 0 (0.0%) | 0 (0.0%) |
| 4 or 5 Rooms | 49 (54.4%) | 0 (0.0%) |
| 6 or 7 Rooms | 24 (26.7%) | 0 (0.0%) |
| 8 or more Rooms | 17 (18.9%) | 5 (100.0%) |
| Total | 90 (100.0%) | 5 (100.0%) |
Housing Structure by Heating Type in Rye
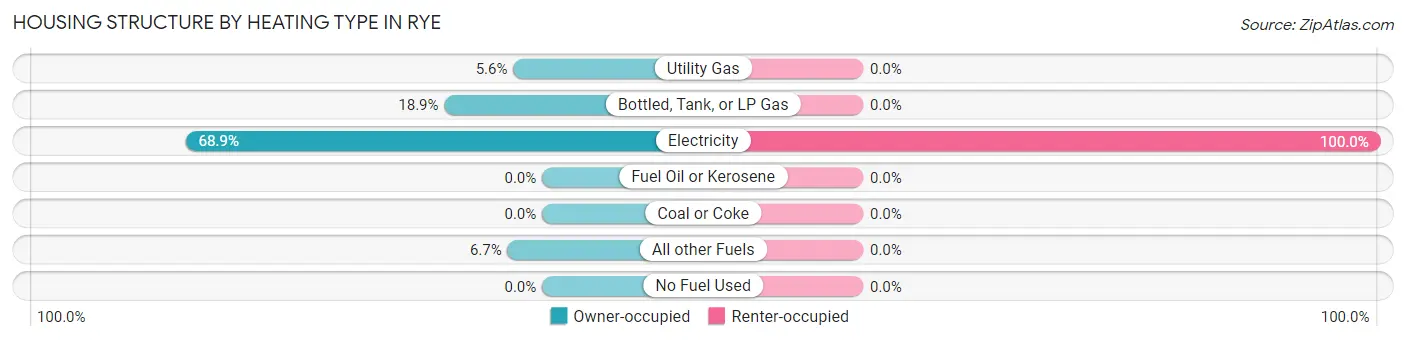
| Heating Type | Owner-occupied | Renter-occupied |
| Utility Gas | 5 (5.6%) | 0 (0.0%) |
| Bottled, Tank, or LP Gas | 17 (18.9%) | 0 (0.0%) |
| Electricity | 62 (68.9%) | 5 (100.0%) |
| Fuel Oil or Kerosene | 0 (0.0%) | 0 (0.0%) |
| Coal or Coke | 0 (0.0%) | 0 (0.0%) |
| All other Fuels | 6 (6.7%) | 0 (0.0%) |
| No Fuel Used | 0 (0.0%) | 0 (0.0%) |
| Total | 90 (100.0%) | 5 (100.0%) |
Household Vehicle Usage in Rye
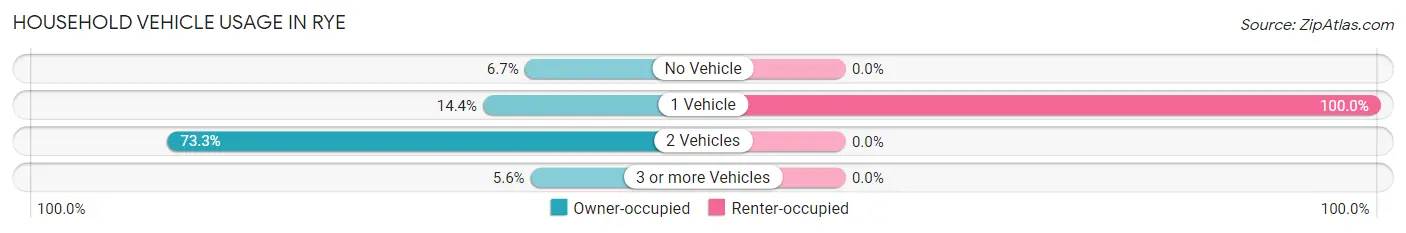
| Vehicles per Household | Owner-occupied | Renter-occupied |
| No Vehicle | 6 (6.7%) | 0 (0.0%) |
| 1 Vehicle | 13 (14.4%) | 5 (100.0%) |
| 2 Vehicles | 66 (73.3%) | 0 (0.0%) |
| 3 or more Vehicles | 5 (5.6%) | 0 (0.0%) |
| Total | 90 (100.0%) | 5 (100.0%) |
Real Estate & Mortgages in Rye
Real Estate and Mortgage Overview in Rye
| Characteristic | Without Mortgage | With Mortgage |
| Housing Units | 44 | 46 |
| Median Property Value | - | - |
| Median Household Income | $69,219 | $0 |
| Monthly Housing Costs | $367 | $0 |
| Real Estate Taxes | $667 | $0 |
Property Value by Mortgage Status in Rye
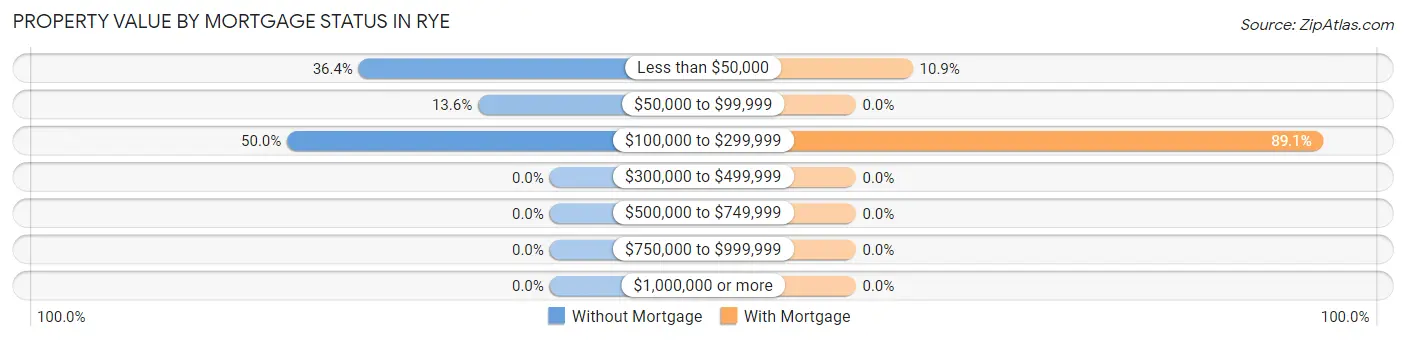
| Property Value | Without Mortgage | With Mortgage |
| Less than $50,000 | 16 (36.4%) | 5 (10.9%) |
| $50,000 to $99,999 | 6 (13.6%) | 0 (0.0%) |
| $100,000 to $299,999 | 22 (50.0%) | 41 (89.1%) |
| $300,000 to $499,999 | 0 (0.0%) | 0 (0.0%) |
| $500,000 to $749,999 | 0 (0.0%) | 0 (0.0%) |
| $750,000 to $999,999 | 0 (0.0%) | 0 (0.0%) |
| $1,000,000 or more | 0 (0.0%) | 0 (0.0%) |
| Total | 44 (100.0%) | 46 (100.0%) |
Household Income by Mortgage Status in Rye
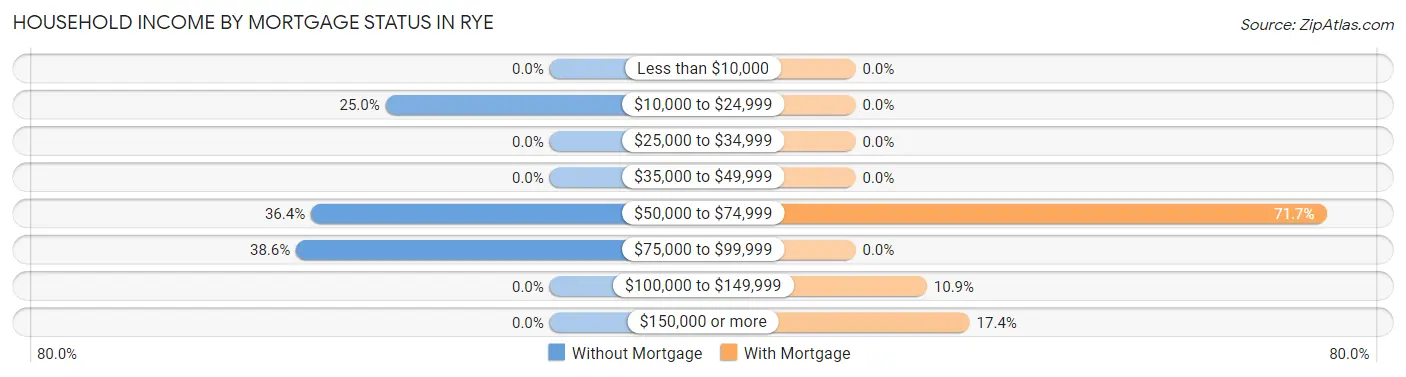
| Household Income | Without Mortgage | With Mortgage |
| Less than $10,000 | 0 (0.0%) | 0 (0.0%) |
| $10,000 to $24,999 | 11 (25.0%) | 0 (0.0%) |
| $25,000 to $34,999 | 0 (0.0%) | 0 (0.0%) |
| $35,000 to $49,999 | 0 (0.0%) | 0 (0.0%) |
| $50,000 to $74,999 | 16 (36.4%) | 33 (71.7%) |
| $75,000 to $99,999 | 17 (38.6%) | 0 (0.0%) |
| $100,000 to $149,999 | 0 (0.0%) | 5 (10.9%) |
| $150,000 or more | 0 (0.0%) | 8 (17.4%) |
| Total | 44 (100.0%) | 46 (100.0%) |
Property Value to Household Income Ratio in Rye
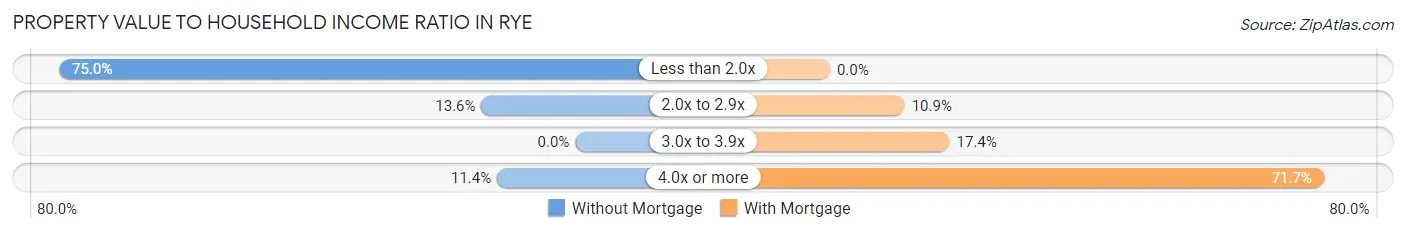
| Value-to-Income Ratio | Without Mortgage | With Mortgage |
| Less than 2.0x | 33 (75.0%) | 0 (0.0%) |
| 2.0x to 2.9x | 6 (13.6%) | 5 (10.9%) |
| 3.0x to 3.9x | 0 (0.0%) | 8 (17.4%) |
| 4.0x or more | 5 (11.4%) | 33 (71.7%) |
| Total | 44 (100.0%) | 46 (100.0%) |
Real Estate Taxes by Mortgage Status in Rye
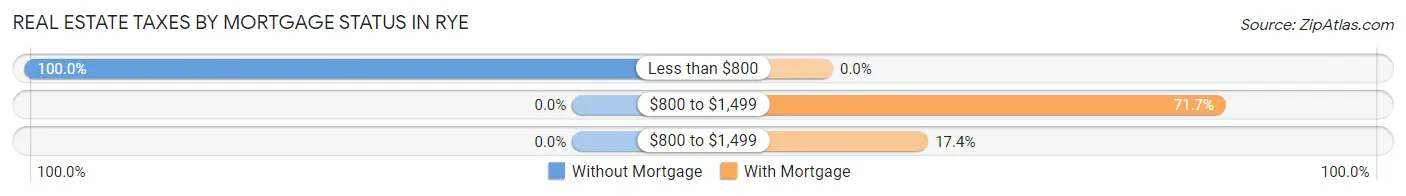
| Property Taxes | Without Mortgage | With Mortgage |
| Less than $800 | 44 (100.0%) | 0 (0.0%) |
| $800 to $1,499 | 0 (0.0%) | 33 (71.7%) |
| $800 to $1,499 | 0 (0.0%) | 8 (17.4%) |
| Total | 44 (100.0%) | 46 (100.0%) |
Health & Disability in Rye
Health Insurance Coverage by Age in Rye
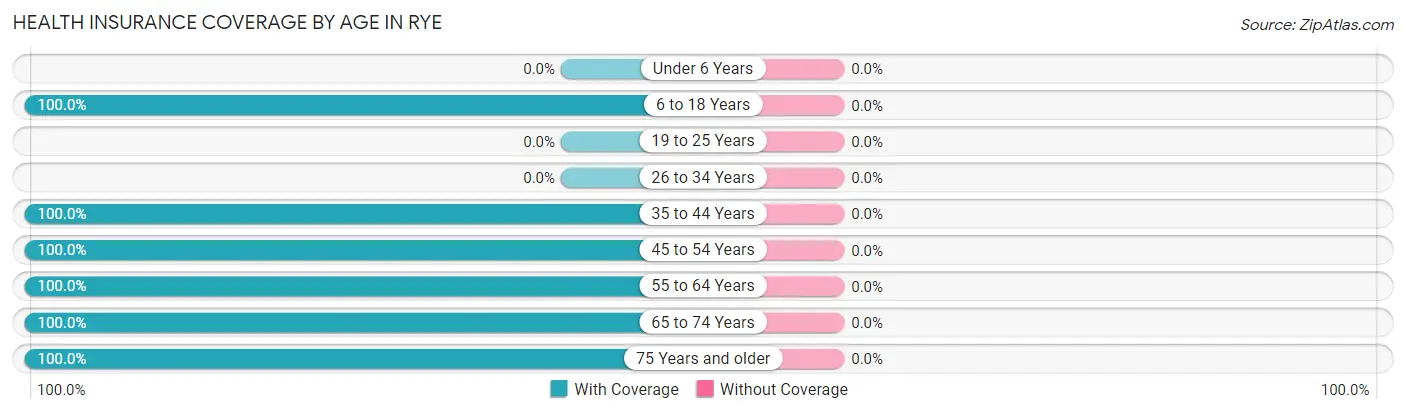
| Age Bracket | With Coverage | Without Coverage |
| Under 6 Years | 0 (0.0%) | 0 (0.0%) |
| 6 to 18 Years | 51 (100.0%) | 0 (0.0%) |
| 19 to 25 Years | 0 (0.0%) | 0 (0.0%) |
| 26 to 34 Years | 0 (0.0%) | 0 (0.0%) |
| 35 to 44 Years | 9 (100.0%) | 0 (0.0%) |
| 45 to 54 Years | 68 (100.0%) | 0 (0.0%) |
| 55 to 64 Years | 13 (100.0%) | 0 (0.0%) |
| 65 to 74 Years | 21 (100.0%) | 0 (0.0%) |
| 75 Years and older | 23 (100.0%) | 0 (0.0%) |
| Total | 185 (100.0%) | 0 (0.0%) |
Health Insurance Coverage by Citizenship Status in Rye
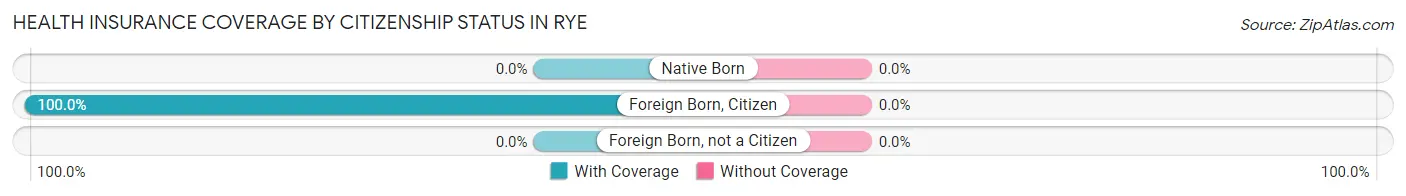
| Citizenship Status | With Coverage | Without Coverage |
| Native Born | 0 (0.0%) | 0 (0.0%) |
| Foreign Born, Citizen | 51 (100.0%) | 0 (0.0%) |
| Foreign Born, not a Citizen | 0 (0.0%) | 0 (0.0%) |
Health Insurance Coverage by Household Income in Rye
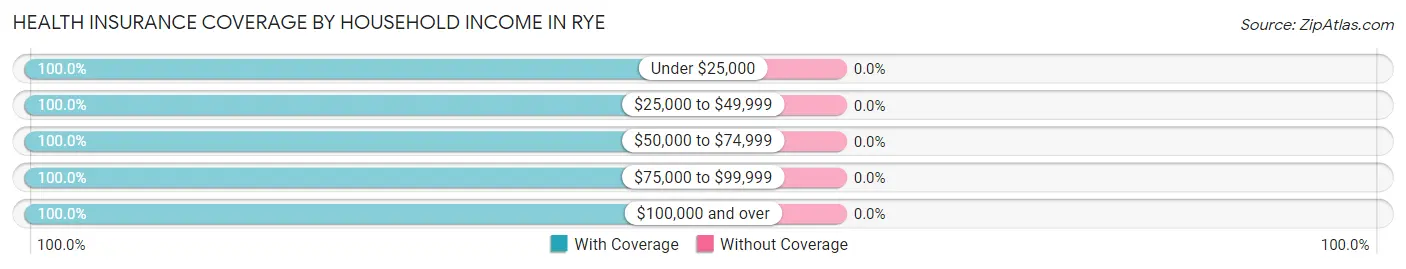
| Household Income | With Coverage | Without Coverage |
| Under $25,000 | 16 (100.0%) | 0 (0.0%) |
| $25,000 to $49,999 | 79 (100.0%) | 0 (0.0%) |
| $50,000 to $74,999 | 16 (100.0%) | 0 (0.0%) |
| $75,000 to $99,999 | 66 (100.0%) | 0 (0.0%) |
| $100,000 and over | 8 (100.0%) | 0 (0.0%) |
Public vs Private Health Insurance Coverage by Age in Rye
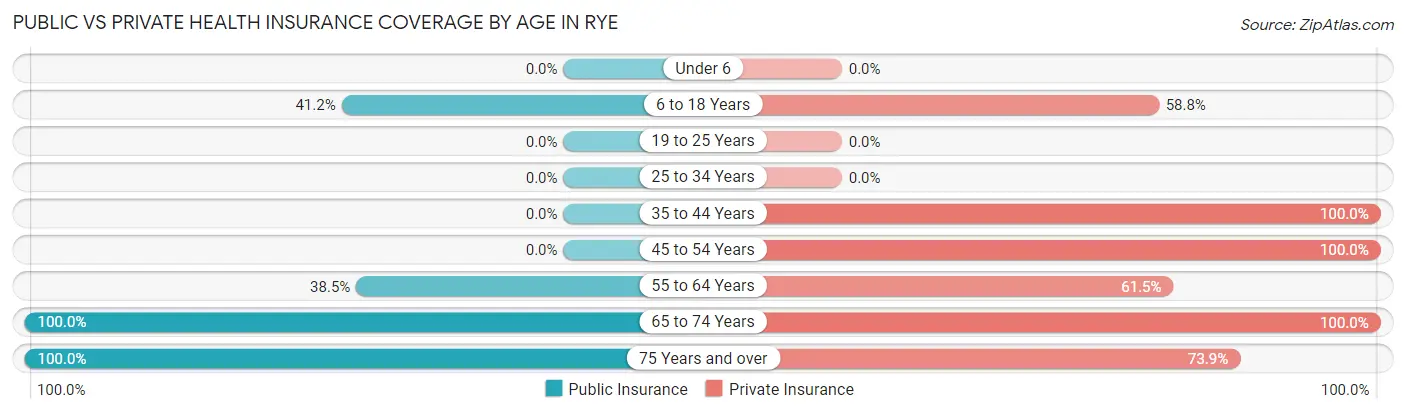
| Age Bracket | Public Insurance | Private Insurance |
| Under 6 | 0 (0.0%) | 0 (0.0%) |
| 6 to 18 Years | 21 (41.2%) | 30 (58.8%) |
| 19 to 25 Years | 0 (0.0%) | 0 (0.0%) |
| 25 to 34 Years | 0 (0.0%) | 0 (0.0%) |
| 35 to 44 Years | 0 (0.0%) | 9 (100.0%) |
| 45 to 54 Years | 0 (0.0%) | 68 (100.0%) |
| 55 to 64 Years | 5 (38.5%) | 8 (61.5%) |
| 65 to 74 Years | 21 (100.0%) | 21 (100.0%) |
| 75 Years and over | 23 (100.0%) | 17 (73.9%) |
| Total | 70 (37.8%) | 153 (82.7%) |
Disability Status by Sex by Age in Rye
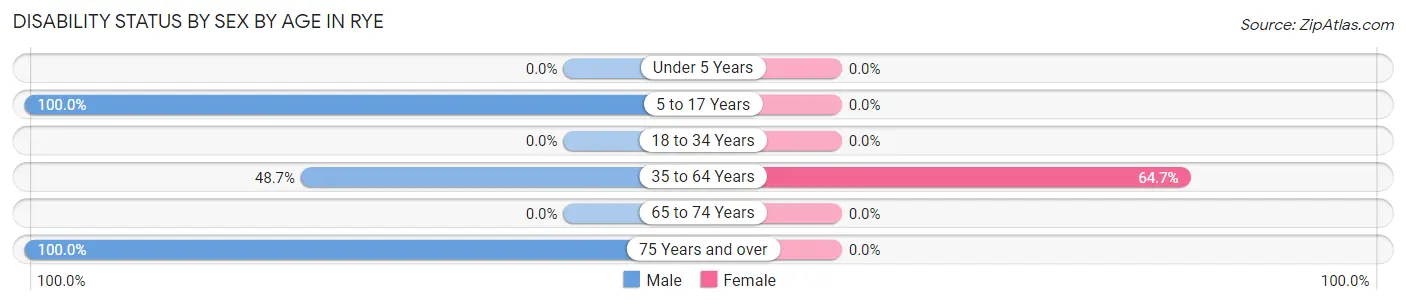
| Age Bracket | Male | Female |
| Under 5 Years | 0 (0.0%) | 0 (0.0%) |
| 5 to 17 Years | 27 (100.0%) | 0 (0.0%) |
| 18 to 34 Years | 0 (0.0%) | 0 (0.0%) |
| 35 to 64 Years | 19 (48.7%) | 33 (64.7%) |
| 65 to 74 Years | 0 (0.0%) | 0 (0.0%) |
| 75 Years and over | 23 (100.0%) | 0 (0.0%) |
Disability Class by Sex by Age in Rye
Disability Class: Hearing Difficulty
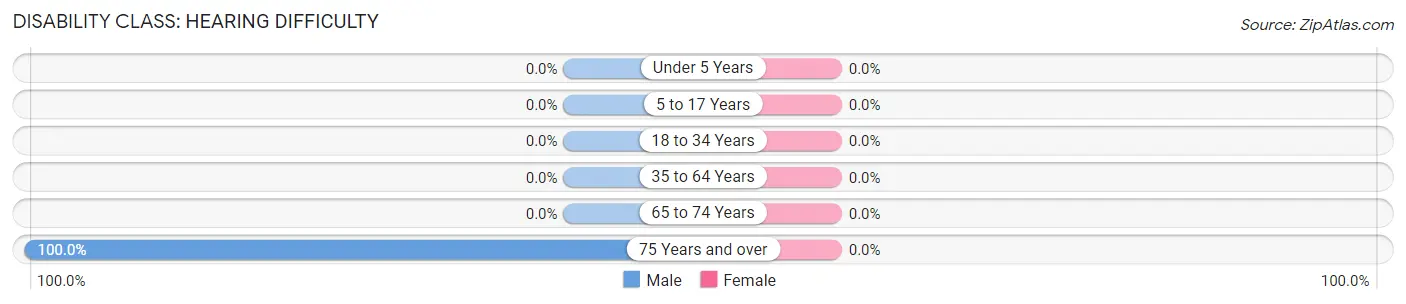
| Age Bracket | Male | Female |
| Under 5 Years | 0 (0.0%) | 0 (0.0%) |
| 5 to 17 Years | 0 (0.0%) | 0 (0.0%) |
| 18 to 34 Years | 0 (0.0%) | 0 (0.0%) |
| 35 to 64 Years | 0 (0.0%) | 0 (0.0%) |
| 65 to 74 Years | 0 (0.0%) | 0 (0.0%) |
| 75 Years and over | 23 (100.0%) | 0 (0.0%) |
Disability Class: Vision Difficulty
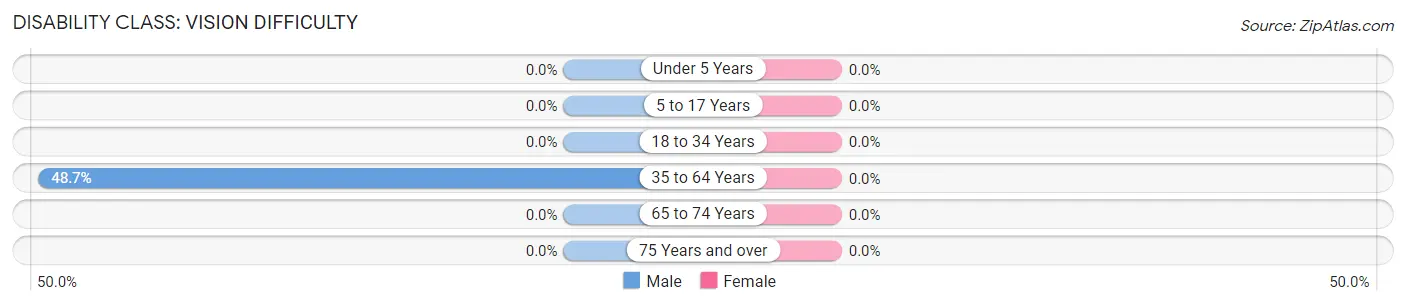
| Age Bracket | Male | Female |
| Under 5 Years | 0 (0.0%) | 0 (0.0%) |
| 5 to 17 Years | 0 (0.0%) | 0 (0.0%) |
| 18 to 34 Years | 0 (0.0%) | 0 (0.0%) |
| 35 to 64 Years | 19 (48.7%) | 0 (0.0%) |
| 65 to 74 Years | 0 (0.0%) | 0 (0.0%) |
| 75 Years and over | 0 (0.0%) | 0 (0.0%) |
Disability Class: Cognitive Difficulty
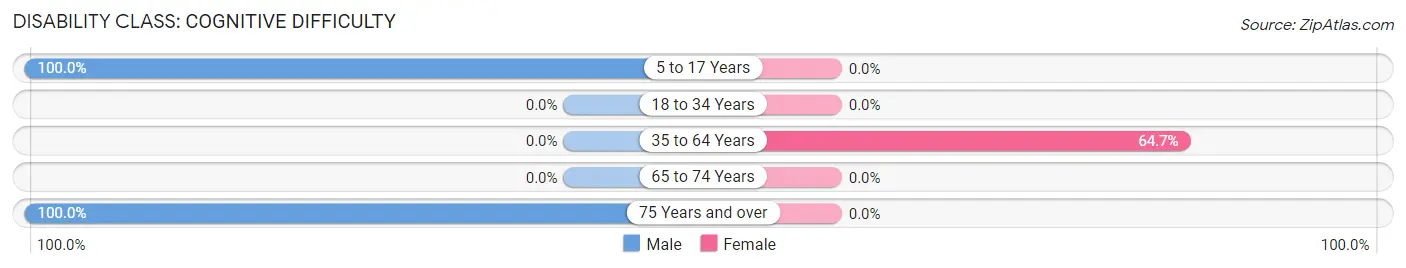
| Age Bracket | Male | Female |
| 5 to 17 Years | 27 (100.0%) | 0 (0.0%) |
| 18 to 34 Years | 0 (0.0%) | 0 (0.0%) |
| 35 to 64 Years | 0 (0.0%) | 33 (64.7%) |
| 65 to 74 Years | 0 (0.0%) | 0 (0.0%) |
| 75 Years and over | 23 (100.0%) | 0 (0.0%) |
Disability Class: Ambulatory Difficulty
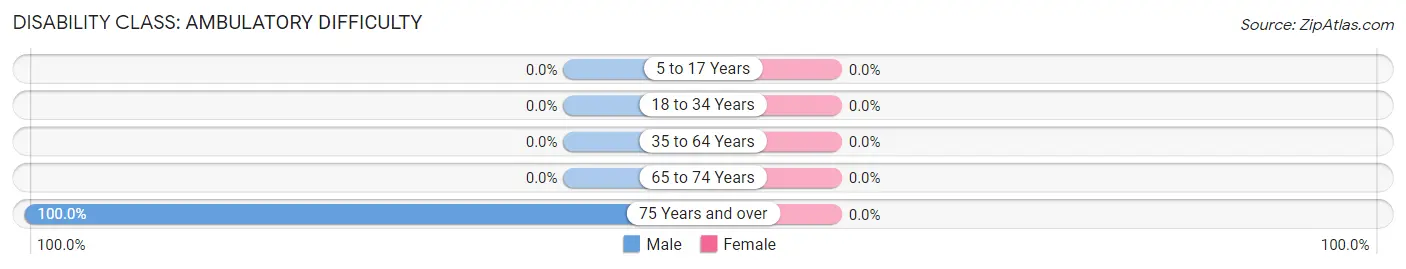
| Age Bracket | Male | Female |
| 5 to 17 Years | 0 (0.0%) | 0 (0.0%) |
| 18 to 34 Years | 0 (0.0%) | 0 (0.0%) |
| 35 to 64 Years | 0 (0.0%) | 0 (0.0%) |
| 65 to 74 Years | 0 (0.0%) | 0 (0.0%) |
| 75 Years and over | 23 (100.0%) | 0 (0.0%) |
Disability Class: Self-Care Difficulty
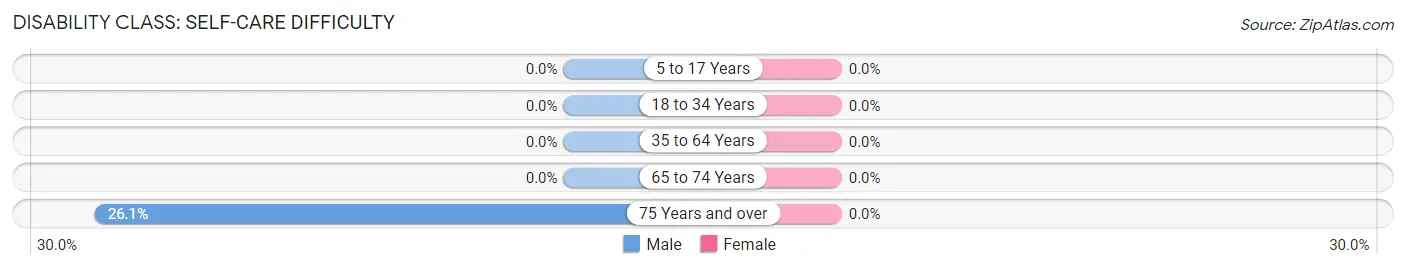
| Age Bracket | Male | Female |
| 5 to 17 Years | 0 (0.0%) | 0 (0.0%) |
| 18 to 34 Years | 0 (0.0%) | 0 (0.0%) |
| 35 to 64 Years | 0 (0.0%) | 0 (0.0%) |
| 65 to 74 Years | 0 (0.0%) | 0 (0.0%) |
| 75 Years and over | 6 (26.1%) | 0 (0.0%) |
Technology Access in Rye
Computing Device Access in Rye
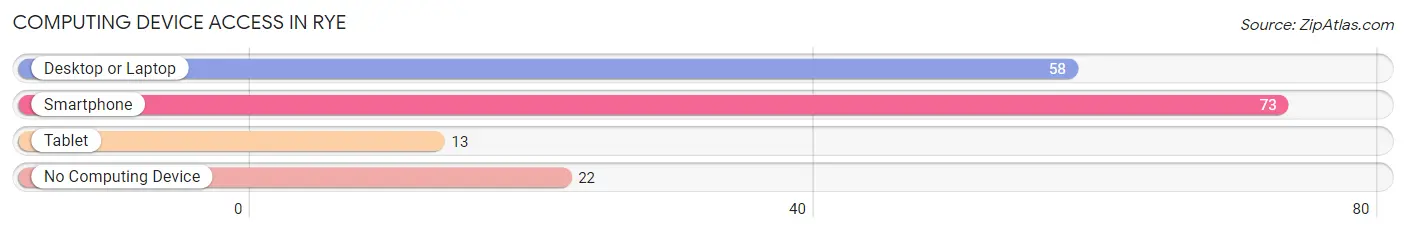
| Device Type | # Households | % Households |
| Desktop or Laptop | 58 | 61.1% |
| Smartphone | 73 | 76.8% |
| Tablet | 13 | 13.7% |
| No Computing Device | 22 | 23.2% |
| Total | 95 | 100.0% |
Internet Access in Rye
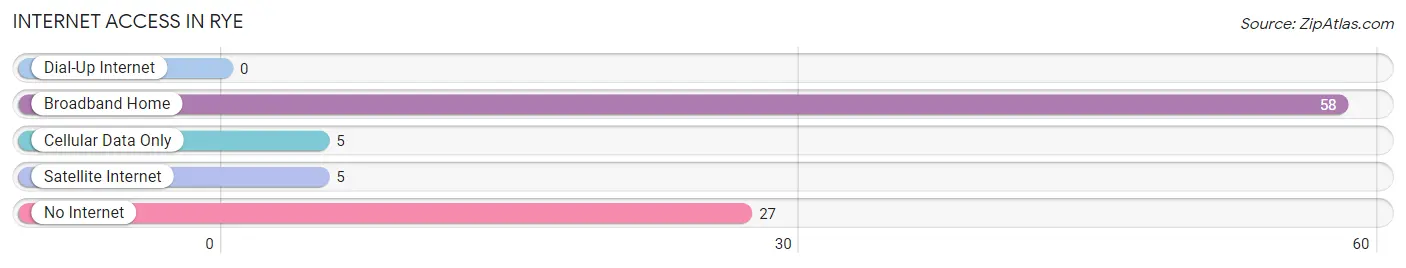
| Internet Type | # Households | % Households |
| Dial-Up Internet | 0 | 0.0% |
| Broadband Home | 58 | 61.1% |
| Cellular Data Only | 5 | 5.3% |
| Satellite Internet | 5 | 5.3% |
| No Internet | 27 | 28.4% |
| Total | 95 | 100.0% |
Rye Summary
Rye is a small unincorporated community located in the Ozark Mountains of Arkansas. It is situated in the northern part of the state, in Madison County, and is approximately 20 miles south of Fayetteville. The community is located along the banks of the White River, and is surrounded by the Ozark National Forest.
History
Rye was first settled in the early 1800s by settlers from Tennessee and Kentucky. The community was named after the rye whiskey that was produced in the area. The first post office was established in 1883, and the town was officially incorporated in 1887.
In the early 1900s, Rye was a thriving community with a population of over 500 people. The town had several stores, a hotel, a school, and a sawmill. The town was also home to a number of churches, including the Methodist Episcopal Church, the Baptist Church, and the Church of Christ.
In the 1920s, the population of Rye began to decline as people moved away in search of better economic opportunities. By the 1950s, the population had dropped to just over 200 people.
Geography
Rye is located in the Ozark Mountains of Arkansas. The town is situated in the northern part of the state, in Madison County, and is approximately 20 miles south of Fayetteville. The community is located along the banks of the White River, and is surrounded by the Ozark National Forest.
The terrain around Rye is mostly hilly and forested, with some open fields and pastures. The climate is mild and humid, with hot summers and cold winters.
Economy
Rye is a small, rural community with a limited economy. The town is home to a few small businesses, including a general store, a gas station, and a restaurant. The town also has a post office and a volunteer fire department.
The main economic activity in Rye is agriculture. The town is home to several farms, which produce a variety of crops, including corn, soybeans, wheat, and hay. The town also has a few small businesses, including a sawmill and a woodworking shop.
Demographics
As of the 2010 census, the population of Rye was 545 people. The racial makeup of the town was 97.3% White, 0.7% African American, 0.2% Native American, 0.2% Asian, and 1.6% from other races.
The median household income in Rye was $30,000, and the median family income was $35,000. The per capita income was $14,000. The town had a poverty rate of 22.2%.
Conclusion
Rye is a small, rural community located in the Ozark Mountains of Arkansas. The town has a long history, and was once a thriving community with a population of over 500 people. Today, the town has a population of just over 500 people, and the main economic activity is agriculture. The town is home to several farms, which produce a variety of crops, including corn, soybeans, wheat, and hay.
Common Questions
What is Per Capita Income in Rye?
Per Capita income in Rye is $25,467.
What is Inequality or Gini Index in Rye?
Inequality or Gini Index in Rye is 0.28.
What is the Total Population of Rye?
Total Population of Rye is 185.
What is the Total Male Population of Rye?
Total Male Population of Rye is 89.
What is the Total Female Population of Rye?
Total Female Population of Rye is 96.
What is the Ratio of Males per 100 Females in Rye?
There are 92.71 Males per 100 Females in Rye.
What is the Ratio of Females per 100 Males in Rye?
There are 107.87 Females per 100 Males in Rye.
What is the Median Population Age in Rye?
Median Population Age in Rye is 47.0 Years.
What is the Average Family Size in Rye
Average Family Size in Rye is 2.6 People.
What is the Average Household Size in Rye
Average Household Size in Rye is 1.9 People.
How Large is the Labor Force in Rye?
There are 52 People in the Labor Forcein in Rye.
What is the Percentage of People in the Labor Force in Rye?
38.8% of People are in the Labor Force in Rye.