Sharp County, AR Map & Demographics
Sharp County Map
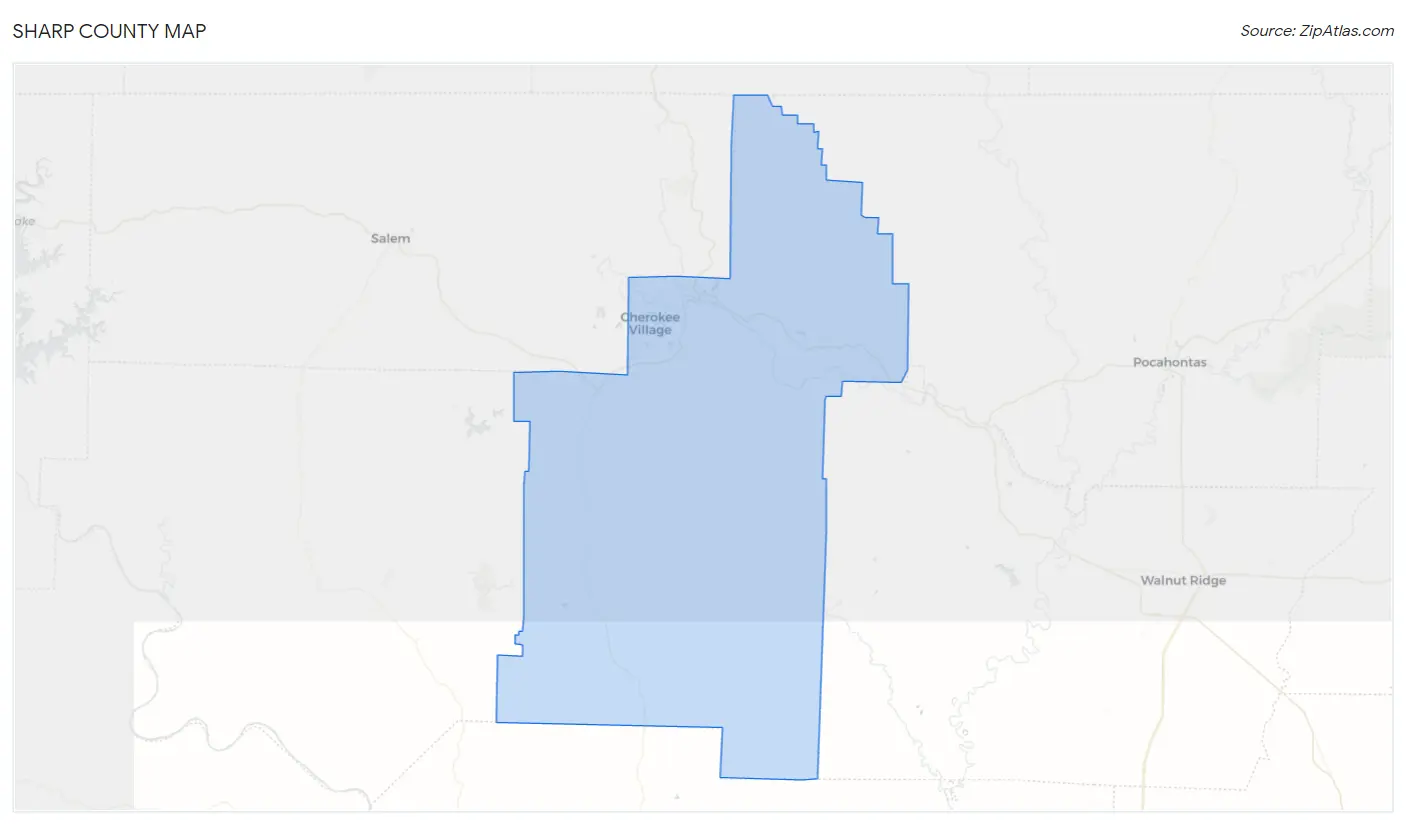
Sharp County Overview
$25,283
PER CAPITA INCOME
$55,625
AVG FAMILY INCOME
$43,332
AVG HOUSEHOLD INCOME
23.9%
WAGE / INCOME GAP [ % ]
76.1¢/ $1
WAGE / INCOME GAP [ $ ]
$9,422
FAMILY INCOME DEFICIT
0.47
INEQUALITY / GINI INDEX
17,422
TOTAL POPULATION
8,559
MALE POPULATION
8,863
FEMALE POPULATION
96.57
MALES / 100 FEMALES
103.55
FEMALES / 100 MALES
47.4
MEDIAN AGE
3.1
AVG FAMILY SIZE
2.5
AVG HOUSEHOLD SIZE
6,704
LABOR FORCE [ PEOPLE ]
47.0%
PERCENT IN LABOR FORCE
6.2%
UNEMPLOYMENT RATE
Sharp County Area Codes
Income in Sharp County
Income Overview in Sharp County
Per Capita Income in Sharp County is $25,283, while median incomes of families and households are $55,625 and $43,332 respectively.
| Characteristic | Number | Measure |
| Per Capita Income | 17,422 | $25,283 |
| Median Family Income | 4,611 | $55,625 |
| Mean Family Income | 4,611 | $75,665 |
| Median Household Income | 6,901 | $43,332 |
| Mean Household Income | 6,901 | $61,476 |
| Income Deficit | 4,611 | $9,422 |
| Wage / Income Gap (%) | 17,422 | 23.93% |
| Wage / Income Gap ($) | 17,422 | 76.07¢ per $1 |
| Gini / Inequality Index | 17,422 | 0.47 |
Earnings by Sex in Sharp County
Average Earnings in Sharp County are $29,641, $33,321 for men and $25,346 for women, a difference of 23.9%.
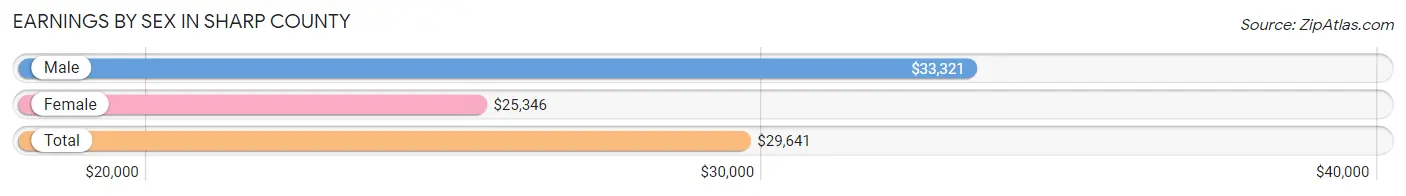
| Sex | Number | Average Earnings |
| Male | 3,706 (52.4%) | $33,321 |
| Female | 3,367 (47.6%) | $25,346 |
| Total | 7,073 (100.0%) | $29,641 |
Earnings by Sex by Income Bracket in Sharp County
The most common earnings brackets in Sharp County are $30,000 to $34,999 for men (386 | 10.4%) and $30,000 to $34,999 for women (455 | 13.5%).
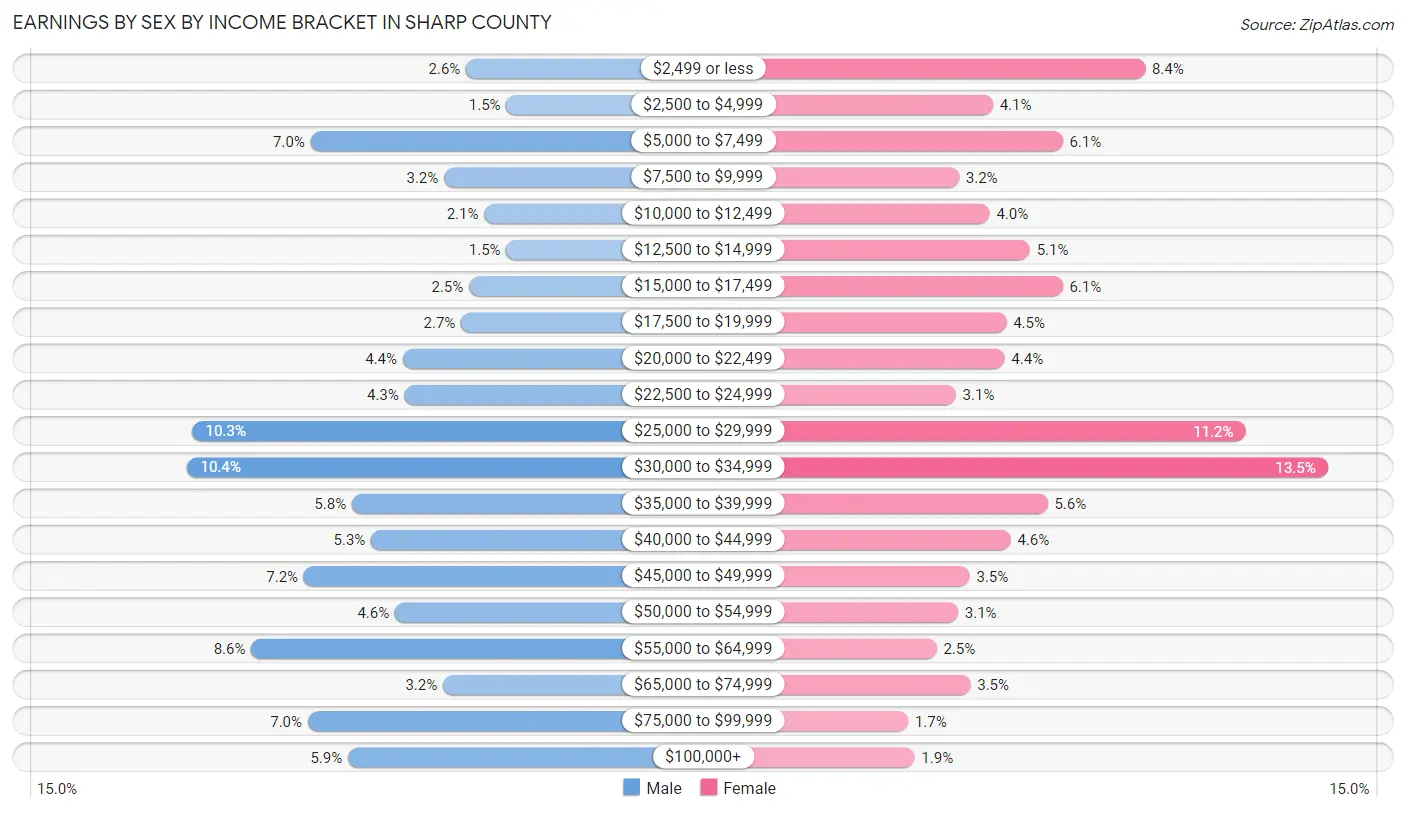
| Income | Male | Female |
| $2,499 or less | 96 (2.6%) | 282 (8.4%) |
| $2,500 to $4,999 | 54 (1.5%) | 138 (4.1%) |
| $5,000 to $7,499 | 258 (7.0%) | 204 (6.1%) |
| $7,500 to $9,999 | 119 (3.2%) | 106 (3.2%) |
| $10,000 to $12,499 | 77 (2.1%) | 135 (4.0%) |
| $12,500 to $14,999 | 54 (1.5%) | 173 (5.1%) |
| $15,000 to $17,499 | 93 (2.5%) | 204 (6.1%) |
| $17,500 to $19,999 | 101 (2.7%) | 151 (4.5%) |
| $20,000 to $22,499 | 162 (4.4%) | 149 (4.4%) |
| $22,500 to $24,999 | 160 (4.3%) | 103 (3.1%) |
| $25,000 to $29,999 | 381 (10.3%) | 377 (11.2%) |
| $30,000 to $34,999 | 386 (10.4%) | 455 (13.5%) |
| $35,000 to $39,999 | 215 (5.8%) | 190 (5.6%) |
| $40,000 to $44,999 | 195 (5.3%) | 155 (4.6%) |
| $45,000 to $49,999 | 265 (7.1%) | 116 (3.5%) |
| $50,000 to $54,999 | 170 (4.6%) | 105 (3.1%) |
| $55,000 to $64,999 | 320 (8.6%) | 85 (2.5%) |
| $65,000 to $74,999 | 120 (3.2%) | 117 (3.5%) |
| $75,000 to $99,999 | 261 (7.0%) | 58 (1.7%) |
| $100,000+ | 219 (5.9%) | 64 (1.9%) |
| Total | 3,706 (100.0%) | 3,367 (100.0%) |
Earnings by Sex by Educational Attainment in Sharp County
Average earnings in Sharp County are $38,689 for men and $26,858 for women, a difference of 30.6%. Men with an educational attainment of bachelor's degree enjoy the highest average annual earnings of $79,213, while those with less than high school education earn the least with $26,582. Women with an educational attainment of graduate degree earn the most with the average annual earnings of $41,818, while those with less than high school education have the smallest earnings of $15,673.
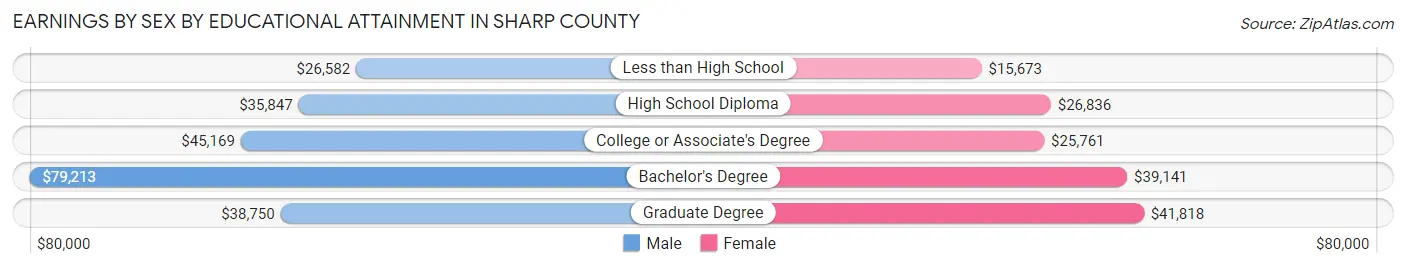
| Educational Attainment | Male Income | Female Income |
| Less than High School | $26,582 | $15,673 |
| High School Diploma | $35,847 | $26,836 |
| College or Associate's Degree | $45,169 | $25,761 |
| Bachelor's Degree | $79,213 | $39,141 |
| Graduate Degree | $38,750 | $41,818 |
| Total | $38,689 | $26,858 |
Family Income in Sharp County
Family Income Brackets in Sharp County
According to the Sharp County family income data, there are 1,019 families falling into the $50,000 to $74,999 income range, which is the most common income bracket and makes up 22.1% of all families. Conversely, the $10,000 to $14,999 income bracket is the least frequent group with only 69 families (1.5%) belonging to this category.
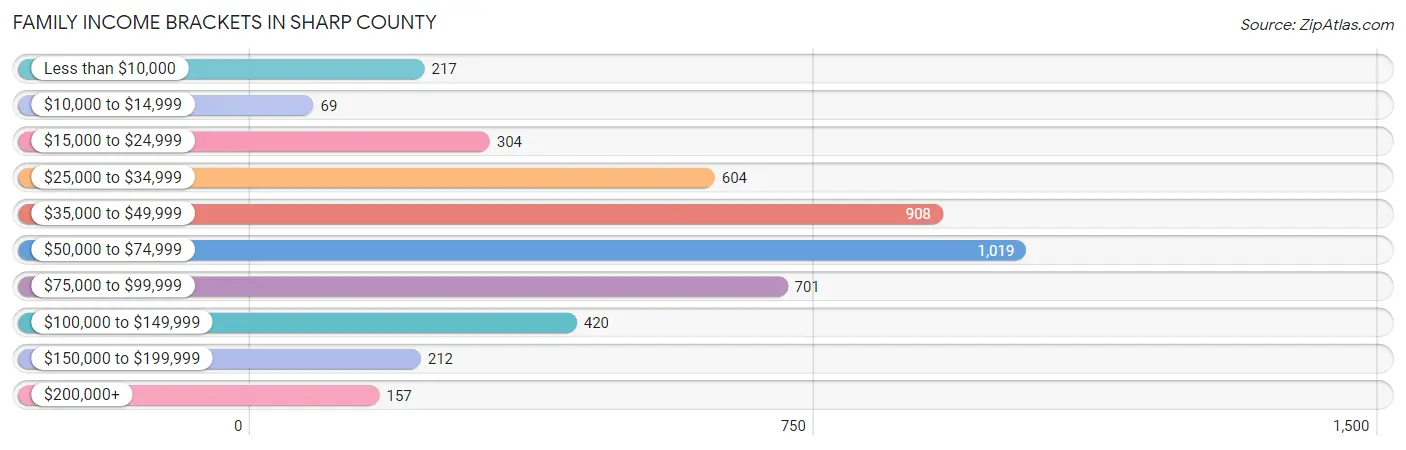
| Income Bracket | # Families | % Families |
| Less than $10,000 | 217 | 4.7% |
| $10,000 to $14,999 | 69 | 1.5% |
| $15,000 to $24,999 | 304 | 6.6% |
| $25,000 to $34,999 | 604 | 13.1% |
| $35,000 to $49,999 | 908 | 19.7% |
| $50,000 to $74,999 | 1,019 | 22.1% |
| $75,000 to $99,999 | 701 | 15.2% |
| $100,000 to $149,999 | 420 | 9.1% |
| $150,000 to $199,999 | 212 | 4.6% |
| $200,000+ | 157 | 3.4% |
Family Income by Famaliy Size in Sharp County
5-person families (311 | 6.7%) account for the highest median family income in Sharp County with $73,770 per family, while 2-person families (2,298 | 49.8%) have the highest median income of $23,173 per family member.
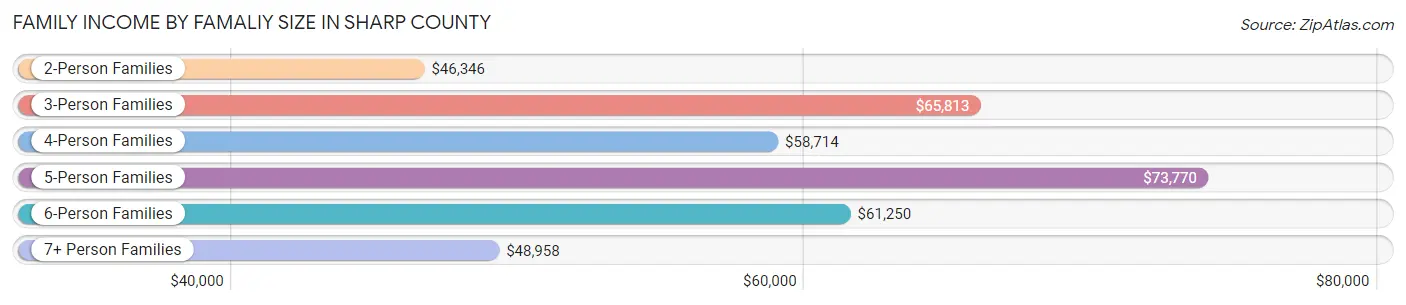
| Income Bracket | # Families | Median Income |
| 2-Person Families | 2,298 (49.8%) | $46,346 |
| 3-Person Families | 1,087 (23.6%) | $65,813 |
| 4-Person Families | 719 (15.6%) | $58,714 |
| 5-Person Families | 311 (6.7%) | $73,770 |
| 6-Person Families | 131 (2.8%) | $61,250 |
| 7+ Person Families | 65 (1.4%) | $48,958 |
| Total | 4,611 (100.0%) | $55,625 |
Family Income by Number of Earners in Sharp County
The median family income in Sharp County is $55,625, with families comprising 3+ earners (269) having the highest median family income of $96,510, while families with no earners (1,221) have the lowest median family income of $36,047, accounting for 5.8% and 26.5% of families, respectively.
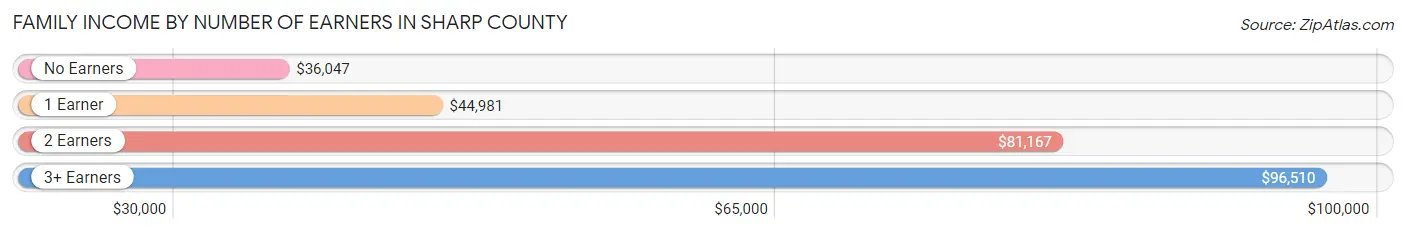
| Number of Earners | # Families | Median Income |
| No Earners | 1,221 (26.5%) | $36,047 |
| 1 Earner | 1,531 (33.2%) | $44,981 |
| 2 Earners | 1,590 (34.5%) | $81,167 |
| 3+ Earners | 269 (5.8%) | $96,510 |
| Total | 4,611 (100.0%) | $55,625 |
Household Income in Sharp County
Household Income Brackets in Sharp County
With 1,256 households falling in the category, the $50,000 to $74,999 income range is the most frequent in Sharp County, accounting for 18.2% of all households. In contrast, only 166 households (2.4%) fall into the $200,000+ income bracket, making it the least populous group.
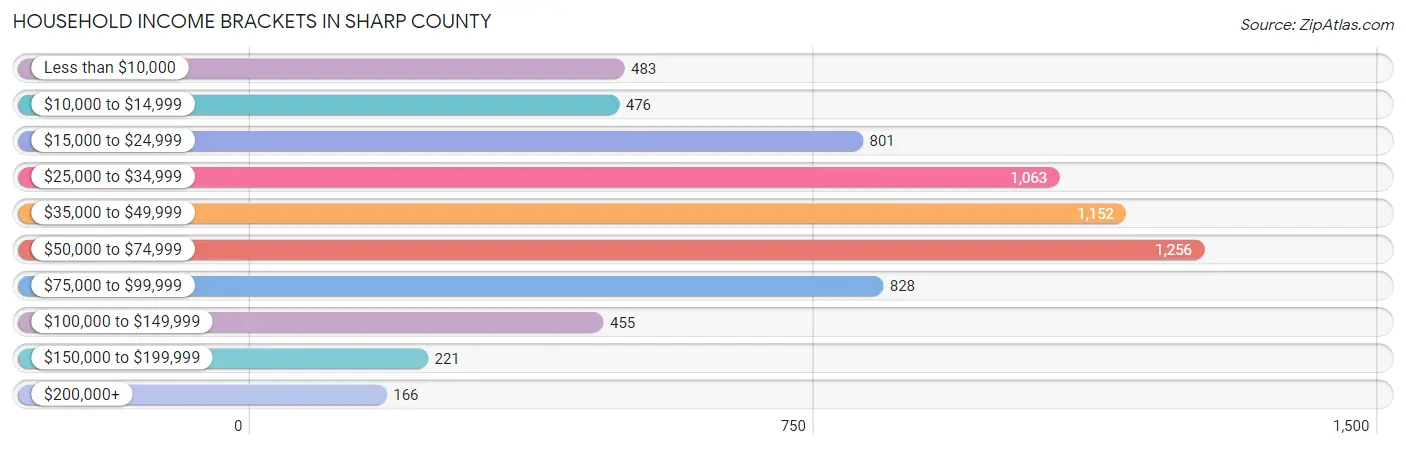
| Income Bracket | # Households | % Households |
| Less than $10,000 | 483 | 7.0% |
| $10,000 to $14,999 | 476 | 6.9% |
| $15,000 to $24,999 | 801 | 11.6% |
| $25,000 to $34,999 | 1,063 | 15.4% |
| $35,000 to $49,999 | 1,152 | 16.7% |
| $50,000 to $74,999 | 1,256 | 18.2% |
| $75,000 to $99,999 | 828 | 12.0% |
| $100,000 to $149,999 | 455 | 6.6% |
| $150,000 to $199,999 | 221 | 3.2% |
| $200,000+ | 166 | 2.4% |
Household Income by Householder Age in Sharp County
The median household income in Sharp County is $43,332, with the highest median household income of $51,641 found in the 45 to 64 years age bracket for the primary householder. A total of 2,393 households (34.7%) fall into this category. Meanwhile, the 15 to 24 years age bracket for the primary householder has the lowest median household income of $29,896, with 135 households (2.0%) in this group.
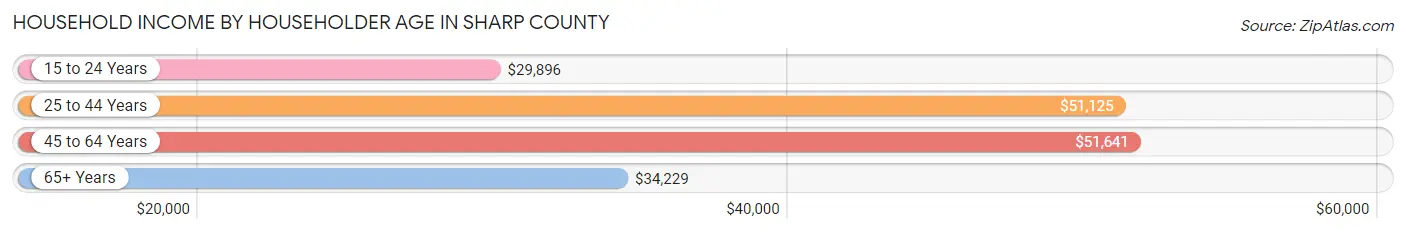
| Income Bracket | # Households | Median Income |
| 15 to 24 Years | 135 (2.0%) | $29,896 |
| 25 to 44 Years | 1,729 (25.1%) | $51,125 |
| 45 to 64 Years | 2,393 (34.7%) | $51,641 |
| 65+ Years | 2,644 (38.3%) | $34,229 |
| Total | 6,901 (100.0%) | $43,332 |
Poverty in Sharp County
Income Below Poverty by Sex and Age in Sharp County
With 14.0% poverty level for males and 17.8% for females among the residents of Sharp County, under 5 year old males and 15 year old females are the most vulnerable to poverty, with 167 males (37.8%) and 45 females (46.4%) in their respective age groups living below the poverty level.
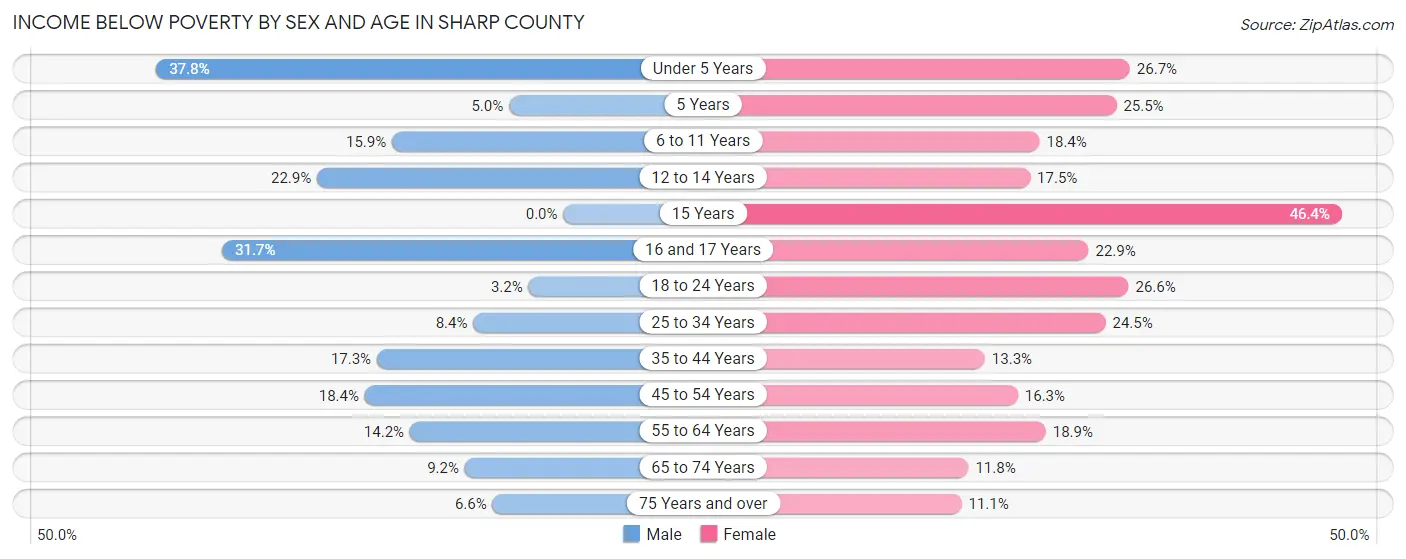
| Age Bracket | Male | Female |
| Under 5 Years | 167 (37.8%) | 115 (26.7%) |
| 5 Years | 7 (5.0%) | 13 (25.5%) |
| 6 to 11 Years | 69 (15.9%) | 112 (18.4%) |
| 12 to 14 Years | 88 (22.9%) | 43 (17.5%) |
| 15 Years | 0 (0.0%) | 45 (46.4%) |
| 16 and 17 Years | 76 (31.7%) | 49 (22.9%) |
| 18 to 24 Years | 20 (3.2%) | 153 (26.6%) |
| 25 to 34 Years | 64 (8.4%) | 199 (24.5%) |
| 35 to 44 Years | 154 (17.3%) | 127 (13.3%) |
| 45 to 54 Years | 195 (18.4%) | 167 (16.3%) |
| 55 to 64 Years | 178 (14.2%) | 258 (18.9%) |
| 65 to 74 Years | 109 (9.1%) | 156 (11.8%) |
| 75 Years and over | 55 (6.6%) | 106 (11.1%) |
| Total | 1,182 (14.0%) | 1,543 (17.8%) |
Income Above Poverty by Sex and Age in Sharp County
According to the poverty statistics in Sharp County, males aged 15 years and females aged 75 years and over are the age groups that are most secure financially, with 100.0% of males and 88.9% of females in these age groups living above the poverty line.
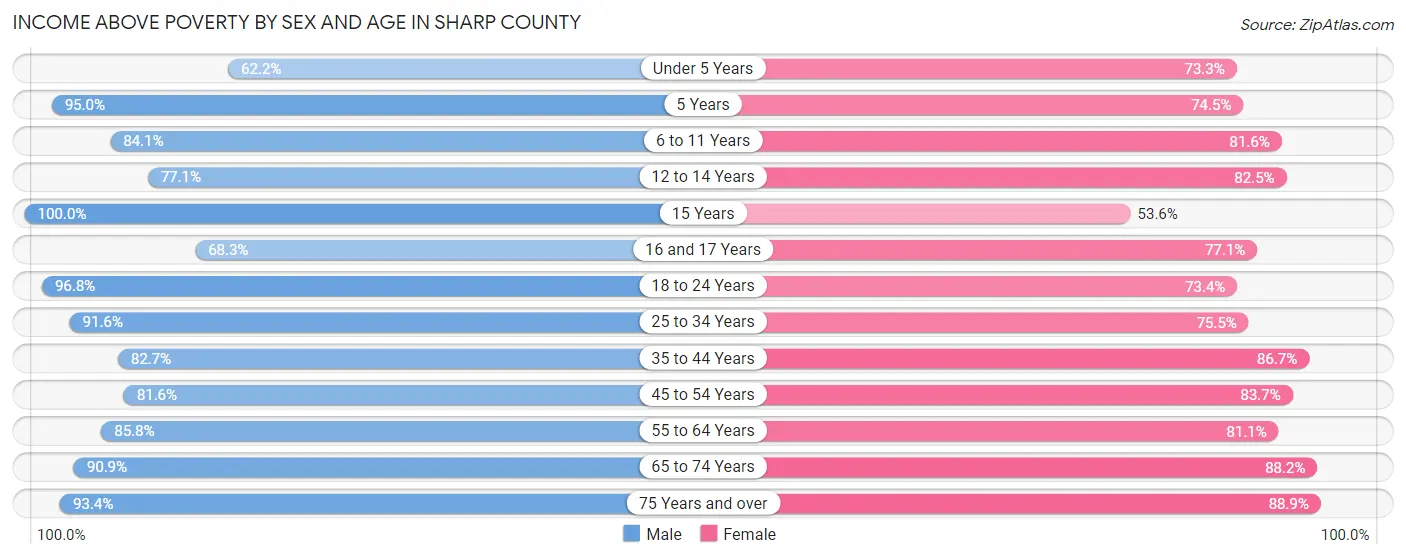
| Age Bracket | Male | Female |
| Under 5 Years | 275 (62.2%) | 315 (73.3%) |
| 5 Years | 132 (95.0%) | 38 (74.5%) |
| 6 to 11 Years | 365 (84.1%) | 498 (81.6%) |
| 12 to 14 Years | 297 (77.1%) | 203 (82.5%) |
| 15 Years | 211 (100.0%) | 52 (53.6%) |
| 16 and 17 Years | 164 (68.3%) | 165 (77.1%) |
| 18 to 24 Years | 600 (96.8%) | 422 (73.4%) |
| 25 to 34 Years | 702 (91.6%) | 614 (75.5%) |
| 35 to 44 Years | 736 (82.7%) | 829 (86.7%) |
| 45 to 54 Years | 863 (81.6%) | 855 (83.7%) |
| 55 to 64 Years | 1,072 (85.8%) | 1,105 (81.1%) |
| 65 to 74 Years | 1,082 (90.8%) | 1,171 (88.2%) |
| 75 Years and over | 782 (93.4%) | 848 (88.9%) |
| Total | 7,281 (86.0%) | 7,115 (82.2%) |
Income Below Poverty Among Married-Couple Families in Sharp County
The poverty statistics for married-couple families in Sharp County show that 4.3% or 150 of the total 3,490 families live below the poverty line. Families with 5 or more children have the highest poverty rate of 61.1%, comprising of 22 families. On the other hand, families with 1 or 2 children have the lowest poverty rate of 2.4%, which includes 24 families.
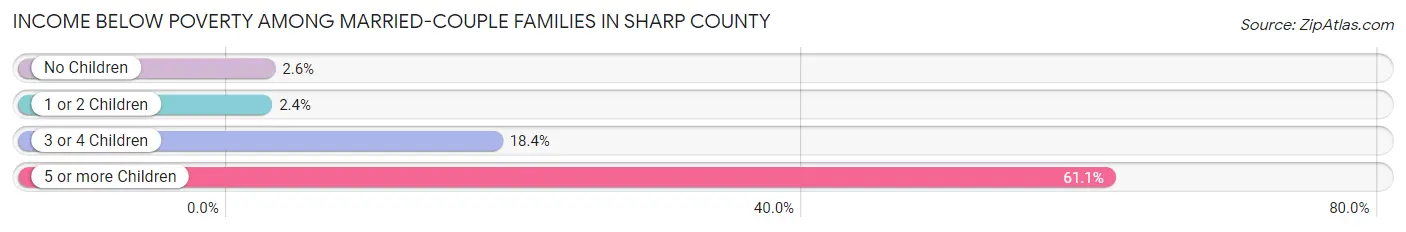
| Children | Above Poverty | Below Poverty |
| No Children | 2,134 (97.4%) | 57 (2.6%) |
| 1 or 2 Children | 984 (97.6%) | 24 (2.4%) |
| 3 or 4 Children | 208 (81.6%) | 47 (18.4%) |
| 5 or more Children | 14 (38.9%) | 22 (61.1%) |
| Total | 3,340 (95.7%) | 150 (4.3%) |
Income Below Poverty Among Single-Parent Households in Sharp County
According to the poverty data in Sharp County, 24.0% or 75 single-father households and 36.2% or 293 single-mother households are living below the poverty line. Among single-father households, those with 1 or 2 children have the highest poverty rate, with 58 households (30.4%) experiencing poverty. Likewise, among single-mother households, those with 5 or more children have the highest poverty rate, with 3 households (100.0%) falling below the poverty line.

| Children | Single Father | Single Mother |
| No Children | 17 (14.7%) | 74 (22.6%) |
| 1 or 2 Children | 58 (30.4%) | 151 (39.6%) |
| 3 or 4 Children | 0 (0.0%) | 65 (67.0%) |
| 5 or more Children | 0 (0.0%) | 3 (100.0%) |
| Total | 75 (24.0%) | 293 (36.2%) |
Income Below Poverty Among Married-Couple vs Single-Parent Households in Sharp County
The poverty data for Sharp County shows that 150 of the married-couple family households (4.3%) and 368 of the single-parent households (32.8%) are living below the poverty level. Within the married-couple family households, those with 5 or more children have the highest poverty rate, with 22 households (61.1%) falling below the poverty line. Among the single-parent households, those with 5 or more children have the highest poverty rate, with 3 household (100.0%) living below poverty.
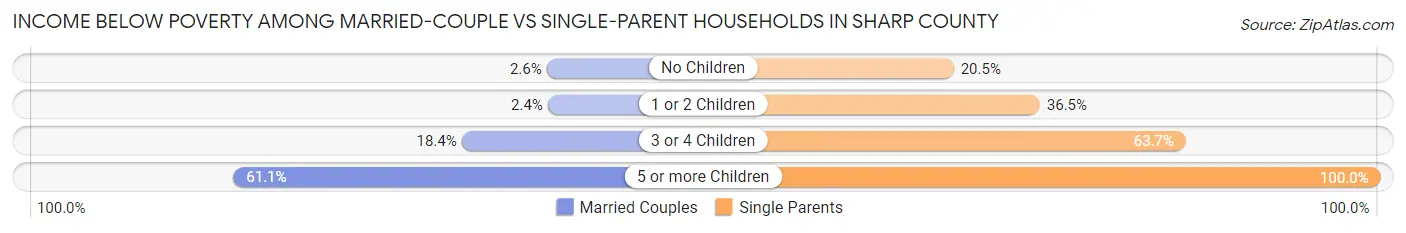
| Children | Married-Couple Families | Single-Parent Households |
| No Children | 57 (2.6%) | 91 (20.5%) |
| 1 or 2 Children | 24 (2.4%) | 209 (36.5%) |
| 3 or 4 Children | 47 (18.4%) | 65 (63.7%) |
| 5 or more Children | 22 (61.1%) | 3 (100.0%) |
| Total | 150 (4.3%) | 368 (32.8%) |
Race in Sharp County
The most populous races in Sharp County are White / Caucasian (16,111 | 92.5%), Two or more Races (810 | 4.6%), and Hispanic or Latino (446 | 2.6%).
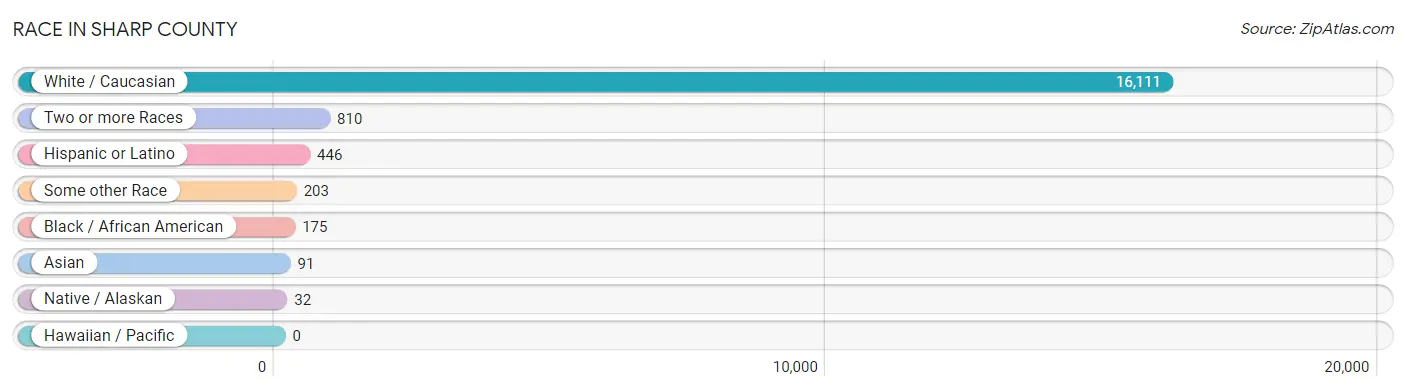
| Race | # Population | % Population |
| Asian | 91 | 0.5% |
| Black / African American | 175 | 1.0% |
| Hawaiian / Pacific | 0 | 0.0% |
| Hispanic or Latino | 446 | 2.6% |
| Native / Alaskan | 32 | 0.2% |
| White / Caucasian | 16,111 | 92.5% |
| Two or more Races | 810 | 4.6% |
| Some other Race | 203 | 1.2% |
| Total | 17,422 | 100.0% |
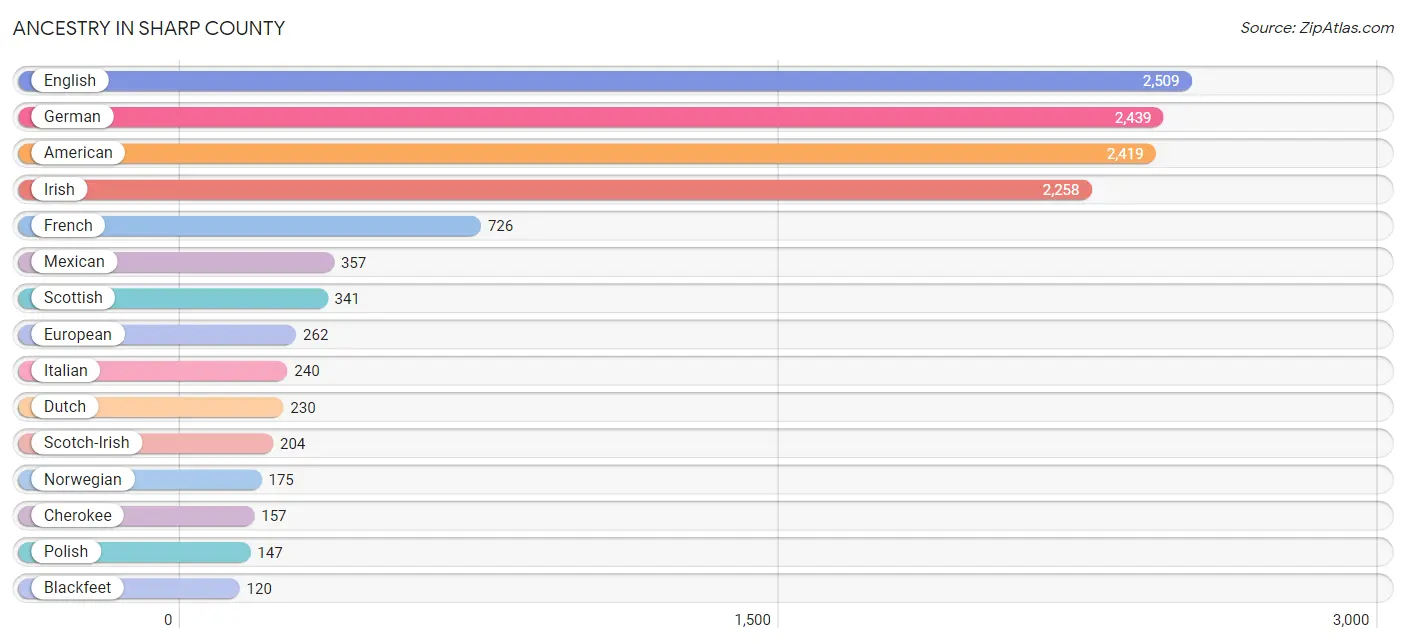
Ancestry in Sharp County
The most populous ancestries reported in Sharp County are English (2,509 | 14.4%), German (2,439 | 14.0%), American (2,419 | 13.9%), Irish (2,258 | 13.0%), and French (726 | 4.2%), together accounting for 59.4% of all Sharp County residents.
| Ancestry | # Population | % Population |
| American | 2,419 | 13.9% |
| Austrian | 6 | 0.0% |
| Belgian | 8 | 0.1% |
| Bhutanese | 11 | 0.1% |
| Blackfeet | 120 | 0.7% |
| British | 42 | 0.2% |
| Bulgarian | 6 | 0.0% |
| Burmese | 28 | 0.2% |
| Canadian | 3 | 0.0% |
| Central American | 35 | 0.2% |
| Cherokee | 157 | 0.9% |
| Cheyenne | 1 | 0.0% |
| Choctaw | 21 | 0.1% |
| Comanche | 3 | 0.0% |
| Cuban | 28 | 0.2% |
| Czech | 33 | 0.2% |
| Danish | 9 | 0.1% |
| Dutch | 230 | 1.3% |
| Dutch West Indian | 2 | 0.0% |
| English | 2,509 | 14.4% |
| European | 262 | 1.5% |
| Finnish | 73 | 0.4% |
| French | 726 | 4.2% |
| French Canadian | 20 | 0.1% |
| German | 2,439 | 14.0% |
| Guatemalan | 35 | 0.2% |
| Hungarian | 25 | 0.1% |
| Indian (Asian) | 31 | 0.2% |
| Irish | 2,258 | 13.0% |
| Iroquois | 1 | 0.0% |
| Italian | 240 | 1.4% |
| Korean | 31 | 0.2% |
| Lithuanian | 5 | 0.0% |
| Lumbee | 3 | 0.0% |
| Mexican | 357 | 2.1% |
| Norwegian | 175 | 1.0% |
| Pima | 4 | 0.0% |
| Polish | 147 | 0.8% |
| Portuguese | 33 | 0.2% |
| Puerto Rican | 26 | 0.2% |
| Romanian | 5 | 0.0% |
| Russian | 34 | 0.2% |
| Scandinavian | 46 | 0.3% |
| Scotch-Irish | 204 | 1.2% |
| Scottish | 341 | 2.0% |
| Seminole | 1 | 0.0% |
| Sri Lankan | 25 | 0.1% |
| Swedish | 109 | 0.6% |
| Welsh | 41 | 0.2% |
| Yugoslavian | 3 | 0.0% | View All 50 Rows |
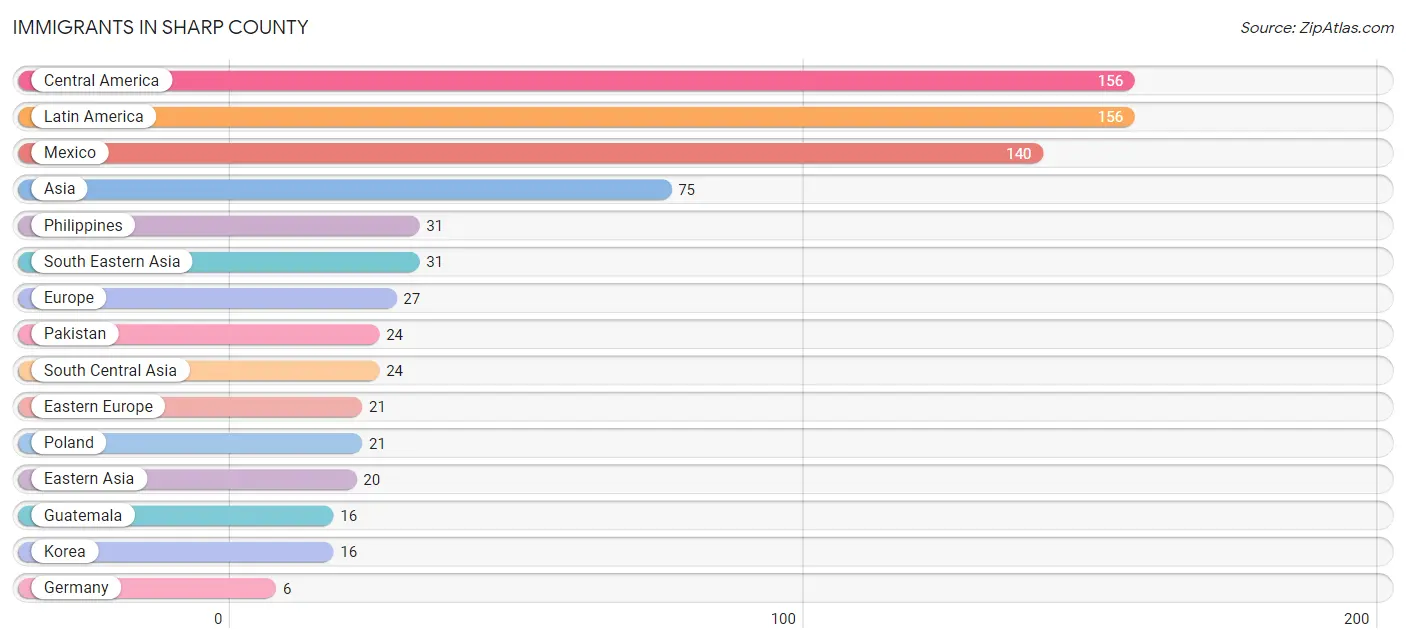
Immigrants in Sharp County
The most numerous immigrant groups reported in Sharp County came from Central America (156 | 0.9%), Latin America (156 | 0.9%), Mexico (140 | 0.8%), Asia (75 | 0.4%), and Philippines (31 | 0.2%), together accounting for 3.2% of all Sharp County residents.
| Immigration Origin | # Population | % Population |
| Asia | 75 | 0.4% |
| Canada | 5 | 0.0% |
| Central America | 156 | 0.9% |
| Eastern Asia | 20 | 0.1% |
| Eastern Europe | 21 | 0.1% |
| Europe | 27 | 0.2% |
| Germany | 6 | 0.0% |
| Guatemala | 16 | 0.1% |
| Japan | 4 | 0.0% |
| Korea | 16 | 0.1% |
| Latin America | 156 | 0.9% |
| Mexico | 140 | 0.8% |
| Pakistan | 24 | 0.1% |
| Philippines | 31 | 0.2% |
| Poland | 21 | 0.1% |
| South Central Asia | 24 | 0.1% |
| South Eastern Asia | 31 | 0.2% |
| Western Europe | 6 | 0.0% | View All 18 Rows |
Sex and Age in Sharp County
Sex and Age in Sharp County
The most populous age groups in Sharp County are 55 to 59 Years (715 | 8.4%) for men and 60 to 64 Years (731 | 8.3%) for women.
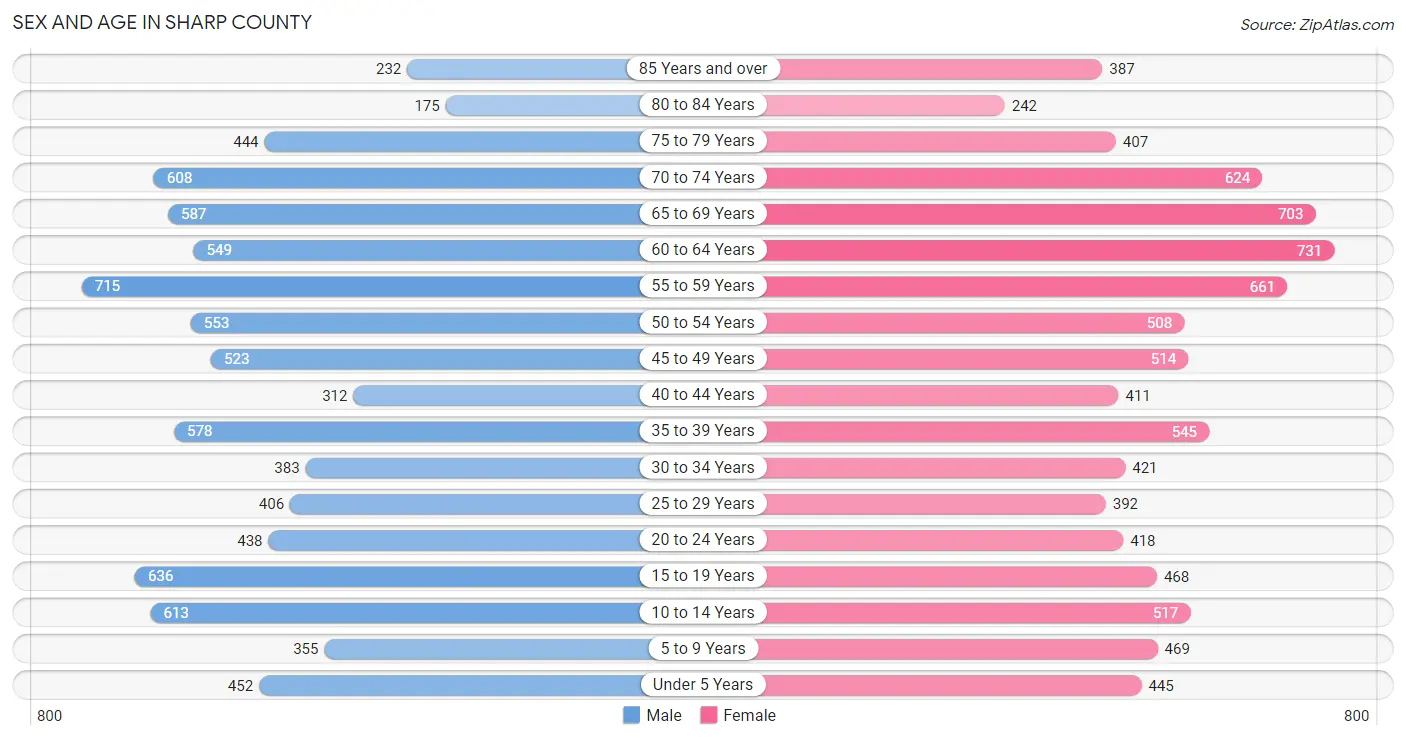
| Age Bracket | Male | Female |
| Under 5 Years | 452 (5.3%) | 445 (5.0%) |
| 5 to 9 Years | 355 (4.2%) | 469 (5.3%) |
| 10 to 14 Years | 613 (7.2%) | 517 (5.8%) |
| 15 to 19 Years | 636 (7.4%) | 468 (5.3%) |
| 20 to 24 Years | 438 (5.1%) | 418 (4.7%) |
| 25 to 29 Years | 406 (4.7%) | 392 (4.4%) |
| 30 to 34 Years | 383 (4.5%) | 421 (4.8%) |
| 35 to 39 Years | 578 (6.8%) | 545 (6.1%) |
| 40 to 44 Years | 312 (3.6%) | 411 (4.6%) |
| 45 to 49 Years | 523 (6.1%) | 514 (5.8%) |
| 50 to 54 Years | 553 (6.5%) | 508 (5.7%) |
| 55 to 59 Years | 715 (8.4%) | 661 (7.5%) |
| 60 to 64 Years | 549 (6.4%) | 731 (8.3%) |
| 65 to 69 Years | 587 (6.9%) | 703 (7.9%) |
| 70 to 74 Years | 608 (7.1%) | 624 (7.0%) |
| 75 to 79 Years | 444 (5.2%) | 407 (4.6%) |
| 80 to 84 Years | 175 (2.0%) | 242 (2.7%) |
| 85 Years and over | 232 (2.7%) | 387 (4.4%) |
| Total | 8,559 (100.0%) | 8,863 (100.0%) |
Families and Households in Sharp County
Median Family Size in Sharp County
The median family size in Sharp County is 3.07 persons per family, with single female/mother families (809 | 17.5%) accounting for the largest median family size of 3.31 persons per family. On the other hand, married-couple families (3,490 | 75.7%) represent the smallest median family size with 3.02 persons per family.
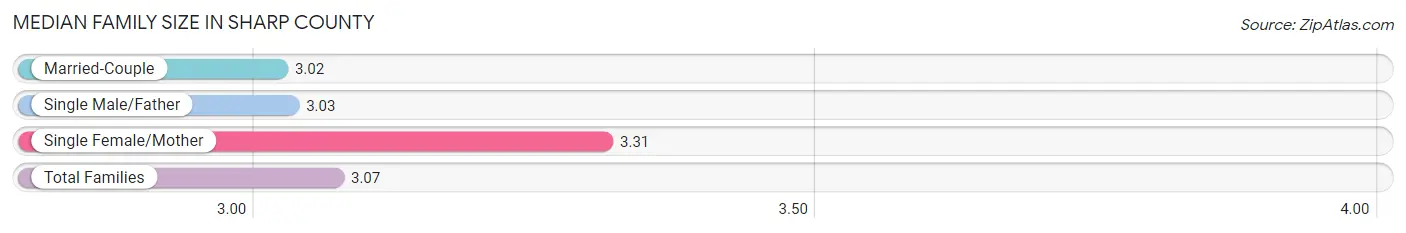
| Family Type | # Families | Family Size |
| Married-Couple | 3,490 (75.7%) | 3.02 |
| Single Male/Father | 312 (6.8%) | 3.03 |
| Single Female/Mother | 809 (17.5%) | 3.31 |
| Total Families | 4,611 (100.0%) | 3.07 |
Median Household Size in Sharp County
The median household size in Sharp County is 2.49 persons per household, with single female/mother households (809 | 11.7%) accounting for the largest median household size of 3.5 persons per household. non-family households (2,290 | 33.2%) represent the smallest median household size with 1.17 persons per household.
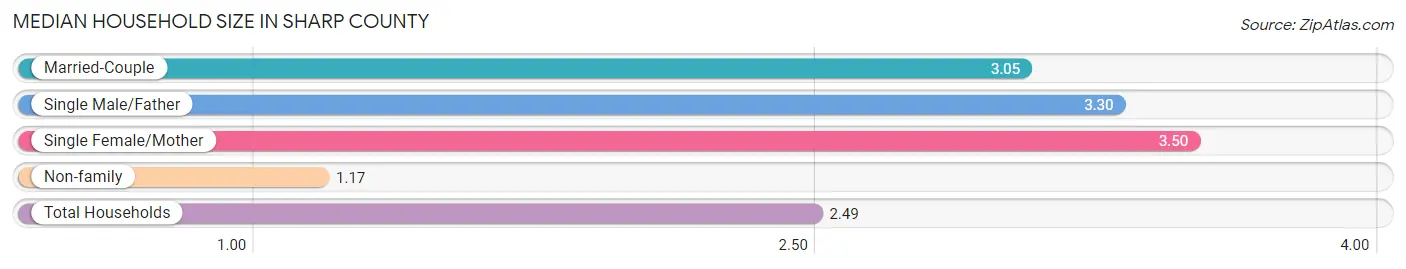
| Household Type | # Households | Household Size |
| Married-Couple | 3,490 (50.6%) | 3.05 |
| Single Male/Father | 312 (4.5%) | 3.30 |
| Single Female/Mother | 809 (11.7%) | 3.50 |
| Non-family | 2,290 (33.2%) | 1.17 |
| Total Households | 6,901 (100.0%) | 2.49 |
Household Size by Marriage Status in Sharp County
Out of a total of 6,901 households in Sharp County, 4,611 (66.8%) are family households, while 2,290 (33.2%) are nonfamily households. The most numerous type of family households are 2-person households, comprising 2,233, and the most common type of nonfamily households are 1-person households, comprising 2,001.
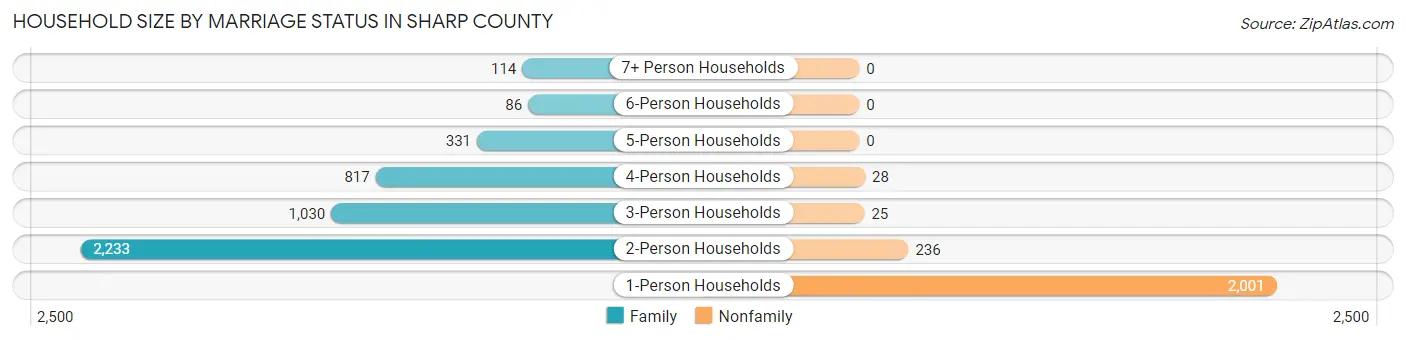
| Household Size | Family Households | Nonfamily Households |
| 1-Person Households | - | 2,001 (29.0%) |
| 2-Person Households | 2,233 (32.4%) | 236 (3.4%) |
| 3-Person Households | 1,030 (14.9%) | 25 (0.4%) |
| 4-Person Households | 817 (11.8%) | 28 (0.4%) |
| 5-Person Households | 331 (4.8%) | 0 (0.0%) |
| 6-Person Households | 86 (1.3%) | 0 (0.0%) |
| 7+ Person Households | 114 (1.7%) | 0 (0.0%) |
| Total | 4,611 (66.8%) | 2,290 (33.2%) |
Female Fertility in Sharp County
Fertility by Age in Sharp County
Average fertility rate in Sharp County is 64.0 births per 1,000 women. Women in the age bracket of 20 to 34 years have the highest fertility rate with 148.0 births per 1,000 women. Women in the age bracket of 20 to 34 years acount for 87.5% of all women with births.
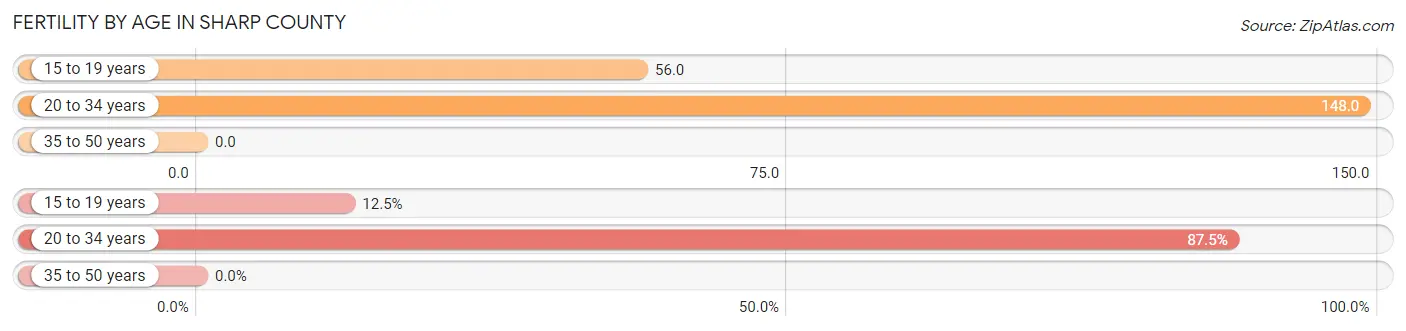
| Age Bracket | Women with Births | Births / 1,000 Women |
| 15 to 19 years | 26 (12.5%) | 56.0 |
| 20 to 34 years | 182 (87.5%) | 148.0 |
| 35 to 50 years | 0 (0.0%) | 0.0 |
| Total | 208 (100.0%) | 64.0 |
Fertility by Age by Marriage Status in Sharp County
38.5% of women with births (208) in Sharp County are married. The highest percentage of unmarried women with births falls into 15 to 19 years age bracket with 100.0% of them unmarried at the time of birth, while the lowest percentage of unmarried women with births belong to 20 to 34 years age bracket with 56.0% of them unmarried.
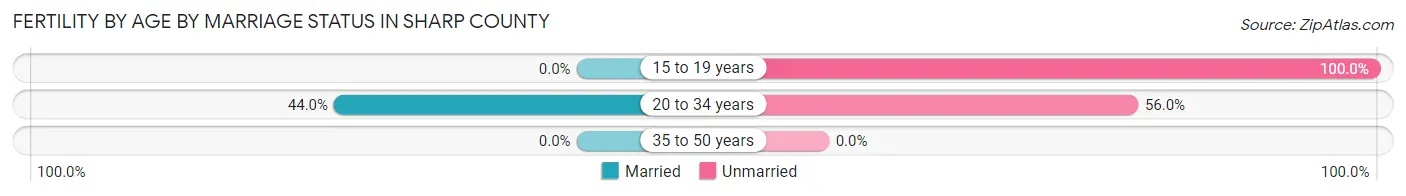
| Age Bracket | Married | Unmarried |
| 15 to 19 years | 0 (0.0%) | 26 (100.0%) |
| 20 to 34 years | 80 (44.0%) | 102 (56.0%) |
| 35 to 50 years | 0 (0.0%) | 0 (0.0%) |
| Total | 80 (38.5%) | 128 (61.5%) |
Fertility by Education in Sharp County
Average fertility rate in Sharp County is 64.0 births per 1,000 women. Women with the education attainment of high school diploma have the highest fertility rate of 131.0 births per 1,000 women, while women with the education attainment of bachelor's degree have the lowest fertility at 7.0 births per 1,000 women. Women with the education attainment of high school diploma represent 56.2% of all women with births.
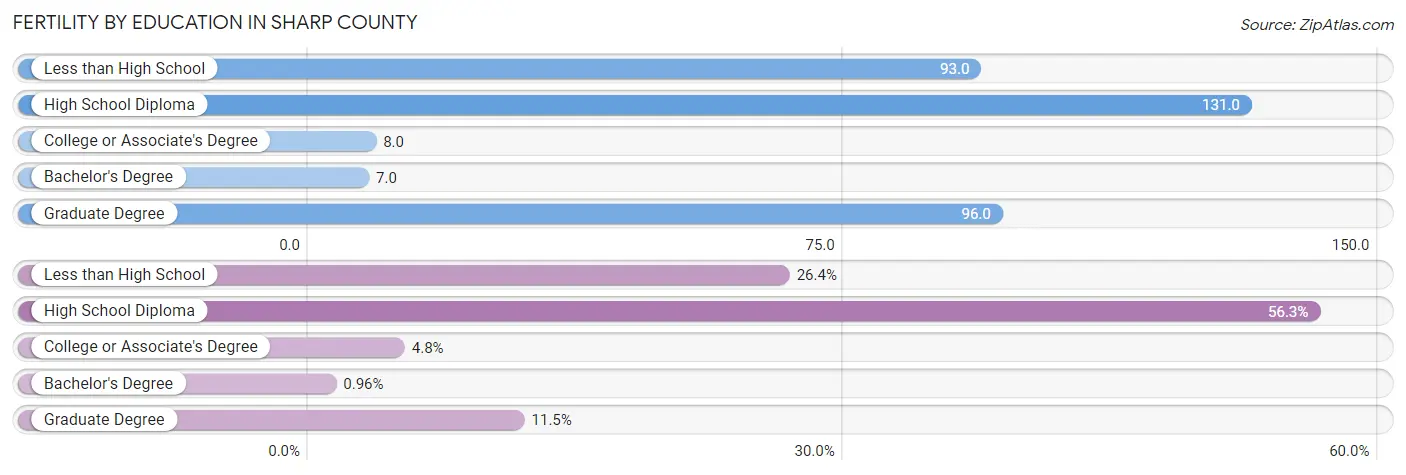
| Educational Attainment | Women with Births | Births / 1,000 Women |
| Less than High School | 55 (26.4%) | 93.0 |
| High School Diploma | 117 (56.2%) | 131.0 |
| College or Associate's Degree | 10 (4.8%) | 8.0 |
| Bachelor's Degree | 2 (1.0%) | 7.0 |
| Graduate Degree | 24 (11.5%) | 96.0 |
| Total | 208 (100.0%) | 64.0 |
Fertility by Education by Marriage Status in Sharp County
61.5% of women with births in Sharp County are unmarried. Women with the educational attainment of bachelor's degree are most likely to be married with 100.0% of them married at childbirth, while women with the educational attainment of less than high school are least likely to be married with 100.0% of them unmarried at childbirth.
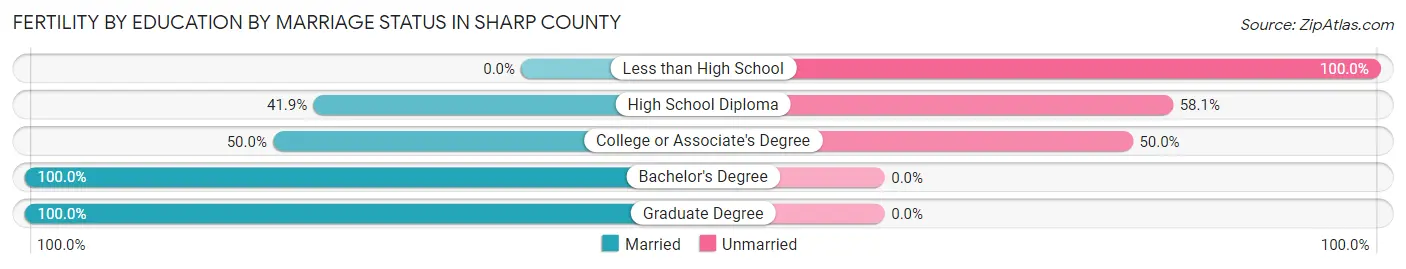
| Educational Attainment | Married | Unmarried |
| Less than High School | 0 (0.0%) | 55 (100.0%) |
| High School Diploma | 49 (41.9%) | 68 (58.1%) |
| College or Associate's Degree | 5 (50.0%) | 5 (50.0%) |
| Bachelor's Degree | 2 (100.0%) | 0 (0.0%) |
| Graduate Degree | 24 (100.0%) | 0 (0.0%) |
| Total | 80 (38.5%) | 128 (61.5%) |
Employment Characteristics in Sharp County
Employment by Class of Employer in Sharp County
Among the 6,216 employed individuals in Sharp County, private company employees (4,177 | 67.2%), self-employed (not incorporated) (529 | 8.5%), and local government employees (504 | 8.1%) make up the most common classes of employment.
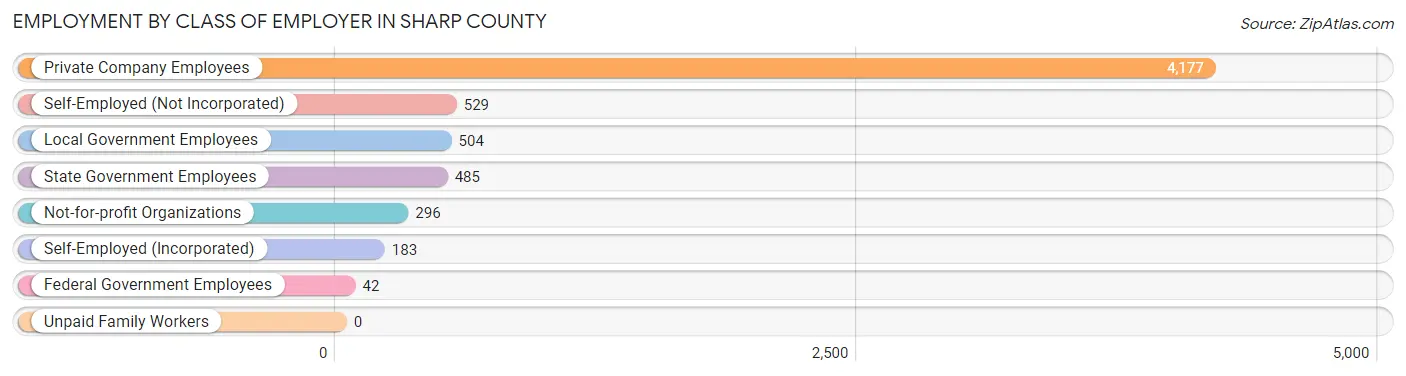
| Employer Class | # Employees | % Employees |
| Private Company Employees | 4,177 | 67.2% |
| Self-Employed (Incorporated) | 183 | 2.9% |
| Self-Employed (Not Incorporated) | 529 | 8.5% |
| Not-for-profit Organizations | 296 | 4.8% |
| Local Government Employees | 504 | 8.1% |
| State Government Employees | 485 | 7.8% |
| Federal Government Employees | 42 | 0.7% |
| Unpaid Family Workers | 0 | 0.0% |
| Total | 6,216 | 100.0% |
Employment Status by Age in Sharp County
According to the labor force statistics for Sharp County, out of the total population over 16 years of age (14,263), 47.0% or 6,704 individuals are in the labor force, with 6.2% or 416 of them unemployed. The age group with the highest labor force participation rate is 25 to 29 years, with 89.6% or 715 individuals in the labor force. Within the labor force, the 16 to 19 years age range has the highest percentage of unemployed individuals, with 12.5% or 36 of them being unemployed.
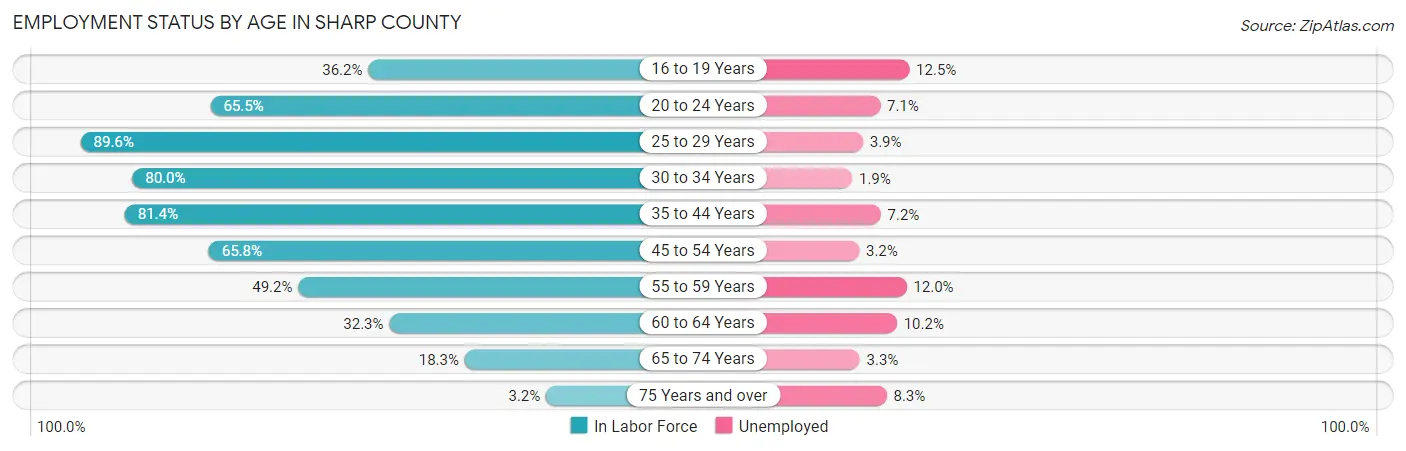
| Age Bracket | In Labor Force | Unemployed |
| 16 to 19 Years | 288 (36.2%) | 36 (12.5%) |
| 20 to 24 Years | 561 (65.5%) | 40 (7.1%) |
| 25 to 29 Years | 715 (89.6%) | 28 (3.9%) |
| 30 to 34 Years | 643 (80.0%) | 12 (1.9%) |
| 35 to 44 Years | 1,503 (81.4%) | 108 (7.2%) |
| 45 to 54 Years | 1,380 (65.8%) | 44 (3.2%) |
| 55 to 59 Years | 677 (49.2%) | 81 (12.0%) |
| 60 to 64 Years | 413 (32.3%) | 42 (10.2%) |
| 65 to 74 Years | 462 (18.3%) | 15 (3.3%) |
| 75 Years and over | 60 (3.2%) | 5 (8.3%) |
| Total | 6,704 (47.0%) | 416 (6.2%) |
Employment Status by Educational Attainment in Sharp County
According to labor force statistics for Sharp County, 65.0% of individuals (5,331) out of the total population between 25 and 64 years of age (8,202) are in the labor force, with 5.9% or 315 of them being unemployed. The group with the highest labor force participation rate are those with the educational attainment of bachelor's degree or higher, with 83.0% or 881 individuals in the labor force. Within the labor force, individuals with college / associate degree education have the highest percentage of unemployment, with 8.1% or 149 of them being unemployed.
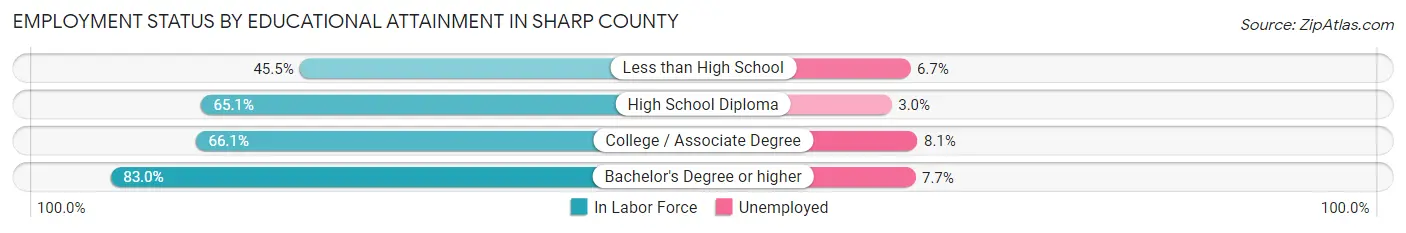
| Educational Attainment | In Labor Force | Unemployed |
| Less than High School | 523 (45.5%) | 77 (6.7%) |
| High School Diploma | 2,091 (65.1%) | 96 (3.0%) |
| College / Associate Degree | 1,837 (66.1%) | 225 (8.1%) |
| Bachelor's Degree or higher | 881 (83.0%) | 82 (7.7%) |
| Total | 5,331 (65.0%) | 484 (5.9%) |
Employment Occupations by Sex in Sharp County
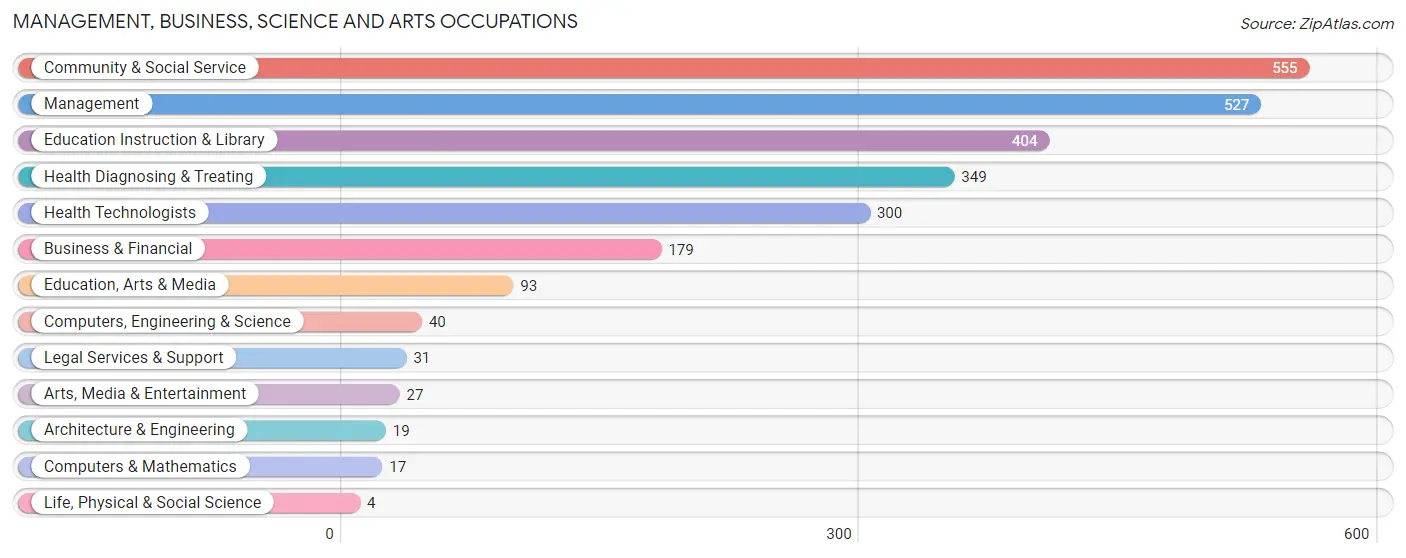
Management, Business, Science and Arts Occupations
The most common Management, Business, Science and Arts occupations in Sharp County are Community & Social Service (555 | 8.8%), Management (527 | 8.4%), Education Instruction & Library (404 | 6.5%), Health Diagnosing & Treating (349 | 5.6%), and Health Technologists (300 | 4.8%).
Management, Business, Science and Arts Occupations by Sex
Within the Management, Business, Science and Arts occupations in Sharp County, the most male-oriented occupations are Architecture & Engineering (100.0%), Computers, Engineering & Science (80.0%), and Computers & Mathematics (76.5%), while the most female-oriented occupations are Life, Physical & Social Science (100.0%), Health Technologists (89.7%), and Health Diagnosing & Treating (88.8%).
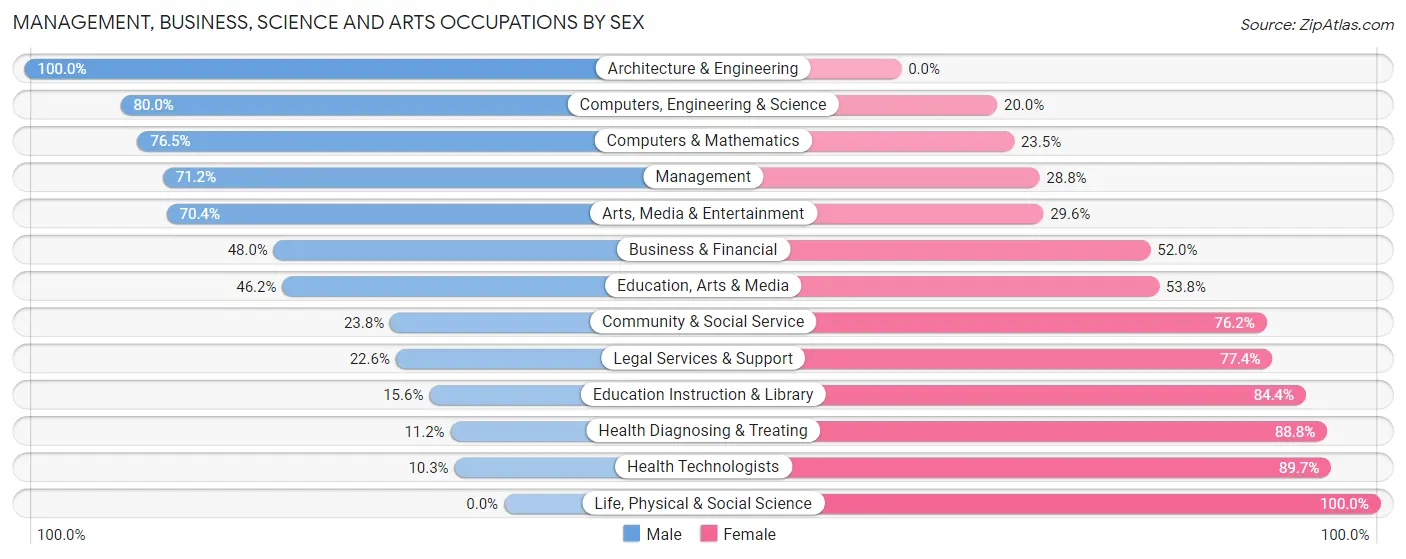
| Occupation | Male | Female |
| Management | 375 (71.2%) | 152 (28.8%) |
| Business & Financial | 86 (48.0%) | 93 (52.0%) |
| Computers, Engineering & Science | 32 (80.0%) | 8 (20.0%) |
| Computers & Mathematics | 13 (76.5%) | 4 (23.5%) |
| Architecture & Engineering | 19 (100.0%) | 0 (0.0%) |
| Life, Physical & Social Science | 0 (0.0%) | 4 (100.0%) |
| Community & Social Service | 132 (23.8%) | 423 (76.2%) |
| Education, Arts & Media | 43 (46.2%) | 50 (53.8%) |
| Legal Services & Support | 7 (22.6%) | 24 (77.4%) |
| Education Instruction & Library | 63 (15.6%) | 341 (84.4%) |
| Arts, Media & Entertainment | 19 (70.4%) | 8 (29.6%) |
| Health Diagnosing & Treating | 39 (11.2%) | 310 (88.8%) |
| Health Technologists | 31 (10.3%) | 269 (89.7%) |
| Total (Category) | 664 (40.2%) | 986 (59.8%) |
| Total (Overall) | 3,320 (53.0%) | 2,948 (47.0%) |
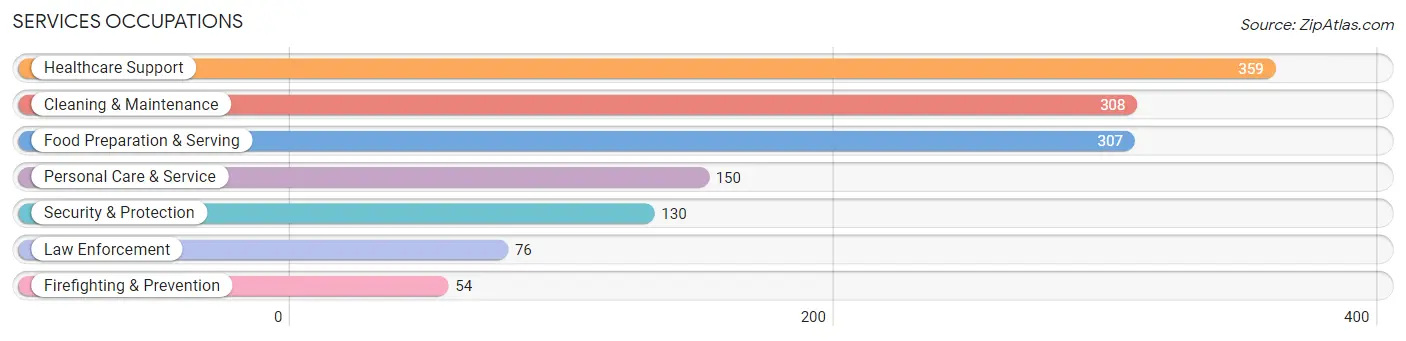
Services Occupations
The most common Services occupations in Sharp County are Healthcare Support (359 | 5.7%), Cleaning & Maintenance (308 | 4.9%), Food Preparation & Serving (307 | 4.9%), Personal Care & Service (150 | 2.4%), and Security & Protection (130 | 2.1%).
Services Occupations by Sex
Within the Services occupations in Sharp County, the most male-oriented occupations are Law Enforcement (89.5%), Security & Protection (89.2%), and Firefighting & Prevention (88.9%), while the most female-oriented occupations are Personal Care & Service (100.0%), Healthcare Support (94.2%), and Food Preparation & Serving (82.1%).
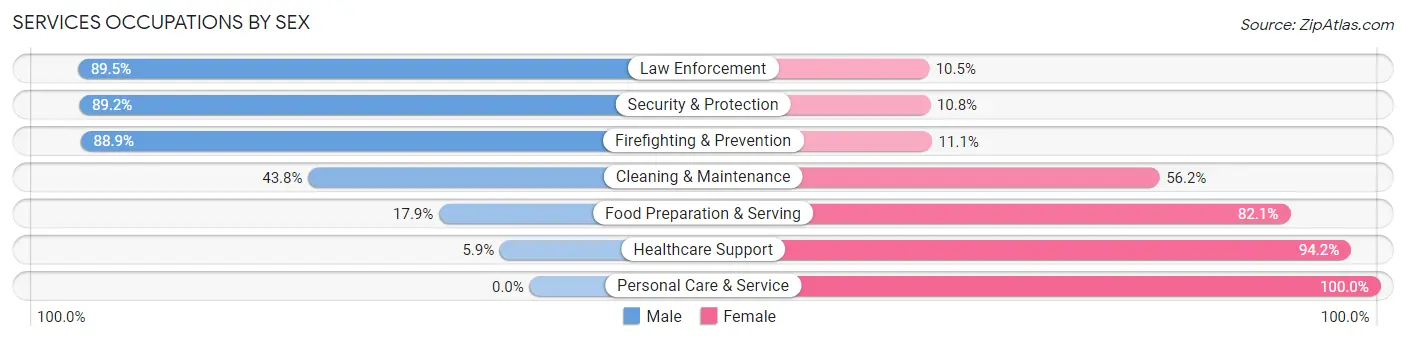
| Occupation | Male | Female |
| Healthcare Support | 21 (5.9%) | 338 (94.2%) |
| Security & Protection | 116 (89.2%) | 14 (10.8%) |
| Firefighting & Prevention | 48 (88.9%) | 6 (11.1%) |
| Law Enforcement | 68 (89.5%) | 8 (10.5%) |
| Food Preparation & Serving | 55 (17.9%) | 252 (82.1%) |
| Cleaning & Maintenance | 135 (43.8%) | 173 (56.2%) |
| Personal Care & Service | 0 (0.0%) | 150 (100.0%) |
| Total (Category) | 327 (26.1%) | 927 (73.9%) |
| Total (Overall) | 3,320 (53.0%) | 2,948 (47.0%) |
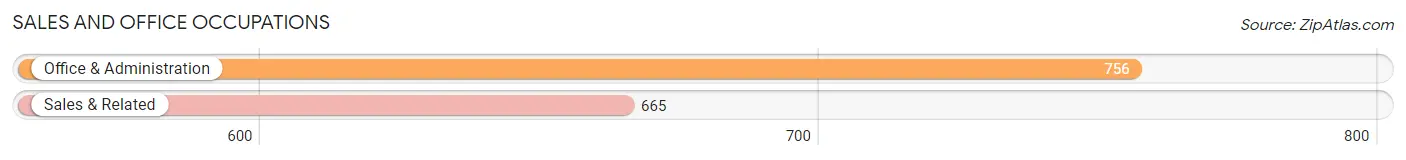
Sales and Office Occupations
The most common Sales and Office occupations in Sharp County are Office & Administration (756 | 12.1%), and Sales & Related (665 | 10.6%).
Sales and Office Occupations by Sex
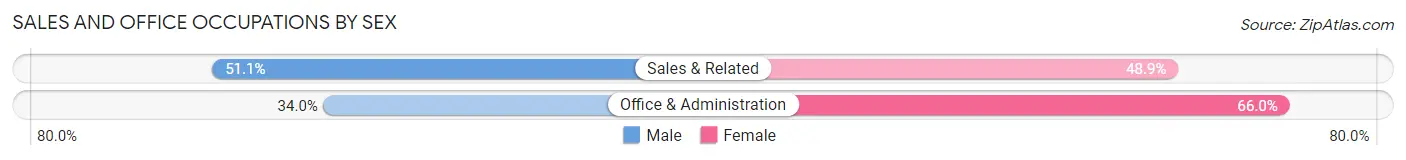
| Occupation | Male | Female |
| Sales & Related | 340 (51.1%) | 325 (48.9%) |
| Office & Administration | 257 (34.0%) | 499 (66.0%) |
| Total (Category) | 597 (42.0%) | 824 (58.0%) |
| Total (Overall) | 3,320 (53.0%) | 2,948 (47.0%) |
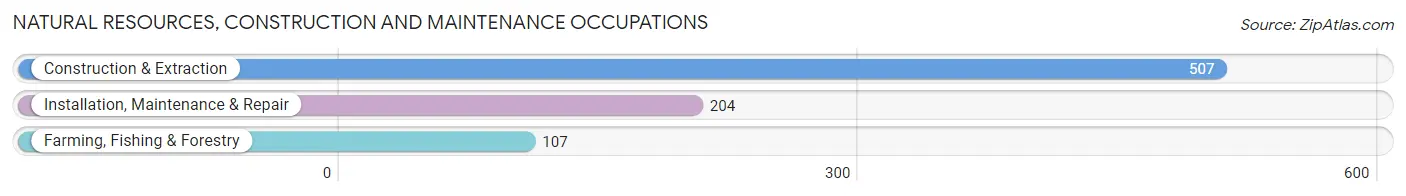
Natural Resources, Construction and Maintenance Occupations
The most common Natural Resources, Construction and Maintenance occupations in Sharp County are Construction & Extraction (507 | 8.1%), Installation, Maintenance & Repair (204 | 3.3%), and Farming, Fishing & Forestry (107 | 1.7%).
Natural Resources, Construction and Maintenance Occupations by Sex
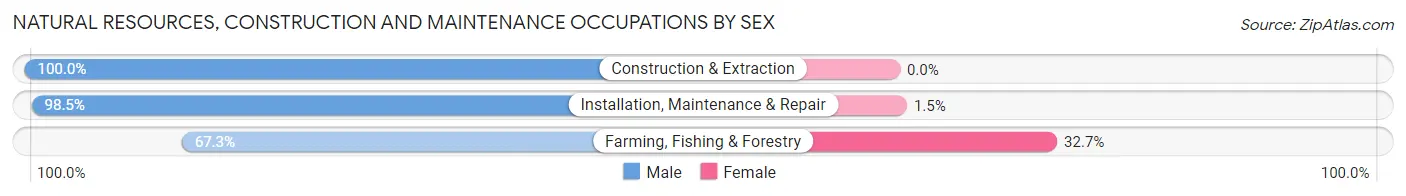
| Occupation | Male | Female |
| Farming, Fishing & Forestry | 72 (67.3%) | 35 (32.7%) |
| Construction & Extraction | 507 (100.0%) | 0 (0.0%) |
| Installation, Maintenance & Repair | 201 (98.5%) | 3 (1.5%) |
| Total (Category) | 780 (95.4%) | 38 (4.6%) |
| Total (Overall) | 3,320 (53.0%) | 2,948 (47.0%) |
Production, Transportation and Moving Occupations
The most common Production, Transportation and Moving occupations in Sharp County are Production (456 | 7.3%), Transportation (442 | 7.0%), and Material Moving (227 | 3.6%).
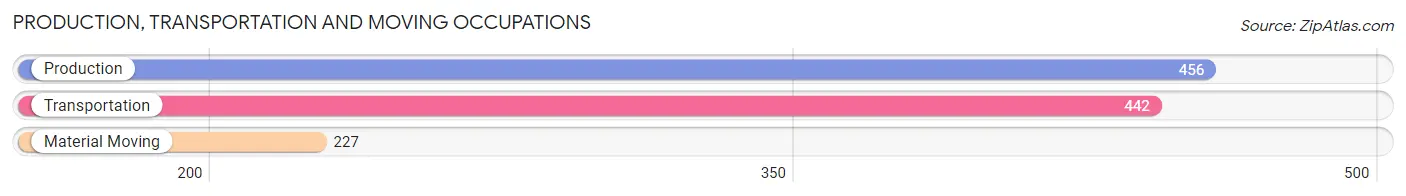
Production, Transportation and Moving Occupations by Sex
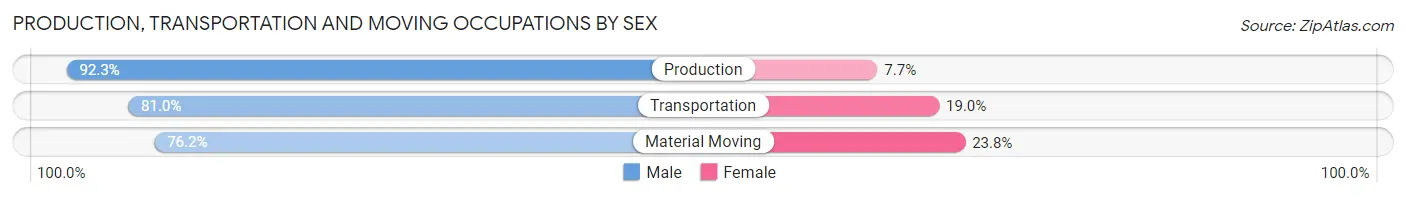
| Occupation | Male | Female |
| Production | 421 (92.3%) | 35 (7.7%) |
| Transportation | 358 (81.0%) | 84 (19.0%) |
| Material Moving | 173 (76.2%) | 54 (23.8%) |
| Total (Category) | 952 (84.6%) | 173 (15.4%) |
| Total (Overall) | 3,320 (53.0%) | 2,948 (47.0%) |
Employment Industries by Sex in Sharp County
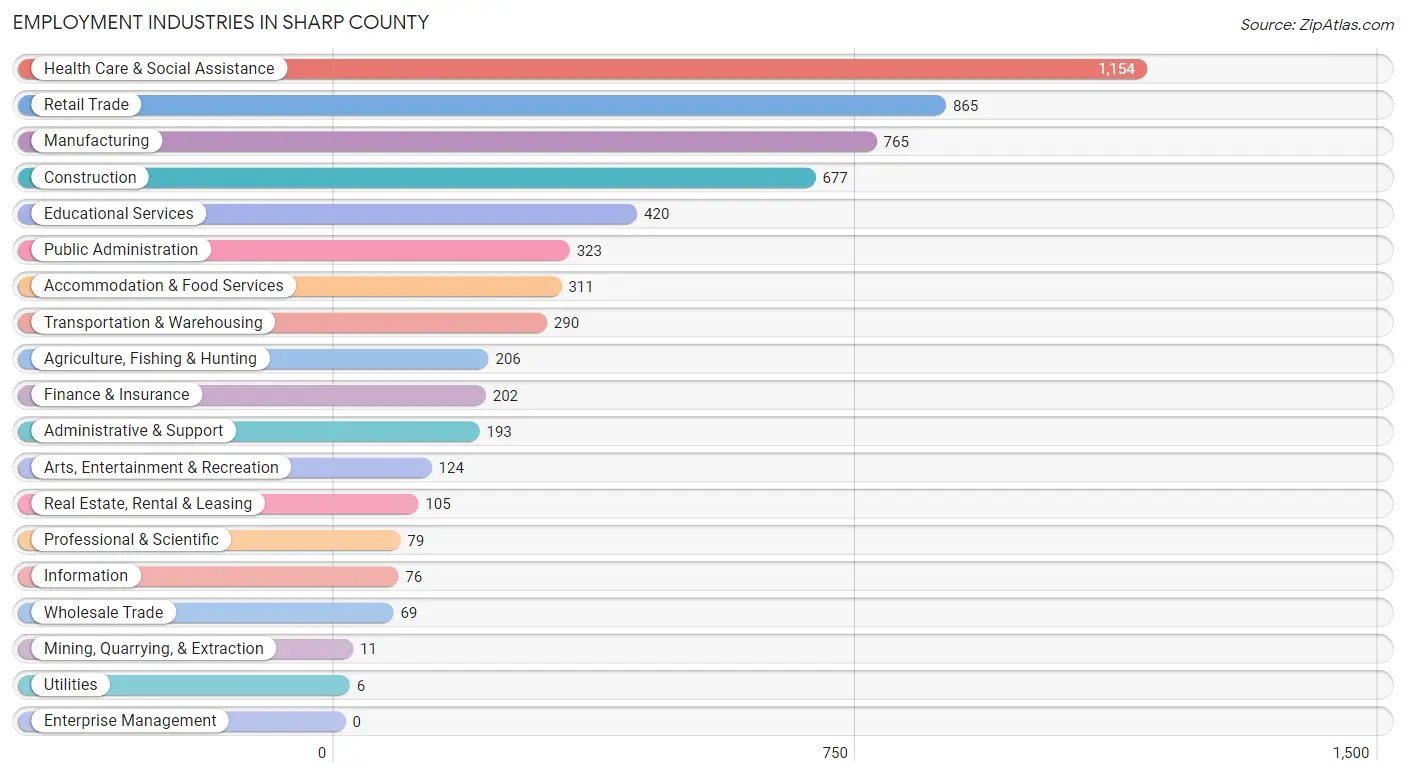
Employment Industries in Sharp County
The major employment industries in Sharp County include Health Care & Social Assistance (1,154 | 18.4%), Retail Trade (865 | 13.8%), Manufacturing (765 | 12.2%), Construction (677 | 10.8%), and Educational Services (420 | 6.7%).
Employment Industries by Sex in Sharp County
The Sharp County industries that see more men than women are Mining, Quarrying, & Extraction (100.0%), Wholesale Trade (100.0%), and Utilities (100.0%), whereas the industries that tend to have a higher number of women are Health Care & Social Assistance (90.4%), Educational Services (77.1%), and Retail Trade (65.9%).
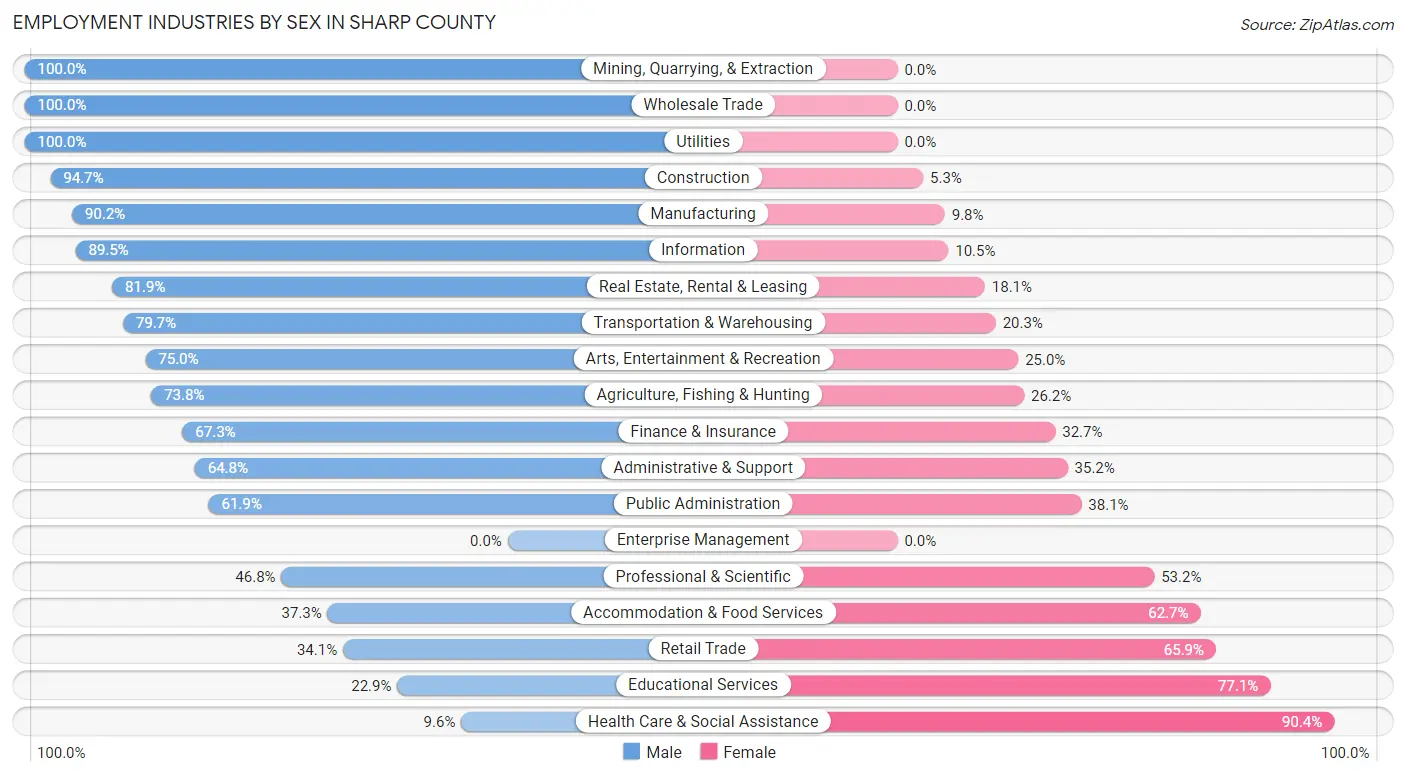
| Industry | Male | Female |
| Agriculture, Fishing & Hunting | 152 (73.8%) | 54 (26.2%) |
| Mining, Quarrying, & Extraction | 11 (100.0%) | 0 (0.0%) |
| Construction | 641 (94.7%) | 36 (5.3%) |
| Manufacturing | 690 (90.2%) | 75 (9.8%) |
| Wholesale Trade | 69 (100.0%) | 0 (0.0%) |
| Retail Trade | 295 (34.1%) | 570 (65.9%) |
| Transportation & Warehousing | 231 (79.7%) | 59 (20.3%) |
| Utilities | 6 (100.0%) | 0 (0.0%) |
| Information | 68 (89.5%) | 8 (10.5%) |
| Finance & Insurance | 136 (67.3%) | 66 (32.7%) |
| Real Estate, Rental & Leasing | 86 (81.9%) | 19 (18.1%) |
| Professional & Scientific | 37 (46.8%) | 42 (53.2%) |
| Enterprise Management | 0 (0.0%) | 0 (0.0%) |
| Administrative & Support | 125 (64.8%) | 68 (35.2%) |
| Educational Services | 96 (22.9%) | 324 (77.1%) |
| Health Care & Social Assistance | 111 (9.6%) | 1,043 (90.4%) |
| Arts, Entertainment & Recreation | 93 (75.0%) | 31 (25.0%) |
| Accommodation & Food Services | 116 (37.3%) | 195 (62.7%) |
| Public Administration | 200 (61.9%) | 123 (38.1%) |
| Total | 3,320 (53.0%) | 2,948 (47.0%) |
Education in Sharp County
School Enrollment in Sharp County
The most common levels of schooling among the 3,470 students in Sharp County are high school (932 | 26.9%), middle school (837 | 24.1%), and elementary school (805 | 23.2%).
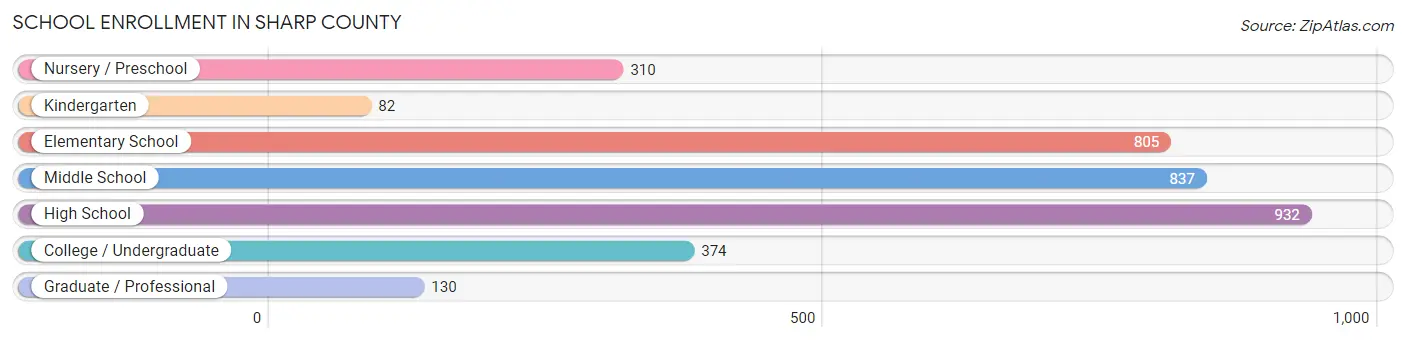
| School Level | # Students | % Students |
| Nursery / Preschool | 310 | 8.9% |
| Kindergarten | 82 | 2.4% |
| Elementary School | 805 | 23.2% |
| Middle School | 837 | 24.1% |
| High School | 932 | 26.9% |
| College / Undergraduate | 374 | 10.8% |
| Graduate / Professional | 130 | 3.7% |
| Total | 3,470 | 100.0% |
School Enrollment by Age by Funding Source in Sharp County
Out of a total of 3,470 students who are enrolled in schools in Sharp County, 219 (6.3%) attend a private institution, while the remaining 3,251 (93.7%) are enrolled in public schools. The age group of 25 to 34 year olds has the highest likelihood of being enrolled in private schools, with 35 (53.8% in the age bracket) enrolled. Conversely, the age group of 18 to 19 year olds has the lowest likelihood of being enrolled in a private school, with 182 (97.9% in the age bracket) attending a public institution.
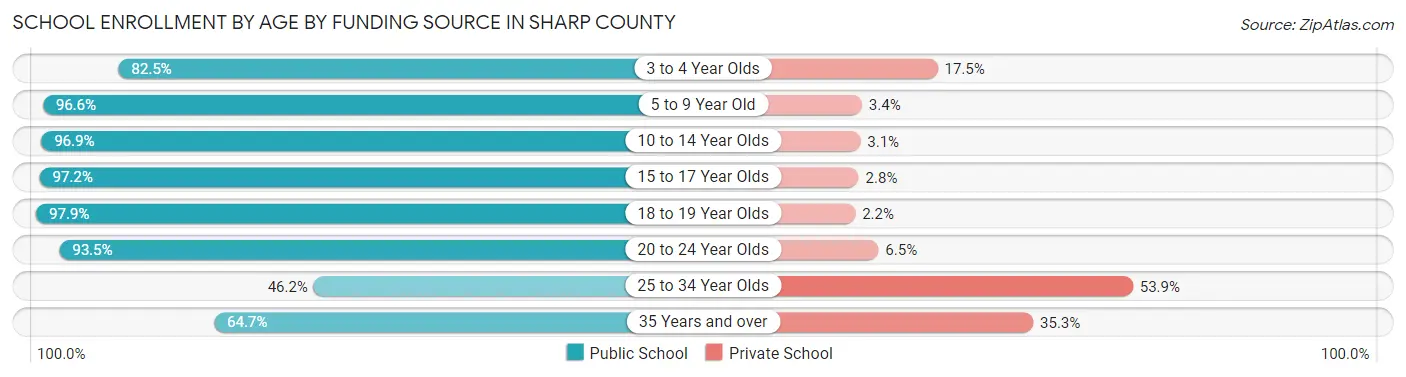
| Age Bracket | Public School | Private School |
| 3 to 4 Year Olds | 170 (82.5%) | 36 (17.5%) |
| 5 to 9 Year Old | 739 (96.6%) | 26 (3.4%) |
| 10 to 14 Year Olds | 1,093 (96.9%) | 35 (3.1%) |
| 15 to 17 Year Olds | 731 (97.2%) | 21 (2.8%) |
| 18 to 19 Year Olds | 182 (97.9%) | 4 (2.1%) |
| 20 to 24 Year Olds | 217 (93.5%) | 15 (6.5%) |
| 25 to 34 Year Olds | 30 (46.2%) | 35 (53.8%) |
| 35 Years and over | 88 (64.7%) | 48 (35.3%) |
| Total | 3,251 (93.7%) | 219 (6.3%) |
Educational Attainment by Field of Study in Sharp County
Education (338 | 22.0%), business (258 | 16.8%), science & technology (242 | 15.8%), bio, nature & agricultural (208 | 13.6%), and liberal arts & history (123 | 8.0%) are the most common fields of study among 1,534 individuals in Sharp County who have obtained a bachelor's degree or higher.
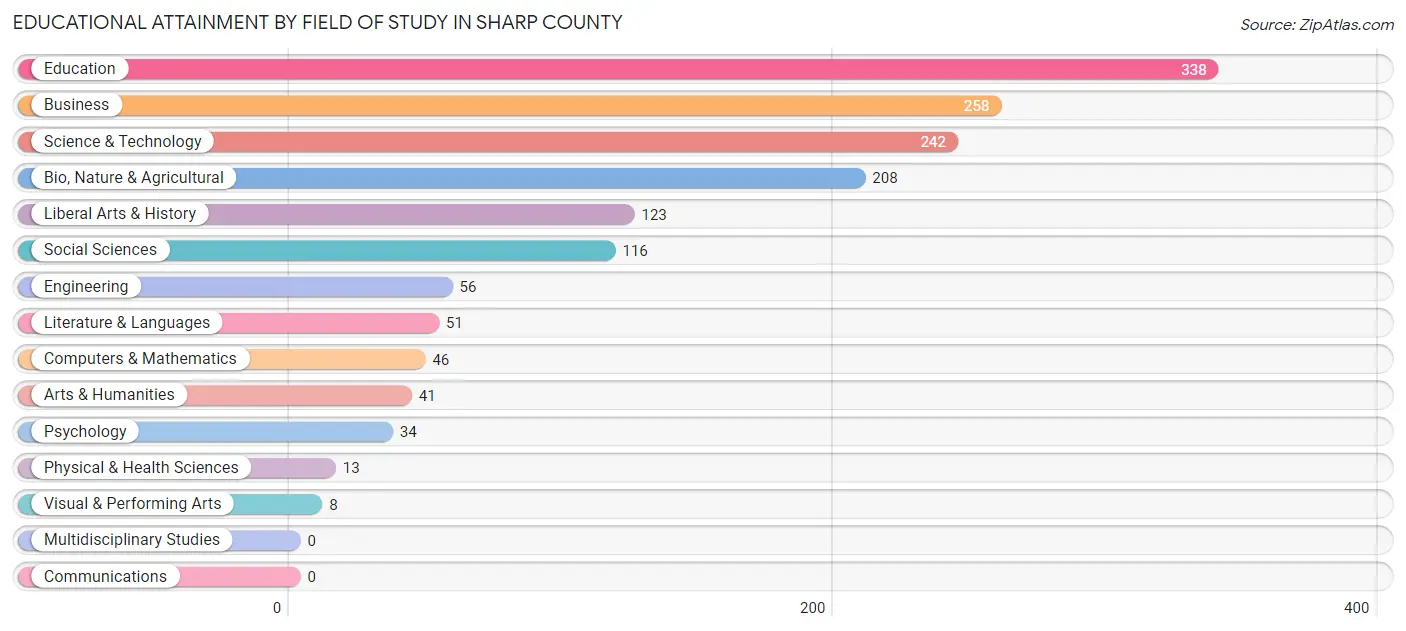
| Field of Study | # Graduates | % Graduates |
| Computers & Mathematics | 46 | 3.0% |
| Bio, Nature & Agricultural | 208 | 13.6% |
| Physical & Health Sciences | 13 | 0.9% |
| Psychology | 34 | 2.2% |
| Social Sciences | 116 | 7.6% |
| Engineering | 56 | 3.6% |
| Multidisciplinary Studies | 0 | 0.0% |
| Science & Technology | 242 | 15.8% |
| Business | 258 | 16.8% |
| Education | 338 | 22.0% |
| Literature & Languages | 51 | 3.3% |
| Liberal Arts & History | 123 | 8.0% |
| Visual & Performing Arts | 8 | 0.5% |
| Communications | 0 | 0.0% |
| Arts & Humanities | 41 | 2.7% |
| Total | 1,534 | 100.0% |
Transportation & Commute in Sharp County
Vehicle Availability by Sex in Sharp County
The most prevalent vehicle ownership categories in Sharp County are males with 2 vehicles (1,599, accounting for 48.9%) and females with 2 vehicles (1,001, making up 54.3%).
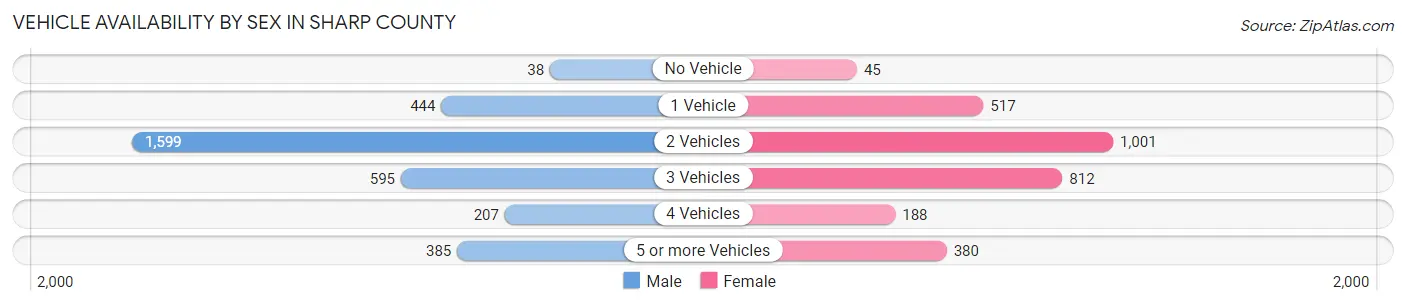
| Vehicles Available | Male | Female |
| No Vehicle | 38 (1.2%) | 45 (1.5%) |
| 1 Vehicle | 444 (13.6%) | 517 (17.6%) |
| 2 Vehicles | 1,599 (48.9%) | 1,001 (34.0%) |
| 3 Vehicles | 595 (18.2%) | 812 (27.6%) |
| 4 Vehicles | 207 (6.3%) | 188 (6.4%) |
| 5 or more Vehicles | 385 (11.8%) | 380 (12.9%) |
| Total | 3,268 (100.0%) | 2,943 (100.0%) |
Commute Time in Sharp County
The most frequently occuring commute durations in Sharp County are 5 to 9 minutes (773 commuters, 13.0%), 10 to 14 minutes (712 commuters, 12.0%), and 30 to 34 minutes (694 commuters, 11.7%).
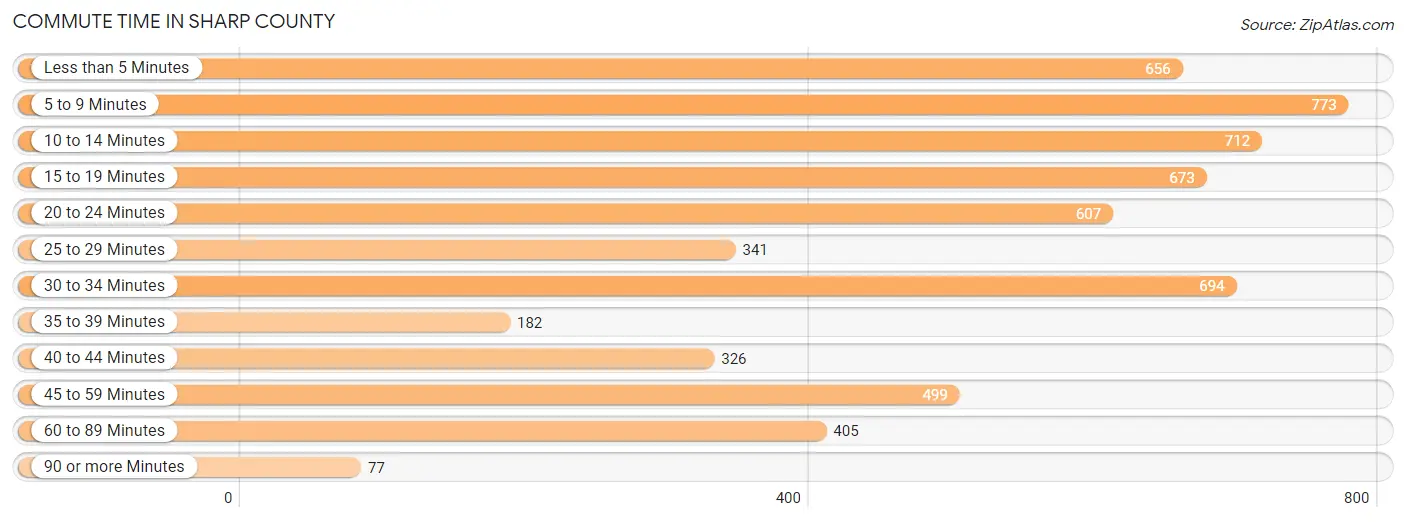
| Commute Time | # Commuters | % Commuters |
| Less than 5 Minutes | 656 | 11.0% |
| 5 to 9 Minutes | 773 | 13.0% |
| 10 to 14 Minutes | 712 | 12.0% |
| 15 to 19 Minutes | 673 | 11.3% |
| 20 to 24 Minutes | 607 | 10.2% |
| 25 to 29 Minutes | 341 | 5.7% |
| 30 to 34 Minutes | 694 | 11.7% |
| 35 to 39 Minutes | 182 | 3.1% |
| 40 to 44 Minutes | 326 | 5.5% |
| 45 to 59 Minutes | 499 | 8.4% |
| 60 to 89 Minutes | 405 | 6.8% |
| 90 or more Minutes | 77 | 1.3% |
Commute Time by Sex in Sharp County
The most common commute times in Sharp County are less than 5 minutes (386 commuters, 12.2%) for males and 10 to 14 minutes (431 commuters, 15.5%) for females.
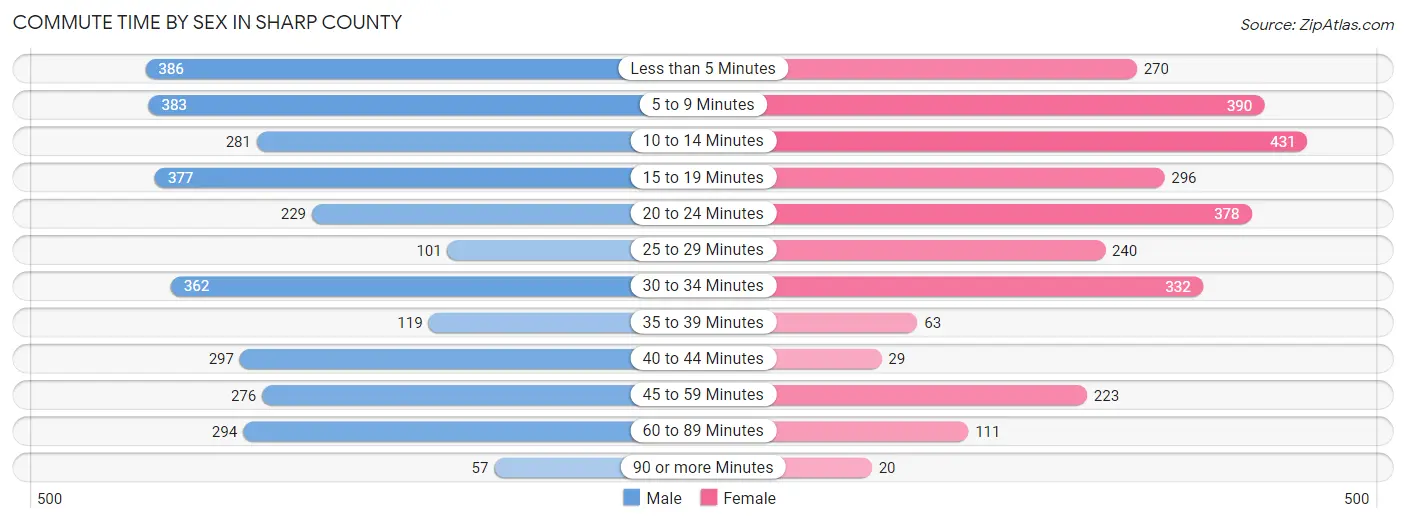
| Commute Time | Male | Female |
| Less than 5 Minutes | 386 (12.2%) | 270 (9.7%) |
| 5 to 9 Minutes | 383 (12.1%) | 390 (14.0%) |
| 10 to 14 Minutes | 281 (8.9%) | 431 (15.5%) |
| 15 to 19 Minutes | 377 (11.9%) | 296 (10.6%) |
| 20 to 24 Minutes | 229 (7.2%) | 378 (13.6%) |
| 25 to 29 Minutes | 101 (3.2%) | 240 (8.6%) |
| 30 to 34 Minutes | 362 (11.5%) | 332 (11.9%) |
| 35 to 39 Minutes | 119 (3.8%) | 63 (2.3%) |
| 40 to 44 Minutes | 297 (9.4%) | 29 (1.0%) |
| 45 to 59 Minutes | 276 (8.7%) | 223 (8.0%) |
| 60 to 89 Minutes | 294 (9.3%) | 111 (4.0%) |
| 90 or more Minutes | 57 (1.8%) | 20 (0.7%) |
Time of Departure to Work by Sex in Sharp County
The most frequent times of departure to work in Sharp County are 6:00 AM to 6:29 AM (477, 15.1%) for males and 7:00 AM to 7:29 AM (495, 17.8%) for females.
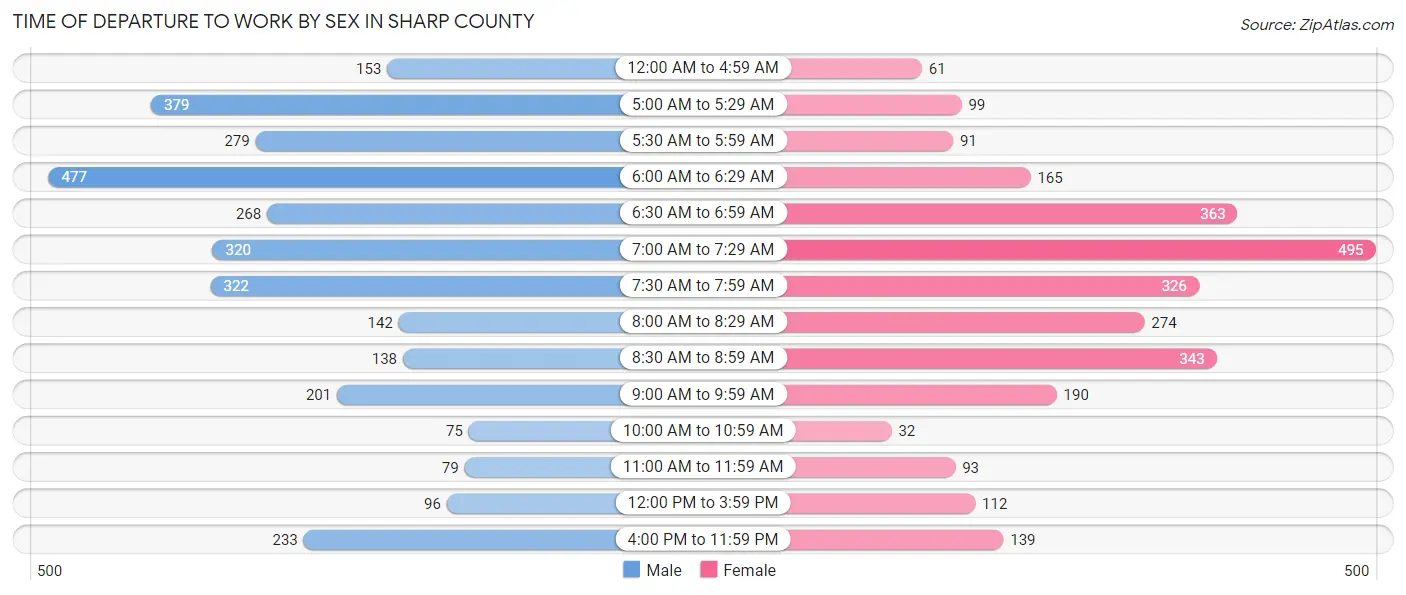
| Time of Departure | Male | Female |
| 12:00 AM to 4:59 AM | 153 (4.8%) | 61 (2.2%) |
| 5:00 AM to 5:29 AM | 379 (12.0%) | 99 (3.6%) |
| 5:30 AM to 5:59 AM | 279 (8.8%) | 91 (3.3%) |
| 6:00 AM to 6:29 AM | 477 (15.1%) | 165 (5.9%) |
| 6:30 AM to 6:59 AM | 268 (8.5%) | 363 (13.0%) |
| 7:00 AM to 7:29 AM | 320 (10.1%) | 495 (17.8%) |
| 7:30 AM to 7:59 AM | 322 (10.2%) | 326 (11.7%) |
| 8:00 AM to 8:29 AM | 142 (4.5%) | 274 (9.9%) |
| 8:30 AM to 8:59 AM | 138 (4.4%) | 343 (12.3%) |
| 9:00 AM to 9:59 AM | 201 (6.4%) | 190 (6.8%) |
| 10:00 AM to 10:59 AM | 75 (2.4%) | 32 (1.1%) |
| 11:00 AM to 11:59 AM | 79 (2.5%) | 93 (3.3%) |
| 12:00 PM to 3:59 PM | 96 (3.0%) | 112 (4.0%) |
| 4:00 PM to 11:59 PM | 233 (7.4%) | 139 (5.0%) |
| Total | 3,162 (100.0%) | 2,783 (100.0%) |
Housing Occupancy in Sharp County
Occupancy by Ownership in Sharp County
Of the total 6,901 dwellings in Sharp County, owner-occupied units account for 5,537 (80.2%), while renter-occupied units make up 1,364 (19.8%).
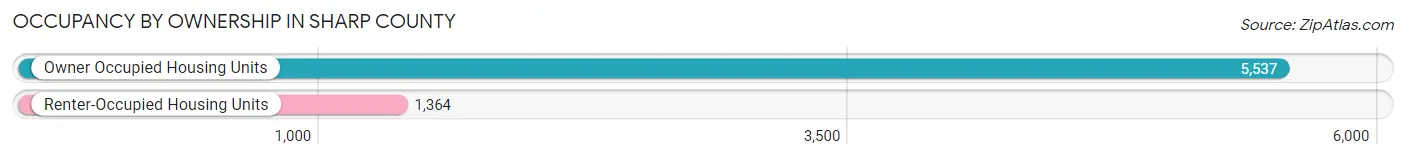
| Occupancy | # Housing Units | % Housing Units |
| Owner Occupied Housing Units | 5,537 | 80.2% |
| Renter-Occupied Housing Units | 1,364 | 19.8% |
| Total Occupied Housing Units | 6,901 | 100.0% |
Occupancy by Household Size in Sharp County
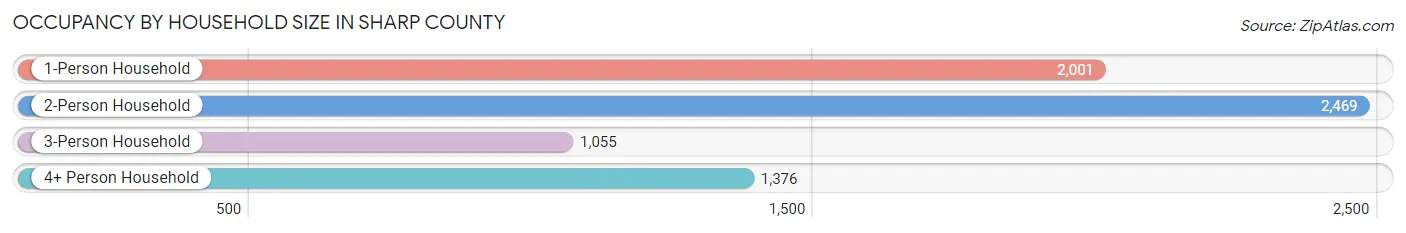
| Household Size | # Housing Units | % Housing Units |
| 1-Person Household | 2,001 | 29.0% |
| 2-Person Household | 2,469 | 35.8% |
| 3-Person Household | 1,055 | 15.3% |
| 4+ Person Household | 1,376 | 19.9% |
| Total Housing Units | 6,901 | 100.0% |
Occupancy by Ownership by Household Size in Sharp County
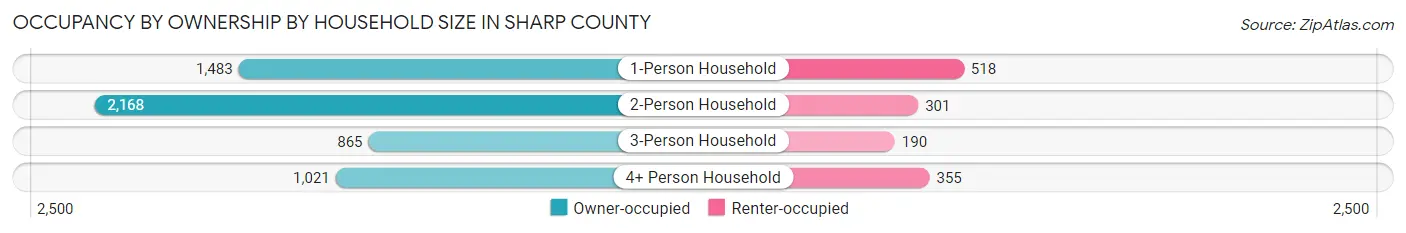
| Household Size | Owner-occupied | Renter-occupied |
| 1-Person Household | 1,483 (74.1%) | 518 (25.9%) |
| 2-Person Household | 2,168 (87.8%) | 301 (12.2%) |
| 3-Person Household | 865 (82.0%) | 190 (18.0%) |
| 4+ Person Household | 1,021 (74.2%) | 355 (25.8%) |
| Total Housing Units | 5,537 (80.2%) | 1,364 (19.8%) |
Occupancy by Educational Attainment in Sharp County
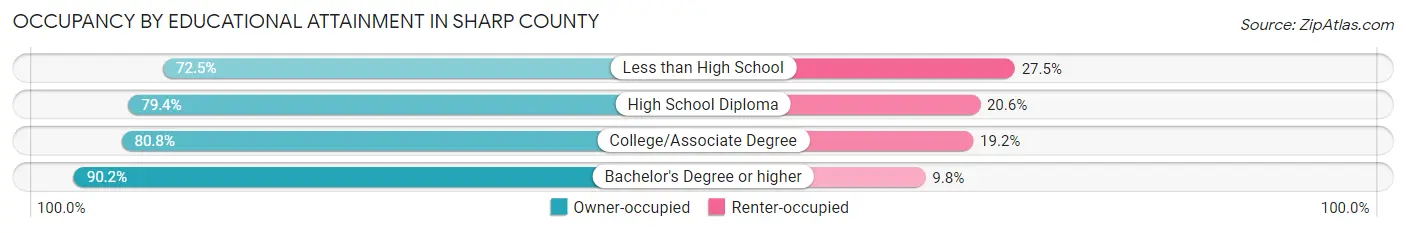
| Household Size | Owner-occupied | Renter-occupied |
| Less than High School | 771 (72.5%) | 292 (27.5%) |
| High School Diploma | 2,149 (79.4%) | 557 (20.6%) |
| College/Associate Degree | 1,785 (80.8%) | 425 (19.2%) |
| Bachelor's Degree or higher | 832 (90.2%) | 90 (9.8%) |
Occupancy by Age of Householder in Sharp County
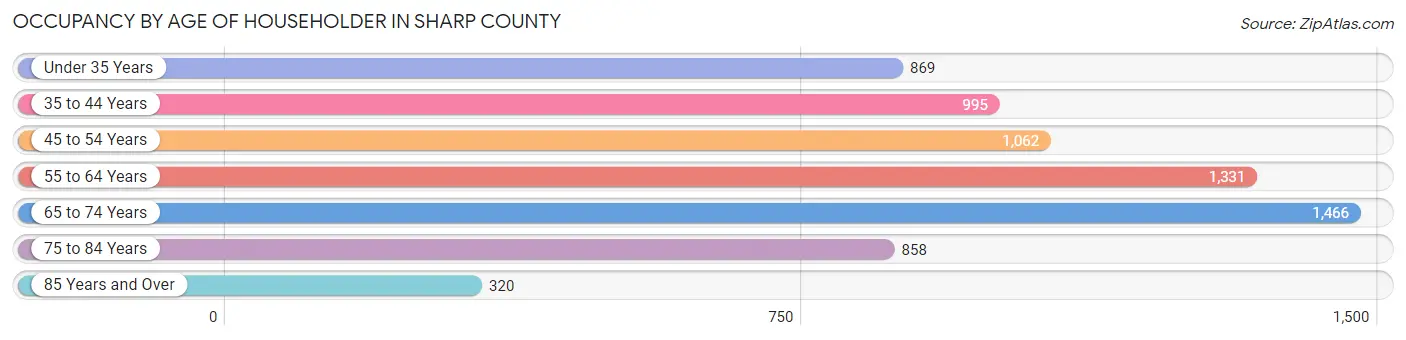
| Age Bracket | # Households | % Households |
| Under 35 Years | 869 | 12.6% |
| 35 to 44 Years | 995 | 14.4% |
| 45 to 54 Years | 1,062 | 15.4% |
| 55 to 64 Years | 1,331 | 19.3% |
| 65 to 74 Years | 1,466 | 21.2% |
| 75 to 84 Years | 858 | 12.4% |
| 85 Years and Over | 320 | 4.6% |
| Total | 6,901 | 100.0% |
Housing Finances in Sharp County
Median Income by Occupancy in Sharp County
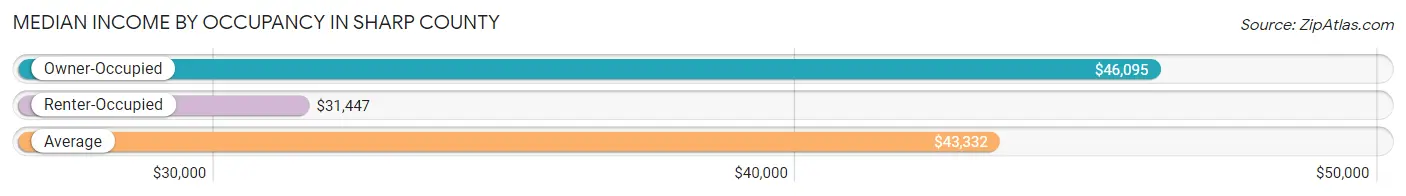
| Occupancy Type | # Households | Median Income |
| Owner-Occupied | 5,537 (80.2%) | $46,095 |
| Renter-Occupied | 1,364 (19.8%) | $31,447 |
| Average | 6,901 (100.0%) | $43,332 |
Occupancy by Householder Income Bracket in Sharp County
| Income Bracket | Owner-occupied | Renter-occupied |
| Less than $5,000 | 177 (3.2%) | 85 (6.2%) |
| $5,000 to $9,999 | 142 (2.6%) | 79 (5.8%) |
| $10,000 to $14,999 | 287 (5.2%) | 188 (13.8%) |
| $15,000 to $19,999 | 267 (4.8%) | 109 (8.0%) |
| $20,000 to $24,999 | 380 (6.9%) | 44 (3.2%) |
| $25,000 to $34,999 | 801 (14.5%) | 259 (19.0%) |
| $35,000 to $49,999 | 965 (17.4%) | 189 (13.9%) |
| $50,000 to $74,999 | 1,039 (18.8%) | 220 (16.1%) |
| $75,000 to $99,999 | 649 (11.7%) | 176 (12.9%) |
| $100,000 to $149,999 | 441 (8.0%) | 15 (1.1%) |
| $150,000 or more | 389 (7.0%) | 0 (0.0%) |
| Total | 5,537 (100.0%) | 1,364 (100.0%) |
Monthly Housing Cost Tiers in Sharp County
| Monthly Cost | Owner-occupied | Renter-occupied |
| Less than $300 | 997 (18.0%) | 147 (10.8%) |
| $300 to $499 | 1,489 (26.9%) | 190 (13.9%) |
| $500 to $799 | 1,496 (27.0%) | 473 (34.7%) |
| $800 to $999 | 357 (6.5%) | 235 (17.2%) |
| $1,000 to $1,499 | 790 (14.3%) | 101 (7.4%) |
| $1,500 to $1,999 | 224 (4.1%) | 0 (0.0%) |
| $2,000 to $2,499 | 80 (1.4%) | 0 (0.0%) |
| $2,500 to $2,999 | 69 (1.3%) | 0 (0.0%) |
| $3,000 or more | 35 (0.6%) | 0 (0.0%) |
| Total | 5,537 (100.0%) | 1,364 (100.0%) |
Physical Housing Characteristics in Sharp County
Housing Structures in Sharp County
| Structure Type | # Housing Units | % Housing Units |
| Single Unit, Detached | 5,550 | 80.4% |
| Single Unit, Attached | 74 | 1.1% |
| 2 Unit Apartments | 109 | 1.6% |
| 3 or 4 Unit Apartments | 136 | 2.0% |
| 5 to 9 Unit Apartments | 58 | 0.8% |
| 10 or more Apartments | 72 | 1.0% |
| Mobile Home / Other | 902 | 13.1% |
| Total | 6,901 | 100.0% |
Housing Structures by Occupancy in Sharp County
| Structure Type | Owner-occupied | Renter-occupied |
| Single Unit, Detached | 4,775 (86.0%) | 775 (14.0%) |
| Single Unit, Attached | 60 (81.1%) | 14 (18.9%) |
| 2 Unit Apartments | 18 (16.5%) | 91 (83.5%) |
| 3 or 4 Unit Apartments | 18 (13.2%) | 118 (86.8%) |
| 5 to 9 Unit Apartments | 0 (0.0%) | 58 (100.0%) |
| 10 or more Apartments | 0 (0.0%) | 72 (100.0%) |
| Mobile Home / Other | 666 (73.8%) | 236 (26.2%) |
| Total | 5,537 (80.2%) | 1,364 (19.8%) |
Housing Structures by Number of Rooms in Sharp County
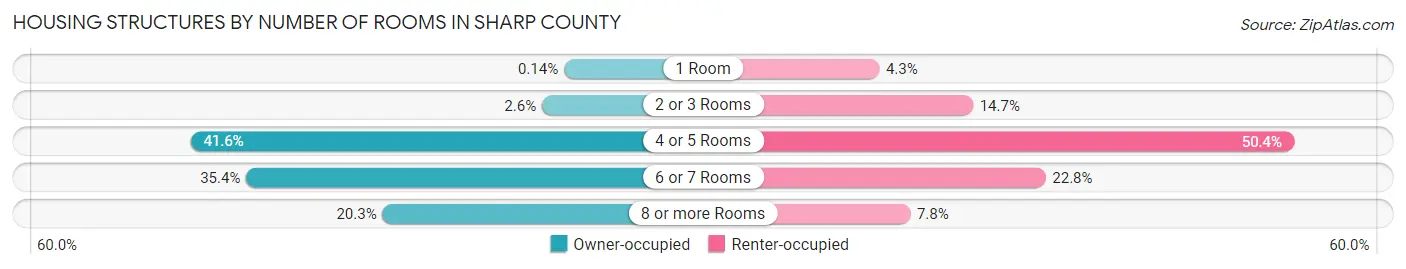
| Number of Rooms | Owner-occupied | Renter-occupied |
| 1 Room | 8 (0.1%) | 59 (4.3%) |
| 2 or 3 Rooms | 143 (2.6%) | 201 (14.7%) |
| 4 or 5 Rooms | 2,303 (41.6%) | 687 (50.4%) |
| 6 or 7 Rooms | 1,960 (35.4%) | 311 (22.8%) |
| 8 or more Rooms | 1,123 (20.3%) | 106 (7.8%) |
| Total | 5,537 (100.0%) | 1,364 (100.0%) |
Housing Structure by Heating Type in Sharp County
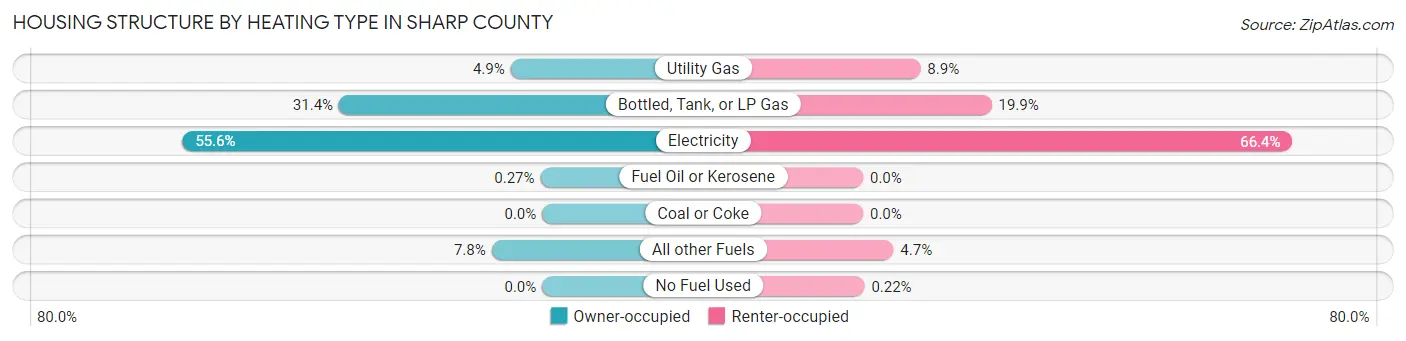
| Heating Type | Owner-occupied | Renter-occupied |
| Utility Gas | 270 (4.9%) | 121 (8.9%) |
| Bottled, Tank, or LP Gas | 1,739 (31.4%) | 271 (19.9%) |
| Electricity | 3,080 (55.6%) | 905 (66.3%) |
| Fuel Oil or Kerosene | 15 (0.3%) | 0 (0.0%) |
| Coal or Coke | 0 (0.0%) | 0 (0.0%) |
| All other Fuels | 433 (7.8%) | 64 (4.7%) |
| No Fuel Used | 0 (0.0%) | 3 (0.2%) |
| Total | 5,537 (100.0%) | 1,364 (100.0%) |
Household Vehicle Usage in Sharp County
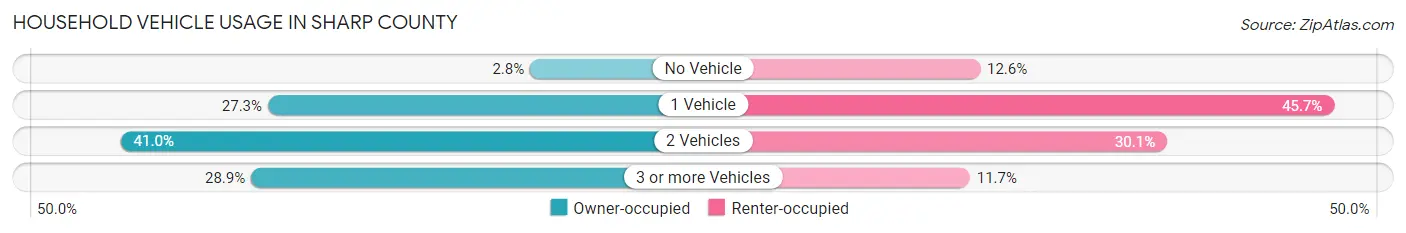
| Vehicles per Household | Owner-occupied | Renter-occupied |
| No Vehicle | 156 (2.8%) | 172 (12.6%) |
| 1 Vehicle | 1,511 (27.3%) | 623 (45.7%) |
| 2 Vehicles | 2,272 (41.0%) | 410 (30.1%) |
| 3 or more Vehicles | 1,598 (28.9%) | 159 (11.7%) |
| Total | 5,537 (100.0%) | 1,364 (100.0%) |
Real Estate & Mortgages in Sharp County
Real Estate and Mortgage Overview in Sharp County
| Characteristic | Without Mortgage | With Mortgage |
| Housing Units | 3,020 | 2,517 |
| Median Property Value | $81,900 | $94,700 |
| Median Household Income | $40,463 | $264 |
| Monthly Housing Costs | $349 | $32 |
| Real Estate Taxes | $491 | $168 |
Property Value by Mortgage Status in Sharp County
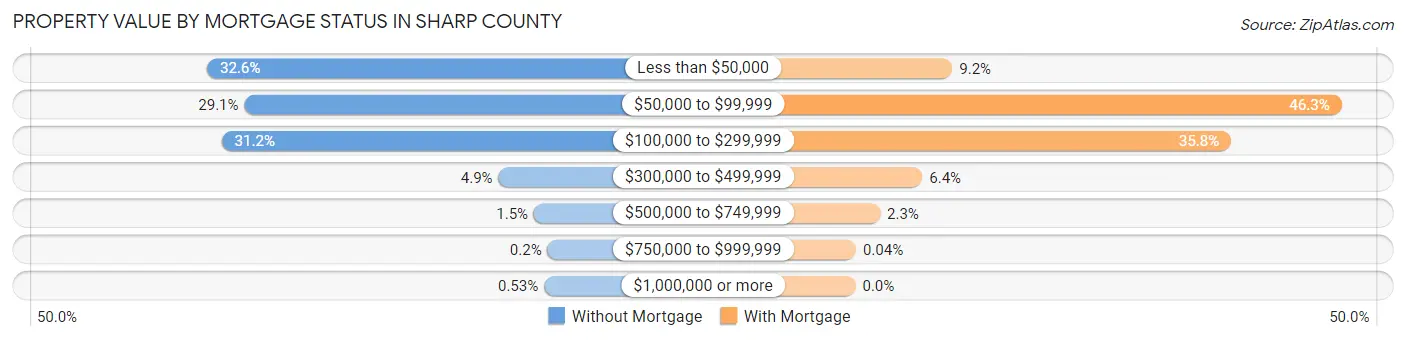
| Property Value | Without Mortgage | With Mortgage |
| Less than $50,000 | 985 (32.6%) | 232 (9.2%) |
| $50,000 to $99,999 | 878 (29.1%) | 1,165 (46.3%) |
| $100,000 to $299,999 | 943 (31.2%) | 900 (35.8%) |
| $300,000 to $499,999 | 147 (4.9%) | 160 (6.4%) |
| $500,000 to $749,999 | 45 (1.5%) | 59 (2.3%) |
| $750,000 to $999,999 | 6 (0.2%) | 1 (0.0%) |
| $1,000,000 or more | 16 (0.5%) | 0 (0.0%) |
| Total | 3,020 (100.0%) | 2,517 (100.0%) |
Household Income by Mortgage Status in Sharp County
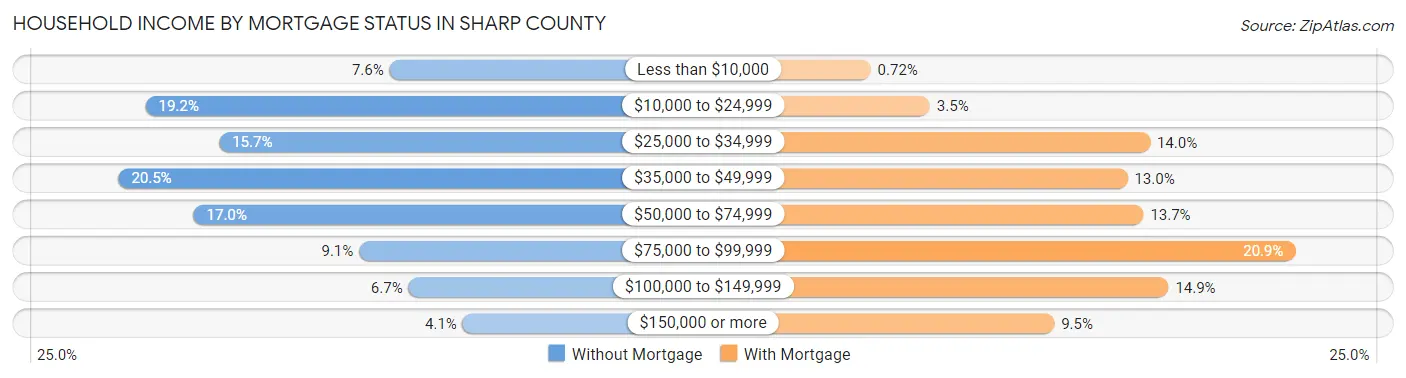
| Household Income | Without Mortgage | With Mortgage |
| Less than $10,000 | 230 (7.6%) | 18 (0.7%) |
| $10,000 to $24,999 | 581 (19.2%) | 89 (3.5%) |
| $25,000 to $34,999 | 475 (15.7%) | 353 (14.0%) |
| $35,000 to $49,999 | 620 (20.5%) | 326 (13.0%) |
| $50,000 to $74,999 | 512 (17.0%) | 345 (13.7%) |
| $75,000 to $99,999 | 274 (9.1%) | 527 (20.9%) |
| $100,000 to $149,999 | 203 (6.7%) | 375 (14.9%) |
| $150,000 or more | 125 (4.1%) | 238 (9.5%) |
| Total | 3,020 (100.0%) | 2,517 (100.0%) |
Property Value to Household Income Ratio in Sharp County
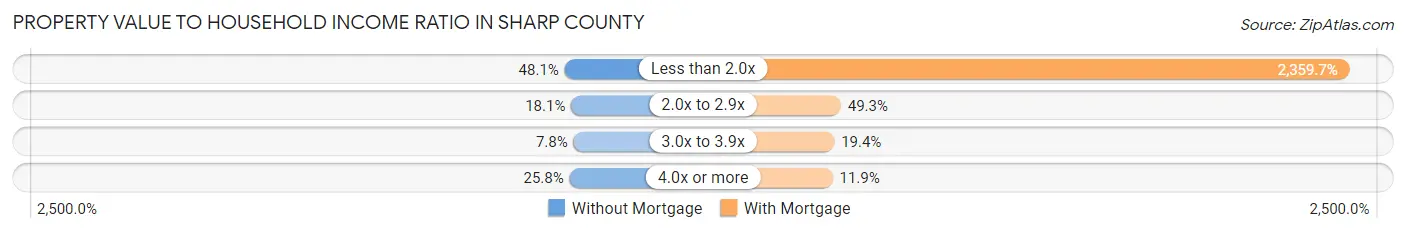
| Value-to-Income Ratio | Without Mortgage | With Mortgage |
| Less than 2.0x | 1,451 (48.0%) | 59,393 (2,359.7%) |
| 2.0x to 2.9x | 546 (18.1%) | 1,242 (49.3%) |
| 3.0x to 3.9x | 234 (7.7%) | 488 (19.4%) |
| 4.0x or more | 779 (25.8%) | 299 (11.9%) |
| Total | 3,020 (100.0%) | 2,517 (100.0%) |
Real Estate Taxes by Mortgage Status in Sharp County
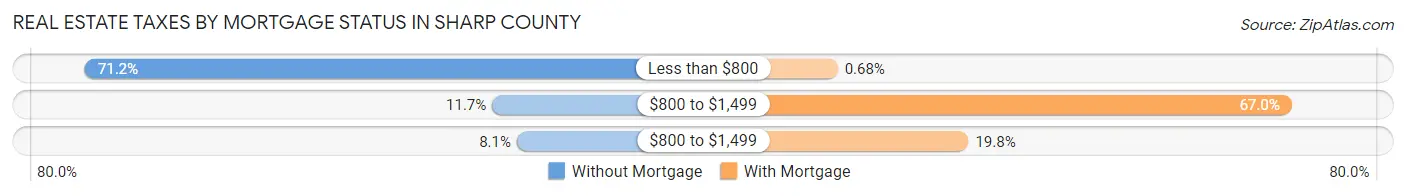
| Property Taxes | Without Mortgage | With Mortgage |
| Less than $800 | 2,150 (71.2%) | 17 (0.7%) |
| $800 to $1,499 | 353 (11.7%) | 1,687 (67.0%) |
| $800 to $1,499 | 244 (8.1%) | 498 (19.8%) |
| Total | 3,020 (100.0%) | 2,517 (100.0%) |
Health & Disability in Sharp County
Health Insurance Coverage by Age in Sharp County
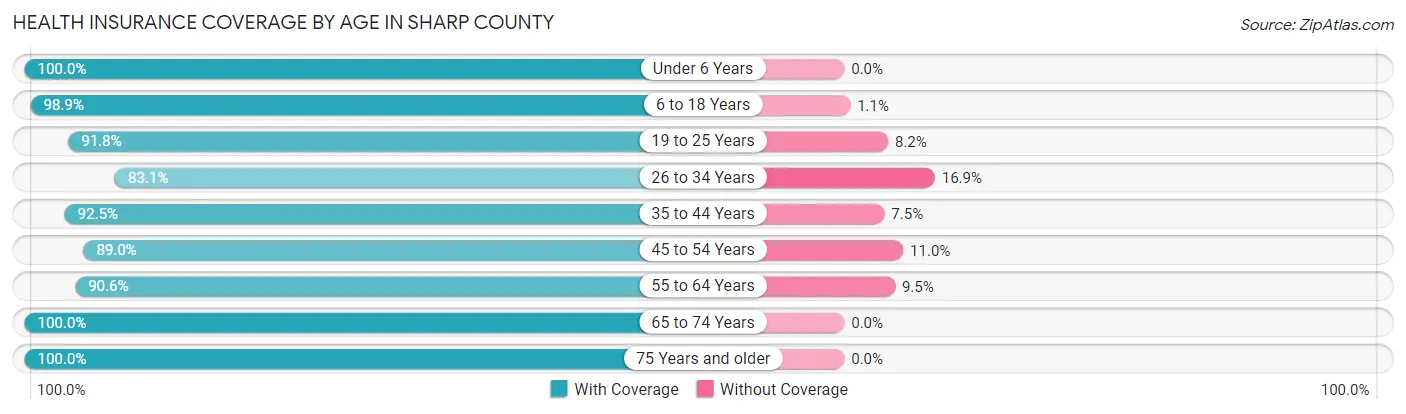
| Age Bracket | With Coverage | Without Coverage |
| Under 6 Years | 1,087 (100.0%) | 0 (0.0%) |
| 6 to 18 Years | 2,615 (98.9%) | 29 (1.1%) |
| 19 to 25 Years | 1,036 (91.8%) | 92 (8.2%) |
| 26 to 34 Years | 1,270 (83.1%) | 258 (16.9%) |
| 35 to 44 Years | 1,708 (92.5%) | 138 (7.5%) |
| 45 to 54 Years | 1,832 (89.0%) | 226 (11.0%) |
| 55 to 64 Years | 2,366 (90.5%) | 247 (9.5%) |
| 65 to 74 Years | 2,518 (100.0%) | 0 (0.0%) |
| 75 Years and older | 1,791 (100.0%) | 0 (0.0%) |
| Total | 16,223 (94.3%) | 990 (5.8%) |
Health Insurance Coverage by Citizenship Status in Sharp County
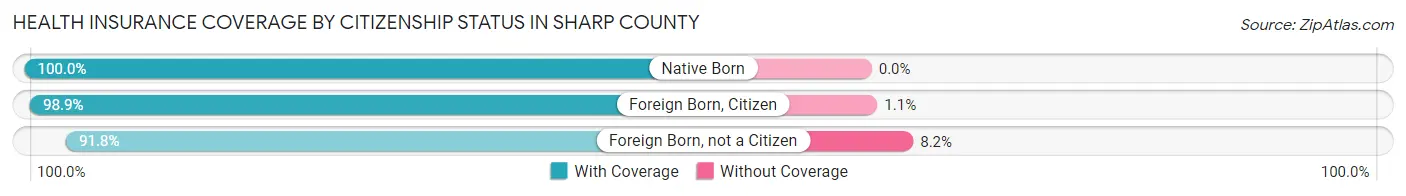
| Citizenship Status | With Coverage | Without Coverage |
| Native Born | 1,087 (100.0%) | 0 (0.0%) |
| Foreign Born, Citizen | 2,615 (98.9%) | 29 (1.1%) |
| Foreign Born, not a Citizen | 1,036 (91.8%) | 92 (8.2%) |
Health Insurance Coverage by Household Income in Sharp County
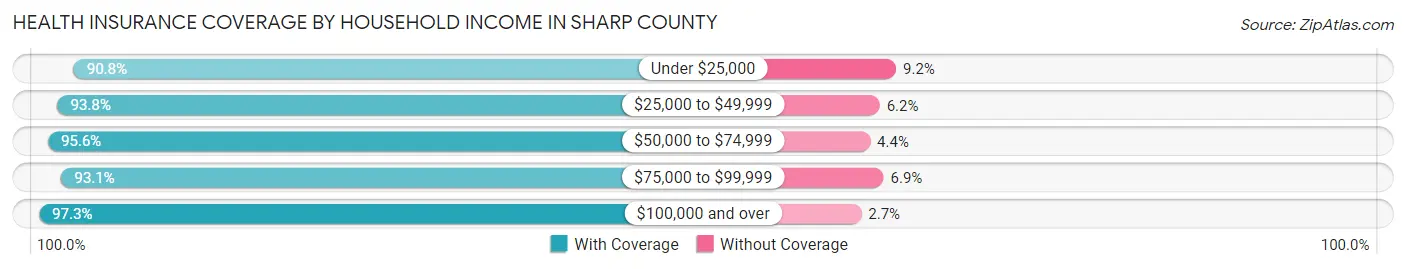
| Household Income | With Coverage | Without Coverage |
| Under $25,000 | 2,340 (90.8%) | 238 (9.2%) |
| $25,000 to $49,999 | 5,198 (93.8%) | 342 (6.2%) |
| $50,000 to $74,999 | 3,424 (95.6%) | 157 (4.4%) |
| $75,000 to $99,999 | 2,309 (93.1%) | 171 (6.9%) |
| $100,000 and over | 2,926 (97.3%) | 82 (2.7%) |
Public vs Private Health Insurance Coverage by Age in Sharp County
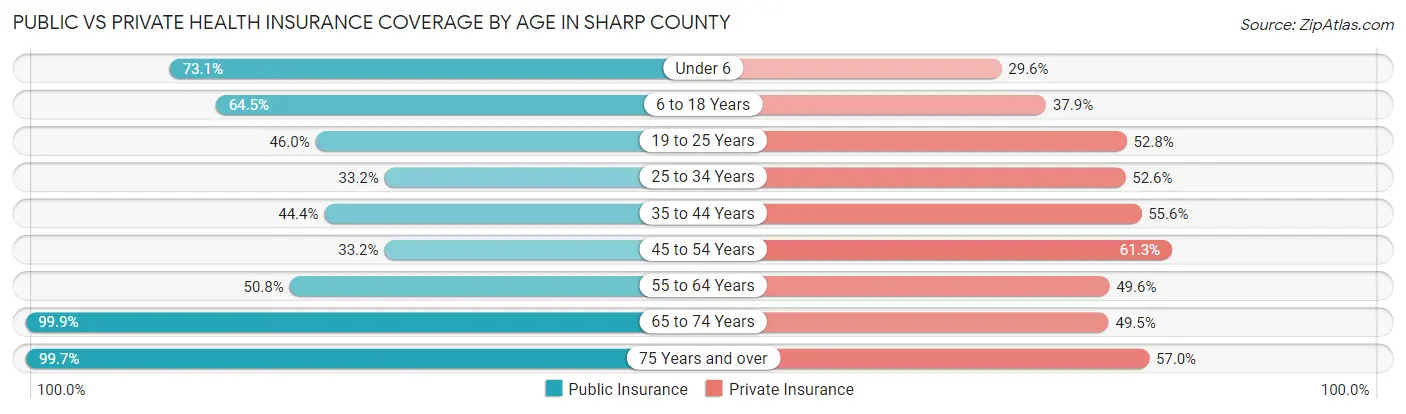
| Age Bracket | Public Insurance | Private Insurance |
| Under 6 | 794 (73.1%) | 322 (29.6%) |
| 6 to 18 Years | 1,706 (64.5%) | 1,002 (37.9%) |
| 19 to 25 Years | 519 (46.0%) | 596 (52.8%) |
| 25 to 34 Years | 507 (33.2%) | 804 (52.6%) |
| 35 to 44 Years | 819 (44.4%) | 1,026 (55.6%) |
| 45 to 54 Years | 684 (33.2%) | 1,261 (61.3%) |
| 55 to 64 Years | 1,328 (50.8%) | 1,297 (49.6%) |
| 65 to 74 Years | 2,515 (99.9%) | 1,247 (49.5%) |
| 75 Years and over | 1,786 (99.7%) | 1,021 (57.0%) |
| Total | 10,658 (61.9%) | 8,576 (49.8%) |
Disability Status by Sex by Age in Sharp County
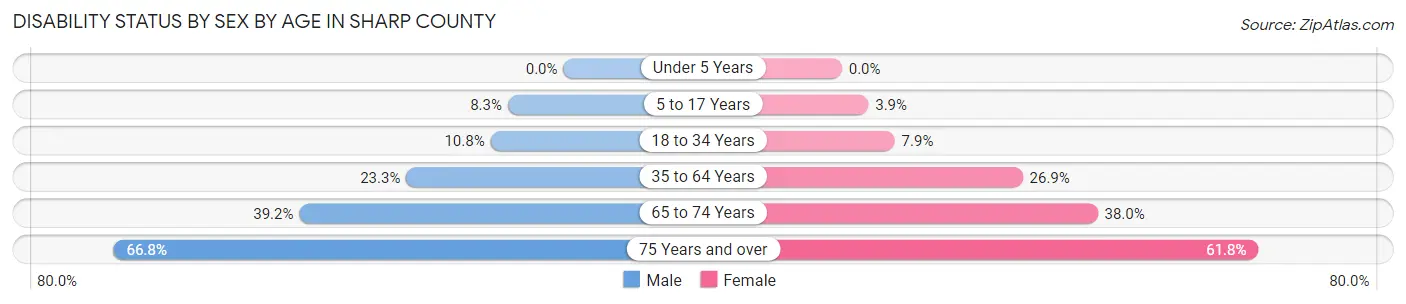
| Age Bracket | Male | Female |
| Under 5 Years | 0 (0.0%) | 0 (0.0%) |
| 5 to 17 Years | 117 (8.3%) | 51 (3.9%) |
| 18 to 34 Years | 150 (10.8%) | 109 (7.9%) |
| 35 to 64 Years | 741 (23.3%) | 897 (26.9%) |
| 65 to 74 Years | 467 (39.2%) | 504 (38.0%) |
| 75 Years and over | 559 (66.8%) | 590 (61.8%) |
Disability Class by Sex by Age in Sharp County
Disability Class: Hearing Difficulty
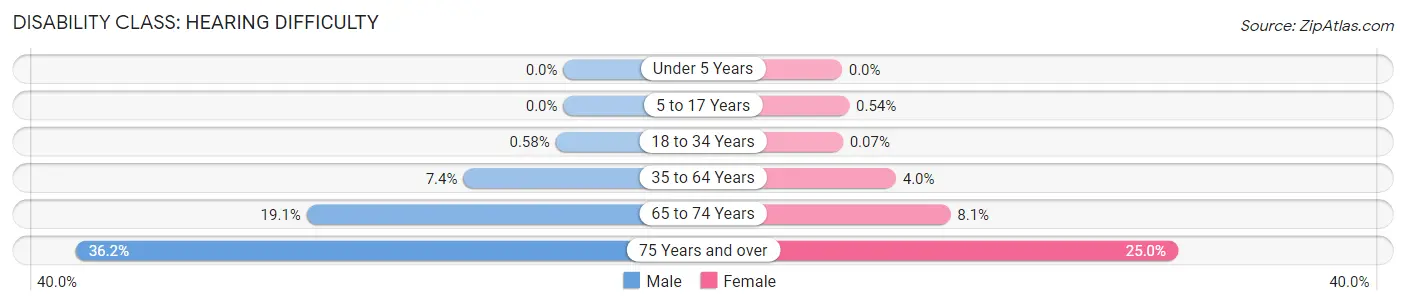
| Age Bracket | Male | Female |
| Under 5 Years | 0 (0.0%) | 0 (0.0%) |
| 5 to 17 Years | 0 (0.0%) | 7 (0.5%) |
| 18 to 34 Years | 8 (0.6%) | 1 (0.1%) |
| 35 to 64 Years | 236 (7.4%) | 134 (4.0%) |
| 65 to 74 Years | 227 (19.1%) | 107 (8.1%) |
| 75 Years and over | 303 (36.2%) | 238 (24.9%) |
Disability Class: Vision Difficulty
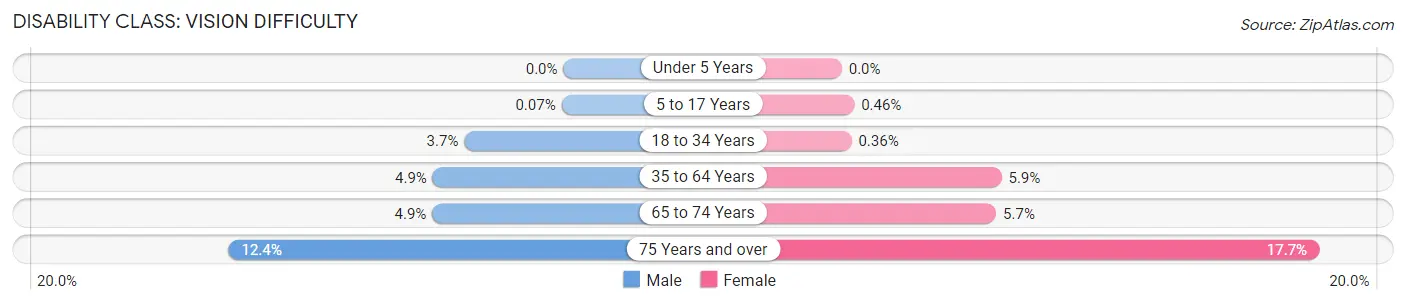
| Age Bracket | Male | Female |
| Under 5 Years | 0 (0.0%) | 0 (0.0%) |
| 5 to 17 Years | 1 (0.1%) | 6 (0.5%) |
| 18 to 34 Years | 51 (3.7%) | 5 (0.4%) |
| 35 to 64 Years | 154 (4.9%) | 198 (5.9%) |
| 65 to 74 Years | 58 (4.9%) | 76 (5.7%) |
| 75 Years and over | 104 (12.4%) | 169 (17.7%) |
Disability Class: Cognitive Difficulty
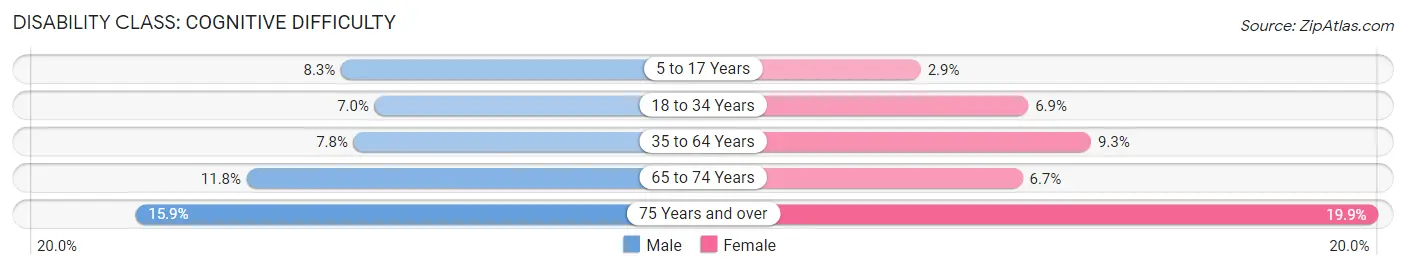
| Age Bracket | Male | Female |
| 5 to 17 Years | 117 (8.3%) | 38 (2.9%) |
| 18 to 34 Years | 97 (7.0%) | 96 (6.9%) |
| 35 to 64 Years | 247 (7.8%) | 309 (9.2%) |
| 65 to 74 Years | 140 (11.7%) | 89 (6.7%) |
| 75 Years and over | 133 (15.9%) | 190 (19.9%) |
Disability Class: Ambulatory Difficulty
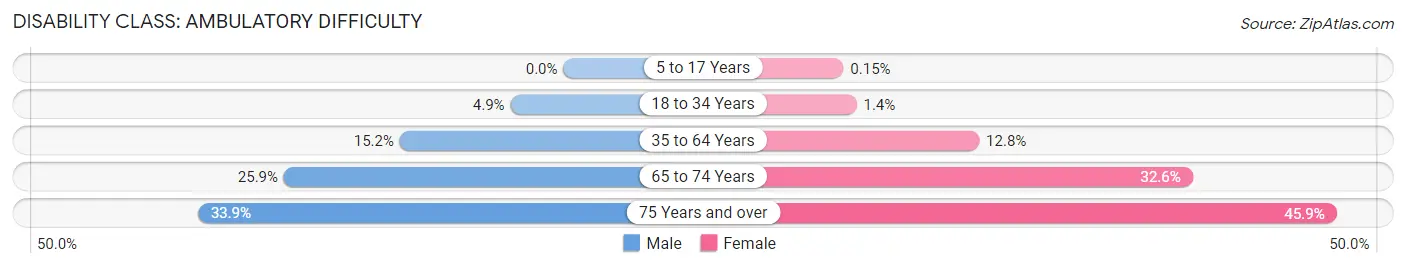
| Age Bracket | Male | Female |
| 5 to 17 Years | 0 (0.0%) | 2 (0.2%) |
| 18 to 34 Years | 68 (4.9%) | 19 (1.4%) |
| 35 to 64 Years | 482 (15.2%) | 426 (12.8%) |
| 65 to 74 Years | 309 (25.9%) | 432 (32.6%) |
| 75 Years and over | 284 (33.9%) | 438 (45.9%) |
Disability Class: Self-Care Difficulty
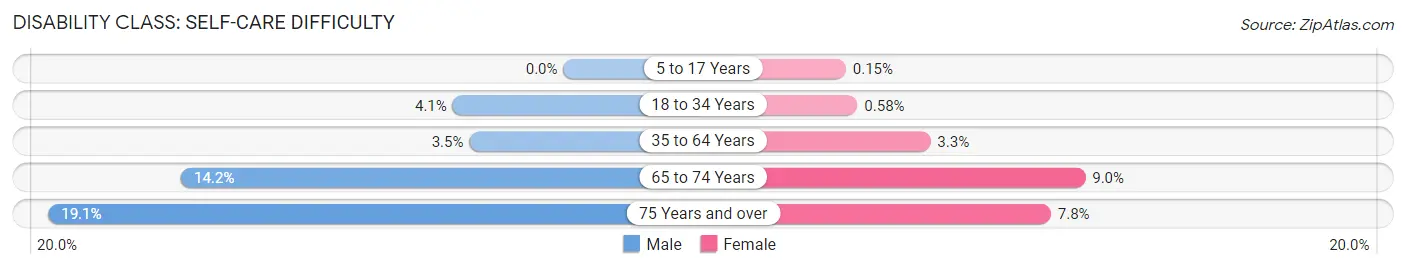
| Age Bracket | Male | Female |
| 5 to 17 Years | 0 (0.0%) | 2 (0.2%) |
| 18 to 34 Years | 57 (4.1%) | 8 (0.6%) |
| 35 to 64 Years | 111 (3.5%) | 110 (3.3%) |
| 65 to 74 Years | 169 (14.2%) | 120 (9.0%) |
| 75 Years and over | 160 (19.1%) | 74 (7.8%) |
Technology Access in Sharp County
Computing Device Access in Sharp County
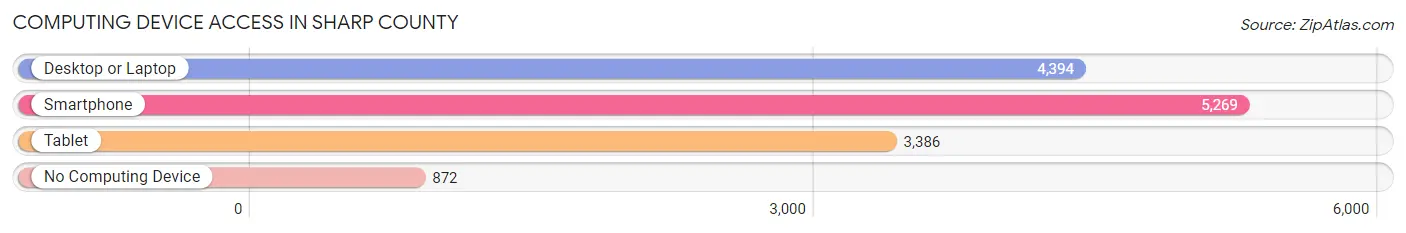
| Device Type | # Households | % Households |
| Desktop or Laptop | 4,394 | 63.7% |
| Smartphone | 5,269 | 76.3% |
| Tablet | 3,386 | 49.1% |
| No Computing Device | 872 | 12.6% |
| Total | 6,901 | 100.0% |
Internet Access in Sharp County
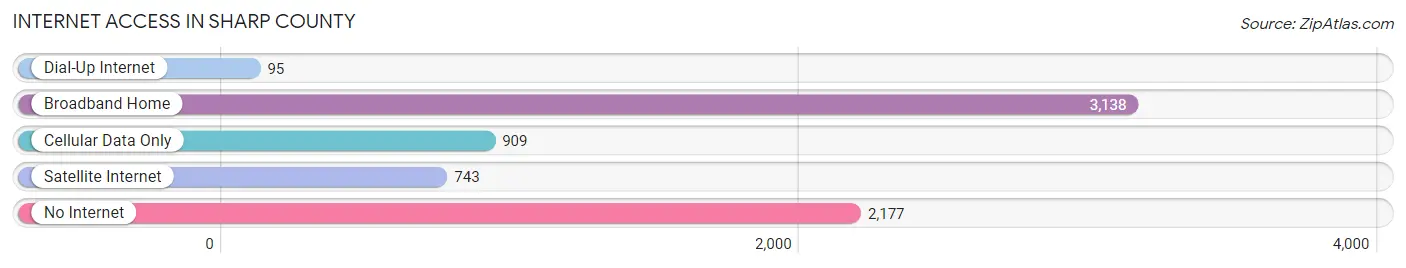
| Internet Type | # Households | % Households |
| Dial-Up Internet | 95 | 1.4% |
| Broadband Home | 3,138 | 45.5% |
| Cellular Data Only | 909 | 13.2% |
| Satellite Internet | 743 | 10.8% |
| No Internet | 2,177 | 31.6% |
| Total | 6,901 | 100.0% |
Sharp County Summary
Introduction
Sharp County is located in the northeast corner of Arkansas and is part of the Arkansas Delta region. It is bordered by Clay County to the north, Randolph County to the east, Lawrence County to the south, and Fulton County to the west. The county seat is Ash Flat, and the largest city is Hardy. The county was established in 1868 and named for Ephraim Sharp, a state legislator.
History
The area that is now Sharp County was originally inhabited by the Osage and Cherokee Native American tribes. The first European settlers arrived in the area in the early 1800s. The county was officially established in 1868 and named for Ephraim Sharp, a state legislator.
The county was largely agricultural in the late 19th and early 20th centuries, with cotton and corn being the main crops. The county also had a thriving timber industry, with the White River providing access to the markets in St. Louis and Memphis.
In the late 20th century, the county experienced a population decline as people moved away from rural areas in search of better economic opportunities. However, the county has seen a resurgence in recent years, with an influx of new residents and businesses.
Geography
Sharp County is located in the northeast corner of Arkansas and is part of the Arkansas Delta region. It is bordered by Clay County to the north, Randolph County to the east, Lawrence County to the south, and Fulton County to the west. The county has a total area of 576 square miles, of which 574 square miles is land and 2 square miles is water.
The county is mostly flat, with some rolling hills in the northern and western parts. The White River runs through the county, and there are several small lakes and streams. The county is also home to several state parks, including Spring River State Park and Ozark National Forest.
Economy
Sharp County has a diverse economy, with agriculture, manufacturing, and tourism being the main industries. The county is home to several large poultry processing plants, as well as a number of smaller businesses. Tourism is also an important part of the economy, with the county being home to several state parks and recreational areas.
Agriculture is still an important part of the economy, with corn, soybeans, and cotton being the main crops. Livestock production is also important, with cattle, hogs, and poultry being the main animals raised.
Demographics
As of the 2010 census, Sharp County had a population of 17,264. The population was spread out, with 48.3% male and 51.7% female. The median age was 41.7 years.
The racial makeup of the county was 97.2% White, 0.7% Black or African American, 0.3% Native American, 0.2% Asian, 0.1% Pacific Islander, 0.5% from other races, and 1.1% from two or more races. Hispanic or Latino of any race were 1.7% of the population.
The median household income was $35,945 and the median family income was $41,945. The per capita income was $17,945. About 16.2% of the population was below the poverty line.
Conclusion
Sharp County is located in the northeast corner of Arkansas and is part of the Arkansas Delta region. It has a diverse economy, with agriculture, manufacturing, and tourism being the main industries. The county has a population of 17,264, with a median age of 41.7 years. The racial makeup of the county is 97.2% White, 0.7% Black or African American, 0.3% Native American, 0.2% Asian, 0.1% Pacific Islander, 0.5% from other races, and 1.1% from two or more races. The median household income is $35,945 and the median family income is $41,945. About 16.2% of the population is below the poverty line. Sharp County has a rich history and is home to several state parks and recreational areas.
Common Questions
What is Per Capita Income in Sharp County?
Per Capita income in Sharp County is $25,283.
What is the Median Family Income in Sharp County?
Median Family Income in Sharp County is $55,625.
What is the Median Household income in Sharp County?
Median Household Income in Sharp County is $43,332.
What is Income or Wage Gap in Sharp County?
Income or Wage Gap in Sharp County is 23.9%.
Women in Sharp County earn 76.1 cents for every dollar earned by a man.
What is Family Income Deficit in Sharp County?
Family Income Deficit in Sharp County is $9,422.
Families that are below poverty line in Sharp County earn $9,422 less on average than the poverty threshold level.
What is Inequality or Gini Index in Sharp County?
Inequality or Gini Index in Sharp County is 0.47.
What is the Total Population of Sharp County?
Total Population of Sharp County is 17,422.
What is the Total Male Population of Sharp County?
Total Male Population of Sharp County is 8,559.
What is the Total Female Population of Sharp County?
Total Female Population of Sharp County is 8,863.
What is the Ratio of Males per 100 Females in Sharp County?
There are 96.57 Males per 100 Females in Sharp County.
What is the Ratio of Females per 100 Males in Sharp County?
There are 103.55 Females per 100 Males in Sharp County.
What is the Median Population Age in Sharp County?
Median Population Age in Sharp County is 47.4 Years.
What is the Average Family Size in Sharp County
Average Family Size in Sharp County is 3.1 People.
What is the Average Household Size in Sharp County
Average Household Size in Sharp County is 2.5 People.
How Large is the Labor Force in Sharp County?
There are 6,704 People in the Labor Forcein in Sharp County.
What is the Percentage of People in the Labor Force in Sharp County?
47.0% of People are in the Labor Force in Sharp County.
What is the Unemployment Rate in Sharp County?
Unemployment Rate in Sharp County is 6.2%.