Sevier County, AR Map & Demographics
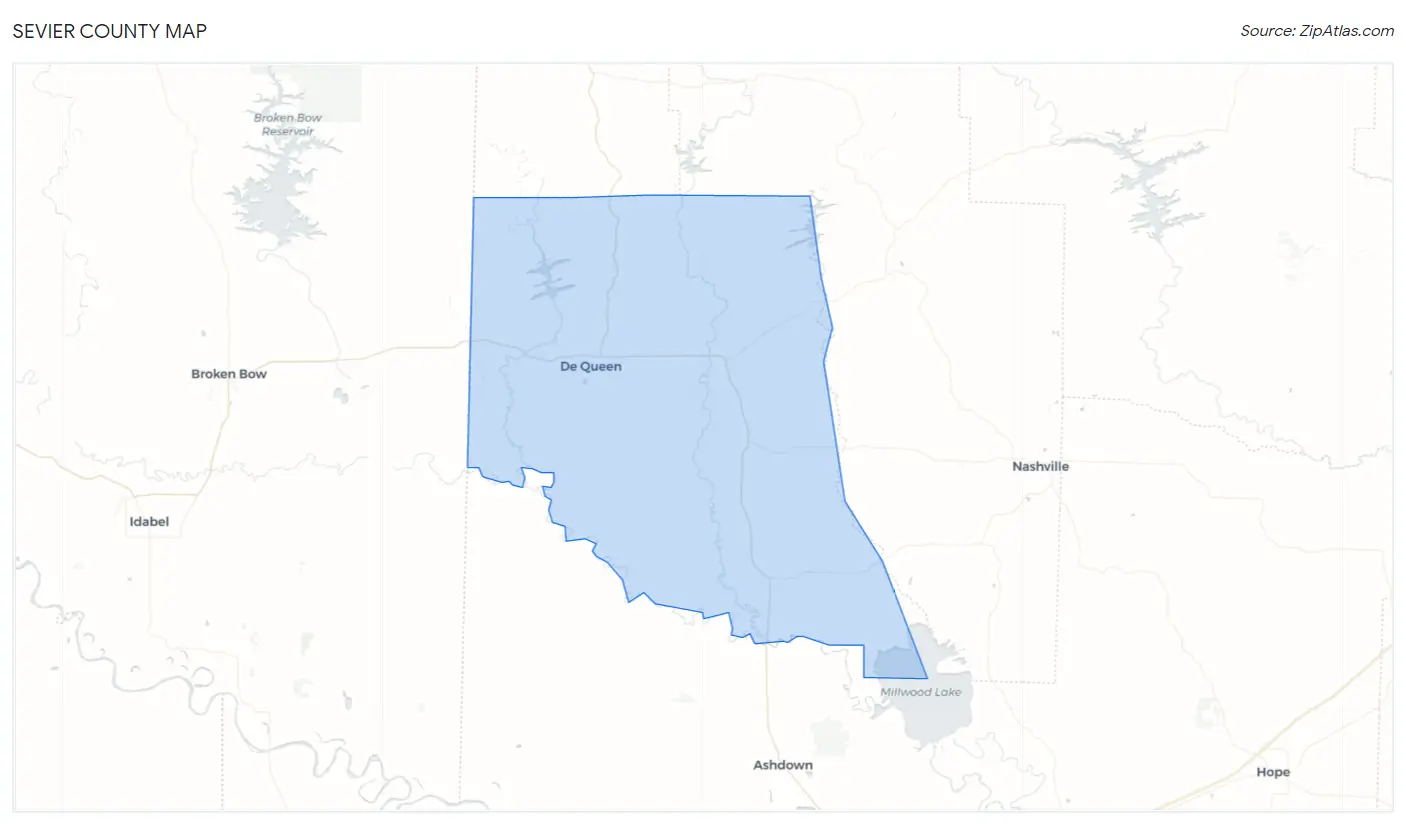
Sevier County Map
Sevier County Overview
$26,369
PER CAPITA INCOME
$59,400
AVG FAMILY INCOME
$53,567
AVG HOUSEHOLD INCOME
32.6%
WAGE / INCOME GAP [ % ]
67.4¢/ $1
WAGE / INCOME GAP [ $ ]
$13,694
FAMILY INCOME DEFICIT
0.48
INEQUALITY / GINI INDEX
15,913
TOTAL POPULATION
7,977
MALE POPULATION
7,936
FEMALE POPULATION
100.52
MALES / 100 FEMALES
99.49
FEMALES / 100 MALES
34.9
MEDIAN AGE
3.4
AVG FAMILY SIZE
2.9
AVG HOUSEHOLD SIZE
7,190
LABOR FORCE [ PEOPLE ]
60.3%
PERCENT IN LABOR FORCE
4.6%
UNEMPLOYMENT RATE
Sevier County Area Codes
Income in Sevier County
Income Overview in Sevier County
Per Capita Income in Sevier County is $26,369, while median incomes of families and households are $59,400 and $53,567 respectively.
| Characteristic | Number | Measure |
| Per Capita Income | 15,913 | $26,369 |
| Median Family Income | 3,959 | $59,400 |
| Mean Family Income | 3,959 | $83,138 |
| Median Household Income | 5,543 | $53,567 |
| Mean Household Income | 5,543 | $70,910 |
| Income Deficit | 3,959 | $13,694 |
| Wage / Income Gap (%) | 15,913 | 32.64% |
| Wage / Income Gap ($) | 15,913 | 67.36¢ per $1 |
| Gini / Inequality Index | 15,913 | 0.48 |
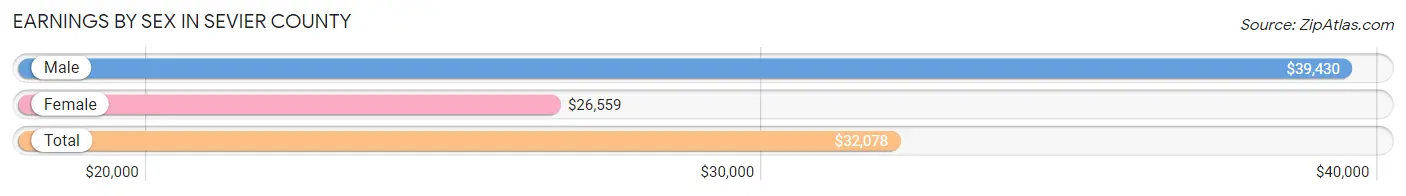
Earnings by Sex in Sevier County
Average Earnings in Sevier County are $32,078, $39,430 for men and $26,559 for women, a difference of 32.6%.
| Sex | Number | Average Earnings |
| Male | 4,226 (57.2%) | $39,430 |
| Female | 3,164 (42.8%) | $26,559 |
| Total | 7,390 (100.0%) | $32,078 |
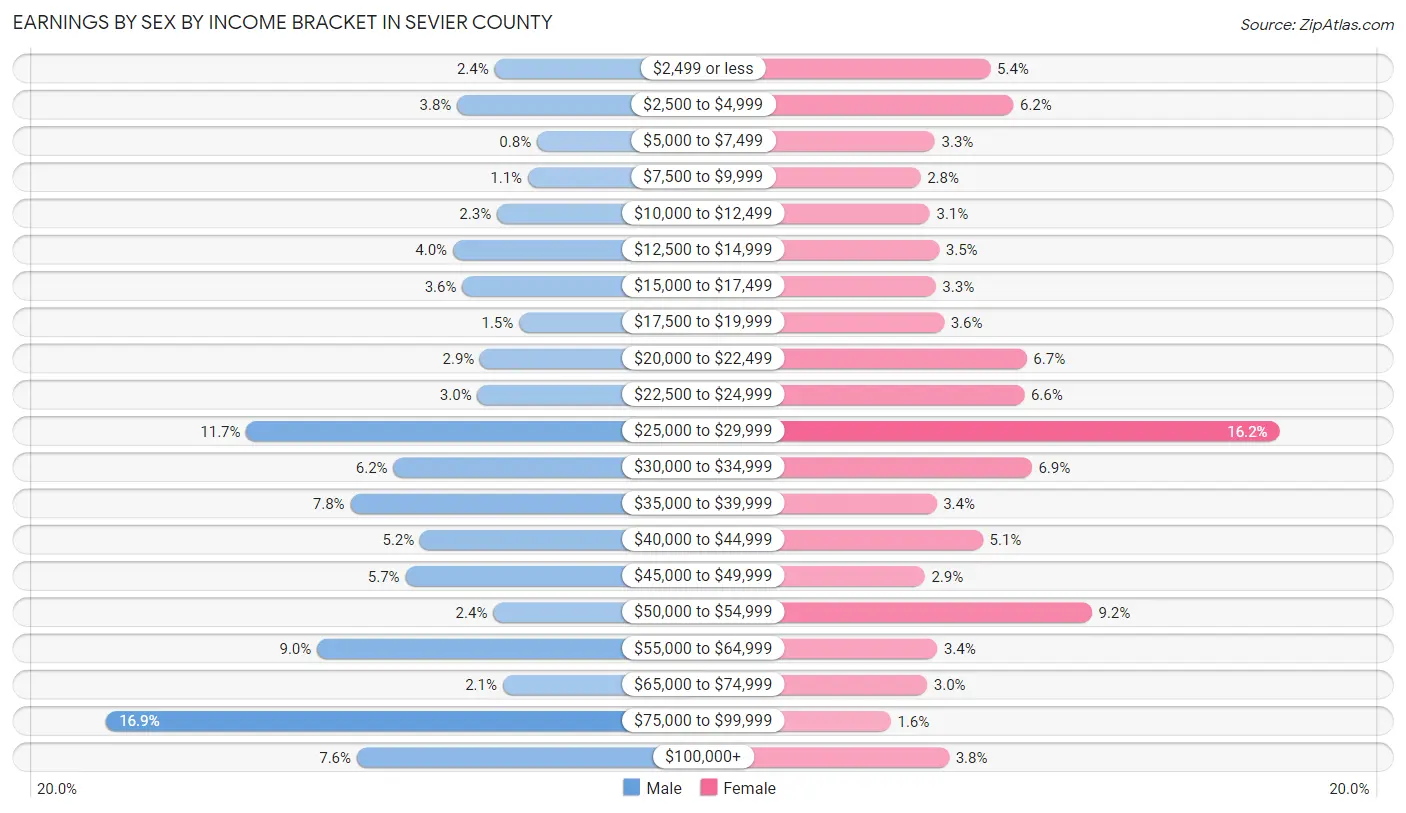
Earnings by Sex by Income Bracket in Sevier County
The most common earnings brackets in Sevier County are $75,000 to $99,999 for men (716 | 16.9%) and $25,000 to $29,999 for women (513 | 16.2%).
| Income | Male | Female |
| $2,499 or less | 101 (2.4%) | 170 (5.4%) |
| $2,500 to $4,999 | 160 (3.8%) | 197 (6.2%) |
| $5,000 to $7,499 | 34 (0.8%) | 104 (3.3%) |
| $7,500 to $9,999 | 48 (1.1%) | 87 (2.8%) |
| $10,000 to $12,499 | 97 (2.3%) | 98 (3.1%) |
| $12,500 to $14,999 | 167 (4.0%) | 109 (3.5%) |
| $15,000 to $17,499 | 152 (3.6%) | 105 (3.3%) |
| $17,500 to $19,999 | 62 (1.5%) | 115 (3.6%) |
| $20,000 to $22,499 | 124 (2.9%) | 213 (6.7%) |
| $22,500 to $24,999 | 128 (3.0%) | 210 (6.6%) |
| $25,000 to $29,999 | 494 (11.7%) | 513 (16.2%) |
| $30,000 to $34,999 | 261 (6.2%) | 219 (6.9%) |
| $35,000 to $39,999 | 329 (7.8%) | 106 (3.4%) |
| $40,000 to $44,999 | 219 (5.2%) | 161 (5.1%) |
| $45,000 to $49,999 | 242 (5.7%) | 92 (2.9%) |
| $50,000 to $54,999 | 103 (2.4%) | 290 (9.2%) |
| $55,000 to $64,999 | 382 (9.0%) | 107 (3.4%) |
| $65,000 to $74,999 | 88 (2.1%) | 95 (3.0%) |
| $75,000 to $99,999 | 716 (16.9%) | 52 (1.6%) |
| $100,000+ | 319 (7.5%) | 121 (3.8%) |
| Total | 4,226 (100.0%) | 3,164 (100.0%) |
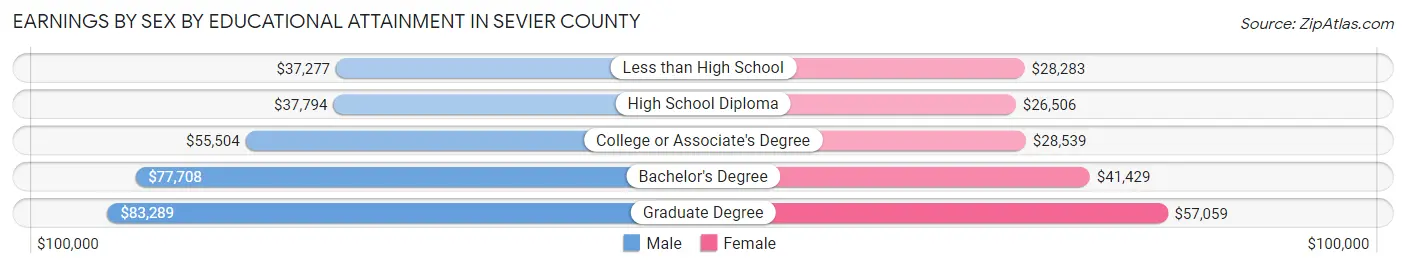
Earnings by Sex by Educational Attainment in Sevier County
Average earnings in Sevier County are $41,696 for men and $29,450 for women, a difference of 29.4%. Men with an educational attainment of graduate degree enjoy the highest average annual earnings of $83,289, while those with less than high school education earn the least with $37,277. Women with an educational attainment of graduate degree earn the most with the average annual earnings of $57,059, while those with high school diploma education have the smallest earnings of $26,506.
| Educational Attainment | Male Income | Female Income |
| Less than High School | $37,277 | $28,283 |
| High School Diploma | $37,794 | $26,506 |
| College or Associate's Degree | $55,504 | $28,539 |
| Bachelor's Degree | $77,708 | $41,429 |
| Graduate Degree | $83,289 | $57,059 |
| Total | $41,696 | $29,450 |
Family Income in Sevier County
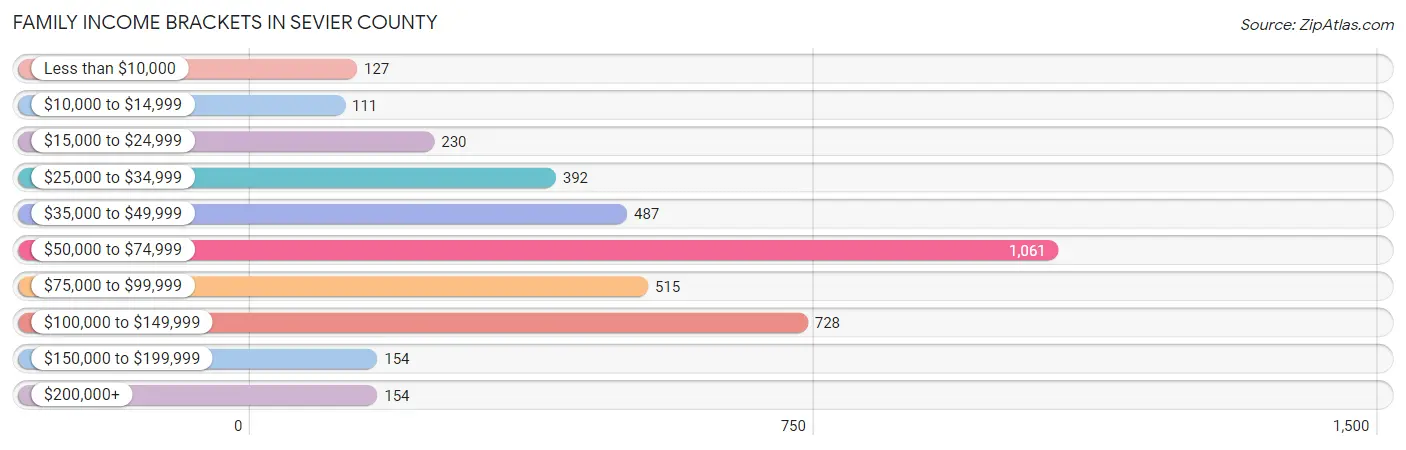
Family Income Brackets in Sevier County
According to the Sevier County family income data, there are 1,061 families falling into the $50,000 to $74,999 income range, which is the most common income bracket and makes up 26.8% of all families. Conversely, the $10,000 to $14,999 income bracket is the least frequent group with only 111 families (2.8%) belonging to this category.
| Income Bracket | # Families | % Families |
| Less than $10,000 | 127 | 3.2% |
| $10,000 to $14,999 | 111 | 2.8% |
| $15,000 to $24,999 | 230 | 5.8% |
| $25,000 to $34,999 | 392 | 9.9% |
| $35,000 to $49,999 | 487 | 12.3% |
| $50,000 to $74,999 | 1,061 | 26.8% |
| $75,000 to $99,999 | 515 | 13.0% |
| $100,000 to $149,999 | 728 | 18.4% |
| $150,000 to $199,999 | 154 | 3.9% |
| $200,000+ | 154 | 3.9% |
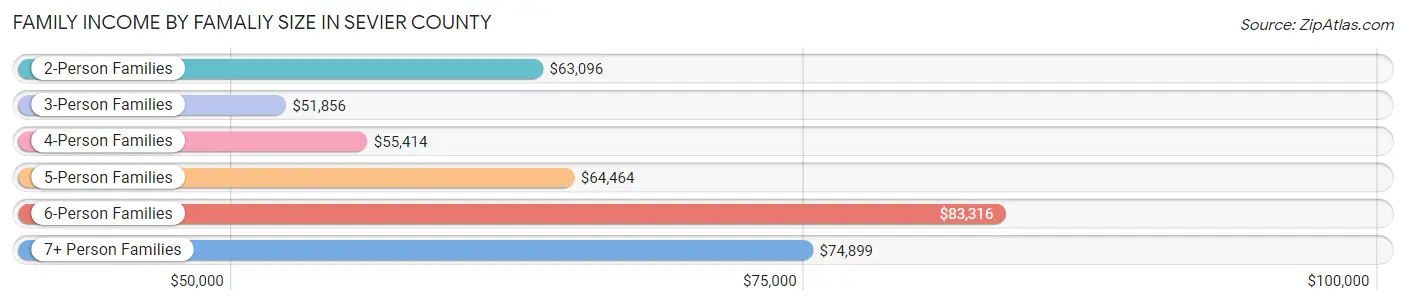
Family Income by Famaliy Size in Sevier County
6-person families (331 | 8.4%) account for the highest median family income in Sevier County with $83,316 per family, while 2-person families (1,747 | 44.1%) have the highest median income of $31,548 per family member.
| Income Bracket | # Families | Median Income |
| 2-Person Families | 1,747 (44.1%) | $63,096 |
| 3-Person Families | 723 (18.3%) | $51,856 |
| 4-Person Families | 520 (13.1%) | $55,414 |
| 5-Person Families | 477 (12.0%) | $64,464 |
| 6-Person Families | 331 (8.4%) | $83,316 |
| 7+ Person Families | 161 (4.1%) | $74,899 |
| Total | 3,959 (100.0%) | $59,400 |
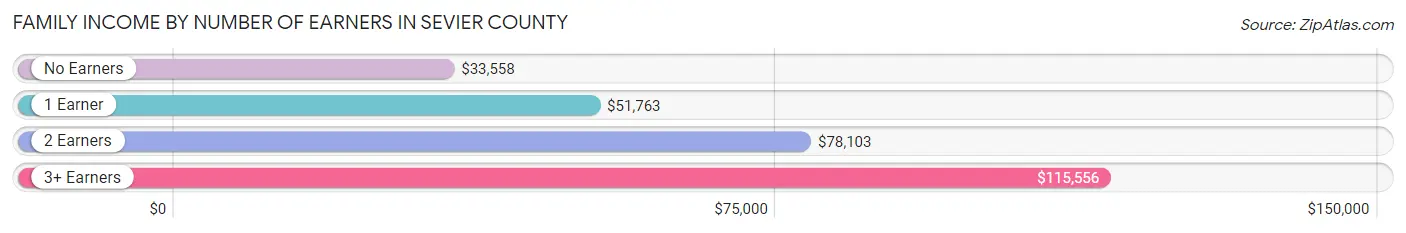
Family Income by Number of Earners in Sevier County
The median family income in Sevier County is $59,400, with families comprising 3+ earners (386) having the highest median family income of $115,556, while families with no earners (604) have the lowest median family income of $33,558, accounting for 9.8% and 15.3% of families, respectively.
| Number of Earners | # Families | Median Income |
| No Earners | 604 (15.3%) | $33,558 |
| 1 Earner | 1,303 (32.9%) | $51,763 |
| 2 Earners | 1,666 (42.1%) | $78,103 |
| 3+ Earners | 386 (9.8%) | $115,556 |
| Total | 3,959 (100.0%) | $59,400 |
Household Income in Sevier County
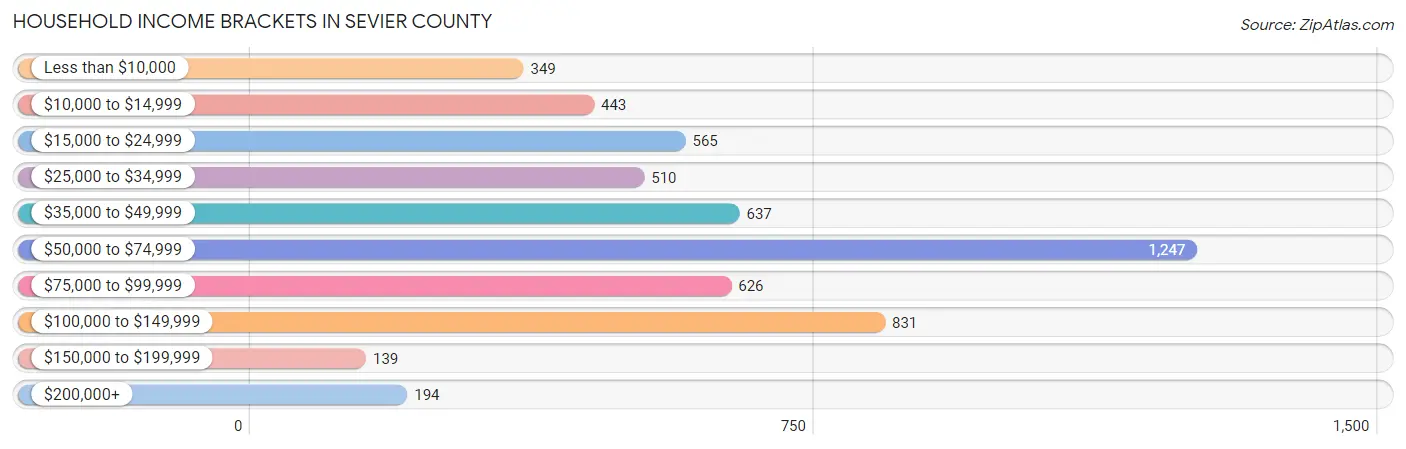
Household Income Brackets in Sevier County
With 1,247 households falling in the category, the $50,000 to $74,999 income range is the most frequent in Sevier County, accounting for 22.5% of all households. In contrast, only 139 households (2.5%) fall into the $150,000 to $199,999 income bracket, making it the least populous group.
| Income Bracket | # Households | % Households |
| Less than $10,000 | 349 | 6.3% |
| $10,000 to $14,999 | 443 | 8.0% |
| $15,000 to $24,999 | 565 | 10.2% |
| $25,000 to $34,999 | 510 | 9.2% |
| $35,000 to $49,999 | 637 | 11.5% |
| $50,000 to $74,999 | 1,247 | 22.5% |
| $75,000 to $99,999 | 626 | 11.3% |
| $100,000 to $149,999 | 831 | 15.0% |
| $150,000 to $199,999 | 139 | 2.5% |
| $200,000+ | 194 | 3.5% |
Household Income by Householder Age in Sevier County
The median household income in Sevier County is $53,567, with the highest median household income of $58,663 found in the 45 to 64 years age bracket for the primary householder. A total of 2,194 households (39.6%) fall into this category. Meanwhile, the 15 to 24 years age bracket for the primary householder has the lowest median household income of $48,400, with 94 households (1.7%) in this group.
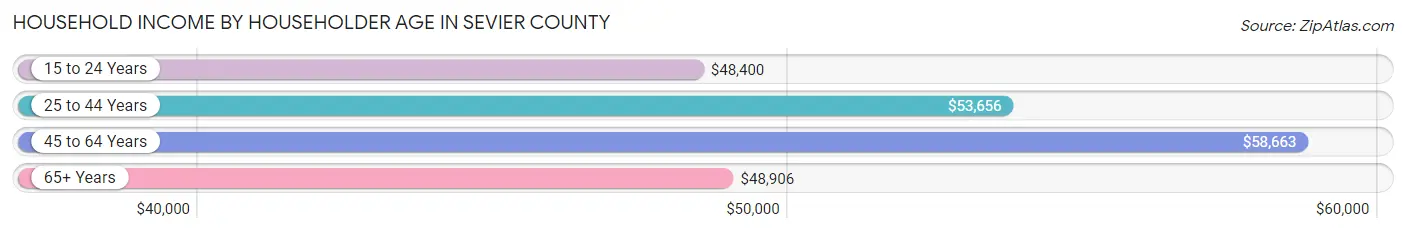
| Income Bracket | # Households | Median Income |
| 15 to 24 Years | 94 (1.7%) | $48,400 |
| 25 to 44 Years | 1,807 (32.6%) | $53,656 |
| 45 to 64 Years | 2,194 (39.6%) | $58,663 |
| 65+ Years | 1,448 (26.1%) | $48,906 |
| Total | 5,543 (100.0%) | $53,567 |
Poverty in Sevier County
Income Below Poverty by Sex and Age in Sevier County
With 17.5% poverty level for males and 22.7% for females among the residents of Sevier County, 5 year old males and 5 year old females are the most vulnerable to poverty, with 61 males (53.5%) and 47 females (49.5%) in their respective age groups living below the poverty level.
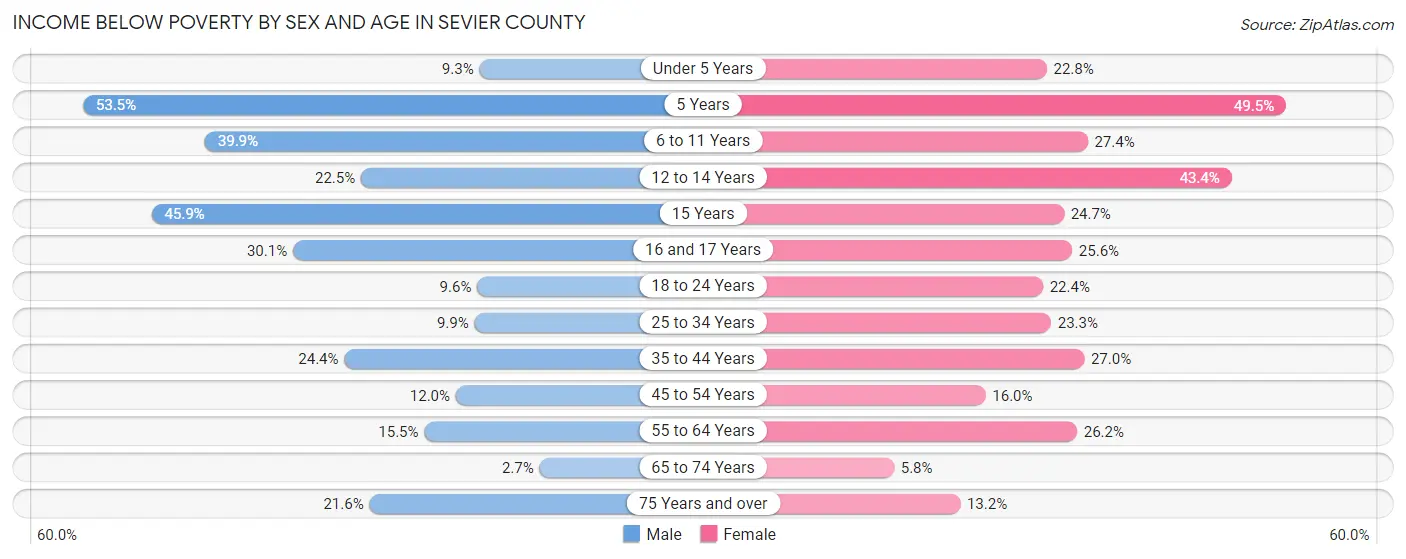
| Age Bracket | Male | Female |
| Under 5 Years | 58 (9.3%) | 122 (22.8%) |
| 5 Years | 61 (53.5%) | 47 (49.5%) |
| 6 to 11 Years | 283 (39.9%) | 238 (27.4%) |
| 12 to 14 Years | 73 (22.5%) | 122 (43.4%) |
| 15 Years | 50 (45.9%) | 43 (24.7%) |
| 16 and 17 Years | 84 (30.1%) | 61 (25.6%) |
| 18 to 24 Years | 79 (9.6%) | 171 (22.4%) |
| 25 to 34 Years | 97 (9.9%) | 210 (23.3%) |
| 35 to 44 Years | 231 (24.4%) | 277 (27.0%) |
| 45 to 54 Years | 112 (12.0%) | 137 (16.0%) |
| 55 to 64 Years | 158 (15.5%) | 241 (26.2%) |
| 65 to 74 Years | 17 (2.6%) | 41 (5.8%) |
| 75 Years and over | 76 (21.6%) | 55 (13.2%) |
| Total | 1,379 (17.5%) | 1,765 (22.7%) |
Income Above Poverty by Sex and Age in Sevier County
According to the poverty statistics in Sevier County, males aged 65 to 74 years and females aged 65 to 74 years are the age groups that are most secure financially, with 97.4% of males and 94.2% of females in these age groups living above the poverty line.
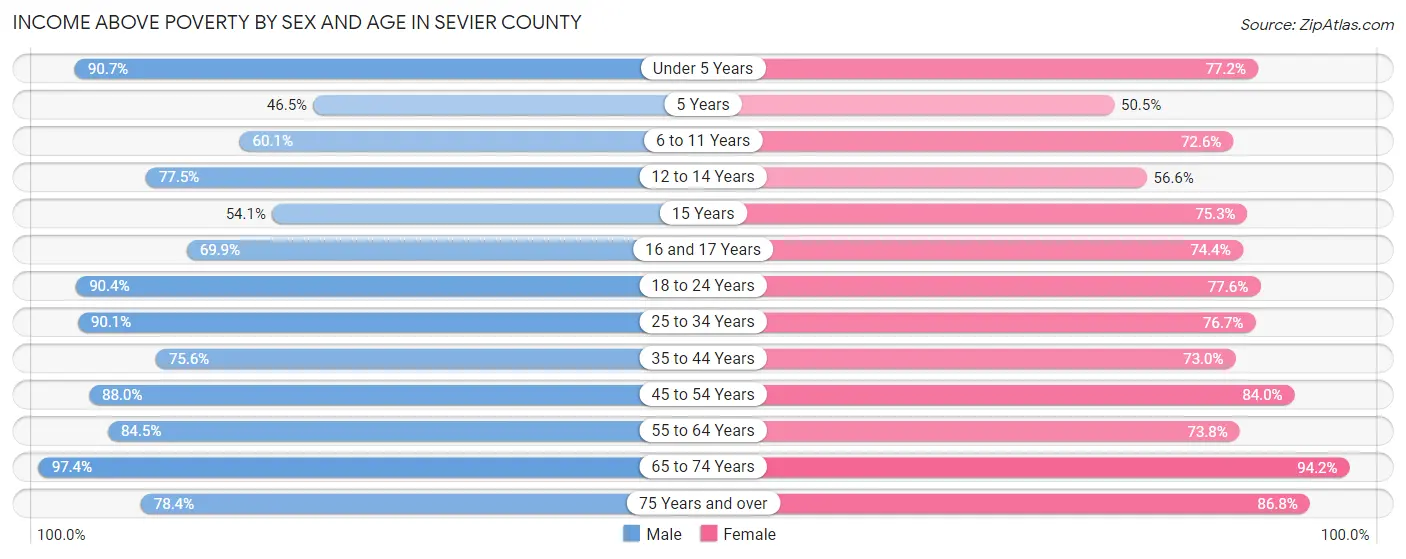
| Age Bracket | Male | Female |
| Under 5 Years | 563 (90.7%) | 413 (77.2%) |
| 5 Years | 53 (46.5%) | 48 (50.5%) |
| 6 to 11 Years | 426 (60.1%) | 632 (72.6%) |
| 12 to 14 Years | 251 (77.5%) | 159 (56.6%) |
| 15 Years | 59 (54.1%) | 131 (75.3%) |
| 16 and 17 Years | 195 (69.9%) | 177 (74.4%) |
| 18 to 24 Years | 745 (90.4%) | 593 (77.6%) |
| 25 to 34 Years | 884 (90.1%) | 692 (76.7%) |
| 35 to 44 Years | 716 (75.6%) | 750 (73.0%) |
| 45 to 54 Years | 824 (88.0%) | 720 (84.0%) |
| 55 to 64 Years | 863 (84.5%) | 680 (73.8%) |
| 65 to 74 Years | 624 (97.4%) | 667 (94.2%) |
| 75 Years and over | 276 (78.4%) | 363 (86.8%) |
| Total | 6,479 (82.5%) | 6,025 (77.3%) |
Income Below Poverty Among Married-Couple Families in Sevier County
The poverty statistics for married-couple families in Sevier County show that 6.2% or 190 of the total 3,062 families live below the poverty line. Families with 3 or 4 children have the highest poverty rate of 11.6%, comprising of 62 families. On the other hand, families with 5 or more children have the lowest poverty rate of 0.0%, which includes 0 families.
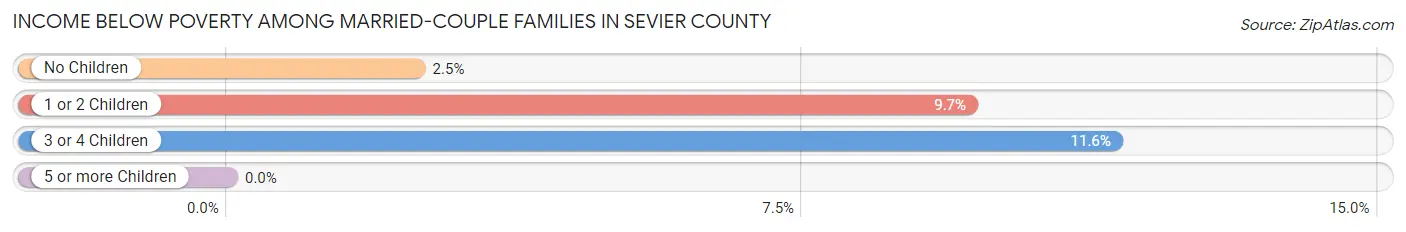
| Children | Above Poverty | Below Poverty |
| No Children | 1,515 (97.6%) | 38 (2.5%) |
| 1 or 2 Children | 842 (90.3%) | 90 (9.7%) |
| 3 or 4 Children | 475 (88.4%) | 62 (11.6%) |
| 5 or more Children | 40 (100.0%) | 0 (0.0%) |
| Total | 2,872 (93.8%) | 190 (6.2%) |
Income Below Poverty Among Single-Parent Households in Sevier County
According to the poverty data in Sevier County, 23.4% or 45 single-father households and 38.2% or 269 single-mother households are living below the poverty line. Among single-father households, those with 5 or more children have the highest poverty rate, with 19 households (100.0%) experiencing poverty. Likewise, among single-mother households, those with 5 or more children have the highest poverty rate, with 7 households (100.0%) falling below the poverty line.
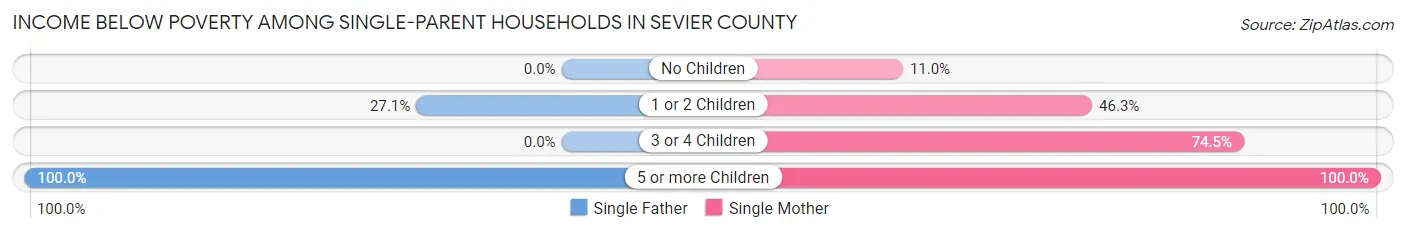
| Children | Single Father | Single Mother |
| No Children | 0 (0.0%) | 33 (11.0%) |
| 1 or 2 Children | 26 (27.1%) | 112 (46.3%) |
| 3 or 4 Children | 0 (0.0%) | 117 (74.5%) |
| 5 or more Children | 19 (100.0%) | 7 (100.0%) |
| Total | 45 (23.4%) | 269 (38.2%) |
Income Below Poverty Among Married-Couple vs Single-Parent Households in Sevier County
The poverty data for Sevier County shows that 190 of the married-couple family households (6.2%) and 314 of the single-parent households (35.0%) are living below the poverty level. Within the married-couple family households, those with 3 or 4 children have the highest poverty rate, with 62 households (11.6%) falling below the poverty line. Among the single-parent households, those with 5 or more children have the highest poverty rate, with 26 household (100.0%) living below poverty.
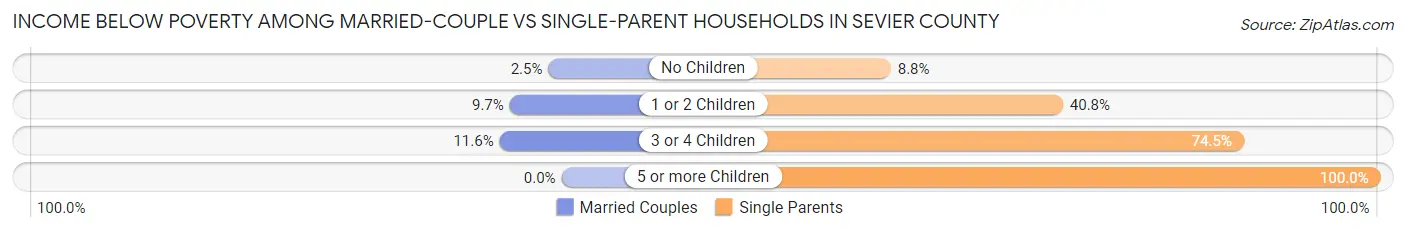
| Children | Married-Couple Families | Single-Parent Households |
| No Children | 38 (2.5%) | 33 (8.8%) |
| 1 or 2 Children | 90 (9.7%) | 138 (40.8%) |
| 3 or 4 Children | 62 (11.6%) | 117 (74.5%) |
| 5 or more Children | 0 (0.0%) | 26 (100.0%) |
| Total | 190 (6.2%) | 314 (35.0%) |
Race in Sevier County
The most populous races in Sevier County are White / Caucasian (9,216 | 57.9%), Hispanic or Latino (5,458 | 34.3%), and Some other Race (4,553 | 28.6%).
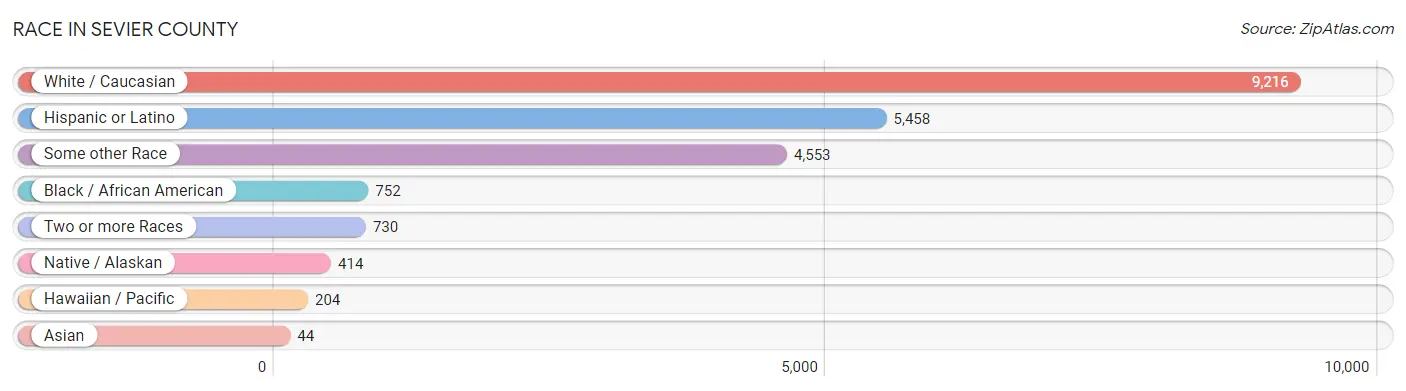
| Race | # Population | % Population |
| Asian | 44 | 0.3% |
| Black / African American | 752 | 4.7% |
| Hawaiian / Pacific | 204 | 1.3% |
| Hispanic or Latino | 5,458 | 34.3% |
| Native / Alaskan | 414 | 2.6% |
| White / Caucasian | 9,216 | 57.9% |
| Two or more Races | 730 | 4.6% |
| Some other Race | 4,553 | 28.6% |
| Total | 15,913 | 100.0% |
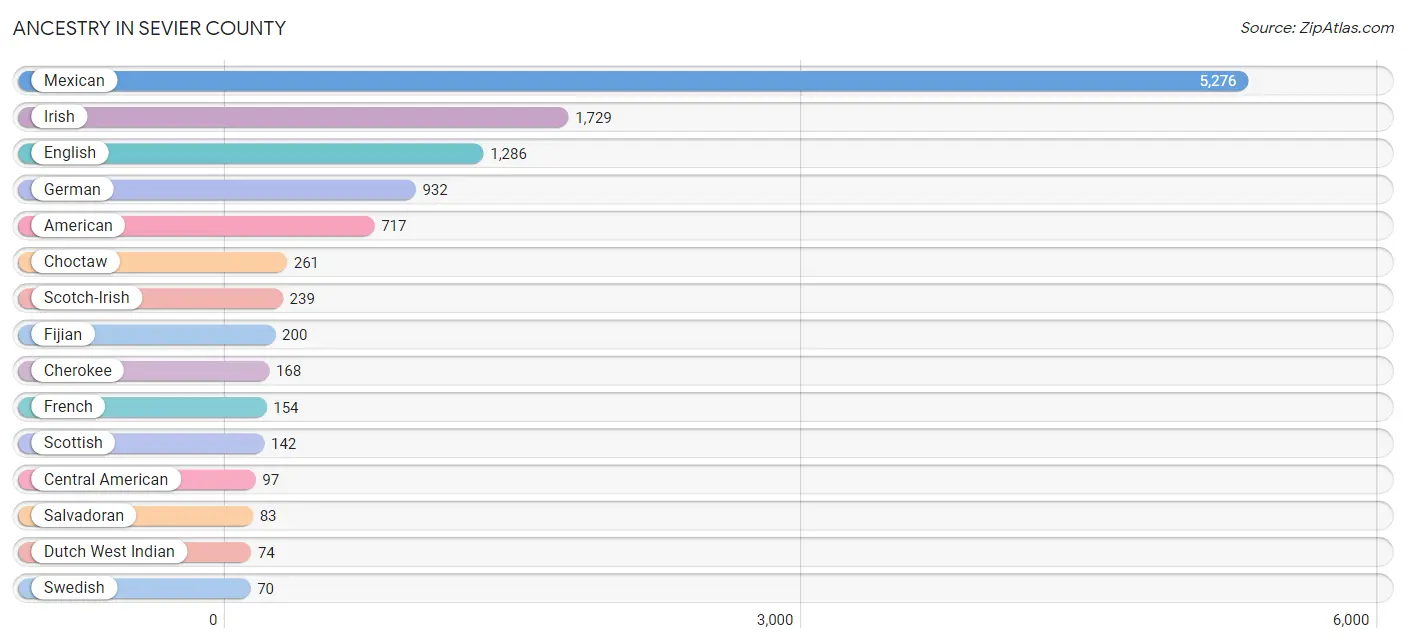
Ancestry in Sevier County
The most populous ancestries reported in Sevier County are Mexican (5,276 | 33.2%), Irish (1,729 | 10.9%), English (1,286 | 8.1%), German (932 | 5.9%), and American (717 | 4.5%), together accounting for 62.5% of all Sevier County residents.
| Ancestry | # Population | % Population |
| Alsatian | 31 | 0.2% |
| American | 717 | 4.5% |
| Cajun | 15 | 0.1% |
| Central American | 97 | 0.6% |
| Cherokee | 168 | 1.1% |
| Chippewa | 16 | 0.1% |
| Choctaw | 261 | 1.6% |
| Creek | 3 | 0.0% |
| Cuban | 1 | 0.0% |
| Czechoslovakian | 23 | 0.1% |
| Dutch | 58 | 0.4% |
| Dutch West Indian | 74 | 0.5% |
| English | 1,286 | 8.1% |
| European | 67 | 0.4% |
| Fijian | 200 | 1.3% |
| French | 154 | 1.0% |
| German | 932 | 5.9% |
| Indian (Asian) | 1 | 0.0% |
| Irish | 1,729 | 10.9% |
| Italian | 39 | 0.3% |
| Korean | 11 | 0.1% |
| Mexican | 5,276 | 33.2% |
| Mexican American Indian | 39 | 0.3% |
| Native Hawaiian | 1 | 0.0% |
| Navajo | 26 | 0.2% |
| Panamanian | 14 | 0.1% |
| Polish | 2 | 0.0% |
| Salvadoran | 83 | 0.5% |
| Scandinavian | 7 | 0.0% |
| Scotch-Irish | 239 | 1.5% |
| Scottish | 142 | 0.9% |
| Sri Lankan | 43 | 0.3% |
| Subsaharan African | 2 | 0.0% |
| Swedish | 70 | 0.4% |
| Swiss | 9 | 0.1% |
| Thai | 2 | 0.0% |
| Welsh | 24 | 0.2% | View All 37 Rows |
Immigrants in Sevier County
The most numerous immigrant groups reported in Sevier County came from Latin America (2,217 | 13.9%), Central America (2,199 | 13.8%), Mexico (2,122 | 13.3%), Oceania (153 | 1.0%), and El Salvador (74 | 0.5%), together accounting for 42.5% of all Sevier County residents.
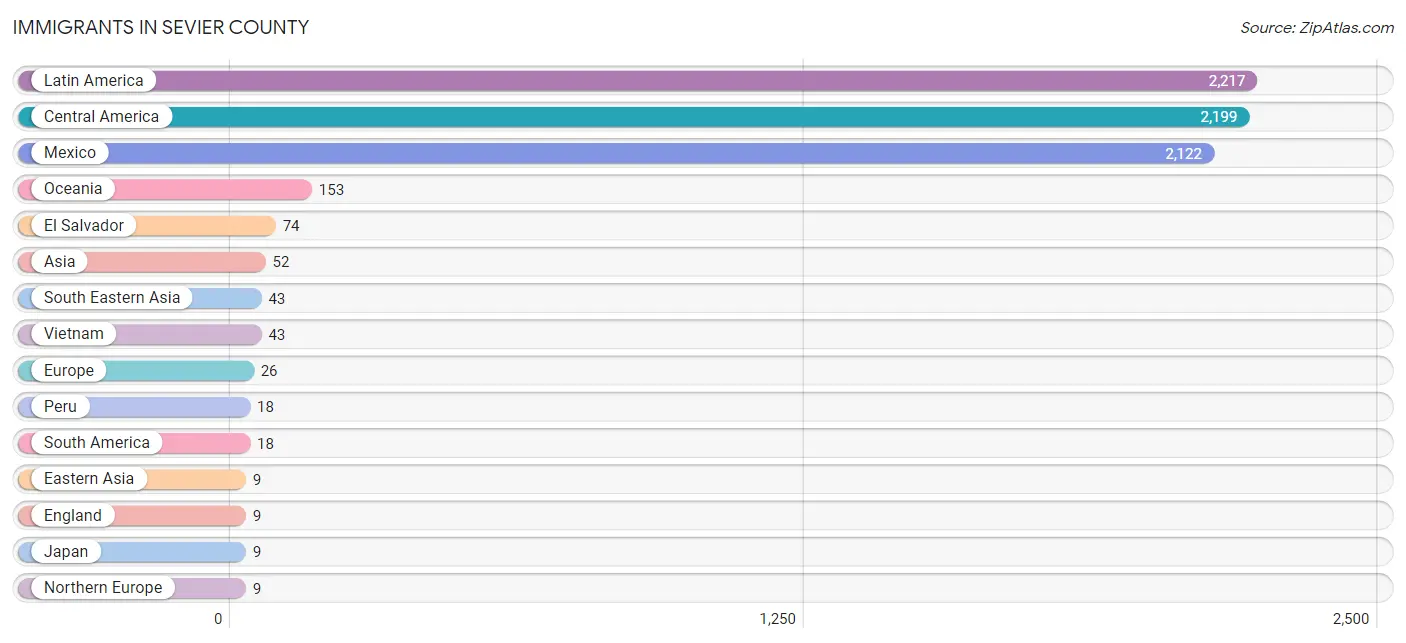
| Immigration Origin | # Population | % Population |
| Asia | 52 | 0.3% |
| Central America | 2,199 | 13.8% |
| Eastern Asia | 9 | 0.1% |
| Eastern Europe | 8 | 0.1% |
| El Salvador | 74 | 0.5% |
| England | 9 | 0.1% |
| Europe | 26 | 0.2% |
| Honduras | 3 | 0.0% |
| Japan | 9 | 0.1% |
| Latin America | 2,217 | 13.9% |
| Mexico | 2,122 | 13.3% |
| Northern Europe | 9 | 0.1% |
| Oceania | 153 | 1.0% |
| Peru | 18 | 0.1% |
| South America | 18 | 0.1% |
| South Eastern Asia | 43 | 0.3% |
| Southern Europe | 9 | 0.1% |
| Spain | 9 | 0.1% |
| Vietnam | 43 | 0.3% | View All 19 Rows |
Sex and Age in Sevier County
Sex and Age in Sevier County
The most populous age groups in Sevier County are 5 to 9 Years (739 | 9.3%) for men and 10 to 14 Years (795 | 10.0%) for women.
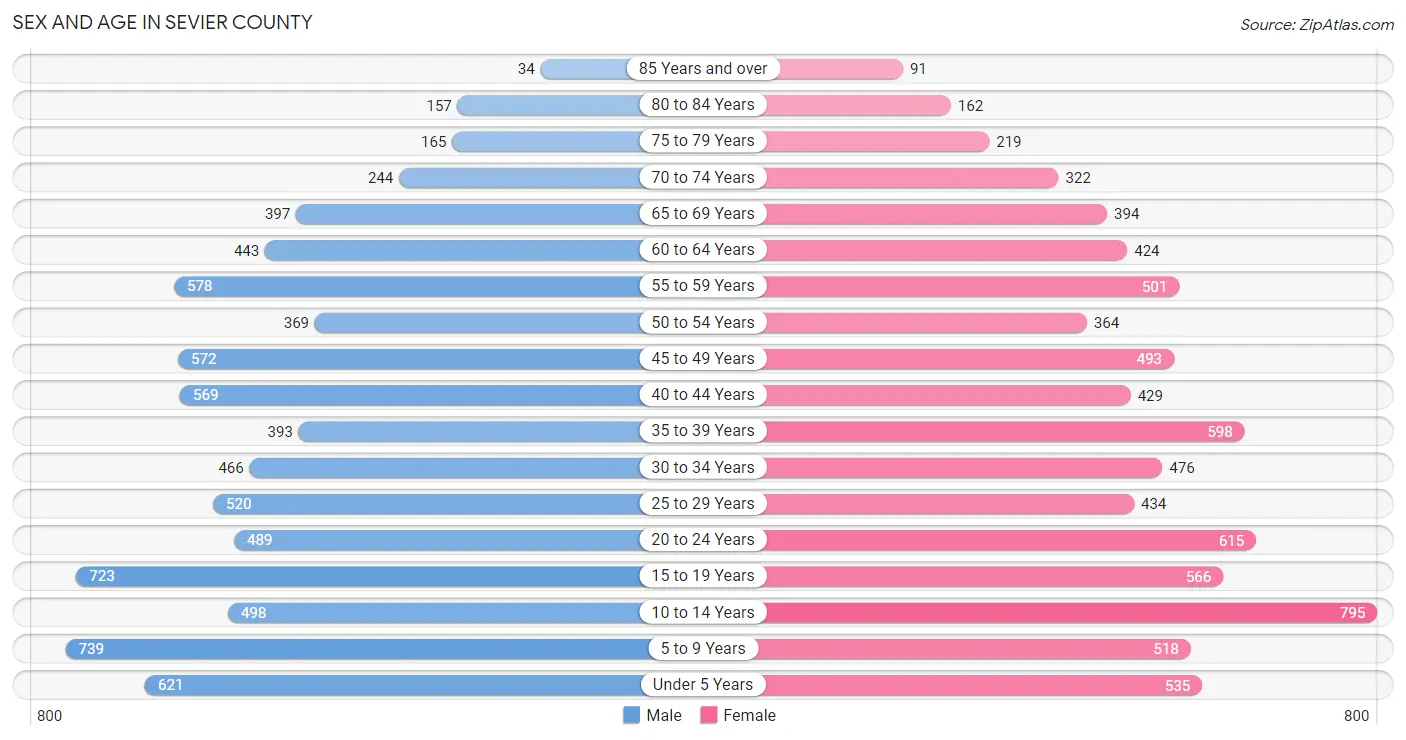
| Age Bracket | Male | Female |
| Under 5 Years | 621 (7.8%) | 535 (6.7%) |
| 5 to 9 Years | 739 (9.3%) | 518 (6.5%) |
| 10 to 14 Years | 498 (6.2%) | 795 (10.0%) |
| 15 to 19 Years | 723 (9.1%) | 566 (7.1%) |
| 20 to 24 Years | 489 (6.1%) | 615 (7.7%) |
| 25 to 29 Years | 520 (6.5%) | 434 (5.5%) |
| 30 to 34 Years | 466 (5.8%) | 476 (6.0%) |
| 35 to 39 Years | 393 (4.9%) | 598 (7.5%) |
| 40 to 44 Years | 569 (7.1%) | 429 (5.4%) |
| 45 to 49 Years | 572 (7.2%) | 493 (6.2%) |
| 50 to 54 Years | 369 (4.6%) | 364 (4.6%) |
| 55 to 59 Years | 578 (7.2%) | 501 (6.3%) |
| 60 to 64 Years | 443 (5.6%) | 424 (5.3%) |
| 65 to 69 Years | 397 (5.0%) | 394 (5.0%) |
| 70 to 74 Years | 244 (3.1%) | 322 (4.1%) |
| 75 to 79 Years | 165 (2.1%) | 219 (2.8%) |
| 80 to 84 Years | 157 (2.0%) | 162 (2.0%) |
| 85 Years and over | 34 (0.4%) | 91 (1.1%) |
| Total | 7,977 (100.0%) | 7,936 (100.0%) |
Families and Households in Sevier County
Median Family Size in Sevier County
The median family size in Sevier County is 3.43 persons per family, with single male/father families (192 | 4.9%) accounting for the largest median family size of 3.79 persons per family. On the other hand, married-couple families (3,062 | 77.3%) represent the smallest median family size with 3.38 persons per family.
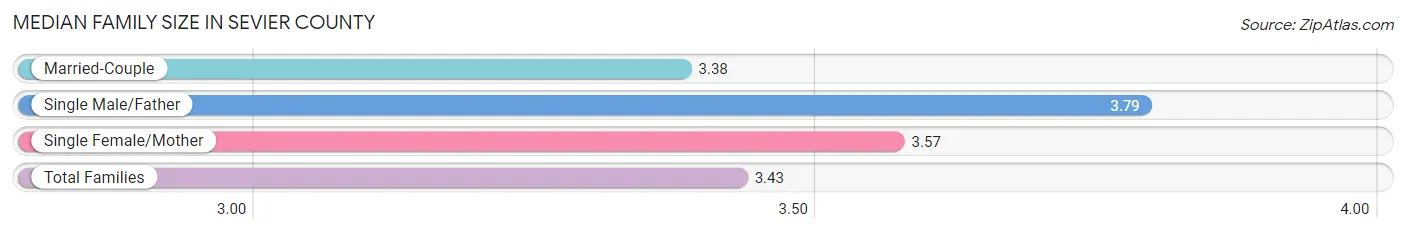
| Family Type | # Families | Family Size |
| Married-Couple | 3,062 (77.3%) | 3.38 |
| Single Male/Father | 192 (4.9%) | 3.79 |
| Single Female/Mother | 705 (17.8%) | 3.57 |
| Total Families | 3,959 (100.0%) | 3.43 |
Median Household Size in Sevier County
The median household size in Sevier County is 2.85 persons per household, with single male/father households (192 | 3.5%) accounting for the largest median household size of 4.11 persons per household. non-family households (1,584 | 28.6%) represent the smallest median household size with 1.10 persons per household.
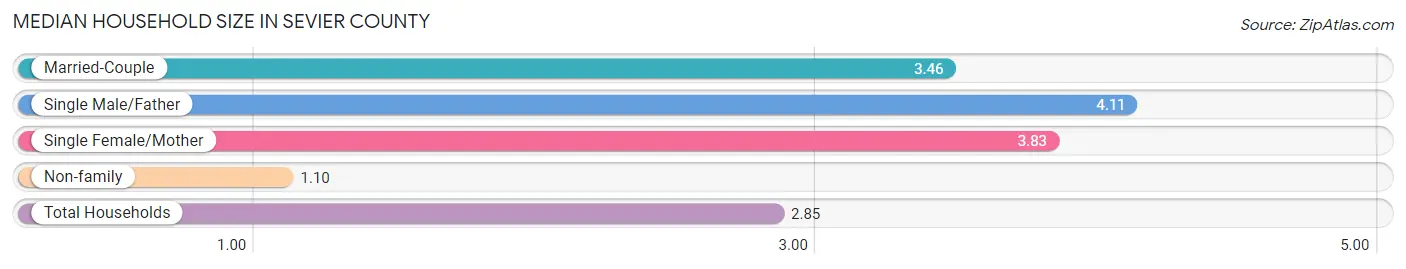
| Household Type | # Households | Household Size |
| Married-Couple | 3,062 (55.2%) | 3.46 |
| Single Male/Father | 192 (3.5%) | 4.11 |
| Single Female/Mother | 705 (12.7%) | 3.83 |
| Non-family | 1,584 (28.6%) | 1.10 |
| Total Households | 5,543 (100.0%) | 2.85 |
Household Size by Marriage Status in Sevier County
Out of a total of 5,543 households in Sevier County, 3,959 (71.4%) are family households, while 1,584 (28.6%) are nonfamily households. The most numerous type of family households are 2-person households, comprising 1,677, and the most common type of nonfamily households are 1-person households, comprising 1,487.
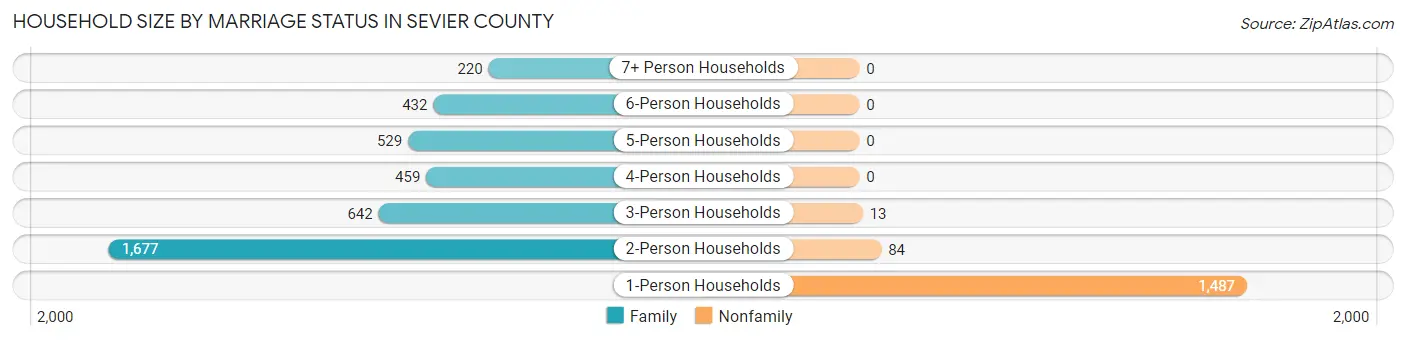
| Household Size | Family Households | Nonfamily Households |
| 1-Person Households | - | 1,487 (26.8%) |
| 2-Person Households | 1,677 (30.2%) | 84 (1.5%) |
| 3-Person Households | 642 (11.6%) | 13 (0.2%) |
| 4-Person Households | 459 (8.3%) | 0 (0.0%) |
| 5-Person Households | 529 (9.5%) | 0 (0.0%) |
| 6-Person Households | 432 (7.8%) | 0 (0.0%) |
| 7+ Person Households | 220 (4.0%) | 0 (0.0%) |
| Total | 3,959 (71.4%) | 1,584 (28.6%) |
Female Fertility in Sevier County
Fertility by Age in Sevier County
Average fertility rate in Sevier County is 25.0 births per 1,000 women. Women in the age bracket of 20 to 34 years have the highest fertility rate with 61.0 births per 1,000 women. Women in the age bracket of 20 to 34 years acount for 100.0% of all women with births.
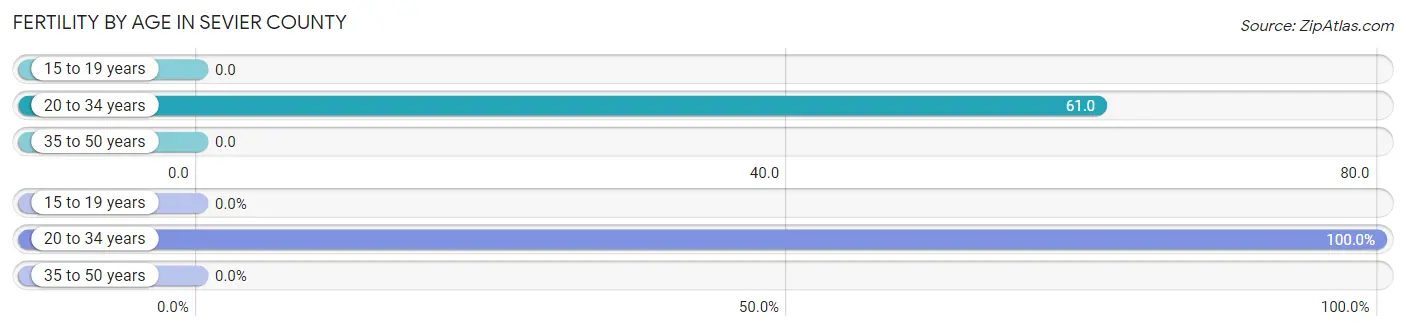
| Age Bracket | Women with Births | Births / 1,000 Women |
| 15 to 19 years | 0 (0.0%) | 0.0 |
| 20 to 34 years | 93 (100.0%) | 61.0 |
| 35 to 50 years | 0 (0.0%) | 0.0 |
| Total | 93 (100.0%) | 25.0 |
Fertility by Age by Marriage Status in Sevier County
67.7% of women with births (93) in Sevier County are married. The highest percentage of unmarried women with births falls into 20 to 34 years age bracket with 32.3% of them unmarried at the time of birth, while the lowest percentage of unmarried women with births belong to 20 to 34 years age bracket with 32.3% of them unmarried.
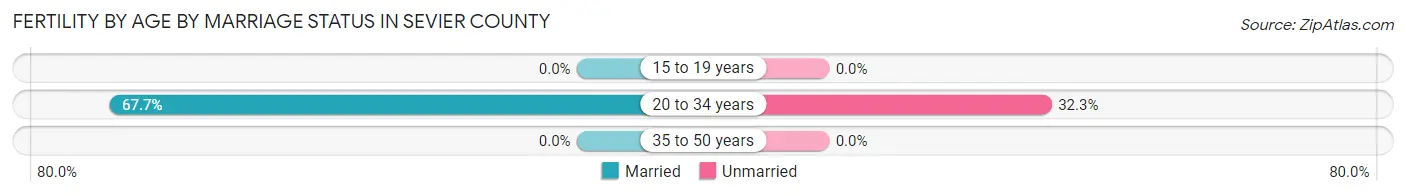
| Age Bracket | Married | Unmarried |
| 15 to 19 years | 0 (0.0%) | 0 (0.0%) |
| 20 to 34 years | 63 (67.7%) | 30 (32.3%) |
| 35 to 50 years | 0 (0.0%) | 0 (0.0%) |
| Total | 63 (67.7%) | 30 (32.3%) |
Fertility by Education in Sevier County
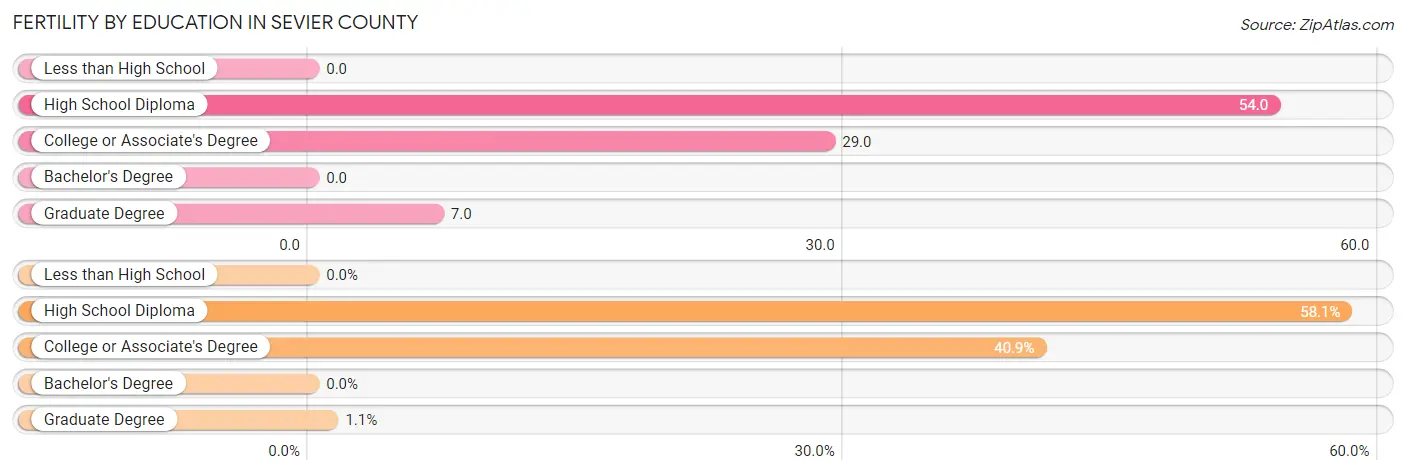
| Educational Attainment | Women with Births | Births / 1,000 Women |
| Less than High School | 0 (0.0%) | 0.0 |
| High School Diploma | 54 (58.1%) | 54.0 |
| College or Associate's Degree | 38 (40.9%) | 29.0 |
| Bachelor's Degree | 0 (0.0%) | 0.0 |
| Graduate Degree | 1 (1.1%) | 7.0 |
| Total | 93 (100.0%) | 25.0 |
Fertility by Education by Marriage Status in Sevier County
32.3% of women with births in Sevier County are unmarried. Women with the educational attainment of graduate degree are most likely to be married with 100.0% of them married at childbirth, while women with the educational attainment of college or associate's degree are least likely to be married with 39.5% of them unmarried at childbirth.
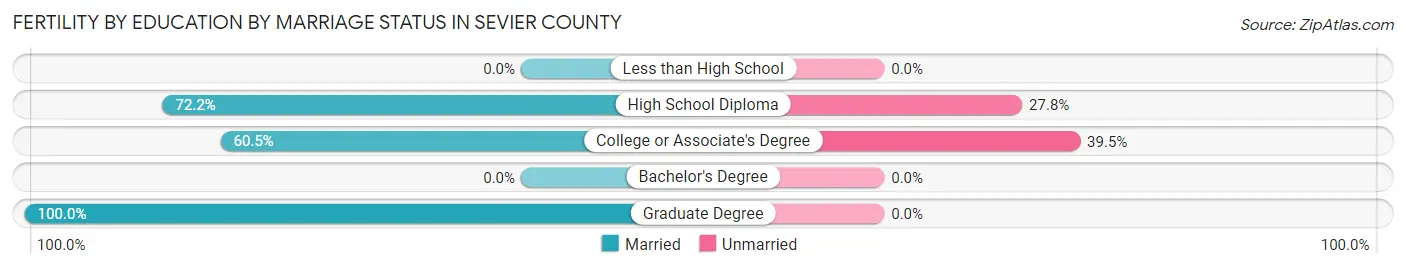
| Educational Attainment | Married | Unmarried |
| Less than High School | 0 (0.0%) | 0 (0.0%) |
| High School Diploma | 39 (72.2%) | 15 (27.8%) |
| College or Associate's Degree | 23 (60.5%) | 15 (39.5%) |
| Bachelor's Degree | 0 (0.0%) | 0 (0.0%) |
| Graduate Degree | 1 (100.0%) | 0 (0.0%) |
| Total | 63 (67.7%) | 30 (32.3%) |
Employment Characteristics in Sevier County
Employment by Class of Employer in Sevier County
Among the 6,683 employed individuals in Sevier County, private company employees (4,762 | 71.3%), self-employed (not incorporated) (524 | 7.8%), and local government employees (470 | 7.0%) make up the most common classes of employment.
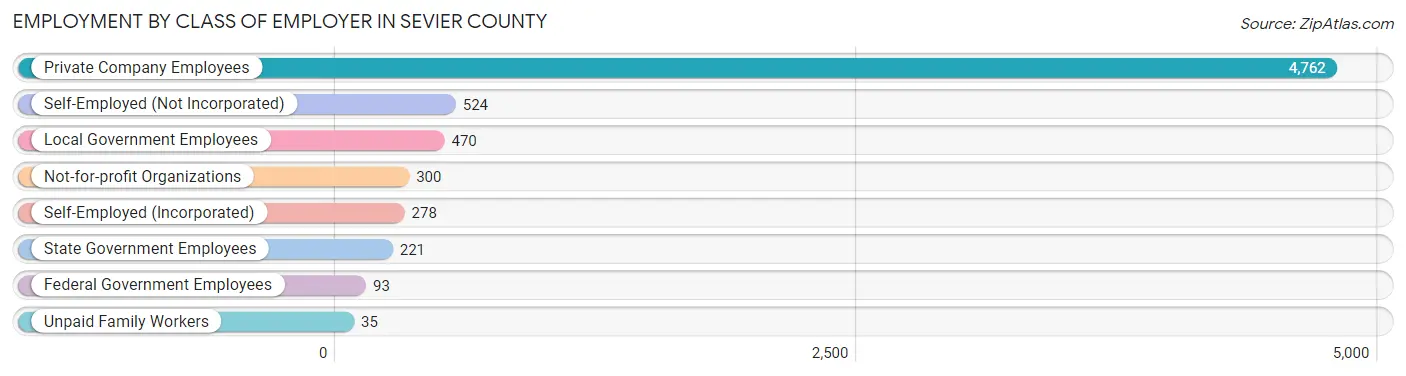
| Employer Class | # Employees | % Employees |
| Private Company Employees | 4,762 | 71.3% |
| Self-Employed (Incorporated) | 278 | 4.2% |
| Self-Employed (Not Incorporated) | 524 | 7.8% |
| Not-for-profit Organizations | 300 | 4.5% |
| Local Government Employees | 470 | 7.0% |
| State Government Employees | 221 | 3.3% |
| Federal Government Employees | 93 | 1.4% |
| Unpaid Family Workers | 35 | 0.5% |
| Total | 6,683 | 100.0% |
Employment Status by Age in Sevier County
According to the labor force statistics for Sevier County, out of the total population over 16 years of age (11,924), 60.3% or 7,190 individuals are in the labor force, with 4.6% or 331 of them unemployed. The age group with the highest labor force participation rate is 25 to 29 years, with 87.3% or 833 individuals in the labor force. Within the labor force, the 20 to 24 years age range has the highest percentage of unemployed individuals, with 12.1% or 111 of them being unemployed.
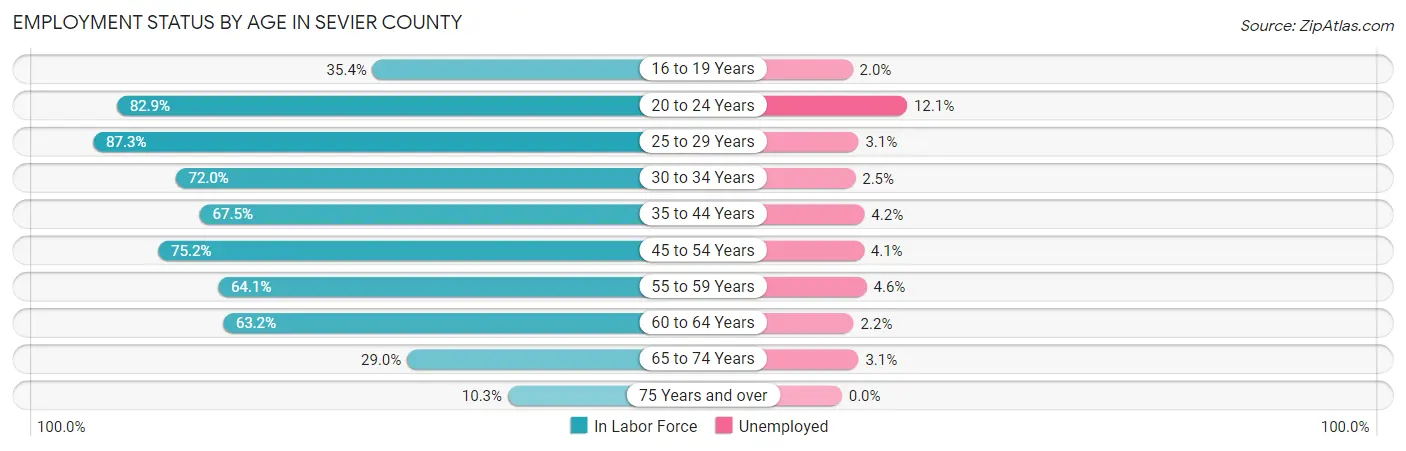
| Age Bracket | In Labor Force | Unemployed |
| 16 to 19 Years | 356 (35.4%) | 7 (2.0%) |
| 20 to 24 Years | 915 (82.9%) | 111 (12.1%) |
| 25 to 29 Years | 833 (87.3%) | 26 (3.1%) |
| 30 to 34 Years | 678 (72.0%) | 17 (2.5%) |
| 35 to 44 Years | 1,343 (67.5%) | 56 (4.2%) |
| 45 to 54 Years | 1,352 (75.2%) | 55 (4.1%) |
| 55 to 59 Years | 692 (64.1%) | 32 (4.6%) |
| 60 to 64 Years | 548 (63.2%) | 12 (2.2%) |
| 65 to 74 Years | 394 (29.0%) | 12 (3.1%) |
| 75 Years and over | 85 (10.3%) | 0 (0.0%) |
| Total | 7,190 (60.3%) | 331 (4.6%) |
Employment Status by Educational Attainment in Sevier County
According to labor force statistics for Sevier County, 71.4% of individuals (5,447) out of the total population between 25 and 64 years of age (7,629) are in the labor force, with 3.7% or 202 of them being unemployed. The group with the highest labor force participation rate are those with the educational attainment of bachelor's degree or higher, with 82.7% or 668 individuals in the labor force. Within the labor force, individuals with less than high school education have the highest percentage of unemployment, with 6.8% or 91 of them being unemployed.
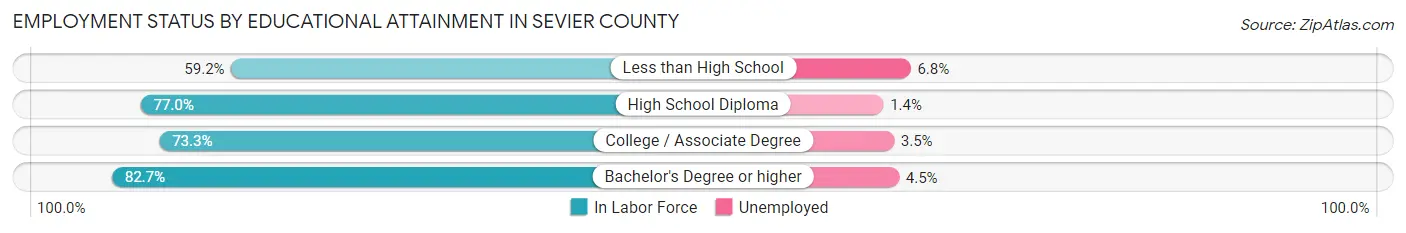
| Educational Attainment | In Labor Force | Unemployed |
| Less than High School | 1,334 (59.2%) | 153 (6.8%) |
| High School Diploma | 2,004 (77.0%) | 36 (1.4%) |
| College / Associate Degree | 1,440 (73.3%) | 69 (3.5%) |
| Bachelor's Degree or higher | 668 (82.7%) | 36 (4.5%) |
| Total | 5,447 (71.4%) | 282 (3.7%) |
Employment Occupations by Sex in Sevier County
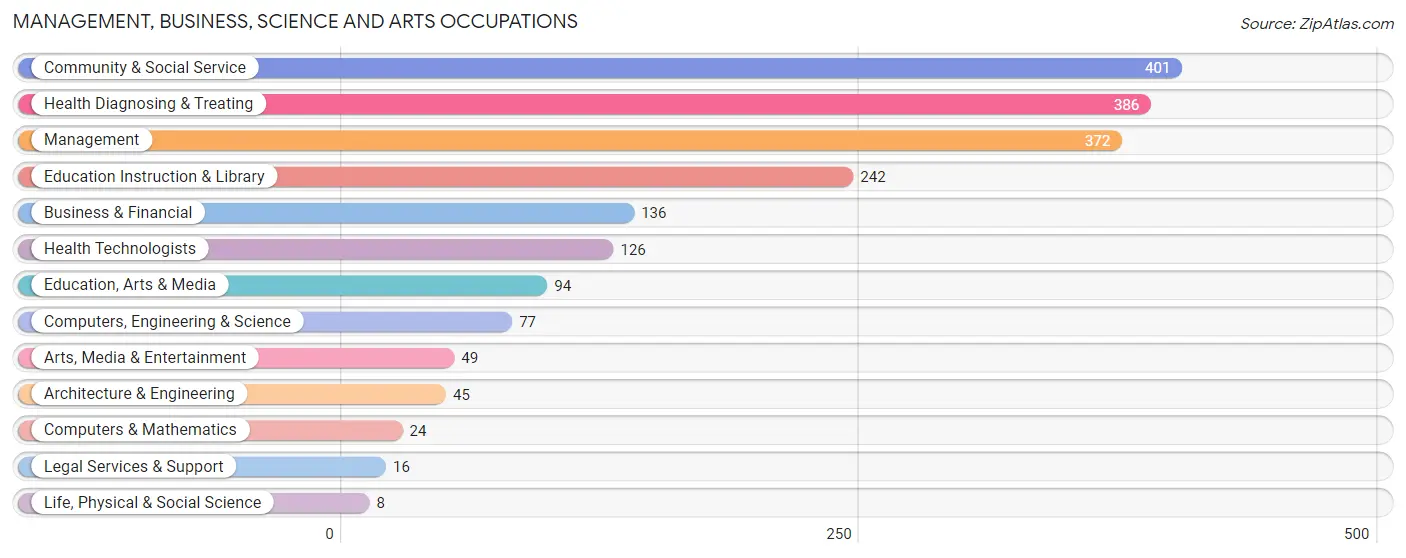
Management, Business, Science and Arts Occupations
The most common Management, Business, Science and Arts occupations in Sevier County are Community & Social Service (401 | 5.8%), Health Diagnosing & Treating (386 | 5.6%), Management (372 | 5.4%), Education Instruction & Library (242 | 3.5%), and Business & Financial (136 | 2.0%).
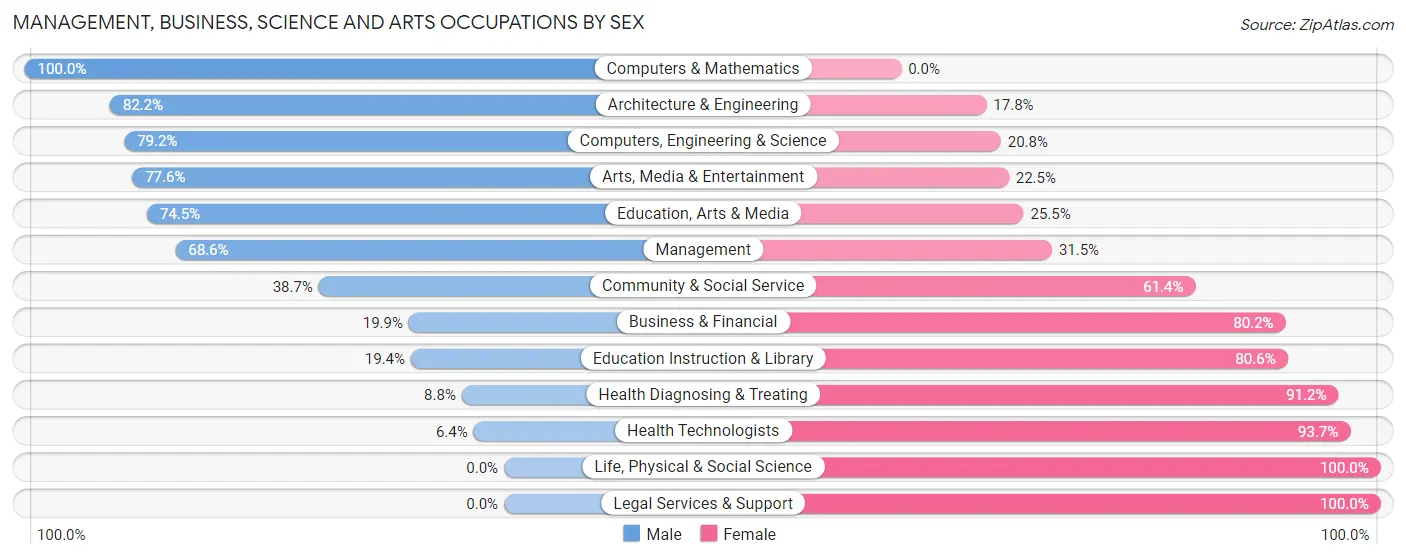
Management, Business, Science and Arts Occupations by Sex
Within the Management, Business, Science and Arts occupations in Sevier County, the most male-oriented occupations are Computers & Mathematics (100.0%), Architecture & Engineering (82.2%), and Computers, Engineering & Science (79.2%), while the most female-oriented occupations are Life, Physical & Social Science (100.0%), Legal Services & Support (100.0%), and Health Technologists (93.6%).
| Occupation | Male | Female |
| Management | 255 (68.5%) | 117 (31.5%) |
| Business & Financial | 27 (19.9%) | 109 (80.1%) |
| Computers, Engineering & Science | 61 (79.2%) | 16 (20.8%) |
| Computers & Mathematics | 24 (100.0%) | 0 (0.0%) |
| Architecture & Engineering | 37 (82.2%) | 8 (17.8%) |
| Life, Physical & Social Science | 0 (0.0%) | 8 (100.0%) |
| Community & Social Service | 155 (38.7%) | 246 (61.4%) |
| Education, Arts & Media | 70 (74.5%) | 24 (25.5%) |
| Legal Services & Support | 0 (0.0%) | 16 (100.0%) |
| Education Instruction & Library | 47 (19.4%) | 195 (80.6%) |
| Arts, Media & Entertainment | 38 (77.5%) | 11 (22.5%) |
| Health Diagnosing & Treating | 34 (8.8%) | 352 (91.2%) |
| Health Technologists | 8 (6.4%) | 118 (93.6%) |
| Total (Category) | 532 (38.8%) | 840 (61.2%) |
| Total (Overall) | 3,966 (57.8%) | 2,899 (42.2%) |
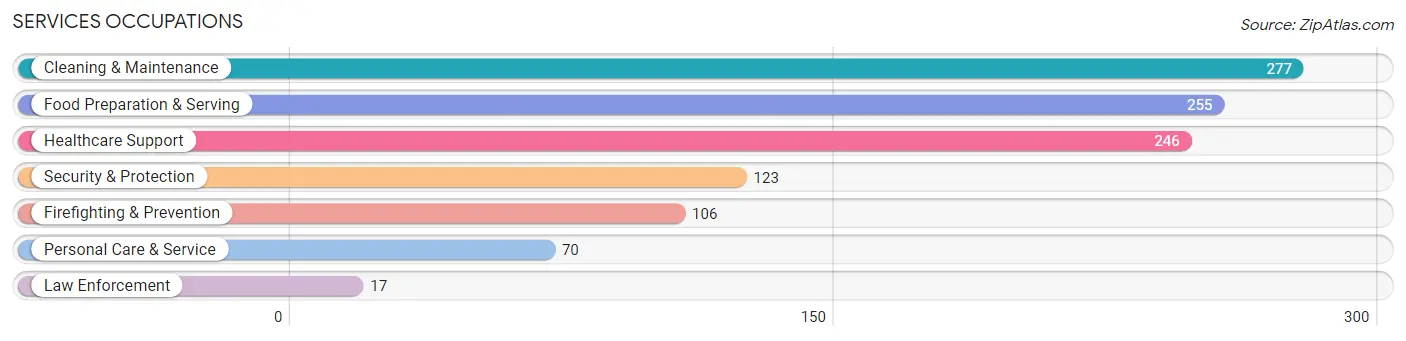
Services Occupations
The most common Services occupations in Sevier County are Cleaning & Maintenance (277 | 4.0%), Food Preparation & Serving (255 | 3.7%), Healthcare Support (246 | 3.6%), Security & Protection (123 | 1.8%), and Firefighting & Prevention (106 | 1.5%).
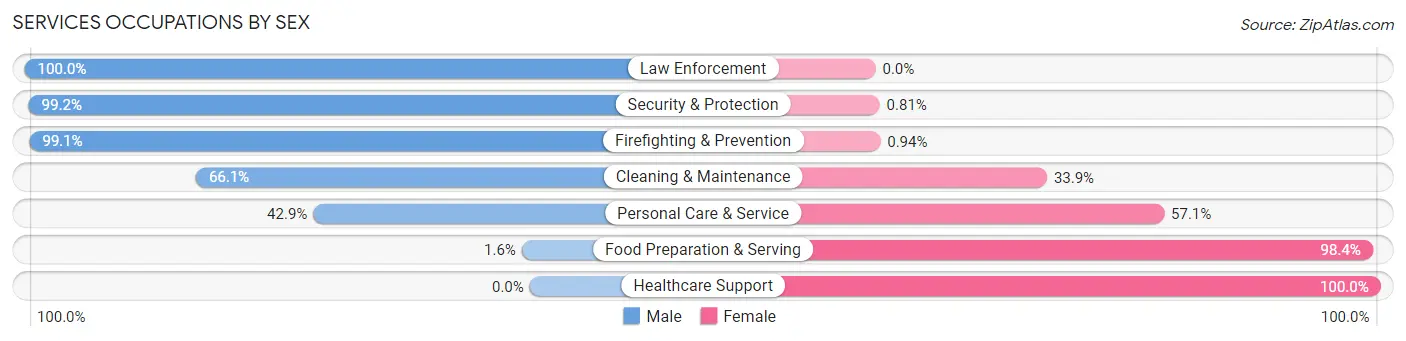
Services Occupations by Sex
Within the Services occupations in Sevier County, the most male-oriented occupations are Law Enforcement (100.0%), Security & Protection (99.2%), and Firefighting & Prevention (99.1%), while the most female-oriented occupations are Healthcare Support (100.0%), Food Preparation & Serving (98.4%), and Personal Care & Service (57.1%).
| Occupation | Male | Female |
| Healthcare Support | 0 (0.0%) | 246 (100.0%) |
| Security & Protection | 122 (99.2%) | 1 (0.8%) |
| Firefighting & Prevention | 105 (99.1%) | 1 (0.9%) |
| Law Enforcement | 17 (100.0%) | 0 (0.0%) |
| Food Preparation & Serving | 4 (1.6%) | 251 (98.4%) |
| Cleaning & Maintenance | 183 (66.1%) | 94 (33.9%) |
| Personal Care & Service | 30 (42.9%) | 40 (57.1%) |
| Total (Category) | 339 (34.9%) | 632 (65.1%) |
| Total (Overall) | 3,966 (57.8%) | 2,899 (42.2%) |
Sales and Office Occupations
The most common Sales and Office occupations in Sevier County are Office & Administration (579 | 8.4%), and Sales & Related (434 | 6.3%).
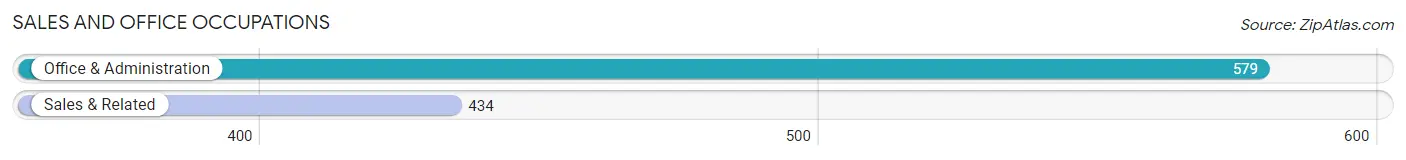
Sales and Office Occupations by Sex

| Occupation | Male | Female |
| Sales & Related | 182 (41.9%) | 252 (58.1%) |
| Office & Administration | 63 (10.9%) | 516 (89.1%) |
| Total (Category) | 245 (24.2%) | 768 (75.8%) |
| Total (Overall) | 3,966 (57.8%) | 2,899 (42.2%) |
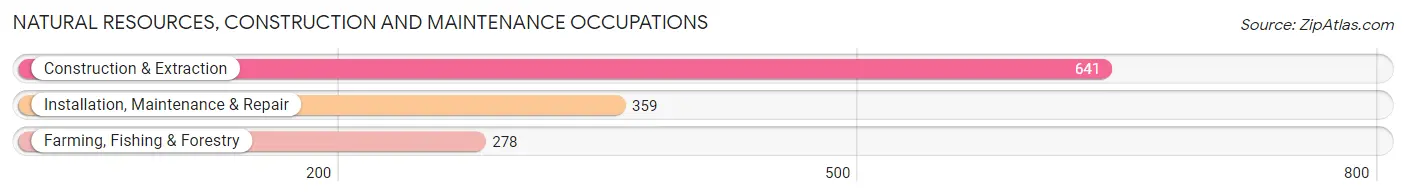
Natural Resources, Construction and Maintenance Occupations
The most common Natural Resources, Construction and Maintenance occupations in Sevier County are Construction & Extraction (641 | 9.3%), Installation, Maintenance & Repair (359 | 5.2%), and Farming, Fishing & Forestry (278 | 4.1%).
Natural Resources, Construction and Maintenance Occupations by Sex
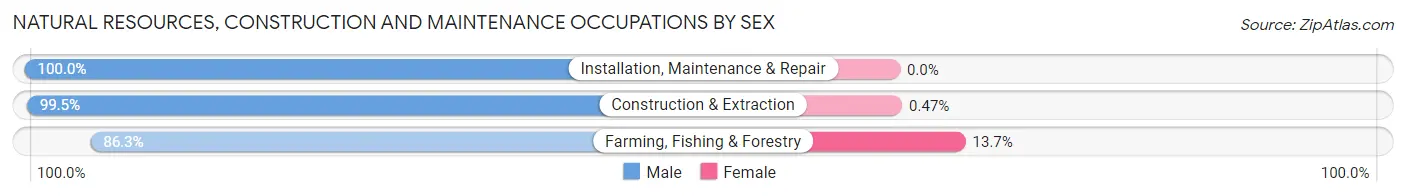
| Occupation | Male | Female |
| Farming, Fishing & Forestry | 240 (86.3%) | 38 (13.7%) |
| Construction & Extraction | 638 (99.5%) | 3 (0.5%) |
| Installation, Maintenance & Repair | 359 (100.0%) | 0 (0.0%) |
| Total (Category) | 1,237 (96.8%) | 41 (3.2%) |
| Total (Overall) | 3,966 (57.8%) | 2,899 (42.2%) |
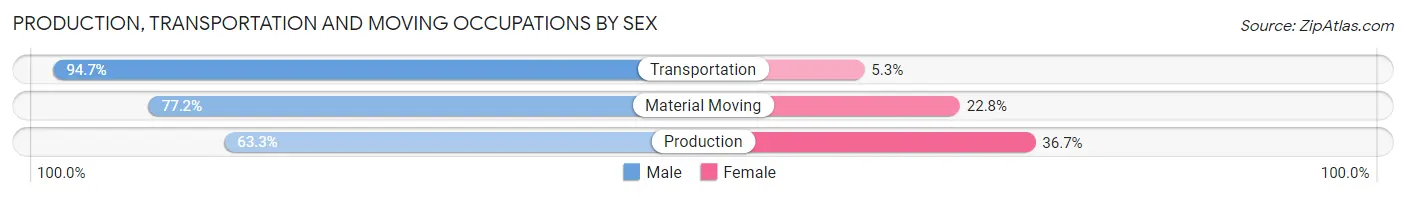
Production, Transportation and Moving Occupations
The most common Production, Transportation and Moving occupations in Sevier County are Production (1,287 | 18.8%), Material Moving (548 | 8.0%), and Transportation (396 | 5.8%).
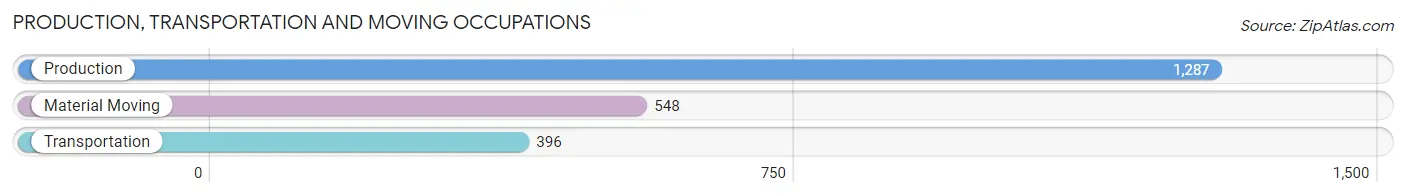
Production, Transportation and Moving Occupations by Sex
| Occupation | Male | Female |
| Production | 815 (63.3%) | 472 (36.7%) |
| Transportation | 375 (94.7%) | 21 (5.3%) |
| Material Moving | 423 (77.2%) | 125 (22.8%) |
| Total (Category) | 1,613 (72.3%) | 618 (27.7%) |
| Total (Overall) | 3,966 (57.8%) | 2,899 (42.2%) |
Employment Industries by Sex in Sevier County
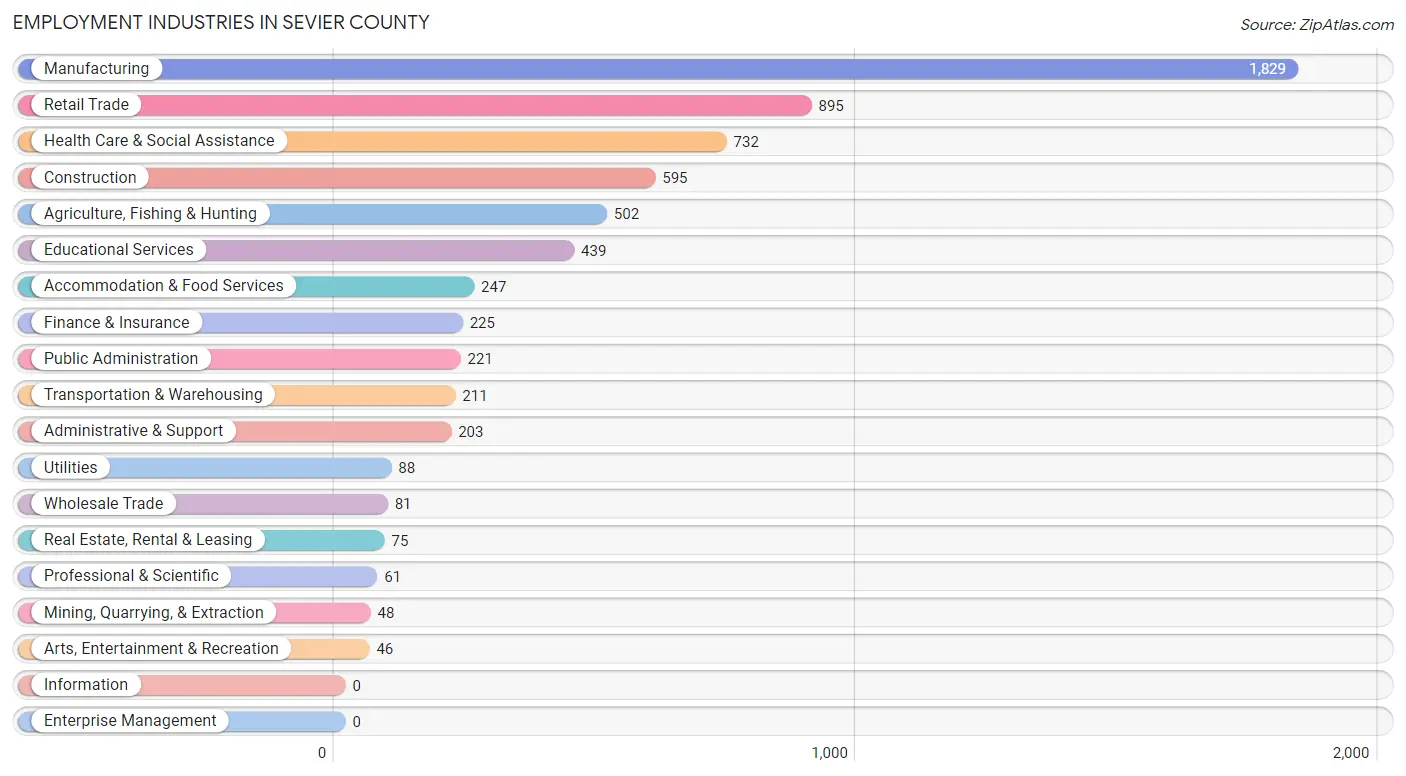
Employment Industries in Sevier County
The major employment industries in Sevier County include Manufacturing (1,829 | 26.6%), Retail Trade (895 | 13.0%), Health Care & Social Assistance (732 | 10.7%), Construction (595 | 8.7%), and Agriculture, Fishing & Hunting (502 | 7.3%).
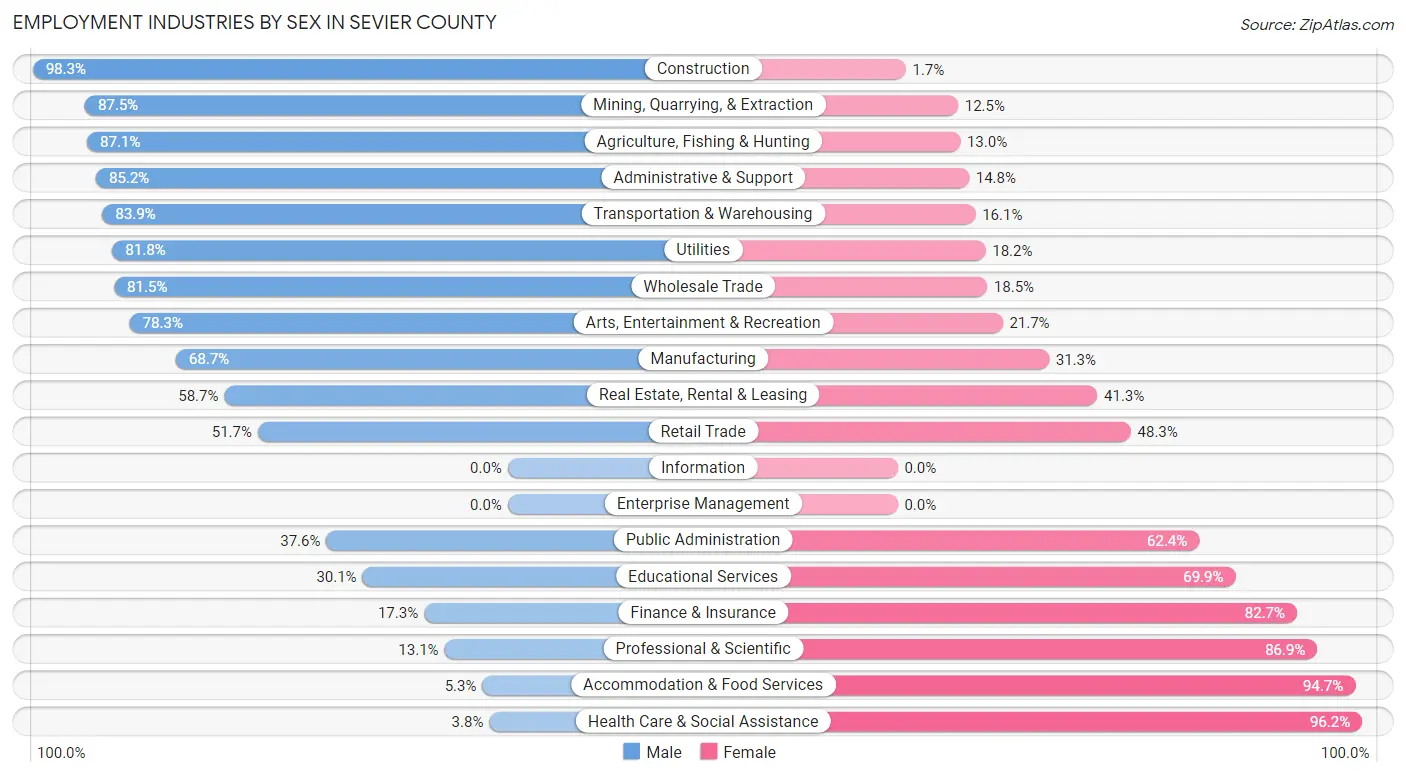
Employment Industries by Sex in Sevier County
The Sevier County industries that see more men than women are Construction (98.3%), Mining, Quarrying, & Extraction (87.5%), and Agriculture, Fishing & Hunting (87.1%), whereas the industries that tend to have a higher number of women are Health Care & Social Assistance (96.2%), Accommodation & Food Services (94.7%), and Professional & Scientific (86.9%).
| Industry | Male | Female |
| Agriculture, Fishing & Hunting | 437 (87.1%) | 65 (13.0%) |
| Mining, Quarrying, & Extraction | 42 (87.5%) | 6 (12.5%) |
| Construction | 585 (98.3%) | 10 (1.7%) |
| Manufacturing | 1,256 (68.7%) | 573 (31.3%) |
| Wholesale Trade | 66 (81.5%) | 15 (18.5%) |
| Retail Trade | 463 (51.7%) | 432 (48.3%) |
| Transportation & Warehousing | 177 (83.9%) | 34 (16.1%) |
| Utilities | 72 (81.8%) | 16 (18.2%) |
| Information | 0 (0.0%) | 0 (0.0%) |
| Finance & Insurance | 39 (17.3%) | 186 (82.7%) |
| Real Estate, Rental & Leasing | 44 (58.7%) | 31 (41.3%) |
| Professional & Scientific | 8 (13.1%) | 53 (86.9%) |
| Enterprise Management | 0 (0.0%) | 0 (0.0%) |
| Administrative & Support | 173 (85.2%) | 30 (14.8%) |
| Educational Services | 132 (30.1%) | 307 (69.9%) |
| Health Care & Social Assistance | 28 (3.8%) | 704 (96.2%) |
| Arts, Entertainment & Recreation | 36 (78.3%) | 10 (21.7%) |
| Accommodation & Food Services | 13 (5.3%) | 234 (94.7%) |
| Public Administration | 83 (37.6%) | 138 (62.4%) |
| Total | 3,966 (57.8%) | 2,899 (42.2%) |
Education in Sevier County
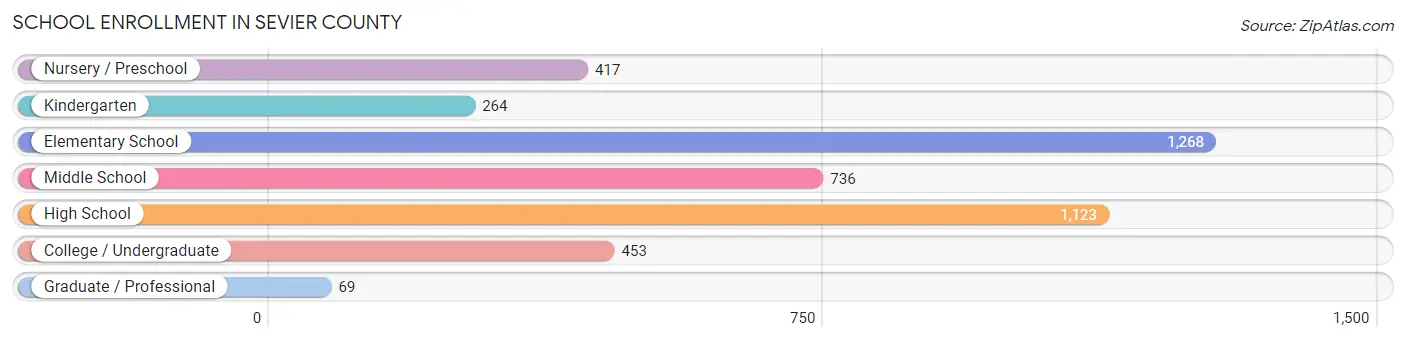
School Enrollment in Sevier County
The most common levels of schooling among the 4,330 students in Sevier County are elementary school (1,268 | 29.3%), high school (1,123 | 25.9%), and middle school (736 | 17.0%).
| School Level | # Students | % Students |
| Nursery / Preschool | 417 | 9.6% |
| Kindergarten | 264 | 6.1% |
| Elementary School | 1,268 | 29.3% |
| Middle School | 736 | 17.0% |
| High School | 1,123 | 25.9% |
| College / Undergraduate | 453 | 10.5% |
| Graduate / Professional | 69 | 1.6% |
| Total | 4,330 | 100.0% |
School Enrollment by Age by Funding Source in Sevier County
Out of a total of 4,330 students who are enrolled in schools in Sevier County, 251 (5.8%) attend a private institution, while the remaining 4,079 (94.2%) are enrolled in public schools. The age group of 35 years and over has the highest likelihood of being enrolled in private schools, with 16 (17.2% in the age bracket) enrolled. Conversely, the age group of 20 to 24 year olds has the lowest likelihood of being enrolled in a private school, with 282 (100.0% in the age bracket) attending a public institution.
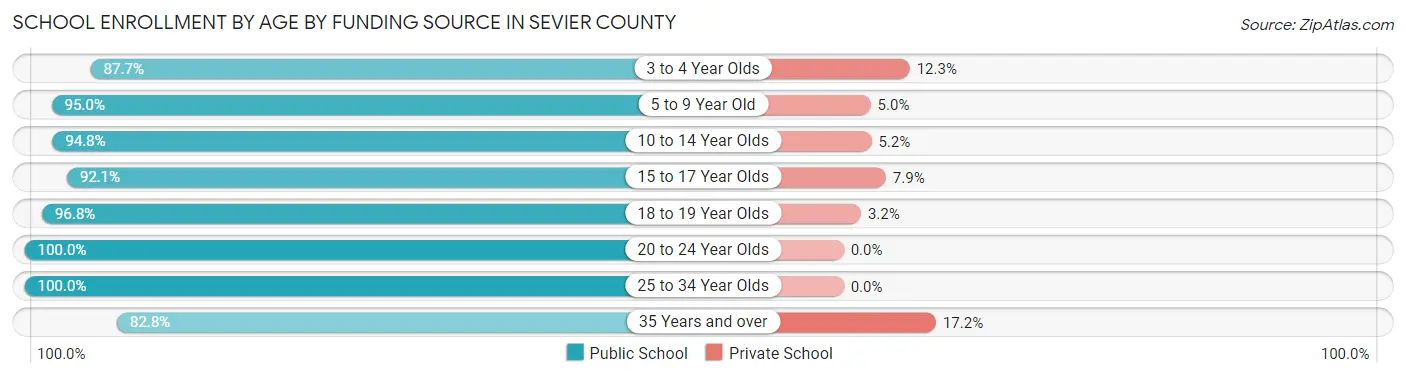
| Age Bracket | Public School | Private School |
| 3 to 4 Year Olds | 235 (87.7%) | 33 (12.3%) |
| 5 to 9 Year Old | 1,190 (95.0%) | 63 (5.0%) |
| 10 to 14 Year Olds | 1,209 (94.8%) | 66 (5.2%) |
| 15 to 17 Year Olds | 691 (92.1%) | 59 (7.9%) |
| 18 to 19 Year Olds | 359 (96.8%) | 12 (3.2%) |
| 20 to 24 Year Olds | 282 (100.0%) | 0 (0.0%) |
| 25 to 34 Year Olds | 38 (100.0%) | 0 (0.0%) |
| 35 Years and over | 77 (82.8%) | 16 (17.2%) |
| Total | 4,079 (94.2%) | 251 (5.8%) |
Educational Attainment by Field of Study in Sevier County
Education (367 | 28.9%), science & technology (234 | 18.4%), arts & humanities (182 | 14.3%), business (162 | 12.8%), and psychology (69 | 5.4%) are the most common fields of study among 1,270 individuals in Sevier County who have obtained a bachelor's degree or higher.
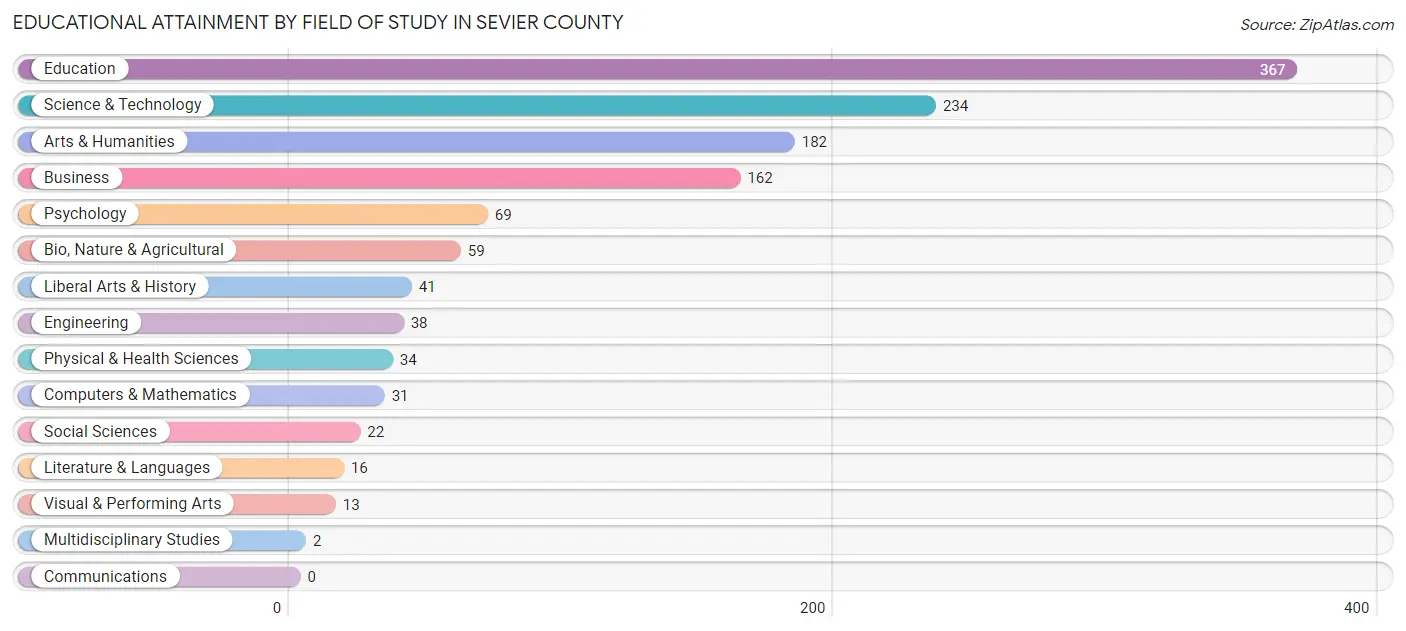
| Field of Study | # Graduates | % Graduates |
| Computers & Mathematics | 31 | 2.4% |
| Bio, Nature & Agricultural | 59 | 4.6% |
| Physical & Health Sciences | 34 | 2.7% |
| Psychology | 69 | 5.4% |
| Social Sciences | 22 | 1.7% |
| Engineering | 38 | 3.0% |
| Multidisciplinary Studies | 2 | 0.2% |
| Science & Technology | 234 | 18.4% |
| Business | 162 | 12.8% |
| Education | 367 | 28.9% |
| Literature & Languages | 16 | 1.3% |
| Liberal Arts & History | 41 | 3.2% |
| Visual & Performing Arts | 13 | 1.0% |
| Communications | 0 | 0.0% |
| Arts & Humanities | 182 | 14.3% |
| Total | 1,270 | 100.0% |
Transportation & Commute in Sevier County
Vehicle Availability by Sex in Sevier County
The most prevalent vehicle ownership categories in Sevier County are males with 2 vehicles (1,394, accounting for 36.7%) and females with 2 vehicles (937, making up 48.2%).
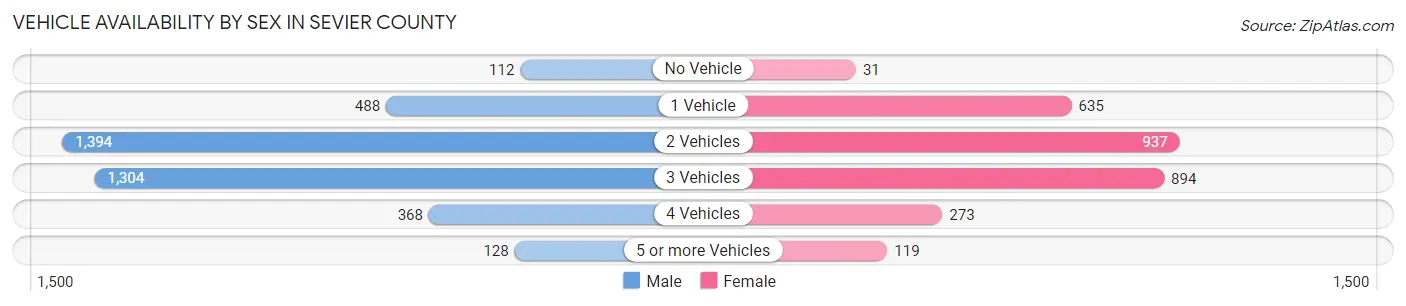
| Vehicles Available | Male | Female |
| No Vehicle | 112 (2.9%) | 31 (1.1%) |
| 1 Vehicle | 488 (12.9%) | 635 (22.0%) |
| 2 Vehicles | 1,394 (36.7%) | 937 (32.4%) |
| 3 Vehicles | 1,304 (34.4%) | 894 (30.9%) |
| 4 Vehicles | 368 (9.7%) | 273 (9.5%) |
| 5 or more Vehicles | 128 (3.4%) | 119 (4.1%) |
| Total | 3,794 (100.0%) | 2,889 (100.0%) |
Commute Time in Sevier County
The most frequently occuring commute durations in Sevier County are 10 to 14 minutes (1,216 commuters, 18.9%), 5 to 9 minutes (1,092 commuters, 17.0%), and 15 to 19 minutes (721 commuters, 11.2%).
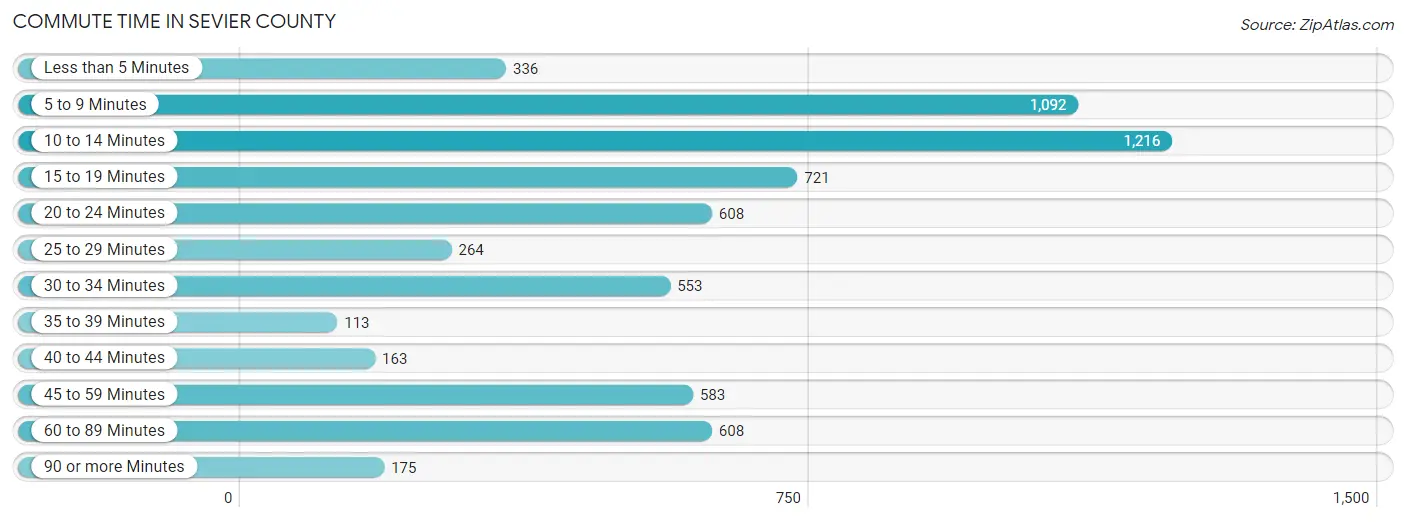
| Commute Time | # Commuters | % Commuters |
| Less than 5 Minutes | 336 | 5.2% |
| 5 to 9 Minutes | 1,092 | 17.0% |
| 10 to 14 Minutes | 1,216 | 18.9% |
| 15 to 19 Minutes | 721 | 11.2% |
| 20 to 24 Minutes | 608 | 9.5% |
| 25 to 29 Minutes | 264 | 4.1% |
| 30 to 34 Minutes | 553 | 8.6% |
| 35 to 39 Minutes | 113 | 1.8% |
| 40 to 44 Minutes | 163 | 2.5% |
| 45 to 59 Minutes | 583 | 9.1% |
| 60 to 89 Minutes | 608 | 9.5% |
| 90 or more Minutes | 175 | 2.7% |
Commute Time by Sex in Sevier County
The most common commute times in Sevier County are 10 to 14 minutes (598 commuters, 16.3%) for males and 5 to 9 minutes (653 commuters, 23.6%) for females.
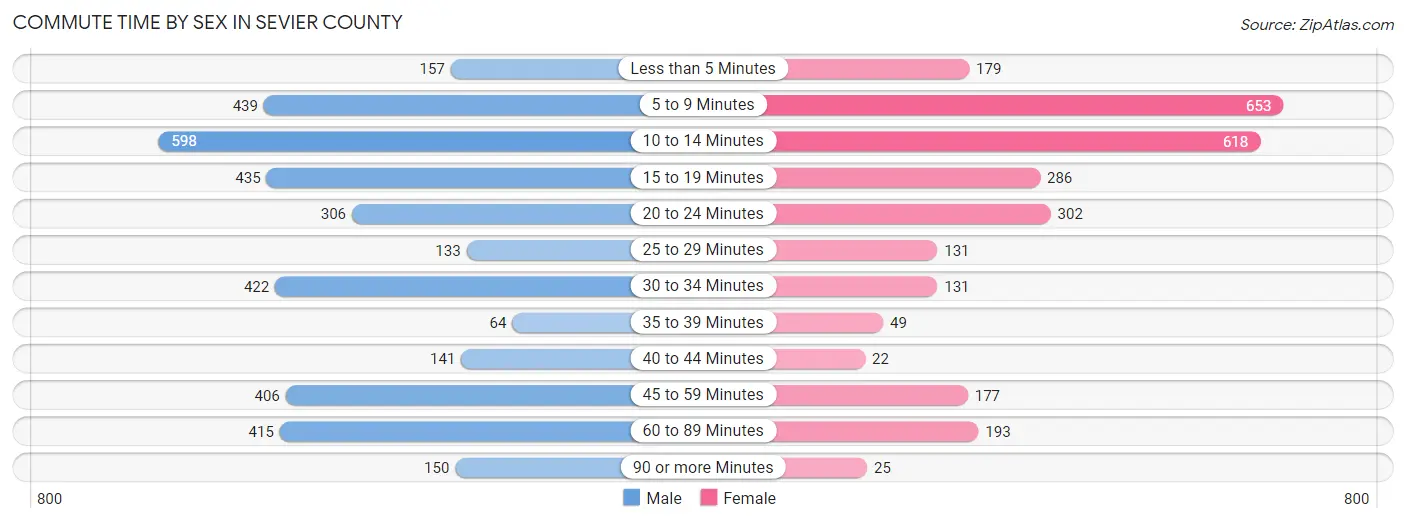
| Commute Time | Male | Female |
| Less than 5 Minutes | 157 (4.3%) | 179 (6.5%) |
| 5 to 9 Minutes | 439 (12.0%) | 653 (23.6%) |
| 10 to 14 Minutes | 598 (16.3%) | 618 (22.3%) |
| 15 to 19 Minutes | 435 (11.9%) | 286 (10.3%) |
| 20 to 24 Minutes | 306 (8.4%) | 302 (10.9%) |
| 25 to 29 Minutes | 133 (3.6%) | 131 (4.7%) |
| 30 to 34 Minutes | 422 (11.5%) | 131 (4.7%) |
| 35 to 39 Minutes | 64 (1.8%) | 49 (1.8%) |
| 40 to 44 Minutes | 141 (3.8%) | 22 (0.8%) |
| 45 to 59 Minutes | 406 (11.1%) | 177 (6.4%) |
| 60 to 89 Minutes | 415 (11.3%) | 193 (7.0%) |
| 90 or more Minutes | 150 (4.1%) | 25 (0.9%) |
Time of Departure to Work by Sex in Sevier County
The most frequent times of departure to work in Sevier County are 6:00 AM to 6:29 AM (726, 19.8%) for males and 7:00 AM to 7:29 AM (690, 24.9%) for females.
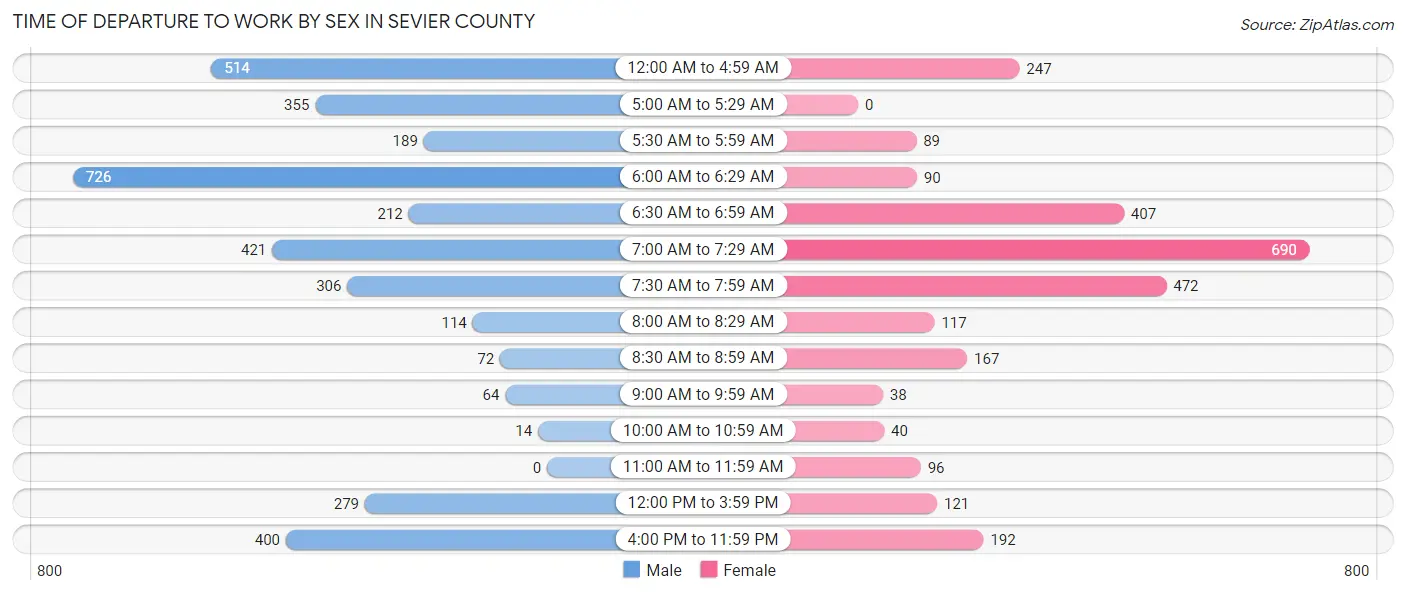
| Time of Departure | Male | Female |
| 12:00 AM to 4:59 AM | 514 (14.0%) | 247 (8.9%) |
| 5:00 AM to 5:29 AM | 355 (9.7%) | 0 (0.0%) |
| 5:30 AM to 5:59 AM | 189 (5.2%) | 89 (3.2%) |
| 6:00 AM to 6:29 AM | 726 (19.8%) | 90 (3.3%) |
| 6:30 AM to 6:59 AM | 212 (5.8%) | 407 (14.7%) |
| 7:00 AM to 7:29 AM | 421 (11.5%) | 690 (24.9%) |
| 7:30 AM to 7:59 AM | 306 (8.4%) | 472 (17.1%) |
| 8:00 AM to 8:29 AM | 114 (3.1%) | 117 (4.2%) |
| 8:30 AM to 8:59 AM | 72 (2.0%) | 167 (6.0%) |
| 9:00 AM to 9:59 AM | 64 (1.8%) | 38 (1.4%) |
| 10:00 AM to 10:59 AM | 14 (0.4%) | 40 (1.5%) |
| 11:00 AM to 11:59 AM | 0 (0.0%) | 96 (3.5%) |
| 12:00 PM to 3:59 PM | 279 (7.6%) | 121 (4.4%) |
| 4:00 PM to 11:59 PM | 400 (10.9%) | 192 (6.9%) |
| Total | 3,666 (100.0%) | 2,766 (100.0%) |
Housing Occupancy in Sevier County
Occupancy by Ownership in Sevier County
Of the total 5,543 dwellings in Sevier County, owner-occupied units account for 3,603 (65.0%), while renter-occupied units make up 1,940 (35.0%).
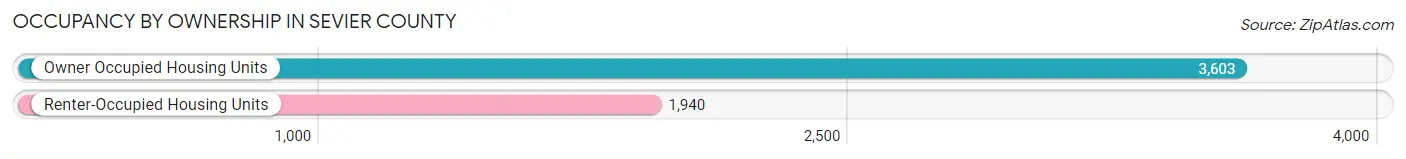
| Occupancy | # Housing Units | % Housing Units |
| Owner Occupied Housing Units | 3,603 | 65.0% |
| Renter-Occupied Housing Units | 1,940 | 35.0% |
| Total Occupied Housing Units | 5,543 | 100.0% |
Occupancy by Household Size in Sevier County
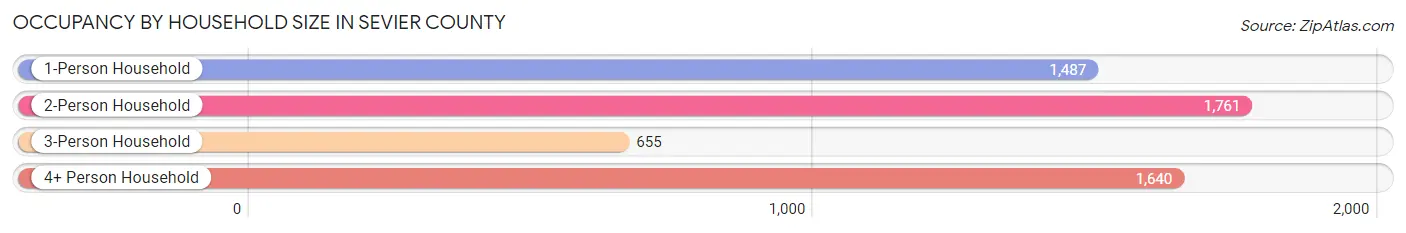
| Household Size | # Housing Units | % Housing Units |
| 1-Person Household | 1,487 | 26.8% |
| 2-Person Household | 1,761 | 31.8% |
| 3-Person Household | 655 | 11.8% |
| 4+ Person Household | 1,640 | 29.6% |
| Total Housing Units | 5,543 | 100.0% |
Occupancy by Ownership by Household Size in Sevier County
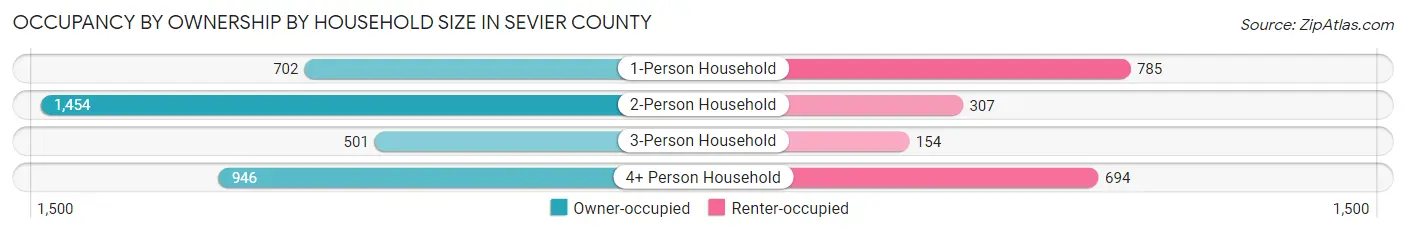
| Household Size | Owner-occupied | Renter-occupied |
| 1-Person Household | 702 (47.2%) | 785 (52.8%) |
| 2-Person Household | 1,454 (82.6%) | 307 (17.4%) |
| 3-Person Household | 501 (76.5%) | 154 (23.5%) |
| 4+ Person Household | 946 (57.7%) | 694 (42.3%) |
| Total Housing Units | 3,603 (65.0%) | 1,940 (35.0%) |
Occupancy by Educational Attainment in Sevier County
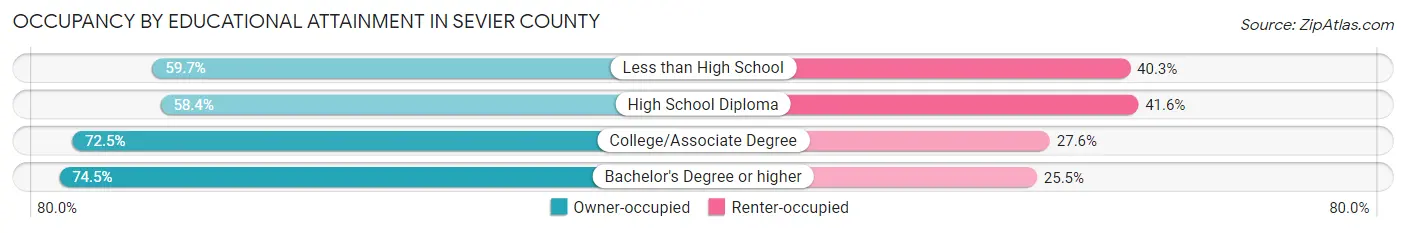
| Household Size | Owner-occupied | Renter-occupied |
| Less than High School | 845 (59.7%) | 570 (40.3%) |
| High School Diploma | 1,032 (58.4%) | 734 (41.6%) |
| College/Associate Degree | 1,194 (72.5%) | 454 (27.6%) |
| Bachelor's Degree or higher | 532 (74.5%) | 182 (25.5%) |
Occupancy by Age of Householder in Sevier County
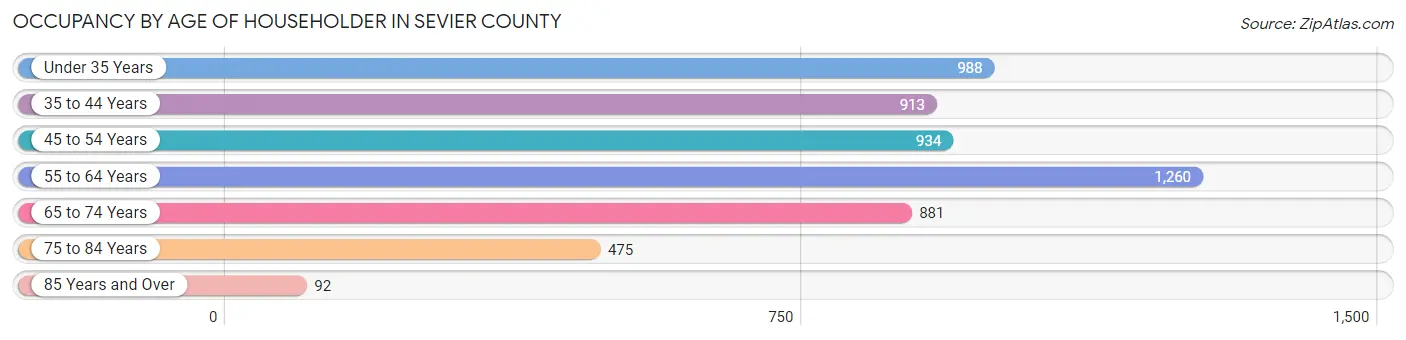
| Age Bracket | # Households | % Households |
| Under 35 Years | 988 | 17.8% |
| 35 to 44 Years | 913 | 16.5% |
| 45 to 54 Years | 934 | 16.9% |
| 55 to 64 Years | 1,260 | 22.7% |
| 65 to 74 Years | 881 | 15.9% |
| 75 to 84 Years | 475 | 8.6% |
| 85 Years and Over | 92 | 1.7% |
| Total | 5,543 | 100.0% |
Housing Finances in Sevier County
Median Income by Occupancy in Sevier County
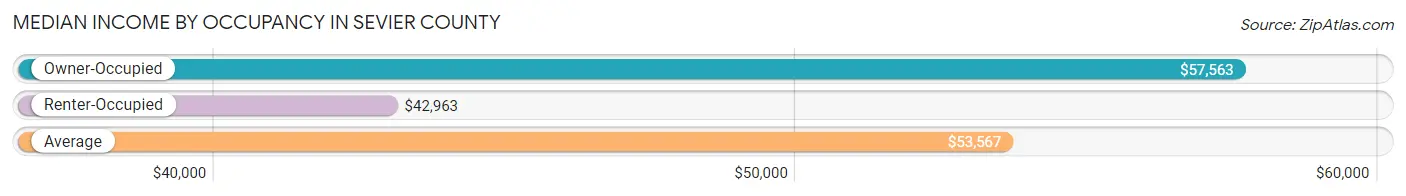
| Occupancy Type | # Households | Median Income |
| Owner-Occupied | 3,603 (65.0%) | $57,563 |
| Renter-Occupied | 1,940 (35.0%) | $42,963 |
| Average | 5,543 (100.0%) | $53,567 |
Occupancy by Householder Income Bracket in Sevier County
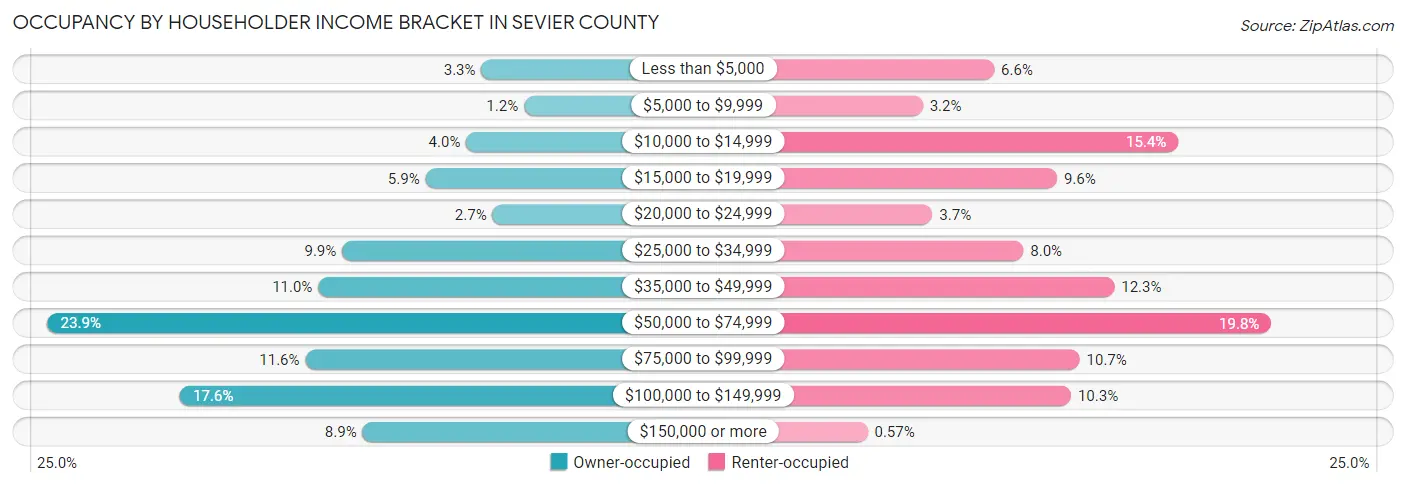
| Income Bracket | Owner-occupied | Renter-occupied |
| Less than $5,000 | 117 (3.3%) | 128 (6.6%) |
| $5,000 to $9,999 | 44 (1.2%) | 62 (3.2%) |
| $10,000 to $14,999 | 143 (4.0%) | 298 (15.4%) |
| $15,000 to $19,999 | 213 (5.9%) | 186 (9.6%) |
| $20,000 to $24,999 | 98 (2.7%) | 71 (3.7%) |
| $25,000 to $34,999 | 356 (9.9%) | 155 (8.0%) |
| $35,000 to $49,999 | 397 (11.0%) | 239 (12.3%) |
| $50,000 to $74,999 | 861 (23.9%) | 384 (19.8%) |
| $75,000 to $99,999 | 419 (11.6%) | 207 (10.7%) |
| $100,000 to $149,999 | 634 (17.6%) | 199 (10.3%) |
| $150,000 or more | 321 (8.9%) | 11 (0.6%) |
| Total | 3,603 (100.0%) | 1,940 (100.0%) |
Monthly Housing Cost Tiers in Sevier County
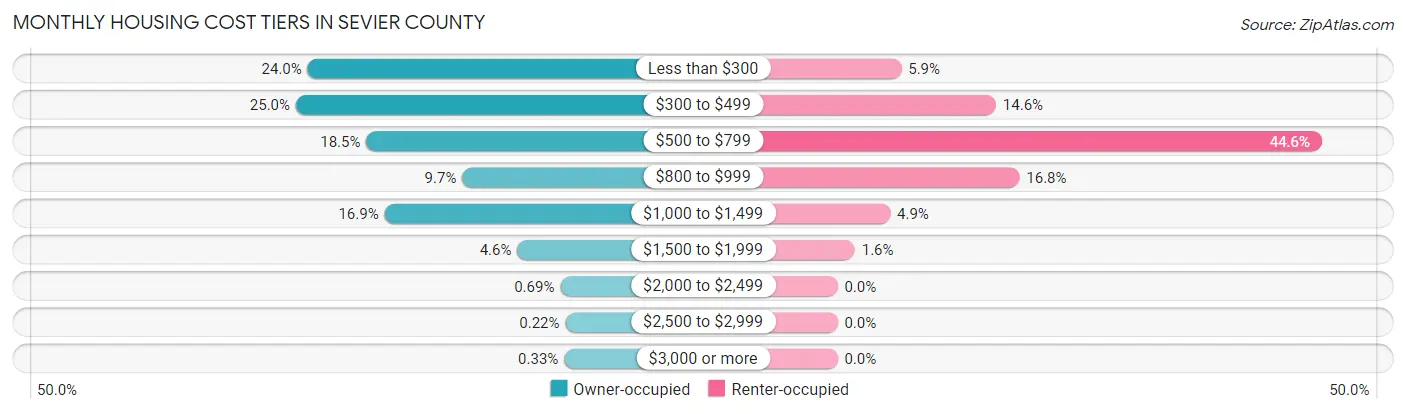
| Monthly Cost | Owner-occupied | Renter-occupied |
| Less than $300 | 863 (23.9%) | 114 (5.9%) |
| $300 to $499 | 902 (25.0%) | 283 (14.6%) |
| $500 to $799 | 668 (18.5%) | 865 (44.6%) |
| $800 to $999 | 350 (9.7%) | 325 (16.8%) |
| $1,000 to $1,499 | 608 (16.9%) | 94 (4.9%) |
| $1,500 to $1,999 | 167 (4.6%) | 31 (1.6%) |
| $2,000 to $2,499 | 25 (0.7%) | 0 (0.0%) |
| $2,500 to $2,999 | 8 (0.2%) | 0 (0.0%) |
| $3,000 or more | 12 (0.3%) | 0 (0.0%) |
| Total | 3,603 (100.0%) | 1,940 (100.0%) |
Physical Housing Characteristics in Sevier County
Housing Structures in Sevier County
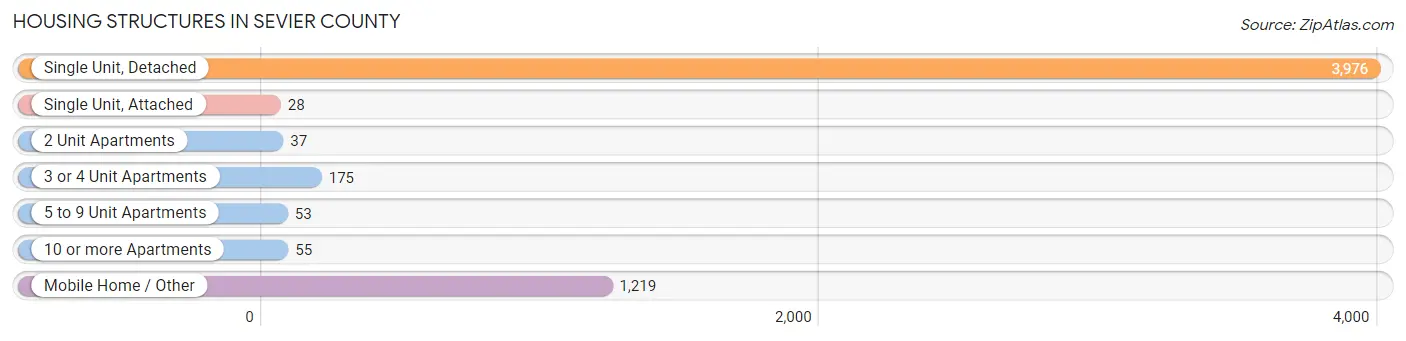
| Structure Type | # Housing Units | % Housing Units |
| Single Unit, Detached | 3,976 | 71.7% |
| Single Unit, Attached | 28 | 0.5% |
| 2 Unit Apartments | 37 | 0.7% |
| 3 or 4 Unit Apartments | 175 | 3.2% |
| 5 to 9 Unit Apartments | 53 | 1.0% |
| 10 or more Apartments | 55 | 1.0% |
| Mobile Home / Other | 1,219 | 22.0% |
| Total | 5,543 | 100.0% |
Housing Structures by Occupancy in Sevier County
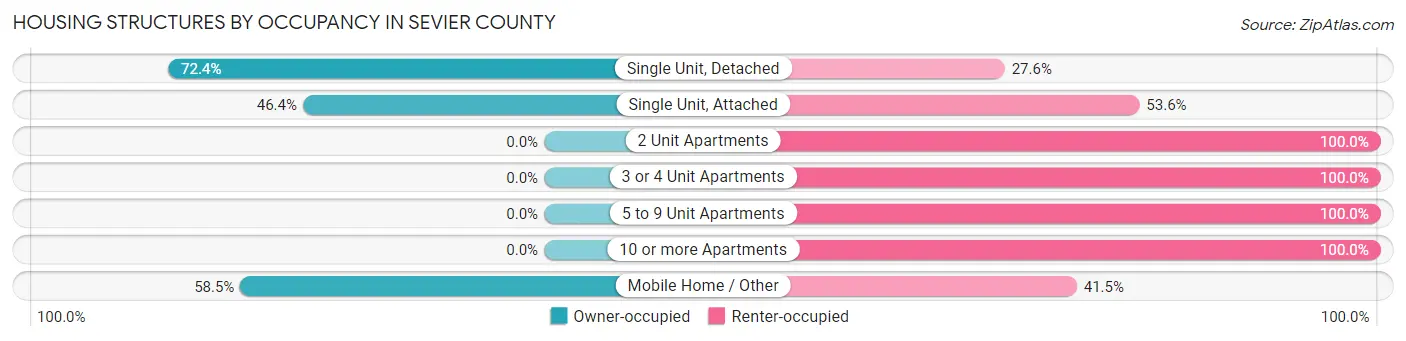
| Structure Type | Owner-occupied | Renter-occupied |
| Single Unit, Detached | 2,877 (72.4%) | 1,099 (27.6%) |
| Single Unit, Attached | 13 (46.4%) | 15 (53.6%) |
| 2 Unit Apartments | 0 (0.0%) | 37 (100.0%) |
| 3 or 4 Unit Apartments | 0 (0.0%) | 175 (100.0%) |
| 5 to 9 Unit Apartments | 0 (0.0%) | 53 (100.0%) |
| 10 or more Apartments | 0 (0.0%) | 55 (100.0%) |
| Mobile Home / Other | 713 (58.5%) | 506 (41.5%) |
| Total | 3,603 (65.0%) | 1,940 (35.0%) |
Housing Structures by Number of Rooms in Sevier County
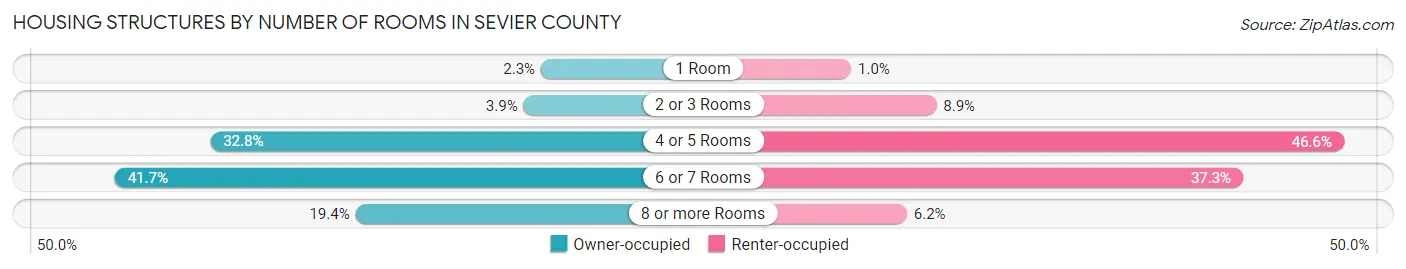
| Number of Rooms | Owner-occupied | Renter-occupied |
| 1 Room | 81 (2.2%) | 20 (1.0%) |
| 2 or 3 Rooms | 139 (3.9%) | 173 (8.9%) |
| 4 or 5 Rooms | 1,183 (32.8%) | 904 (46.6%) |
| 6 or 7 Rooms | 1,501 (41.7%) | 723 (37.3%) |
| 8 or more Rooms | 699 (19.4%) | 120 (6.2%) |
| Total | 3,603 (100.0%) | 1,940 (100.0%) |
Housing Structure by Heating Type in Sevier County
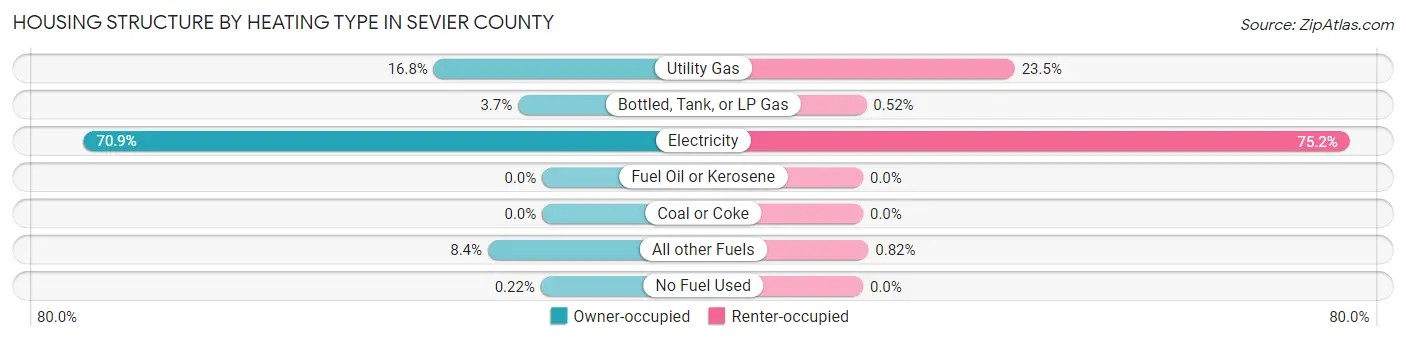
| Heating Type | Owner-occupied | Renter-occupied |
| Utility Gas | 604 (16.8%) | 455 (23.4%) |
| Bottled, Tank, or LP Gas | 134 (3.7%) | 10 (0.5%) |
| Electricity | 2,555 (70.9%) | 1,459 (75.2%) |
| Fuel Oil or Kerosene | 0 (0.0%) | 0 (0.0%) |
| Coal or Coke | 0 (0.0%) | 0 (0.0%) |
| All other Fuels | 302 (8.4%) | 16 (0.8%) |
| No Fuel Used | 8 (0.2%) | 0 (0.0%) |
| Total | 3,603 (100.0%) | 1,940 (100.0%) |
Household Vehicle Usage in Sevier County
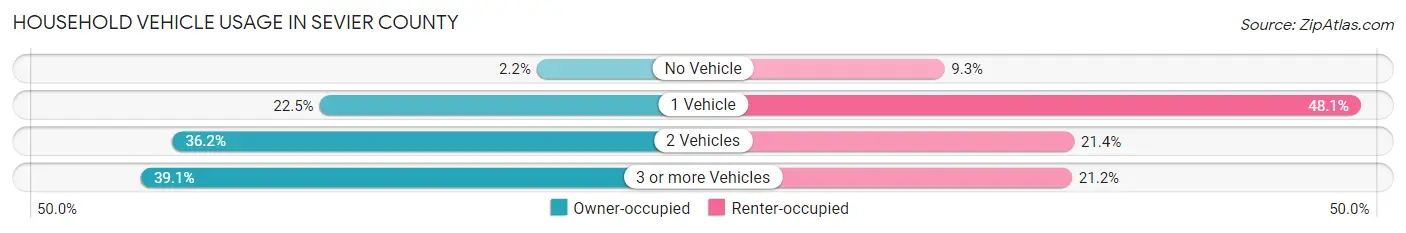
| Vehicles per Household | Owner-occupied | Renter-occupied |
| No Vehicle | 79 (2.2%) | 180 (9.3%) |
| 1 Vehicle | 810 (22.5%) | 934 (48.1%) |
| 2 Vehicles | 1,304 (36.2%) | 415 (21.4%) |
| 3 or more Vehicles | 1,410 (39.1%) | 411 (21.2%) |
| Total | 3,603 (100.0%) | 1,940 (100.0%) |
Real Estate & Mortgages in Sevier County
Real Estate and Mortgage Overview in Sevier County
| Characteristic | Without Mortgage | With Mortgage |
| Housing Units | 2,124 | 1,479 |
| Median Property Value | $86,600 | $130,500 |
| Median Household Income | $54,486 | $165 |
| Monthly Housing Costs | $340 | $12 |
| Real Estate Taxes | $455 | $217 |
Property Value by Mortgage Status in Sevier County
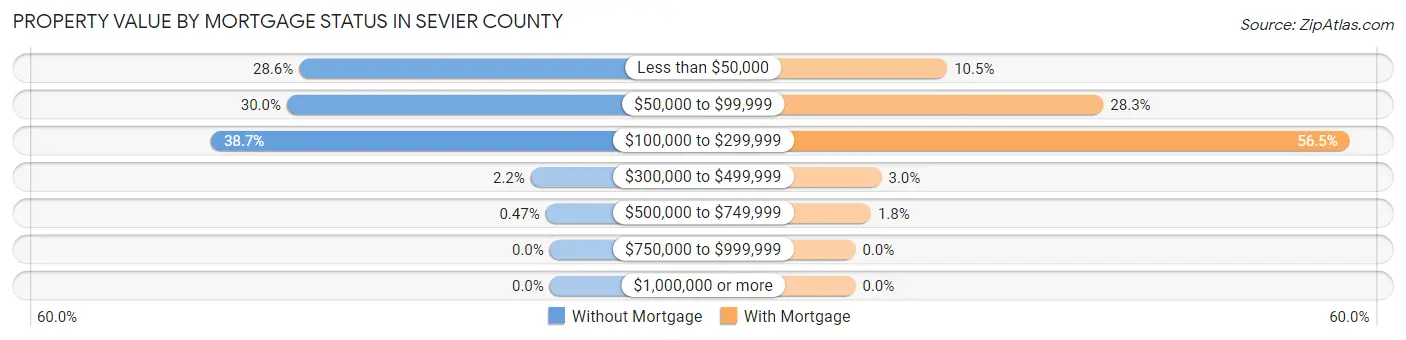
| Property Value | Without Mortgage | With Mortgage |
| Less than $50,000 | 608 (28.6%) | 155 (10.5%) |
| $50,000 to $99,999 | 638 (30.0%) | 419 (28.3%) |
| $100,000 to $299,999 | 822 (38.7%) | 835 (56.5%) |
| $300,000 to $499,999 | 46 (2.2%) | 44 (3.0%) |
| $500,000 to $749,999 | 10 (0.5%) | 26 (1.8%) |
| $750,000 to $999,999 | 0 (0.0%) | 0 (0.0%) |
| $1,000,000 or more | 0 (0.0%) | 0 (0.0%) |
| Total | 2,124 (100.0%) | 1,479 (100.0%) |
Household Income by Mortgage Status in Sevier County
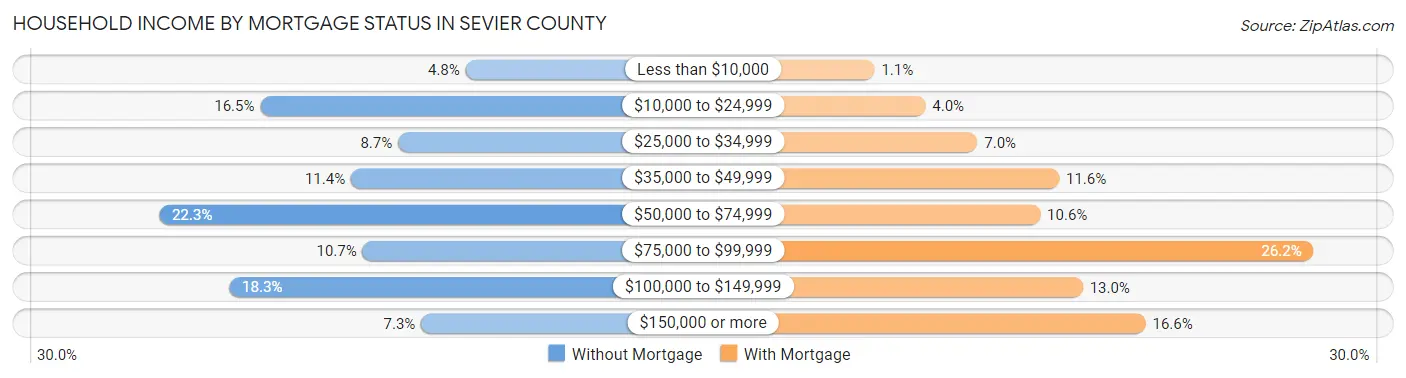
| Household Income | Without Mortgage | With Mortgage |
| Less than $10,000 | 102 (4.8%) | 16 (1.1%) |
| $10,000 to $24,999 | 351 (16.5%) | 59 (4.0%) |
| $25,000 to $34,999 | 184 (8.7%) | 103 (7.0%) |
| $35,000 to $49,999 | 241 (11.4%) | 172 (11.6%) |
| $50,000 to $74,999 | 474 (22.3%) | 156 (10.5%) |
| $75,000 to $99,999 | 227 (10.7%) | 387 (26.2%) |
| $100,000 to $149,999 | 389 (18.3%) | 192 (13.0%) |
| $150,000 or more | 156 (7.3%) | 245 (16.6%) |
| Total | 2,124 (100.0%) | 1,479 (100.0%) |
Property Value to Household Income Ratio in Sevier County
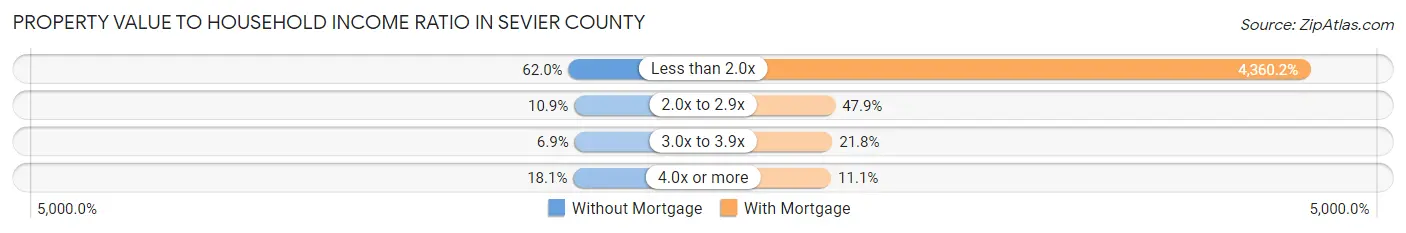
| Value-to-Income Ratio | Without Mortgage | With Mortgage |
| Less than 2.0x | 1,317 (62.0%) | 64,488 (4,360.2%) |
| 2.0x to 2.9x | 231 (10.9%) | 709 (47.9%) |
| 3.0x to 3.9x | 146 (6.9%) | 322 (21.8%) |
| 4.0x or more | 384 (18.1%) | 164 (11.1%) |
| Total | 2,124 (100.0%) | 1,479 (100.0%) |
Real Estate Taxes by Mortgage Status in Sevier County
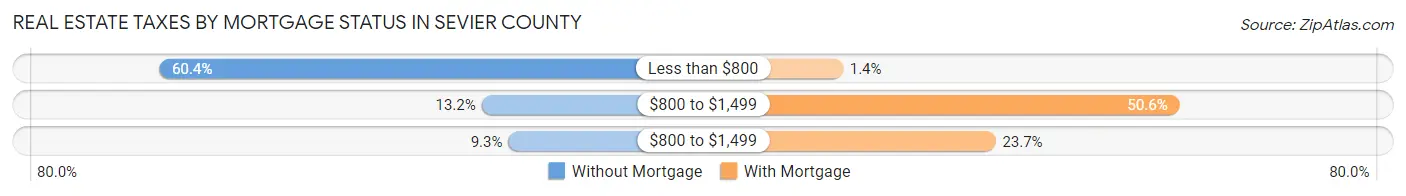
| Property Taxes | Without Mortgage | With Mortgage |
| Less than $800 | 1,282 (60.4%) | 21 (1.4%) |
| $800 to $1,499 | 281 (13.2%) | 749 (50.6%) |
| $800 to $1,499 | 198 (9.3%) | 351 (23.7%) |
| Total | 2,124 (100.0%) | 1,479 (100.0%) |
Health & Disability in Sevier County
Health Insurance Coverage by Age in Sevier County
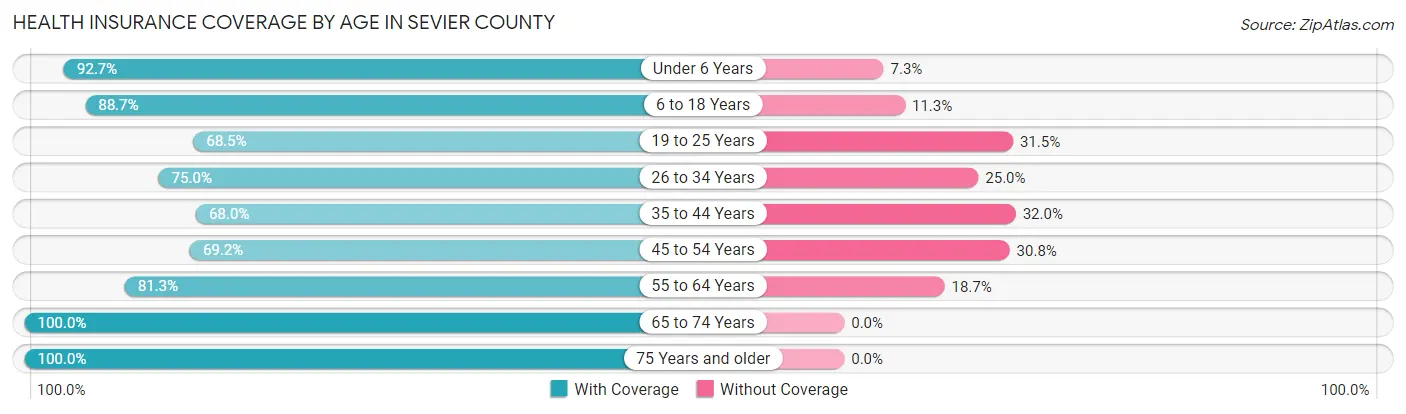
| Age Bracket | With Coverage | Without Coverage |
| Under 6 Years | 1,265 (92.7%) | 100 (7.3%) |
| 6 to 18 Years | 3,083 (88.7%) | 394 (11.3%) |
| 19 to 25 Years | 926 (68.5%) | 425 (31.5%) |
| 26 to 34 Years | 1,338 (75.0%) | 446 (25.0%) |
| 35 to 44 Years | 1,343 (68.0%) | 631 (32.0%) |
| 45 to 54 Years | 1,240 (69.2%) | 553 (30.8%) |
| 55 to 64 Years | 1,579 (81.3%) | 363 (18.7%) |
| 65 to 74 Years | 1,349 (100.0%) | 0 (0.0%) |
| 75 Years and older | 770 (100.0%) | 0 (0.0%) |
| Total | 12,893 (81.6%) | 2,912 (18.4%) |
Health Insurance Coverage by Citizenship Status in Sevier County
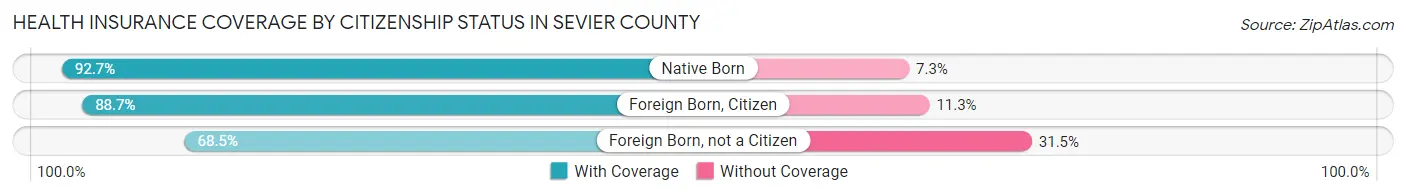
| Citizenship Status | With Coverage | Without Coverage |
| Native Born | 1,265 (92.7%) | 100 (7.3%) |
| Foreign Born, Citizen | 3,083 (88.7%) | 394 (11.3%) |
| Foreign Born, not a Citizen | 926 (68.5%) | 425 (31.5%) |
Health Insurance Coverage by Household Income in Sevier County
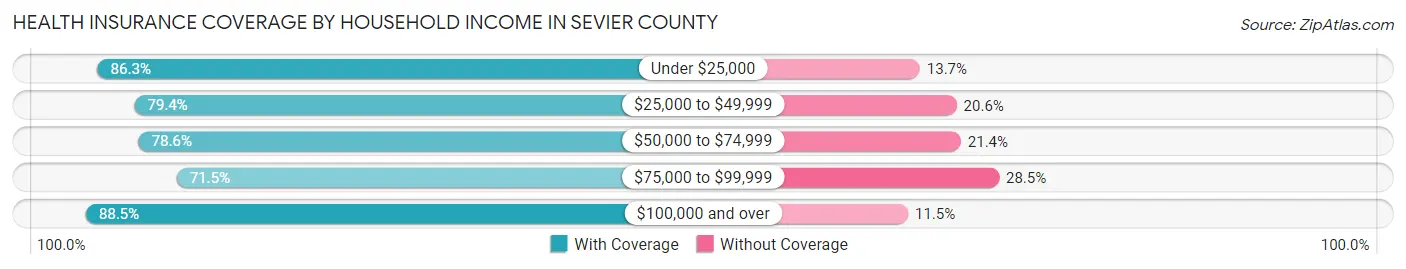
| Household Income | With Coverage | Without Coverage |
| Under $25,000 | 2,339 (86.3%) | 371 (13.7%) |
| $25,000 to $49,999 | 2,624 (79.4%) | 680 (20.6%) |
| $50,000 to $74,999 | 3,062 (78.6%) | 832 (21.4%) |
| $75,000 to $99,999 | 1,479 (71.5%) | 590 (28.5%) |
| $100,000 and over | 3,386 (88.5%) | 439 (11.5%) |
Public vs Private Health Insurance Coverage by Age in Sevier County
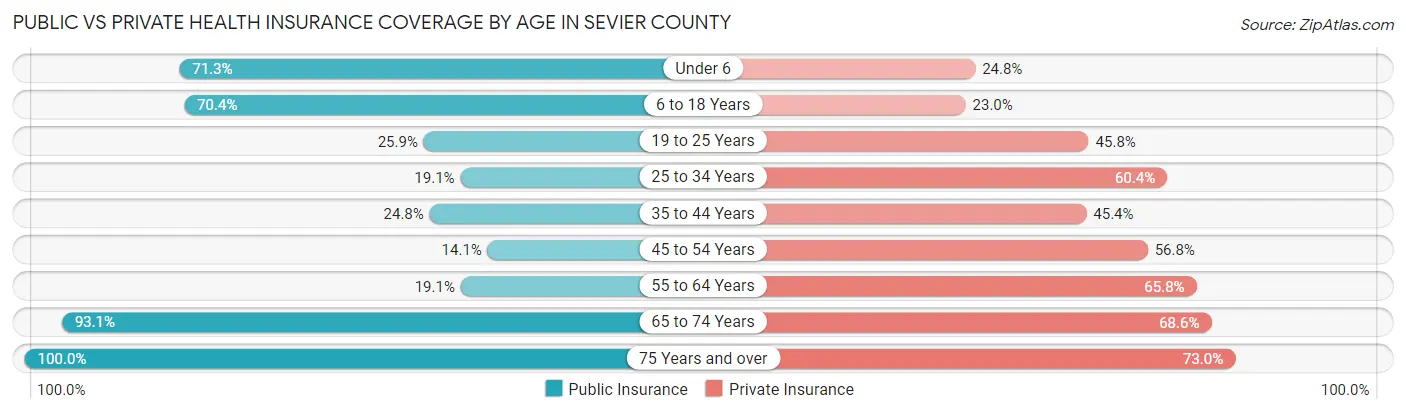
| Age Bracket | Public Insurance | Private Insurance |
| Under 6 | 973 (71.3%) | 338 (24.8%) |
| 6 to 18 Years | 2,448 (70.4%) | 799 (23.0%) |
| 19 to 25 Years | 350 (25.9%) | 619 (45.8%) |
| 25 to 34 Years | 341 (19.1%) | 1,077 (60.4%) |
| 35 to 44 Years | 490 (24.8%) | 896 (45.4%) |
| 45 to 54 Years | 252 (14.1%) | 1,018 (56.8%) |
| 55 to 64 Years | 370 (19.1%) | 1,278 (65.8%) |
| 65 to 74 Years | 1,256 (93.1%) | 925 (68.6%) |
| 75 Years and over | 770 (100.0%) | 562 (73.0%) |
| Total | 7,250 (45.9%) | 7,512 (47.5%) |
Disability Status by Sex by Age in Sevier County
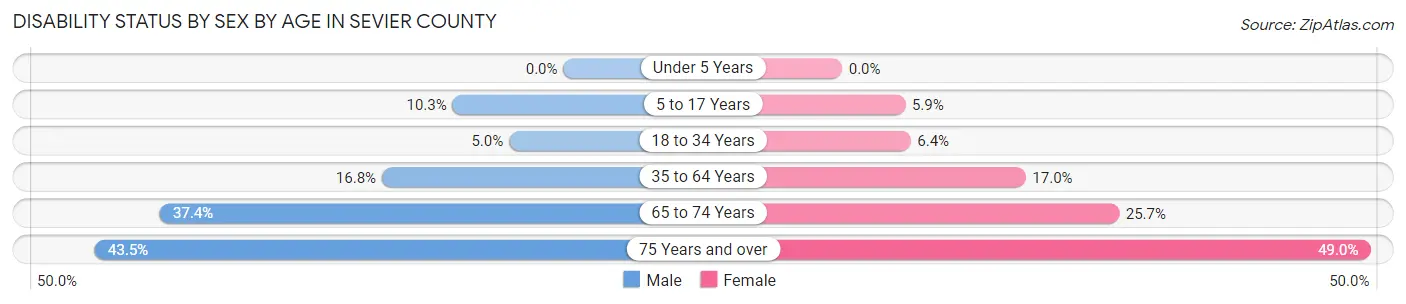
| Age Bracket | Male | Female |
| Under 5 Years | 0 (0.0%) | 0 (0.0%) |
| 5 to 17 Years | 167 (10.3%) | 101 (5.9%) |
| 18 to 34 Years | 91 (5.0%) | 106 (6.4%) |
| 35 to 64 Years | 489 (16.8%) | 478 (17.0%) |
| 65 to 74 Years | 240 (37.4%) | 182 (25.7%) |
| 75 Years and over | 153 (43.5%) | 205 (49.0%) |
Disability Class by Sex by Age in Sevier County
Disability Class: Hearing Difficulty
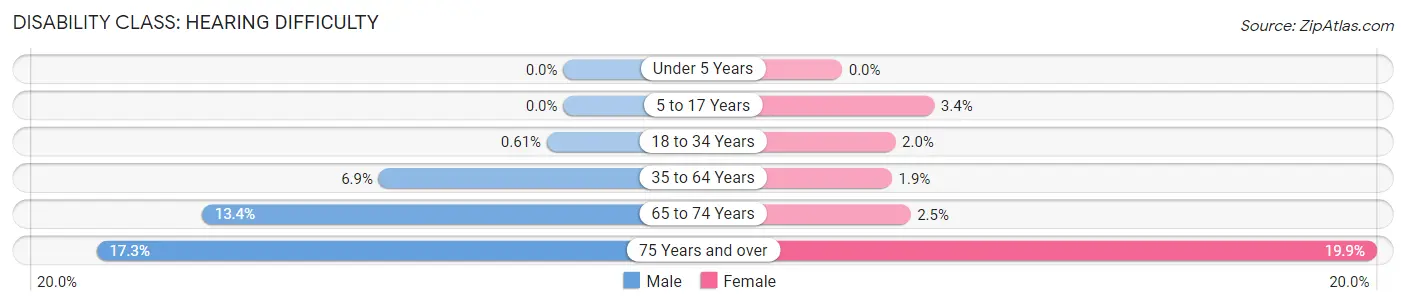
| Age Bracket | Male | Female |
| Under 5 Years | 0 (0.0%) | 0 (0.0%) |
| 5 to 17 Years | 0 (0.0%) | 59 (3.4%) |
| 18 to 34 Years | 11 (0.6%) | 33 (2.0%) |
| 35 to 64 Years | 199 (6.9%) | 52 (1.8%) |
| 65 to 74 Years | 86 (13.4%) | 18 (2.5%) |
| 75 Years and over | 61 (17.3%) | 83 (19.9%) |
Disability Class: Vision Difficulty
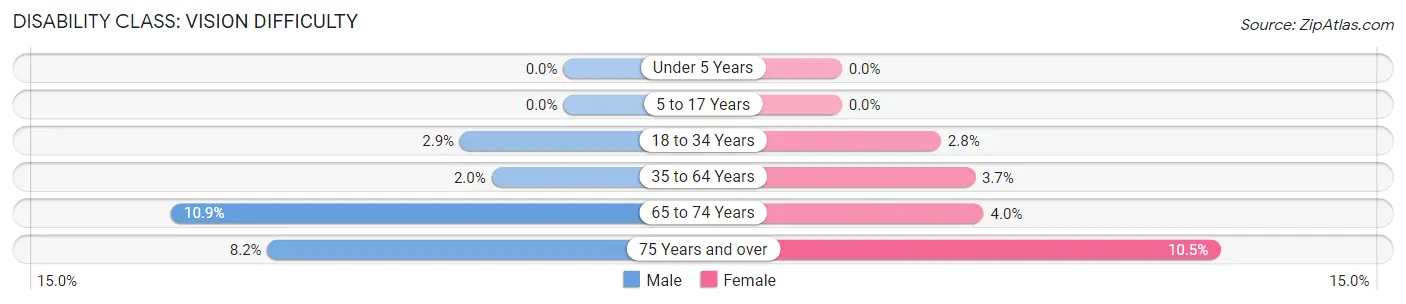
| Age Bracket | Male | Female |
| Under 5 Years | 0 (0.0%) | 0 (0.0%) |
| 5 to 17 Years | 0 (0.0%) | 0 (0.0%) |
| 18 to 34 Years | 52 (2.9%) | 46 (2.8%) |
| 35 to 64 Years | 58 (2.0%) | 104 (3.7%) |
| 65 to 74 Years | 70 (10.9%) | 28 (4.0%) |
| 75 Years and over | 29 (8.2%) | 44 (10.5%) |
Disability Class: Cognitive Difficulty
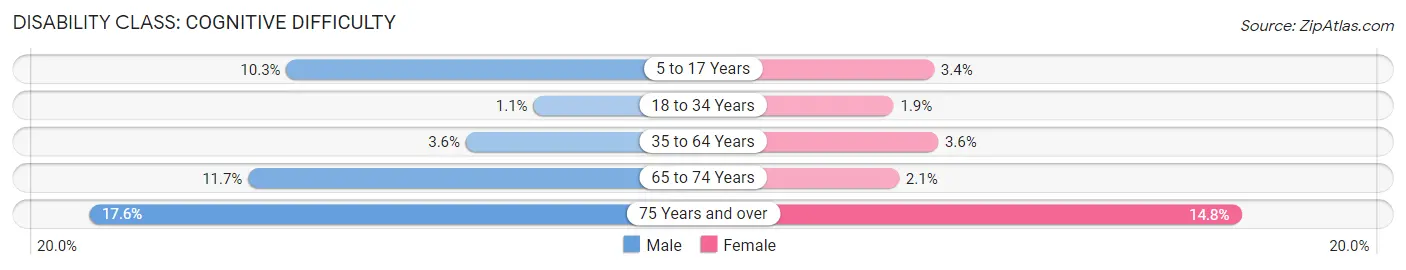
| Age Bracket | Male | Female |
| 5 to 17 Years | 167 (10.3%) | 59 (3.4%) |
| 18 to 34 Years | 20 (1.1%) | 32 (1.9%) |
| 35 to 64 Years | 105 (3.6%) | 100 (3.6%) |
| 65 to 74 Years | 75 (11.7%) | 15 (2.1%) |
| 75 Years and over | 62 (17.6%) | 62 (14.8%) |
Disability Class: Ambulatory Difficulty
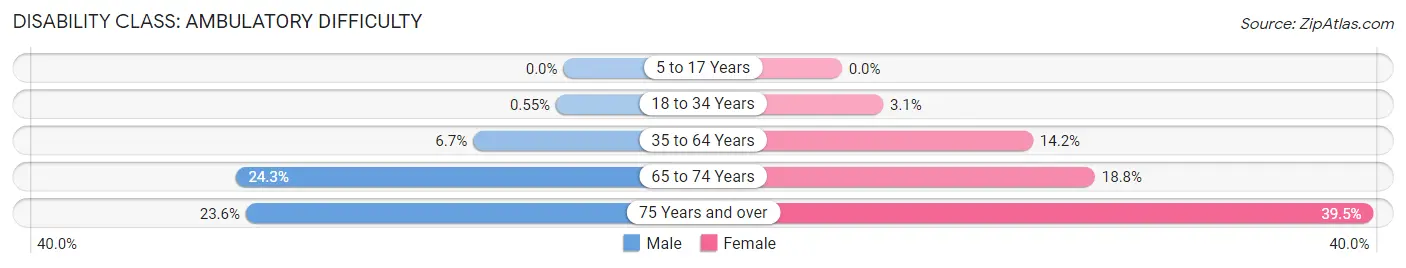
| Age Bracket | Male | Female |
| 5 to 17 Years | 0 (0.0%) | 0 (0.0%) |
| 18 to 34 Years | 10 (0.5%) | 51 (3.1%) |
| 35 to 64 Years | 195 (6.7%) | 398 (14.2%) |
| 65 to 74 Years | 156 (24.3%) | 133 (18.8%) |
| 75 Years and over | 83 (23.6%) | 165 (39.5%) |
Disability Class: Self-Care Difficulty
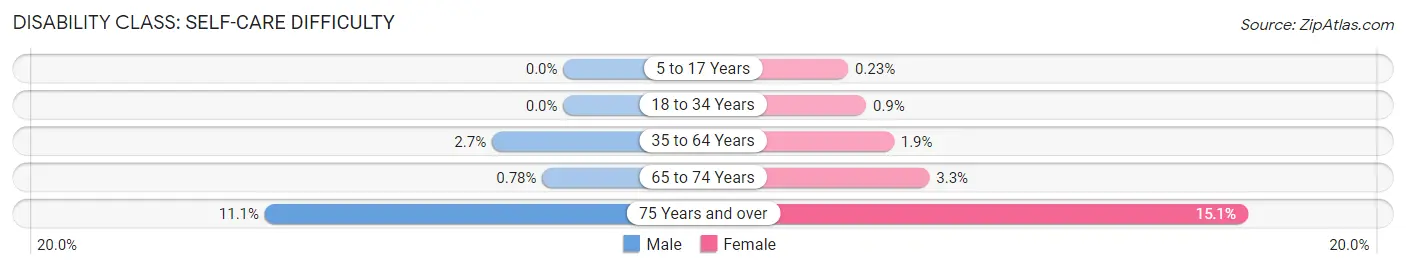
| Age Bracket | Male | Female |
| 5 to 17 Years | 0 (0.0%) | 4 (0.2%) |
| 18 to 34 Years | 0 (0.0%) | 15 (0.9%) |
| 35 to 64 Years | 77 (2.6%) | 54 (1.9%) |
| 65 to 74 Years | 5 (0.8%) | 23 (3.3%) |
| 75 Years and over | 39 (11.1%) | 63 (15.1%) |
Technology Access in Sevier County
Computing Device Access in Sevier County
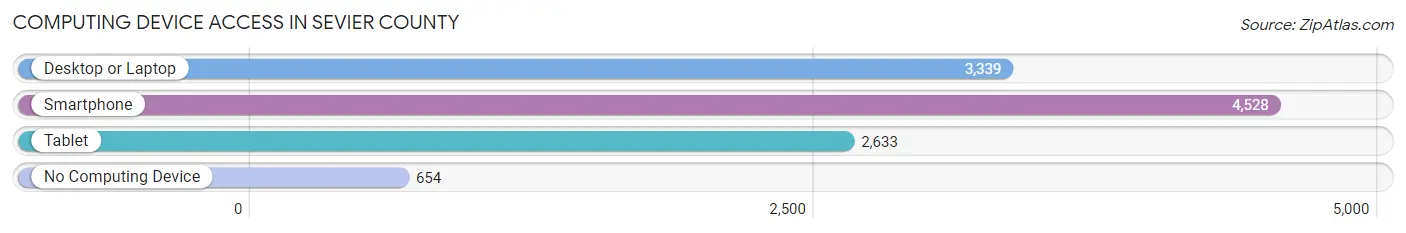
| Device Type | # Households | % Households |
| Desktop or Laptop | 3,339 | 60.2% |
| Smartphone | 4,528 | 81.7% |
| Tablet | 2,633 | 47.5% |
| No Computing Device | 654 | 11.8% |
| Total | 5,543 | 100.0% |
Internet Access in Sevier County
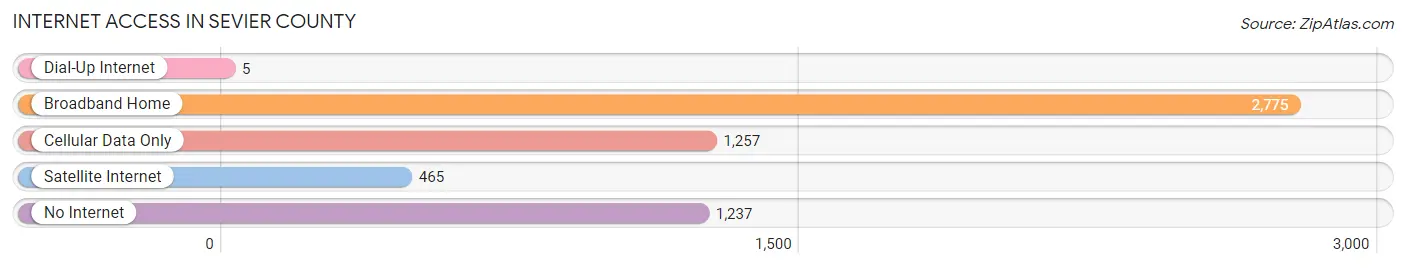
| Internet Type | # Households | % Households |
| Dial-Up Internet | 5 | 0.1% |
| Broadband Home | 2,775 | 50.1% |
| Cellular Data Only | 1,257 | 22.7% |
| Satellite Internet | 465 | 8.4% |
| No Internet | 1,237 | 22.3% |
| Total | 5,543 | 100.0% |
Sevier County Summary
Sevier County is located in the southwestern corner of Arkansas, and is bordered by Howard County to the north, Little River County to the east, Miller County to the south, and the state of Texas to the west. The county seat is De Queen, and the county has a total area of 590 square miles. As of the 2010 census, the population was 17,058.
History
Sevier County was formed in 1828 from a portion of Hempstead County. It was named for Ambrose Sevier, a U.S. Senator from Arkansas. The first county seat was located in the town of Lockesburg, but it was moved to De Queen in 1891.
During the Civil War, Sevier County was the site of several skirmishes between Union and Confederate forces. The most notable of these was the Battle of Poison Spring, which took place on April 18, 1864. The Union forces were victorious, and the Confederate forces suffered heavy losses.
Geography
Sevier County is located in the Ouachita Mountains region of Arkansas. The terrain is mostly hilly, with elevations ranging from 500 to 1,500 feet above sea level. The county is drained by the Little River and its tributaries, which flow southward into Miller County. The county is mostly forested, with the majority of the land being used for timber production.
Economy
The economy of Sevier County is largely based on agriculture and timber production. The county is home to several large poultry farms, as well as several smaller farms that produce beef, pork, and dairy products. The timber industry is also an important part of the local economy, with the majority of the timber being used for paper production.
In addition to agriculture and timber, Sevier County is home to several manufacturing companies, including a furniture factory, a plastics factory, and a metal fabrication plant. The county is also home to several retail stores, restaurants, and other businesses.
Demographics
As of the 2010 census, the population of Sevier County was 17,058. The racial makeup of the county was 79.3% White, 17.2% Black or African American, 0.7% Native American, 0.3% Asian, 0.1% Pacific Islander, and 2.4% from two or more races. Hispanic or Latino of any race were 2.7% of the population.
The median income for a household in the county was $30,945, and the median income for a family was $37,945. The per capita income for the county was $16,845. About 17.2% of families and 21.3% of the population were below the poverty line, including 28.2% of those under age 18 and 14.2% of those age 65 or over.
Common Questions
What is Per Capita Income in Sevier County?
Per Capita income in Sevier County is $26,369.
What is the Median Family Income in Sevier County?
Median Family Income in Sevier County is $59,400.
What is the Median Household income in Sevier County?
Median Household Income in Sevier County is $53,567.
What is Income or Wage Gap in Sevier County?
Income or Wage Gap in Sevier County is 32.6%.
Women in Sevier County earn 67.4 cents for every dollar earned by a man.
What is Family Income Deficit in Sevier County?
Family Income Deficit in Sevier County is $13,694.
Families that are below poverty line in Sevier County earn $13,694 less on average than the poverty threshold level.
What is Inequality or Gini Index in Sevier County?
Inequality or Gini Index in Sevier County is 0.48.
What is the Total Population of Sevier County?
Total Population of Sevier County is 15,913.
What is the Total Male Population of Sevier County?
Total Male Population of Sevier County is 7,977.
What is the Total Female Population of Sevier County?
Total Female Population of Sevier County is 7,936.
What is the Ratio of Males per 100 Females in Sevier County?
There are 100.52 Males per 100 Females in Sevier County.
What is the Ratio of Females per 100 Males in Sevier County?
There are 99.49 Females per 100 Males in Sevier County.
What is the Median Population Age in Sevier County?
Median Population Age in Sevier County is 34.9 Years.
What is the Average Family Size in Sevier County
Average Family Size in Sevier County is 3.4 People.
What is the Average Household Size in Sevier County
Average Household Size in Sevier County is 2.9 People.
How Large is the Labor Force in Sevier County?
There are 7,190 People in the Labor Forcein in Sevier County.
What is the Percentage of People in the Labor Force in Sevier County?
60.3% of People are in the Labor Force in Sevier County.
What is the Unemployment Rate in Sevier County?
Unemployment Rate in Sevier County is 4.6%.