Randolph County, AR Map & Demographics
Randolph County Map
Randolph County Overview
$25,528
PER CAPITA INCOME
$59,380
AVG FAMILY INCOME
$45,993
AVG HOUSEHOLD INCOME
23.0%
WAGE / INCOME GAP [ % ]
77.0¢/ $1
WAGE / INCOME GAP [ $ ]
$8,063
FAMILY INCOME DEFICIT
0.44
INEQUALITY / GINI INDEX
18,619
TOTAL POPULATION
9,393
MALE POPULATION
9,226
FEMALE POPULATION
101.81
MALES / 100 FEMALES
98.22
FEMALES / 100 MALES
39.1
MEDIAN AGE
3.3
AVG FAMILY SIZE
2.5
AVG HOUSEHOLD SIZE
7,731
LABOR FORCE [ PEOPLE ]
52.9%
PERCENT IN LABOR FORCE
7.5%
UNEMPLOYMENT RATE
Randolph County Area Codes
Income in Randolph County
Income Overview in Randolph County
Per Capita Income in Randolph County is $25,528, while median incomes of families and households are $59,380 and $45,993 respectively.
| Characteristic | Number | Measure |
| Per Capita Income | 18,619 | $25,528 |
| Median Family Income | 4,555 | $59,380 |
| Mean Family Income | 4,555 | $73,528 |
| Median Household Income | 7,190 | $45,993 |
| Mean Household Income | 7,190 | $61,004 |
| Income Deficit | 4,555 | $8,063 |
| Wage / Income Gap (%) | 18,619 | 23.00% |
| Wage / Income Gap ($) | 18,619 | 77.00¢ per $1 |
| Gini / Inequality Index | 18,619 | 0.44 |
Earnings by Sex in Randolph County
Average Earnings in Randolph County are $31,169, $35,015 for men and $26,960 for women, a difference of 23.0%.
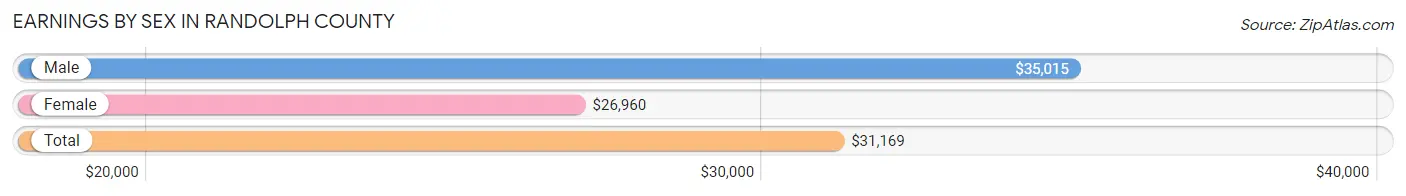
| Sex | Number | Average Earnings |
| Male | 4,709 (58.3%) | $35,015 |
| Female | 3,365 (41.7%) | $26,960 |
| Total | 8,074 (100.0%) | $31,169 |
Earnings by Sex by Income Bracket in Randolph County
The most common earnings brackets in Randolph County are $25,000 to $29,999 for men (520 | 11.0%) and $25,000 to $29,999 for women (447 | 13.3%).
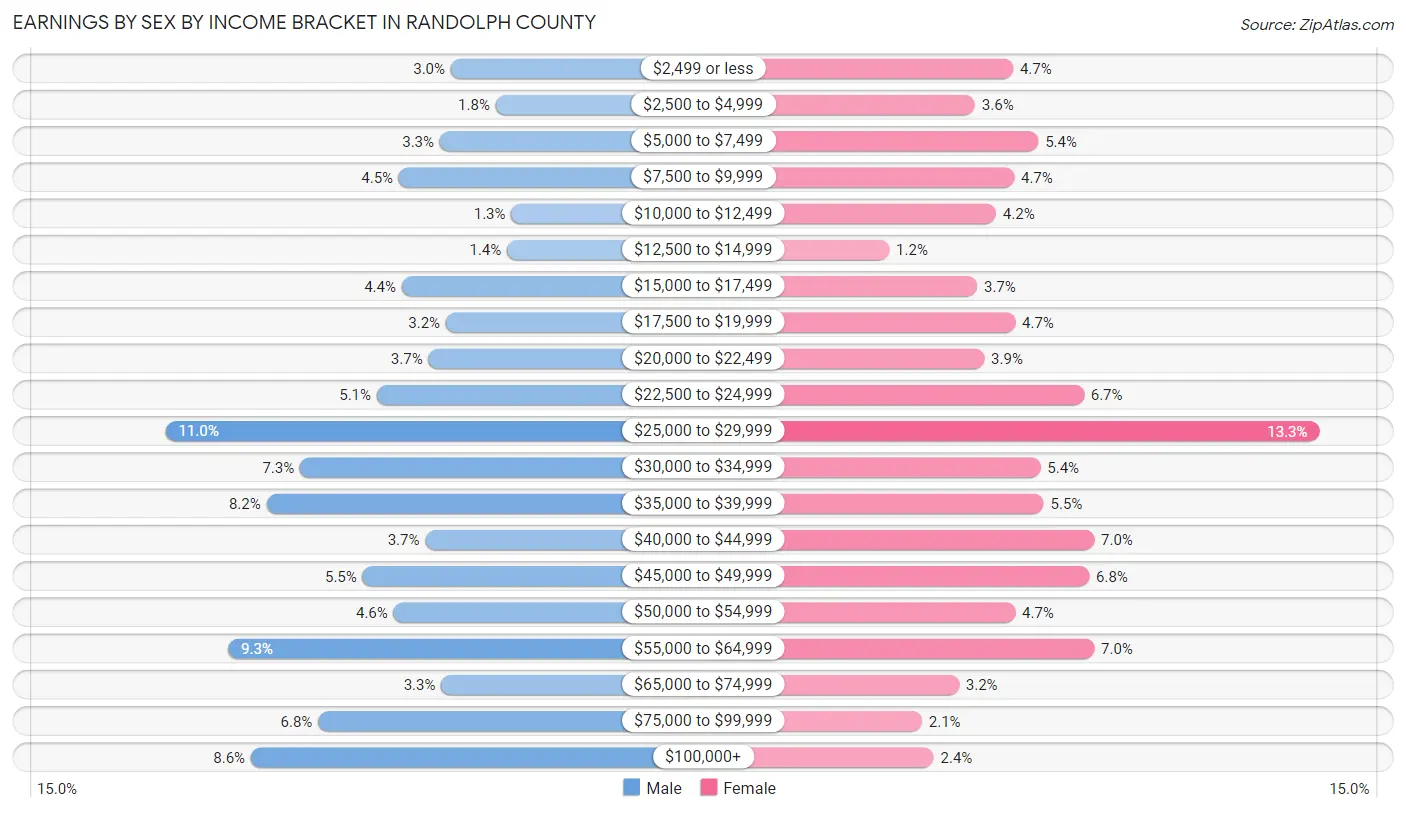
| Income | Male | Female |
| $2,499 or less | 142 (3.0%) | 157 (4.7%) |
| $2,500 to $4,999 | 83 (1.8%) | 121 (3.6%) |
| $5,000 to $7,499 | 157 (3.3%) | 181 (5.4%) |
| $7,500 to $9,999 | 211 (4.5%) | 158 (4.7%) |
| $10,000 to $12,499 | 62 (1.3%) | 141 (4.2%) |
| $12,500 to $14,999 | 68 (1.4%) | 40 (1.2%) |
| $15,000 to $17,499 | 207 (4.4%) | 123 (3.7%) |
| $17,500 to $19,999 | 149 (3.2%) | 159 (4.7%) |
| $20,000 to $22,499 | 172 (3.6%) | 130 (3.9%) |
| $22,500 to $24,999 | 240 (5.1%) | 224 (6.7%) |
| $25,000 to $29,999 | 520 (11.0%) | 447 (13.3%) |
| $30,000 to $34,999 | 342 (7.3%) | 183 (5.4%) |
| $35,000 to $39,999 | 386 (8.2%) | 186 (5.5%) |
| $40,000 to $44,999 | 176 (3.7%) | 234 (7.0%) |
| $45,000 to $49,999 | 259 (5.5%) | 229 (6.8%) |
| $50,000 to $54,999 | 218 (4.6%) | 159 (4.7%) |
| $55,000 to $64,999 | 437 (9.3%) | 234 (7.0%) |
| $65,000 to $74,999 | 155 (3.3%) | 106 (3.2%) |
| $75,000 to $99,999 | 318 (6.8%) | 71 (2.1%) |
| $100,000+ | 407 (8.6%) | 82 (2.4%) |
| Total | 4,709 (100.0%) | 3,365 (100.0%) |
Earnings by Sex by Educational Attainment in Randolph County
Average earnings in Randolph County are $37,212 for men and $30,690 for women, a difference of 17.5%. Men with an educational attainment of graduate degree enjoy the highest average annual earnings of $108,205, while those with college or associate's degree education earn the least with $32,328. Women with an educational attainment of graduate degree earn the most with the average annual earnings of $59,531, while those with high school diploma education have the smallest earnings of $23,256.
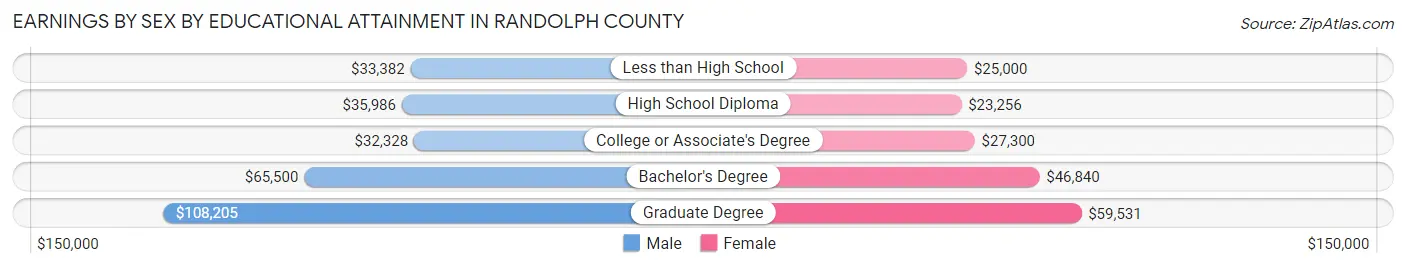
| Educational Attainment | Male Income | Female Income |
| Less than High School | $33,382 | $25,000 |
| High School Diploma | $35,986 | $23,256 |
| College or Associate's Degree | $32,328 | $27,300 |
| Bachelor's Degree | $65,500 | $46,840 |
| Graduate Degree | $108,205 | $59,531 |
| Total | $37,212 | $30,690 |
Family Income in Randolph County
Family Income Brackets in Randolph County
According to the Randolph County family income data, there are 856 families falling into the $50,000 to $74,999 income range, which is the most common income bracket and makes up 18.8% of all families. Conversely, the $10,000 to $14,999 income bracket is the least frequent group with only 77 families (1.7%) belonging to this category.
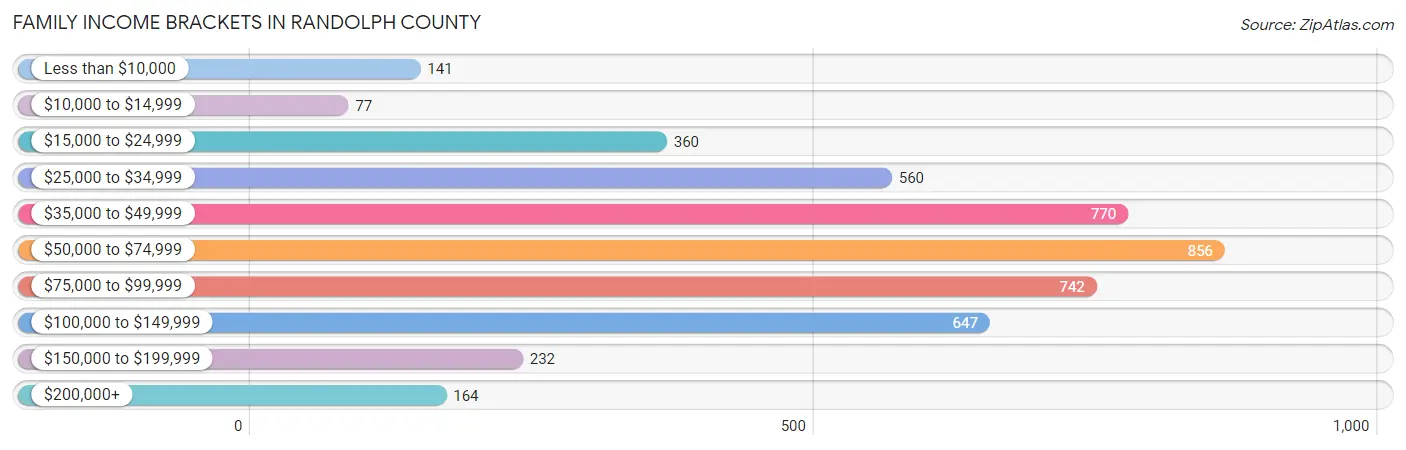
| Income Bracket | # Families | % Families |
| Less than $10,000 | 141 | 3.1% |
| $10,000 to $14,999 | 77 | 1.7% |
| $15,000 to $24,999 | 360 | 7.9% |
| $25,000 to $34,999 | 560 | 12.3% |
| $35,000 to $49,999 | 770 | 16.9% |
| $50,000 to $74,999 | 856 | 18.8% |
| $75,000 to $99,999 | 742 | 16.3% |
| $100,000 to $149,999 | 647 | 14.2% |
| $150,000 to $199,999 | 232 | 5.1% |
| $200,000+ | 164 | 3.6% |
Family Income by Famaliy Size in Randolph County
6-person families (135 | 3.0%) account for the highest median family income in Randolph County with $103,132 per family, while 2-person families (2,011 | 44.2%) have the highest median income of $27,274 per family member.
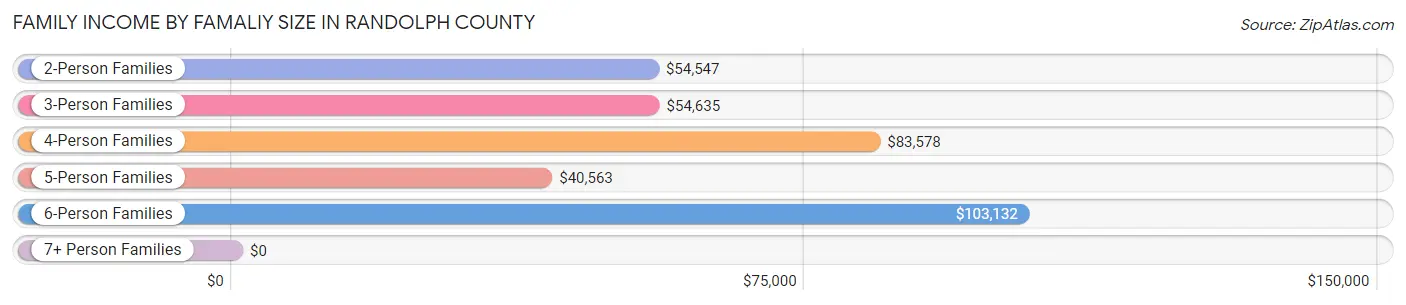
| Income Bracket | # Families | Median Income |
| 2-Person Families | 2,011 (44.2%) | $54,547 |
| 3-Person Families | 807 (17.7%) | $54,635 |
| 4-Person Families | 1,102 (24.2%) | $83,578 |
| 5-Person Families | 411 (9.0%) | $40,563 |
| 6-Person Families | 135 (3.0%) | $103,132 |
| 7+ Person Families | 89 (1.9%) | $0 |
| Total | 4,555 (100.0%) | $59,380 |
Family Income by Number of Earners in Randolph County
The median family income in Randolph County is $59,380, with families comprising 3+ earners (317) having the highest median family income of $133,101, while families with no earners (795) have the lowest median family income of $33,505, accounting for 7.0% and 17.4% of families, respectively.
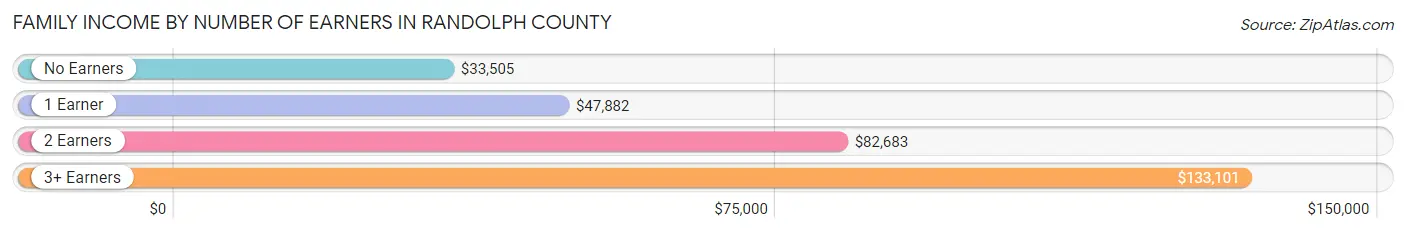
| Number of Earners | # Families | Median Income |
| No Earners | 795 (17.4%) | $33,505 |
| 1 Earner | 1,777 (39.0%) | $47,882 |
| 2 Earners | 1,666 (36.6%) | $82,683 |
| 3+ Earners | 317 (7.0%) | $133,101 |
| Total | 4,555 (100.0%) | $59,380 |
Household Income in Randolph County
Household Income Brackets in Randolph County
With 1,273 households falling in the category, the $15,000 to $24,999 income range is the most frequent in Randolph County, accounting for 17.7% of all households. In contrast, only 187 households (2.6%) fall into the $200,000+ income bracket, making it the least populous group.
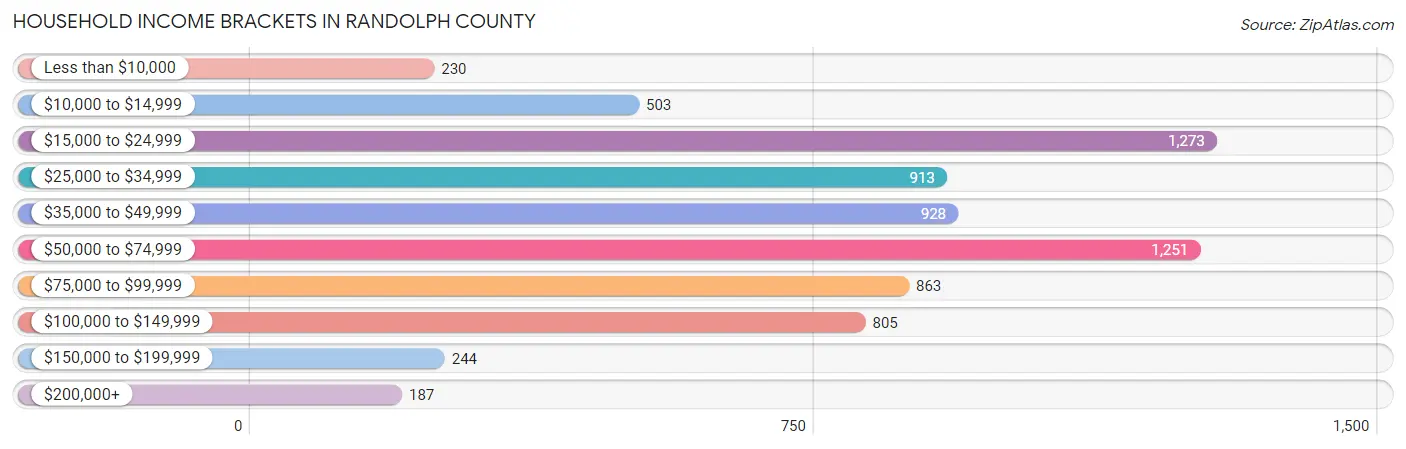
| Income Bracket | # Households | % Households |
| Less than $10,000 | 230 | 3.2% |
| $10,000 to $14,999 | 503 | 7.0% |
| $15,000 to $24,999 | 1,273 | 17.7% |
| $25,000 to $34,999 | 913 | 12.7% |
| $35,000 to $49,999 | 928 | 12.9% |
| $50,000 to $74,999 | 1,251 | 17.4% |
| $75,000 to $99,999 | 863 | 12.0% |
| $100,000 to $149,999 | 805 | 11.2% |
| $150,000 to $199,999 | 244 | 3.4% |
| $200,000+ | 187 | 2.6% |
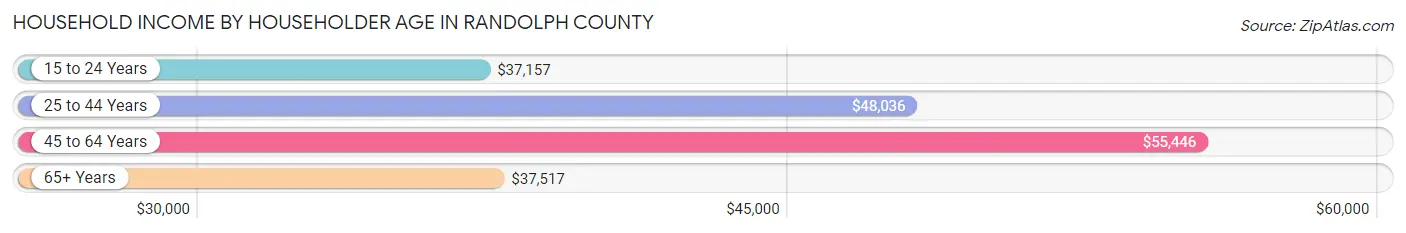
Household Income by Householder Age in Randolph County
The median household income in Randolph County is $45,993, with the highest median household income of $55,446 found in the 45 to 64 years age bracket for the primary householder. A total of 2,572 households (35.8%) fall into this category. Meanwhile, the 15 to 24 years age bracket for the primary householder has the lowest median household income of $37,157, with 250 households (3.5%) in this group.
| Income Bracket | # Households | Median Income |
| 15 to 24 Years | 250 (3.5%) | $37,157 |
| 25 to 44 Years | 1,951 (27.1%) | $48,036 |
| 45 to 64 Years | 2,572 (35.8%) | $55,446 |
| 65+ Years | 2,417 (33.6%) | $37,517 |
| Total | 7,190 (100.0%) | $45,993 |
Poverty in Randolph County
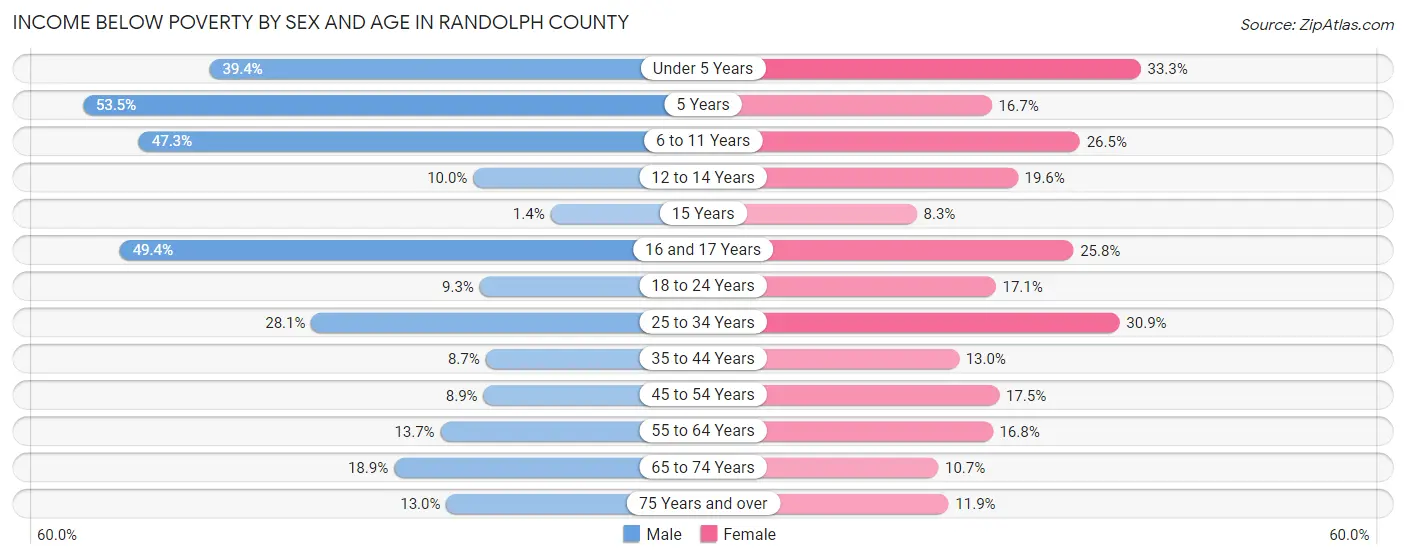
Income Below Poverty by Sex and Age in Randolph County
With 19.5% poverty level for males and 19.0% for females among the residents of Randolph County, 5 year old males and under 5 year old females are the most vulnerable to poverty, with 61 males (53.5%) and 187 females (33.3%) in their respective age groups living below the poverty level.
| Age Bracket | Male | Female |
| Under 5 Years | 227 (39.4%) | 187 (33.3%) |
| 5 Years | 61 (53.5%) | 9 (16.7%) |
| 6 to 11 Years | 364 (47.3%) | 159 (26.5%) |
| 12 to 14 Years | 52 (10.0%) | 94 (19.6%) |
| 15 Years | 3 (1.4%) | 6 (8.3%) |
| 16 and 17 Years | 82 (49.4%) | 67 (25.8%) |
| 18 to 24 Years | 68 (9.3%) | 107 (17.1%) |
| 25 to 34 Years | 327 (28.1%) | 333 (30.9%) |
| 35 to 44 Years | 96 (8.7%) | 138 (13.0%) |
| 45 to 54 Years | 100 (8.9%) | 187 (17.5%) |
| 55 to 64 Years | 162 (13.7%) | 214 (16.8%) |
| 65 to 74 Years | 172 (18.9%) | 111 (10.7%) |
| 75 Years and over | 85 (13.0%) | 108 (11.9%) |
| Total | 1,799 (19.5%) | 1,720 (19.0%) |
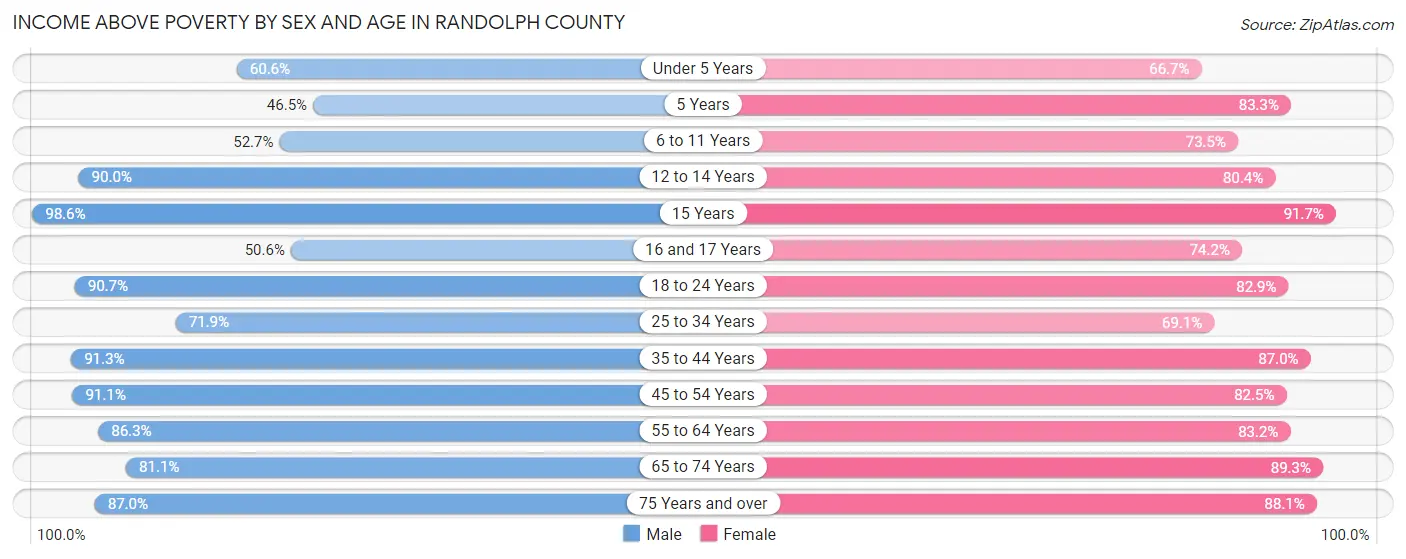
Income Above Poverty by Sex and Age in Randolph County
According to the poverty statistics in Randolph County, males aged 15 years and females aged 15 years are the age groups that are most secure financially, with 98.6% of males and 91.7% of females in these age groups living above the poverty line.
| Age Bracket | Male | Female |
| Under 5 Years | 349 (60.6%) | 375 (66.7%) |
| 5 Years | 53 (46.5%) | 45 (83.3%) |
| 6 to 11 Years | 406 (52.7%) | 441 (73.5%) |
| 12 to 14 Years | 466 (90.0%) | 386 (80.4%) |
| 15 Years | 207 (98.6%) | 66 (91.7%) |
| 16 and 17 Years | 84 (50.6%) | 193 (74.2%) |
| 18 to 24 Years | 662 (90.7%) | 518 (82.9%) |
| 25 to 34 Years | 838 (71.9%) | 744 (69.1%) |
| 35 to 44 Years | 1,013 (91.3%) | 922 (87.0%) |
| 45 to 54 Years | 1,023 (91.1%) | 881 (82.5%) |
| 55 to 64 Years | 1,021 (86.3%) | 1,061 (83.2%) |
| 65 to 74 Years | 740 (81.1%) | 924 (89.3%) |
| 75 Years and over | 567 (87.0%) | 802 (88.1%) |
| Total | 7,429 (80.5%) | 7,358 (81.0%) |
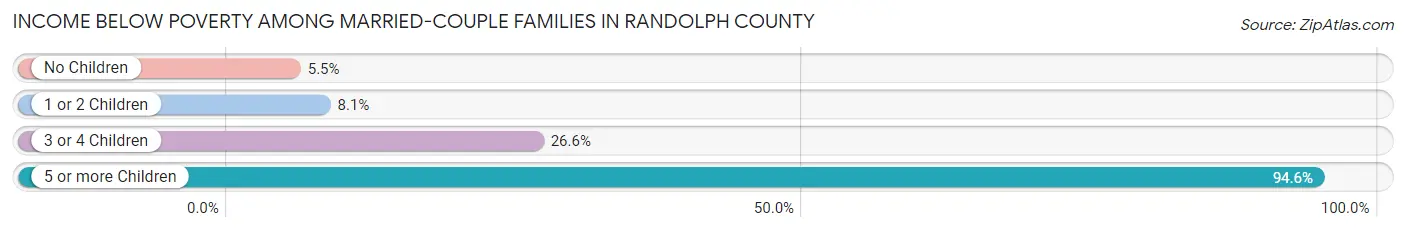
Income Below Poverty Among Married-Couple Families in Randolph County
The poverty statistics for married-couple families in Randolph County show that 9.4% or 333 of the total 3,540 families live below the poverty line. Families with 5 or more children have the highest poverty rate of 94.6%, comprising of 35 families. On the other hand, families with no children have the lowest poverty rate of 5.5%, which includes 100 families.
| Children | Above Poverty | Below Poverty |
| No Children | 1,733 (94.5%) | 100 (5.5%) |
| 1 or 2 Children | 1,221 (91.9%) | 107 (8.1%) |
| 3 or 4 Children | 251 (73.4%) | 91 (26.6%) |
| 5 or more Children | 2 (5.4%) | 35 (94.6%) |
| Total | 3,207 (90.6%) | 333 (9.4%) |
Income Below Poverty Among Single-Parent Households in Randolph County
According to the poverty data in Randolph County, 12.2% or 38 single-father households and 40.1% or 282 single-mother households are living below the poverty line. Among single-father households, those with 3 or 4 children have the highest poverty rate, with 17 households (100.0%) experiencing poverty. Likewise, among single-mother households, those with 3 or 4 children have the highest poverty rate, with 72 households (87.8%) falling below the poverty line.
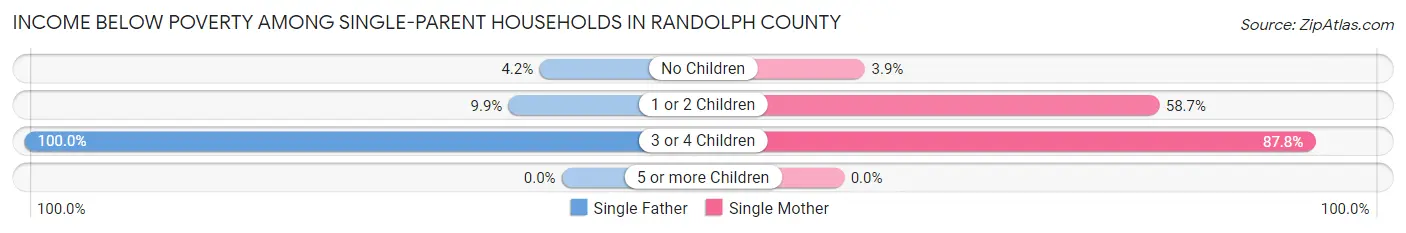
| Children | Single Father | Single Mother |
| No Children | 6 (4.2%) | 11 (3.9%) |
| 1 or 2 Children | 15 (9.9%) | 199 (58.7%) |
| 3 or 4 Children | 17 (100.0%) | 72 (87.8%) |
| 5 or more Children | 0 (0.0%) | 0 (0.0%) |
| Total | 38 (12.2%) | 282 (40.1%) |
Income Below Poverty Among Married-Couple vs Single-Parent Households in Randolph County
The poverty data for Randolph County shows that 333 of the married-couple family households (9.4%) and 320 of the single-parent households (31.5%) are living below the poverty level. Within the married-couple family households, those with 5 or more children have the highest poverty rate, with 35 households (94.6%) falling below the poverty line. Among the single-parent households, those with 3 or 4 children have the highest poverty rate, with 89 household (89.9%) living below poverty.
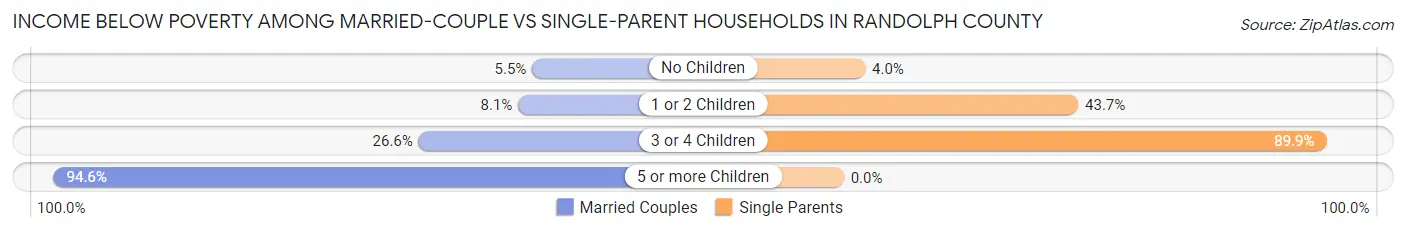
| Children | Married-Couple Families | Single-Parent Households |
| No Children | 100 (5.5%) | 17 (4.0%) |
| 1 or 2 Children | 107 (8.1%) | 214 (43.7%) |
| 3 or 4 Children | 91 (26.6%) | 89 (89.9%) |
| 5 or more Children | 35 (94.6%) | 0 (0.0%) |
| Total | 333 (9.4%) | 320 (31.5%) |
Race in Randolph County
The most populous races in Randolph County are White / Caucasian (16,846 | 90.5%), Two or more Races (1,018 | 5.5%), and Hispanic or Latino (456 | 2.5%).
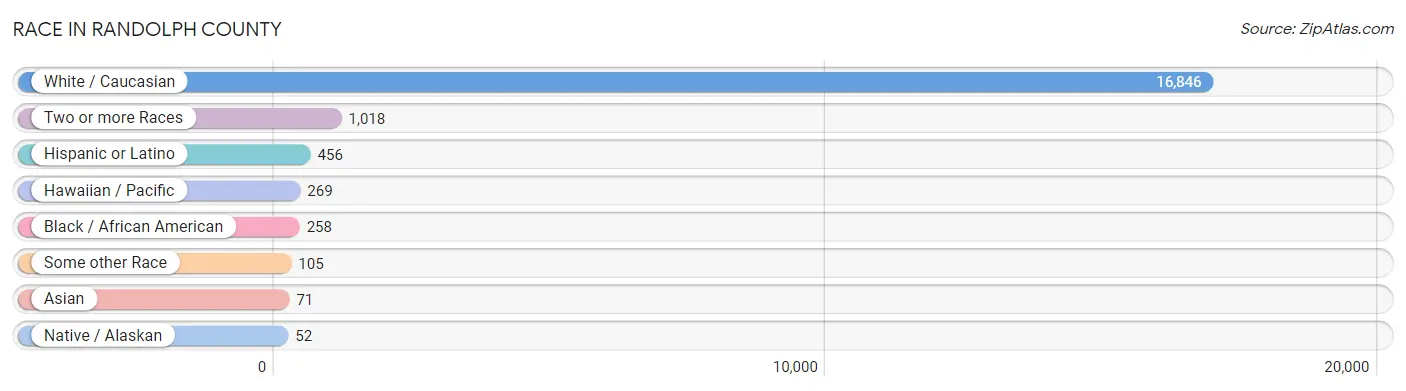
| Race | # Population | % Population |
| Asian | 71 | 0.4% |
| Black / African American | 258 | 1.4% |
| Hawaiian / Pacific | 269 | 1.4% |
| Hispanic or Latino | 456 | 2.5% |
| Native / Alaskan | 52 | 0.3% |
| White / Caucasian | 16,846 | 90.5% |
| Two or more Races | 1,018 | 5.5% |
| Some other Race | 105 | 0.6% |
| Total | 18,619 | 100.0% |
Ancestry in Randolph County
The most populous ancestries reported in Randolph County are German (2,686 | 14.4%), Irish (2,563 | 13.8%), American (2,042 | 11.0%), English (1,940 | 10.4%), and Scottish (629 | 3.4%), together accounting for 53.0% of all Randolph County residents.
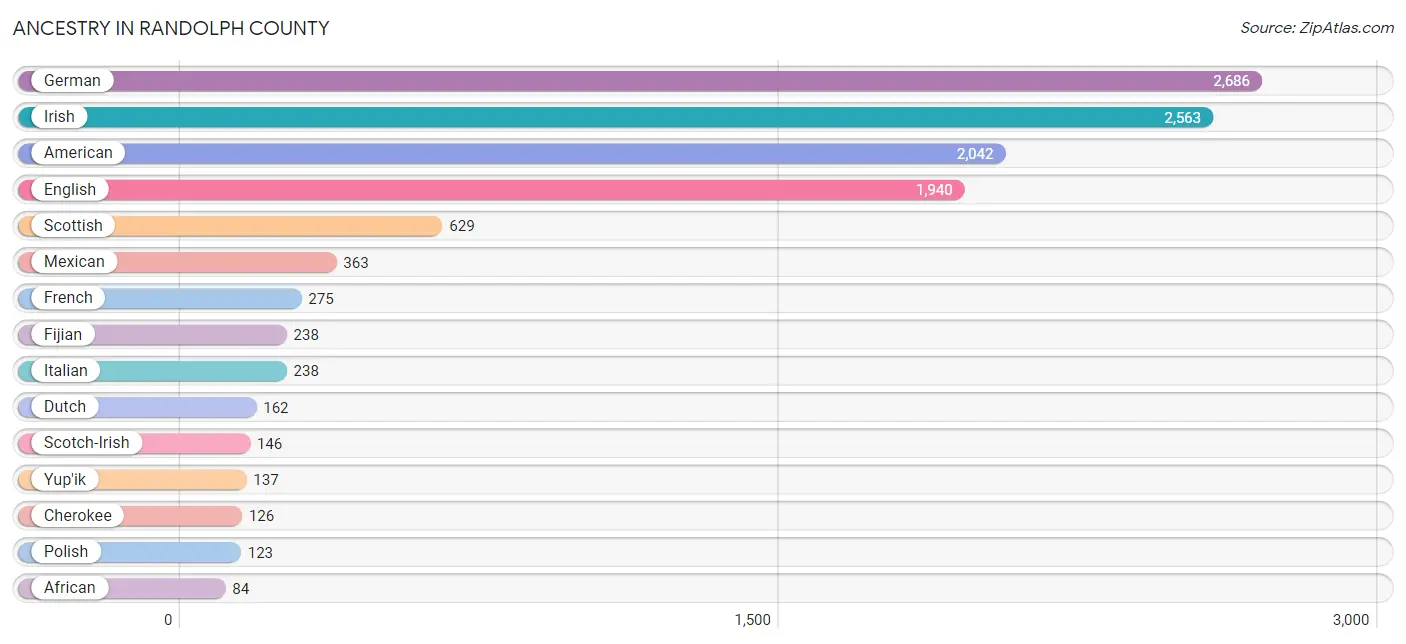
| Ancestry | # Population | % Population |
| African | 84 | 0.4% |
| American | 2,042 | 11.0% |
| Australian | 15 | 0.1% |
| Austrian | 10 | 0.1% |
| Blackfeet | 6 | 0.0% |
| Brazilian | 9 | 0.1% |
| British | 42 | 0.2% |
| Burmese | 8 | 0.0% |
| Cajun | 32 | 0.2% |
| Cherokee | 126 | 0.7% |
| Chippewa | 7 | 0.0% |
| Choctaw | 15 | 0.1% |
| Comanche | 4 | 0.0% |
| Dutch | 162 | 0.9% |
| Eastern European | 23 | 0.1% |
| English | 1,940 | 10.4% |
| European | 27 | 0.2% |
| Fijian | 238 | 1.3% |
| Filipino | 4 | 0.0% |
| Finnish | 16 | 0.1% |
| French | 275 | 1.5% |
| French Canadian | 11 | 0.1% |
| German | 2,686 | 14.4% |
| Greek | 22 | 0.1% |
| Hungarian | 48 | 0.3% |
| Irish | 2,563 | 13.8% |
| Italian | 238 | 1.3% |
| Korean | 74 | 0.4% |
| Mexican | 363 | 1.9% |
| Navajo | 10 | 0.1% |
| Northern European | 11 | 0.1% |
| Norwegian | 33 | 0.2% |
| Polish | 123 | 0.7% |
| Portuguese | 7 | 0.0% |
| Russian | 7 | 0.0% |
| Scotch-Irish | 146 | 0.8% |
| Scottish | 629 | 3.4% |
| Sioux | 1 | 0.0% |
| Spanish | 77 | 0.4% |
| Subsaharan African | 84 | 0.4% |
| Swedish | 47 | 0.3% |
| Swiss | 4 | 0.0% |
| Thai | 32 | 0.2% |
| Welsh | 57 | 0.3% |
| Yup'ik | 137 | 0.7% | View All 45 Rows |
Immigrants in Randolph County
The most numerous immigrant groups reported in Randolph County came from Oceania (242 | 1.3%), Europe (189 | 1.0%), Latin America (135 | 0.7%), Northern Europe (116 | 0.6%), and Scotland (116 | 0.6%), together accounting for 4.3% of all Randolph County residents.
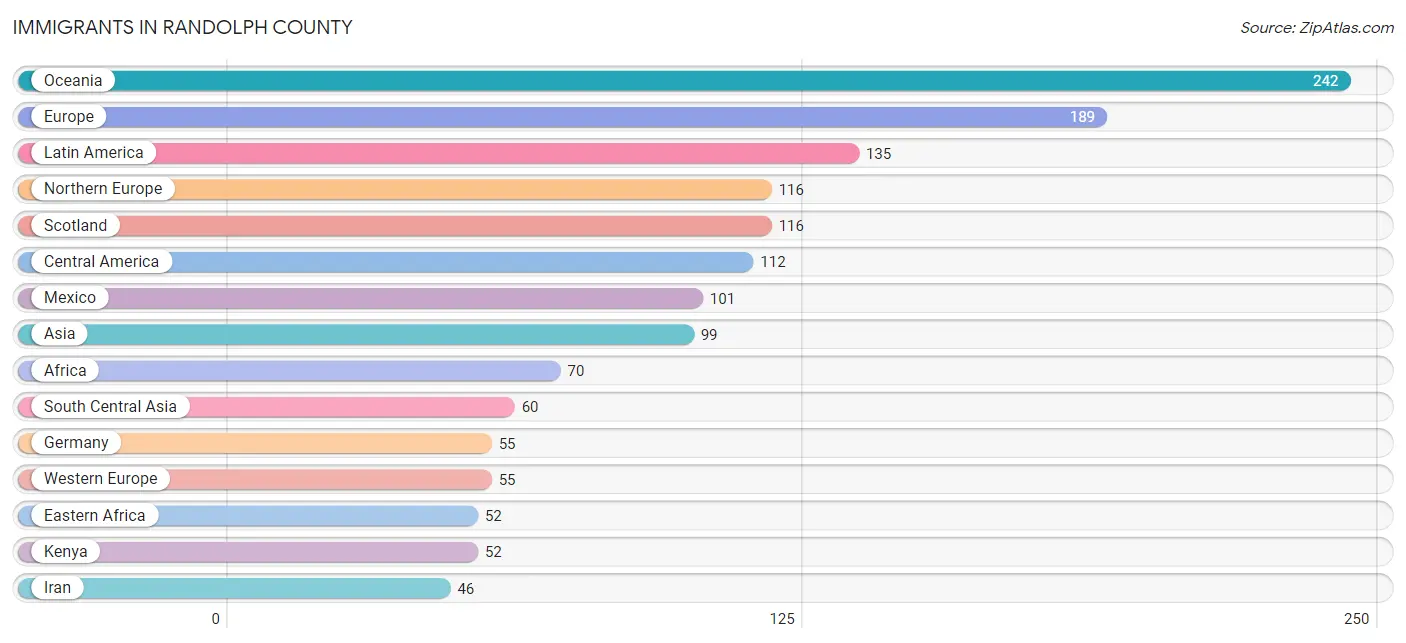
| Immigration Origin | # Population | % Population |
| Africa | 70 | 0.4% |
| Asia | 99 | 0.5% |
| Australia | 15 | 0.1% |
| Brazil | 23 | 0.1% |
| Central America | 112 | 0.6% |
| China | 4 | 0.0% |
| Eastern Africa | 52 | 0.3% |
| Eastern Asia | 12 | 0.1% |
| Europe | 189 | 1.0% |
| Germany | 55 | 0.3% |
| Greece | 18 | 0.1% |
| Honduras | 11 | 0.1% |
| India | 14 | 0.1% |
| Iran | 46 | 0.3% |
| Kenya | 52 | 0.3% |
| Korea | 8 | 0.0% |
| Latin America | 135 | 0.7% |
| Mexico | 101 | 0.5% |
| Northern Europe | 116 | 0.6% |
| Oceania | 242 | 1.3% |
| Philippines | 27 | 0.2% |
| Scotland | 116 | 0.6% |
| South America | 23 | 0.1% |
| South Central Asia | 60 | 0.3% |
| South Eastern Asia | 27 | 0.2% |
| Southern Europe | 18 | 0.1% |
| Western Europe | 55 | 0.3% | View All 27 Rows |
Sex and Age in Randolph County
Sex and Age in Randolph County
The most populous age groups in Randolph County are 10 to 14 Years (791 | 8.4%) for men and 35 to 39 Years (762 | 8.3%) for women.
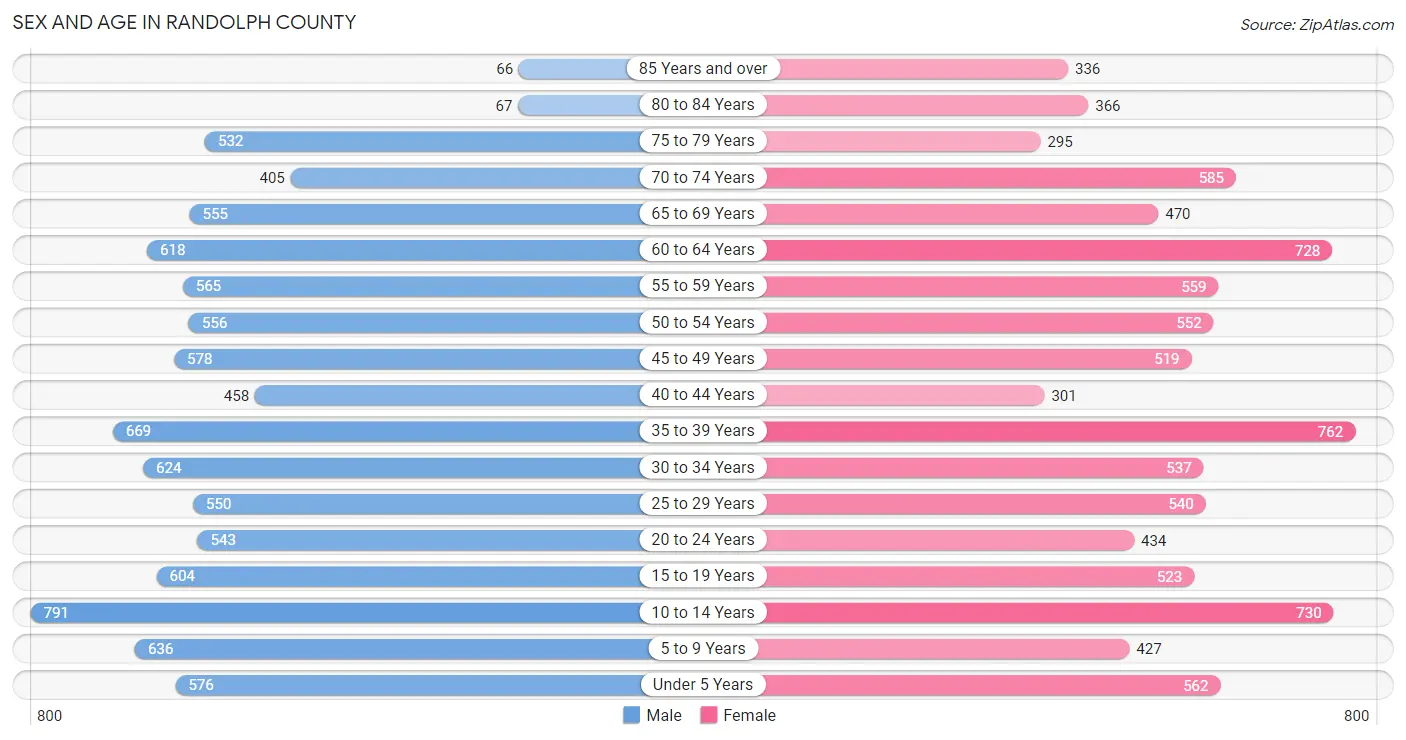
| Age Bracket | Male | Female |
| Under 5 Years | 576 (6.1%) | 562 (6.1%) |
| 5 to 9 Years | 636 (6.8%) | 427 (4.6%) |
| 10 to 14 Years | 791 (8.4%) | 730 (7.9%) |
| 15 to 19 Years | 604 (6.4%) | 523 (5.7%) |
| 20 to 24 Years | 543 (5.8%) | 434 (4.7%) |
| 25 to 29 Years | 550 (5.9%) | 540 (5.9%) |
| 30 to 34 Years | 624 (6.6%) | 537 (5.8%) |
| 35 to 39 Years | 669 (7.1%) | 762 (8.3%) |
| 40 to 44 Years | 458 (4.9%) | 301 (3.3%) |
| 45 to 49 Years | 578 (6.1%) | 519 (5.6%) |
| 50 to 54 Years | 556 (5.9%) | 552 (6.0%) |
| 55 to 59 Years | 565 (6.0%) | 559 (6.1%) |
| 60 to 64 Years | 618 (6.6%) | 728 (7.9%) |
| 65 to 69 Years | 555 (5.9%) | 470 (5.1%) |
| 70 to 74 Years | 405 (4.3%) | 585 (6.3%) |
| 75 to 79 Years | 532 (5.7%) | 295 (3.2%) |
| 80 to 84 Years | 67 (0.7%) | 366 (4.0%) |
| 85 Years and over | 66 (0.7%) | 336 (3.6%) |
| Total | 9,393 (100.0%) | 9,226 (100.0%) |
Families and Households in Randolph County
Median Family Size in Randolph County
The median family size in Randolph County is 3.26 persons per family, with single female/mother families (703 | 15.4%) accounting for the largest median family size of 3.43 persons per family. On the other hand, single male/father families (312 | 6.9%) represent the smallest median family size with 3.01 persons per family.
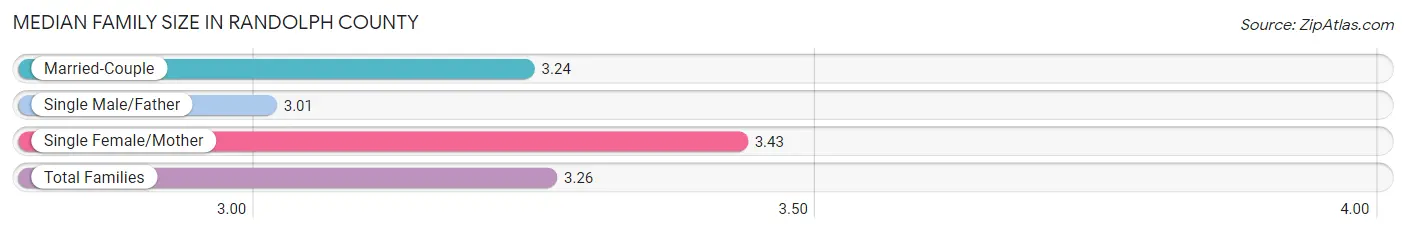
| Family Type | # Families | Family Size |
| Married-Couple | 3,540 (77.7%) | 3.24 |
| Single Male/Father | 312 (6.9%) | 3.01 |
| Single Female/Mother | 703 (15.4%) | 3.43 |
| Total Families | 4,555 (100.0%) | 3.26 |
Median Household Size in Randolph County
The median household size in Randolph County is 2.55 persons per household, with single female/mother households (703 | 9.8%) accounting for the largest median household size of 3.82 persons per household. non-family households (2,635 | 36.6%) represent the smallest median household size with 1.17 persons per household.
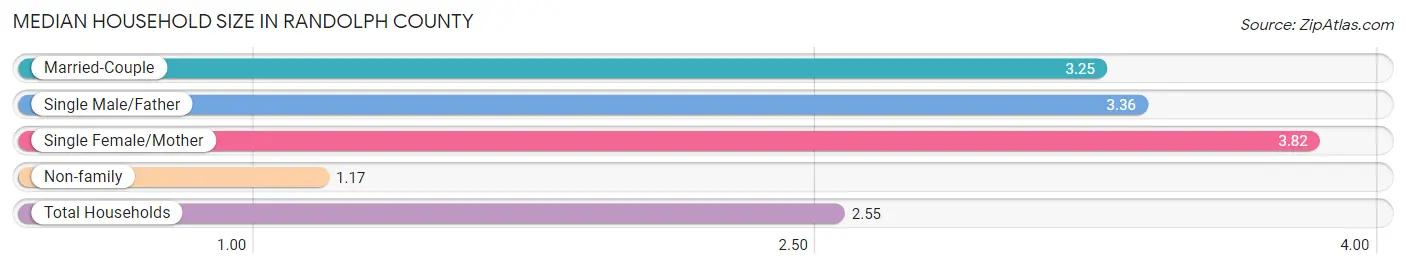
| Household Type | # Households | Household Size |
| Married-Couple | 3,540 (49.2%) | 3.25 |
| Single Male/Father | 312 (4.3%) | 3.36 |
| Single Female/Mother | 703 (9.8%) | 3.82 |
| Non-family | 2,635 (36.6%) | 1.17 |
| Total Households | 7,190 (100.0%) | 2.55 |
Household Size by Marriage Status in Randolph County
Out of a total of 7,190 households in Randolph County, 4,555 (63.3%) are family households, while 2,635 (36.6%) are nonfamily households. The most numerous type of family households are 2-person households, comprising 1,859, and the most common type of nonfamily households are 1-person households, comprising 2,331.
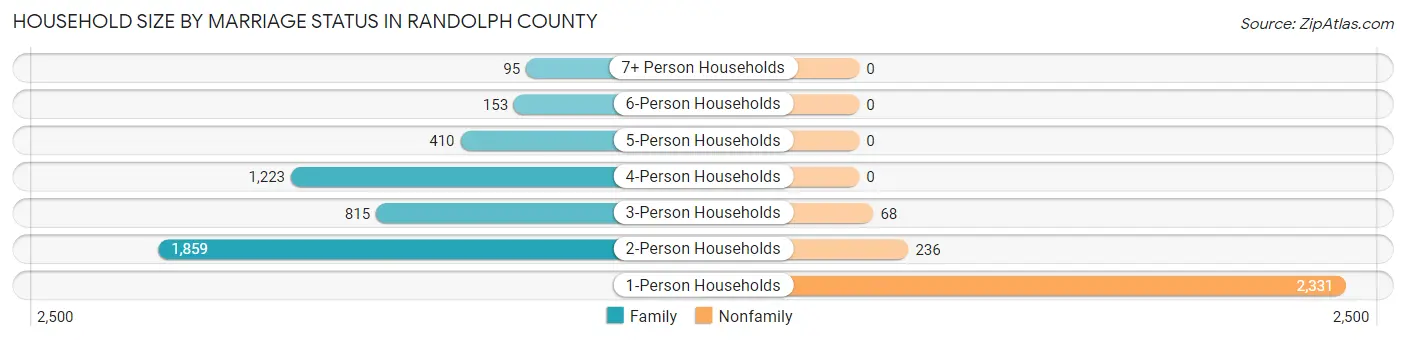
| Household Size | Family Households | Nonfamily Households |
| 1-Person Households | - | 2,331 (32.4%) |
| 2-Person Households | 1,859 (25.9%) | 236 (3.3%) |
| 3-Person Households | 815 (11.3%) | 68 (0.9%) |
| 4-Person Households | 1,223 (17.0%) | 0 (0.0%) |
| 5-Person Households | 410 (5.7%) | 0 (0.0%) |
| 6-Person Households | 153 (2.1%) | 0 (0.0%) |
| 7+ Person Households | 95 (1.3%) | 0 (0.0%) |
| Total | 4,555 (63.3%) | 2,635 (36.6%) |
Female Fertility in Randolph County
Fertility by Age in Randolph County
Average fertility rate in Randolph County is 118.0 births per 1,000 women. Women in the age bracket of 20 to 34 years have the highest fertility rate with 253.0 births per 1,000 women. Women in the age bracket of 20 to 34 years acount for 87.4% of all women with births.
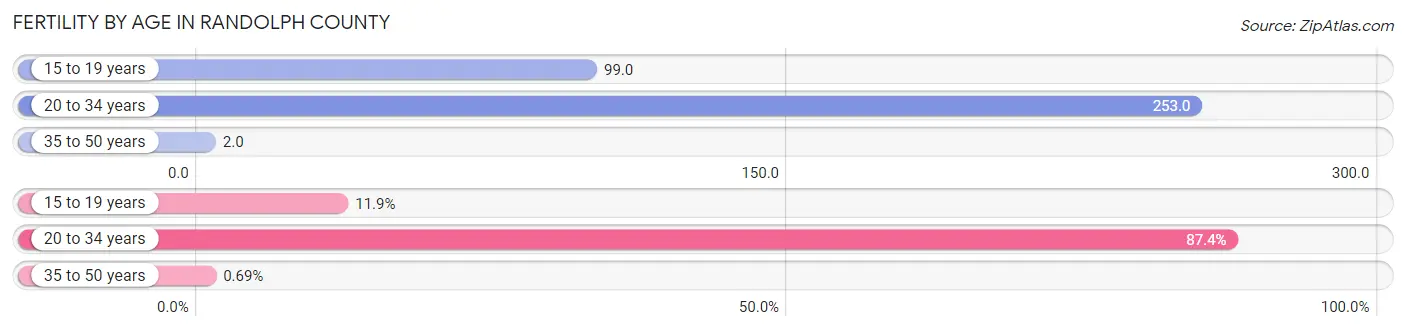
| Age Bracket | Women with Births | Births / 1,000 Women |
| 15 to 19 years | 52 (11.9%) | 99.0 |
| 20 to 34 years | 382 (87.4%) | 253.0 |
| 35 to 50 years | 3 (0.7%) | 2.0 |
| Total | 437 (100.0%) | 118.0 |
Fertility by Age by Marriage Status in Randolph County
44.2% of women with births (437) in Randolph County are married. The highest percentage of unmarried women with births falls into 15 to 19 years age bracket with 100.0% of them unmarried at the time of birth, while the lowest percentage of unmarried women with births belong to 20 to 34 years age bracket with 49.5% of them unmarried.
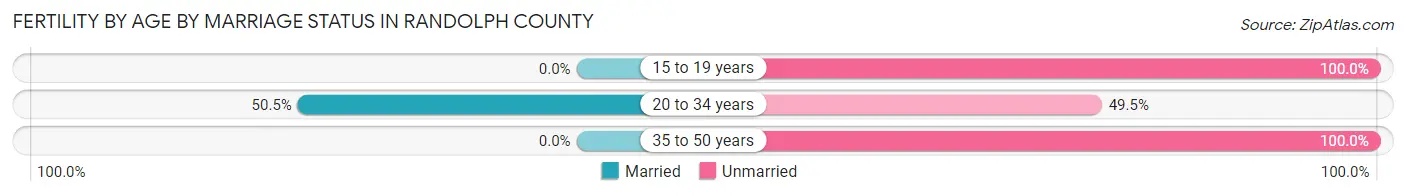
| Age Bracket | Married | Unmarried |
| 15 to 19 years | 0 (0.0%) | 52 (100.0%) |
| 20 to 34 years | 193 (50.5%) | 189 (49.5%) |
| 35 to 50 years | 0 (0.0%) | 3 (100.0%) |
| Total | 193 (44.2%) | 244 (55.8%) |
Fertility by Education in Randolph County
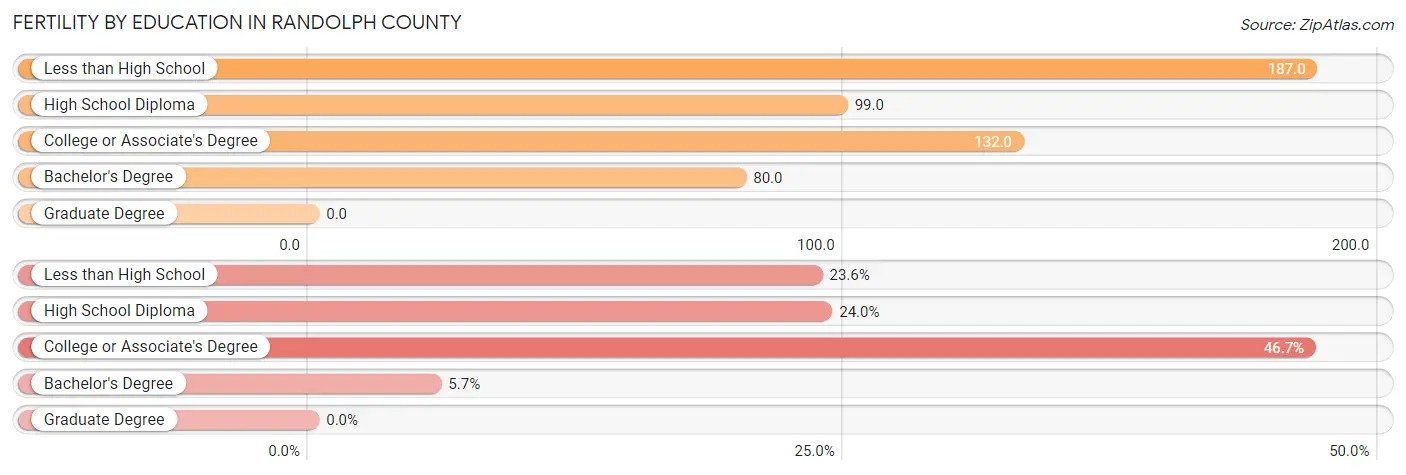
| Educational Attainment | Women with Births | Births / 1,000 Women |
| Less than High School | 103 (23.6%) | 187.0 |
| High School Diploma | 105 (24.0%) | 99.0 |
| College or Associate's Degree | 204 (46.7%) | 132.0 |
| Bachelor's Degree | 25 (5.7%) | 80.0 |
| Graduate Degree | 0 (0.0%) | 0.0 |
| Total | 437 (100.0%) | 118.0 |
Fertility by Education by Marriage Status in Randolph County
55.8% of women with births in Randolph County are unmarried. Women with the educational attainment of bachelor's degree are most likely to be married with 100.0% of them married at childbirth, while women with the educational attainment of high school diploma are least likely to be married with 85.7% of them unmarried at childbirth.
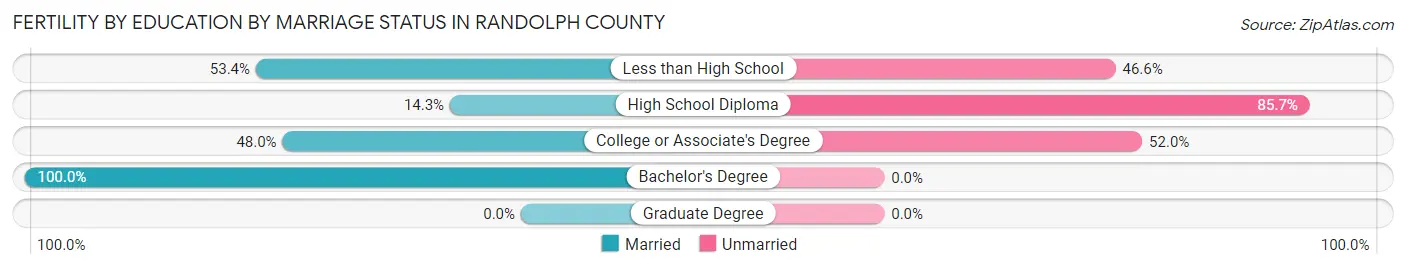
| Educational Attainment | Married | Unmarried |
| Less than High School | 55 (53.4%) | 48 (46.6%) |
| High School Diploma | 15 (14.3%) | 90 (85.7%) |
| College or Associate's Degree | 98 (48.0%) | 106 (52.0%) |
| Bachelor's Degree | 25 (100.0%) | 0 (0.0%) |
| Graduate Degree | 0 (0.0%) | 0 (0.0%) |
| Total | 193 (44.2%) | 244 (55.8%) |
Employment Characteristics in Randolph County
Employment by Class of Employer in Randolph County
Among the 6,962 employed individuals in Randolph County, private company employees (4,784 | 68.7%), self-employed (not incorporated) (654 | 9.4%), and local government employees (425 | 6.1%) make up the most common classes of employment.
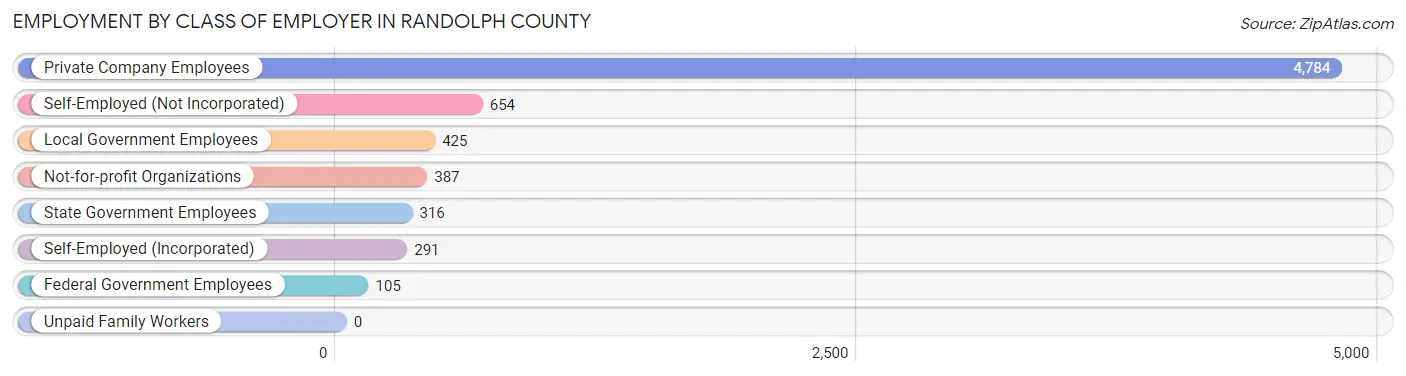
| Employer Class | # Employees | % Employees |
| Private Company Employees | 4,784 | 68.7% |
| Self-Employed (Incorporated) | 291 | 4.2% |
| Self-Employed (Not Incorporated) | 654 | 9.4% |
| Not-for-profit Organizations | 387 | 5.6% |
| Local Government Employees | 425 | 6.1% |
| State Government Employees | 316 | 4.5% |
| Federal Government Employees | 105 | 1.5% |
| Unpaid Family Workers | 0 | 0.0% |
| Total | 6,962 | 100.0% |
Employment Status by Age in Randolph County
According to the labor force statistics for Randolph County, out of the total population over 16 years of age (14,615), 52.9% or 7,731 individuals are in the labor force, with 7.5% or 580 of them unemployed. The age group with the highest labor force participation rate is 30 to 34 years, with 81.5% or 946 individuals in the labor force. Within the labor force, the 75 years and over age range has the highest percentage of unemployed individuals, with 17.0% or 23 of them being unemployed.
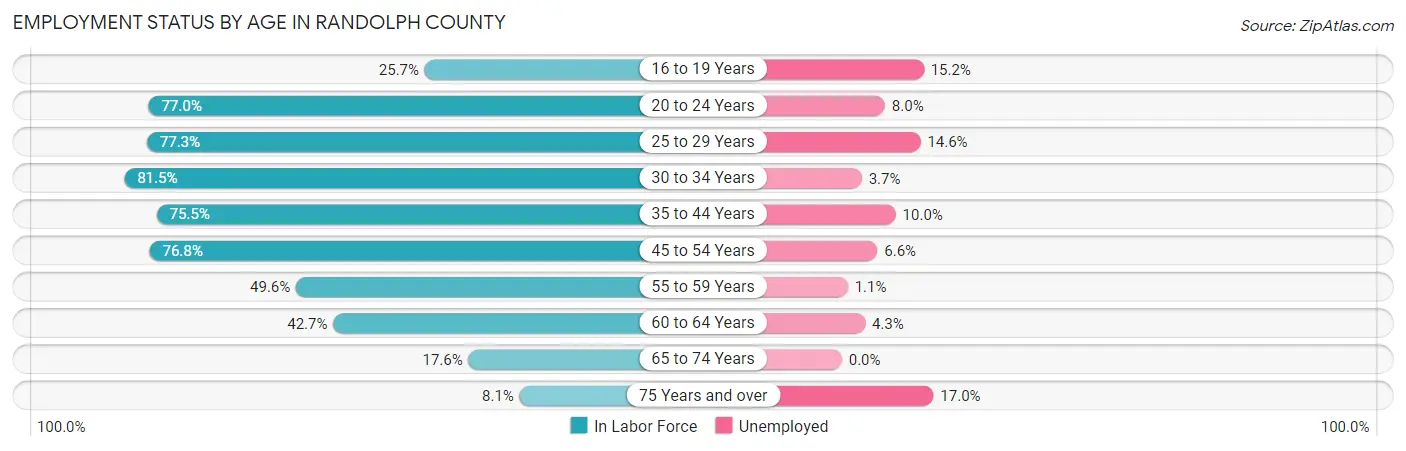
| Age Bracket | In Labor Force | Unemployed |
| 16 to 19 Years | 217 (25.7%) | 33 (15.2%) |
| 20 to 24 Years | 752 (77.0%) | 60 (8.0%) |
| 25 to 29 Years | 843 (77.3%) | 123 (14.6%) |
| 30 to 34 Years | 946 (81.5%) | 35 (3.7%) |
| 35 to 44 Years | 1,653 (75.5%) | 165 (10.0%) |
| 45 to 54 Years | 1,693 (76.8%) | 112 (6.6%) |
| 55 to 59 Years | 558 (49.6%) | 6 (1.1%) |
| 60 to 64 Years | 575 (42.7%) | 25 (4.3%) |
| 65 to 74 Years | 355 (17.6%) | 0 (0.0%) |
| 75 Years and over | 135 (8.1%) | 23 (17.0%) |
| Total | 7,731 (52.9%) | 580 (7.5%) |
Employment Status by Educational Attainment in Randolph County
According to labor force statistics for Randolph County, 68.8% of individuals (6,272) out of the total population between 25 and 64 years of age (9,116) are in the labor force, with 7.4% or 464 of them being unemployed. The group with the highest labor force participation rate are those with the educational attainment of bachelor's degree or higher, with 85.0% or 1,255 individuals in the labor force. Within the labor force, individuals with college / associate degree education have the highest percentage of unemployment, with 10.5% or 217 of them being unemployed.
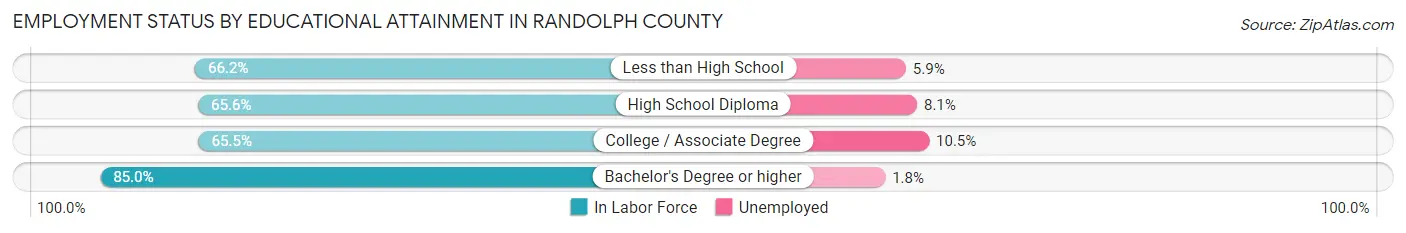
| Educational Attainment | In Labor Force | Unemployed |
| Less than High School | 576 (66.2%) | 51 (5.9%) |
| High School Diploma | 2,371 (65.6%) | 293 (8.1%) |
| College / Associate Degree | 2,067 (65.5%) | 331 (10.5%) |
| Bachelor's Degree or higher | 1,255 (85.0%) | 27 (1.8%) |
| Total | 6,272 (68.8%) | 675 (7.4%) |
Employment Occupations by Sex in Randolph County
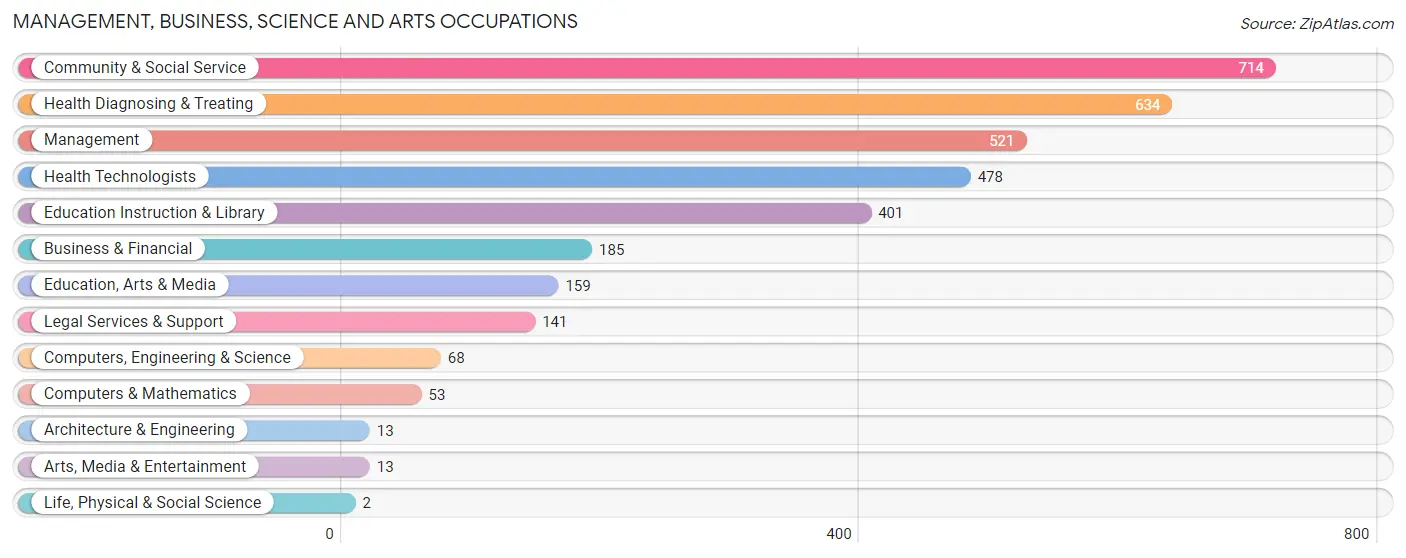
Management, Business, Science and Arts Occupations
The most common Management, Business, Science and Arts occupations in Randolph County are Community & Social Service (714 | 10.0%), Health Diagnosing & Treating (634 | 8.9%), Management (521 | 7.3%), Health Technologists (478 | 6.7%), and Education Instruction & Library (401 | 5.6%).
Management, Business, Science and Arts Occupations by Sex
Within the Management, Business, Science and Arts occupations in Randolph County, the most male-oriented occupations are Architecture & Engineering (100.0%), Management (73.9%), and Legal Services & Support (69.5%), while the most female-oriented occupations are Life, Physical & Social Science (100.0%), Education Instruction & Library (78.8%), and Health Diagnosing & Treating (76.8%).
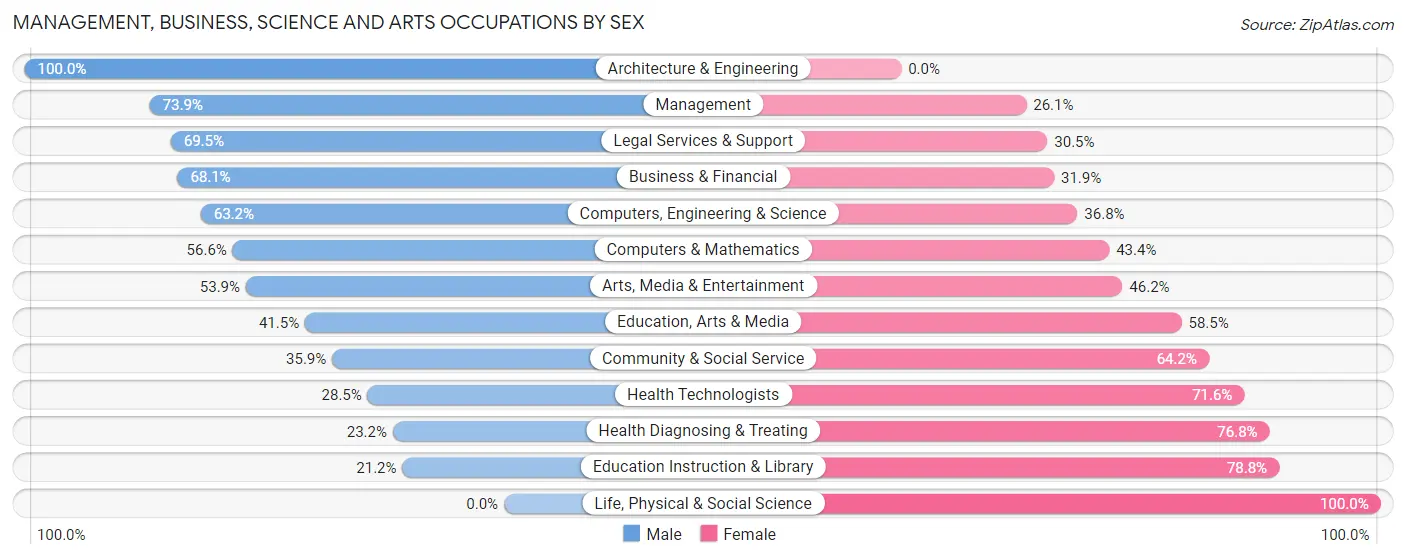
| Occupation | Male | Female |
| Management | 385 (73.9%) | 136 (26.1%) |
| Business & Financial | 126 (68.1%) | 59 (31.9%) |
| Computers, Engineering & Science | 43 (63.2%) | 25 (36.8%) |
| Computers & Mathematics | 30 (56.6%) | 23 (43.4%) |
| Architecture & Engineering | 13 (100.0%) | 0 (0.0%) |
| Life, Physical & Social Science | 0 (0.0%) | 2 (100.0%) |
| Community & Social Service | 256 (35.8%) | 458 (64.1%) |
| Education, Arts & Media | 66 (41.5%) | 93 (58.5%) |
| Legal Services & Support | 98 (69.5%) | 43 (30.5%) |
| Education Instruction & Library | 85 (21.2%) | 316 (78.8%) |
| Arts, Media & Entertainment | 7 (53.8%) | 6 (46.2%) |
| Health Diagnosing & Treating | 147 (23.2%) | 487 (76.8%) |
| Health Technologists | 136 (28.4%) | 342 (71.6%) |
| Total (Category) | 957 (45.1%) | 1,165 (54.9%) |
| Total (Overall) | 4,151 (58.1%) | 2,993 (41.9%) |
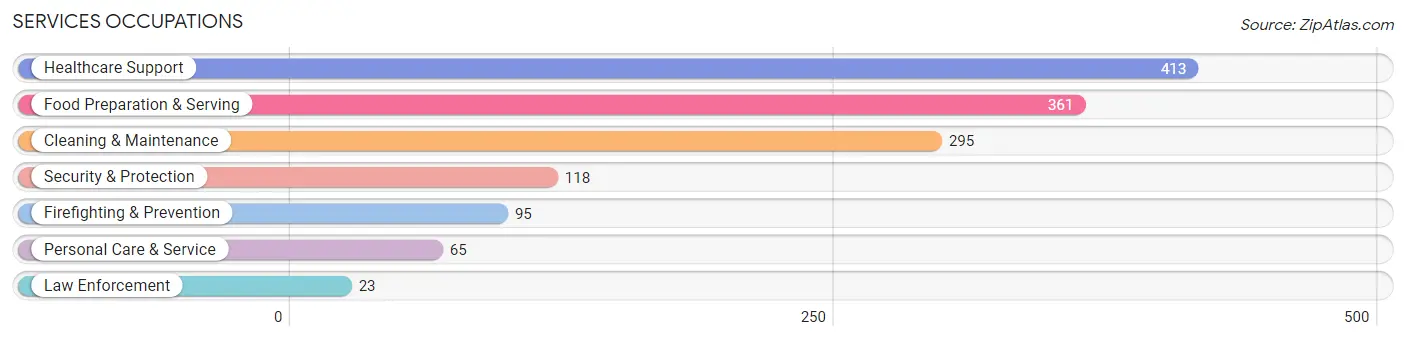
Services Occupations
The most common Services occupations in Randolph County are Healthcare Support (413 | 5.8%), Food Preparation & Serving (361 | 5.1%), Cleaning & Maintenance (295 | 4.1%), Security & Protection (118 | 1.7%), and Firefighting & Prevention (95 | 1.3%).
Services Occupations by Sex
Within the Services occupations in Randolph County, the most male-oriented occupations are Law Enforcement (100.0%), Food Preparation & Serving (63.7%), and Cleaning & Maintenance (35.9%), while the most female-oriented occupations are Personal Care & Service (93.9%), Firefighting & Prevention (86.3%), and Healthcare Support (80.6%).
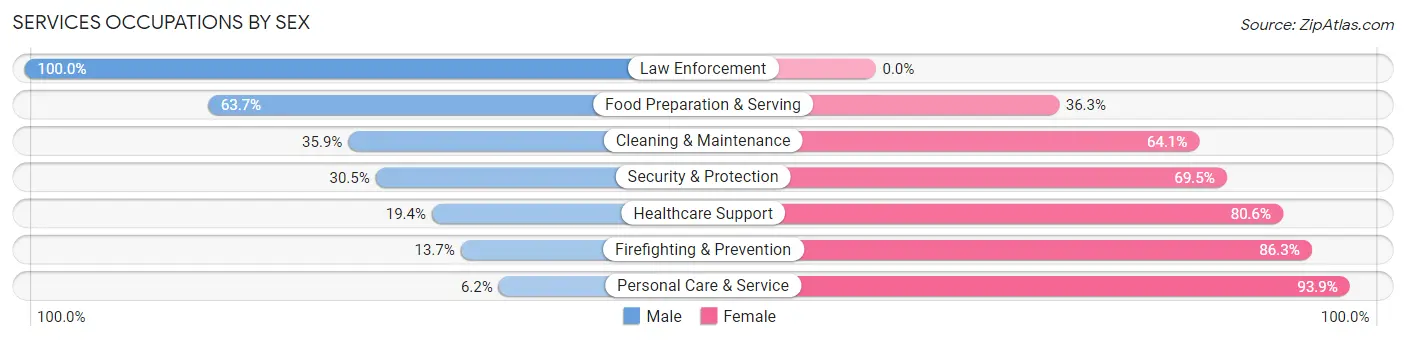
| Occupation | Male | Female |
| Healthcare Support | 80 (19.4%) | 333 (80.6%) |
| Security & Protection | 36 (30.5%) | 82 (69.5%) |
| Firefighting & Prevention | 13 (13.7%) | 82 (86.3%) |
| Law Enforcement | 23 (100.0%) | 0 (0.0%) |
| Food Preparation & Serving | 230 (63.7%) | 131 (36.3%) |
| Cleaning & Maintenance | 106 (35.9%) | 189 (64.1%) |
| Personal Care & Service | 4 (6.1%) | 61 (93.9%) |
| Total (Category) | 456 (36.4%) | 796 (63.6%) |
| Total (Overall) | 4,151 (58.1%) | 2,993 (41.9%) |
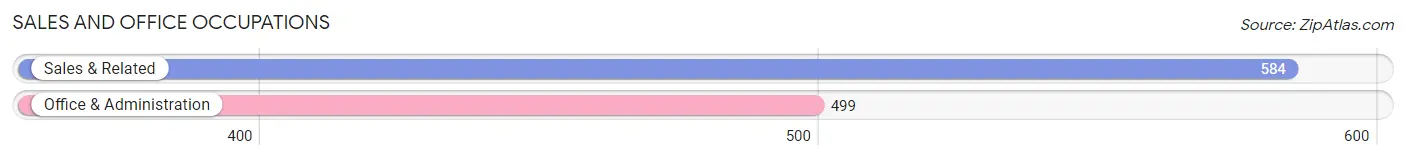
Sales and Office Occupations
The most common Sales and Office occupations in Randolph County are Sales & Related (584 | 8.2%), and Office & Administration (499 | 7.0%).
Sales and Office Occupations by Sex
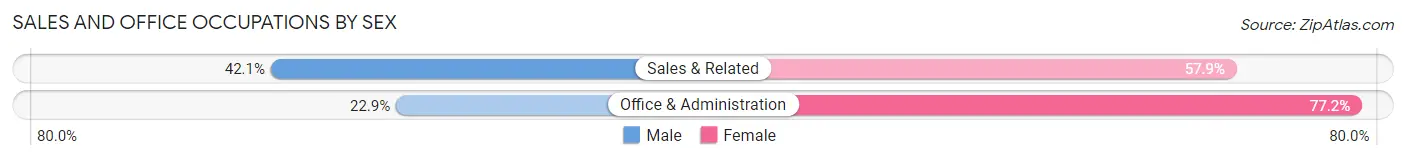
| Occupation | Male | Female |
| Sales & Related | 246 (42.1%) | 338 (57.9%) |
| Office & Administration | 114 (22.9%) | 385 (77.1%) |
| Total (Category) | 360 (33.2%) | 723 (66.8%) |
| Total (Overall) | 4,151 (58.1%) | 2,993 (41.9%) |
Natural Resources, Construction and Maintenance Occupations
The most common Natural Resources, Construction and Maintenance occupations in Randolph County are Construction & Extraction (559 | 7.8%), Installation, Maintenance & Repair (313 | 4.4%), and Farming, Fishing & Forestry (158 | 2.2%).
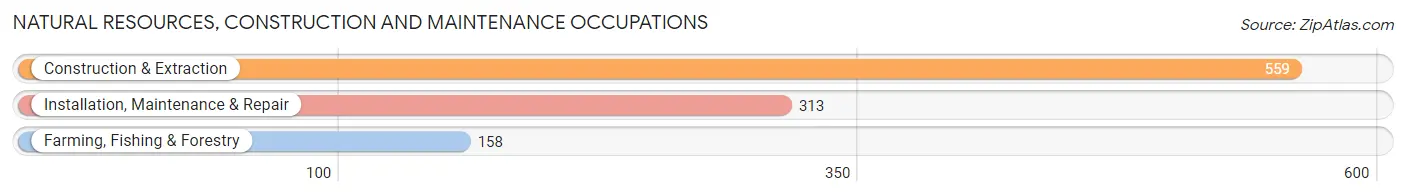
Natural Resources, Construction and Maintenance Occupations by Sex
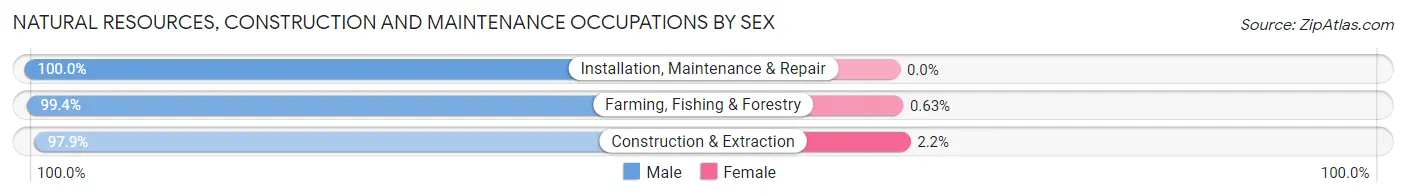
| Occupation | Male | Female |
| Farming, Fishing & Forestry | 157 (99.4%) | 1 (0.6%) |
| Construction & Extraction | 547 (97.9%) | 12 (2.1%) |
| Installation, Maintenance & Repair | 313 (100.0%) | 0 (0.0%) |
| Total (Category) | 1,017 (98.7%) | 13 (1.3%) |
| Total (Overall) | 4,151 (58.1%) | 2,993 (41.9%) |
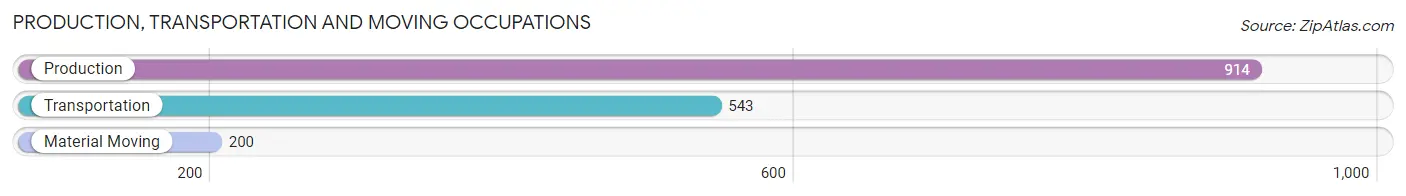
Production, Transportation and Moving Occupations
The most common Production, Transportation and Moving occupations in Randolph County are Production (914 | 12.8%), Transportation (543 | 7.6%), and Material Moving (200 | 2.8%).
Production, Transportation and Moving Occupations by Sex
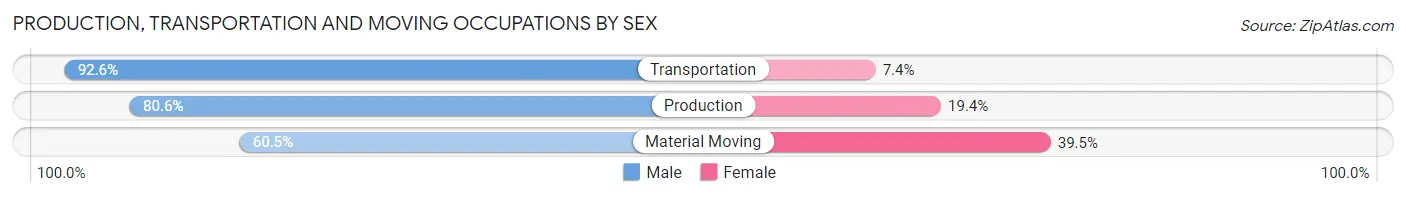
| Occupation | Male | Female |
| Production | 737 (80.6%) | 177 (19.4%) |
| Transportation | 503 (92.6%) | 40 (7.4%) |
| Material Moving | 121 (60.5%) | 79 (39.5%) |
| Total (Category) | 1,361 (82.1%) | 296 (17.9%) |
| Total (Overall) | 4,151 (58.1%) | 2,993 (41.9%) |
Employment Industries by Sex in Randolph County
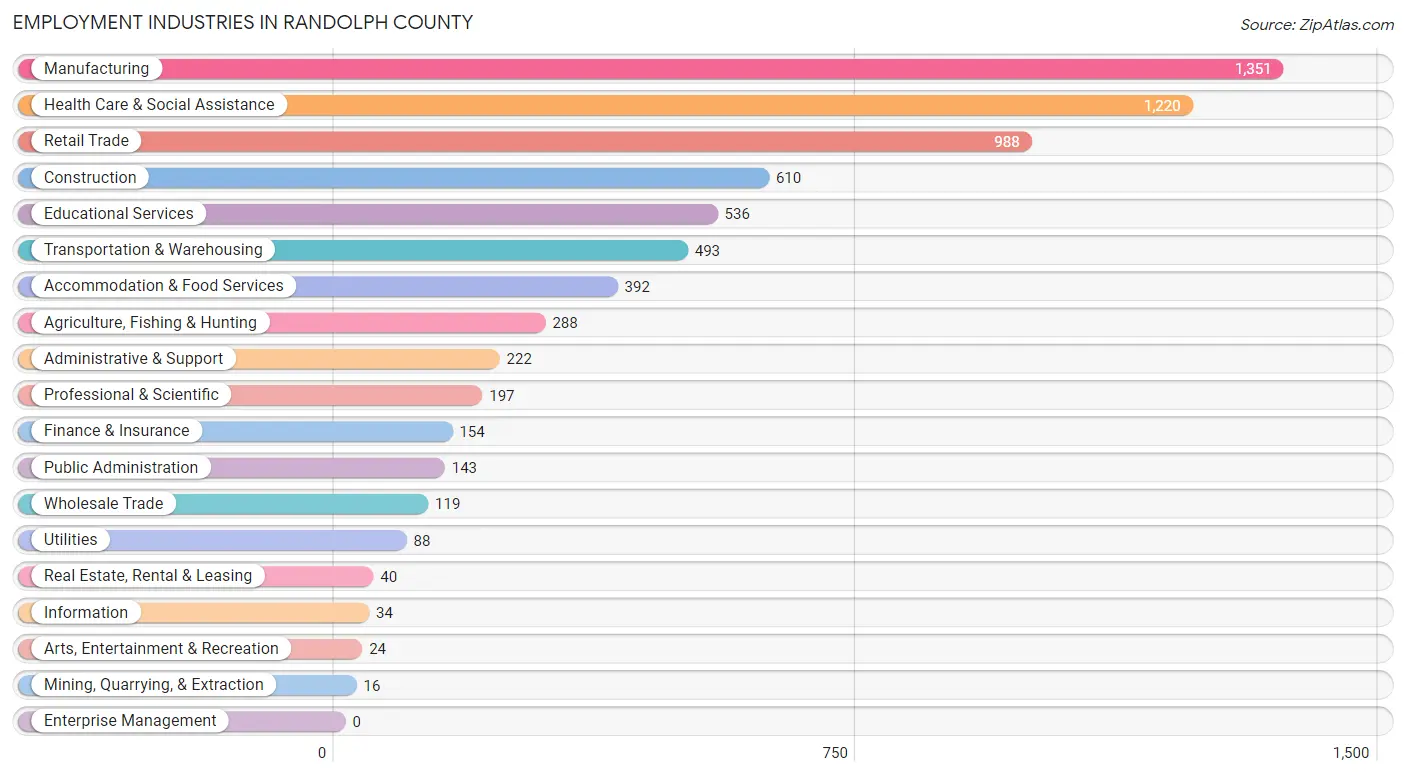
Employment Industries in Randolph County
The major employment industries in Randolph County include Manufacturing (1,351 | 18.9%), Health Care & Social Assistance (1,220 | 17.1%), Retail Trade (988 | 13.8%), Construction (610 | 8.5%), and Educational Services (536 | 7.5%).
Employment Industries by Sex in Randolph County
The Randolph County industries that see more men than women are Mining, Quarrying, & Extraction (100.0%), Agriculture, Fishing & Hunting (99.7%), and Construction (97.1%), whereas the industries that tend to have a higher number of women are Educational Services (77.6%), Health Care & Social Assistance (76.5%), and Real Estate, Rental & Leasing (72.5%).
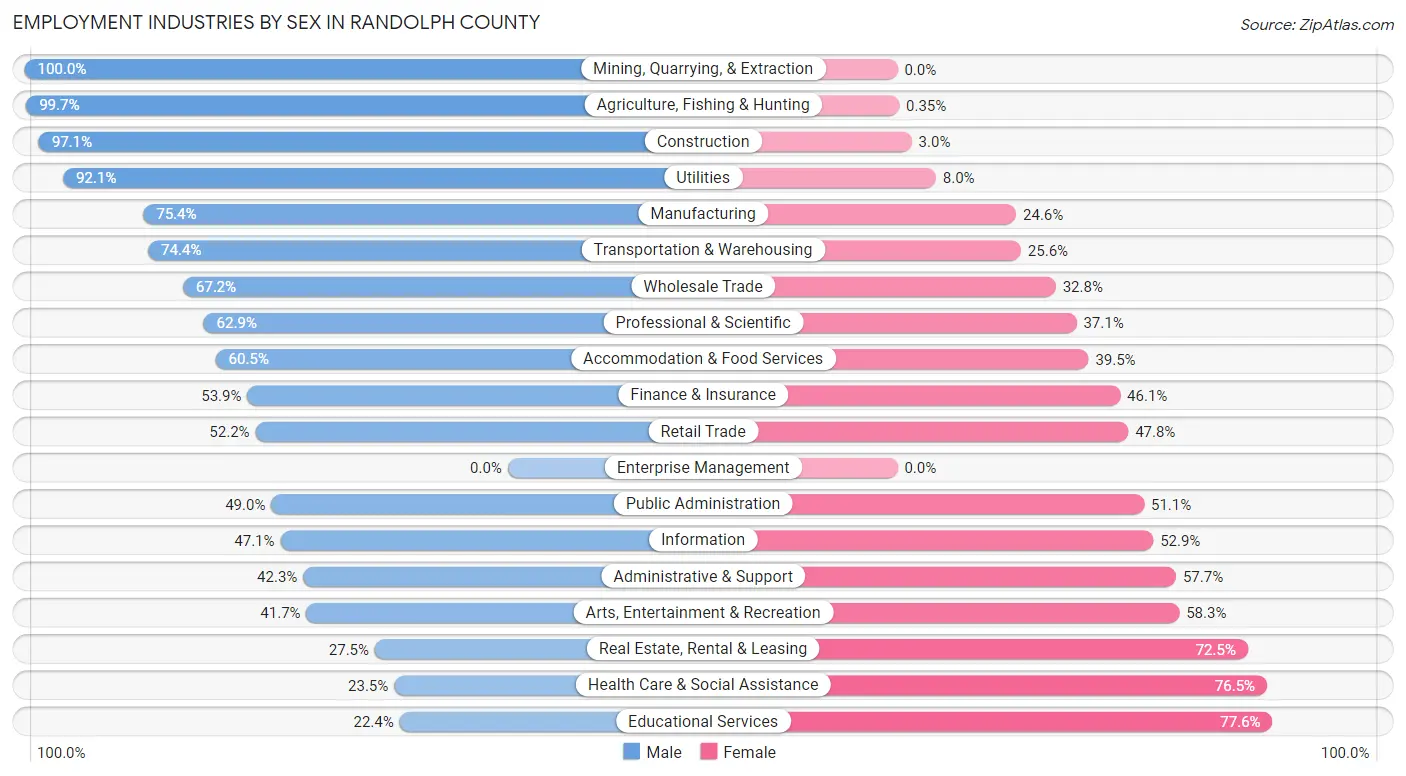
| Industry | Male | Female |
| Agriculture, Fishing & Hunting | 287 (99.7%) | 1 (0.4%) |
| Mining, Quarrying, & Extraction | 16 (100.0%) | 0 (0.0%) |
| Construction | 592 (97.1%) | 18 (2.9%) |
| Manufacturing | 1,019 (75.4%) | 332 (24.6%) |
| Wholesale Trade | 80 (67.2%) | 39 (32.8%) |
| Retail Trade | 516 (52.2%) | 472 (47.8%) |
| Transportation & Warehousing | 367 (74.4%) | 126 (25.6%) |
| Utilities | 81 (92.0%) | 7 (8.0%) |
| Information | 16 (47.1%) | 18 (52.9%) |
| Finance & Insurance | 83 (53.9%) | 71 (46.1%) |
| Real Estate, Rental & Leasing | 11 (27.5%) | 29 (72.5%) |
| Professional & Scientific | 124 (62.9%) | 73 (37.1%) |
| Enterprise Management | 0 (0.0%) | 0 (0.0%) |
| Administrative & Support | 94 (42.3%) | 128 (57.7%) |
| Educational Services | 120 (22.4%) | 416 (77.6%) |
| Health Care & Social Assistance | 287 (23.5%) | 933 (76.5%) |
| Arts, Entertainment & Recreation | 10 (41.7%) | 14 (58.3%) |
| Accommodation & Food Services | 237 (60.5%) | 155 (39.5%) |
| Public Administration | 70 (48.9%) | 73 (51.0%) |
| Total | 4,151 (58.1%) | 2,993 (41.9%) |
Education in Randolph County
School Enrollment in Randolph County
The most common levels of schooling among the 3,946 students in Randolph County are middle school (1,128 | 28.6%), elementary school (1,040 | 26.4%), and high school (900 | 22.8%).
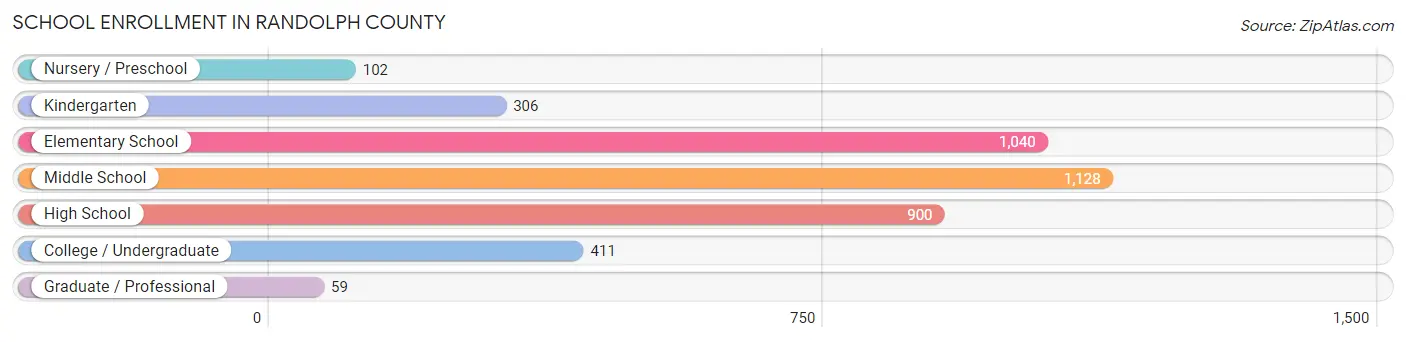
| School Level | # Students | % Students |
| Nursery / Preschool | 102 | 2.6% |
| Kindergarten | 306 | 7.7% |
| Elementary School | 1,040 | 26.4% |
| Middle School | 1,128 | 28.6% |
| High School | 900 | 22.8% |
| College / Undergraduate | 411 | 10.4% |
| Graduate / Professional | 59 | 1.5% |
| Total | 3,946 | 100.0% |
School Enrollment by Age by Funding Source in Randolph County
Out of a total of 3,946 students who are enrolled in schools in Randolph County, 414 (10.5%) attend a private institution, while the remaining 3,532 (89.5%) are enrolled in public schools. The age group of 20 to 24 year olds has the highest likelihood of being enrolled in private schools, with 40 (29.6% in the age bracket) enrolled. Conversely, the age group of 18 to 19 year olds has the lowest likelihood of being enrolled in a private school, with 326 (100.0% in the age bracket) attending a public institution.
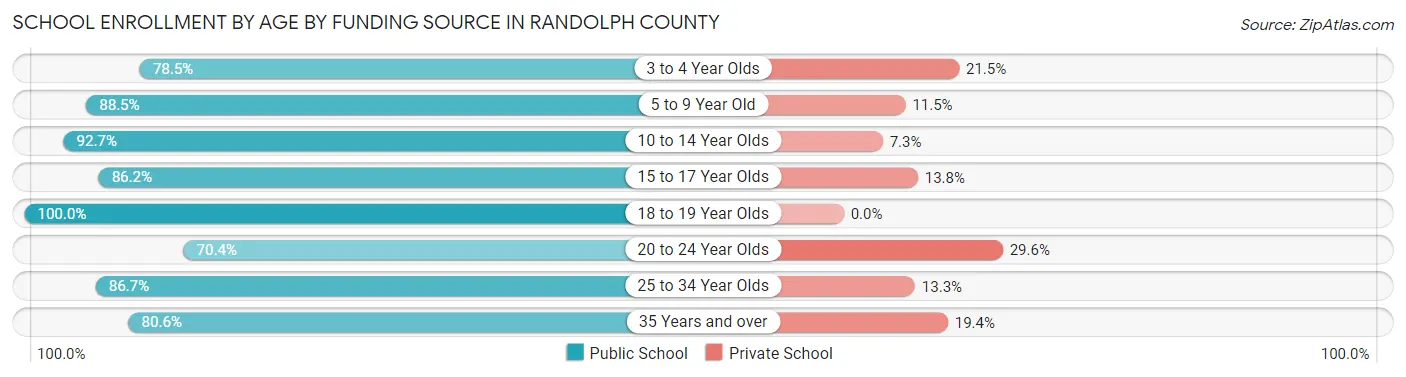
| Age Bracket | Public School | Private School |
| 3 to 4 Year Olds | 95 (78.5%) | 26 (21.5%) |
| 5 to 9 Year Old | 892 (88.5%) | 116 (11.5%) |
| 10 to 14 Year Olds | 1,365 (92.7%) | 107 (7.3%) |
| 15 to 17 Year Olds | 593 (86.2%) | 95 (13.8%) |
| 18 to 19 Year Olds | 326 (100.0%) | 0 (0.0%) |
| 20 to 24 Year Olds | 95 (70.4%) | 40 (29.6%) |
| 25 to 34 Year Olds | 85 (86.7%) | 13 (13.3%) |
| 35 Years and over | 79 (80.6%) | 19 (19.4%) |
| Total | 3,532 (89.5%) | 414 (10.5%) |
Educational Attainment by Field of Study in Randolph County
Business (401 | 19.5%), science & technology (367 | 17.8%), education (342 | 16.6%), bio, nature & agricultural (225 | 10.9%), and liberal arts & history (149 | 7.2%) are the most common fields of study among 2,061 individuals in Randolph County who have obtained a bachelor's degree or higher.
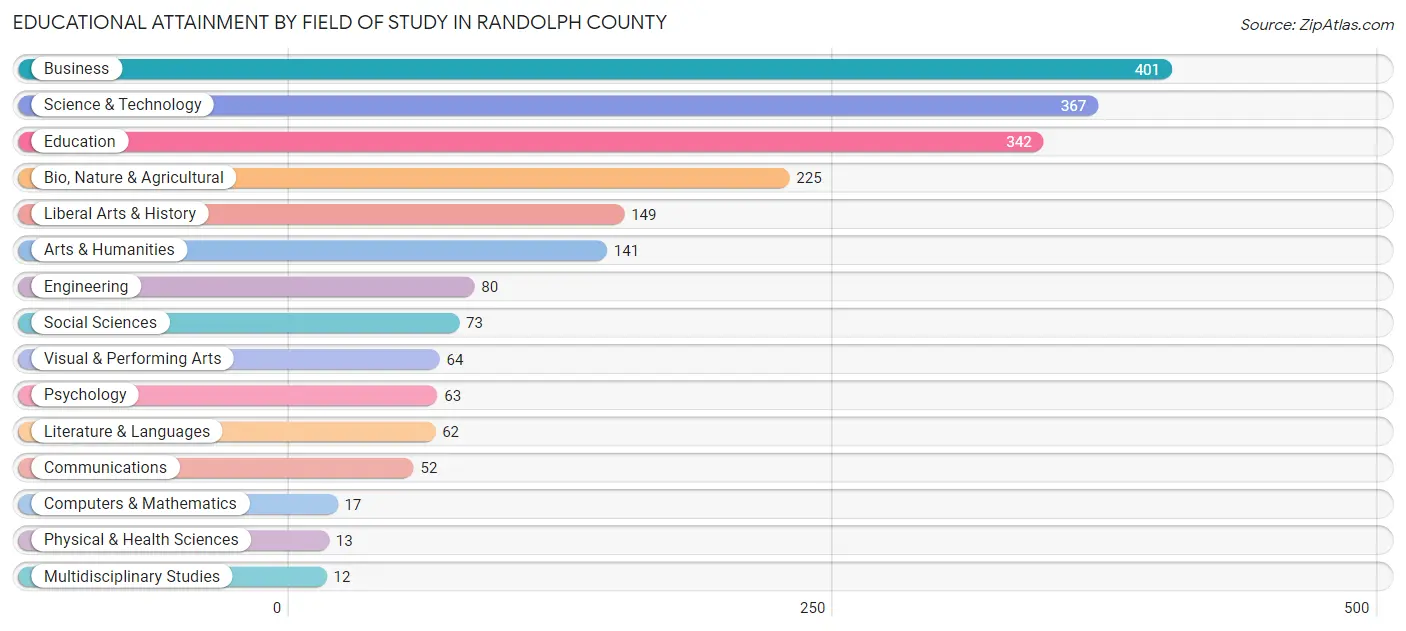
| Field of Study | # Graduates | % Graduates |
| Computers & Mathematics | 17 | 0.8% |
| Bio, Nature & Agricultural | 225 | 10.9% |
| Physical & Health Sciences | 13 | 0.6% |
| Psychology | 63 | 3.1% |
| Social Sciences | 73 | 3.5% |
| Engineering | 80 | 3.9% |
| Multidisciplinary Studies | 12 | 0.6% |
| Science & Technology | 367 | 17.8% |
| Business | 401 | 19.5% |
| Education | 342 | 16.6% |
| Literature & Languages | 62 | 3.0% |
| Liberal Arts & History | 149 | 7.2% |
| Visual & Performing Arts | 64 | 3.1% |
| Communications | 52 | 2.5% |
| Arts & Humanities | 141 | 6.8% |
| Total | 2,061 | 100.0% |
Transportation & Commute in Randolph County
Vehicle Availability by Sex in Randolph County
The most prevalent vehicle ownership categories in Randolph County are males with 2 vehicles (1,649, accounting for 40.1%) and females with 2 vehicles (806, making up 58.3%).
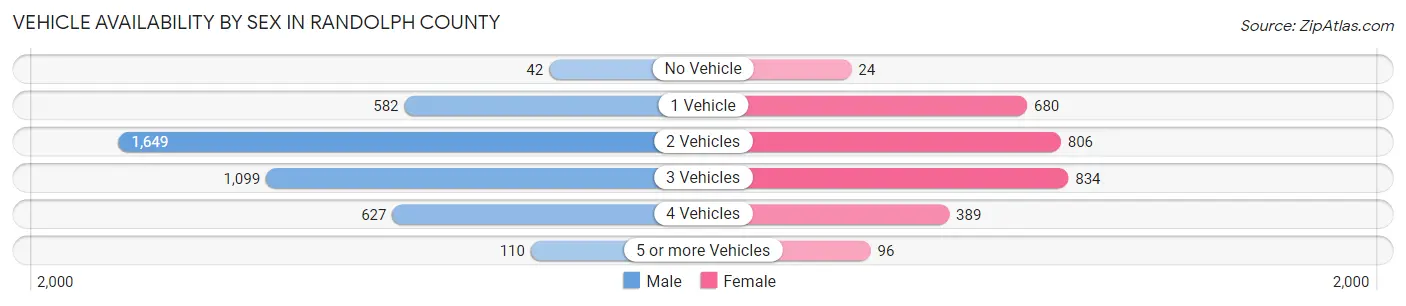
| Vehicles Available | Male | Female |
| No Vehicle | 42 (1.0%) | 24 (0.9%) |
| 1 Vehicle | 582 (14.2%) | 680 (24.0%) |
| 2 Vehicles | 1,649 (40.1%) | 806 (28.5%) |
| 3 Vehicles | 1,099 (26.8%) | 834 (29.5%) |
| 4 Vehicles | 627 (15.3%) | 389 (13.8%) |
| 5 or more Vehicles | 110 (2.7%) | 96 (3.4%) |
| Total | 4,109 (100.0%) | 2,829 (100.0%) |
Commute Time in Randolph County
The most frequently occuring commute durations in Randolph County are 10 to 14 minutes (1,091 commuters, 16.3%), 15 to 19 minutes (992 commuters, 14.8%), and 20 to 24 minutes (882 commuters, 13.2%).
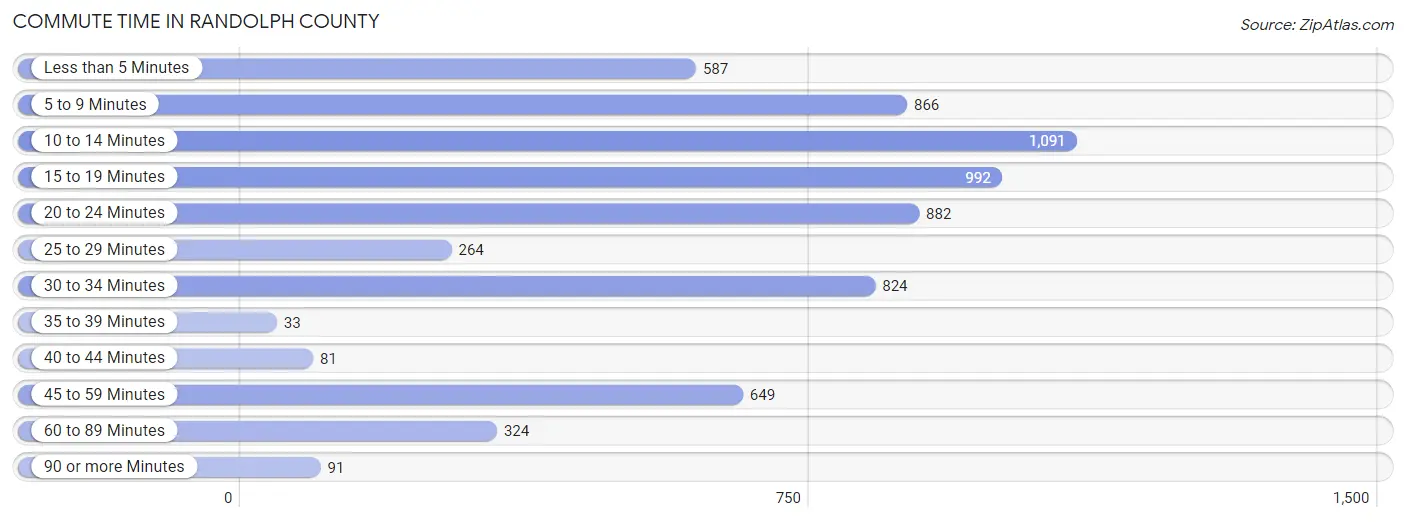
| Commute Time | # Commuters | % Commuters |
| Less than 5 Minutes | 587 | 8.8% |
| 5 to 9 Minutes | 866 | 13.0% |
| 10 to 14 Minutes | 1,091 | 16.3% |
| 15 to 19 Minutes | 992 | 14.8% |
| 20 to 24 Minutes | 882 | 13.2% |
| 25 to 29 Minutes | 264 | 4.0% |
| 30 to 34 Minutes | 824 | 12.3% |
| 35 to 39 Minutes | 33 | 0.5% |
| 40 to 44 Minutes | 81 | 1.2% |
| 45 to 59 Minutes | 649 | 9.7% |
| 60 to 89 Minutes | 324 | 4.9% |
| 90 or more Minutes | 91 | 1.4% |
Commute Time by Sex in Randolph County
The most common commute times in Randolph County are 10 to 14 minutes (762 commuters, 19.2%) for males and 20 to 24 minutes (506 commuters, 18.6%) for females.
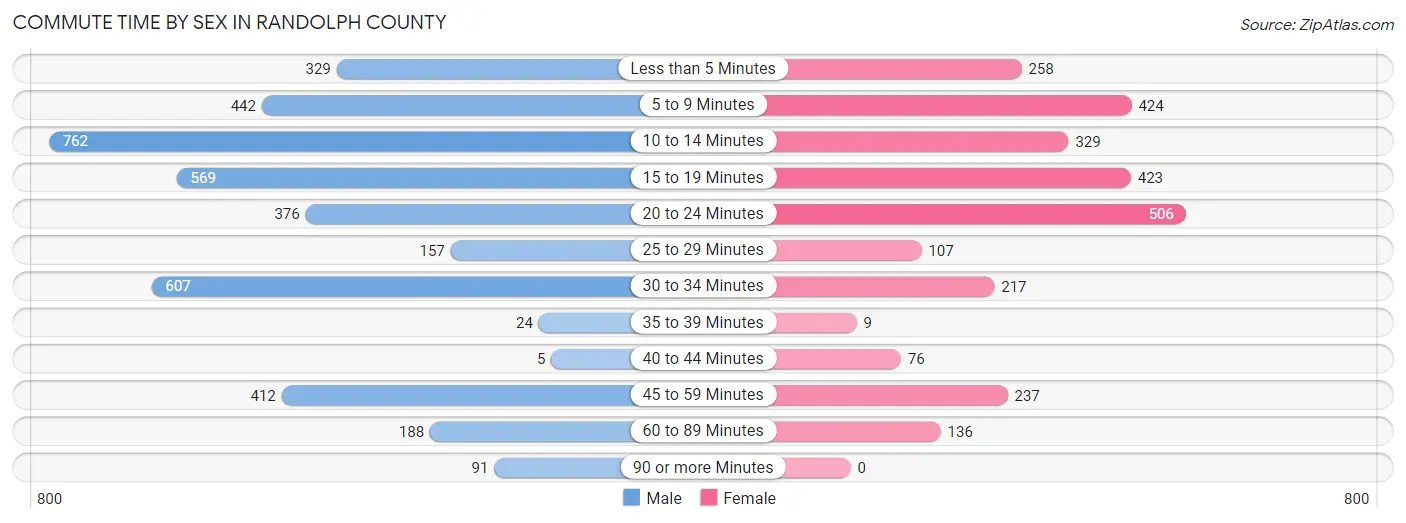
| Commute Time | Male | Female |
| Less than 5 Minutes | 329 (8.3%) | 258 (9.5%) |
| 5 to 9 Minutes | 442 (11.2%) | 424 (15.6%) |
| 10 to 14 Minutes | 762 (19.2%) | 329 (12.1%) |
| 15 to 19 Minutes | 569 (14.4%) | 423 (15.5%) |
| 20 to 24 Minutes | 376 (9.5%) | 506 (18.6%) |
| 25 to 29 Minutes | 157 (4.0%) | 107 (3.9%) |
| 30 to 34 Minutes | 607 (15.3%) | 217 (8.0%) |
| 35 to 39 Minutes | 24 (0.6%) | 9 (0.3%) |
| 40 to 44 Minutes | 5 (0.1%) | 76 (2.8%) |
| 45 to 59 Minutes | 412 (10.4%) | 237 (8.7%) |
| 60 to 89 Minutes | 188 (4.8%) | 136 (5.0%) |
| 90 or more Minutes | 91 (2.3%) | 0 (0.0%) |
Time of Departure to Work by Sex in Randolph County
The most frequent times of departure to work in Randolph County are 7:00 AM to 7:29 AM (498, 12.6%) for males and 7:30 AM to 7:59 AM (627, 23.0%) for females.
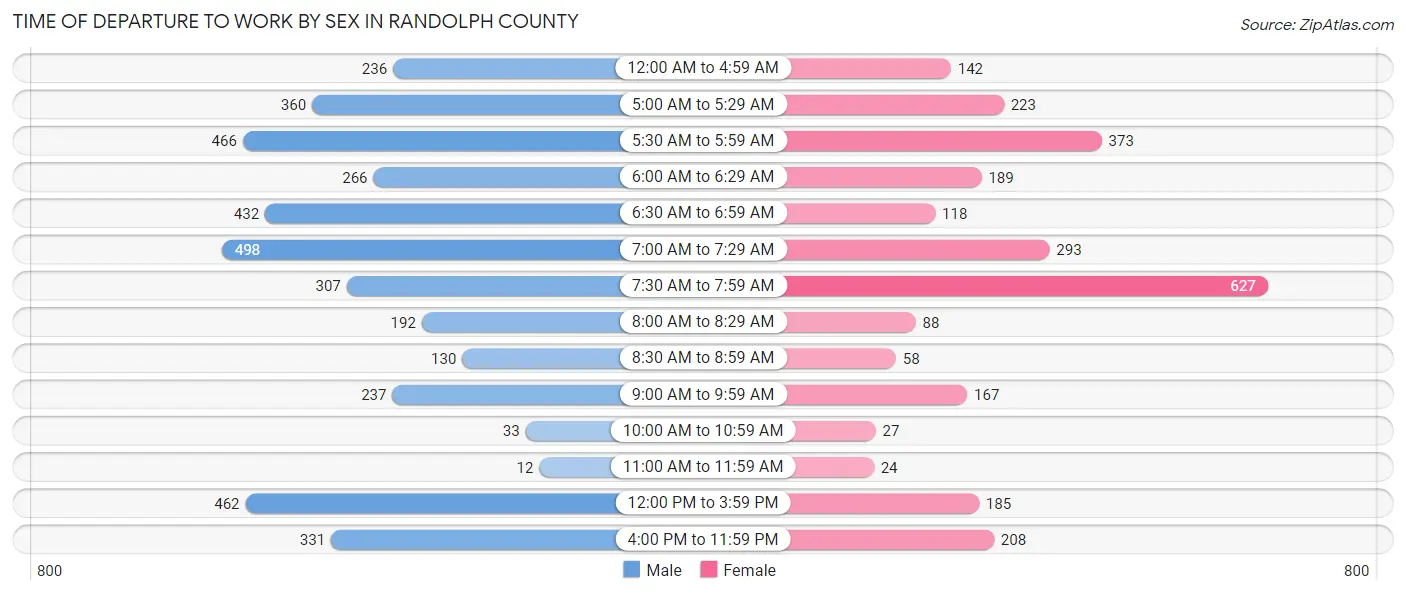
| Time of Departure | Male | Female |
| 12:00 AM to 4:59 AM | 236 (6.0%) | 142 (5.2%) |
| 5:00 AM to 5:29 AM | 360 (9.1%) | 223 (8.2%) |
| 5:30 AM to 5:59 AM | 466 (11.8%) | 373 (13.7%) |
| 6:00 AM to 6:29 AM | 266 (6.7%) | 189 (6.9%) |
| 6:30 AM to 6:59 AM | 432 (10.9%) | 118 (4.3%) |
| 7:00 AM to 7:29 AM | 498 (12.6%) | 293 (10.8%) |
| 7:30 AM to 7:59 AM | 307 (7.7%) | 627 (23.0%) |
| 8:00 AM to 8:29 AM | 192 (4.9%) | 88 (3.2%) |
| 8:30 AM to 8:59 AM | 130 (3.3%) | 58 (2.1%) |
| 9:00 AM to 9:59 AM | 237 (6.0%) | 167 (6.1%) |
| 10:00 AM to 10:59 AM | 33 (0.8%) | 27 (1.0%) |
| 11:00 AM to 11:59 AM | 12 (0.3%) | 24 (0.9%) |
| 12:00 PM to 3:59 PM | 462 (11.7%) | 185 (6.8%) |
| 4:00 PM to 11:59 PM | 331 (8.4%) | 208 (7.6%) |
| Total | 3,962 (100.0%) | 2,722 (100.0%) |
Housing Occupancy in Randolph County
Occupancy by Ownership in Randolph County
Of the total 7,190 dwellings in Randolph County, owner-occupied units account for 5,281 (73.5%), while renter-occupied units make up 1,909 (26.6%).
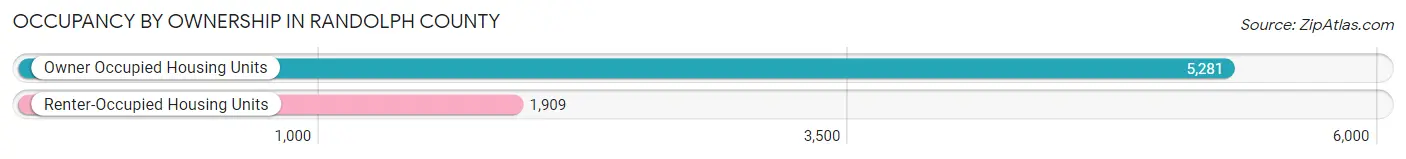
| Occupancy | # Housing Units | % Housing Units |
| Owner Occupied Housing Units | 5,281 | 73.5% |
| Renter-Occupied Housing Units | 1,909 | 26.6% |
| Total Occupied Housing Units | 7,190 | 100.0% |
Occupancy by Household Size in Randolph County
| Household Size | # Housing Units | % Housing Units |
| 1-Person Household | 2,331 | 32.4% |
| 2-Person Household | 2,095 | 29.1% |
| 3-Person Household | 883 | 12.3% |
| 4+ Person Household | 1,881 | 26.2% |
| Total Housing Units | 7,190 | 100.0% |
Occupancy by Ownership by Household Size in Randolph County
| Household Size | Owner-occupied | Renter-occupied |
| 1-Person Household | 1,572 (67.4%) | 759 (32.6%) |
| 2-Person Household | 1,818 (86.8%) | 277 (13.2%) |
| 3-Person Household | 681 (77.1%) | 202 (22.9%) |
| 4+ Person Household | 1,210 (64.3%) | 671 (35.7%) |
| Total Housing Units | 5,281 (73.5%) | 1,909 (26.6%) |
Occupancy by Educational Attainment in Randolph County
| Household Size | Owner-occupied | Renter-occupied |
| Less than High School | 686 (67.1%) | 336 (32.9%) |
| High School Diploma | 2,020 (72.4%) | 770 (27.6%) |
| College/Associate Degree | 1,597 (68.5%) | 733 (31.5%) |
| Bachelor's Degree or higher | 978 (93.3%) | 70 (6.7%) |
Occupancy by Age of Householder in Randolph County
| Age Bracket | # Households | % Households |
| Under 35 Years | 1,253 | 17.4% |
| 35 to 44 Years | 948 | 13.2% |
| 45 to 54 Years | 1,078 | 15.0% |
| 55 to 64 Years | 1,494 | 20.8% |
| 65 to 74 Years | 1,283 | 17.8% |
| 75 to 84 Years | 825 | 11.5% |
| 85 Years and Over | 309 | 4.3% |
| Total | 7,190 | 100.0% |
Housing Finances in Randolph County
Median Income by Occupancy in Randolph County
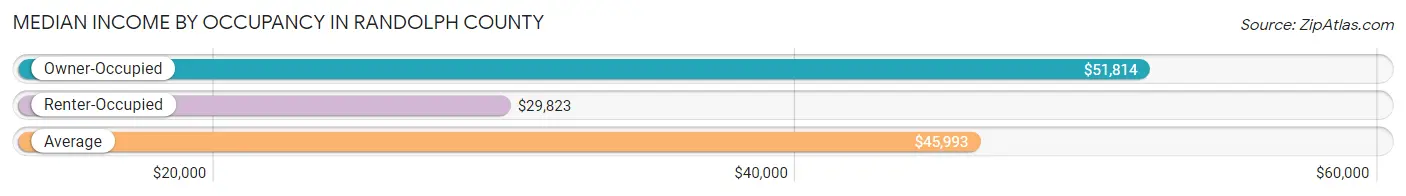
| Occupancy Type | # Households | Median Income |
| Owner-Occupied | 5,281 (73.5%) | $51,814 |
| Renter-Occupied | 1,909 (26.6%) | $29,823 |
| Average | 7,190 (100.0%) | $45,993 |
Occupancy by Householder Income Bracket in Randolph County
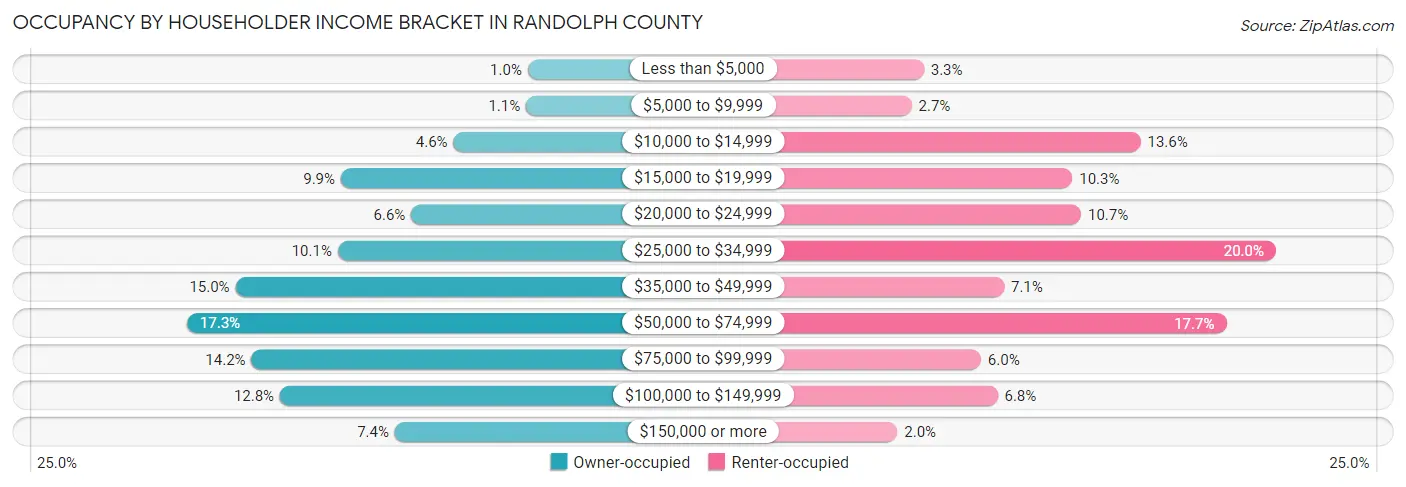
| Income Bracket | Owner-occupied | Renter-occupied |
| Less than $5,000 | 55 (1.0%) | 62 (3.3%) |
| $5,000 to $9,999 | 59 (1.1%) | 51 (2.7%) |
| $10,000 to $14,999 | 242 (4.6%) | 259 (13.6%) |
| $15,000 to $19,999 | 525 (9.9%) | 197 (10.3%) |
| $20,000 to $24,999 | 348 (6.6%) | 205 (10.7%) |
| $25,000 to $34,999 | 533 (10.1%) | 382 (20.0%) |
| $35,000 to $49,999 | 790 (15.0%) | 135 (7.1%) |
| $50,000 to $74,999 | 912 (17.3%) | 337 (17.6%) |
| $75,000 to $99,999 | 750 (14.2%) | 114 (6.0%) |
| $100,000 to $149,999 | 678 (12.8%) | 129 (6.8%) |
| $150,000 or more | 389 (7.4%) | 38 (2.0%) |
| Total | 5,281 (100.0%) | 1,909 (100.0%) |
Monthly Housing Cost Tiers in Randolph County
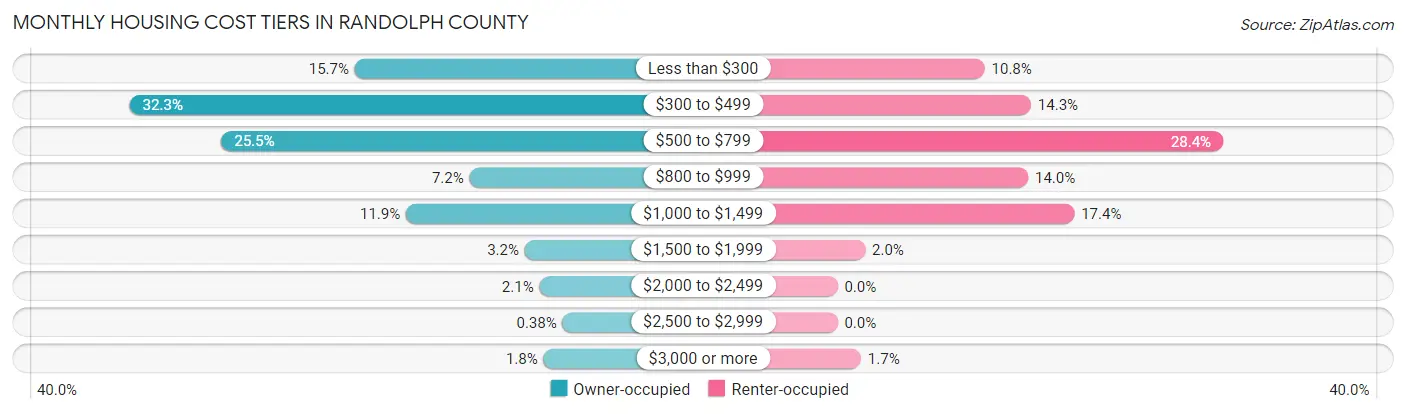
| Monthly Cost | Owner-occupied | Renter-occupied |
| Less than $300 | 828 (15.7%) | 207 (10.8%) |
| $300 to $499 | 1,704 (32.3%) | 272 (14.2%) |
| $500 to $799 | 1,347 (25.5%) | 542 (28.4%) |
| $800 to $999 | 382 (7.2%) | 268 (14.0%) |
| $1,000 to $1,499 | 629 (11.9%) | 333 (17.4%) |
| $1,500 to $1,999 | 167 (3.2%) | 39 (2.0%) |
| $2,000 to $2,499 | 110 (2.1%) | 0 (0.0%) |
| $2,500 to $2,999 | 20 (0.4%) | 0 (0.0%) |
| $3,000 or more | 94 (1.8%) | 33 (1.7%) |
| Total | 5,281 (100.0%) | 1,909 (100.0%) |
Physical Housing Characteristics in Randolph County
Housing Structures in Randolph County
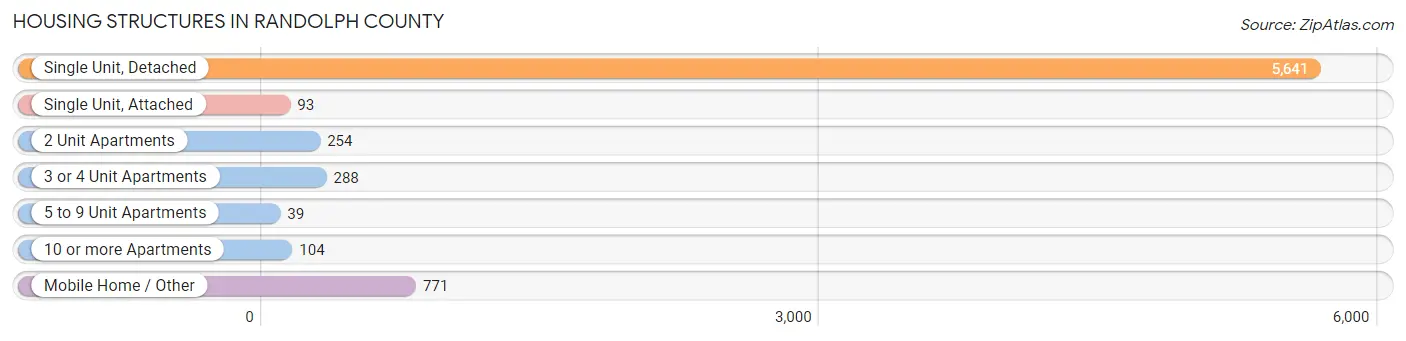
| Structure Type | # Housing Units | % Housing Units |
| Single Unit, Detached | 5,641 | 78.5% |
| Single Unit, Attached | 93 | 1.3% |
| 2 Unit Apartments | 254 | 3.5% |
| 3 or 4 Unit Apartments | 288 | 4.0% |
| 5 to 9 Unit Apartments | 39 | 0.5% |
| 10 or more Apartments | 104 | 1.5% |
| Mobile Home / Other | 771 | 10.7% |
| Total | 7,190 | 100.0% |
Housing Structures by Occupancy in Randolph County
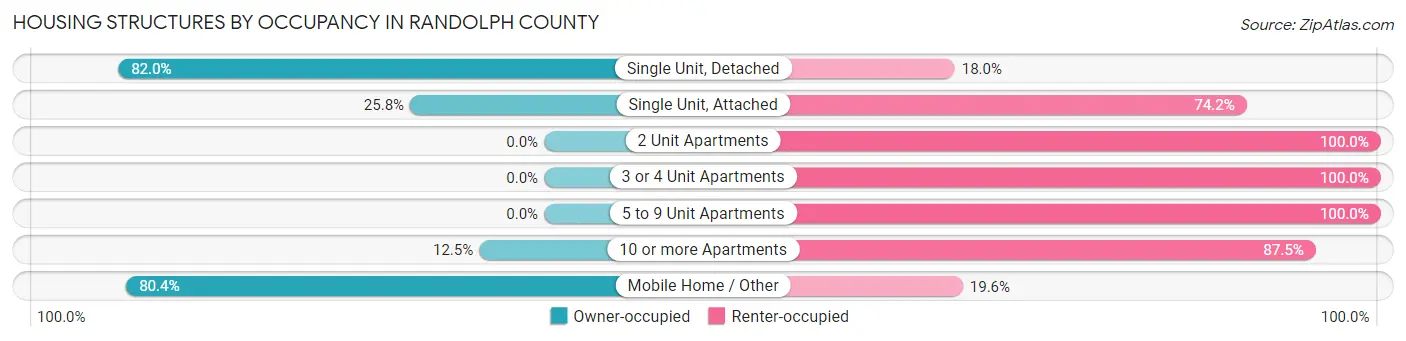
| Structure Type | Owner-occupied | Renter-occupied |
| Single Unit, Detached | 4,624 (82.0%) | 1,017 (18.0%) |
| Single Unit, Attached | 24 (25.8%) | 69 (74.2%) |
| 2 Unit Apartments | 0 (0.0%) | 254 (100.0%) |
| 3 or 4 Unit Apartments | 0 (0.0%) | 288 (100.0%) |
| 5 to 9 Unit Apartments | 0 (0.0%) | 39 (100.0%) |
| 10 or more Apartments | 13 (12.5%) | 91 (87.5%) |
| Mobile Home / Other | 620 (80.4%) | 151 (19.6%) |
| Total | 5,281 (73.5%) | 1,909 (26.6%) |
Housing Structures by Number of Rooms in Randolph County
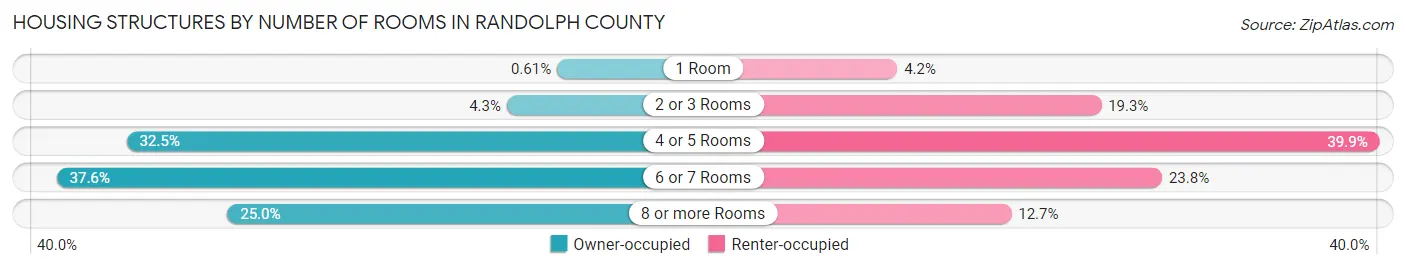
| Number of Rooms | Owner-occupied | Renter-occupied |
| 1 Room | 32 (0.6%) | 81 (4.2%) |
| 2 or 3 Rooms | 228 (4.3%) | 369 (19.3%) |
| 4 or 5 Rooms | 1,714 (32.5%) | 762 (39.9%) |
| 6 or 7 Rooms | 1,987 (37.6%) | 455 (23.8%) |
| 8 or more Rooms | 1,320 (25.0%) | 242 (12.7%) |
| Total | 5,281 (100.0%) | 1,909 (100.0%) |
Housing Structure by Heating Type in Randolph County
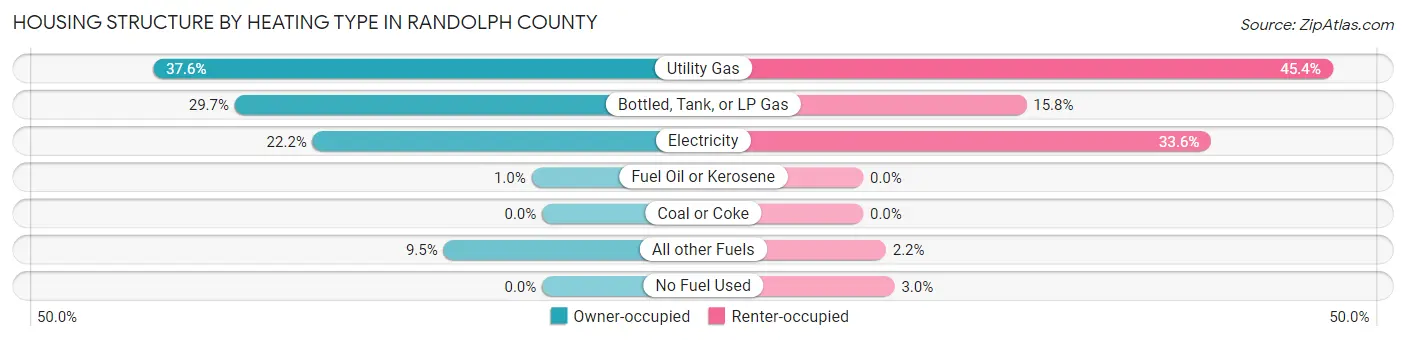
| Heating Type | Owner-occupied | Renter-occupied |
| Utility Gas | 1,985 (37.6%) | 866 (45.4%) |
| Bottled, Tank, or LP Gas | 1,568 (29.7%) | 301 (15.8%) |
| Electricity | 1,171 (22.2%) | 642 (33.6%) |
| Fuel Oil or Kerosene | 54 (1.0%) | 0 (0.0%) |
| Coal or Coke | 0 (0.0%) | 0 (0.0%) |
| All other Fuels | 503 (9.5%) | 42 (2.2%) |
| No Fuel Used | 0 (0.0%) | 58 (3.0%) |
| Total | 5,281 (100.0%) | 1,909 (100.0%) |
Household Vehicle Usage in Randolph County
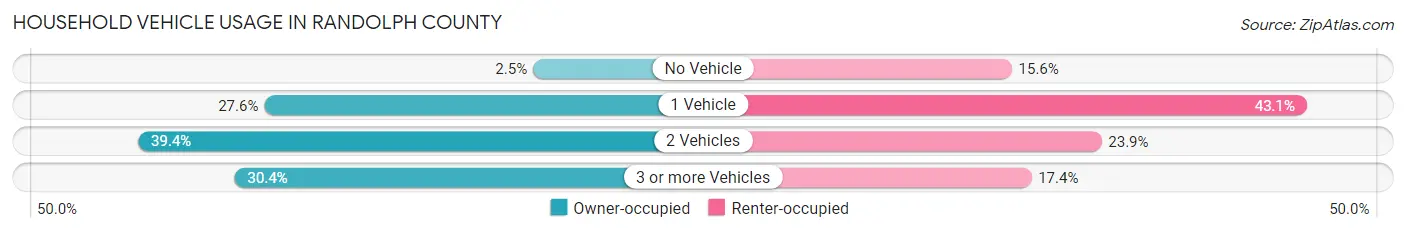
| Vehicles per Household | Owner-occupied | Renter-occupied |
| No Vehicle | 134 (2.5%) | 297 (15.6%) |
| 1 Vehicle | 1,459 (27.6%) | 823 (43.1%) |
| 2 Vehicles | 2,082 (39.4%) | 457 (23.9%) |
| 3 or more Vehicles | 1,606 (30.4%) | 332 (17.4%) |
| Total | 5,281 (100.0%) | 1,909 (100.0%) |
Real Estate & Mortgages in Randolph County
Real Estate and Mortgage Overview in Randolph County
| Characteristic | Without Mortgage | With Mortgage |
| Housing Units | 3,184 | 2,097 |
| Median Property Value | $102,700 | $131,900 |
| Median Household Income | $46,312 | $184 |
| Monthly Housing Costs | $387 | $94 |
| Real Estate Taxes | $458 | $135 |
Property Value by Mortgage Status in Randolph County
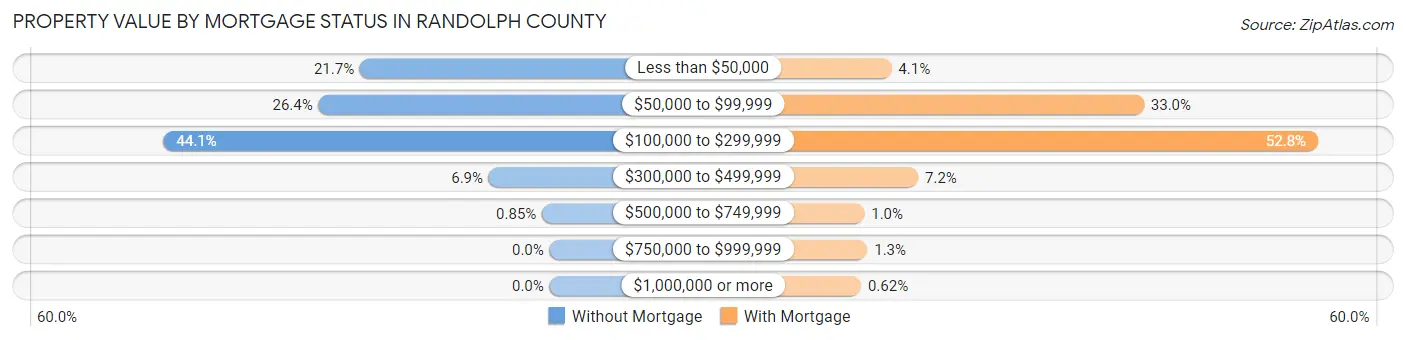
| Property Value | Without Mortgage | With Mortgage |
| Less than $50,000 | 690 (21.7%) | 86 (4.1%) |
| $50,000 to $99,999 | 841 (26.4%) | 691 (33.0%) |
| $100,000 to $299,999 | 1,405 (44.1%) | 1,108 (52.8%) |
| $300,000 to $499,999 | 221 (6.9%) | 150 (7.1%) |
| $500,000 to $749,999 | 27 (0.9%) | 21 (1.0%) |
| $750,000 to $999,999 | 0 (0.0%) | 28 (1.3%) |
| $1,000,000 or more | 0 (0.0%) | 13 (0.6%) |
| Total | 3,184 (100.0%) | 2,097 (100.0%) |
Household Income by Mortgage Status in Randolph County
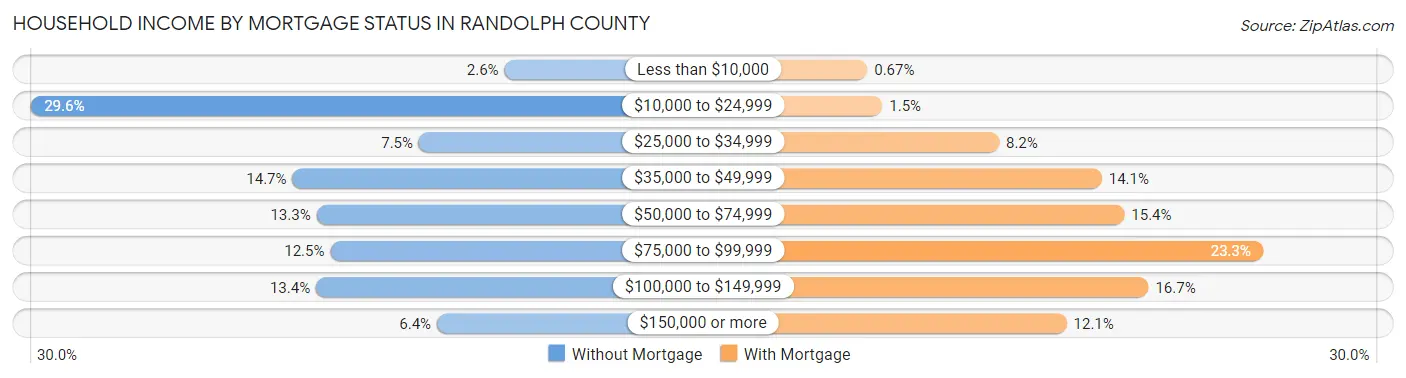
| Household Income | Without Mortgage | With Mortgage |
| Less than $10,000 | 82 (2.6%) | 14 (0.7%) |
| $10,000 to $24,999 | 943 (29.6%) | 32 (1.5%) |
| $25,000 to $34,999 | 238 (7.5%) | 172 (8.2%) |
| $35,000 to $49,999 | 468 (14.7%) | 295 (14.1%) |
| $50,000 to $74,999 | 424 (13.3%) | 322 (15.4%) |
| $75,000 to $99,999 | 399 (12.5%) | 488 (23.3%) |
| $100,000 to $149,999 | 425 (13.4%) | 351 (16.7%) |
| $150,000 or more | 205 (6.4%) | 253 (12.1%) |
| Total | 3,184 (100.0%) | 2,097 (100.0%) |
Property Value to Household Income Ratio in Randolph County
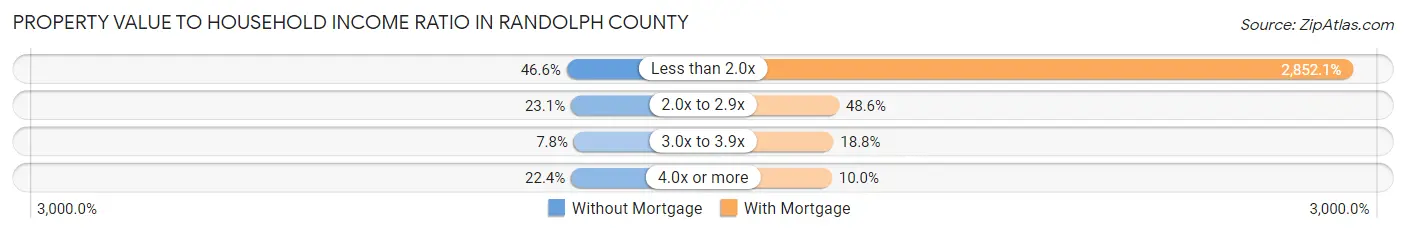
| Value-to-Income Ratio | Without Mortgage | With Mortgage |
| Less than 2.0x | 1,483 (46.6%) | 59,809 (2,852.1%) |
| 2.0x to 2.9x | 736 (23.1%) | 1,019 (48.6%) |
| 3.0x to 3.9x | 248 (7.8%) | 394 (18.8%) |
| 4.0x or more | 714 (22.4%) | 210 (10.0%) |
| Total | 3,184 (100.0%) | 2,097 (100.0%) |
Real Estate Taxes by Mortgage Status in Randolph County
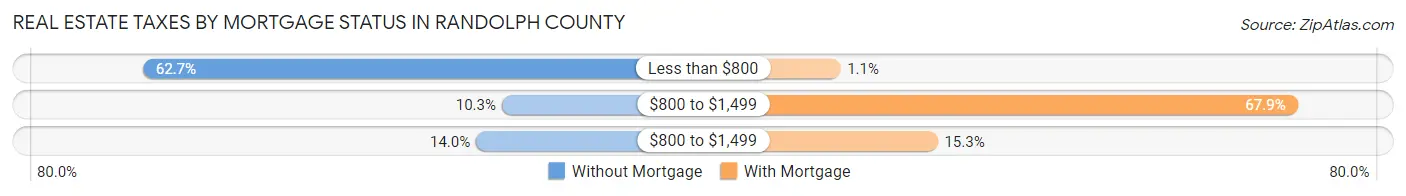
| Property Taxes | Without Mortgage | With Mortgage |
| Less than $800 | 1,997 (62.7%) | 22 (1.1%) |
| $800 to $1,499 | 327 (10.3%) | 1,423 (67.9%) |
| $800 to $1,499 | 447 (14.0%) | 320 (15.3%) |
| Total | 3,184 (100.0%) | 2,097 (100.0%) |
Health & Disability in Randolph County
Health Insurance Coverage by Age in Randolph County
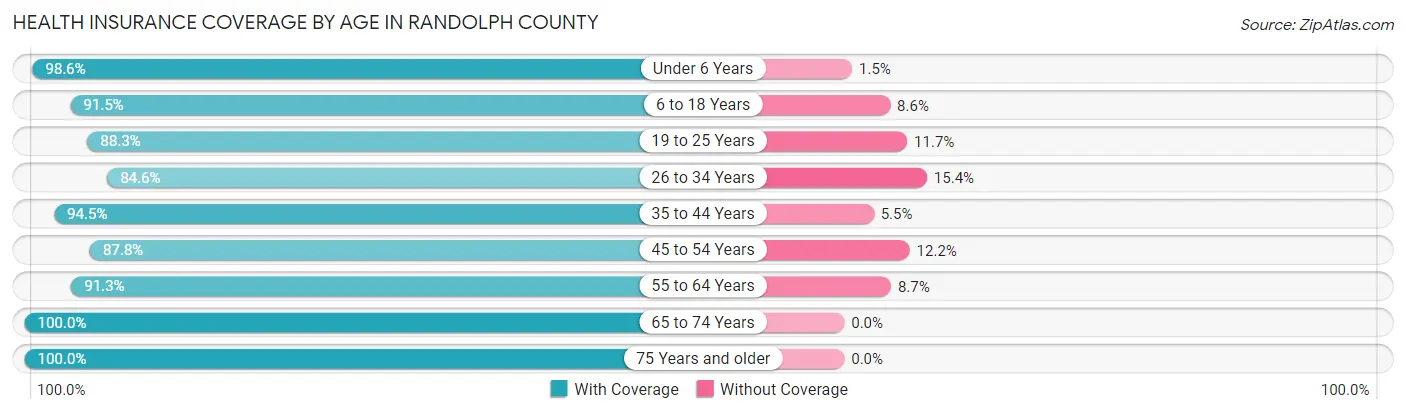
| Age Bracket | With Coverage | Without Coverage |
| Under 6 Years | 1,287 (98.6%) | 19 (1.5%) |
| 6 to 18 Years | 3,068 (91.4%) | 287 (8.6%) |
| 19 to 25 Years | 1,228 (88.3%) | 163 (11.7%) |
| 26 to 34 Years | 1,663 (84.6%) | 303 (15.4%) |
| 35 to 44 Years | 2,050 (94.5%) | 119 (5.5%) |
| 45 to 54 Years | 1,924 (87.8%) | 267 (12.2%) |
| 55 to 64 Years | 2,244 (91.3%) | 214 (8.7%) |
| 65 to 74 Years | 1,947 (100.0%) | 0 (0.0%) |
| 75 Years and older | 1,562 (100.0%) | 0 (0.0%) |
| Total | 16,973 (92.5%) | 1,372 (7.5%) |
Health Insurance Coverage by Citizenship Status in Randolph County
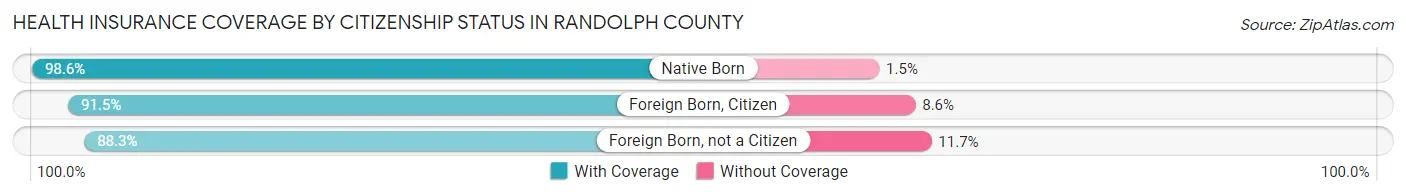
| Citizenship Status | With Coverage | Without Coverage |
| Native Born | 1,287 (98.6%) | 19 (1.5%) |
| Foreign Born, Citizen | 3,068 (91.4%) | 287 (8.6%) |
| Foreign Born, not a Citizen | 1,228 (88.3%) | 163 (11.7%) |
Health Insurance Coverage by Household Income in Randolph County
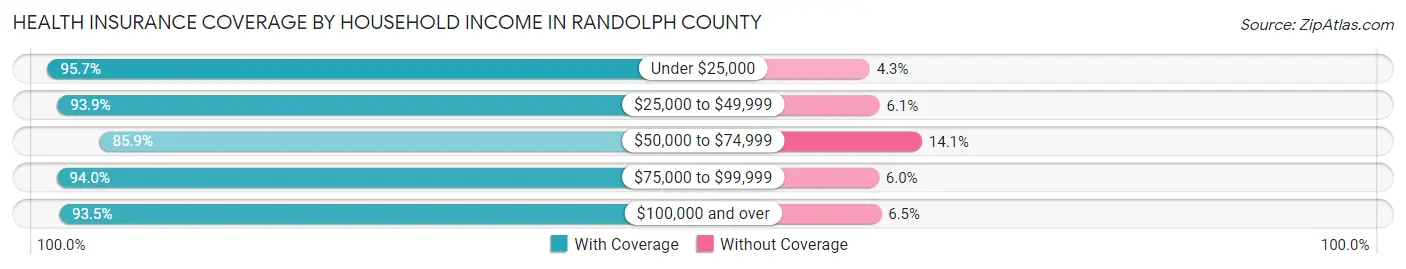
| Household Income | With Coverage | Without Coverage |
| Under $25,000 | 2,908 (95.7%) | 131 (4.3%) |
| $25,000 to $49,999 | 4,657 (93.9%) | 304 (6.1%) |
| $50,000 to $74,999 | 3,202 (85.9%) | 524 (14.1%) |
| $75,000 to $99,999 | 2,410 (94.0%) | 154 (6.0%) |
| $100,000 and over | 3,753 (93.5%) | 259 (6.5%) |
Public vs Private Health Insurance Coverage by Age in Randolph County
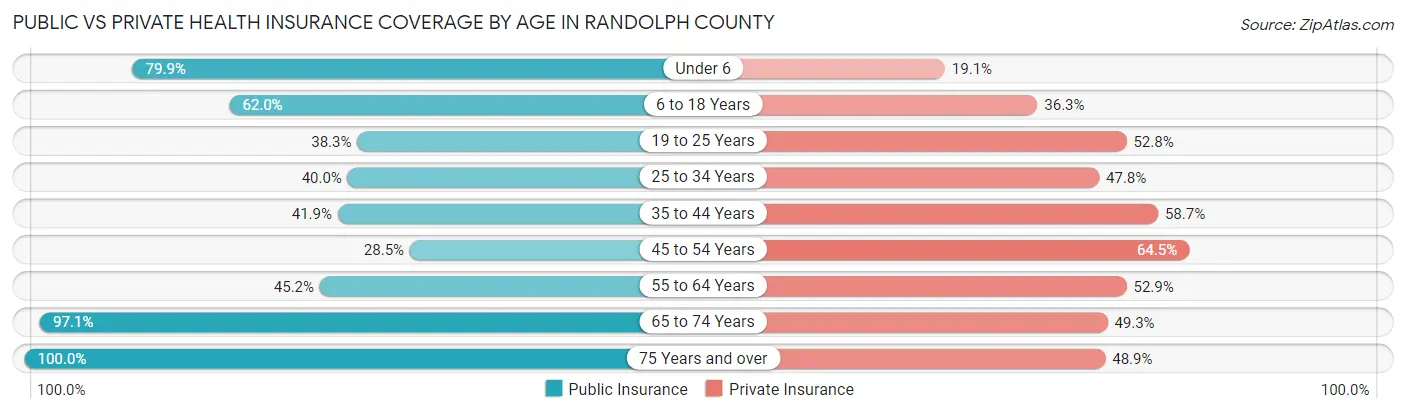
| Age Bracket | Public Insurance | Private Insurance |
| Under 6 | 1,044 (79.9%) | 250 (19.1%) |
| 6 to 18 Years | 2,079 (62.0%) | 1,218 (36.3%) |
| 19 to 25 Years | 532 (38.3%) | 735 (52.8%) |
| 25 to 34 Years | 787 (40.0%) | 939 (47.8%) |
| 35 to 44 Years | 908 (41.9%) | 1,273 (58.7%) |
| 45 to 54 Years | 624 (28.5%) | 1,412 (64.4%) |
| 55 to 64 Years | 1,111 (45.2%) | 1,299 (52.8%) |
| 65 to 74 Years | 1,891 (97.1%) | 960 (49.3%) |
| 75 Years and over | 1,562 (100.0%) | 764 (48.9%) |
| Total | 10,538 (57.4%) | 8,850 (48.2%) |
Disability Status by Sex by Age in Randolph County
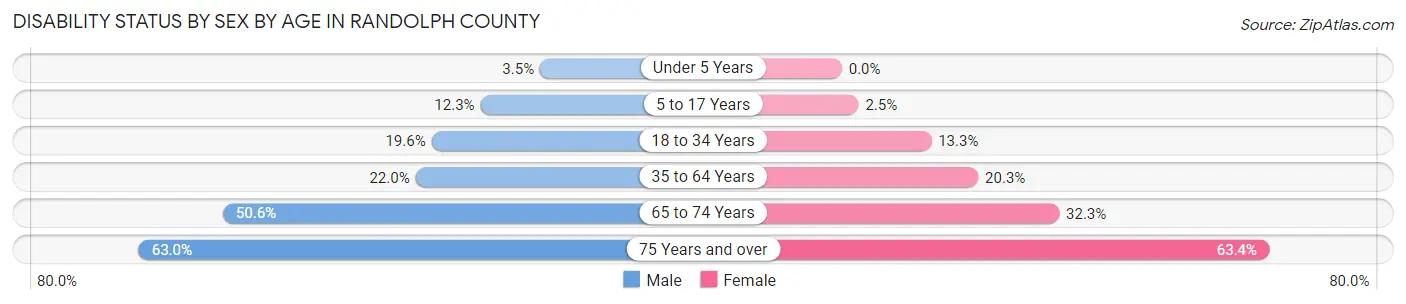
| Age Bracket | Male | Female |
| Under 5 Years | 20 (3.5%) | 0 (0.0%) |
| 5 to 17 Years | 221 (12.3%) | 37 (2.5%) |
| 18 to 34 Years | 371 (19.6%) | 226 (13.3%) |
| 35 to 64 Years | 750 (22.0%) | 689 (20.3%) |
| 65 to 74 Years | 461 (50.5%) | 334 (32.3%) |
| 75 Years and over | 411 (63.0%) | 577 (63.4%) |
Disability Class by Sex by Age in Randolph County
Disability Class: Hearing Difficulty
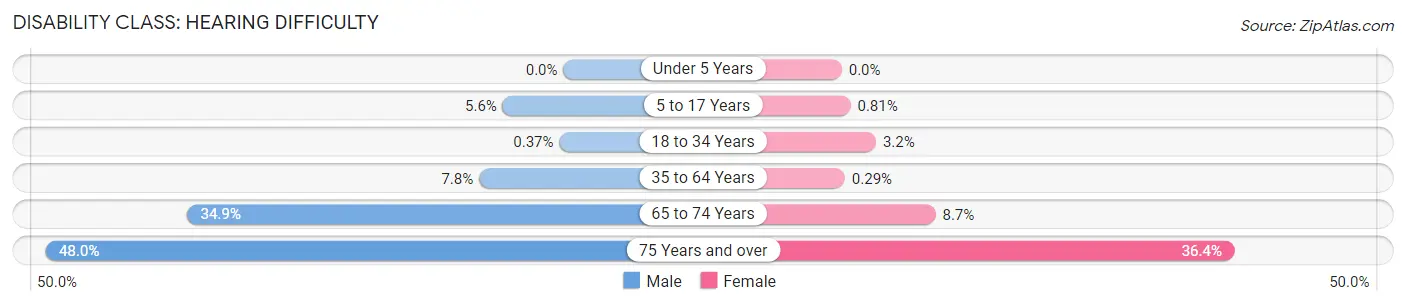
| Age Bracket | Male | Female |
| Under 5 Years | 0 (0.0%) | 0 (0.0%) |
| 5 to 17 Years | 101 (5.6%) | 12 (0.8%) |
| 18 to 34 Years | 7 (0.4%) | 54 (3.2%) |
| 35 to 64 Years | 267 (7.8%) | 10 (0.3%) |
| 65 to 74 Years | 318 (34.9%) | 90 (8.7%) |
| 75 Years and over | 313 (48.0%) | 331 (36.4%) |
Disability Class: Vision Difficulty
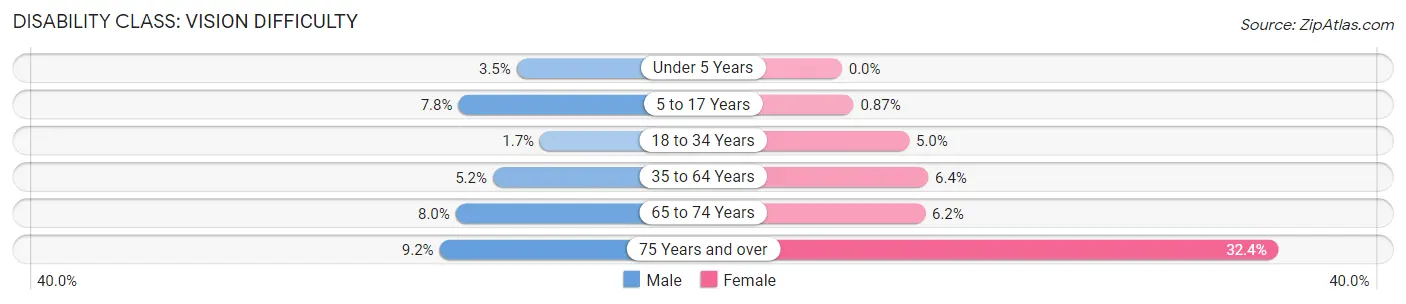
| Age Bracket | Male | Female |
| Under 5 Years | 20 (3.5%) | 0 (0.0%) |
| 5 to 17 Years | 140 (7.8%) | 13 (0.9%) |
| 18 to 34 Years | 33 (1.7%) | 85 (5.0%) |
| 35 to 64 Years | 179 (5.2%) | 218 (6.4%) |
| 65 to 74 Years | 73 (8.0%) | 64 (6.2%) |
| 75 Years and over | 60 (9.2%) | 295 (32.4%) |
Disability Class: Cognitive Difficulty
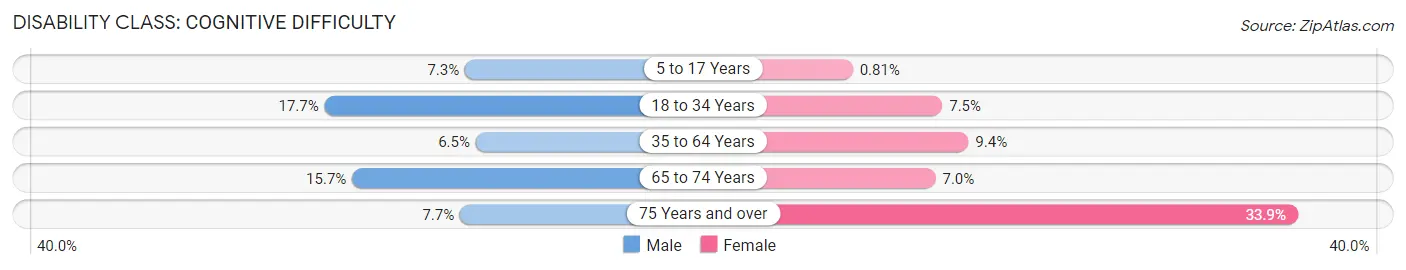
| Age Bracket | Male | Female |
| 5 to 17 Years | 131 (7.3%) | 12 (0.8%) |
| 18 to 34 Years | 336 (17.7%) | 127 (7.5%) |
| 35 to 64 Years | 222 (6.5%) | 320 (9.4%) |
| 65 to 74 Years | 143 (15.7%) | 72 (7.0%) |
| 75 Years and over | 50 (7.7%) | 308 (33.9%) |
Disability Class: Ambulatory Difficulty
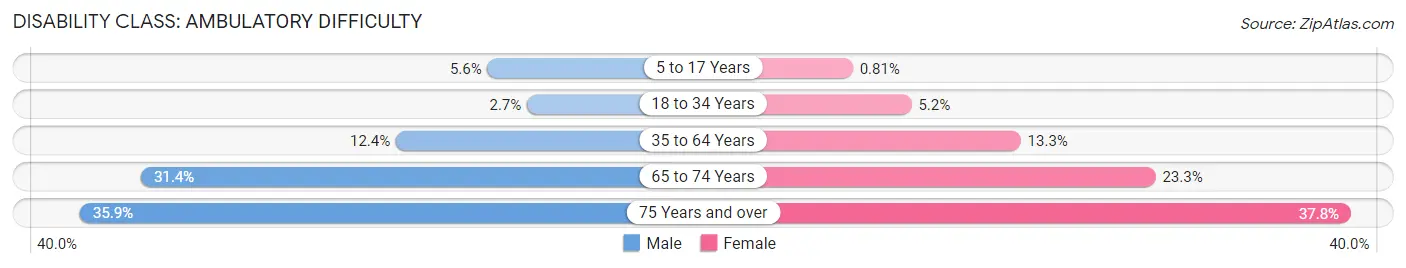
| Age Bracket | Male | Female |
| 5 to 17 Years | 101 (5.6%) | 12 (0.8%) |
| 18 to 34 Years | 51 (2.7%) | 88 (5.2%) |
| 35 to 64 Years | 424 (12.4%) | 452 (13.3%) |
| 65 to 74 Years | 286 (31.4%) | 241 (23.3%) |
| 75 Years and over | 234 (35.9%) | 344 (37.8%) |
Disability Class: Self-Care Difficulty
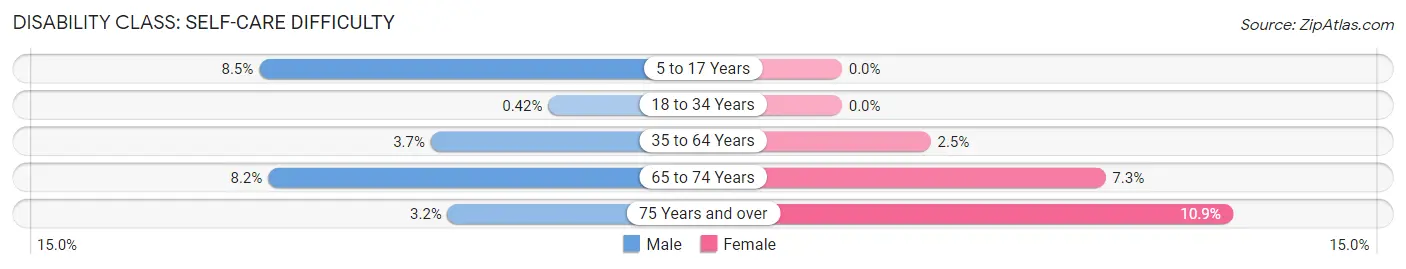
| Age Bracket | Male | Female |
| 5 to 17 Years | 152 (8.5%) | 0 (0.0%) |
| 18 to 34 Years | 8 (0.4%) | 0 (0.0%) |
| 35 to 64 Years | 126 (3.7%) | 84 (2.5%) |
| 65 to 74 Years | 75 (8.2%) | 76 (7.3%) |
| 75 Years and over | 21 (3.2%) | 99 (10.9%) |
Technology Access in Randolph County
Computing Device Access in Randolph County
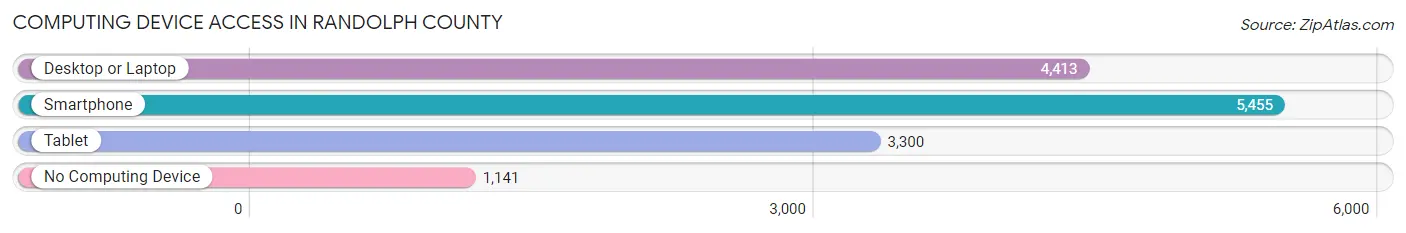
| Device Type | # Households | % Households |
| Desktop or Laptop | 4,413 | 61.4% |
| Smartphone | 5,455 | 75.9% |
| Tablet | 3,300 | 45.9% |
| No Computing Device | 1,141 | 15.9% |
| Total | 7,190 | 100.0% |
Internet Access in Randolph County
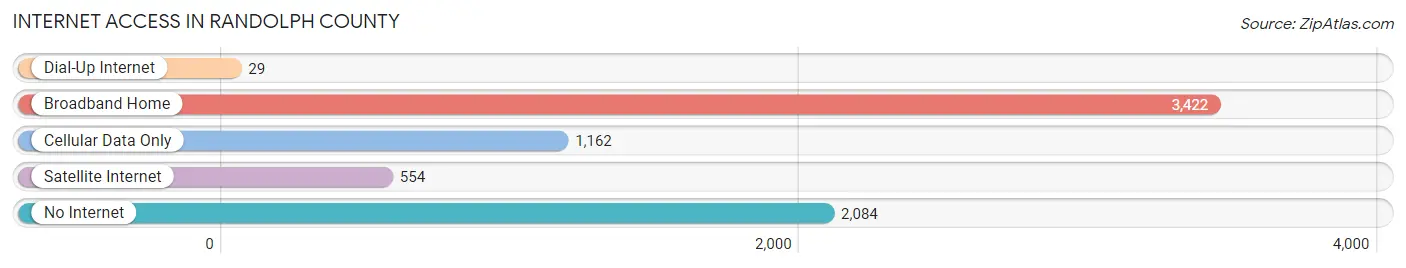
| Internet Type | # Households | % Households |
| Dial-Up Internet | 29 | 0.4% |
| Broadband Home | 3,422 | 47.6% |
| Cellular Data Only | 1,162 | 16.2% |
| Satellite Internet | 554 | 7.7% |
| No Internet | 2,084 | 29.0% |
| Total | 7,190 | 100.0% |
Randolph County Summary
Randolph County, Arkansas is located in the northeast corner of the state and is bordered by Missouri to the north, Lawrence County to the east, Clay County to the south, and Greene County to the west. The county seat is Pocahontas, and the county has a total area of 602 square miles. As of the 2010 census, the population was 17,969.
History
Randolph County was formed in 1835 from a portion of Lawrence County. It was named for John Randolph, a prominent Virginia statesman. The first county seat was established at Davidsonville, but it was moved to Pocahontas in 1851.
During the Civil War, Randolph County was a hotbed of Unionist sentiment. The county was the site of several skirmishes between Union and Confederate forces, and the county was occupied by Union troops for much of the war.
Geography
Randolph County is located in the foothills of the Ozark Mountains. The terrain is mostly hilly, with some flat areas in the valleys. The Black River runs through the county, and there are several smaller creeks and streams. The county is mostly forested, with some agricultural land in the valleys.
Economy
The economy of Randolph County is largely based on agriculture and forestry. The county is home to several large timber companies, and the timber industry is a major employer in the area. The county also has a thriving agricultural sector, with corn, soybeans, and cotton being the main crops.
The county also has a growing tourism industry, with several state parks and recreational areas located in the area. The county is also home to several manufacturing companies, including a furniture factory and a plastics plant.
Demographics
As of the 2010 census, the population of Randolph County was 17,969. The racial makeup of the county was 92.3% White, 4.7% Black or African American, 0.4% Native American, 0.3% Asian, 0.1% Pacific Islander, 0.7% from other races, and 1.5% from two or more races. Hispanic or Latino of any race were 2.2% of the population.
The median income for a household in the county was $30,945, and the median income for a family was $37,945. The per capita income for the county was $16,845. About 17.2% of families and 21.7% of the population were below the poverty line, including 28.3% of those under age 18 and 16.2% of those age 65 or over.
Common Questions
What is Per Capita Income in Randolph County?
Per Capita income in Randolph County is $25,528.
What is the Median Family Income in Randolph County?
Median Family Income in Randolph County is $59,380.
What is the Median Household income in Randolph County?
Median Household Income in Randolph County is $45,993.
What is Income or Wage Gap in Randolph County?
Income or Wage Gap in Randolph County is 23.0%.
Women in Randolph County earn 77.0 cents for every dollar earned by a man.
What is Family Income Deficit in Randolph County?
Family Income Deficit in Randolph County is $8,063.
Families that are below poverty line in Randolph County earn $8,063 less on average than the poverty threshold level.
What is Inequality or Gini Index in Randolph County?
Inequality or Gini Index in Randolph County is 0.44.
What is the Total Population of Randolph County?
Total Population of Randolph County is 18,619.
What is the Total Male Population of Randolph County?
Total Male Population of Randolph County is 9,393.
What is the Total Female Population of Randolph County?
Total Female Population of Randolph County is 9,226.
What is the Ratio of Males per 100 Females in Randolph County?
There are 101.81 Males per 100 Females in Randolph County.
What is the Ratio of Females per 100 Males in Randolph County?
There are 98.22 Females per 100 Males in Randolph County.
What is the Median Population Age in Randolph County?
Median Population Age in Randolph County is 39.1 Years.
What is the Average Family Size in Randolph County
Average Family Size in Randolph County is 3.3 People.
What is the Average Household Size in Randolph County
Average Household Size in Randolph County is 2.5 People.
How Large is the Labor Force in Randolph County?
There are 7,731 People in the Labor Forcein in Randolph County.
What is the Percentage of People in the Labor Force in Randolph County?
52.9% of People are in the Labor Force in Randolph County.
What is the Unemployment Rate in Randolph County?
Unemployment Rate in Randolph County is 7.5%.