Montgomery County, AR Map & Demographics
Montgomery County Map
Montgomery County Overview
$26,815
PER CAPITA INCOME
$56,905
AVG FAMILY INCOME
$47,103
AVG HOUSEHOLD INCOME
36.0%
WAGE / INCOME GAP [ % ]
64.0¢/ $1
WAGE / INCOME GAP [ $ ]
$8,489
FAMILY INCOME DEFICIT
0.45
INEQUALITY / GINI INDEX
8,555
TOTAL POPULATION
4,380
MALE POPULATION
4,175
FEMALE POPULATION
104.91
MALES / 100 FEMALES
95.32
FEMALES / 100 MALES
50.5
MEDIAN AGE
2.8
AVG FAMILY SIZE
2.4
AVG HOUSEHOLD SIZE
3,505
LABOR FORCE [ PEOPLE ]
48.5%
PERCENT IN LABOR FORCE
7.3%
UNEMPLOYMENT RATE
Montgomery County Area Codes
Income in Montgomery County
Income Overview in Montgomery County
Per Capita Income in Montgomery County is $26,815, while median incomes of families and households are $56,905 and $47,103 respectively.
| Characteristic | Number | Measure |
| Per Capita Income | 8,555 | $26,815 |
| Median Family Income | 2,448 | $56,905 |
| Mean Family Income | 2,448 | $74,829 |
| Median Household Income | 3,589 | $47,103 |
| Mean Household Income | 3,589 | $61,955 |
| Income Deficit | 2,448 | $8,489 |
| Wage / Income Gap (%) | 8,555 | 36.01% |
| Wage / Income Gap ($) | 8,555 | 63.99¢ per $1 |
| Gini / Inequality Index | 8,555 | 0.45 |
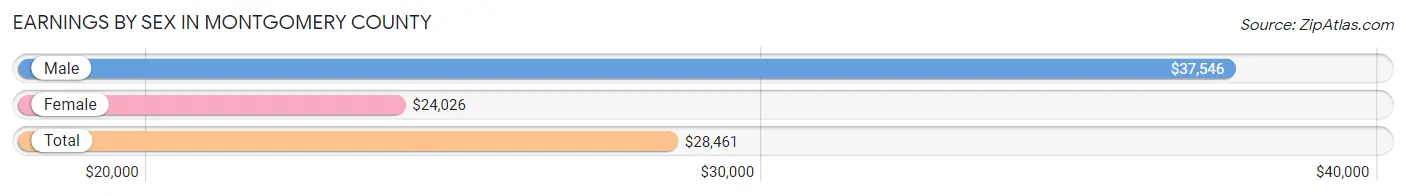
Earnings by Sex in Montgomery County
Average Earnings in Montgomery County are $28,461, $37,546 for men and $24,026 for women, a difference of 36.0%.
| Sex | Number | Average Earnings |
| Male | 1,810 (50.1%) | $37,546 |
| Female | 1,803 (49.9%) | $24,026 |
| Total | 3,613 (100.0%) | $28,461 |
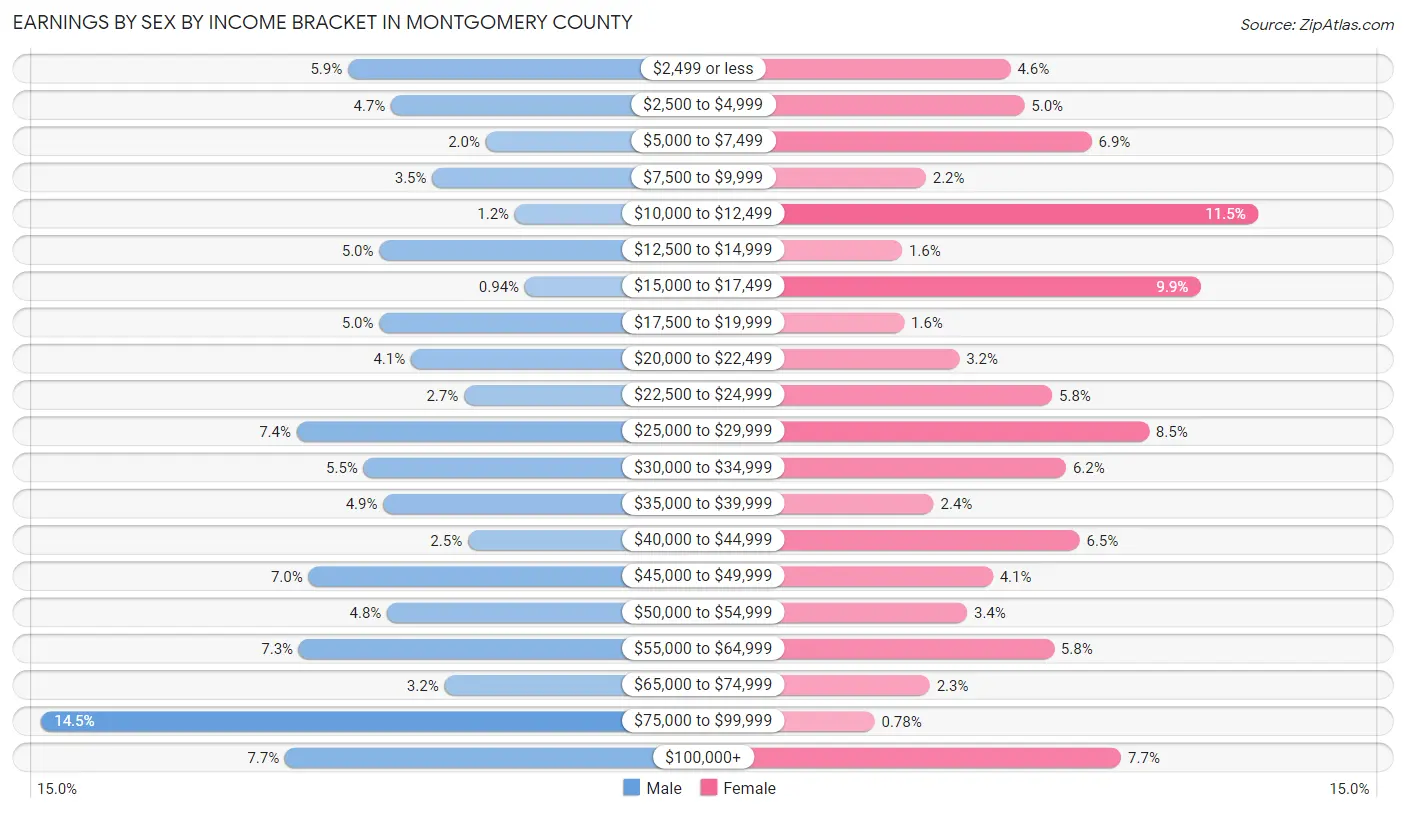
Earnings by Sex by Income Bracket in Montgomery County
The most common earnings brackets in Montgomery County are $75,000 to $99,999 for men (263 | 14.5%) and $10,000 to $12,499 for women (208 | 11.5%).
| Income | Male | Female |
| $2,499 or less | 107 (5.9%) | 83 (4.6%) |
| $2,500 to $4,999 | 85 (4.7%) | 90 (5.0%) |
| $5,000 to $7,499 | 37 (2.0%) | 124 (6.9%) |
| $7,500 to $9,999 | 64 (3.5%) | 40 (2.2%) |
| $10,000 to $12,499 | 22 (1.2%) | 208 (11.5%) |
| $12,500 to $14,999 | 91 (5.0%) | 28 (1.5%) |
| $15,000 to $17,499 | 17 (0.9%) | 179 (9.9%) |
| $17,500 to $19,999 | 91 (5.0%) | 29 (1.6%) |
| $20,000 to $22,499 | 75 (4.1%) | 57 (3.2%) |
| $22,500 to $24,999 | 48 (2.6%) | 104 (5.8%) |
| $25,000 to $29,999 | 133 (7.3%) | 153 (8.5%) |
| $30,000 to $34,999 | 99 (5.5%) | 111 (6.2%) |
| $35,000 to $39,999 | 89 (4.9%) | 44 (2.4%) |
| $40,000 to $44,999 | 46 (2.5%) | 118 (6.5%) |
| $45,000 to $49,999 | 127 (7.0%) | 74 (4.1%) |
| $50,000 to $54,999 | 87 (4.8%) | 61 (3.4%) |
| $55,000 to $64,999 | 132 (7.3%) | 105 (5.8%) |
| $65,000 to $74,999 | 58 (3.2%) | 42 (2.3%) |
| $75,000 to $99,999 | 263 (14.5%) | 14 (0.8%) |
| $100,000+ | 139 (7.7%) | 139 (7.7%) |
| Total | 1,810 (100.0%) | 1,803 (100.0%) |
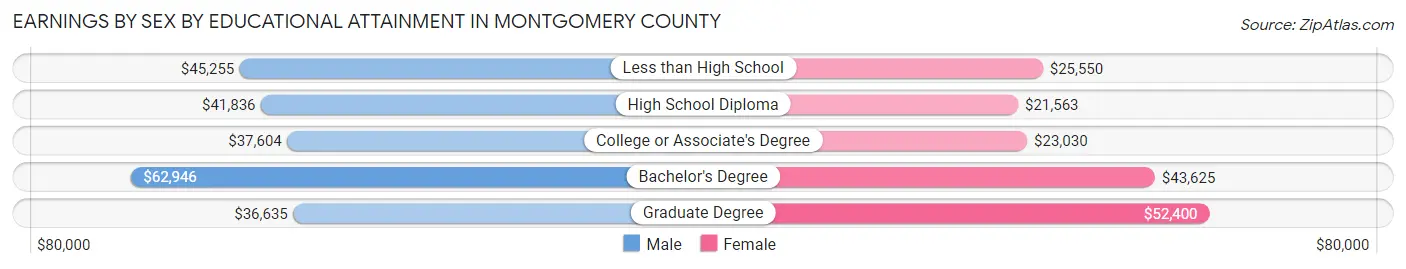
Earnings by Sex by Educational Attainment in Montgomery County
Average earnings in Montgomery County are $42,500 for men and $25,214 for women, a difference of 40.7%. Men with an educational attainment of bachelor's degree enjoy the highest average annual earnings of $62,946, while those with graduate degree education earn the least with $36,635. Women with an educational attainment of graduate degree earn the most with the average annual earnings of $52,400, while those with high school diploma education have the smallest earnings of $21,563.
| Educational Attainment | Male Income | Female Income |
| Less than High School | $45,255 | $25,550 |
| High School Diploma | $41,836 | $21,563 |
| College or Associate's Degree | $37,604 | $23,030 |
| Bachelor's Degree | $62,946 | $43,625 |
| Graduate Degree | $36,635 | $52,400 |
| Total | $42,500 | $25,214 |
Family Income in Montgomery County
Family Income Brackets in Montgomery County
According to the Montgomery County family income data, there are 431 families falling into the $35,000 to $49,999 income range, which is the most common income bracket and makes up 17.6% of all families. Conversely, the less than $10,000 income bracket is the least frequent group with only 76 families (3.1%) belonging to this category.
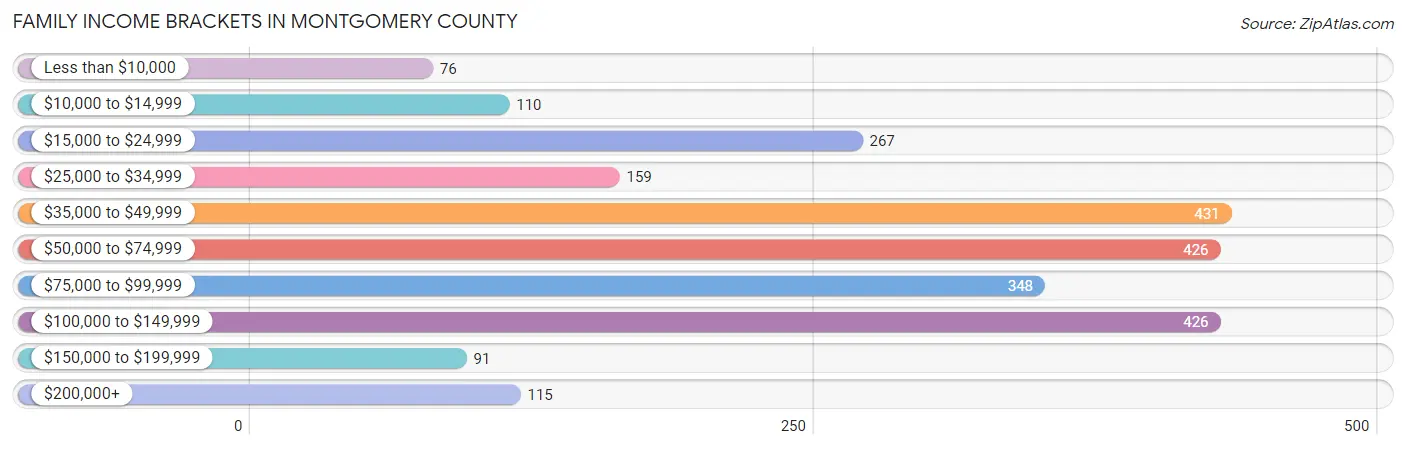
| Income Bracket | # Families | % Families |
| Less than $10,000 | 76 | 3.1% |
| $10,000 to $14,999 | 110 | 4.5% |
| $15,000 to $24,999 | 267 | 10.9% |
| $25,000 to $34,999 | 159 | 6.5% |
| $35,000 to $49,999 | 431 | 17.6% |
| $50,000 to $74,999 | 426 | 17.4% |
| $75,000 to $99,999 | 348 | 14.2% |
| $100,000 to $149,999 | 426 | 17.4% |
| $150,000 to $199,999 | 91 | 3.7% |
| $200,000+ | 115 | 4.7% |
Family Income by Famaliy Size in Montgomery County
5-person families (188 | 7.7%) account for the highest median family income in Montgomery County with $83,182 per family, while 2-person families (1,642 | 67.1%) have the highest median income of $29,375 per family member.
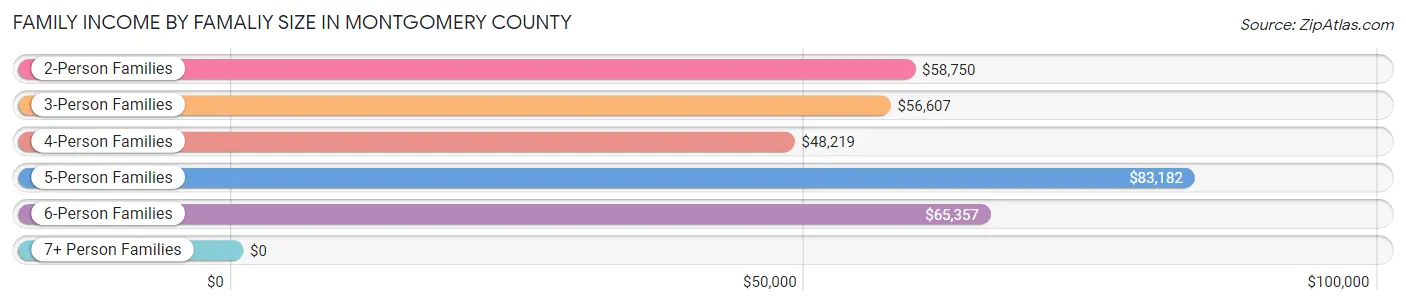
| Income Bracket | # Families | Median Income |
| 2-Person Families | 1,642 (67.1%) | $58,750 |
| 3-Person Families | 358 (14.6%) | $56,607 |
| 4-Person Families | 227 (9.3%) | $48,219 |
| 5-Person Families | 188 (7.7%) | $83,182 |
| 6-Person Families | 32 (1.3%) | $65,357 |
| 7+ Person Families | 1 (0.0%) | $0 |
| Total | 2,448 (100.0%) | $56,905 |
Family Income by Number of Earners in Montgomery County
The median family income in Montgomery County is $56,905, with families comprising 3+ earners (77) having the highest median family income of $103,875, while families with no earners (726) have the lowest median family income of $45,421, accounting for 3.2% and 29.7% of families, respectively.
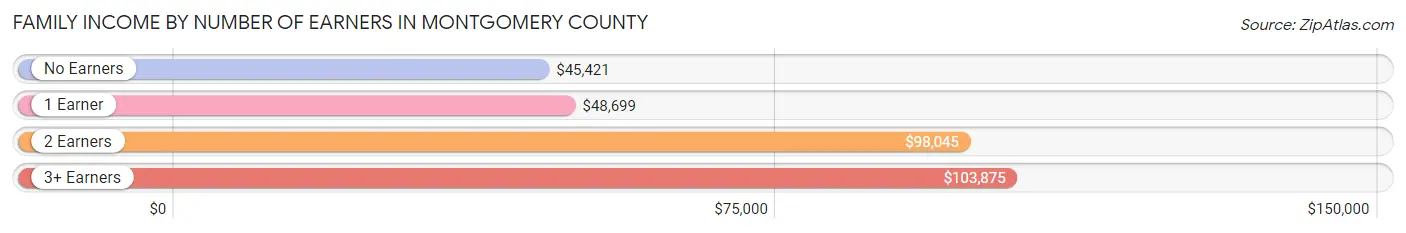
| Number of Earners | # Families | Median Income |
| No Earners | 726 (29.7%) | $45,421 |
| 1 Earner | 731 (29.9%) | $48,699 |
| 2 Earners | 914 (37.3%) | $98,045 |
| 3+ Earners | 77 (3.2%) | $103,875 |
| Total | 2,448 (100.0%) | $56,905 |
Household Income in Montgomery County
Household Income Brackets in Montgomery County
With 581 households falling in the category, the $35,000 to $49,999 income range is the most frequent in Montgomery County, accounting for 16.2% of all households. In contrast, only 90 households (2.5%) fall into the $150,000 to $199,999 income bracket, making it the least populous group.
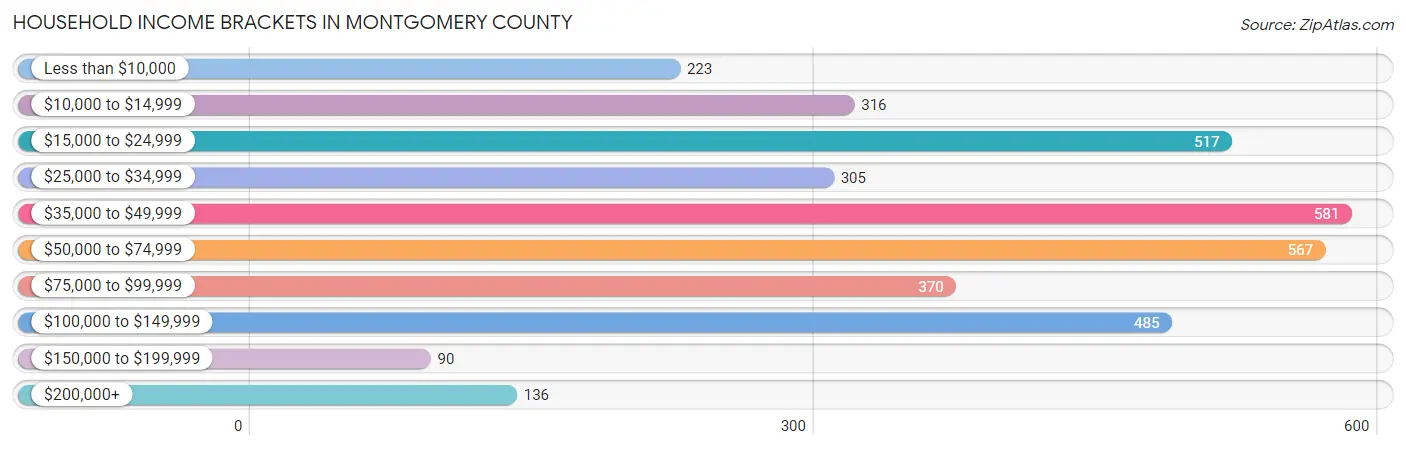
| Income Bracket | # Households | % Households |
| Less than $10,000 | 223 | 6.2% |
| $10,000 to $14,999 | 316 | 8.8% |
| $15,000 to $24,999 | 517 | 14.4% |
| $25,000 to $34,999 | 305 | 8.5% |
| $35,000 to $49,999 | 581 | 16.2% |
| $50,000 to $74,999 | 567 | 15.8% |
| $75,000 to $99,999 | 370 | 10.3% |
| $100,000 to $149,999 | 485 | 13.5% |
| $150,000 to $199,999 | 90 | 2.5% |
| $200,000+ | 136 | 3.8% |
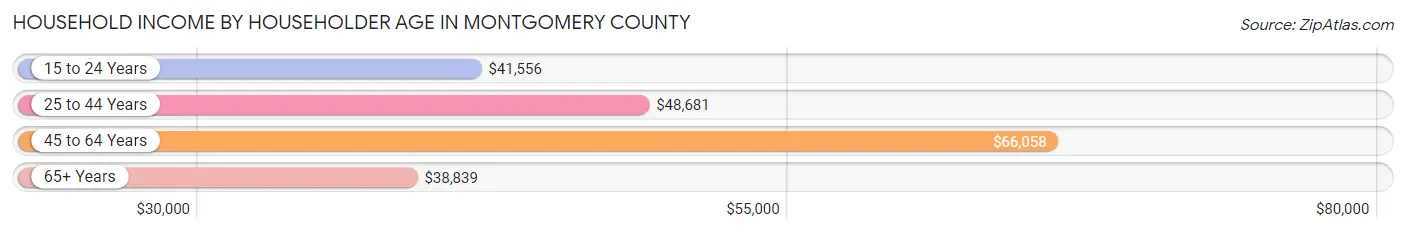
Household Income by Householder Age in Montgomery County
The median household income in Montgomery County is $47,103, with the highest median household income of $66,058 found in the 45 to 64 years age bracket for the primary householder. A total of 1,294 households (36.0%) fall into this category. Meanwhile, the 65+ years age bracket for the primary householder has the lowest median household income of $38,839, with 1,418 households (39.5%) in this group.
| Income Bracket | # Households | Median Income |
| 15 to 24 Years | 91 (2.5%) | $41,556 |
| 25 to 44 Years | 786 (21.9%) | $48,681 |
| 45 to 64 Years | 1,294 (36.0%) | $66,058 |
| 65+ Years | 1,418 (39.5%) | $38,839 |
| Total | 3,589 (100.0%) | $47,103 |
Poverty in Montgomery County
Income Below Poverty by Sex and Age in Montgomery County
With 20.3% poverty level for males and 15.8% for females among the residents of Montgomery County, 5 year old males and 35 to 44 year old females are the most vulnerable to poverty, with 5 males (50.0%) and 171 females (40.5%) in their respective age groups living below the poverty level.
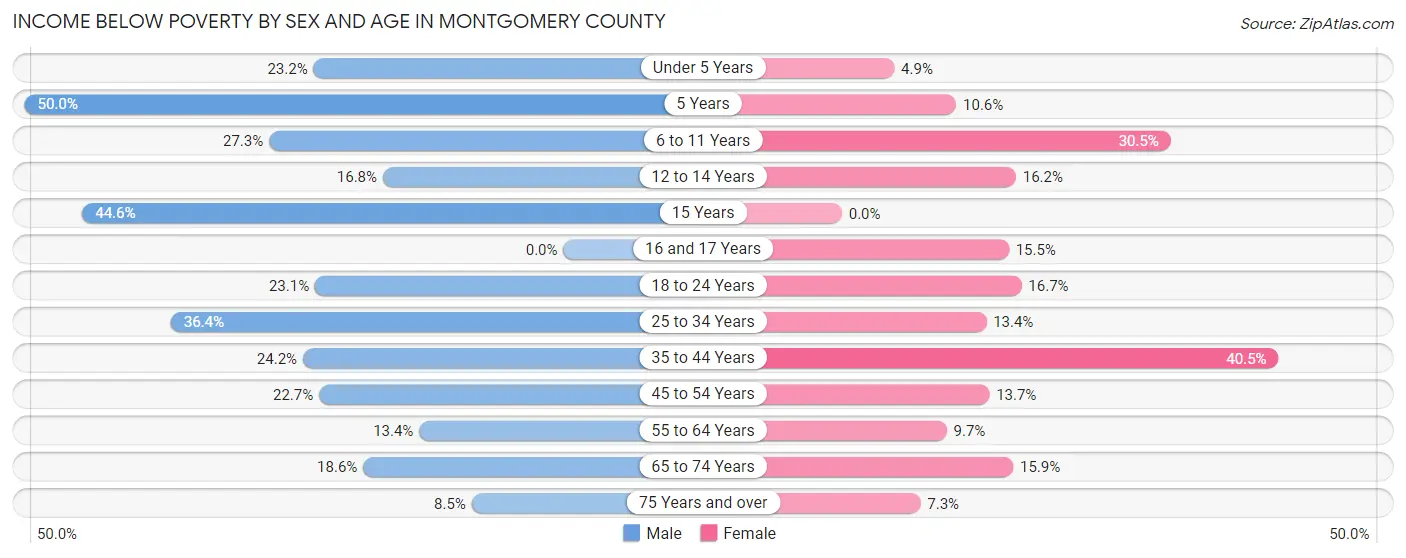
| Age Bracket | Male | Female |
| Under 5 Years | 48 (23.2%) | 9 (4.9%) |
| 5 Years | 5 (50.0%) | 7 (10.6%) |
| 6 to 11 Years | 71 (27.3%) | 47 (30.5%) |
| 12 to 14 Years | 35 (16.8%) | 26 (16.2%) |
| 15 Years | 25 (44.6%) | 0 (0.0%) |
| 16 and 17 Years | 0 (0.0%) | 11 (15.5%) |
| 18 to 24 Years | 71 (23.1%) | 40 (16.7%) |
| 25 to 34 Years | 161 (36.4%) | 56 (13.4%) |
| 35 to 44 Years | 95 (24.2%) | 171 (40.5%) |
| 45 to 54 Years | 112 (22.7%) | 71 (13.7%) |
| 55 to 64 Years | 99 (13.4%) | 68 (9.7%) |
| 65 to 74 Years | 123 (18.6%) | 105 (15.9%) |
| 75 Years and over | 36 (8.5%) | 35 (7.3%) |
| Total | 881 (20.3%) | 646 (15.8%) |
Income Above Poverty by Sex and Age in Montgomery County
According to the poverty statistics in Montgomery County, males aged 16 and 17 years and females aged 15 years are the age groups that are most secure financially, with 100.0% of males and 100.0% of females in these age groups living above the poverty line.
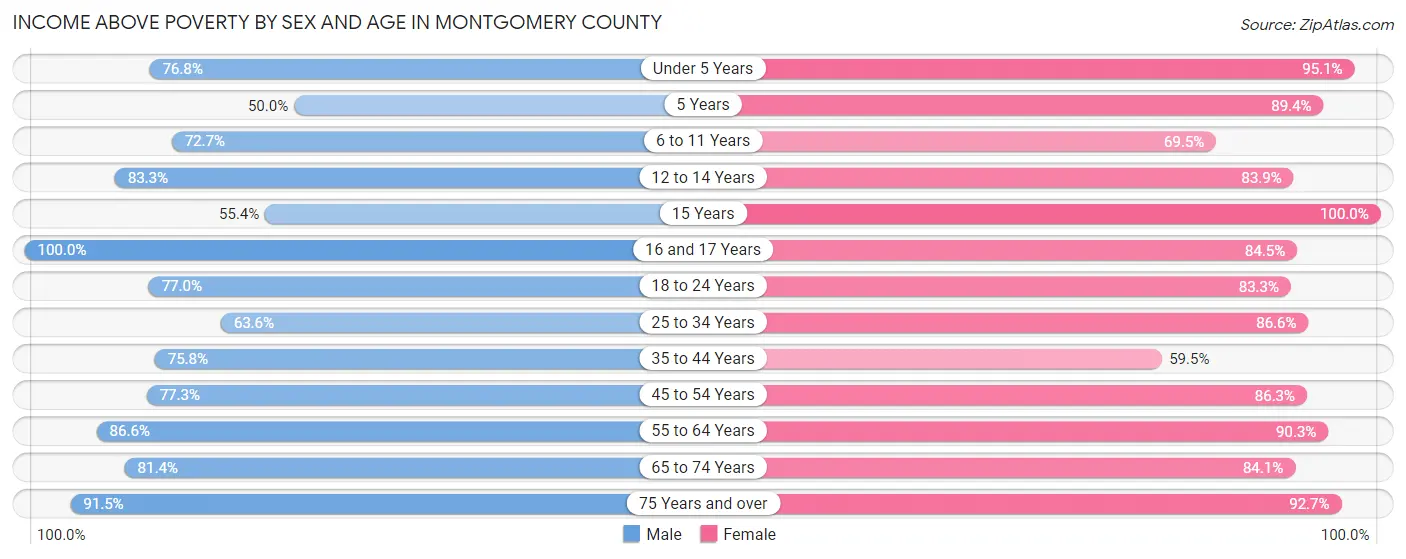
| Age Bracket | Male | Female |
| Under 5 Years | 159 (76.8%) | 176 (95.1%) |
| 5 Years | 5 (50.0%) | 59 (89.4%) |
| 6 to 11 Years | 189 (72.7%) | 107 (69.5%) |
| 12 to 14 Years | 174 (83.3%) | 135 (83.9%) |
| 15 Years | 31 (55.4%) | 3 (100.0%) |
| 16 and 17 Years | 129 (100.0%) | 60 (84.5%) |
| 18 to 24 Years | 237 (76.9%) | 200 (83.3%) |
| 25 to 34 Years | 281 (63.6%) | 362 (86.6%) |
| 35 to 44 Years | 298 (75.8%) | 251 (59.5%) |
| 45 to 54 Years | 382 (77.3%) | 448 (86.3%) |
| 55 to 64 Years | 641 (86.6%) | 631 (90.3%) |
| 65 to 74 Years | 539 (81.4%) | 556 (84.1%) |
| 75 Years and over | 387 (91.5%) | 445 (92.7%) |
| Total | 3,452 (79.7%) | 3,433 (84.2%) |
Income Below Poverty Among Married-Couple Families in Montgomery County
The poverty statistics for married-couple families in Montgomery County show that 8.7% or 176 of the total 2,030 families live below the poverty line. Families with 3 or 4 children have the highest poverty rate of 19.0%, comprising of 31 families. On the other hand, families with no children have the lowest poverty rate of 6.7%, which includes 97 families.
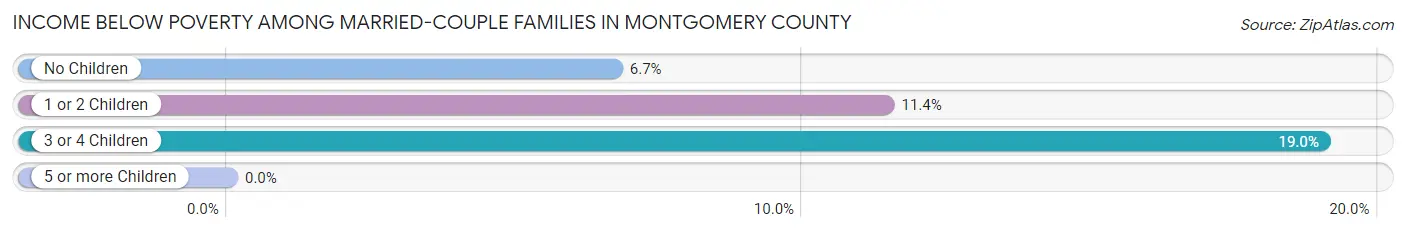
| Children | Above Poverty | Below Poverty |
| No Children | 1,350 (93.3%) | 97 (6.7%) |
| 1 or 2 Children | 372 (88.6%) | 48 (11.4%) |
| 3 or 4 Children | 132 (81.0%) | 31 (19.0%) |
| 5 or more Children | 0 (0.0%) | 0 (0.0%) |
| Total | 1,854 (91.3%) | 176 (8.7%) |
Income Below Poverty Among Single-Parent Households in Montgomery County
According to the poverty data in Montgomery County, 39.2% or 65 single-father households and 31.8% or 80 single-mother households are living below the poverty line. Among single-father households, those with 1 or 2 children have the highest poverty rate, with 42 households (46.7%) experiencing poverty. Likewise, among single-mother households, those with 3 or 4 children have the highest poverty rate, with 14 households (58.3%) falling below the poverty line.
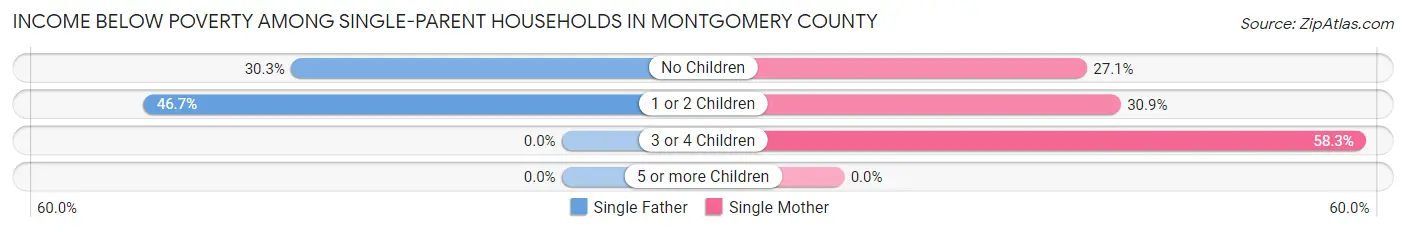
| Children | Single Father | Single Mother |
| No Children | 23 (30.3%) | 32 (27.1%) |
| 1 or 2 Children | 42 (46.7%) | 34 (30.9%) |
| 3 or 4 Children | 0 (0.0%) | 14 (58.3%) |
| 5 or more Children | 0 (0.0%) | 0 (0.0%) |
| Total | 65 (39.2%) | 80 (31.8%) |
Income Below Poverty Among Married-Couple vs Single-Parent Households in Montgomery County
The poverty data for Montgomery County shows that 176 of the married-couple family households (8.7%) and 145 of the single-parent households (34.7%) are living below the poverty level. Within the married-couple family households, those with 3 or 4 children have the highest poverty rate, with 31 households (19.0%) falling below the poverty line. Among the single-parent households, those with 3 or 4 children have the highest poverty rate, with 14 household (58.3%) living below poverty.
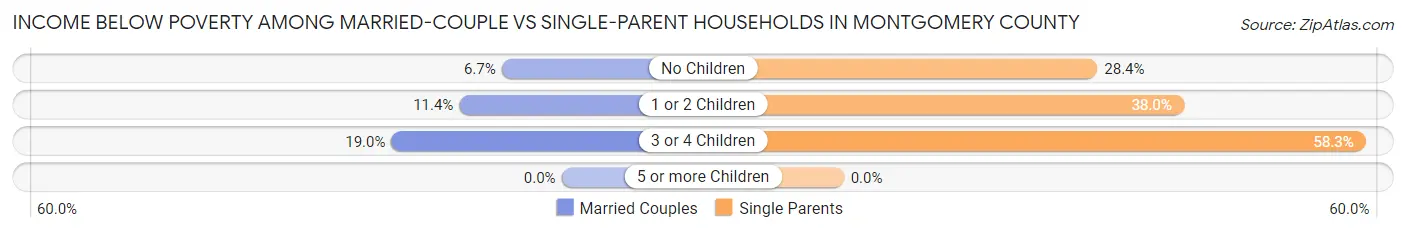
| Children | Married-Couple Families | Single-Parent Households |
| No Children | 97 (6.7%) | 55 (28.3%) |
| 1 or 2 Children | 48 (11.4%) | 76 (38.0%) |
| 3 or 4 Children | 31 (19.0%) | 14 (58.3%) |
| 5 or more Children | 0 (0.0%) | 0 (0.0%) |
| Total | 176 (8.7%) | 145 (34.7%) |
Race in Montgomery County
The most populous races in Montgomery County are White / Caucasian (7,777 | 90.9%), Hispanic or Latino (415 | 4.9%), and Two or more Races (324 | 3.8%).
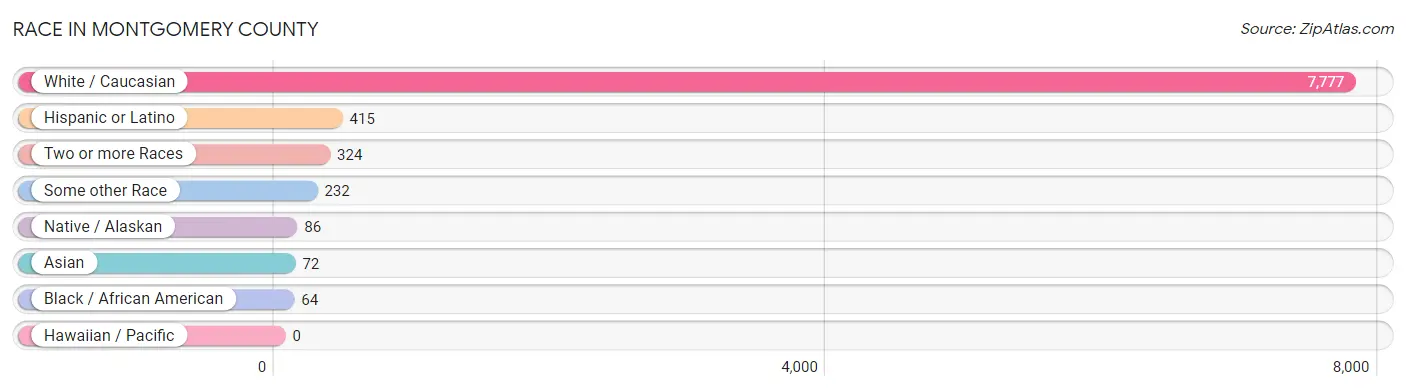
| Race | # Population | % Population |
| Asian | 72 | 0.8% |
| Black / African American | 64 | 0.7% |
| Hawaiian / Pacific | 0 | 0.0% |
| Hispanic or Latino | 415 | 4.9% |
| Native / Alaskan | 86 | 1.0% |
| White / Caucasian | 7,777 | 90.9% |
| Two or more Races | 324 | 3.8% |
| Some other Race | 232 | 2.7% |
| Total | 8,555 | 100.0% |
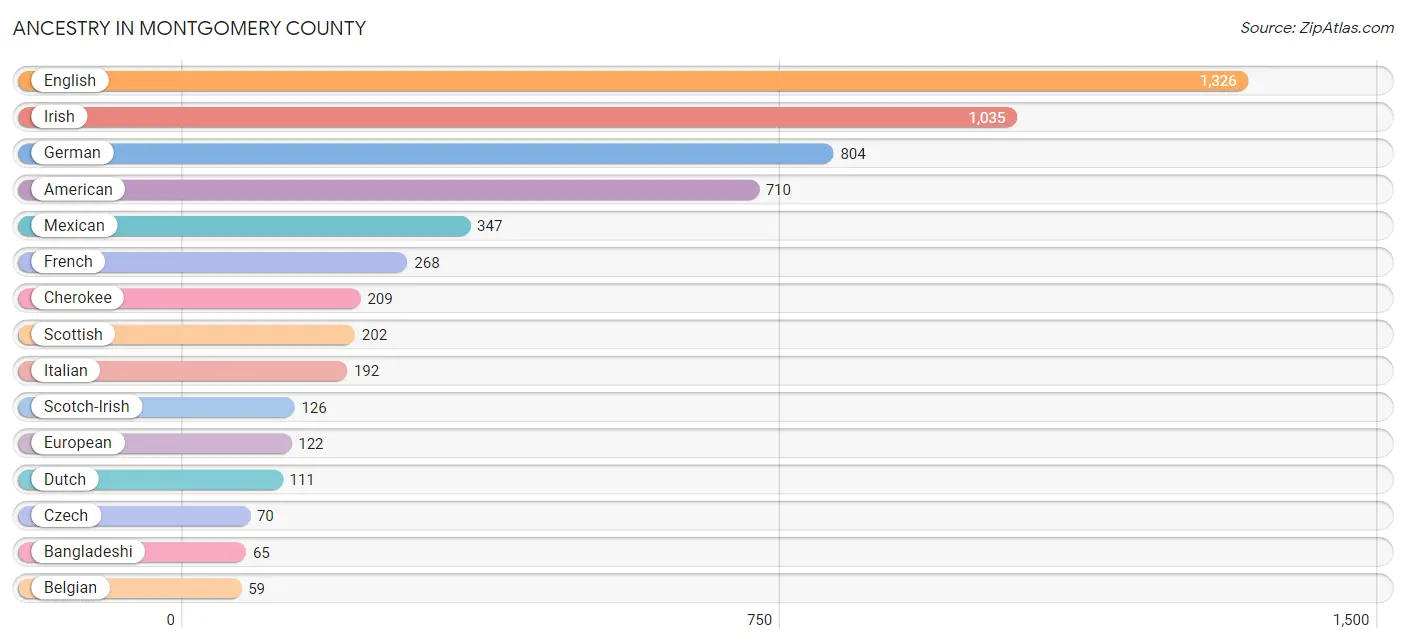
Ancestry in Montgomery County
The most populous ancestries reported in Montgomery County are English (1,326 | 15.5%), Irish (1,035 | 12.1%), German (804 | 9.4%), American (710 | 8.3%), and Mexican (347 | 4.1%), together accounting for 49.4% of all Montgomery County residents.
| Ancestry | # Population | % Population |
| African | 7 | 0.1% |
| Alsatian | 6 | 0.1% |
| American | 710 | 8.3% |
| Apache | 14 | 0.2% |
| Australian | 10 | 0.1% |
| Austrian | 4 | 0.1% |
| Bangladeshi | 65 | 0.8% |
| Belgian | 59 | 0.7% |
| Blackfeet | 12 | 0.1% |
| British | 30 | 0.4% |
| Cherokee | 209 | 2.4% |
| Chickasaw | 11 | 0.1% |
| Choctaw | 8 | 0.1% |
| Crow | 1 | 0.0% |
| Cuban | 36 | 0.4% |
| Czech | 70 | 0.8% |
| Danish | 18 | 0.2% |
| Dutch | 111 | 1.3% |
| Dutch West Indian | 59 | 0.7% |
| Eastern European | 13 | 0.2% |
| English | 1,326 | 15.5% |
| European | 122 | 1.4% |
| Finnish | 6 | 0.1% |
| French | 268 | 3.1% |
| French Canadian | 41 | 0.5% |
| German | 804 | 9.4% |
| Greek | 35 | 0.4% |
| Hungarian | 13 | 0.2% |
| Irish | 1,035 | 12.1% |
| Italian | 192 | 2.2% |
| Korean | 37 | 0.4% |
| Mexican | 347 | 4.1% |
| Mexican American Indian | 12 | 0.1% |
| Native Hawaiian | 30 | 0.4% |
| Northern European | 1 | 0.0% |
| Norwegian | 47 | 0.5% |
| Polish | 9 | 0.1% |
| Portuguese | 6 | 0.1% |
| Puerto Rican | 7 | 0.1% |
| Scandinavian | 23 | 0.3% |
| Scotch-Irish | 126 | 1.5% |
| Scottish | 202 | 2.4% |
| Slovak | 45 | 0.5% |
| South African | 6 | 0.1% |
| Spanish | 12 | 0.1% |
| Subsaharan African | 13 | 0.2% |
| Swedish | 14 | 0.2% |
| Swiss | 12 | 0.1% |
| Welsh | 32 | 0.4% | View All 49 Rows |
Immigrants in Montgomery County
The most numerous immigrant groups reported in Montgomery County came from Central America (122 | 1.4%), Latin America (122 | 1.4%), Mexico (122 | 1.4%), Asia (72 | 0.8%), and South Eastern Asia (72 | 0.8%), together accounting for 6.0% of all Montgomery County residents.
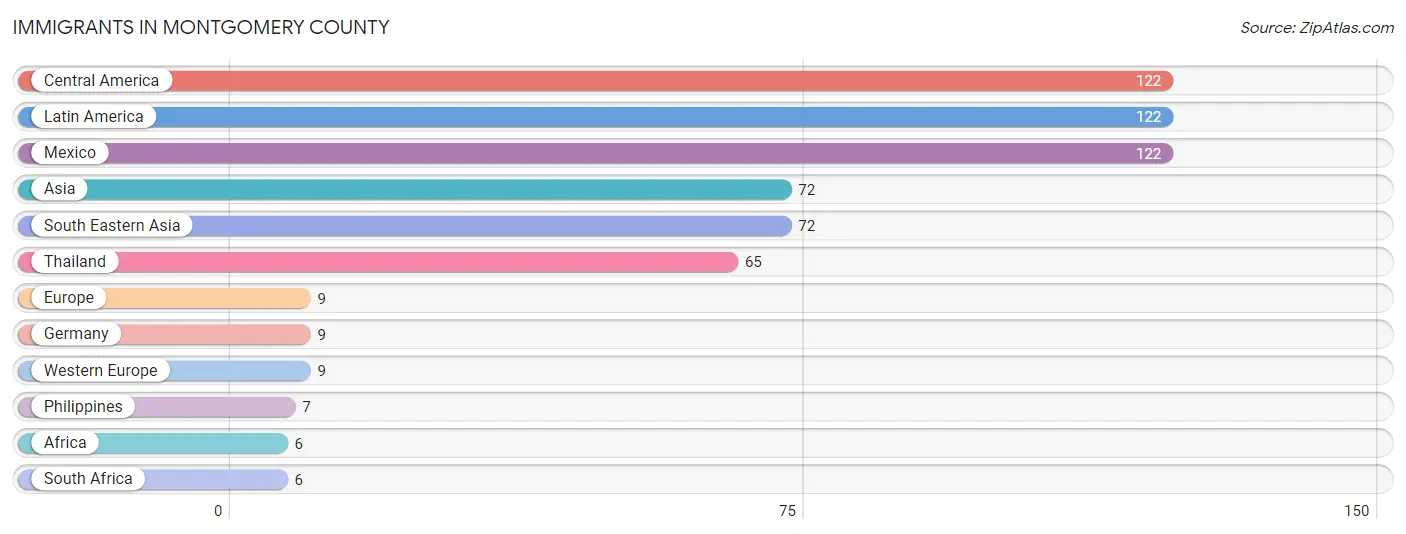
| Immigration Origin | # Population | % Population |
| Africa | 6 | 0.1% |
| Asia | 72 | 0.8% |
| Central America | 122 | 1.4% |
| Europe | 9 | 0.1% |
| Germany | 9 | 0.1% |
| Latin America | 122 | 1.4% |
| Mexico | 122 | 1.4% |
| Philippines | 7 | 0.1% |
| South Africa | 6 | 0.1% |
| South Eastern Asia | 72 | 0.8% |
| Thailand | 65 | 0.8% |
| Western Europe | 9 | 0.1% | View All 12 Rows |
Sex and Age in Montgomery County
Sex and Age in Montgomery County
The most populous age groups in Montgomery County are 60 to 64 Years (404 | 9.2%) for men and 65 to 69 Years (417 | 10.0%) for women.
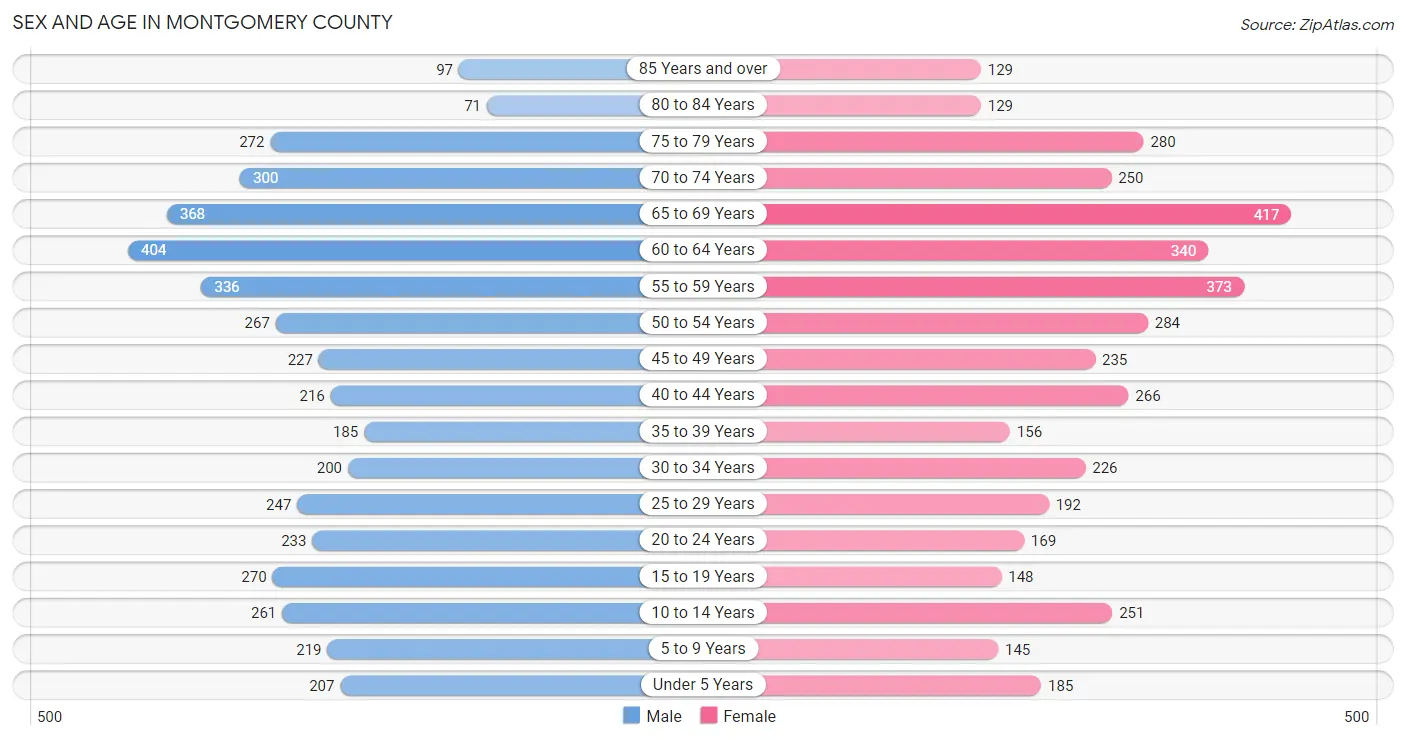
| Age Bracket | Male | Female |
| Under 5 Years | 207 (4.7%) | 185 (4.4%) |
| 5 to 9 Years | 219 (5.0%) | 145 (3.5%) |
| 10 to 14 Years | 261 (6.0%) | 251 (6.0%) |
| 15 to 19 Years | 270 (6.2%) | 148 (3.5%) |
| 20 to 24 Years | 233 (5.3%) | 169 (4.1%) |
| 25 to 29 Years | 247 (5.6%) | 192 (4.6%) |
| 30 to 34 Years | 200 (4.6%) | 226 (5.4%) |
| 35 to 39 Years | 185 (4.2%) | 156 (3.7%) |
| 40 to 44 Years | 216 (4.9%) | 266 (6.4%) |
| 45 to 49 Years | 227 (5.2%) | 235 (5.6%) |
| 50 to 54 Years | 267 (6.1%) | 284 (6.8%) |
| 55 to 59 Years | 336 (7.7%) | 373 (8.9%) |
| 60 to 64 Years | 404 (9.2%) | 340 (8.1%) |
| 65 to 69 Years | 368 (8.4%) | 417 (10.0%) |
| 70 to 74 Years | 300 (6.9%) | 250 (6.0%) |
| 75 to 79 Years | 272 (6.2%) | 280 (6.7%) |
| 80 to 84 Years | 71 (1.6%) | 129 (3.1%) |
| 85 Years and over | 97 (2.2%) | 129 (3.1%) |
| Total | 4,380 (100.0%) | 4,175 (100.0%) |
Families and Households in Montgomery County
Median Family Size in Montgomery County
The median family size in Montgomery County is 2.84 persons per family, with single female/mother families (252 | 10.3%) accounting for the largest median family size of 3.24 persons per family. On the other hand, married-couple families (2,030 | 82.9%) represent the smallest median family size with 2.77 persons per family.
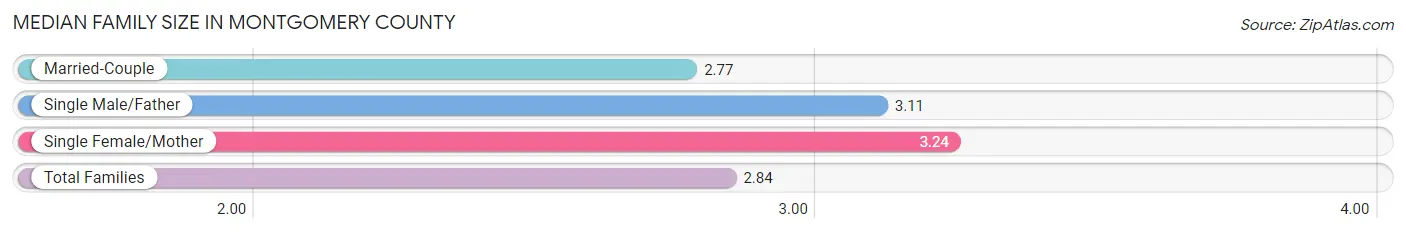
| Family Type | # Families | Family Size |
| Married-Couple | 2,030 (82.9%) | 2.77 |
| Single Male/Father | 166 (6.8%) | 3.11 |
| Single Female/Mother | 252 (10.3%) | 3.24 |
| Total Families | 2,448 (100.0%) | 2.84 |
Median Household Size in Montgomery County
The median household size in Montgomery County is 2.35 persons per household, with single male/father households (166 | 4.6%) accounting for the largest median household size of 3.61 persons per household. non-family households (1,141 | 31.8%) represent the smallest median household size with 1.17 persons per household.
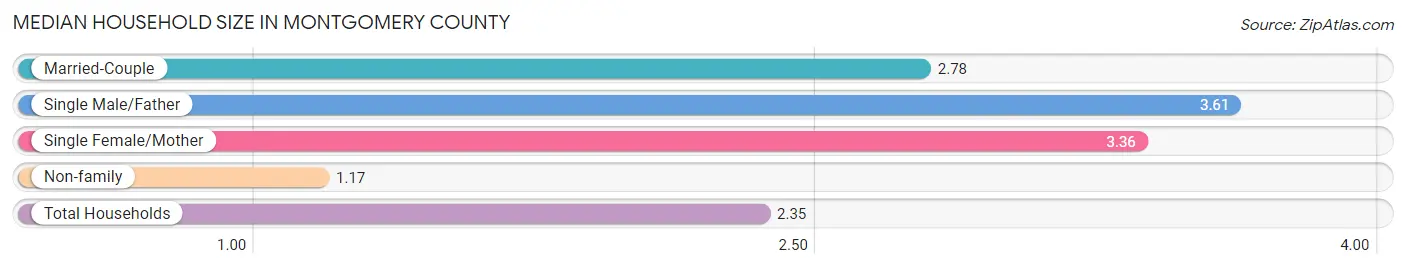
| Household Type | # Households | Household Size |
| Married-Couple | 2,030 (56.6%) | 2.78 |
| Single Male/Father | 166 (4.6%) | 3.61 |
| Single Female/Mother | 252 (7.0%) | 3.36 |
| Non-family | 1,141 (31.8%) | 1.17 |
| Total Households | 3,589 (100.0%) | 2.35 |
Household Size by Marriage Status in Montgomery County
Out of a total of 3,589 households in Montgomery County, 2,448 (68.2%) are family households, while 1,141 (31.8%) are nonfamily households. The most numerous type of family households are 2-person households, comprising 1,598, and the most common type of nonfamily households are 1-person households, comprising 979.
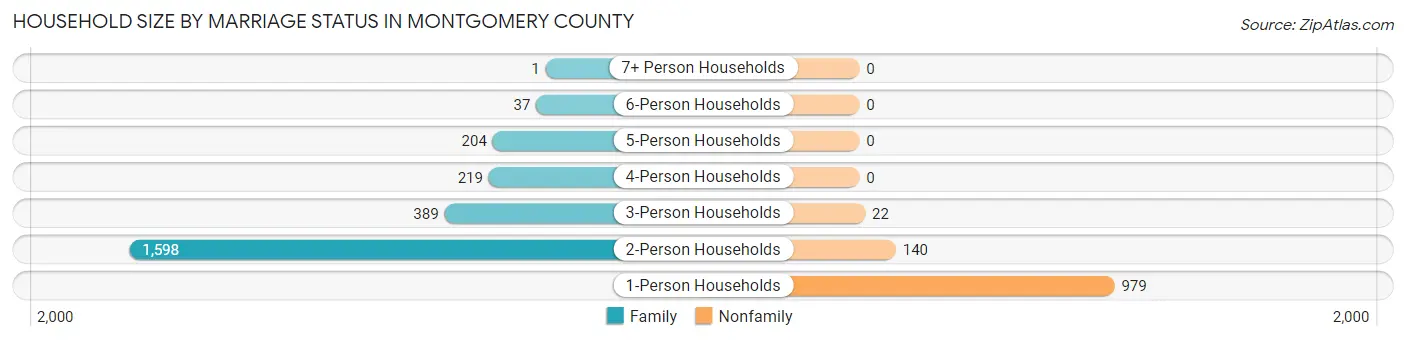
| Household Size | Family Households | Nonfamily Households |
| 1-Person Households | - | 979 (27.3%) |
| 2-Person Households | 1,598 (44.5%) | 140 (3.9%) |
| 3-Person Households | 389 (10.8%) | 22 (0.6%) |
| 4-Person Households | 219 (6.1%) | 0 (0.0%) |
| 5-Person Households | 204 (5.7%) | 0 (0.0%) |
| 6-Person Households | 37 (1.0%) | 0 (0.0%) |
| 7+ Person Households | 1 (0.0%) | 0 (0.0%) |
| Total | 2,448 (68.2%) | 1,141 (31.8%) |
Female Fertility in Montgomery County
Fertility by Age in Montgomery County
Average fertility rate in Montgomery County is 30.0 births per 1,000 women. Women in the age bracket of 20 to 34 years have the highest fertility rate with 63.0 births per 1,000 women. Women in the age bracket of 20 to 34 years acount for 84.1% of all women with births.
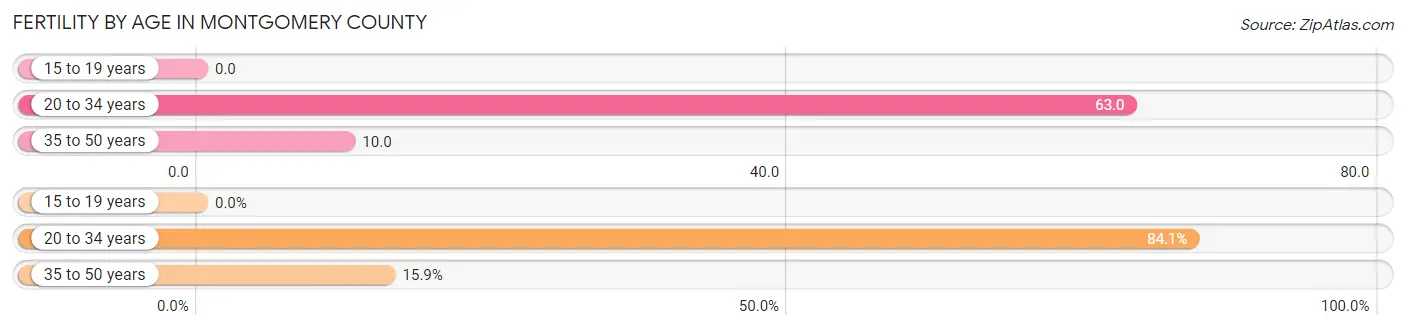
| Age Bracket | Women with Births | Births / 1,000 Women |
| 15 to 19 years | 0 (0.0%) | 0.0 |
| 20 to 34 years | 37 (84.1%) | 63.0 |
| 35 to 50 years | 7 (15.9%) | 10.0 |
| Total | 44 (100.0%) | 30.0 |
Fertility by Age by Marriage Status in Montgomery County
88.6% of women with births (44) in Montgomery County are married. The highest percentage of unmarried women with births falls into 20 to 34 years age bracket with 13.5% of them unmarried at the time of birth, while the lowest percentage of unmarried women with births belong to 35 to 50 years age bracket with 0.0% of them unmarried.
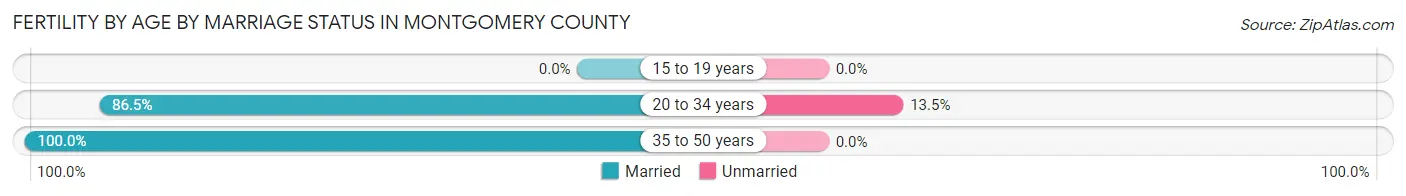
| Age Bracket | Married | Unmarried |
| 15 to 19 years | 0 (0.0%) | 0 (0.0%) |
| 20 to 34 years | 32 (86.5%) | 5 (13.5%) |
| 35 to 50 years | 7 (100.0%) | 0 (0.0%) |
| Total | 39 (88.6%) | 5 (11.4%) |
Fertility by Education in Montgomery County
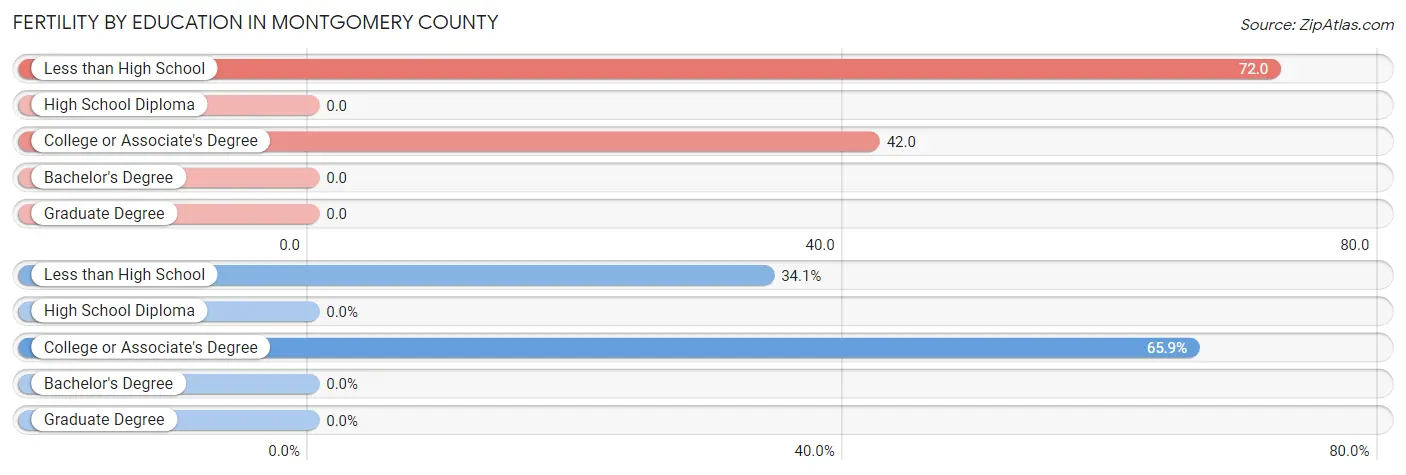
| Educational Attainment | Women with Births | Births / 1,000 Women |
| Less than High School | 15 (34.1%) | 72.0 |
| High School Diploma | 0 (0.0%) | 0.0 |
| College or Associate's Degree | 29 (65.9%) | 42.0 |
| Bachelor's Degree | 0 (0.0%) | 0.0 |
| Graduate Degree | 0 (0.0%) | 0.0 |
| Total | 44 (100.0%) | 30.0 |
Fertility by Education by Marriage Status in Montgomery County
11.4% of women with births in Montgomery County are unmarried. Women with the educational attainment of college or associate's degree are most likely to be married with 100.0% of them married at childbirth, while women with the educational attainment of less than high school are least likely to be married with 33.3% of them unmarried at childbirth.
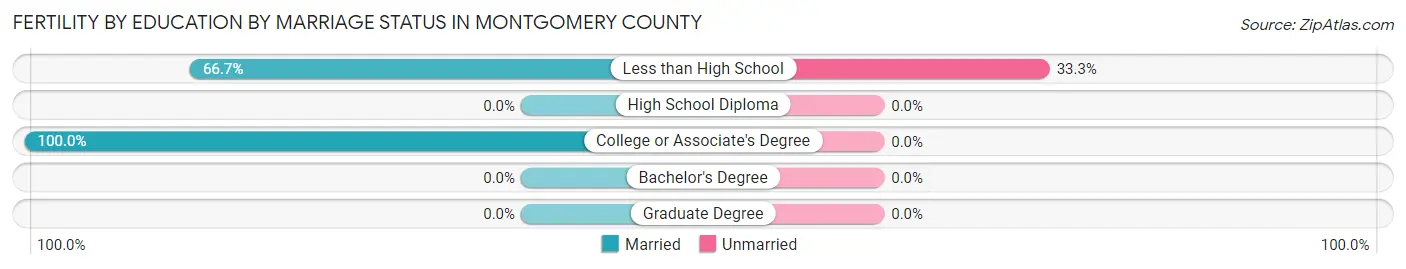
| Educational Attainment | Married | Unmarried |
| Less than High School | 10 (66.7%) | 5 (33.3%) |
| High School Diploma | 0 (0.0%) | 0 (0.0%) |
| College or Associate's Degree | 29 (100.0%) | 0 (0.0%) |
| Bachelor's Degree | 0 (0.0%) | 0 (0.0%) |
| Graduate Degree | 0 (0.0%) | 0 (0.0%) |
| Total | 39 (88.6%) | 5 (11.4%) |
Employment Characteristics in Montgomery County
Employment by Class of Employer in Montgomery County
Among the 3,222 employed individuals in Montgomery County, private company employees (1,934 | 60.0%), self-employed (not incorporated) (329 | 10.2%), and state government employees (289 | 9.0%) make up the most common classes of employment.
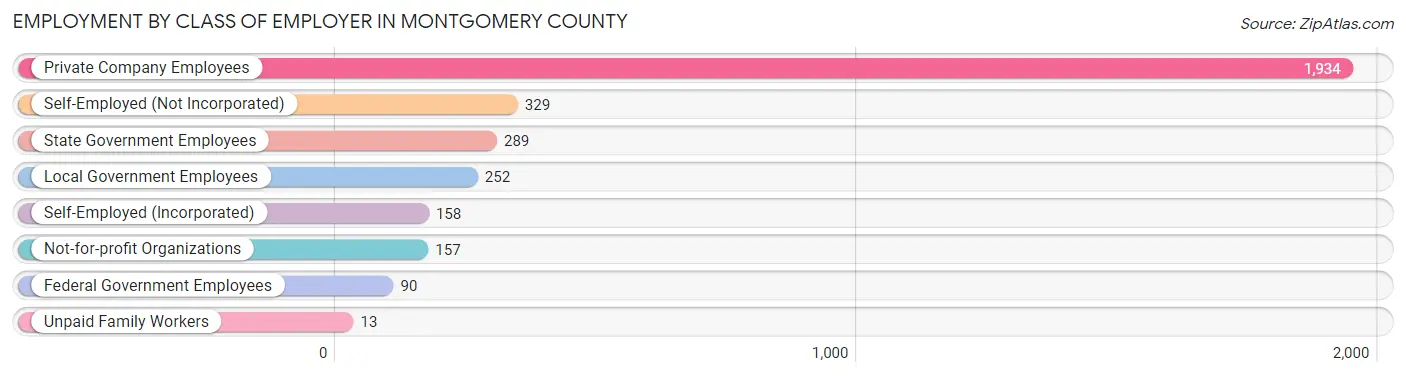
| Employer Class | # Employees | % Employees |
| Private Company Employees | 1,934 | 60.0% |
| Self-Employed (Incorporated) | 158 | 4.9% |
| Self-Employed (Not Incorporated) | 329 | 10.2% |
| Not-for-profit Organizations | 157 | 4.9% |
| Local Government Employees | 252 | 7.8% |
| State Government Employees | 289 | 9.0% |
| Federal Government Employees | 90 | 2.8% |
| Unpaid Family Workers | 13 | 0.4% |
| Total | 3,222 | 100.0% |
Employment Status by Age in Montgomery County
According to the labor force statistics for Montgomery County, out of the total population over 16 years of age (7,227), 48.5% or 3,505 individuals are in the labor force, with 7.3% or 256 of them unemployed. The age group with the highest labor force participation rate is 30 to 34 years, with 82.6% or 352 individuals in the labor force. Within the labor force, the 16 to 19 years age range has the highest percentage of unemployed individuals, with 29.5% or 23 of them being unemployed.
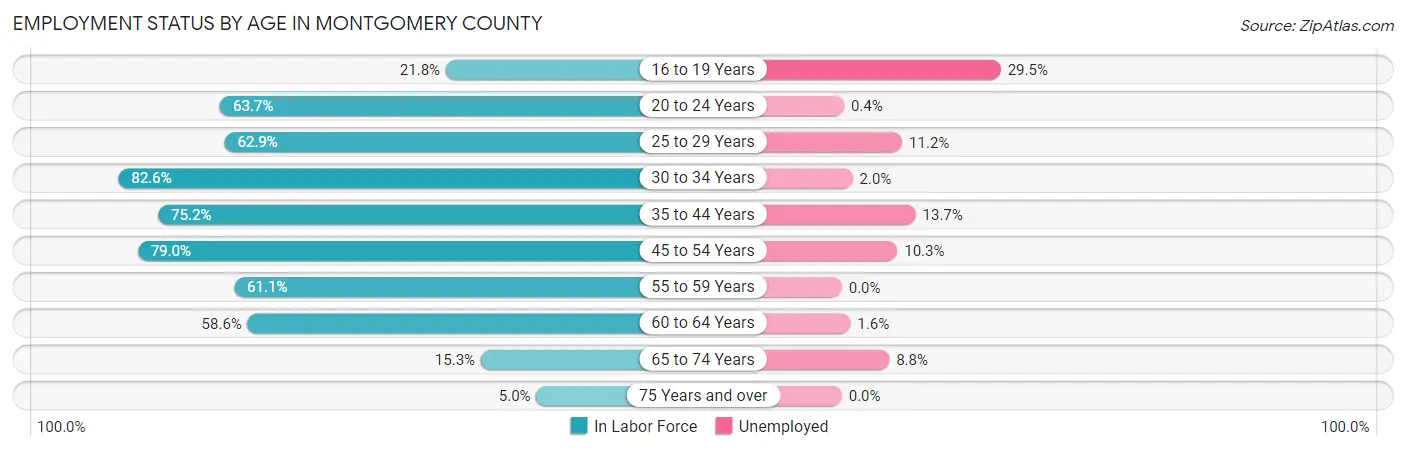
| Age Bracket | In Labor Force | Unemployed |
| 16 to 19 Years | 78 (21.8%) | 23 (29.5%) |
| 20 to 24 Years | 256 (63.7%) | 1 (0.4%) |
| 25 to 29 Years | 276 (62.9%) | 31 (11.2%) |
| 30 to 34 Years | 352 (82.6%) | 7 (2.0%) |
| 35 to 44 Years | 619 (75.2%) | 85 (13.7%) |
| 45 to 54 Years | 800 (79.0%) | 82 (10.3%) |
| 55 to 59 Years | 433 (61.1%) | 0 (0.0%) |
| 60 to 64 Years | 436 (58.6%) | 7 (1.6%) |
| 65 to 74 Years | 204 (15.3%) | 18 (8.8%) |
| 75 Years and over | 49 (5.0%) | 0 (0.0%) |
| Total | 3,505 (48.5%) | 256 (7.3%) |
Employment Status by Educational Attainment in Montgomery County
According to labor force statistics for Montgomery County, 70.2% of individuals (2,916) out of the total population between 25 and 64 years of age (4,154) are in the labor force, with 7.3% or 213 of them being unemployed. The group with the highest labor force participation rate are those with the educational attainment of bachelor's degree or higher, with 77.9% or 491 individuals in the labor force. Within the labor force, individuals with bachelor's degree or higher education have the highest percentage of unemployment, with 14.7% or 72 of them being unemployed.
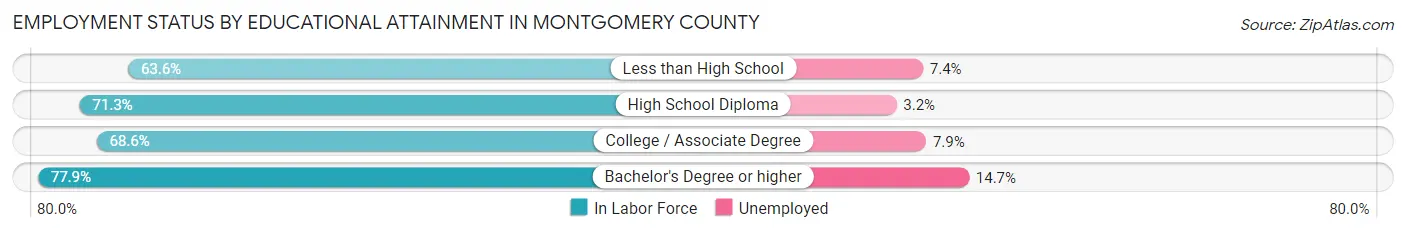
| Educational Attainment | In Labor Force | Unemployed |
| Less than High School | 405 (63.6%) | 47 (7.4%) |
| High School Diploma | 1,062 (71.3%) | 48 (3.2%) |
| College / Associate Degree | 959 (68.6%) | 110 (7.9%) |
| Bachelor's Degree or higher | 491 (77.9%) | 93 (14.7%) |
| Total | 2,916 (70.2%) | 303 (7.3%) |
Employment Occupations by Sex in Montgomery County
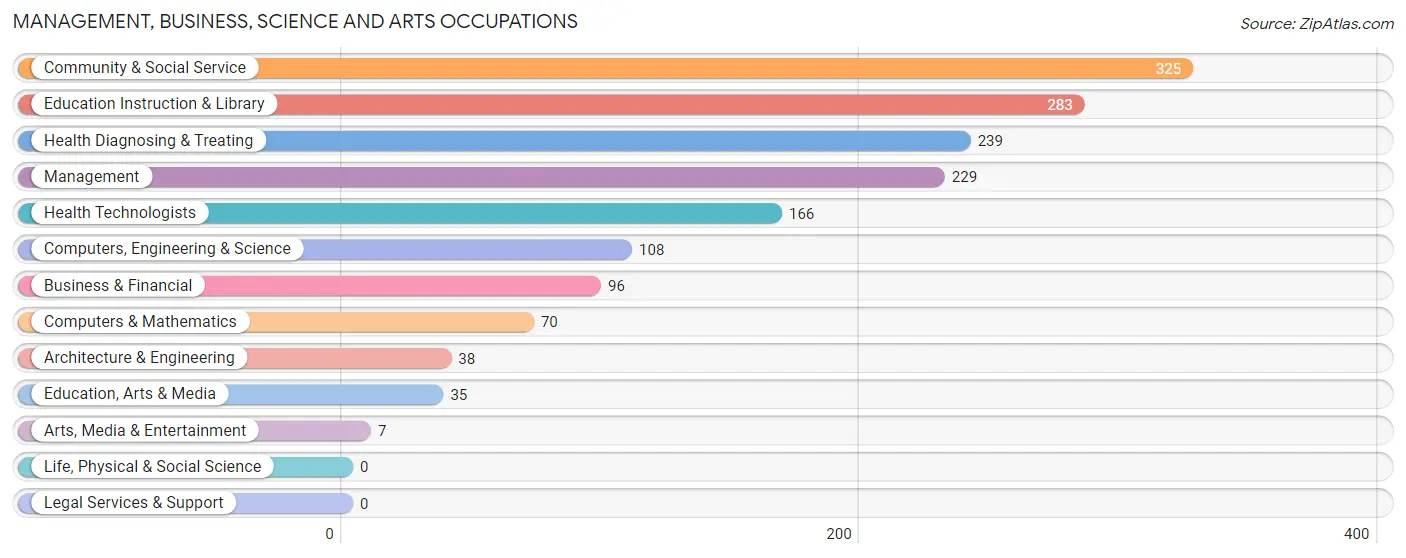
Management, Business, Science and Arts Occupations
The most common Management, Business, Science and Arts occupations in Montgomery County are Community & Social Service (325 | 10.0%), Education Instruction & Library (283 | 8.7%), Health Diagnosing & Treating (239 | 7.4%), Management (229 | 7.0%), and Health Technologists (166 | 5.1%).
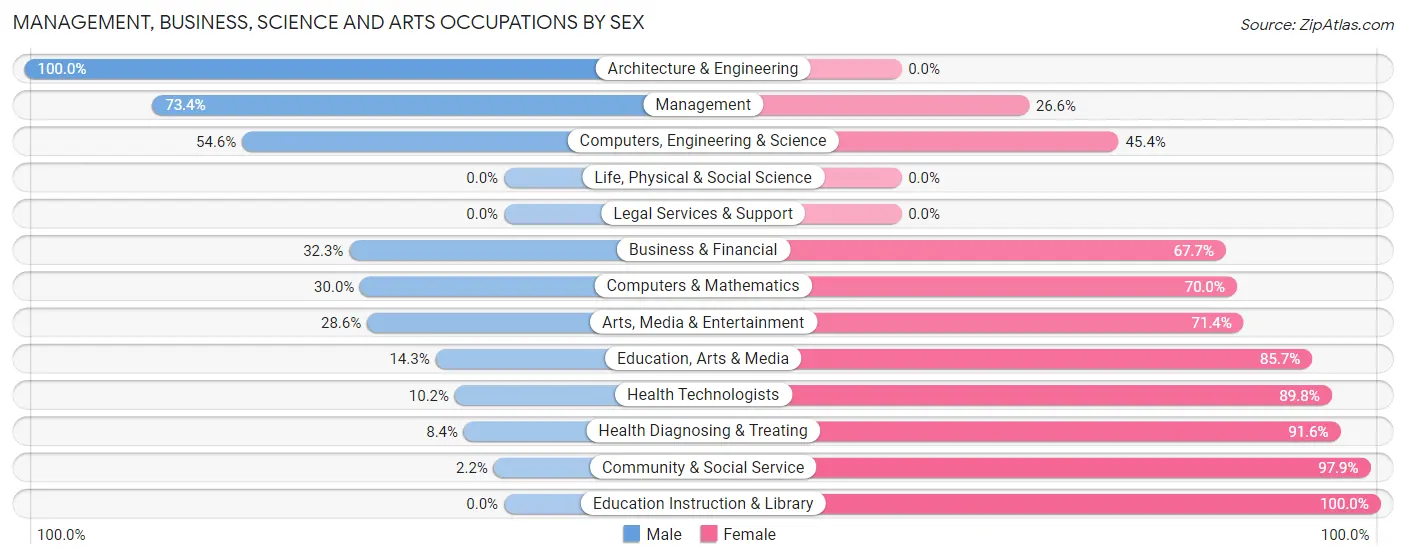
Management, Business, Science and Arts Occupations by Sex
Within the Management, Business, Science and Arts occupations in Montgomery County, the most male-oriented occupations are Architecture & Engineering (100.0%), Management (73.4%), and Computers, Engineering & Science (54.6%), while the most female-oriented occupations are Education Instruction & Library (100.0%), Community & Social Service (97.9%), and Health Diagnosing & Treating (91.6%).
| Occupation | Male | Female |
| Management | 168 (73.4%) | 61 (26.6%) |
| Business & Financial | 31 (32.3%) | 65 (67.7%) |
| Computers, Engineering & Science | 59 (54.6%) | 49 (45.4%) |
| Computers & Mathematics | 21 (30.0%) | 49 (70.0%) |
| Architecture & Engineering | 38 (100.0%) | 0 (0.0%) |
| Life, Physical & Social Science | 0 (0.0%) | 0 (0.0%) |
| Community & Social Service | 7 (2.1%) | 318 (97.9%) |
| Education, Arts & Media | 5 (14.3%) | 30 (85.7%) |
| Legal Services & Support | 0 (0.0%) | 0 (0.0%) |
| Education Instruction & Library | 0 (0.0%) | 283 (100.0%) |
| Arts, Media & Entertainment | 2 (28.6%) | 5 (71.4%) |
| Health Diagnosing & Treating | 20 (8.4%) | 219 (91.6%) |
| Health Technologists | 17 (10.2%) | 149 (89.8%) |
| Total (Category) | 285 (28.6%) | 712 (71.4%) |
| Total (Overall) | 1,562 (48.1%) | 1,687 (51.9%) |
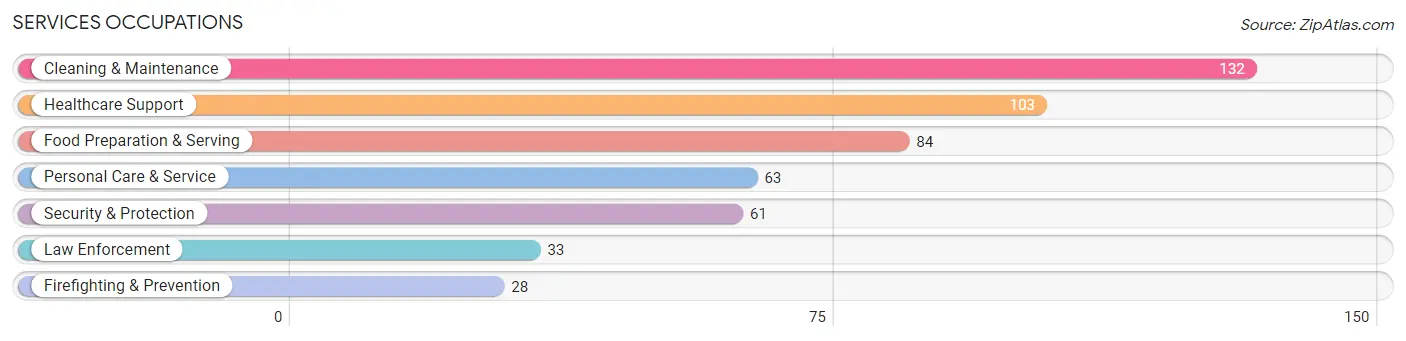
Services Occupations
The most common Services occupations in Montgomery County are Cleaning & Maintenance (132 | 4.1%), Healthcare Support (103 | 3.2%), Food Preparation & Serving (84 | 2.6%), Personal Care & Service (63 | 1.9%), and Security & Protection (61 | 1.9%).
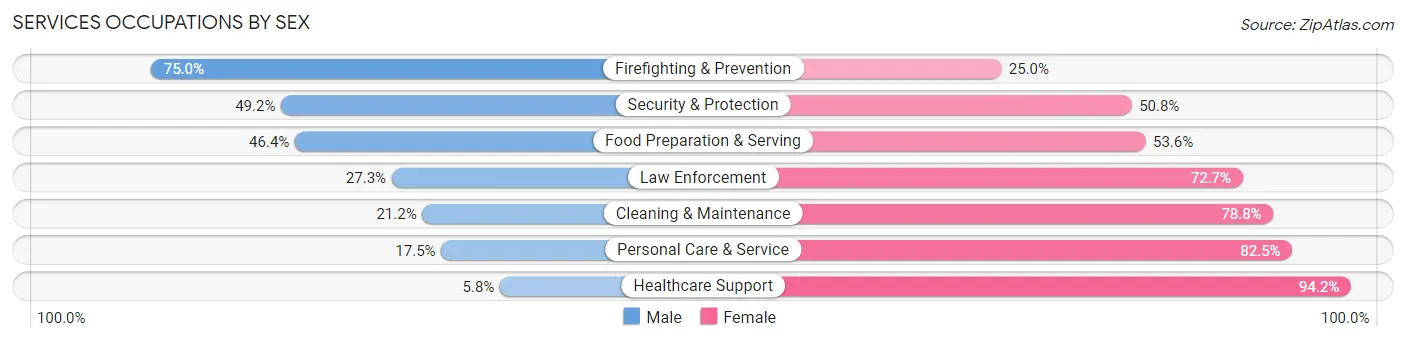
Services Occupations by Sex
Within the Services occupations in Montgomery County, the most male-oriented occupations are Firefighting & Prevention (75.0%), Security & Protection (49.2%), and Food Preparation & Serving (46.4%), while the most female-oriented occupations are Healthcare Support (94.2%), Personal Care & Service (82.5%), and Cleaning & Maintenance (78.8%).
| Occupation | Male | Female |
| Healthcare Support | 6 (5.8%) | 97 (94.2%) |
| Security & Protection | 30 (49.2%) | 31 (50.8%) |
| Firefighting & Prevention | 21 (75.0%) | 7 (25.0%) |
| Law Enforcement | 9 (27.3%) | 24 (72.7%) |
| Food Preparation & Serving | 39 (46.4%) | 45 (53.6%) |
| Cleaning & Maintenance | 28 (21.2%) | 104 (78.8%) |
| Personal Care & Service | 11 (17.5%) | 52 (82.5%) |
| Total (Category) | 114 (25.7%) | 329 (74.3%) |
| Total (Overall) | 1,562 (48.1%) | 1,687 (51.9%) |
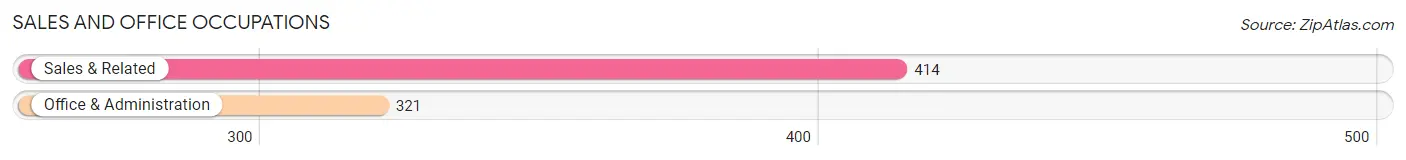
Sales and Office Occupations
The most common Sales and Office occupations in Montgomery County are Sales & Related (414 | 12.7%), and Office & Administration (321 | 9.9%).
Sales and Office Occupations by Sex
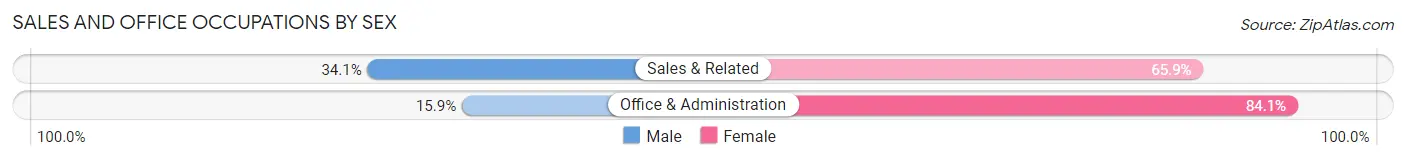
| Occupation | Male | Female |
| Sales & Related | 141 (34.1%) | 273 (65.9%) |
| Office & Administration | 51 (15.9%) | 270 (84.1%) |
| Total (Category) | 192 (26.1%) | 543 (73.9%) |
| Total (Overall) | 1,562 (48.1%) | 1,687 (51.9%) |
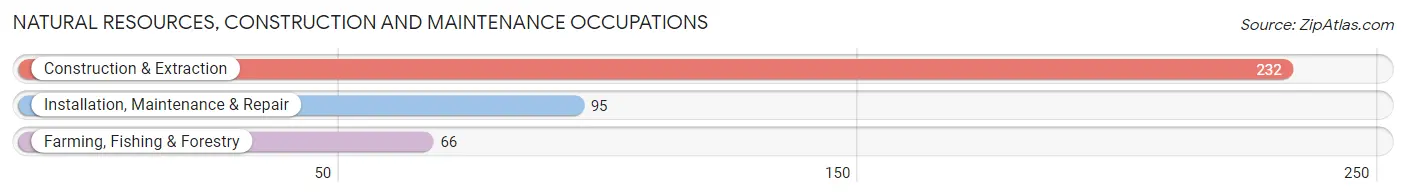
Natural Resources, Construction and Maintenance Occupations
The most common Natural Resources, Construction and Maintenance occupations in Montgomery County are Construction & Extraction (232 | 7.1%), Installation, Maintenance & Repair (95 | 2.9%), and Farming, Fishing & Forestry (66 | 2.0%).
Natural Resources, Construction and Maintenance Occupations by Sex
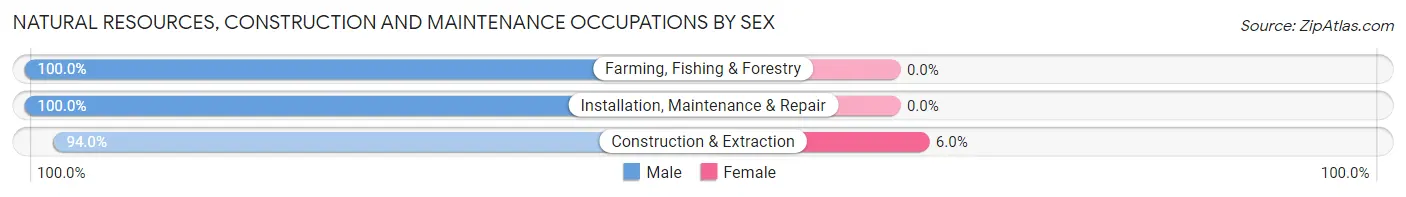
| Occupation | Male | Female |
| Farming, Fishing & Forestry | 66 (100.0%) | 0 (0.0%) |
| Construction & Extraction | 218 (94.0%) | 14 (6.0%) |
| Installation, Maintenance & Repair | 95 (100.0%) | 0 (0.0%) |
| Total (Category) | 379 (96.4%) | 14 (3.6%) |
| Total (Overall) | 1,562 (48.1%) | 1,687 (51.9%) |
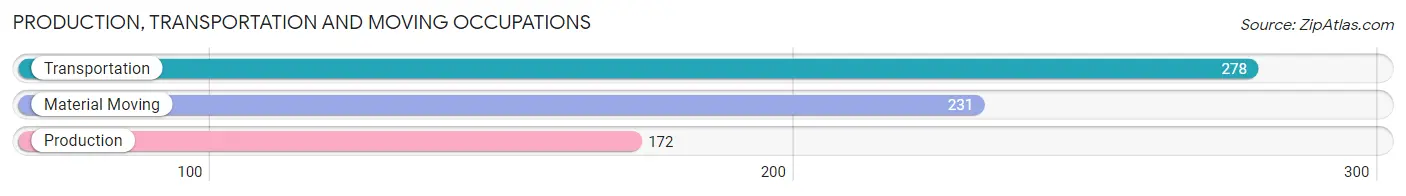
Production, Transportation and Moving Occupations
The most common Production, Transportation and Moving occupations in Montgomery County are Transportation (278 | 8.6%), Material Moving (231 | 7.1%), and Production (172 | 5.3%).
Production, Transportation and Moving Occupations by Sex
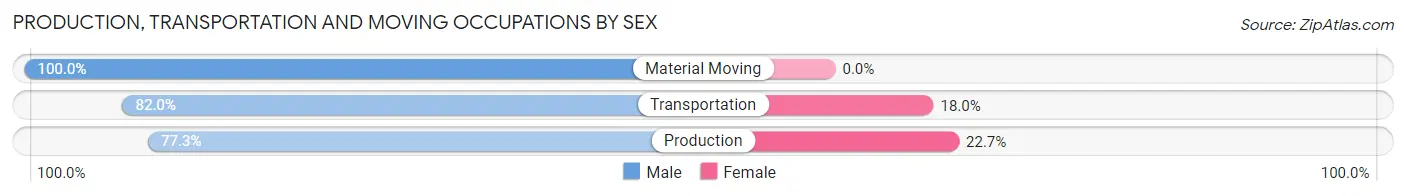
| Occupation | Male | Female |
| Production | 133 (77.3%) | 39 (22.7%) |
| Transportation | 228 (82.0%) | 50 (18.0%) |
| Material Moving | 231 (100.0%) | 0 (0.0%) |
| Total (Category) | 592 (86.9%) | 89 (13.1%) |
| Total (Overall) | 1,562 (48.1%) | 1,687 (51.9%) |
Employment Industries by Sex in Montgomery County
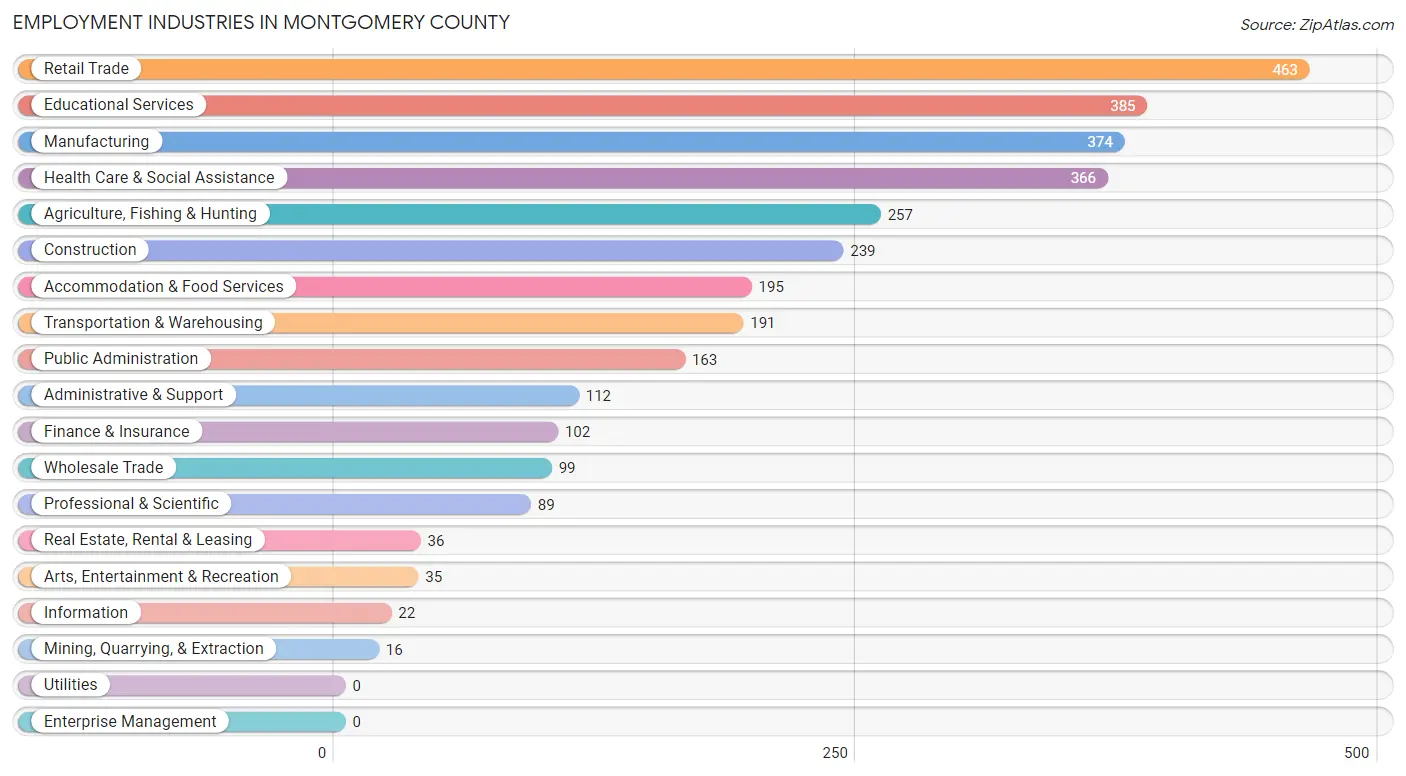
Employment Industries in Montgomery County
The major employment industries in Montgomery County include Retail Trade (463 | 14.2%), Educational Services (385 | 11.8%), Manufacturing (374 | 11.5%), Health Care & Social Assistance (366 | 11.3%), and Agriculture, Fishing & Hunting (257 | 7.9%).
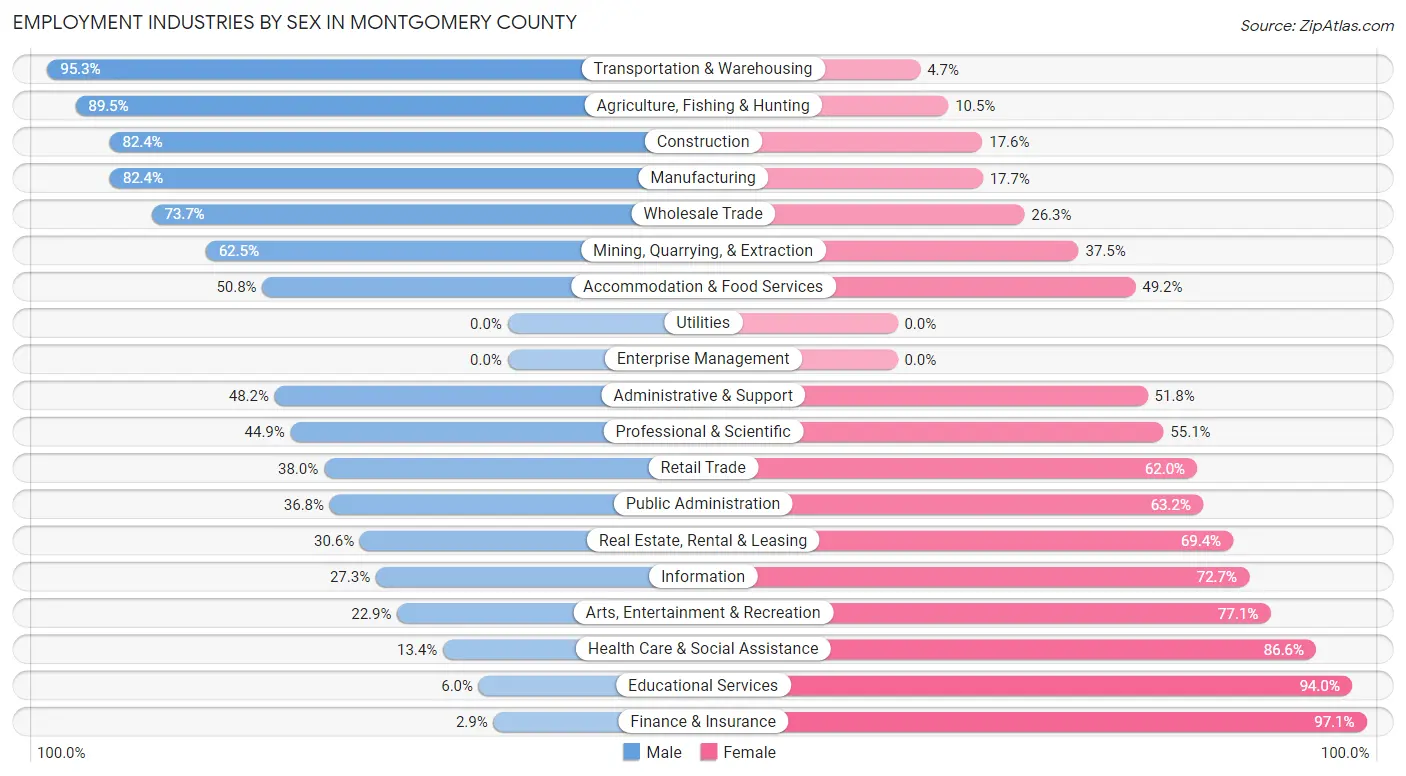
Employment Industries by Sex in Montgomery County
The Montgomery County industries that see more men than women are Transportation & Warehousing (95.3%), Agriculture, Fishing & Hunting (89.5%), and Construction (82.4%), whereas the industries that tend to have a higher number of women are Finance & Insurance (97.1%), Educational Services (94.0%), and Health Care & Social Assistance (86.6%).
| Industry | Male | Female |
| Agriculture, Fishing & Hunting | 230 (89.5%) | 27 (10.5%) |
| Mining, Quarrying, & Extraction | 10 (62.5%) | 6 (37.5%) |
| Construction | 197 (82.4%) | 42 (17.6%) |
| Manufacturing | 308 (82.4%) | 66 (17.6%) |
| Wholesale Trade | 73 (73.7%) | 26 (26.3%) |
| Retail Trade | 176 (38.0%) | 287 (62.0%) |
| Transportation & Warehousing | 182 (95.3%) | 9 (4.7%) |
| Utilities | 0 (0.0%) | 0 (0.0%) |
| Information | 6 (27.3%) | 16 (72.7%) |
| Finance & Insurance | 3 (2.9%) | 99 (97.1%) |
| Real Estate, Rental & Leasing | 11 (30.6%) | 25 (69.4%) |
| Professional & Scientific | 40 (44.9%) | 49 (55.1%) |
| Enterprise Management | 0 (0.0%) | 0 (0.0%) |
| Administrative & Support | 54 (48.2%) | 58 (51.8%) |
| Educational Services | 23 (6.0%) | 362 (94.0%) |
| Health Care & Social Assistance | 49 (13.4%) | 317 (86.6%) |
| Arts, Entertainment & Recreation | 8 (22.9%) | 27 (77.1%) |
| Accommodation & Food Services | 99 (50.8%) | 96 (49.2%) |
| Public Administration | 60 (36.8%) | 103 (63.2%) |
| Total | 1,562 (48.1%) | 1,687 (51.9%) |
Education in Montgomery County
School Enrollment in Montgomery County
The most common levels of schooling among the 1,434 students in Montgomery County are high school (463 | 32.3%), middle school (364 | 25.4%), and elementary school (254 | 17.7%).
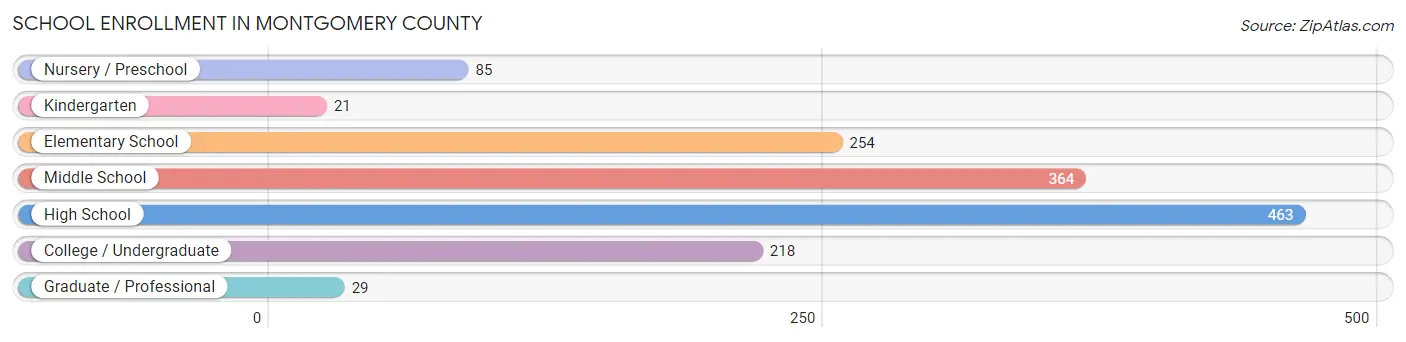
| School Level | # Students | % Students |
| Nursery / Preschool | 85 | 5.9% |
| Kindergarten | 21 | 1.5% |
| Elementary School | 254 | 17.7% |
| Middle School | 364 | 25.4% |
| High School | 463 | 32.3% |
| College / Undergraduate | 218 | 15.2% |
| Graduate / Professional | 29 | 2.0% |
| Total | 1,434 | 100.0% |
School Enrollment by Age by Funding Source in Montgomery County
Out of a total of 1,434 students who are enrolled in schools in Montgomery County, 162 (11.3%) attend a private institution, while the remaining 1,272 (88.7%) are enrolled in public schools. The age group of 3 to 4 year olds has the highest likelihood of being enrolled in private schools, with 7 (36.8% in the age bracket) enrolled. Conversely, the age group of 5 to 9 year old has the lowest likelihood of being enrolled in a private school, with 311 (100.0% in the age bracket) attending a public institution.
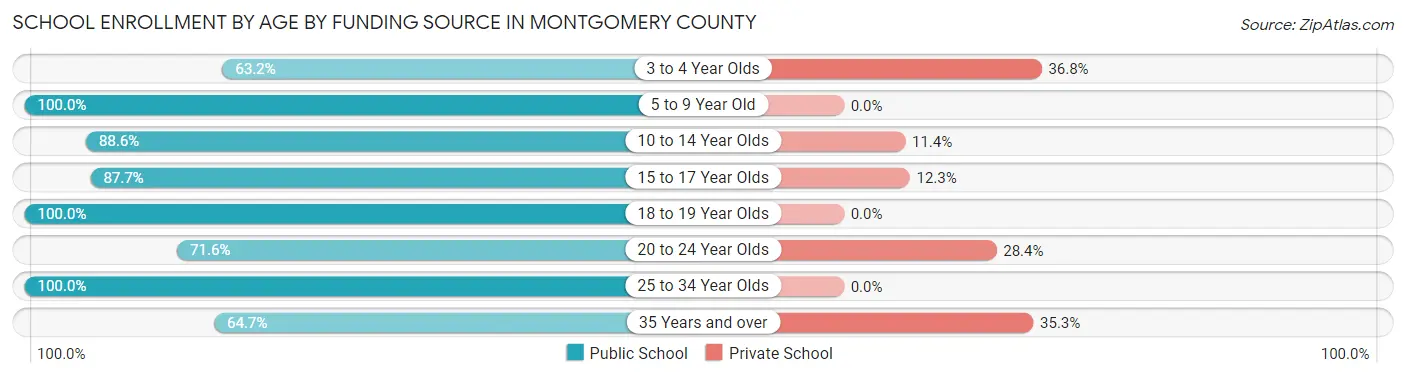
| Age Bracket | Public School | Private School |
| 3 to 4 Year Olds | 12 (63.2%) | 7 (36.8%) |
| 5 to 9 Year Old | 311 (100.0%) | 0 (0.0%) |
| 10 to 14 Year Olds | 434 (88.6%) | 56 (11.4%) |
| 15 to 17 Year Olds | 236 (87.7%) | 33 (12.3%) |
| 18 to 19 Year Olds | 95 (100.0%) | 0 (0.0%) |
| 20 to 24 Year Olds | 136 (71.6%) | 54 (28.4%) |
| 25 to 34 Year Olds | 26 (100.0%) | 0 (0.0%) |
| 35 Years and over | 22 (64.7%) | 12 (35.3%) |
| Total | 1,272 (88.7%) | 162 (11.3%) |
Educational Attainment by Field of Study in Montgomery County
Education (245 | 21.2%), business (206 | 17.8%), bio, nature & agricultural (127 | 11.0%), arts & humanities (113 | 9.8%), and psychology (93 | 8.0%) are the most common fields of study among 1,156 individuals in Montgomery County who have obtained a bachelor's degree or higher.
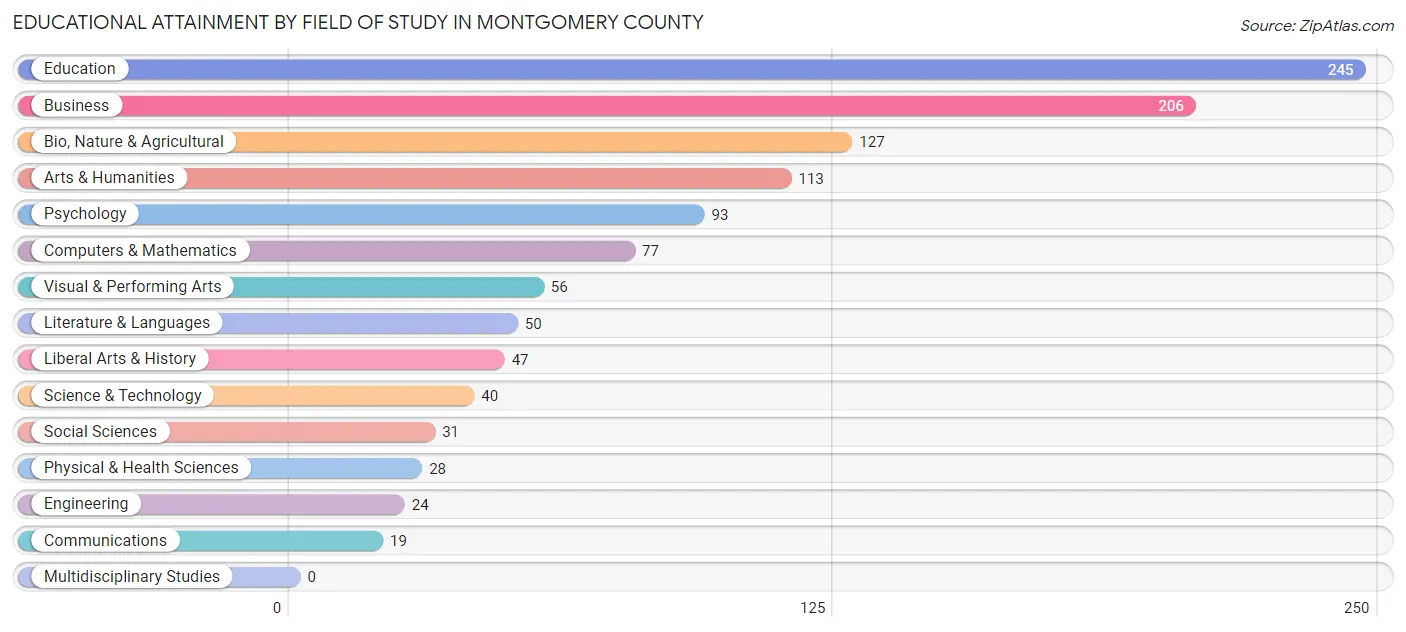
| Field of Study | # Graduates | % Graduates |
| Computers & Mathematics | 77 | 6.7% |
| Bio, Nature & Agricultural | 127 | 11.0% |
| Physical & Health Sciences | 28 | 2.4% |
| Psychology | 93 | 8.0% |
| Social Sciences | 31 | 2.7% |
| Engineering | 24 | 2.1% |
| Multidisciplinary Studies | 0 | 0.0% |
| Science & Technology | 40 | 3.5% |
| Business | 206 | 17.8% |
| Education | 245 | 21.2% |
| Literature & Languages | 50 | 4.3% |
| Liberal Arts & History | 47 | 4.1% |
| Visual & Performing Arts | 56 | 4.8% |
| Communications | 19 | 1.6% |
| Arts & Humanities | 113 | 9.8% |
| Total | 1,156 | 100.0% |
Transportation & Commute in Montgomery County
Vehicle Availability by Sex in Montgomery County
The most prevalent vehicle ownership categories in Montgomery County are males with 2 vehicles (509, accounting for 33.0%) and females with 2 vehicles (600, making up 30.3%).
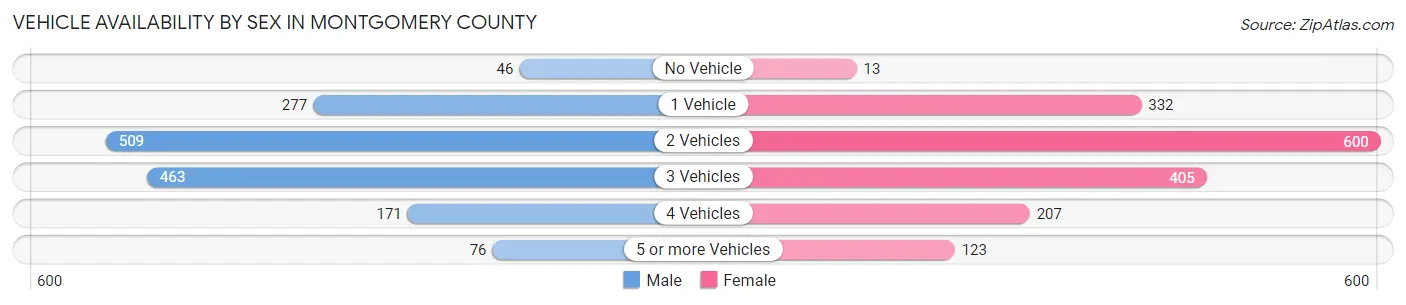
| Vehicles Available | Male | Female |
| No Vehicle | 46 (3.0%) | 13 (0.8%) |
| 1 Vehicle | 277 (18.0%) | 332 (19.8%) |
| 2 Vehicles | 509 (33.0%) | 600 (35.7%) |
| 3 Vehicles | 463 (30.0%) | 405 (24.1%) |
| 4 Vehicles | 171 (11.1%) | 207 (12.3%) |
| 5 or more Vehicles | 76 (4.9%) | 123 (7.3%) |
| Total | 1,542 (100.0%) | 1,680 (100.0%) |
Commute Time in Montgomery County
The most frequently occuring commute durations in Montgomery County are 30 to 34 minutes (477 commuters, 15.4%), 15 to 19 minutes (441 commuters, 14.2%), and 60 to 89 minutes (375 commuters, 12.1%).
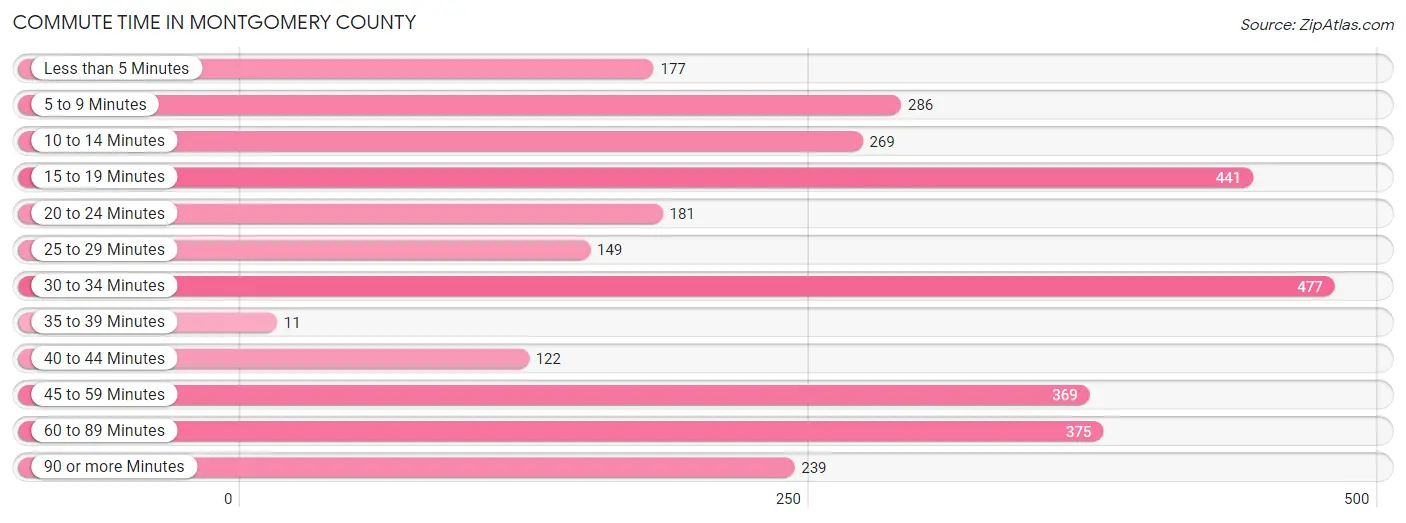
| Commute Time | # Commuters | % Commuters |
| Less than 5 Minutes | 177 | 5.7% |
| 5 to 9 Minutes | 286 | 9.2% |
| 10 to 14 Minutes | 269 | 8.7% |
| 15 to 19 Minutes | 441 | 14.2% |
| 20 to 24 Minutes | 181 | 5.9% |
| 25 to 29 Minutes | 149 | 4.8% |
| 30 to 34 Minutes | 477 | 15.4% |
| 35 to 39 Minutes | 11 | 0.4% |
| 40 to 44 Minutes | 122 | 3.9% |
| 45 to 59 Minutes | 369 | 11.9% |
| 60 to 89 Minutes | 375 | 12.1% |
| 90 or more Minutes | 239 | 7.7% |
Commute Time by Sex in Montgomery County
The most common commute times in Montgomery County are 30 to 34 minutes (293 commuters, 19.4%) for males and 15 to 19 minutes (235 commuters, 14.8%) for females.
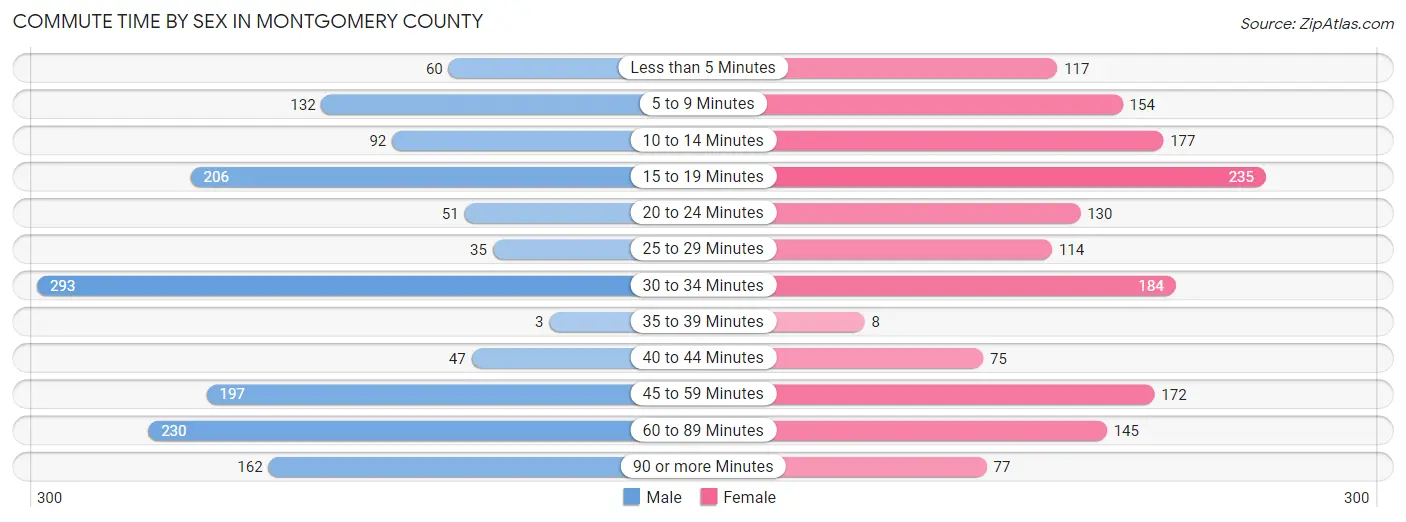
| Commute Time | Male | Female |
| Less than 5 Minutes | 60 (4.0%) | 117 (7.4%) |
| 5 to 9 Minutes | 132 (8.7%) | 154 (9.7%) |
| 10 to 14 Minutes | 92 (6.1%) | 177 (11.2%) |
| 15 to 19 Minutes | 206 (13.7%) | 235 (14.8%) |
| 20 to 24 Minutes | 51 (3.4%) | 130 (8.2%) |
| 25 to 29 Minutes | 35 (2.3%) | 114 (7.2%) |
| 30 to 34 Minutes | 293 (19.4%) | 184 (11.6%) |
| 35 to 39 Minutes | 3 (0.2%) | 8 (0.5%) |
| 40 to 44 Minutes | 47 (3.1%) | 75 (4.7%) |
| 45 to 59 Minutes | 197 (13.1%) | 172 (10.8%) |
| 60 to 89 Minutes | 230 (15.2%) | 145 (9.1%) |
| 90 or more Minutes | 162 (10.7%) | 77 (4.9%) |
Time of Departure to Work by Sex in Montgomery County
The most frequent times of departure to work in Montgomery County are 7:00 AM to 7:29 AM (289, 19.2%) for males and 7:00 AM to 7:29 AM (327, 20.6%) for females.
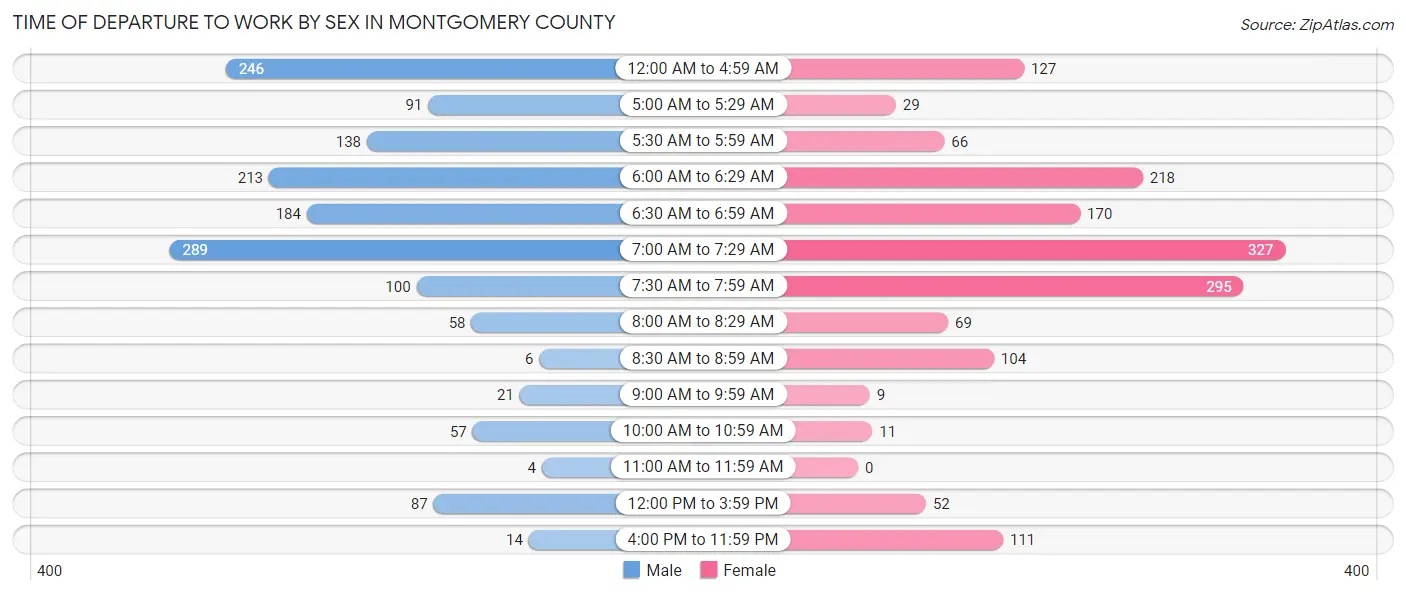
| Time of Departure | Male | Female |
| 12:00 AM to 4:59 AM | 246 (16.3%) | 127 (8.0%) |
| 5:00 AM to 5:29 AM | 91 (6.0%) | 29 (1.8%) |
| 5:30 AM to 5:59 AM | 138 (9.1%) | 66 (4.2%) |
| 6:00 AM to 6:29 AM | 213 (14.1%) | 218 (13.7%) |
| 6:30 AM to 6:59 AM | 184 (12.2%) | 170 (10.7%) |
| 7:00 AM to 7:29 AM | 289 (19.2%) | 327 (20.6%) |
| 7:30 AM to 7:59 AM | 100 (6.6%) | 295 (18.6%) |
| 8:00 AM to 8:29 AM | 58 (3.8%) | 69 (4.3%) |
| 8:30 AM to 8:59 AM | 6 (0.4%) | 104 (6.6%) |
| 9:00 AM to 9:59 AM | 21 (1.4%) | 9 (0.6%) |
| 10:00 AM to 10:59 AM | 57 (3.8%) | 11 (0.7%) |
| 11:00 AM to 11:59 AM | 4 (0.3%) | 0 (0.0%) |
| 12:00 PM to 3:59 PM | 87 (5.8%) | 52 (3.3%) |
| 4:00 PM to 11:59 PM | 14 (0.9%) | 111 (7.0%) |
| Total | 1,508 (100.0%) | 1,588 (100.0%) |
Housing Occupancy in Montgomery County
Occupancy by Ownership in Montgomery County
Of the total 3,589 dwellings in Montgomery County, owner-occupied units account for 2,887 (80.4%), while renter-occupied units make up 702 (19.6%).
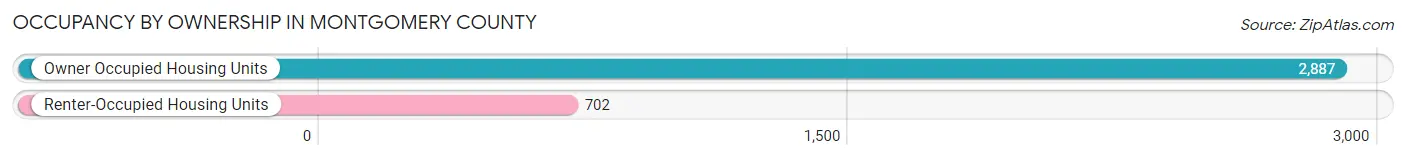
| Occupancy | # Housing Units | % Housing Units |
| Owner Occupied Housing Units | 2,887 | 80.4% |
| Renter-Occupied Housing Units | 702 | 19.6% |
| Total Occupied Housing Units | 3,589 | 100.0% |
Occupancy by Household Size in Montgomery County
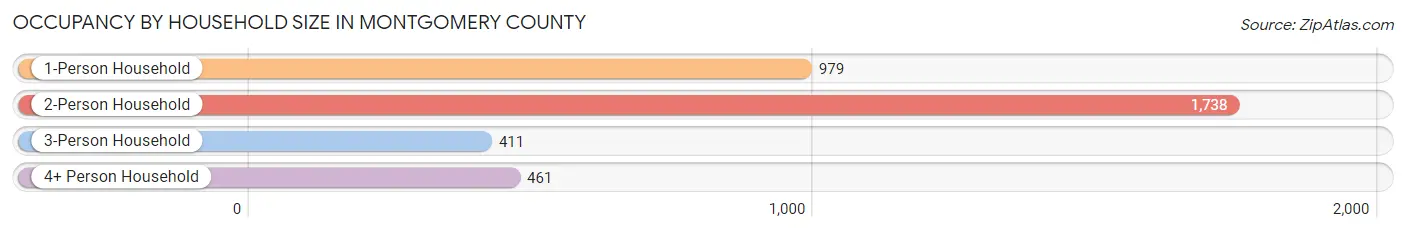
| Household Size | # Housing Units | % Housing Units |
| 1-Person Household | 979 | 27.3% |
| 2-Person Household | 1,738 | 48.4% |
| 3-Person Household | 411 | 11.5% |
| 4+ Person Household | 461 | 12.8% |
| Total Housing Units | 3,589 | 100.0% |
Occupancy by Ownership by Household Size in Montgomery County
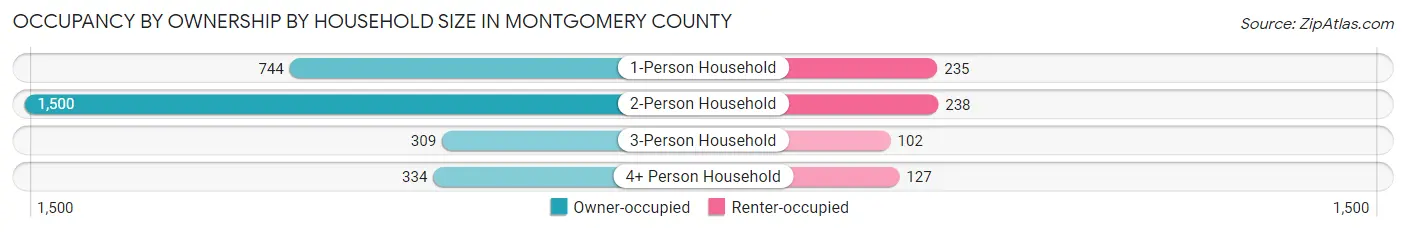
| Household Size | Owner-occupied | Renter-occupied |
| 1-Person Household | 744 (76.0%) | 235 (24.0%) |
| 2-Person Household | 1,500 (86.3%) | 238 (13.7%) |
| 3-Person Household | 309 (75.2%) | 102 (24.8%) |
| 4+ Person Household | 334 (72.5%) | 127 (27.6%) |
| Total Housing Units | 2,887 (80.4%) | 702 (19.6%) |
Occupancy by Educational Attainment in Montgomery County
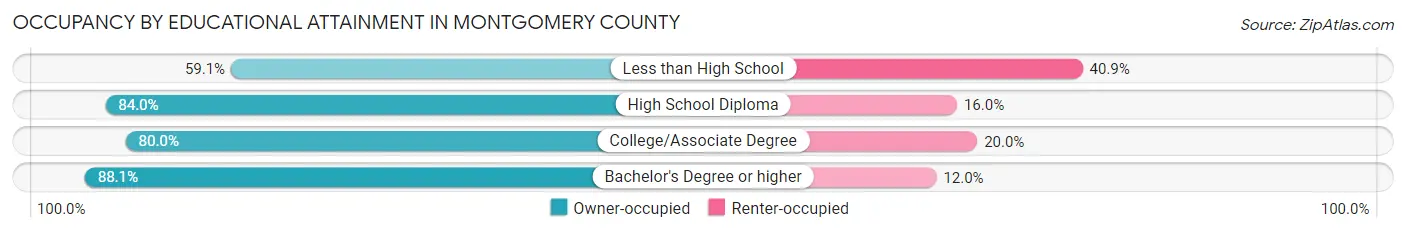
| Household Size | Owner-occupied | Renter-occupied |
| Less than High School | 247 (59.1%) | 171 (40.9%) |
| High School Diploma | 949 (84.0%) | 181 (16.0%) |
| College/Associate Degree | 1,050 (80.0%) | 263 (20.0%) |
| Bachelor's Degree or higher | 641 (88.0%) | 87 (11.9%) |
Occupancy by Age of Householder in Montgomery County
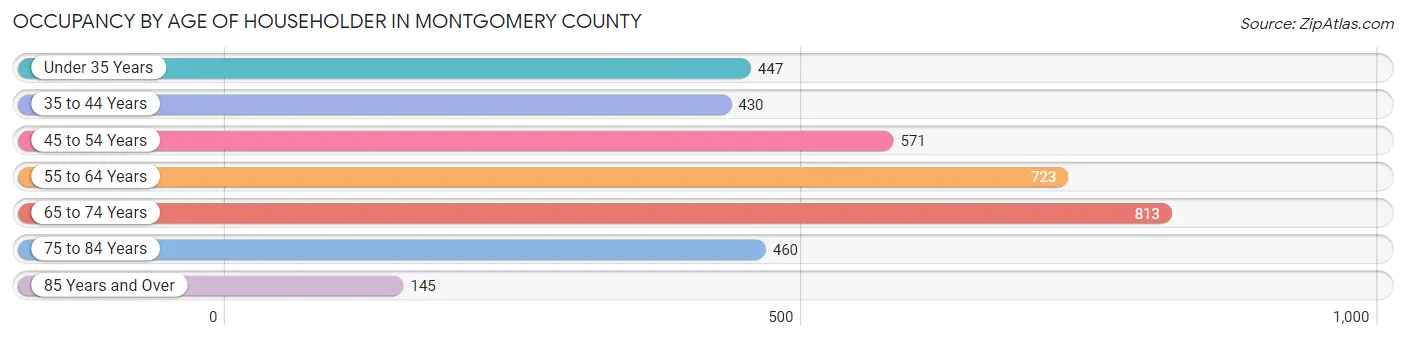
| Age Bracket | # Households | % Households |
| Under 35 Years | 447 | 12.4% |
| 35 to 44 Years | 430 | 12.0% |
| 45 to 54 Years | 571 | 15.9% |
| 55 to 64 Years | 723 | 20.1% |
| 65 to 74 Years | 813 | 22.7% |
| 75 to 84 Years | 460 | 12.8% |
| 85 Years and Over | 145 | 4.0% |
| Total | 3,589 | 100.0% |
Housing Finances in Montgomery County
Median Income by Occupancy in Montgomery County
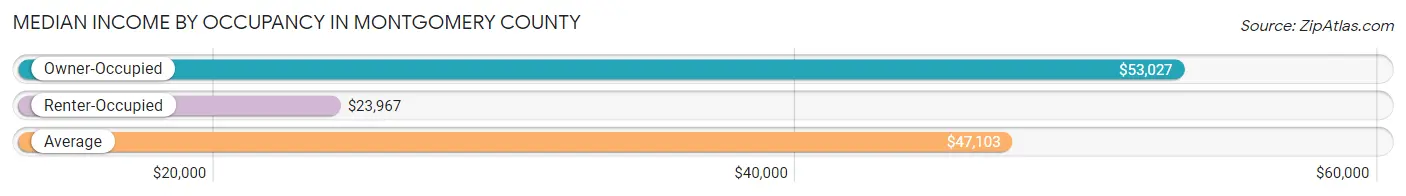
| Occupancy Type | # Households | Median Income |
| Owner-Occupied | 2,887 (80.4%) | $53,027 |
| Renter-Occupied | 702 (19.6%) | $23,967 |
| Average | 3,589 (100.0%) | $47,103 |
Occupancy by Householder Income Bracket in Montgomery County
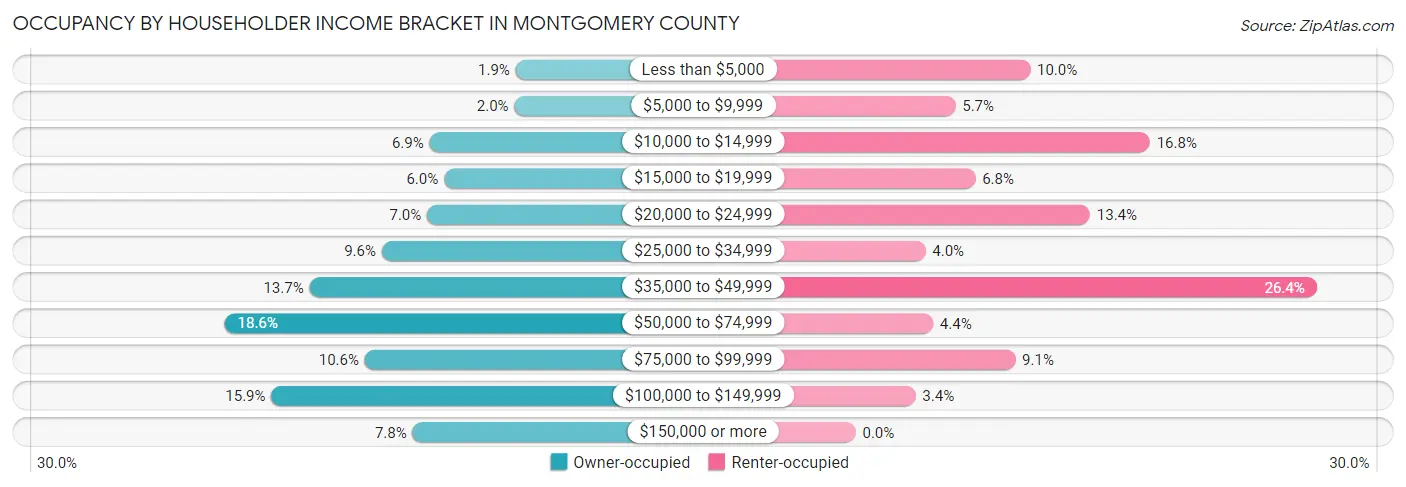
| Income Bracket | Owner-occupied | Renter-occupied |
| Less than $5,000 | 56 (1.9%) | 70 (10.0%) |
| $5,000 to $9,999 | 58 (2.0%) | 40 (5.7%) |
| $10,000 to $14,999 | 198 (6.9%) | 118 (16.8%) |
| $15,000 to $19,999 | 174 (6.0%) | 48 (6.8%) |
| $20,000 to $24,999 | 202 (7.0%) | 94 (13.4%) |
| $25,000 to $34,999 | 277 (9.6%) | 28 (4.0%) |
| $35,000 to $49,999 | 396 (13.7%) | 185 (26.4%) |
| $50,000 to $74,999 | 536 (18.6%) | 31 (4.4%) |
| $75,000 to $99,999 | 305 (10.6%) | 64 (9.1%) |
| $100,000 to $149,999 | 459 (15.9%) | 24 (3.4%) |
| $150,000 or more | 226 (7.8%) | 0 (0.0%) |
| Total | 2,887 (100.0%) | 702 (100.0%) |
Monthly Housing Cost Tiers in Montgomery County
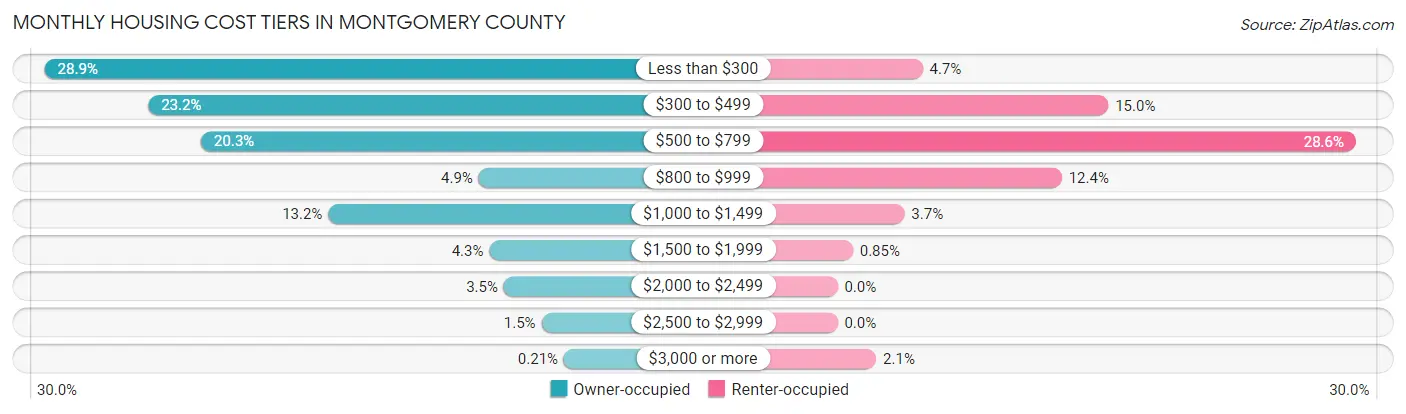
| Monthly Cost | Owner-occupied | Renter-occupied |
| Less than $300 | 834 (28.9%) | 33 (4.7%) |
| $300 to $499 | 669 (23.2%) | 105 (15.0%) |
| $500 to $799 | 585 (20.3%) | 201 (28.6%) |
| $800 to $999 | 142 (4.9%) | 87 (12.4%) |
| $1,000 to $1,499 | 382 (13.2%) | 26 (3.7%) |
| $1,500 to $1,999 | 125 (4.3%) | 6 (0.9%) |
| $2,000 to $2,499 | 102 (3.5%) | 0 (0.0%) |
| $2,500 to $2,999 | 42 (1.5%) | 0 (0.0%) |
| $3,000 or more | 6 (0.2%) | 15 (2.1%) |
| Total | 2,887 (100.0%) | 702 (100.0%) |
Physical Housing Characteristics in Montgomery County
Housing Structures in Montgomery County
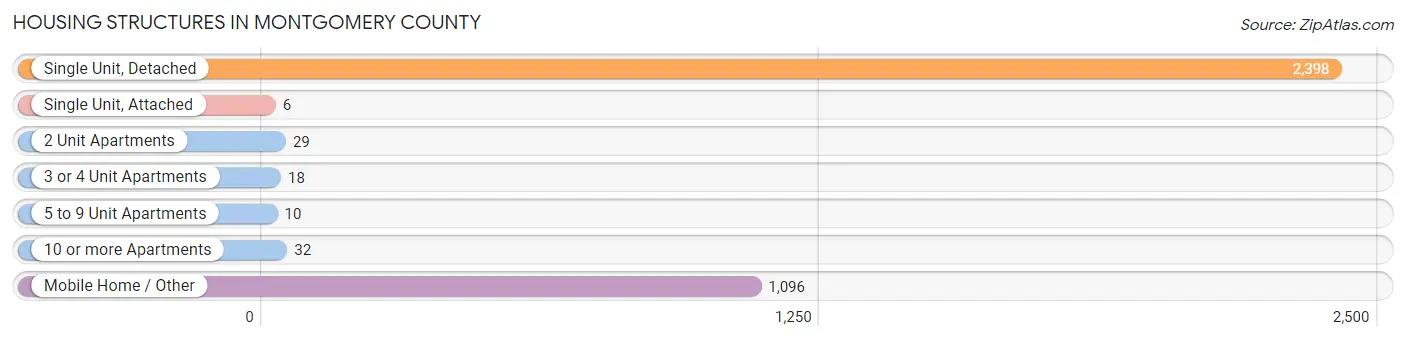
| Structure Type | # Housing Units | % Housing Units |
| Single Unit, Detached | 2,398 | 66.8% |
| Single Unit, Attached | 6 | 0.2% |
| 2 Unit Apartments | 29 | 0.8% |
| 3 or 4 Unit Apartments | 18 | 0.5% |
| 5 to 9 Unit Apartments | 10 | 0.3% |
| 10 or more Apartments | 32 | 0.9% |
| Mobile Home / Other | 1,096 | 30.5% |
| Total | 3,589 | 100.0% |
Housing Structures by Occupancy in Montgomery County
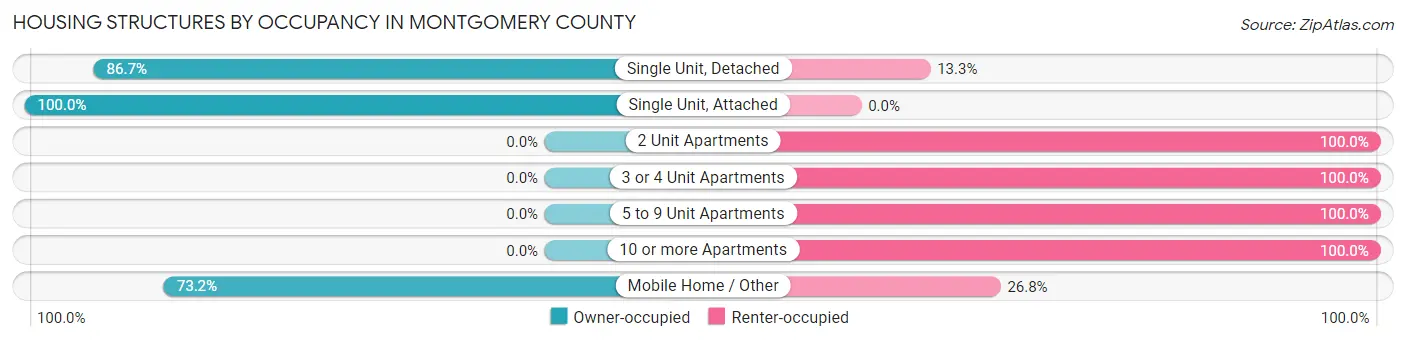
| Structure Type | Owner-occupied | Renter-occupied |
| Single Unit, Detached | 2,079 (86.7%) | 319 (13.3%) |
| Single Unit, Attached | 6 (100.0%) | 0 (0.0%) |
| 2 Unit Apartments | 0 (0.0%) | 29 (100.0%) |
| 3 or 4 Unit Apartments | 0 (0.0%) | 18 (100.0%) |
| 5 to 9 Unit Apartments | 0 (0.0%) | 10 (100.0%) |
| 10 or more Apartments | 0 (0.0%) | 32 (100.0%) |
| Mobile Home / Other | 802 (73.2%) | 294 (26.8%) |
| Total | 2,887 (80.4%) | 702 (19.6%) |
Housing Structures by Number of Rooms in Montgomery County
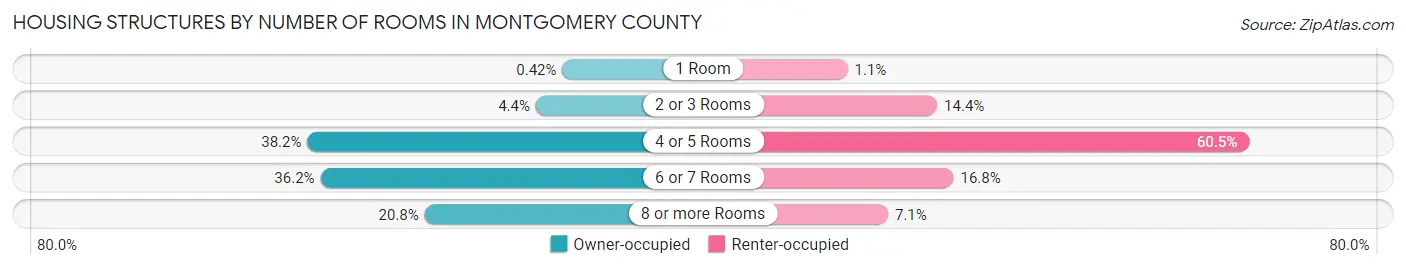
| Number of Rooms | Owner-occupied | Renter-occupied |
| 1 Room | 12 (0.4%) | 8 (1.1%) |
| 2 or 3 Rooms | 126 (4.4%) | 101 (14.4%) |
| 4 or 5 Rooms | 1,102 (38.2%) | 425 (60.5%) |
| 6 or 7 Rooms | 1,046 (36.2%) | 118 (16.8%) |
| 8 or more Rooms | 601 (20.8%) | 50 (7.1%) |
| Total | 2,887 (100.0%) | 702 (100.0%) |
Housing Structure by Heating Type in Montgomery County
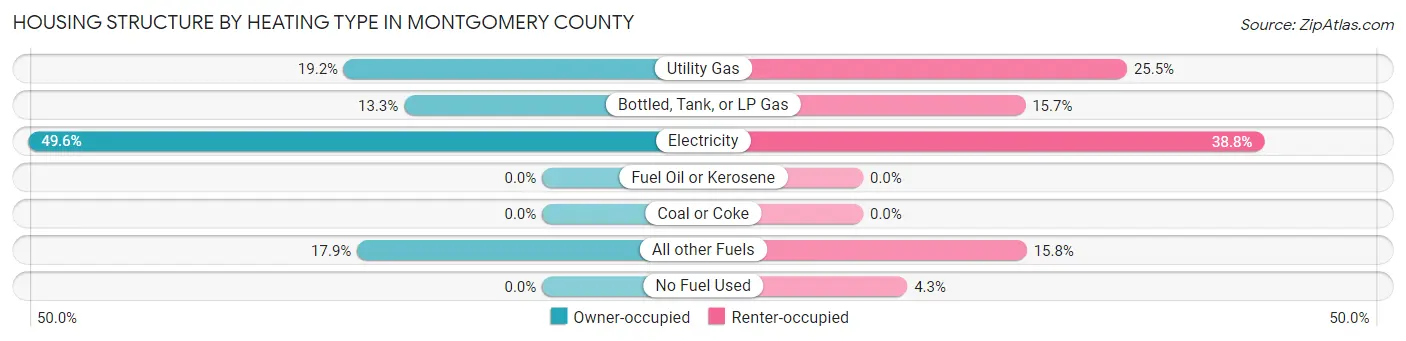
| Heating Type | Owner-occupied | Renter-occupied |
| Utility Gas | 553 (19.2%) | 179 (25.5%) |
| Bottled, Tank, or LP Gas | 385 (13.3%) | 110 (15.7%) |
| Electricity | 1,433 (49.6%) | 272 (38.8%) |
| Fuel Oil or Kerosene | 0 (0.0%) | 0 (0.0%) |
| Coal or Coke | 0 (0.0%) | 0 (0.0%) |
| All other Fuels | 516 (17.9%) | 111 (15.8%) |
| No Fuel Used | 0 (0.0%) | 30 (4.3%) |
| Total | 2,887 (100.0%) | 702 (100.0%) |
Household Vehicle Usage in Montgomery County
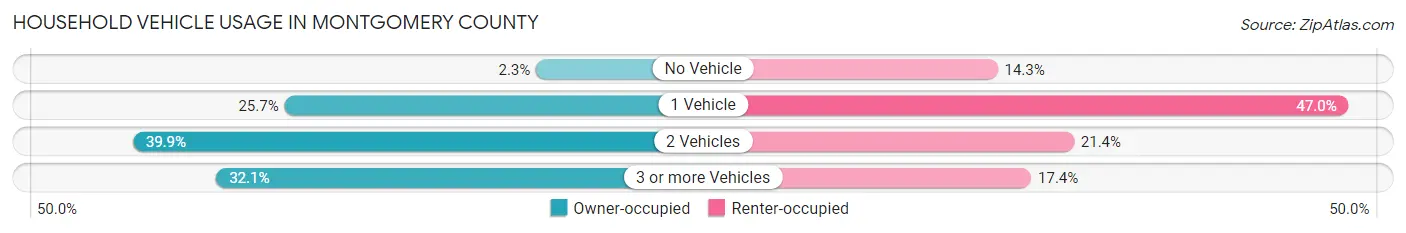
| Vehicles per Household | Owner-occupied | Renter-occupied |
| No Vehicle | 65 (2.2%) | 100 (14.2%) |
| 1 Vehicle | 743 (25.7%) | 330 (47.0%) |
| 2 Vehicles | 1,152 (39.9%) | 150 (21.4%) |
| 3 or more Vehicles | 927 (32.1%) | 122 (17.4%) |
| Total | 2,887 (100.0%) | 702 (100.0%) |
Real Estate & Mortgages in Montgomery County
Real Estate and Mortgage Overview in Montgomery County
| Characteristic | Without Mortgage | With Mortgage |
| Housing Units | 1,821 | 1,066 |
| Median Property Value | $97,700 | $180,600 |
| Median Household Income | $42,019 | $122 |
| Monthly Housing Costs | $318 | $6 |
| Real Estate Taxes | $386 | $106 |
Property Value by Mortgage Status in Montgomery County
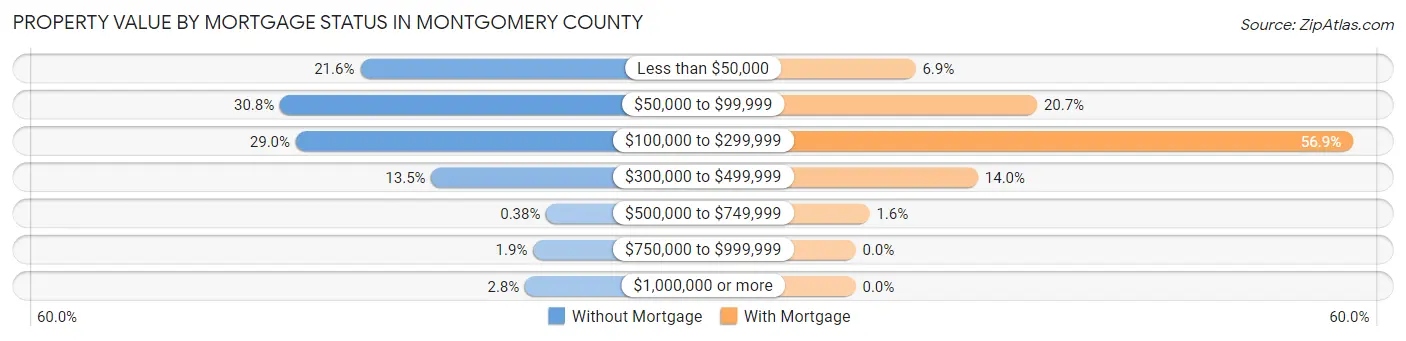
| Property Value | Without Mortgage | With Mortgage |
| Less than $50,000 | 394 (21.6%) | 73 (6.9%) |
| $50,000 to $99,999 | 561 (30.8%) | 221 (20.7%) |
| $100,000 to $299,999 | 528 (29.0%) | 606 (56.9%) |
| $300,000 to $499,999 | 246 (13.5%) | 149 (14.0%) |
| $500,000 to $749,999 | 7 (0.4%) | 17 (1.6%) |
| $750,000 to $999,999 | 34 (1.9%) | 0 (0.0%) |
| $1,000,000 or more | 51 (2.8%) | 0 (0.0%) |
| Total | 1,821 (100.0%) | 1,066 (100.0%) |
Household Income by Mortgage Status in Montgomery County
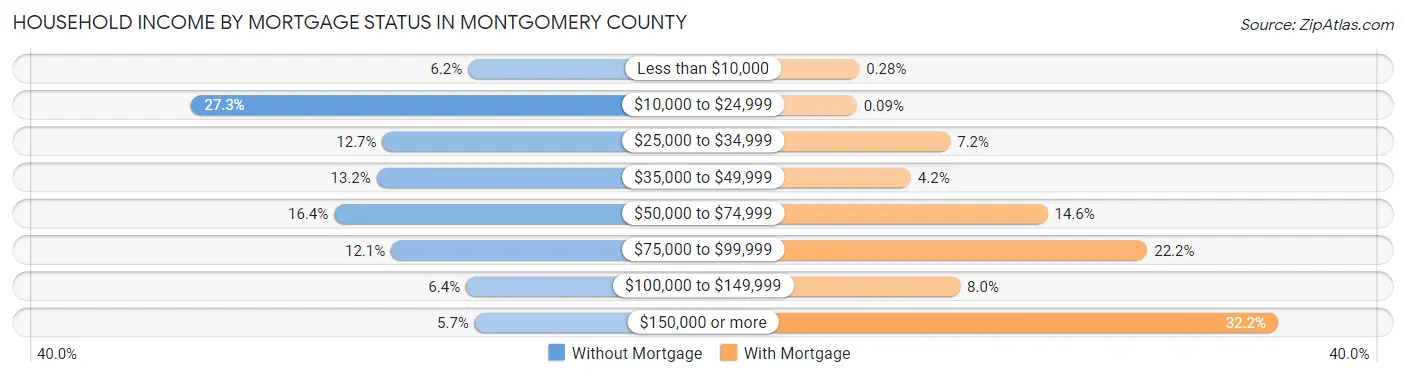
| Household Income | Without Mortgage | With Mortgage |
| Less than $10,000 | 113 (6.2%) | 3 (0.3%) |
| $10,000 to $24,999 | 497 (27.3%) | 1 (0.1%) |
| $25,000 to $34,999 | 232 (12.7%) | 77 (7.2%) |
| $35,000 to $49,999 | 240 (13.2%) | 45 (4.2%) |
| $50,000 to $74,999 | 299 (16.4%) | 156 (14.6%) |
| $75,000 to $99,999 | 220 (12.1%) | 237 (22.2%) |
| $100,000 to $149,999 | 116 (6.4%) | 85 (8.0%) |
| $150,000 or more | 104 (5.7%) | 343 (32.2%) |
| Total | 1,821 (100.0%) | 1,066 (100.0%) |
Property Value to Household Income Ratio in Montgomery County
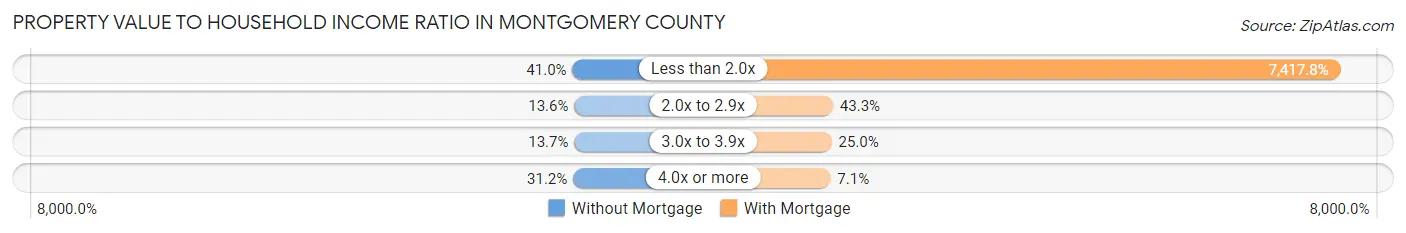
| Value-to-Income Ratio | Without Mortgage | With Mortgage |
| Less than 2.0x | 747 (41.0%) | 79,074 (7,417.8%) |
| 2.0x to 2.9x | 248 (13.6%) | 462 (43.3%) |
| 3.0x to 3.9x | 250 (13.7%) | 266 (24.9%) |
| 4.0x or more | 568 (31.2%) | 76 (7.1%) |
| Total | 1,821 (100.0%) | 1,066 (100.0%) |
Real Estate Taxes by Mortgage Status in Montgomery County
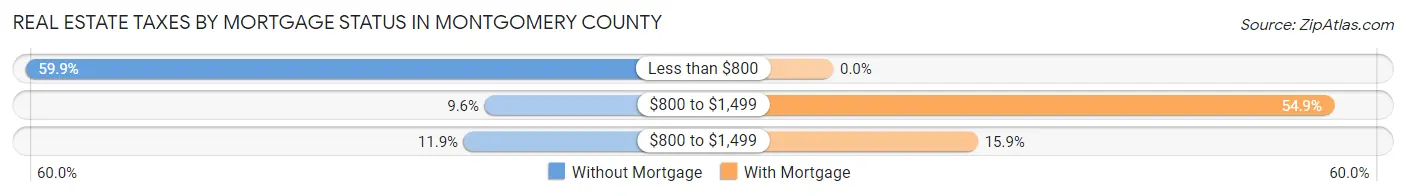
| Property Taxes | Without Mortgage | With Mortgage |
| Less than $800 | 1,091 (59.9%) | 0 (0.0%) |
| $800 to $1,499 | 174 (9.6%) | 585 (54.9%) |
| $800 to $1,499 | 216 (11.9%) | 169 (15.9%) |
| Total | 1,821 (100.0%) | 1,066 (100.0%) |
Health & Disability in Montgomery County
Health Insurance Coverage by Age in Montgomery County
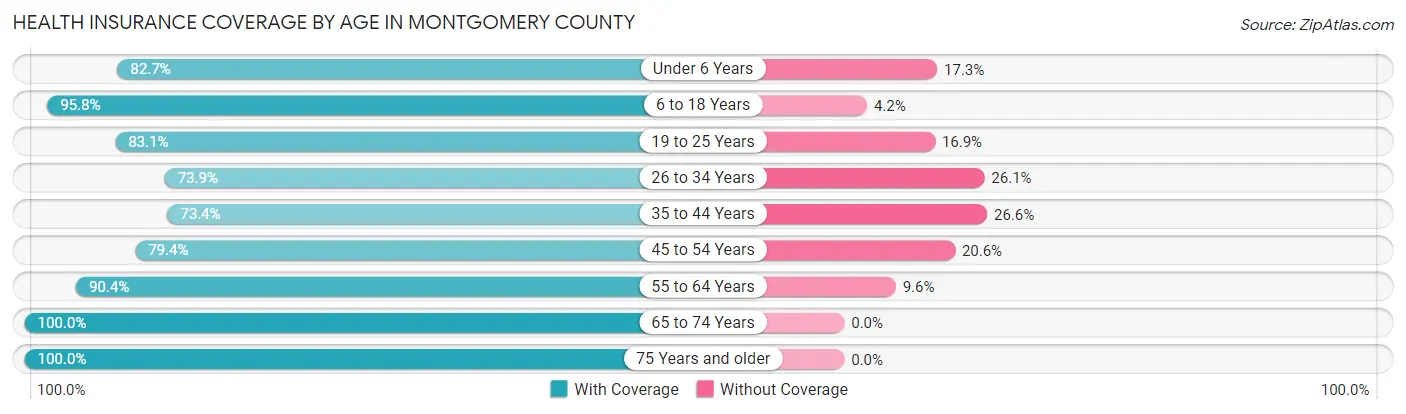
| Age Bracket | With Coverage | Without Coverage |
| Under 6 Years | 387 (82.7%) | 81 (17.3%) |
| 6 to 18 Years | 1,088 (95.8%) | 48 (4.2%) |
| 19 to 25 Years | 482 (83.1%) | 98 (16.9%) |
| 26 to 34 Years | 554 (73.9%) | 196 (26.1%) |
| 35 to 44 Years | 598 (73.4%) | 217 (26.6%) |
| 45 to 54 Years | 804 (79.4%) | 209 (20.6%) |
| 55 to 64 Years | 1,301 (90.4%) | 138 (9.6%) |
| 65 to 74 Years | 1,323 (100.0%) | 0 (0.0%) |
| 75 Years and older | 903 (100.0%) | 0 (0.0%) |
| Total | 7,440 (88.3%) | 987 (11.7%) |
Health Insurance Coverage by Citizenship Status in Montgomery County
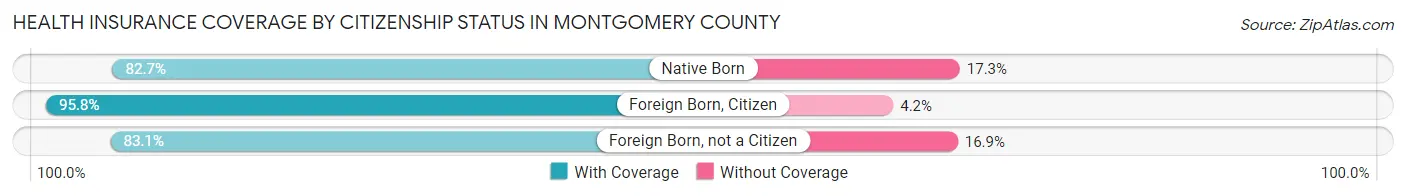
| Citizenship Status | With Coverage | Without Coverage |
| Native Born | 387 (82.7%) | 81 (17.3%) |
| Foreign Born, Citizen | 1,088 (95.8%) | 48 (4.2%) |
| Foreign Born, not a Citizen | 482 (83.1%) | 98 (16.9%) |
Health Insurance Coverage by Household Income in Montgomery County
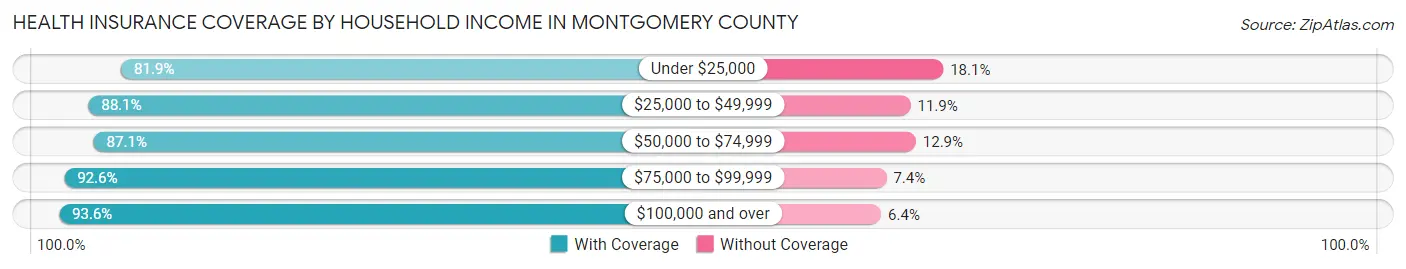
| Household Income | With Coverage | Without Coverage |
| Under $25,000 | 1,533 (81.9%) | 338 (18.1%) |
| $25,000 to $49,999 | 1,689 (88.1%) | 229 (11.9%) |
| $50,000 to $74,999 | 1,500 (87.1%) | 223 (12.9%) |
| $75,000 to $99,999 | 872 (92.6%) | 70 (7.4%) |
| $100,000 and over | 1,846 (93.6%) | 127 (6.4%) |
Public vs Private Health Insurance Coverage by Age in Montgomery County
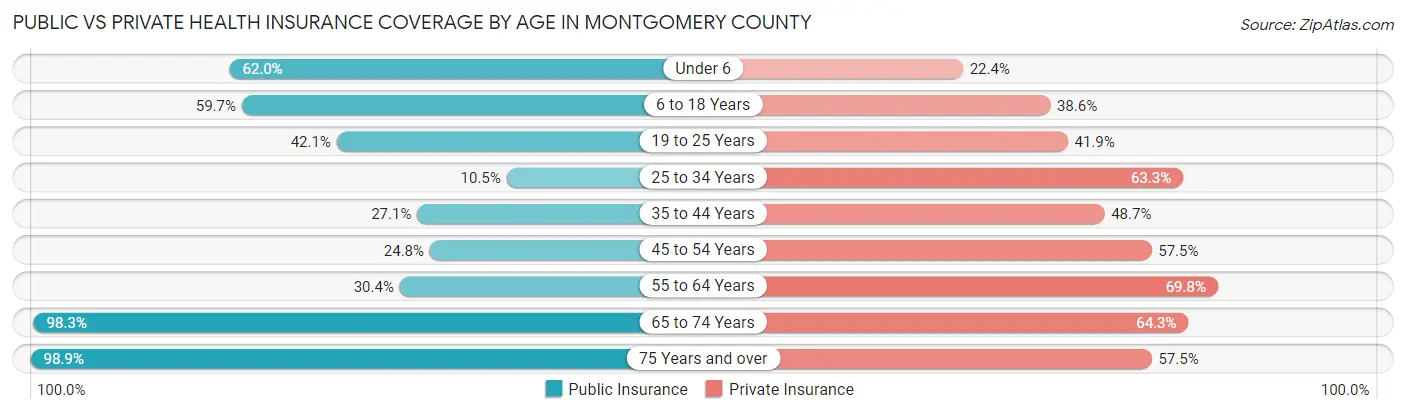
| Age Bracket | Public Insurance | Private Insurance |
| Under 6 | 290 (62.0%) | 105 (22.4%) |
| 6 to 18 Years | 678 (59.7%) | 439 (38.6%) |
| 19 to 25 Years | 244 (42.1%) | 243 (41.9%) |
| 25 to 34 Years | 79 (10.5%) | 475 (63.3%) |
| 35 to 44 Years | 221 (27.1%) | 397 (48.7%) |
| 45 to 54 Years | 251 (24.8%) | 582 (57.5%) |
| 55 to 64 Years | 437 (30.4%) | 1,004 (69.8%) |
| 65 to 74 Years | 1,301 (98.3%) | 851 (64.3%) |
| 75 Years and over | 893 (98.9%) | 519 (57.5%) |
| Total | 4,394 (52.1%) | 4,615 (54.8%) |
Disability Status by Sex by Age in Montgomery County
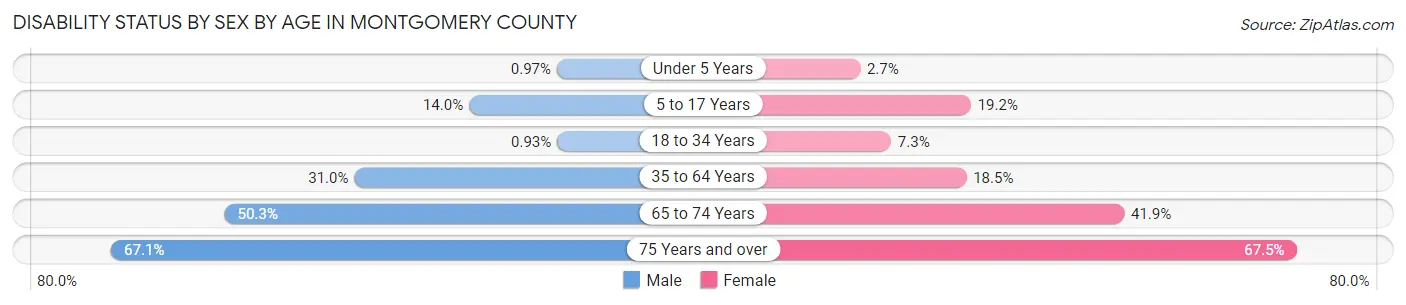
| Age Bracket | Male | Female |
| Under 5 Years | 2 (1.0%) | 5 (2.7%) |
| 5 to 17 Years | 93 (14.0%) | 90 (19.2%) |
| 18 to 34 Years | 7 (0.9%) | 48 (7.3%) |
| 35 to 64 Years | 505 (31.0%) | 303 (18.5%) |
| 65 to 74 Years | 333 (50.3%) | 277 (41.9%) |
| 75 Years and over | 284 (67.1%) | 324 (67.5%) |
Disability Class by Sex by Age in Montgomery County
Disability Class: Hearing Difficulty
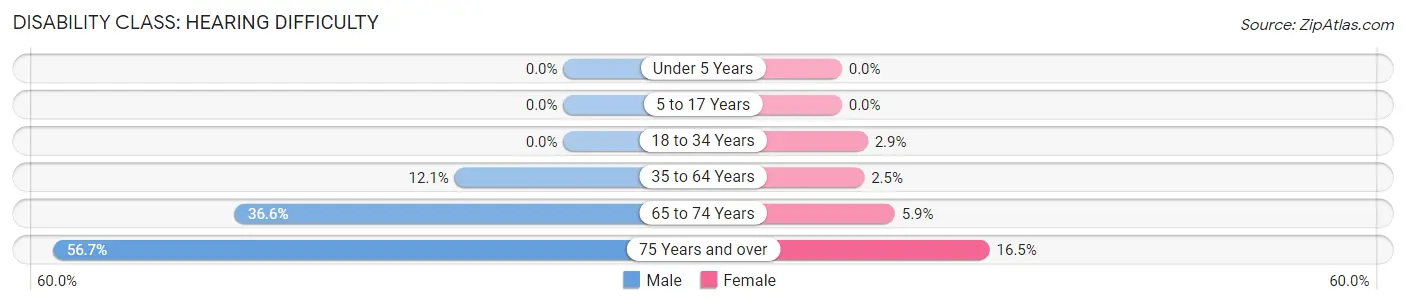
| Age Bracket | Male | Female |
| Under 5 Years | 0 (0.0%) | 0 (0.0%) |
| 5 to 17 Years | 0 (0.0%) | 0 (0.0%) |
| 18 to 34 Years | 0 (0.0%) | 19 (2.9%) |
| 35 to 64 Years | 197 (12.1%) | 41 (2.5%) |
| 65 to 74 Years | 242 (36.6%) | 39 (5.9%) |
| 75 Years and over | 240 (56.7%) | 79 (16.5%) |
Disability Class: Vision Difficulty
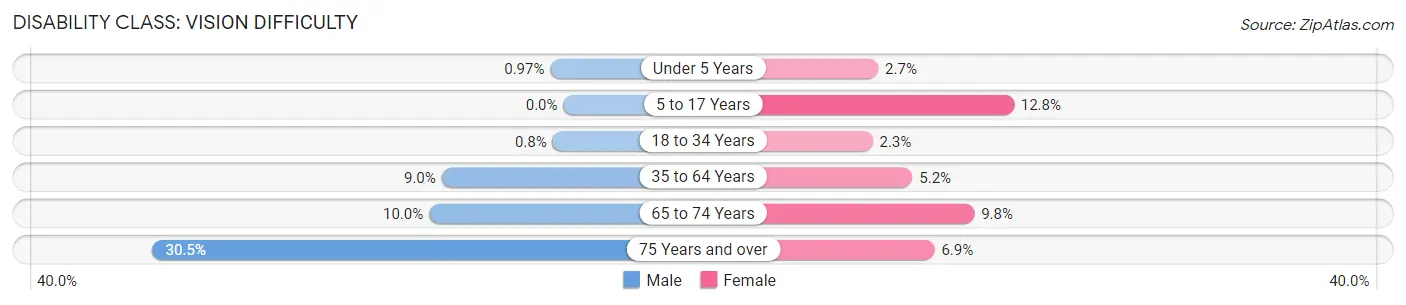
| Age Bracket | Male | Female |
| Under 5 Years | 2 (1.0%) | 5 (2.7%) |
| 5 to 17 Years | 0 (0.0%) | 60 (12.8%) |
| 18 to 34 Years | 6 (0.8%) | 15 (2.3%) |
| 35 to 64 Years | 147 (9.0%) | 86 (5.2%) |
| 65 to 74 Years | 66 (10.0%) | 65 (9.8%) |
| 75 Years and over | 129 (30.5%) | 33 (6.9%) |
Disability Class: Cognitive Difficulty
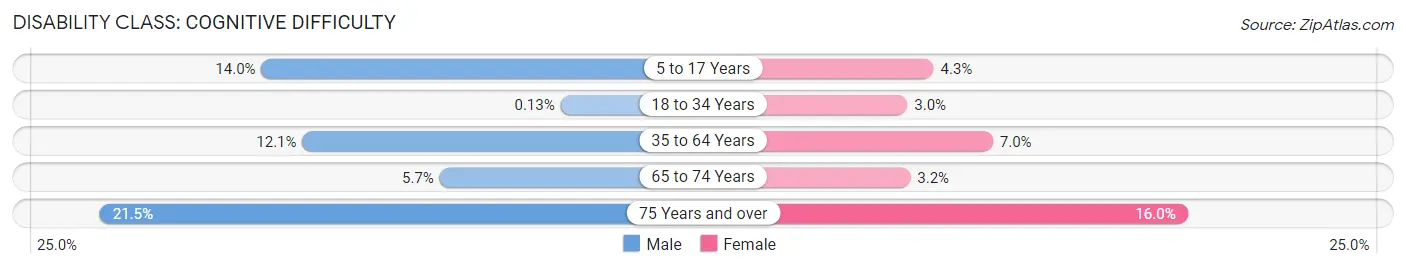
| Age Bracket | Male | Female |
| 5 to 17 Years | 93 (14.0%) | 20 (4.3%) |
| 18 to 34 Years | 1 (0.1%) | 20 (3.0%) |
| 35 to 64 Years | 197 (12.1%) | 115 (7.0%) |
| 65 to 74 Years | 38 (5.7%) | 21 (3.2%) |
| 75 Years and over | 91 (21.5%) | 77 (16.0%) |
Disability Class: Ambulatory Difficulty
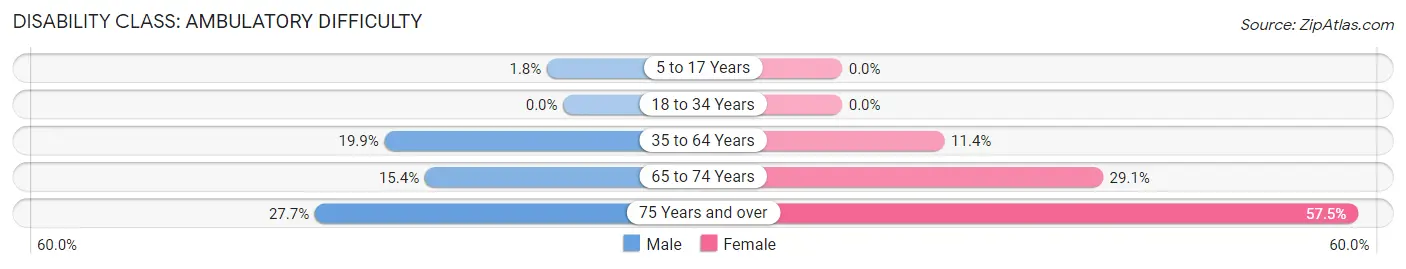
| Age Bracket | Male | Female |
| 5 to 17 Years | 12 (1.8%) | 0 (0.0%) |
| 18 to 34 Years | 0 (0.0%) | 0 (0.0%) |
| 35 to 64 Years | 324 (19.9%) | 187 (11.4%) |
| 65 to 74 Years | 102 (15.4%) | 192 (29.0%) |
| 75 Years and over | 117 (27.7%) | 276 (57.5%) |
Disability Class: Self-Care Difficulty
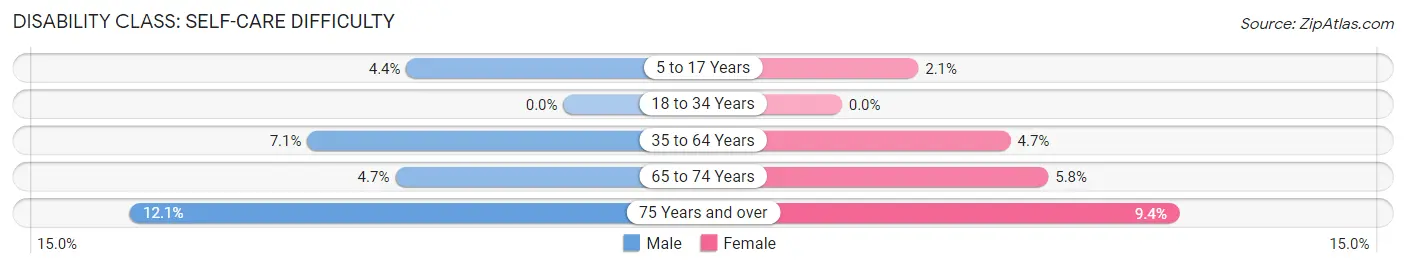
| Age Bracket | Male | Female |
| 5 to 17 Years | 29 (4.4%) | 10 (2.1%) |
| 18 to 34 Years | 0 (0.0%) | 0 (0.0%) |
| 35 to 64 Years | 116 (7.1%) | 77 (4.7%) |
| 65 to 74 Years | 31 (4.7%) | 38 (5.8%) |
| 75 Years and over | 51 (12.1%) | 45 (9.4%) |
Technology Access in Montgomery County
Computing Device Access in Montgomery County
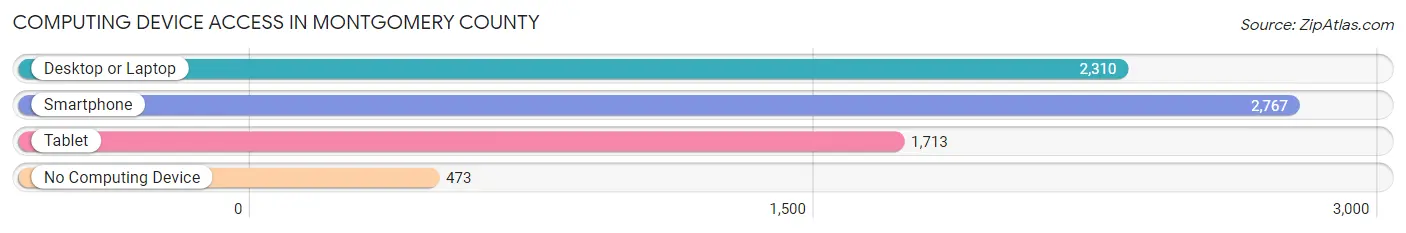
| Device Type | # Households | % Households |
| Desktop or Laptop | 2,310 | 64.4% |
| Smartphone | 2,767 | 77.1% |
| Tablet | 1,713 | 47.7% |
| No Computing Device | 473 | 13.2% |
| Total | 3,589 | 100.0% |
Internet Access in Montgomery County
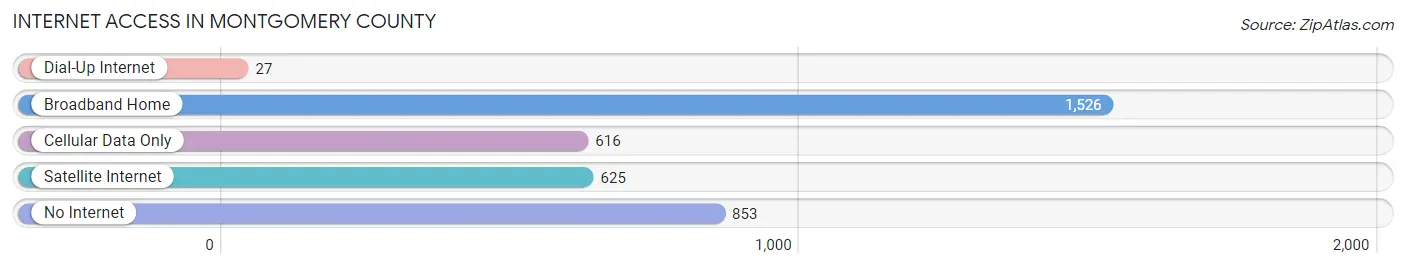
| Internet Type | # Households | % Households |
| Dial-Up Internet | 27 | 0.7% |
| Broadband Home | 1,526 | 42.5% |
| Cellular Data Only | 616 | 17.2% |
| Satellite Internet | 625 | 17.4% |
| No Internet | 853 | 23.8% |
| Total | 3,589 | 100.0% |
Montgomery County Summary
Montgomery County, Arkansas is located in the southwestern corner of the state and is part of the Arkansas Delta region. The county is bordered by Yell County to the north, Scott County to the east, Polk County to the south, and Howard County to the west. The county seat is Mount Ida, and the largest city is Hot Springs Village. The county has a total area of 717 square miles, of which 714 square miles is land and 3 square miles is water.
Montgomery County was established in 1842 and named for Richard Montgomery, an American Revolutionary War hero. The county was originally part of the Choctaw Nation, and the first settlers arrived in the area in the early 1800s. The county was home to several Native American tribes, including the Caddo, Osage, and Quapaw.
The economy of Montgomery County is largely based on agriculture, forestry, and tourism. The county is home to several large farms, as well as several small family farms. The county is also home to several timber companies, which harvest timber from the Ouachita National Forest. Tourism is also an important part of the economy, as the county is home to several popular tourist attractions, including Hot Springs National Park, Lake Ouachita State Park, and the Ouachita National Forest.
As of the 2010 census, the population of Montgomery County was 9,487, with a population density of 13.3 people per square mile. The median household income was $37,945, and the median family income was $45,945. The per capita income was $20,945. The population was spread out, with 24.3% under the age of 18, 8.2% from 18 to 24, 25.2% from 25 to 44, 28.2% from 45 to 64, and 14.1% who were 65 years of age or older. The racial makeup of the county was 95.3% White, 0.7% Black or African American, 0.7% Native American, 0.3% Asian, 0.1% Pacific Islander, 1.3% from other races, and 1.9% from two or more races.
Montgomery County is served by the Mount Ida School District, which includes two elementary schools, one middle school, and one high school. The county is also home to several private schools, including the Hot Springs Village School and the Ouachita Baptist Academy. The county is served by the Montgomery County Library System, which includes five branches located throughout the county.
Montgomery County is home to several attractions, including Hot Springs National Park, Lake Ouachita State Park, and the Ouachita National Forest. The county is also home to several museums, including the Montgomery County Historical Museum and the Hot Springs National Park Museum. The county is also home to several festivals and events, including the Hot Springs Music Festival and the Hot Springs Jazz Festival.
Montgomery County is a great place to live, work, and play. The county has a rich history, a diverse economy, and a variety of attractions and activities. The county is a great place to raise a family, and offers a variety of educational and recreational opportunities.
Common Questions
What is Per Capita Income in Montgomery County?
Per Capita income in Montgomery County is $26,815.
What is the Median Family Income in Montgomery County?
Median Family Income in Montgomery County is $56,905.
What is the Median Household income in Montgomery County?
Median Household Income in Montgomery County is $47,103.
What is Income or Wage Gap in Montgomery County?
Income or Wage Gap in Montgomery County is 36.0%.
Women in Montgomery County earn 64.0 cents for every dollar earned by a man.
What is Family Income Deficit in Montgomery County?
Family Income Deficit in Montgomery County is $8,489.
Families that are below poverty line in Montgomery County earn $8,489 less on average than the poverty threshold level.
What is Inequality or Gini Index in Montgomery County?
Inequality or Gini Index in Montgomery County is 0.45.
What is the Total Population of Montgomery County?
Total Population of Montgomery County is 8,555.
What is the Total Male Population of Montgomery County?
Total Male Population of Montgomery County is 4,380.
What is the Total Female Population of Montgomery County?
Total Female Population of Montgomery County is 4,175.
What is the Ratio of Males per 100 Females in Montgomery County?
There are 104.91 Males per 100 Females in Montgomery County.
What is the Ratio of Females per 100 Males in Montgomery County?
There are 95.32 Females per 100 Males in Montgomery County.
What is the Median Population Age in Montgomery County?
Median Population Age in Montgomery County is 50.5 Years.
What is the Average Family Size in Montgomery County
Average Family Size in Montgomery County is 2.8 People.
What is the Average Household Size in Montgomery County
Average Household Size in Montgomery County is 2.4 People.
How Large is the Labor Force in Montgomery County?
There are 3,505 People in the Labor Forcein in Montgomery County.
What is the Percentage of People in the Labor Force in Montgomery County?
48.5% of People are in the Labor Force in Montgomery County.
What is the Unemployment Rate in Montgomery County?
Unemployment Rate in Montgomery County is 7.3%.