Little River County, AR Map & Demographics
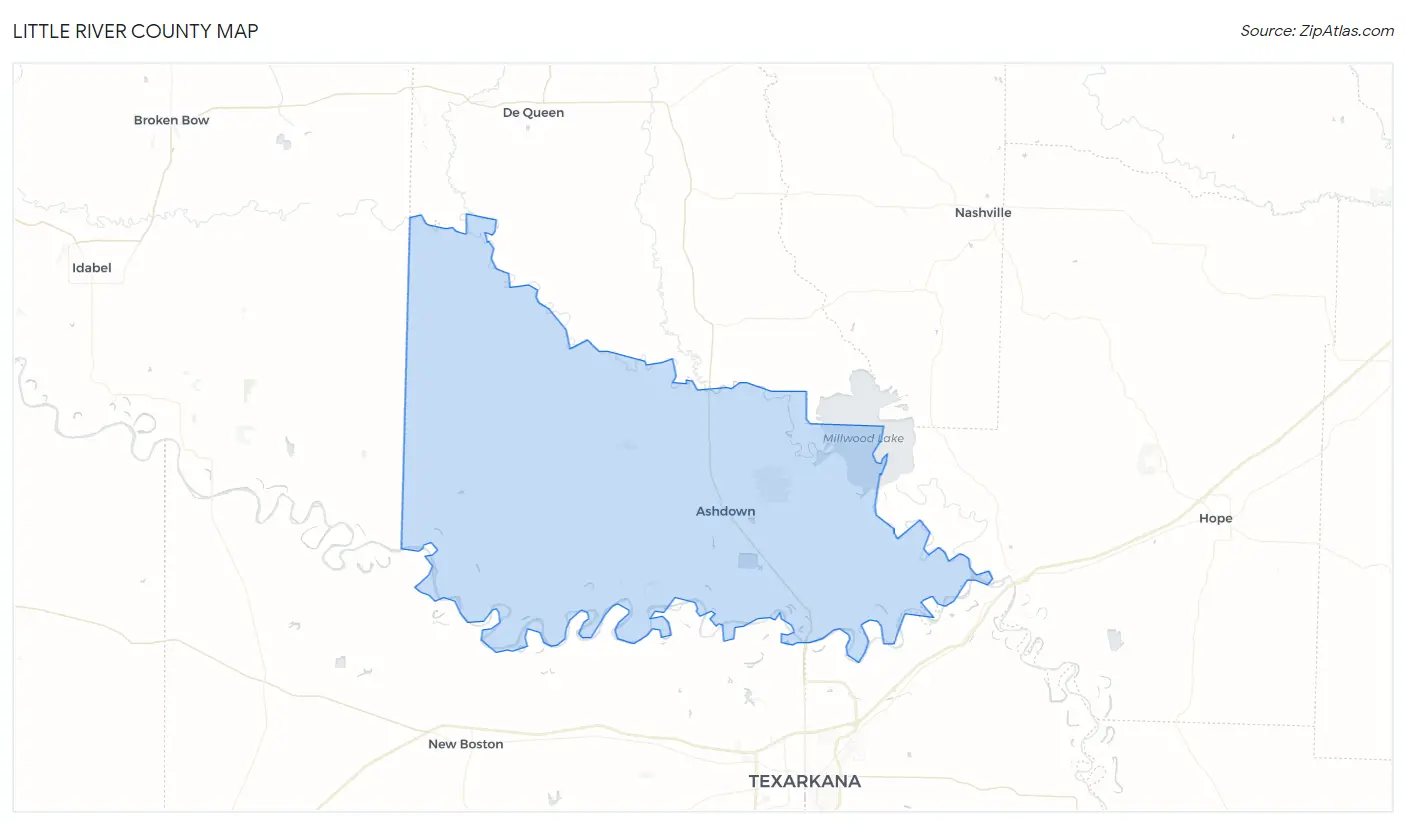
Little River County Map
Little River County Overview
$28,764
PER CAPITA INCOME
$76,776
AVG FAMILY INCOME
$58,627
AVG HOUSEHOLD INCOME
20.6%
WAGE / INCOME GAP [ % ]
79.4¢/ $1
WAGE / INCOME GAP [ $ ]
0.41
INEQUALITY / GINI INDEX
12,024
TOTAL POPULATION
5,849
MALE POPULATION
6,175
FEMALE POPULATION
94.72
MALES / 100 FEMALES
105.57
FEMALES / 100 MALES
42.3
MEDIAN AGE
3.1
AVG FAMILY SIZE
2.5
AVG HOUSEHOLD SIZE
5,484
LABOR FORCE [ PEOPLE ]
57.0%
PERCENT IN LABOR FORCE
8.0%
UNEMPLOYMENT RATE
Little River County Area Codes
Income in Little River County
Income Overview in Little River County
Per Capita Income in Little River County is $28,764, while median incomes of families and households are $76,776 and $58,627 respectively.
| Characteristic | Number | Measure |
| Per Capita Income | 12,024 | $28,764 |
| Median Family Income | 3,239 | $76,776 |
| Mean Family Income | 3,239 | $84,782 |
| Median Household Income | 4,734 | $58,627 |
| Mean Household Income | 4,734 | $71,108 |
| Income Deficit | 3,239 | $0 |
| Wage / Income Gap (%) | 12,024 | 20.56% |
| Wage / Income Gap ($) | 12,024 | 79.44¢ per $1 |
| Gini / Inequality Index | 12,024 | 0.41 |
Earnings by Sex in Little River County
Average Earnings in Little River County are $36,067, $42,007 for men and $33,369 for women, a difference of 20.6%.
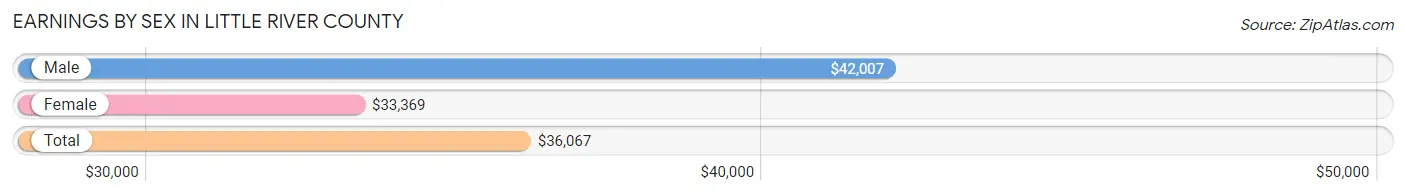
| Sex | Number | Average Earnings |
| Male | 2,860 (52.1%) | $42,007 |
| Female | 2,629 (47.9%) | $33,369 |
| Total | 5,489 (100.0%) | $36,067 |
Earnings by Sex by Income Bracket in Little River County
The most common earnings brackets in Little River County are $100,000+ for men (434 | 15.2%) and $35,000 to $39,999 for women (314 | 11.9%).
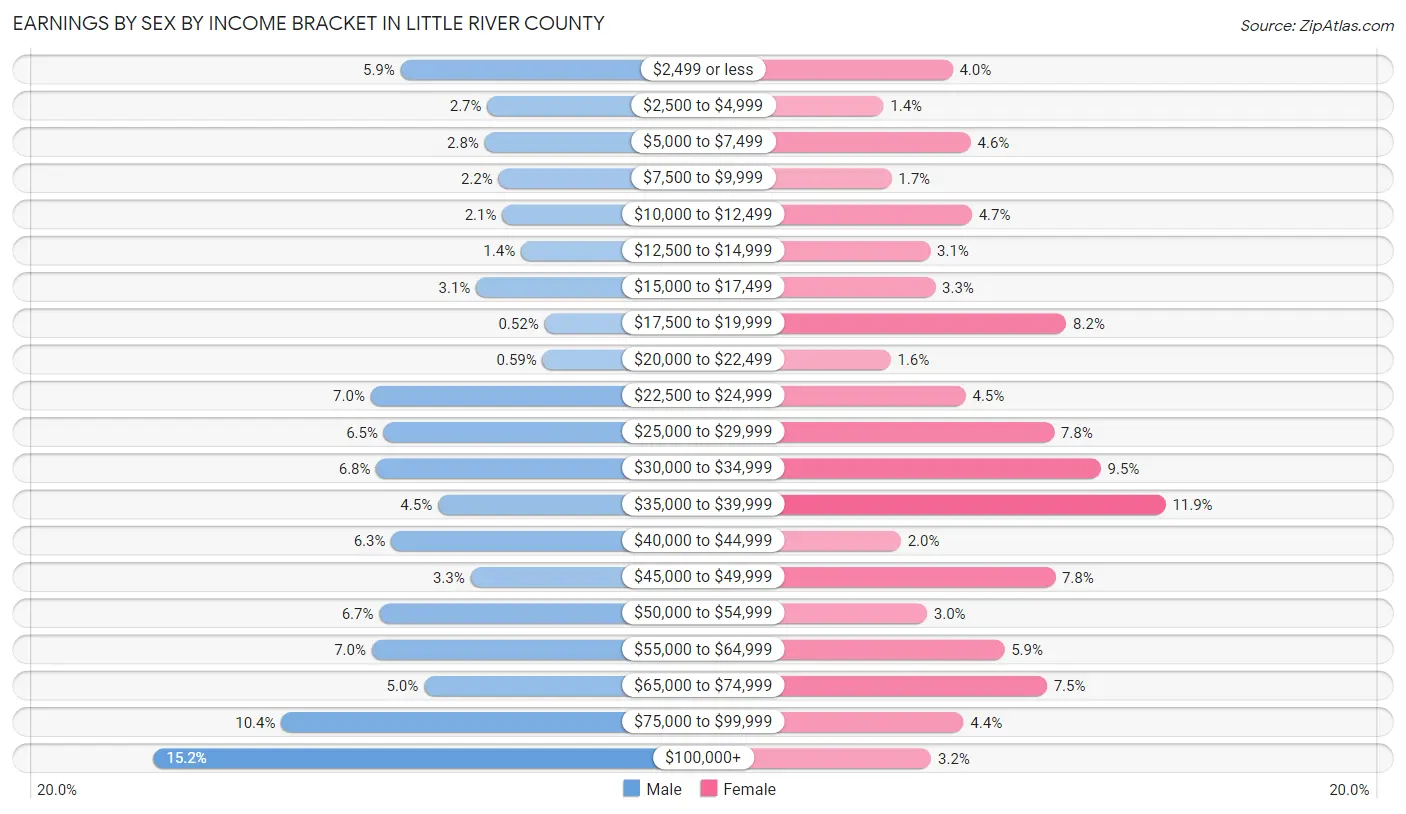
| Income | Male | Female |
| $2,499 or less | 169 (5.9%) | 104 (4.0%) |
| $2,500 to $4,999 | 76 (2.7%) | 36 (1.4%) |
| $5,000 to $7,499 | 79 (2.8%) | 122 (4.6%) |
| $7,500 to $9,999 | 64 (2.2%) | 44 (1.7%) |
| $10,000 to $12,499 | 60 (2.1%) | 123 (4.7%) |
| $12,500 to $14,999 | 40 (1.4%) | 82 (3.1%) |
| $15,000 to $17,499 | 88 (3.1%) | 87 (3.3%) |
| $17,500 to $19,999 | 15 (0.5%) | 216 (8.2%) |
| $20,000 to $22,499 | 17 (0.6%) | 43 (1.6%) |
| $22,500 to $24,999 | 201 (7.0%) | 117 (4.4%) |
| $25,000 to $29,999 | 187 (6.5%) | 204 (7.8%) |
| $30,000 to $34,999 | 195 (6.8%) | 250 (9.5%) |
| $35,000 to $39,999 | 129 (4.5%) | 314 (11.9%) |
| $40,000 to $44,999 | 179 (6.3%) | 53 (2.0%) |
| $45,000 to $49,999 | 94 (3.3%) | 205 (7.8%) |
| $50,000 to $54,999 | 192 (6.7%) | 79 (3.0%) |
| $55,000 to $64,999 | 200 (7.0%) | 155 (5.9%) |
| $65,000 to $74,999 | 144 (5.0%) | 197 (7.5%) |
| $75,000 to $99,999 | 297 (10.4%) | 115 (4.4%) |
| $100,000+ | 434 (15.2%) | 83 (3.2%) |
| Total | 2,860 (100.0%) | 2,629 (100.0%) |
Earnings by Sex by Educational Attainment in Little River County
Average earnings in Little River County are $51,250 for men and $35,495 for women, a difference of 30.7%. Men with an educational attainment of graduate degree enjoy the highest average annual earnings of $95,781, while those with college or associate's degree education earn the least with $48,537. Women with an educational attainment of graduate degree earn the most with the average annual earnings of $57,321, while those with less than high school education have the smallest earnings of $11,202.
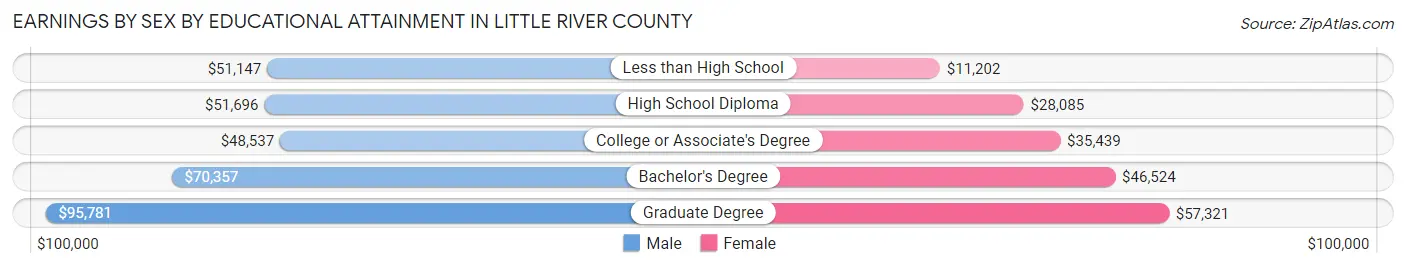
| Educational Attainment | Male Income | Female Income |
| Less than High School | $51,147 | $11,202 |
| High School Diploma | $51,696 | $28,085 |
| College or Associate's Degree | $48,537 | $35,439 |
| Bachelor's Degree | $70,357 | $46,524 |
| Graduate Degree | $95,781 | $57,321 |
| Total | $51,250 | $35,495 |
Family Income in Little River County
Family Income Brackets in Little River County
According to the Little River County family income data, there are 632 families falling into the $75,000 to $99,999 income range, which is the most common income bracket and makes up 19.5% of all families. Conversely, the $10,000 to $14,999 income bracket is the least frequent group with only 42 families (1.3%) belonging to this category.
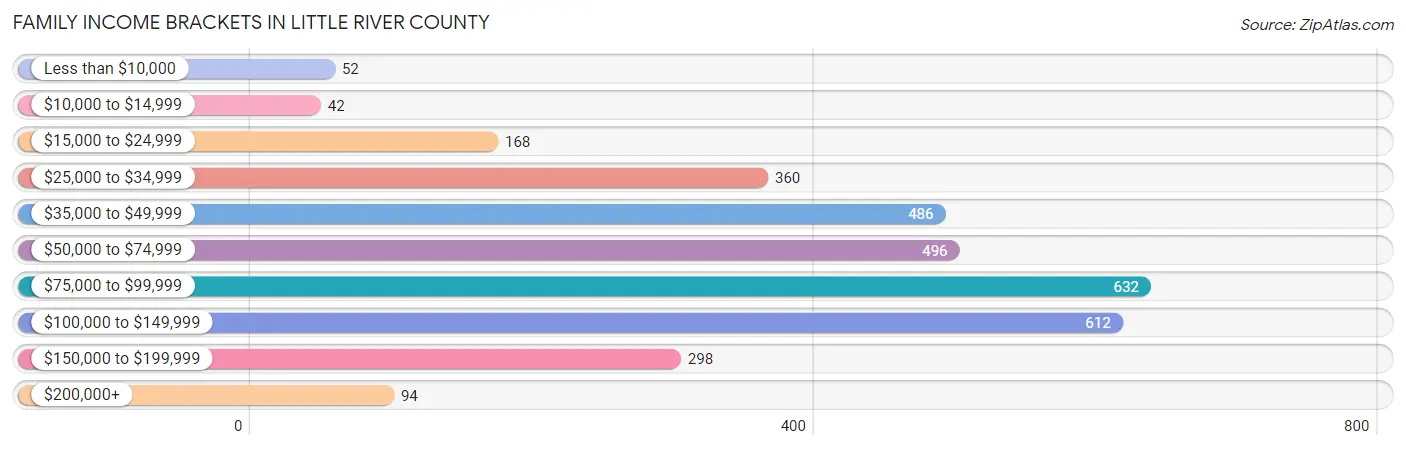
| Income Bracket | # Families | % Families |
| Less than $10,000 | 52 | 1.6% |
| $10,000 to $14,999 | 42 | 1.3% |
| $15,000 to $24,999 | 168 | 5.2% |
| $25,000 to $34,999 | 360 | 11.1% |
| $35,000 to $49,999 | 486 | 15.0% |
| $50,000 to $74,999 | 496 | 15.3% |
| $75,000 to $99,999 | 632 | 19.5% |
| $100,000 to $149,999 | 612 | 18.9% |
| $150,000 to $199,999 | 298 | 9.2% |
| $200,000+ | 94 | 2.9% |
Family Income by Famaliy Size in Little River County
6-person families (66 | 2.0%) account for the highest median family income in Little River County with $143,750 per family, while 2-person families (1,632 | 50.4%) have the highest median income of $35,000 per family member.
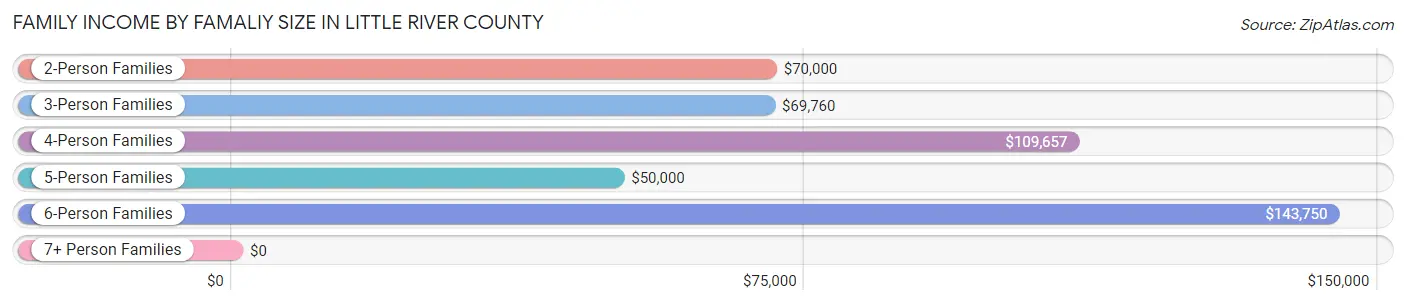
| Income Bracket | # Families | Median Income |
| 2-Person Families | 1,632 (50.4%) | $70,000 |
| 3-Person Families | 617 (19.1%) | $69,760 |
| 4-Person Families | 686 (21.2%) | $109,657 |
| 5-Person Families | 228 (7.0%) | $50,000 |
| 6-Person Families | 66 (2.0%) | $143,750 |
| 7+ Person Families | 10 (0.3%) | $0 |
| Total | 3,239 (100.0%) | $76,776 |
Family Income by Number of Earners in Little River County
The median family income in Little River County is $76,776, with families comprising 3+ earners (327) having the highest median family income of $143,262, while families with no earners (653) have the lowest median family income of $31,058, accounting for 10.1% and 20.2% of families, respectively.
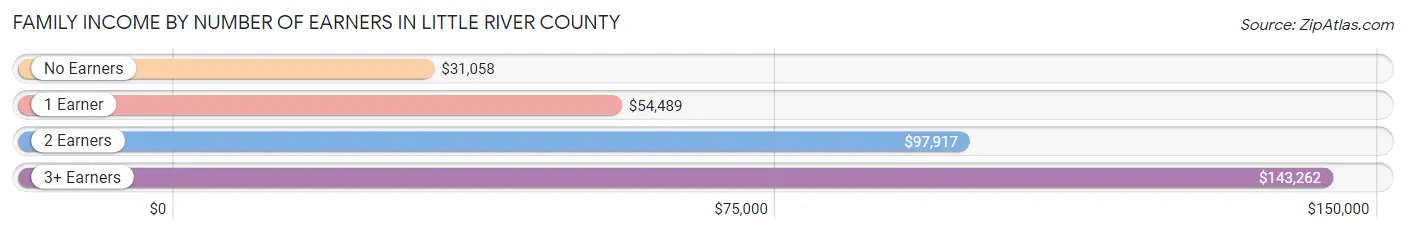
| Number of Earners | # Families | Median Income |
| No Earners | 653 (20.2%) | $31,058 |
| 1 Earner | 1,147 (35.4%) | $54,489 |
| 2 Earners | 1,112 (34.3%) | $97,917 |
| 3+ Earners | 327 (10.1%) | $143,262 |
| Total | 3,239 (100.0%) | $76,776 |
Household Income in Little River County
Household Income Brackets in Little River County
With 772 households falling in the category, the $75,000 to $99,999 income range is the most frequent in Little River County, accounting for 16.3% of all households. In contrast, only 95 households (2.0%) fall into the $200,000+ income bracket, making it the least populous group.
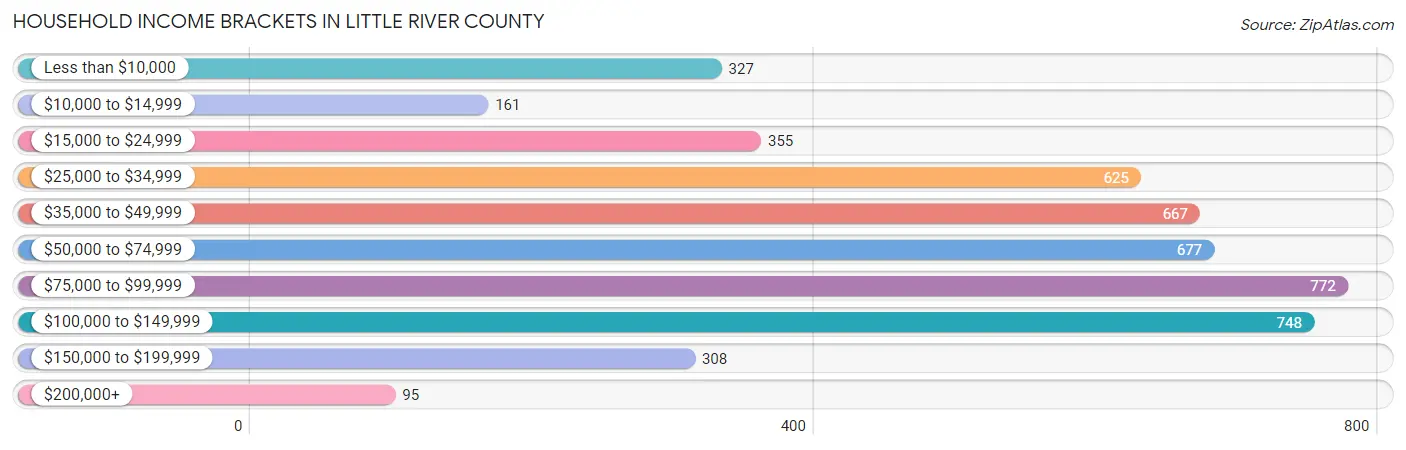
| Income Bracket | # Households | % Households |
| Less than $10,000 | 327 | 6.9% |
| $10,000 to $14,999 | 161 | 3.4% |
| $15,000 to $24,999 | 355 | 7.5% |
| $25,000 to $34,999 | 625 | 13.2% |
| $35,000 to $49,999 | 667 | 14.1% |
| $50,000 to $74,999 | 677 | 14.3% |
| $75,000 to $99,999 | 772 | 16.3% |
| $100,000 to $149,999 | 748 | 15.8% |
| $150,000 to $199,999 | 308 | 6.5% |
| $200,000+ | 95 | 2.0% |
Household Income by Householder Age in Little River County
The median household income in Little River County is $58,627, with the highest median household income of $77,429 found in the 25 to 44 years age bracket for the primary householder. A total of 1,261 households (26.6%) fall into this category. Meanwhile, the 15 to 24 years age bracket for the primary householder has the lowest median household income of $0, with 42 households (0.9%) in this group.
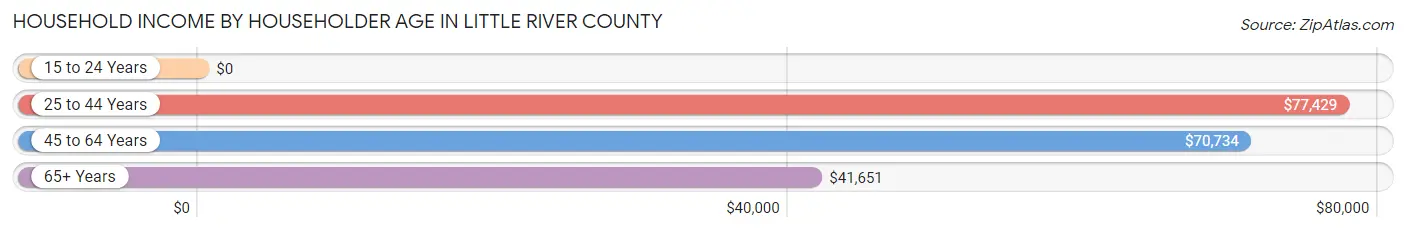
| Income Bracket | # Households | Median Income |
| 15 to 24 Years | 42 (0.9%) | $0 |
| 25 to 44 Years | 1,261 (26.6%) | $77,429 |
| 45 to 64 Years | 1,835 (38.8%) | $70,734 |
| 65+ Years | 1,596 (33.7%) | $41,651 |
| Total | 4,734 (100.0%) | $58,627 |
Poverty in Little River County
Income Below Poverty by Sex and Age in Little River County
With 8.5% poverty level for males and 14.9% for females among the residents of Little River County, 75 year old and over males and 6 to 11 year old females are the most vulnerable to poverty, with 72 males (16.8%) and 160 females (39.6%) in their respective age groups living below the poverty level.
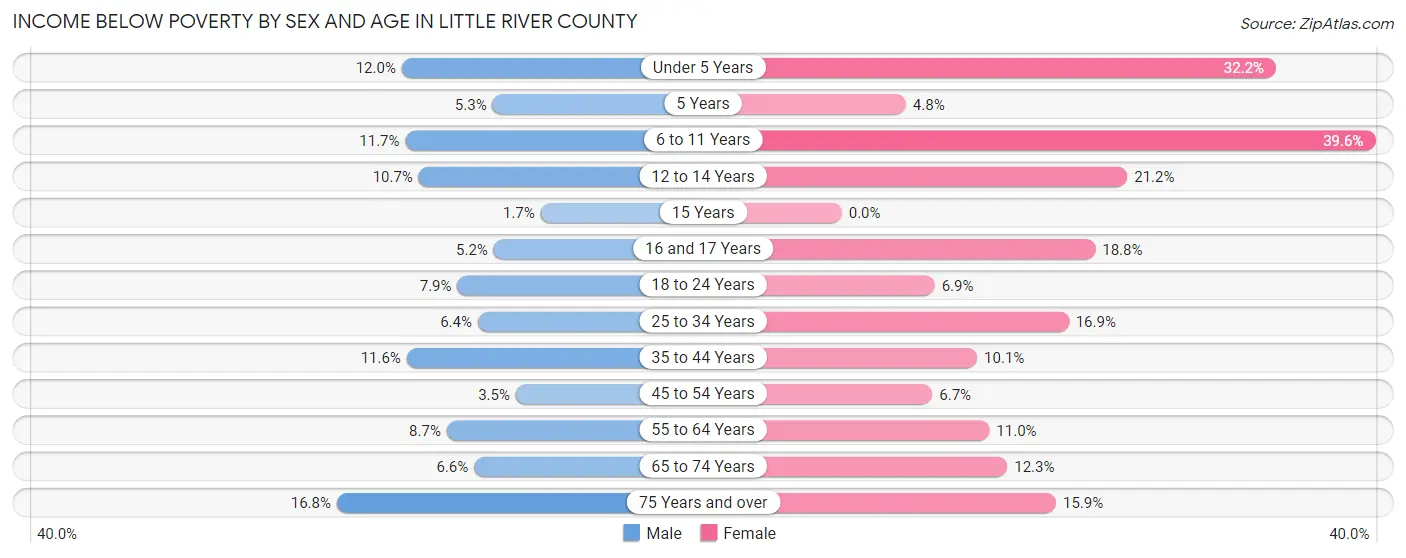
| Age Bracket | Male | Female |
| Under 5 Years | 33 (12.0%) | 127 (32.2%) |
| 5 Years | 4 (5.3%) | 3 (4.8%) |
| 6 to 11 Years | 40 (11.7%) | 160 (39.6%) |
| 12 to 14 Years | 29 (10.7%) | 60 (21.2%) |
| 15 Years | 3 (1.7%) | 0 (0.0%) |
| 16 and 17 Years | 9 (5.2%) | 16 (18.8%) |
| 18 to 24 Years | 40 (7.9%) | 30 (6.9%) |
| 25 to 34 Years | 43 (6.4%) | 106 (16.9%) |
| 35 to 44 Years | 75 (11.6%) | 84 (10.1%) |
| 45 to 54 Years | 23 (3.5%) | 51 (6.7%) |
| 55 to 64 Years | 67 (8.7%) | 97 (11.0%) |
| 65 to 74 Years | 45 (6.6%) | 100 (12.3%) |
| 75 Years and over | 72 (16.8%) | 77 (15.9%) |
| Total | 483 (8.5%) | 911 (14.9%) |
Income Above Poverty by Sex and Age in Little River County
According to the poverty statistics in Little River County, males aged 15 years and females aged 15 years are the age groups that are most secure financially, with 98.3% of males and 100.0% of females in these age groups living above the poverty line.
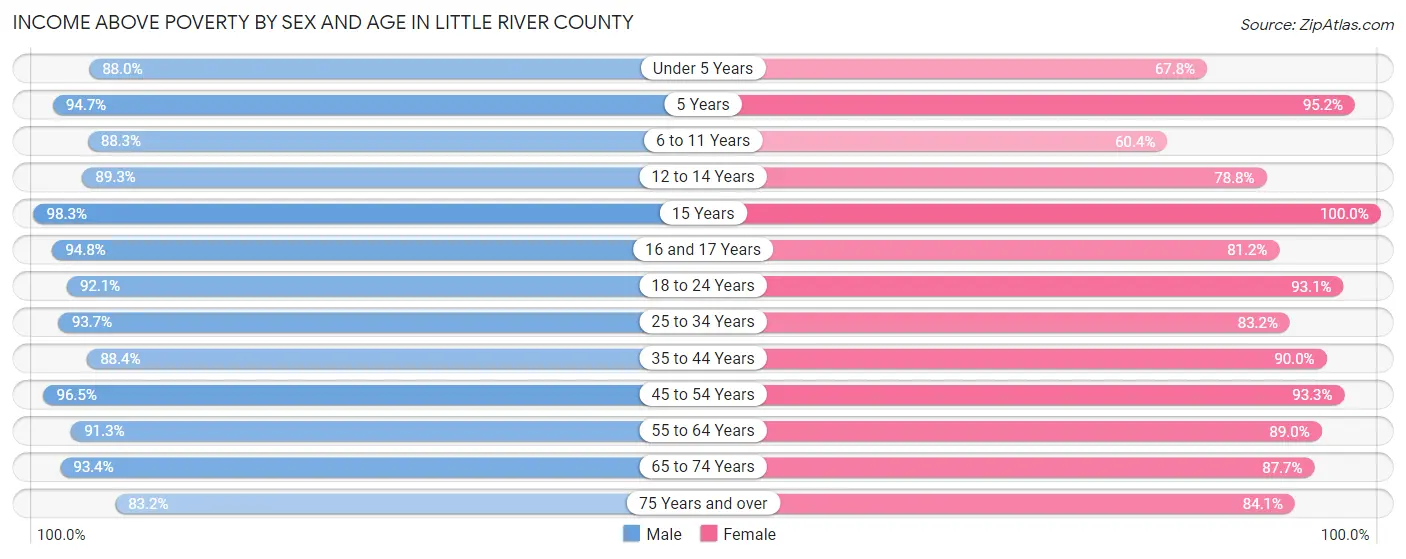
| Age Bracket | Male | Female |
| Under 5 Years | 242 (88.0%) | 267 (67.8%) |
| 5 Years | 72 (94.7%) | 60 (95.2%) |
| 6 to 11 Years | 301 (88.3%) | 244 (60.4%) |
| 12 to 14 Years | 241 (89.3%) | 223 (78.8%) |
| 15 Years | 174 (98.3%) | 22 (100.0%) |
| 16 and 17 Years | 165 (94.8%) | 69 (81.2%) |
| 18 to 24 Years | 468 (92.1%) | 405 (93.1%) |
| 25 to 34 Years | 634 (93.6%) | 523 (83.2%) |
| 35 to 44 Years | 570 (88.4%) | 752 (89.9%) |
| 45 to 54 Years | 628 (96.5%) | 708 (93.3%) |
| 55 to 64 Years | 707 (91.3%) | 788 (89.0%) |
| 65 to 74 Years | 634 (93.4%) | 714 (87.7%) |
| 75 Years and over | 356 (83.2%) | 407 (84.1%) |
| Total | 5,192 (91.5%) | 5,182 (85.1%) |
Income Below Poverty Among Married-Couple Families in Little River County
The poverty statistics for married-couple families in Little River County show that 2.5% or 57 of the total 2,272 families live below the poverty line. Families with 1 or 2 children have the highest poverty rate of 2.7%, comprising of 16 families. On the other hand, families with 3 or 4 children have the lowest poverty rate of 0.0%, which includes 0 families.
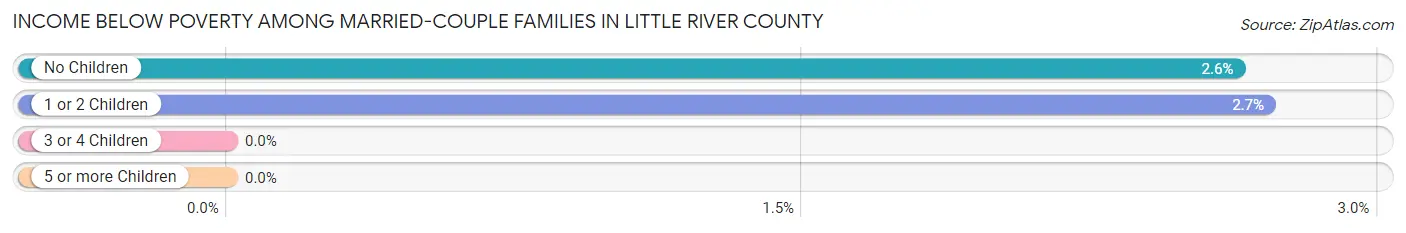
| Children | Above Poverty | Below Poverty |
| No Children | 1,519 (97.4%) | 41 (2.6%) |
| 1 or 2 Children | 575 (97.3%) | 16 (2.7%) |
| 3 or 4 Children | 121 (100.0%) | 0 (0.0%) |
| 5 or more Children | 0 (0.0%) | 0 (0.0%) |
| Total | 2,215 (97.5%) | 57 (2.5%) |
Income Below Poverty Among Single-Parent Households in Little River County
According to the poverty data in Little River County, 1.8% or 4 single-father households and 21.9% or 163 single-mother households are living below the poverty line. Among single-father households, those with 3 or 4 children have the highest poverty rate, with 4 households (9.3%) experiencing poverty. Likewise, among single-mother households, those with 3 or 4 children have the highest poverty rate, with 50 households (28.2%) falling below the poverty line.
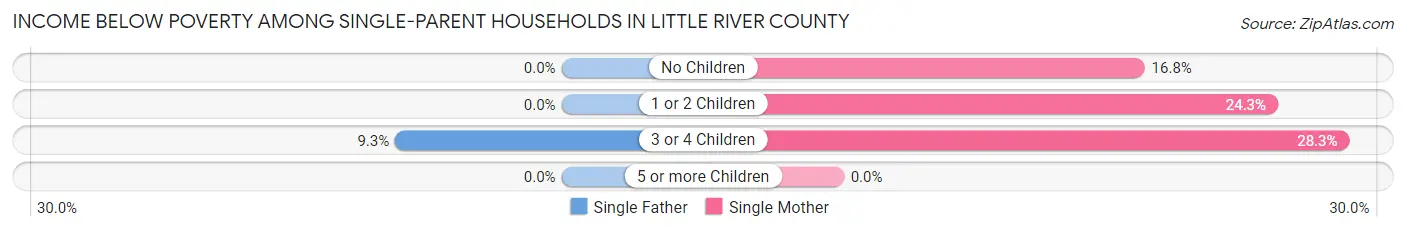
| Children | Single Father | Single Mother |
| No Children | 0 (0.0%) | 56 (16.8%) |
| 1 or 2 Children | 0 (0.0%) | 57 (24.3%) |
| 3 or 4 Children | 4 (9.3%) | 50 (28.2%) |
| 5 or more Children | 0 (0.0%) | 0 (0.0%) |
| Total | 4 (1.8%) | 163 (21.9%) |
Income Below Poverty Among Married-Couple vs Single-Parent Households in Little River County
The poverty data for Little River County shows that 57 of the married-couple family households (2.5%) and 167 of the single-parent households (17.3%) are living below the poverty level. Within the married-couple family households, those with 1 or 2 children have the highest poverty rate, with 16 households (2.7%) falling below the poverty line. Among the single-parent households, those with 3 or 4 children have the highest poverty rate, with 54 household (24.5%) living below poverty.
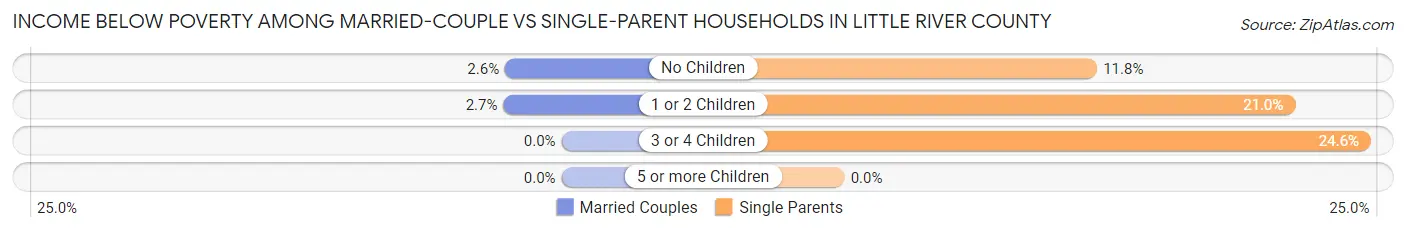
| Children | Married-Couple Families | Single-Parent Households |
| No Children | 41 (2.6%) | 56 (11.8%) |
| 1 or 2 Children | 16 (2.7%) | 57 (21.0%) |
| 3 or 4 Children | 0 (0.0%) | 54 (24.5%) |
| 5 or more Children | 0 (0.0%) | 0 (0.0%) |
| Total | 57 (2.5%) | 167 (17.3%) |
Race in Little River County
The most populous races in Little River County are White / Caucasian (8,697 | 72.3%), Black / African American (2,238 | 18.6%), and Two or more Races (773 | 6.4%).
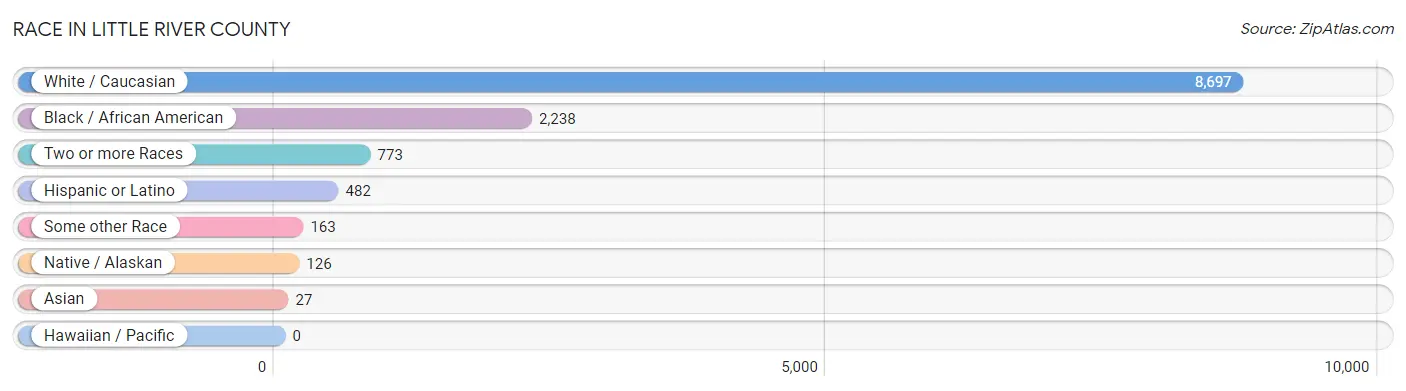
| Race | # Population | % Population |
| Asian | 27 | 0.2% |
| Black / African American | 2,238 | 18.6% |
| Hawaiian / Pacific | 0 | 0.0% |
| Hispanic or Latino | 482 | 4.0% |
| Native / Alaskan | 126 | 1.1% |
| White / Caucasian | 8,697 | 72.3% |
| Two or more Races | 773 | 6.4% |
| Some other Race | 163 | 1.4% |
| Total | 12,024 | 100.0% |
Ancestry in Little River County
The most populous ancestries reported in Little River County are Irish (1,410 | 11.7%), English (954 | 7.9%), German (723 | 6.0%), American (722 | 6.0%), and Mexican (455 | 3.8%), together accounting for 35.4% of all Little River County residents.
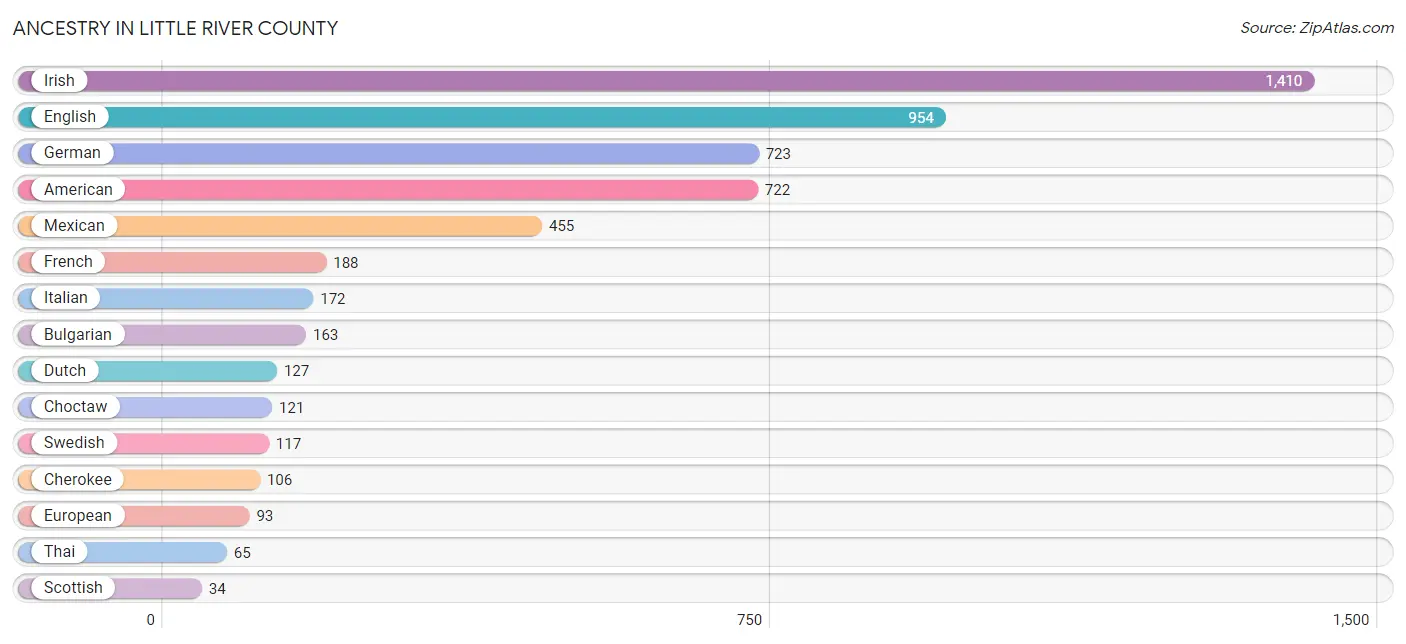
| Ancestry | # Population | % Population |
| African | 3 | 0.0% |
| American | 722 | 6.0% |
| Blackfeet | 3 | 0.0% |
| Bulgarian | 163 | 1.4% |
| Canadian | 21 | 0.2% |
| Central American | 18 | 0.2% |
| Cherokee | 106 | 0.9% |
| Choctaw | 121 | 1.0% |
| Cuban | 9 | 0.1% |
| Dutch | 127 | 1.1% |
| Dutch West Indian | 29 | 0.2% |
| English | 954 | 7.9% |
| European | 93 | 0.8% |
| French | 188 | 1.6% |
| French Canadian | 18 | 0.2% |
| German | 723 | 6.0% |
| Greek | 12 | 0.1% |
| Irish | 1,410 | 11.7% |
| Italian | 172 | 1.4% |
| Jamaican | 11 | 0.1% |
| Korean | 11 | 0.1% |
| Mexican | 455 | 3.8% |
| Panamanian | 18 | 0.2% |
| Polish | 30 | 0.3% |
| Russian | 28 | 0.2% |
| Scandinavian | 3 | 0.0% |
| Scotch-Irish | 11 | 0.1% |
| Scottish | 34 | 0.3% |
| Sioux | 10 | 0.1% |
| Sri Lankan | 24 | 0.2% |
| Subsaharan African | 3 | 0.0% |
| Swedish | 117 | 1.0% |
| Thai | 65 | 0.5% |
| Welsh | 8 | 0.1% | View All 34 Rows |
Immigrants in Little River County
The most numerous immigrant groups reported in Little River County came from Central America (72 | 0.6%), Latin America (72 | 0.6%), Mexico (64 | 0.5%), Canada (9 | 0.1%), and Panama (8 | 0.1%), together accounting for 1.9% of all Little River County residents.
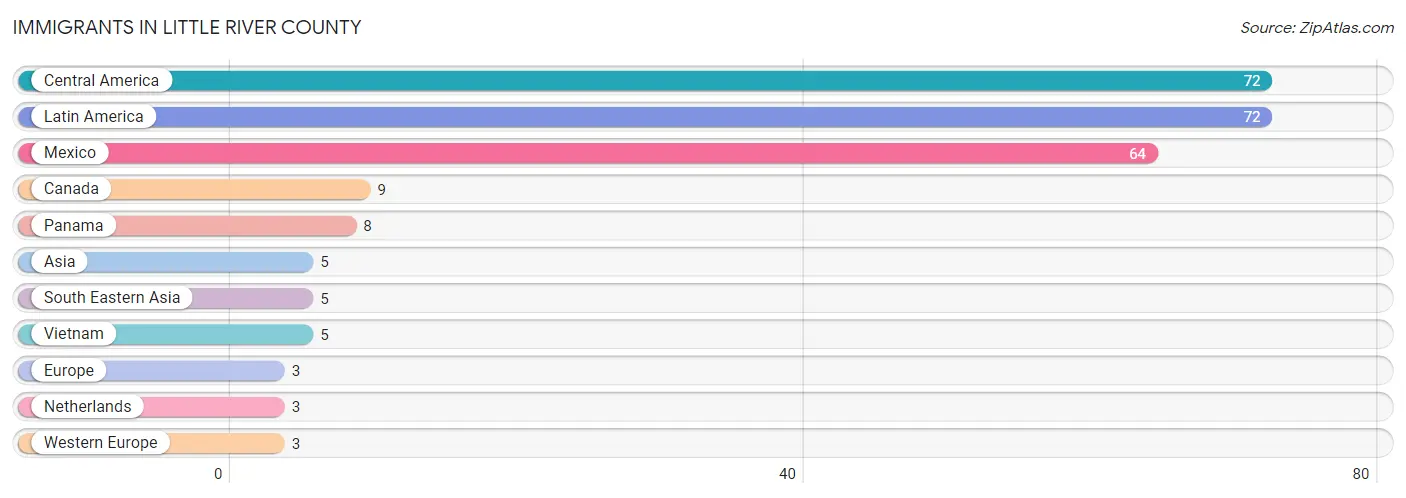
| Immigration Origin | # Population | % Population |
| Asia | 5 | 0.0% |
| Canada | 9 | 0.1% |
| Central America | 72 | 0.6% |
| Europe | 3 | 0.0% |
| Latin America | 72 | 0.6% |
| Mexico | 64 | 0.5% |
| Netherlands | 3 | 0.0% |
| Panama | 8 | 0.1% |
| South Eastern Asia | 5 | 0.0% |
| Vietnam | 5 | 0.0% |
| Western Europe | 3 | 0.0% | View All 11 Rows |
Sex and Age in Little River County
Sex and Age in Little River County
The most populous age groups in Little River County are 60 to 64 Years (538 | 9.2%) for men and 55 to 59 Years (486 | 7.9%) for women.
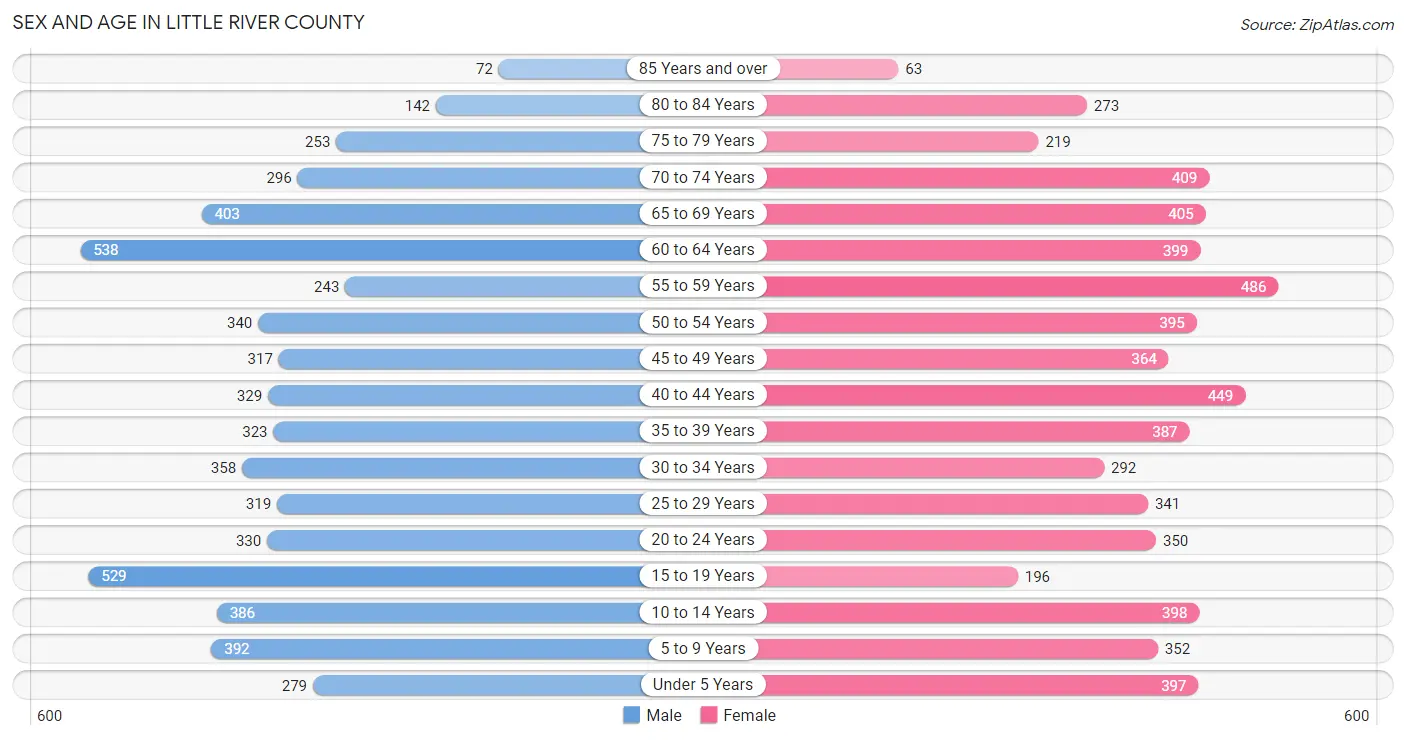
| Age Bracket | Male | Female |
| Under 5 Years | 279 (4.8%) | 397 (6.4%) |
| 5 to 9 Years | 392 (6.7%) | 352 (5.7%) |
| 10 to 14 Years | 386 (6.6%) | 398 (6.5%) |
| 15 to 19 Years | 529 (9.0%) | 196 (3.2%) |
| 20 to 24 Years | 330 (5.6%) | 350 (5.7%) |
| 25 to 29 Years | 319 (5.4%) | 341 (5.5%) |
| 30 to 34 Years | 358 (6.1%) | 292 (4.7%) |
| 35 to 39 Years | 323 (5.5%) | 387 (6.3%) |
| 40 to 44 Years | 329 (5.6%) | 449 (7.3%) |
| 45 to 49 Years | 317 (5.4%) | 364 (5.9%) |
| 50 to 54 Years | 340 (5.8%) | 395 (6.4%) |
| 55 to 59 Years | 243 (4.2%) | 486 (7.9%) |
| 60 to 64 Years | 538 (9.2%) | 399 (6.5%) |
| 65 to 69 Years | 403 (6.9%) | 405 (6.6%) |
| 70 to 74 Years | 296 (5.1%) | 409 (6.6%) |
| 75 to 79 Years | 253 (4.3%) | 219 (3.5%) |
| 80 to 84 Years | 142 (2.4%) | 273 (4.4%) |
| 85 Years and over | 72 (1.2%) | 63 (1.0%) |
| Total | 5,849 (100.0%) | 6,175 (100.0%) |
Families and Households in Little River County
Median Family Size in Little River County
The median family size in Little River County is 3.06 persons per family, with single female/mother families (745 | 23.0%) accounting for the largest median family size of 3.34 persons per family. On the other hand, married-couple families (2,272 | 70.2%) represent the smallest median family size with 2.96 persons per family.
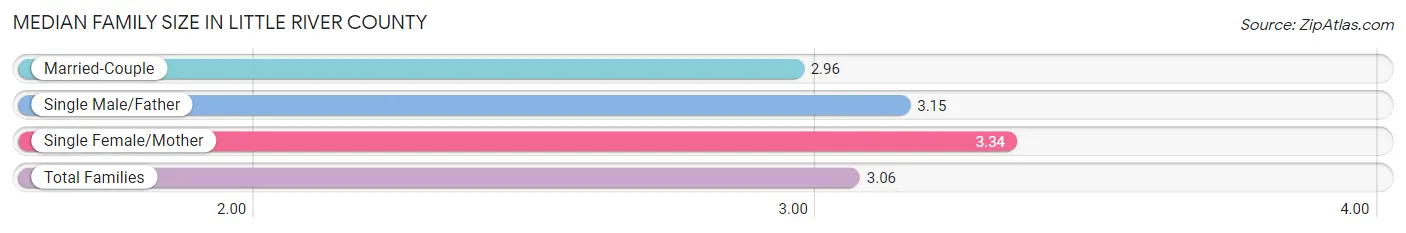
| Family Type | # Families | Family Size |
| Married-Couple | 2,272 (70.2%) | 2.96 |
| Single Male/Father | 222 (6.9%) | 3.15 |
| Single Female/Mother | 745 (23.0%) | 3.34 |
| Total Families | 3,239 (100.0%) | 3.06 |
Median Household Size in Little River County
The median household size in Little River County is 2.50 persons per household, with single female/mother households (745 | 15.7%) accounting for the largest median household size of 3.5 persons per household. non-family households (1,495 | 31.6%) represent the smallest median household size with 1.18 persons per household.
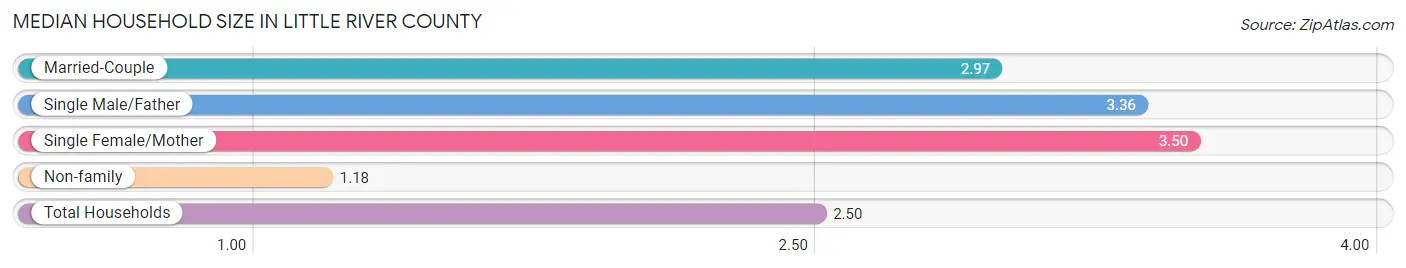
| Household Type | # Households | Household Size |
| Married-Couple | 2,272 (48.0%) | 2.97 |
| Single Male/Father | 222 (4.7%) | 3.36 |
| Single Female/Mother | 745 (15.7%) | 3.50 |
| Non-family | 1,495 (31.6%) | 1.18 |
| Total Households | 4,734 (100.0%) | 2.50 |
Household Size by Marriage Status in Little River County
Out of a total of 4,734 households in Little River County, 3,239 (68.4%) are family households, while 1,495 (31.6%) are nonfamily households. The most numerous type of family households are 2-person households, comprising 1,591, and the most common type of nonfamily households are 1-person households, comprising 1,383.
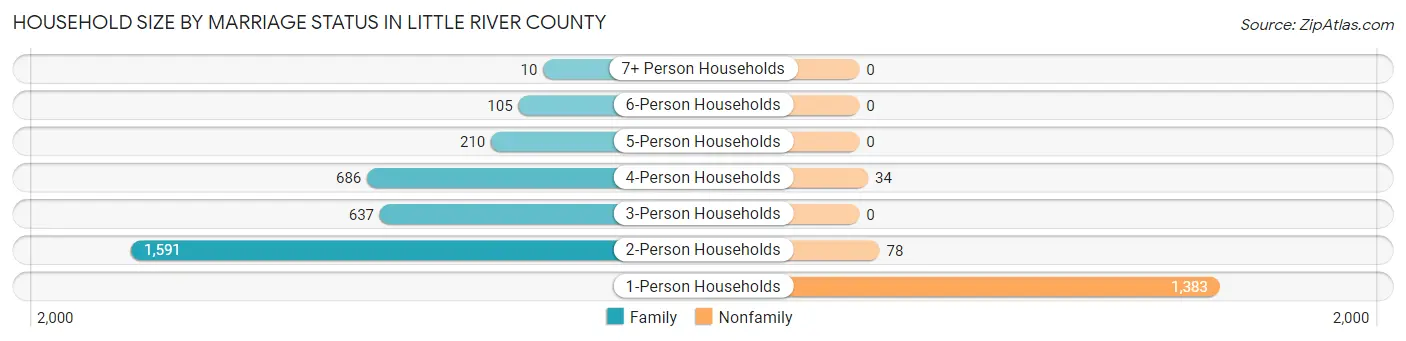
| Household Size | Family Households | Nonfamily Households |
| 1-Person Households | - | 1,383 (29.2%) |
| 2-Person Households | 1,591 (33.6%) | 78 (1.7%) |
| 3-Person Households | 637 (13.5%) | 0 (0.0%) |
| 4-Person Households | 686 (14.5%) | 34 (0.7%) |
| 5-Person Households | 210 (4.4%) | 0 (0.0%) |
| 6-Person Households | 105 (2.2%) | 0 (0.0%) |
| 7+ Person Households | 10 (0.2%) | 0 (0.0%) |
| Total | 3,239 (68.4%) | 1,495 (31.6%) |
Female Fertility in Little River County
Fertility by Age in Little River County
Average fertility rate in Little River County is 52.0 births per 1,000 women. Women in the age bracket of 15 to 19 years have the highest fertility rate with 173.0 births per 1,000 women. Women in the age bracket of 20 to 34 years acount for 69.3% of all women with births.
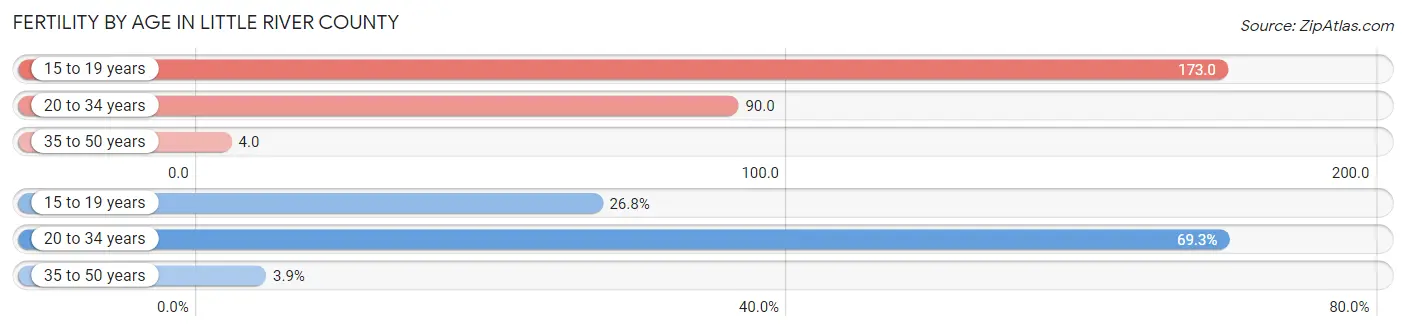
| Age Bracket | Women with Births | Births / 1,000 Women |
| 15 to 19 years | 34 (26.8%) | 173.0 |
| 20 to 34 years | 88 (69.3%) | 90.0 |
| 35 to 50 years | 5 (3.9%) | 4.0 |
| Total | 127 (100.0%) | 52.0 |
Fertility by Age by Marriage Status in Little River County
63.0% of women with births (127) in Little River County are married. The highest percentage of unmarried women with births falls into 15 to 19 years age bracket with 70.6% of them unmarried at the time of birth, while the lowest percentage of unmarried women with births belong to 35 to 50 years age bracket with 0.0% of them unmarried.
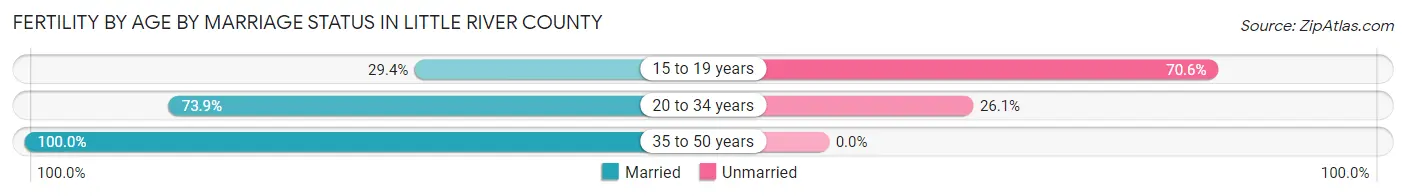
| Age Bracket | Married | Unmarried |
| 15 to 19 years | 10 (29.4%) | 24 (70.6%) |
| 20 to 34 years | 65 (73.9%) | 23 (26.1%) |
| 35 to 50 years | 5 (100.0%) | 0 (0.0%) |
| Total | 80 (63.0%) | 47 (37.0%) |
Fertility by Education in Little River County
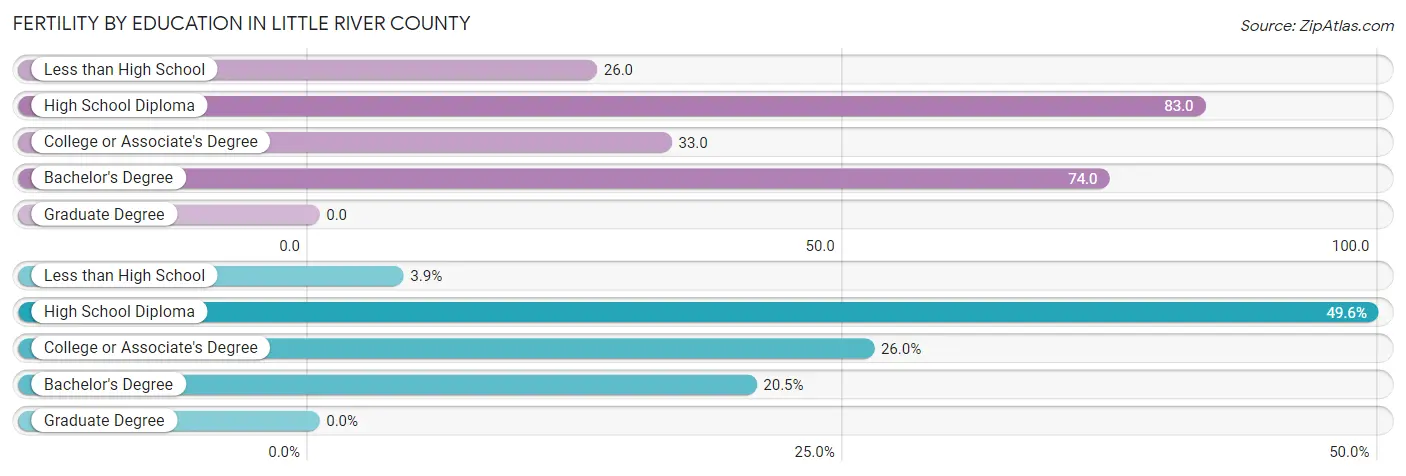
| Educational Attainment | Women with Births | Births / 1,000 Women |
| Less than High School | 5 (3.9%) | 26.0 |
| High School Diploma | 63 (49.6%) | 83.0 |
| College or Associate's Degree | 33 (26.0%) | 33.0 |
| Bachelor's Degree | 26 (20.5%) | 74.0 |
| Graduate Degree | 0 (0.0%) | 0.0 |
| Total | 127 (100.0%) | 52.0 |
Fertility by Education by Marriage Status in Little River County
37.0% of women with births in Little River County are unmarried. Women with the educational attainment of college or associate's degree are most likely to be married with 100.0% of them married at childbirth, while women with the educational attainment of less than high school are least likely to be married with 100.0% of them unmarried at childbirth.
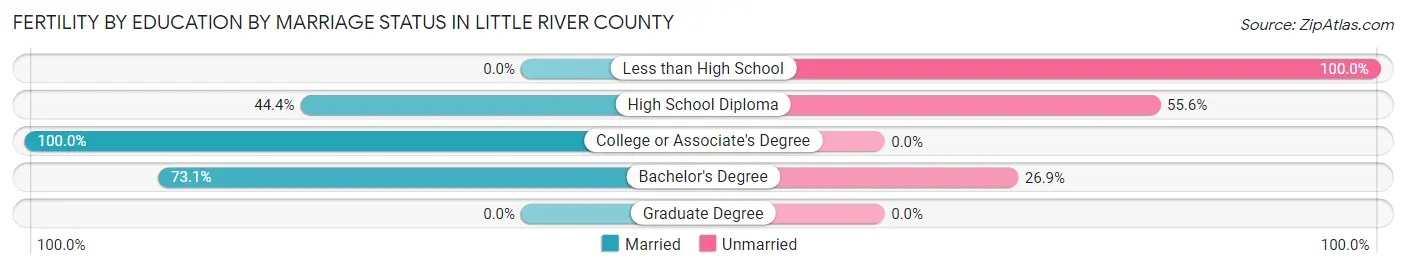
| Educational Attainment | Married | Unmarried |
| Less than High School | 0 (0.0%) | 5 (100.0%) |
| High School Diploma | 28 (44.4%) | 35 (55.6%) |
| College or Associate's Degree | 33 (100.0%) | 0 (0.0%) |
| Bachelor's Degree | 19 (73.1%) | 7 (26.9%) |
| Graduate Degree | 0 (0.0%) | 0 (0.0%) |
| Total | 80 (63.0%) | 47 (37.0%) |
Employment Characteristics in Little River County
Employment by Class of Employer in Little River County
Among the 5,008 employed individuals in Little River County, private company employees (3,406 | 68.0%), local government employees (841 | 16.8%), and not-for-profit organizations (251 | 5.0%) make up the most common classes of employment.
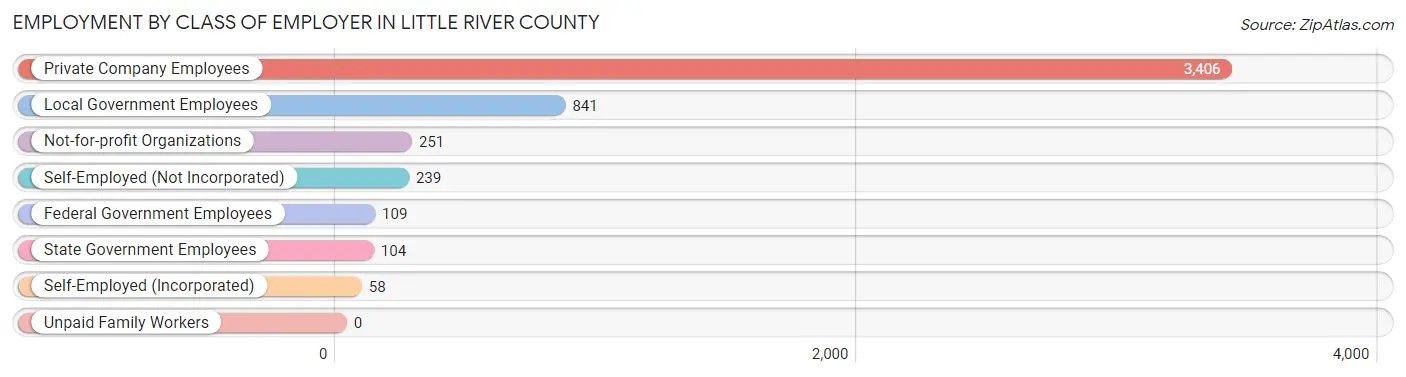
| Employer Class | # Employees | % Employees |
| Private Company Employees | 3,406 | 68.0% |
| Self-Employed (Incorporated) | 58 | 1.2% |
| Self-Employed (Not Incorporated) | 239 | 4.8% |
| Not-for-profit Organizations | 251 | 5.0% |
| Local Government Employees | 841 | 16.8% |
| State Government Employees | 104 | 2.1% |
| Federal Government Employees | 109 | 2.2% |
| Unpaid Family Workers | 0 | 0.0% |
| Total | 5,008 | 100.0% |
Employment Status by Age in Little River County
According to the labor force statistics for Little River County, out of the total population over 16 years of age (9,621), 57.0% or 5,484 individuals are in the labor force, with 8.0% or 439 of them unemployed. The age group with the highest labor force participation rate is 20 to 24 years, with 90.0% or 612 individuals in the labor force. Within the labor force, the 20 to 24 years age range has the highest percentage of unemployed individuals, with 39.2% or 240 of them being unemployed.
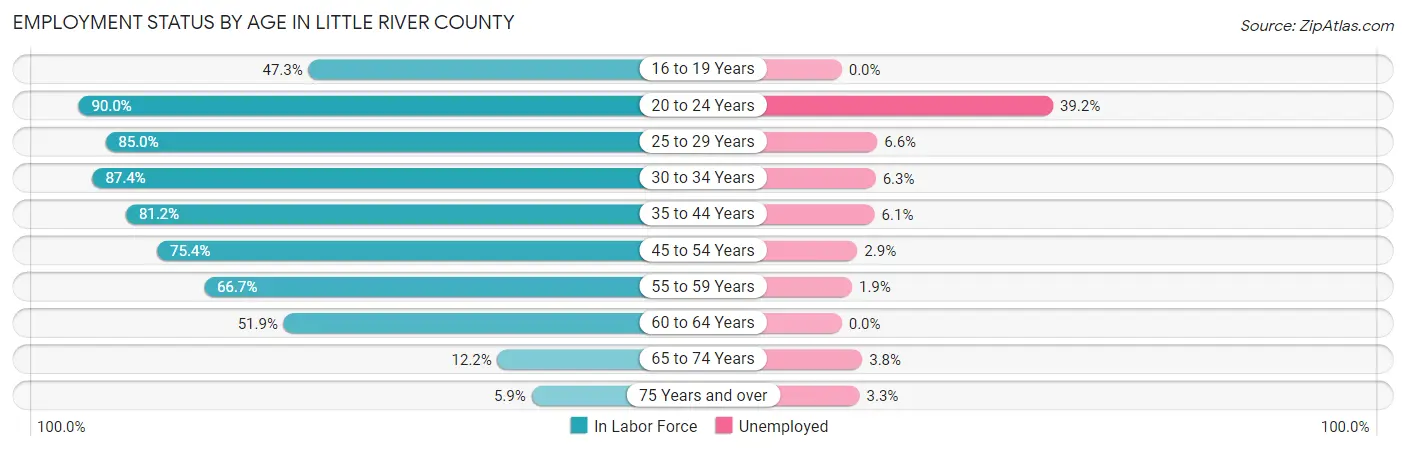
| Age Bracket | In Labor Force | Unemployed |
| 16 to 19 Years | 249 (47.3%) | 0 (0.0%) |
| 20 to 24 Years | 612 (90.0%) | 240 (39.2%) |
| 25 to 29 Years | 561 (85.0%) | 37 (6.6%) |
| 30 to 34 Years | 568 (87.4%) | 36 (6.3%) |
| 35 to 44 Years | 1,208 (81.2%) | 74 (6.1%) |
| 45 to 54 Years | 1,068 (75.4%) | 31 (2.9%) |
| 55 to 59 Years | 486 (66.7%) | 9 (1.9%) |
| 60 to 64 Years | 486 (51.9%) | 0 (0.0%) |
| 65 to 74 Years | 185 (12.2%) | 7 (3.8%) |
| 75 Years and over | 60 (5.9%) | 2 (3.3%) |
| Total | 5,484 (57.0%) | 439 (8.0%) |
Employment Status by Educational Attainment in Little River County
According to labor force statistics for Little River County, 74.4% of individuals (4,375) out of the total population between 25 and 64 years of age (5,880) are in the labor force, with 4.3% or 188 of them being unemployed. The group with the highest labor force participation rate are those with the educational attainment of bachelor's degree or higher, with 85.4% or 875 individuals in the labor force. Within the labor force, individuals with high school diploma education have the highest percentage of unemployment, with 6.0% or 108 of them being unemployed.
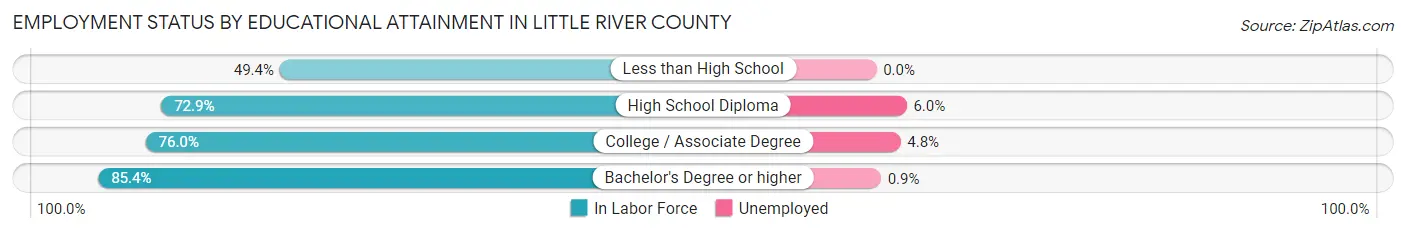
| Educational Attainment | In Labor Force | Unemployed |
| Less than High School | 207 (49.4%) | 0 (0.0%) |
| High School Diploma | 1,792 (72.9%) | 147 (6.0%) |
| College / Associate Degree | 1,503 (76.0%) | 95 (4.8%) |
| Bachelor's Degree or higher | 875 (85.4%) | 9 (0.9%) |
| Total | 4,375 (74.4%) | 253 (4.3%) |
Employment Occupations by Sex in Little River County
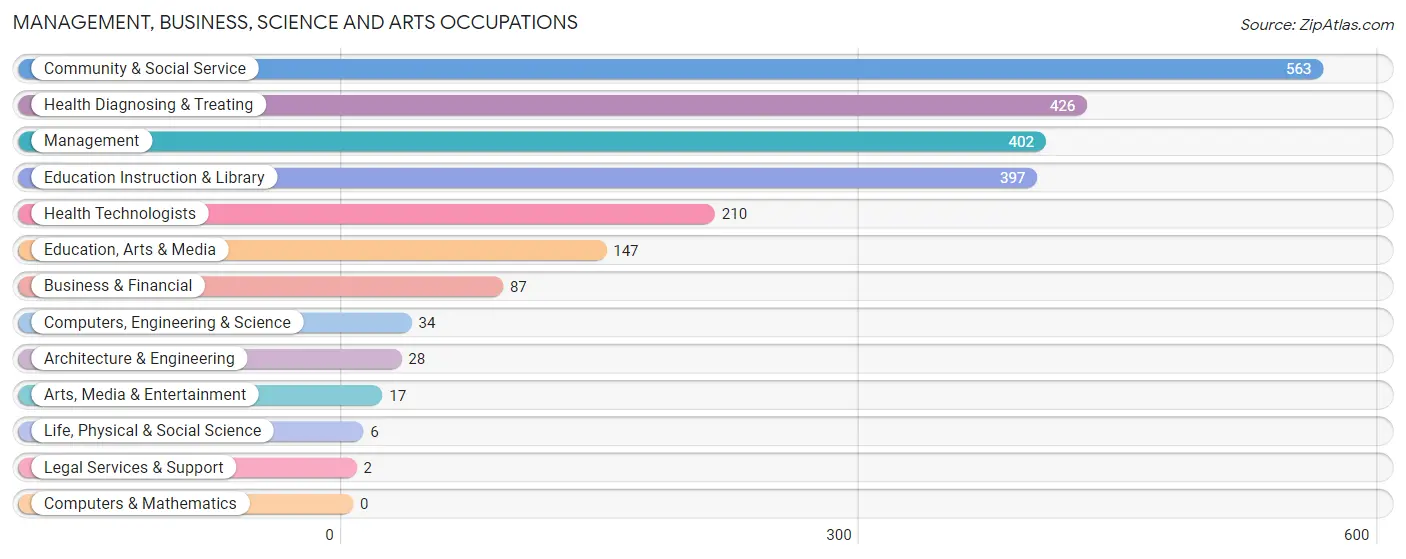
Management, Business, Science and Arts Occupations
The most common Management, Business, Science and Arts occupations in Little River County are Community & Social Service (563 | 11.2%), Health Diagnosing & Treating (426 | 8.4%), Management (402 | 8.0%), Education Instruction & Library (397 | 7.9%), and Health Technologists (210 | 4.2%).
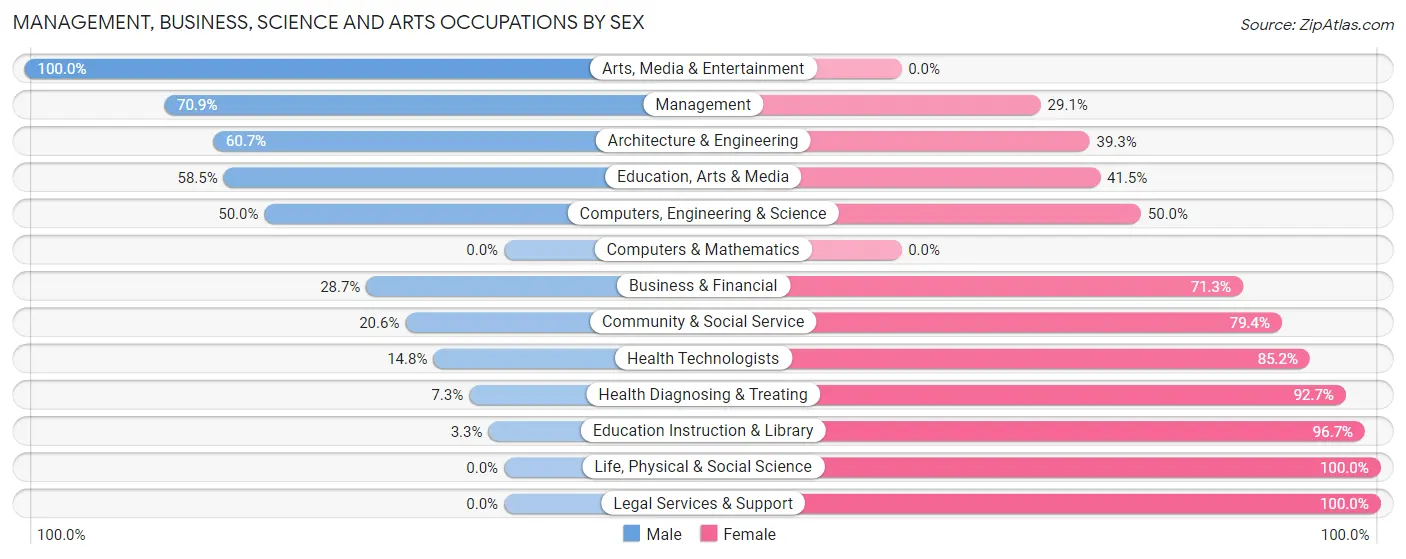
Management, Business, Science and Arts Occupations by Sex
Within the Management, Business, Science and Arts occupations in Little River County, the most male-oriented occupations are Arts, Media & Entertainment (100.0%), Management (70.9%), and Architecture & Engineering (60.7%), while the most female-oriented occupations are Life, Physical & Social Science (100.0%), Legal Services & Support (100.0%), and Education Instruction & Library (96.7%).
| Occupation | Male | Female |
| Management | 285 (70.9%) | 117 (29.1%) |
| Business & Financial | 25 (28.7%) | 62 (71.3%) |
| Computers, Engineering & Science | 17 (50.0%) | 17 (50.0%) |
| Computers & Mathematics | 0 (0.0%) | 0 (0.0%) |
| Architecture & Engineering | 17 (60.7%) | 11 (39.3%) |
| Life, Physical & Social Science | 0 (0.0%) | 6 (100.0%) |
| Community & Social Service | 116 (20.6%) | 447 (79.4%) |
| Education, Arts & Media | 86 (58.5%) | 61 (41.5%) |
| Legal Services & Support | 0 (0.0%) | 2 (100.0%) |
| Education Instruction & Library | 13 (3.3%) | 384 (96.7%) |
| Arts, Media & Entertainment | 17 (100.0%) | 0 (0.0%) |
| Health Diagnosing & Treating | 31 (7.3%) | 395 (92.7%) |
| Health Technologists | 31 (14.8%) | 179 (85.2%) |
| Total (Category) | 474 (31.4%) | 1,038 (68.6%) |
| Total (Overall) | 2,641 (52.3%) | 2,405 (47.7%) |
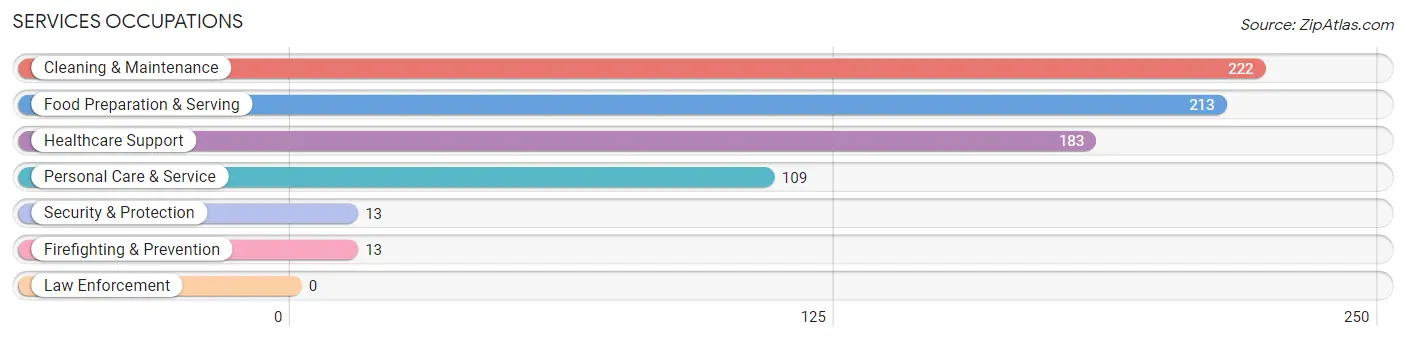
Services Occupations
The most common Services occupations in Little River County are Cleaning & Maintenance (222 | 4.4%), Food Preparation & Serving (213 | 4.2%), Healthcare Support (183 | 3.6%), Personal Care & Service (109 | 2.2%), and Security & Protection (13 | 0.3%).
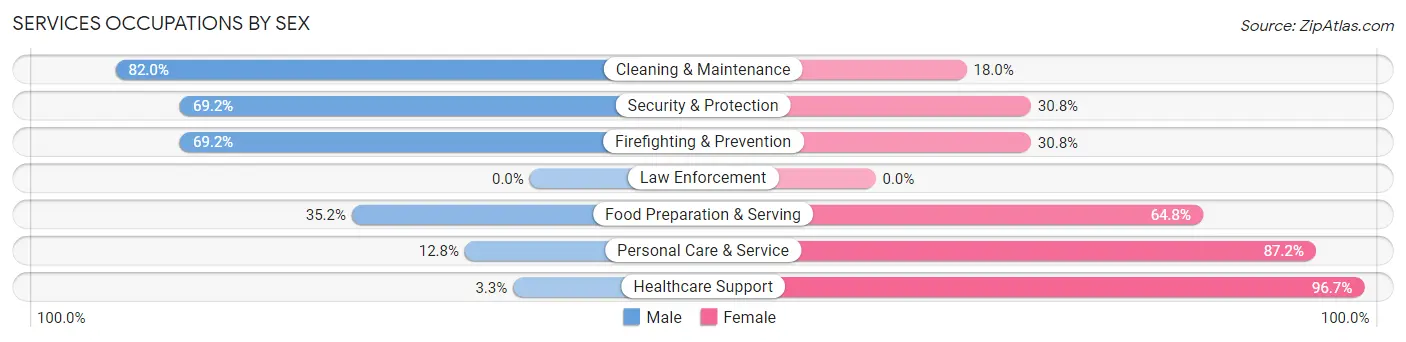
Services Occupations by Sex
Within the Services occupations in Little River County, the most male-oriented occupations are Cleaning & Maintenance (82.0%), Security & Protection (69.2%), and Firefighting & Prevention (69.2%), while the most female-oriented occupations are Healthcare Support (96.7%), Personal Care & Service (87.2%), and Food Preparation & Serving (64.8%).
| Occupation | Male | Female |
| Healthcare Support | 6 (3.3%) | 177 (96.7%) |
| Security & Protection | 9 (69.2%) | 4 (30.8%) |
| Firefighting & Prevention | 9 (69.2%) | 4 (30.8%) |
| Law Enforcement | 0 (0.0%) | 0 (0.0%) |
| Food Preparation & Serving | 75 (35.2%) | 138 (64.8%) |
| Cleaning & Maintenance | 182 (82.0%) | 40 (18.0%) |
| Personal Care & Service | 14 (12.8%) | 95 (87.2%) |
| Total (Category) | 286 (38.7%) | 454 (61.4%) |
| Total (Overall) | 2,641 (52.3%) | 2,405 (47.7%) |
Sales and Office Occupations
The most common Sales and Office occupations in Little River County are Office & Administration (572 | 11.3%), and Sales & Related (349 | 6.9%).
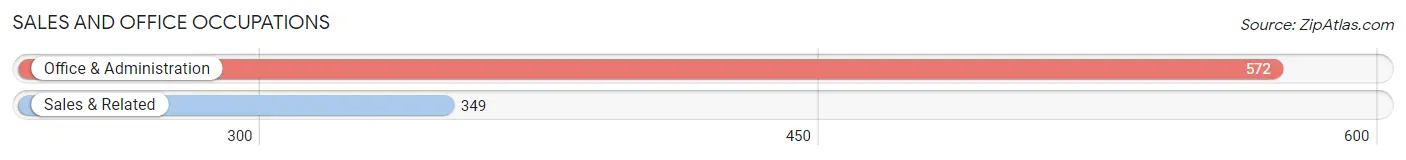
Sales and Office Occupations by Sex

| Occupation | Male | Female |
| Sales & Related | 109 (31.2%) | 240 (68.8%) |
| Office & Administration | 98 (17.1%) | 474 (82.9%) |
| Total (Category) | 207 (22.5%) | 714 (77.5%) |
| Total (Overall) | 2,641 (52.3%) | 2,405 (47.7%) |
Natural Resources, Construction and Maintenance Occupations
The most common Natural Resources, Construction and Maintenance occupations in Little River County are Construction & Extraction (359 | 7.1%), Installation, Maintenance & Repair (326 | 6.5%), and Farming, Fishing & Forestry (30 | 0.6%).
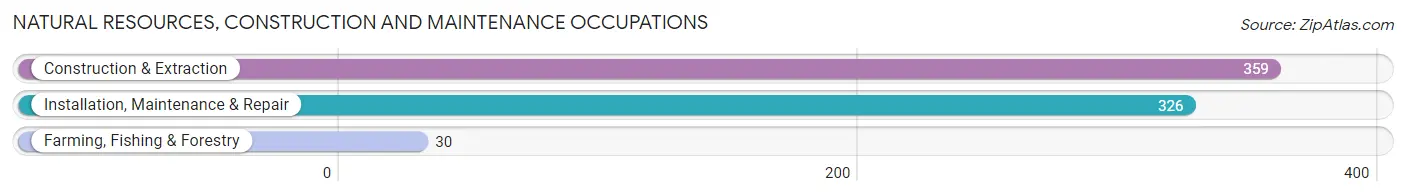
Natural Resources, Construction and Maintenance Occupations by Sex
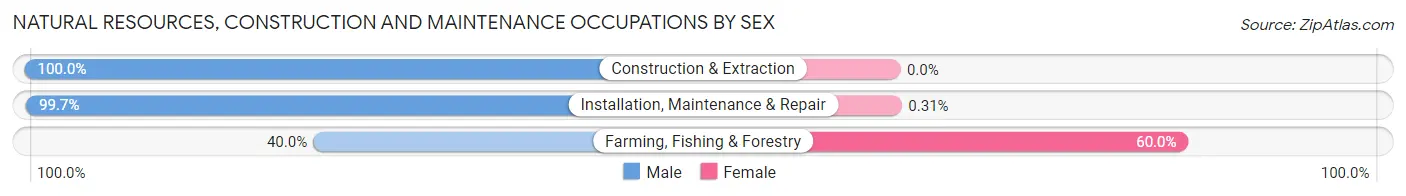
| Occupation | Male | Female |
| Farming, Fishing & Forestry | 12 (40.0%) | 18 (60.0%) |
| Construction & Extraction | 359 (100.0%) | 0 (0.0%) |
| Installation, Maintenance & Repair | 325 (99.7%) | 1 (0.3%) |
| Total (Category) | 696 (97.3%) | 19 (2.7%) |
| Total (Overall) | 2,641 (52.3%) | 2,405 (47.7%) |
Production, Transportation and Moving Occupations
The most common Production, Transportation and Moving occupations in Little River County are Production (704 | 14.0%), Material Moving (275 | 5.4%), and Transportation (179 | 3.5%).
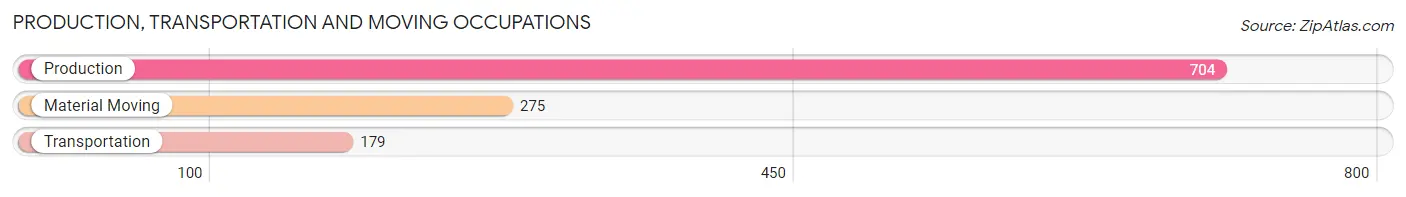
Production, Transportation and Moving Occupations by Sex
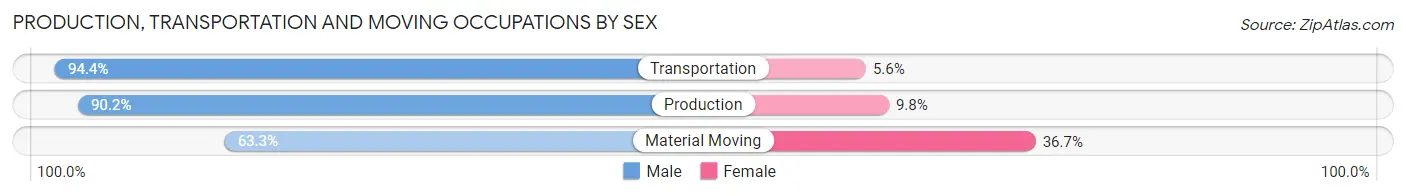
| Occupation | Male | Female |
| Production | 635 (90.2%) | 69 (9.8%) |
| Transportation | 169 (94.4%) | 10 (5.6%) |
| Material Moving | 174 (63.3%) | 101 (36.7%) |
| Total (Category) | 978 (84.5%) | 180 (15.5%) |
| Total (Overall) | 2,641 (52.3%) | 2,405 (47.7%) |
Employment Industries by Sex in Little River County
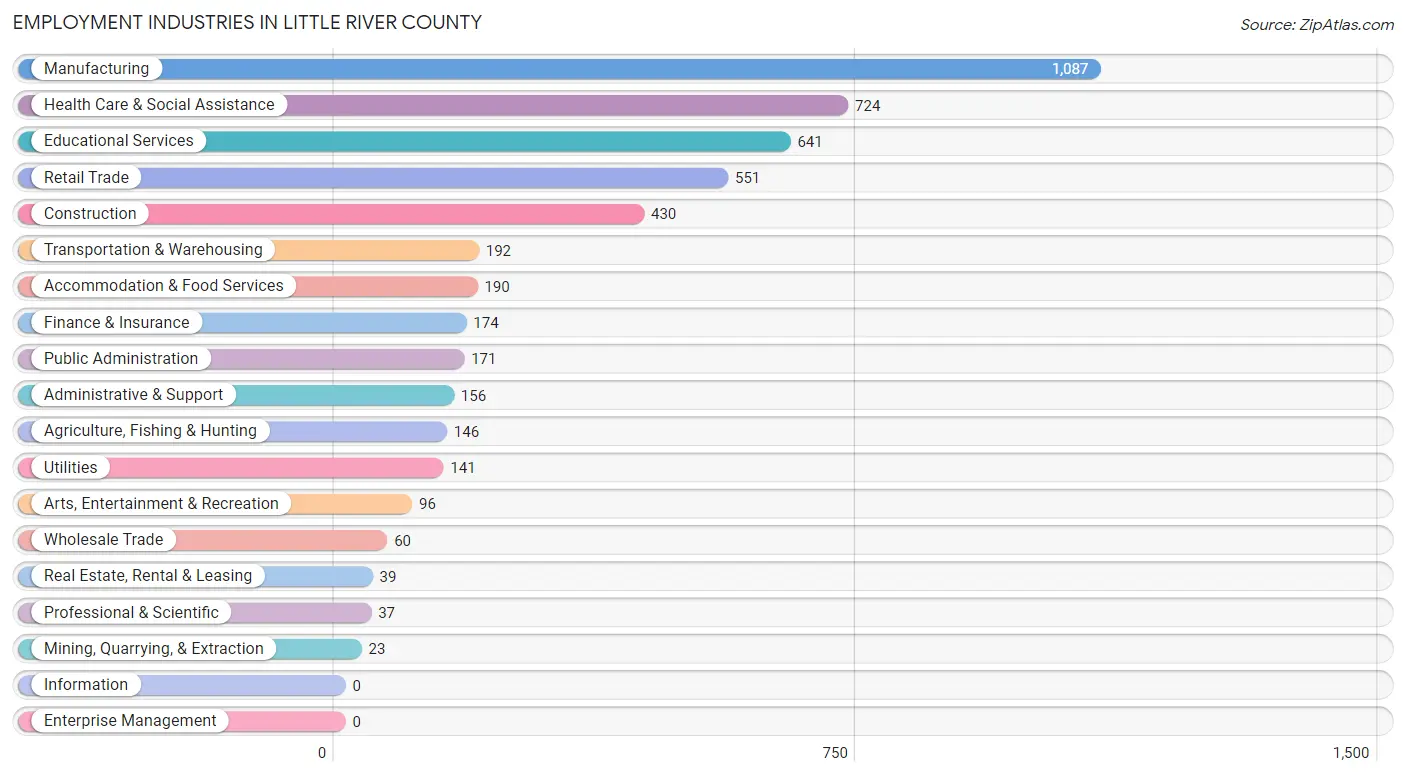
Employment Industries in Little River County
The major employment industries in Little River County include Manufacturing (1,087 | 21.5%), Health Care & Social Assistance (724 | 14.3%), Educational Services (641 | 12.7%), Retail Trade (551 | 10.9%), and Construction (430 | 8.5%).
Employment Industries by Sex in Little River County
The Little River County industries that see more men than women are Mining, Quarrying, & Extraction (100.0%), Utilities (100.0%), and Construction (94.4%), whereas the industries that tend to have a higher number of women are Educational Services (85.0%), Health Care & Social Assistance (83.6%), and Public Administration (79.5%).
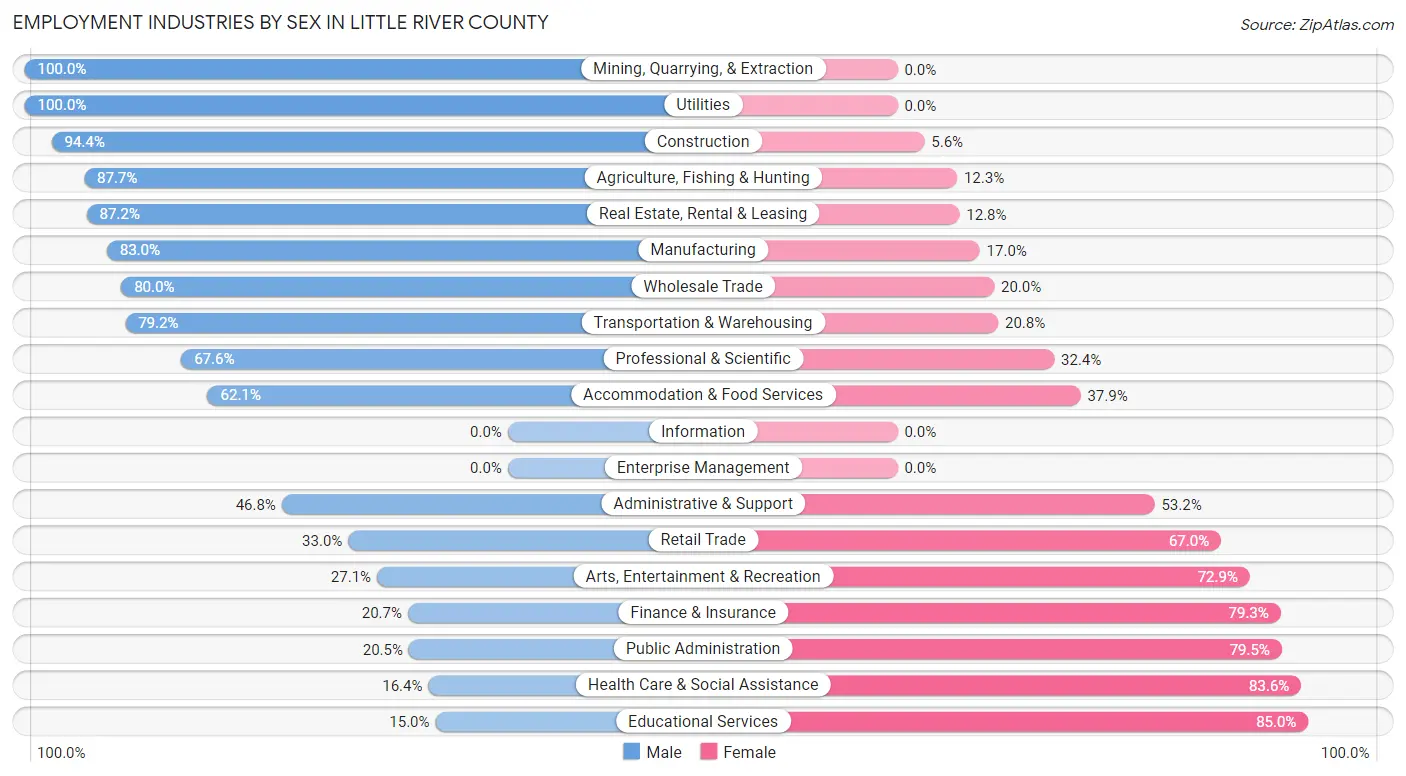
| Industry | Male | Female |
| Agriculture, Fishing & Hunting | 128 (87.7%) | 18 (12.3%) |
| Mining, Quarrying, & Extraction | 23 (100.0%) | 0 (0.0%) |
| Construction | 406 (94.4%) | 24 (5.6%) |
| Manufacturing | 902 (83.0%) | 185 (17.0%) |
| Wholesale Trade | 48 (80.0%) | 12 (20.0%) |
| Retail Trade | 182 (33.0%) | 369 (67.0%) |
| Transportation & Warehousing | 152 (79.2%) | 40 (20.8%) |
| Utilities | 141 (100.0%) | 0 (0.0%) |
| Information | 0 (0.0%) | 0 (0.0%) |
| Finance & Insurance | 36 (20.7%) | 138 (79.3%) |
| Real Estate, Rental & Leasing | 34 (87.2%) | 5 (12.8%) |
| Professional & Scientific | 25 (67.6%) | 12 (32.4%) |
| Enterprise Management | 0 (0.0%) | 0 (0.0%) |
| Administrative & Support | 73 (46.8%) | 83 (53.2%) |
| Educational Services | 96 (15.0%) | 545 (85.0%) |
| Health Care & Social Assistance | 119 (16.4%) | 605 (83.6%) |
| Arts, Entertainment & Recreation | 26 (27.1%) | 70 (72.9%) |
| Accommodation & Food Services | 118 (62.1%) | 72 (37.9%) |
| Public Administration | 35 (20.5%) | 136 (79.5%) |
| Total | 2,641 (52.3%) | 2,405 (47.7%) |
Education in Little River County
School Enrollment in Little River County
The most common levels of schooling among the 2,462 students in Little River County are middle school (666 | 27.1%), high school (596 | 24.2%), and elementary school (511 | 20.8%).
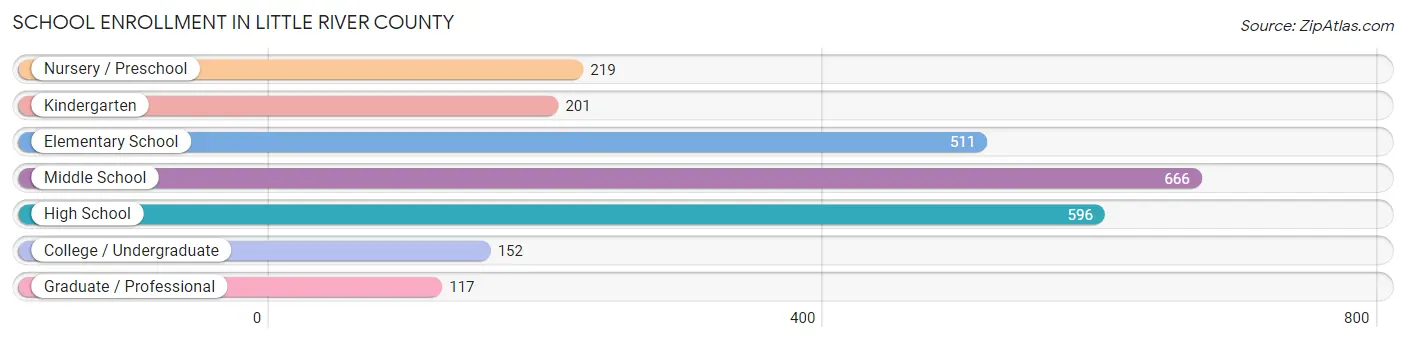
| School Level | # Students | % Students |
| Nursery / Preschool | 219 | 8.9% |
| Kindergarten | 201 | 8.2% |
| Elementary School | 511 | 20.8% |
| Middle School | 666 | 27.1% |
| High School | 596 | 24.2% |
| College / Undergraduate | 152 | 6.2% |
| Graduate / Professional | 117 | 4.8% |
| Total | 2,462 | 100.0% |
School Enrollment by Age by Funding Source in Little River County
Out of a total of 2,462 students who are enrolled in schools in Little River County, 140 (5.7%) attend a private institution, while the remaining 2,322 (94.3%) are enrolled in public schools. The age group of 3 to 4 year olds has the highest likelihood of being enrolled in private schools, with 20 (13.3% in the age bracket) enrolled. Conversely, the age group of 18 to 19 year olds has the lowest likelihood of being enrolled in a private school, with 36 (100.0% in the age bracket) attending a public institution.
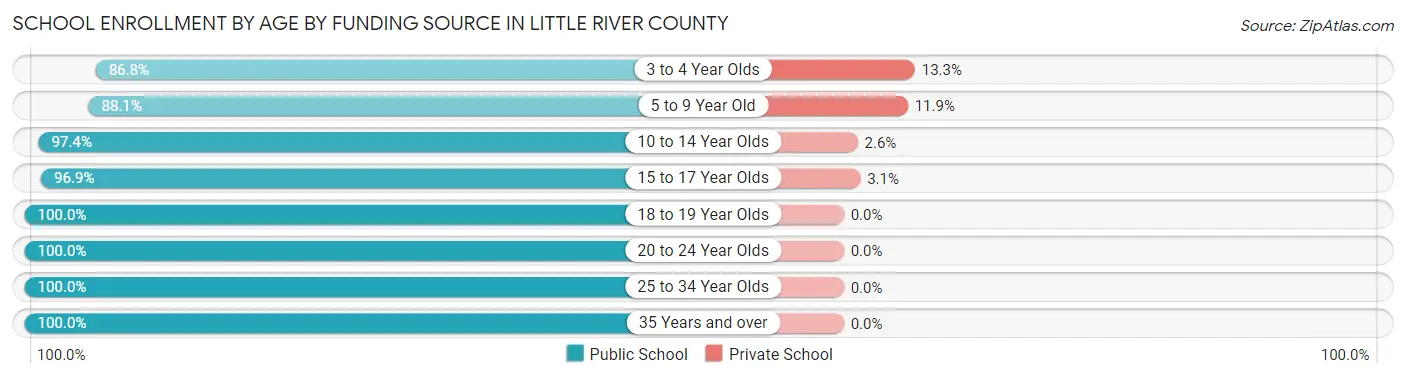
| Age Bracket | Public School | Private School |
| 3 to 4 Year Olds | 131 (86.8%) | 20 (13.3%) |
| 5 to 9 Year Old | 642 (88.1%) | 87 (11.9%) |
| 10 to 14 Year Olds | 749 (97.4%) | 20 (2.6%) |
| 15 to 17 Year Olds | 441 (96.9%) | 14 (3.1%) |
| 18 to 19 Year Olds | 36 (100.0%) | 0 (0.0%) |
| 20 to 24 Year Olds | 62 (100.0%) | 0 (0.0%) |
| 25 to 34 Year Olds | 119 (100.0%) | 0 (0.0%) |
| 35 Years and over | 141 (100.0%) | 0 (0.0%) |
| Total | 2,322 (94.3%) | 140 (5.7%) |
Educational Attainment by Field of Study in Little River County
Education (560 | 40.0%), business (196 | 14.0%), science & technology (160 | 11.4%), bio, nature & agricultural (121 | 8.6%), and computers & mathematics (99 | 7.1%) are the most common fields of study among 1,401 individuals in Little River County who have obtained a bachelor's degree or higher.
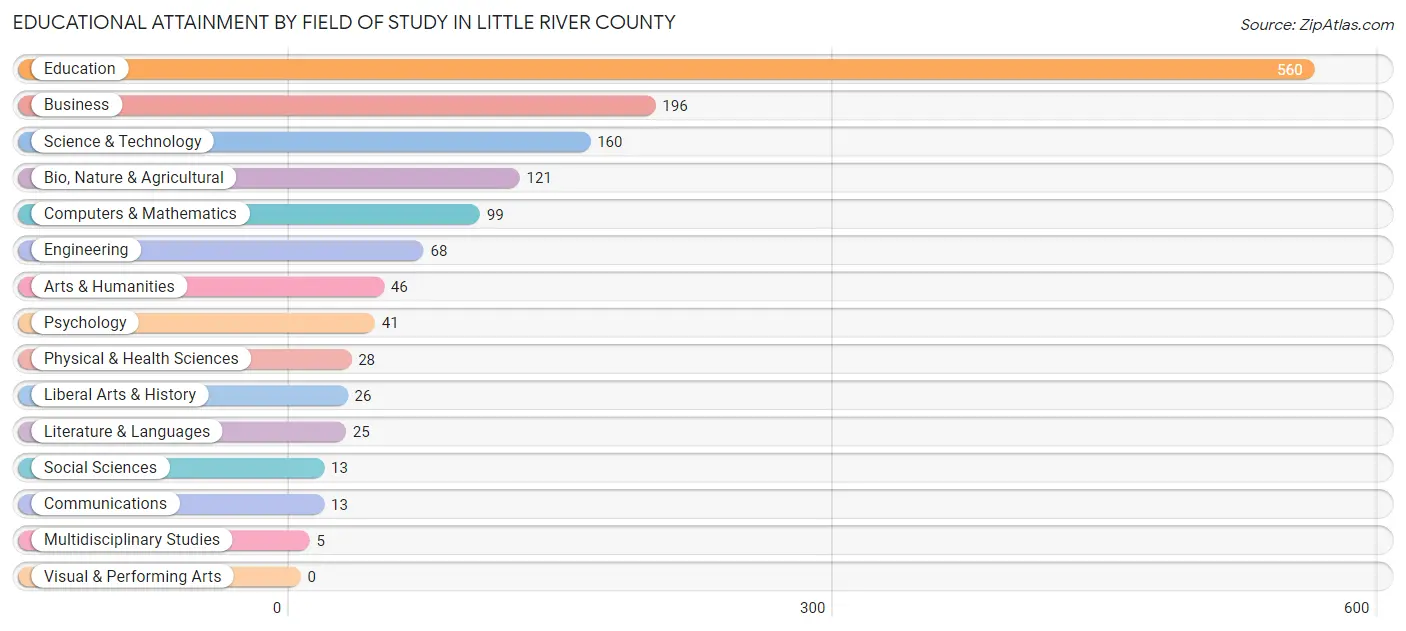
| Field of Study | # Graduates | % Graduates |
| Computers & Mathematics | 99 | 7.1% |
| Bio, Nature & Agricultural | 121 | 8.6% |
| Physical & Health Sciences | 28 | 2.0% |
| Psychology | 41 | 2.9% |
| Social Sciences | 13 | 0.9% |
| Engineering | 68 | 4.9% |
| Multidisciplinary Studies | 5 | 0.4% |
| Science & Technology | 160 | 11.4% |
| Business | 196 | 14.0% |
| Education | 560 | 40.0% |
| Literature & Languages | 25 | 1.8% |
| Liberal Arts & History | 26 | 1.9% |
| Visual & Performing Arts | 0 | 0.0% |
| Communications | 13 | 0.9% |
| Arts & Humanities | 46 | 3.3% |
| Total | 1,401 | 100.0% |
Transportation & Commute in Little River County
Vehicle Availability by Sex in Little River County
The most prevalent vehicle ownership categories in Little River County are males with 3 vehicles (949, accounting for 36.2%) and females with 3 vehicles (732, making up 39.7%).
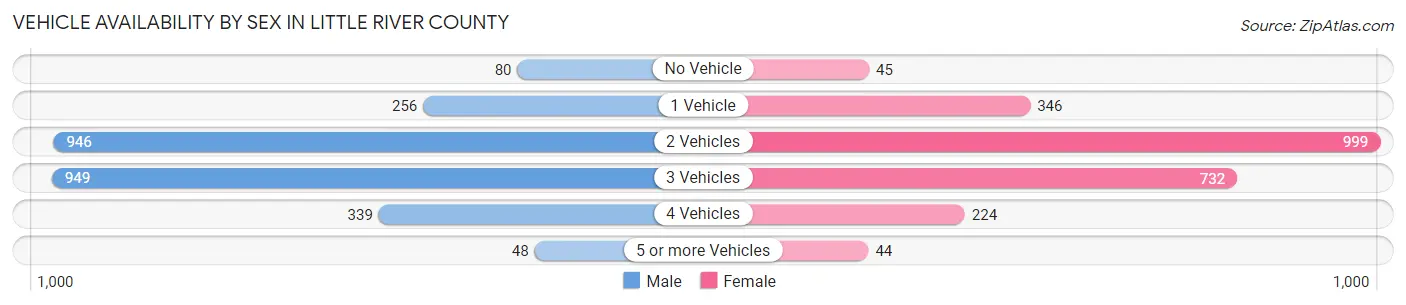
| Vehicles Available | Male | Female |
| No Vehicle | 80 (3.1%) | 45 (1.9%) |
| 1 Vehicle | 256 (9.8%) | 346 (14.5%) |
| 2 Vehicles | 946 (36.1%) | 999 (41.8%) |
| 3 Vehicles | 949 (36.2%) | 732 (30.6%) |
| 4 Vehicles | 339 (13.0%) | 224 (9.4%) |
| 5 or more Vehicles | 48 (1.8%) | 44 (1.8%) |
| Total | 2,618 (100.0%) | 2,390 (100.0%) |
Commute Time in Little River County
The most frequently occuring commute durations in Little River County are 30 to 34 minutes (865 commuters, 17.7%), 5 to 9 minutes (691 commuters, 14.1%), and 45 to 59 minutes (586 commuters, 12.0%).
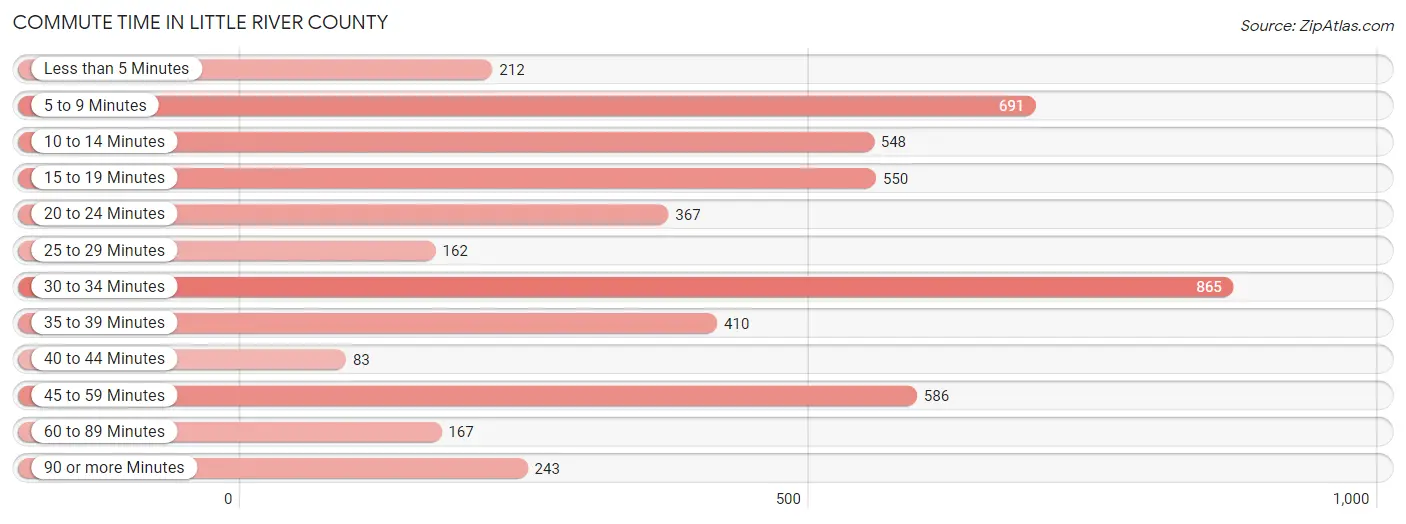
| Commute Time | # Commuters | % Commuters |
| Less than 5 Minutes | 212 | 4.3% |
| 5 to 9 Minutes | 691 | 14.1% |
| 10 to 14 Minutes | 548 | 11.2% |
| 15 to 19 Minutes | 550 | 11.3% |
| 20 to 24 Minutes | 367 | 7.5% |
| 25 to 29 Minutes | 162 | 3.3% |
| 30 to 34 Minutes | 865 | 17.7% |
| 35 to 39 Minutes | 410 | 8.4% |
| 40 to 44 Minutes | 83 | 1.7% |
| 45 to 59 Minutes | 586 | 12.0% |
| 60 to 89 Minutes | 167 | 3.4% |
| 90 or more Minutes | 243 | 5.0% |
Commute Time by Sex in Little River County
The most common commute times in Little River County are 15 to 19 minutes (417 commuters, 16.1%) for males and 30 to 34 minutes (521 commuters, 22.7%) for females.
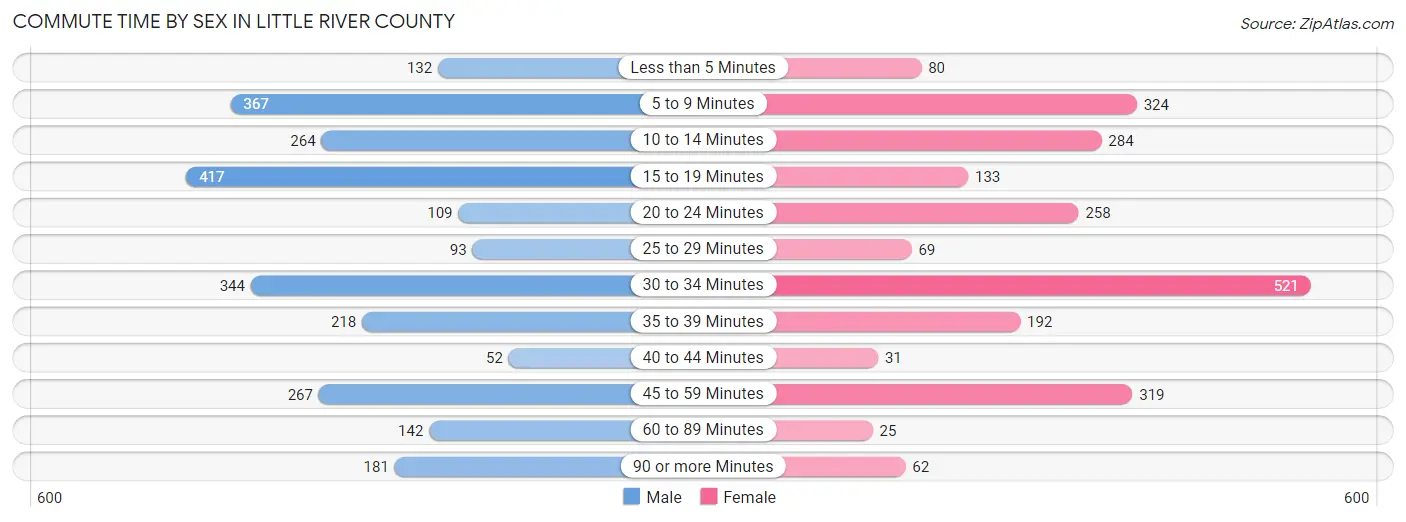
| Commute Time | Male | Female |
| Less than 5 Minutes | 132 (5.1%) | 80 (3.5%) |
| 5 to 9 Minutes | 367 (14.2%) | 324 (14.1%) |
| 10 to 14 Minutes | 264 (10.2%) | 284 (12.4%) |
| 15 to 19 Minutes | 417 (16.1%) | 133 (5.8%) |
| 20 to 24 Minutes | 109 (4.2%) | 258 (11.2%) |
| 25 to 29 Minutes | 93 (3.6%) | 69 (3.0%) |
| 30 to 34 Minutes | 344 (13.3%) | 521 (22.7%) |
| 35 to 39 Minutes | 218 (8.4%) | 192 (8.4%) |
| 40 to 44 Minutes | 52 (2.0%) | 31 (1.3%) |
| 45 to 59 Minutes | 267 (10.3%) | 319 (13.9%) |
| 60 to 89 Minutes | 142 (5.5%) | 25 (1.1%) |
| 90 or more Minutes | 181 (7.0%) | 62 (2.7%) |
Time of Departure to Work by Sex in Little River County
The most frequent times of departure to work in Little River County are 6:00 AM to 6:29 AM (381, 14.7%) for males and 7:00 AM to 7:29 AM (498, 21.7%) for females.
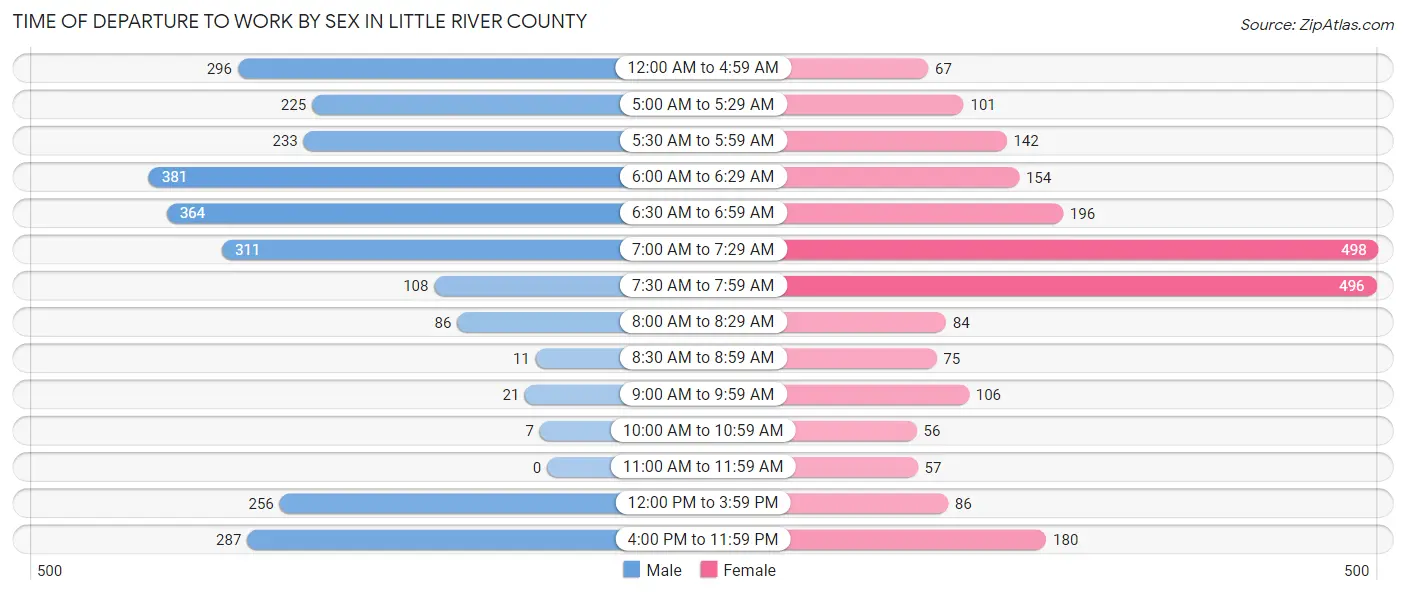
| Time of Departure | Male | Female |
| 12:00 AM to 4:59 AM | 296 (11.5%) | 67 (2.9%) |
| 5:00 AM to 5:29 AM | 225 (8.7%) | 101 (4.4%) |
| 5:30 AM to 5:59 AM | 233 (9.0%) | 142 (6.2%) |
| 6:00 AM to 6:29 AM | 381 (14.7%) | 154 (6.7%) |
| 6:30 AM to 6:59 AM | 364 (14.1%) | 196 (8.5%) |
| 7:00 AM to 7:29 AM | 311 (12.0%) | 498 (21.7%) |
| 7:30 AM to 7:59 AM | 108 (4.2%) | 496 (21.6%) |
| 8:00 AM to 8:29 AM | 86 (3.3%) | 84 (3.7%) |
| 8:30 AM to 8:59 AM | 11 (0.4%) | 75 (3.3%) |
| 9:00 AM to 9:59 AM | 21 (0.8%) | 106 (4.6%) |
| 10:00 AM to 10:59 AM | 7 (0.3%) | 56 (2.4%) |
| 11:00 AM to 11:59 AM | 0 (0.0%) | 57 (2.5%) |
| 12:00 PM to 3:59 PM | 256 (9.9%) | 86 (3.7%) |
| 4:00 PM to 11:59 PM | 287 (11.1%) | 180 (7.8%) |
| Total | 2,586 (100.0%) | 2,298 (100.0%) |
Housing Occupancy in Little River County
Occupancy by Ownership in Little River County
Of the total 4,734 dwellings in Little River County, owner-occupied units account for 3,971 (83.9%), while renter-occupied units make up 763 (16.1%).
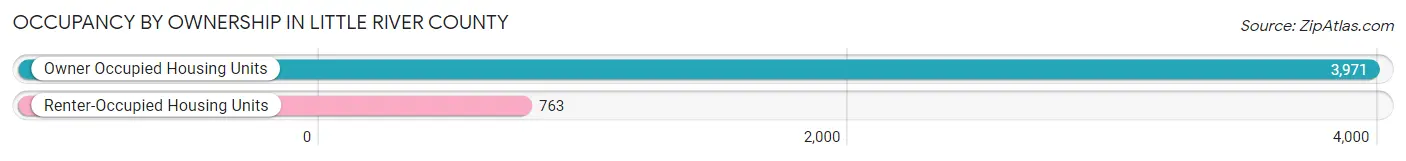
| Occupancy | # Housing Units | % Housing Units |
| Owner Occupied Housing Units | 3,971 | 83.9% |
| Renter-Occupied Housing Units | 763 | 16.1% |
| Total Occupied Housing Units | 4,734 | 100.0% |
Occupancy by Household Size in Little River County
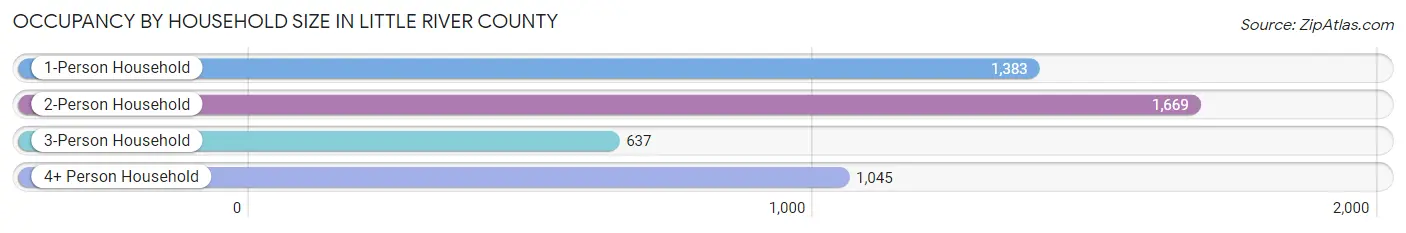
| Household Size | # Housing Units | % Housing Units |
| 1-Person Household | 1,383 | 29.2% |
| 2-Person Household | 1,669 | 35.3% |
| 3-Person Household | 637 | 13.5% |
| 4+ Person Household | 1,045 | 22.1% |
| Total Housing Units | 4,734 | 100.0% |
Occupancy by Ownership by Household Size in Little River County
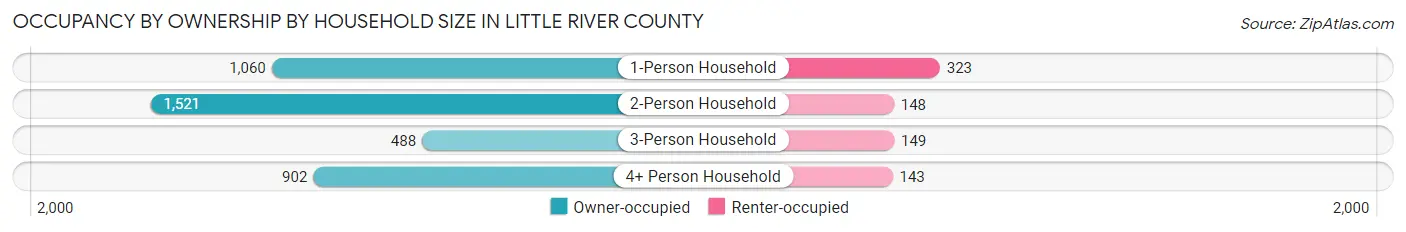
| Household Size | Owner-occupied | Renter-occupied |
| 1-Person Household | 1,060 (76.6%) | 323 (23.4%) |
| 2-Person Household | 1,521 (91.1%) | 148 (8.9%) |
| 3-Person Household | 488 (76.6%) | 149 (23.4%) |
| 4+ Person Household | 902 (86.3%) | 143 (13.7%) |
| Total Housing Units | 3,971 (83.9%) | 763 (16.1%) |
Occupancy by Educational Attainment in Little River County
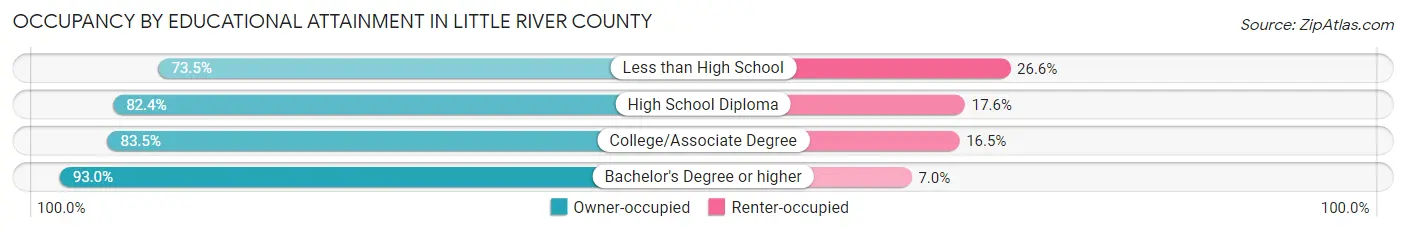
| Household Size | Owner-occupied | Renter-occupied |
| Less than High School | 260 (73.5%) | 94 (26.6%) |
| High School Diploma | 1,753 (82.4%) | 374 (17.6%) |
| College/Associate Degree | 1,213 (83.5%) | 239 (16.5%) |
| Bachelor's Degree or higher | 745 (93.0%) | 56 (7.0%) |
Occupancy by Age of Householder in Little River County
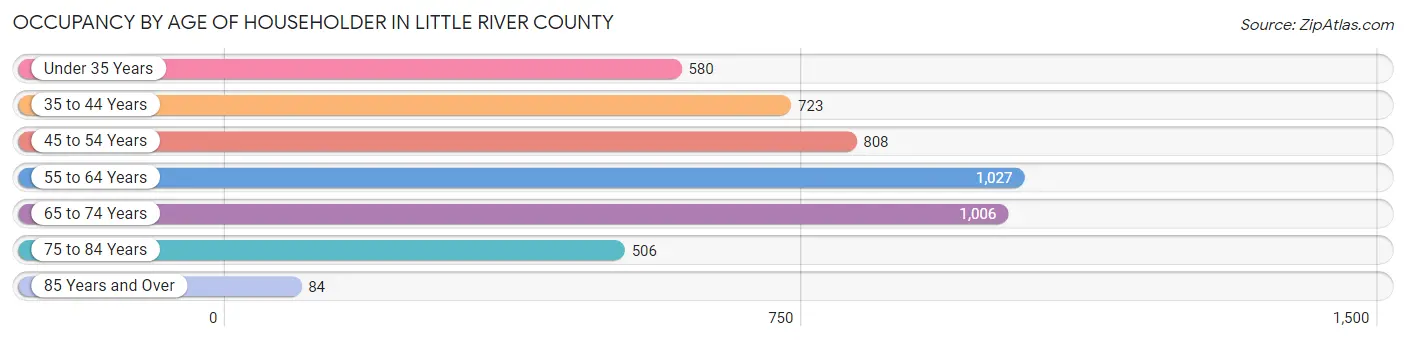
| Age Bracket | # Households | % Households |
| Under 35 Years | 580 | 12.2% |
| 35 to 44 Years | 723 | 15.3% |
| 45 to 54 Years | 808 | 17.1% |
| 55 to 64 Years | 1,027 | 21.7% |
| 65 to 74 Years | 1,006 | 21.2% |
| 75 to 84 Years | 506 | 10.7% |
| 85 Years and Over | 84 | 1.8% |
| Total | 4,734 | 100.0% |
Housing Finances in Little River County
Median Income by Occupancy in Little River County
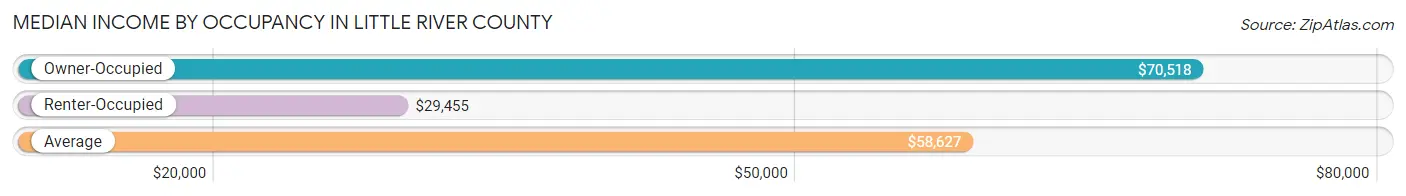
| Occupancy Type | # Households | Median Income |
| Owner-Occupied | 3,971 (83.9%) | $70,518 |
| Renter-Occupied | 763 (16.1%) | $29,455 |
| Average | 4,734 (100.0%) | $58,627 |
Occupancy by Householder Income Bracket in Little River County
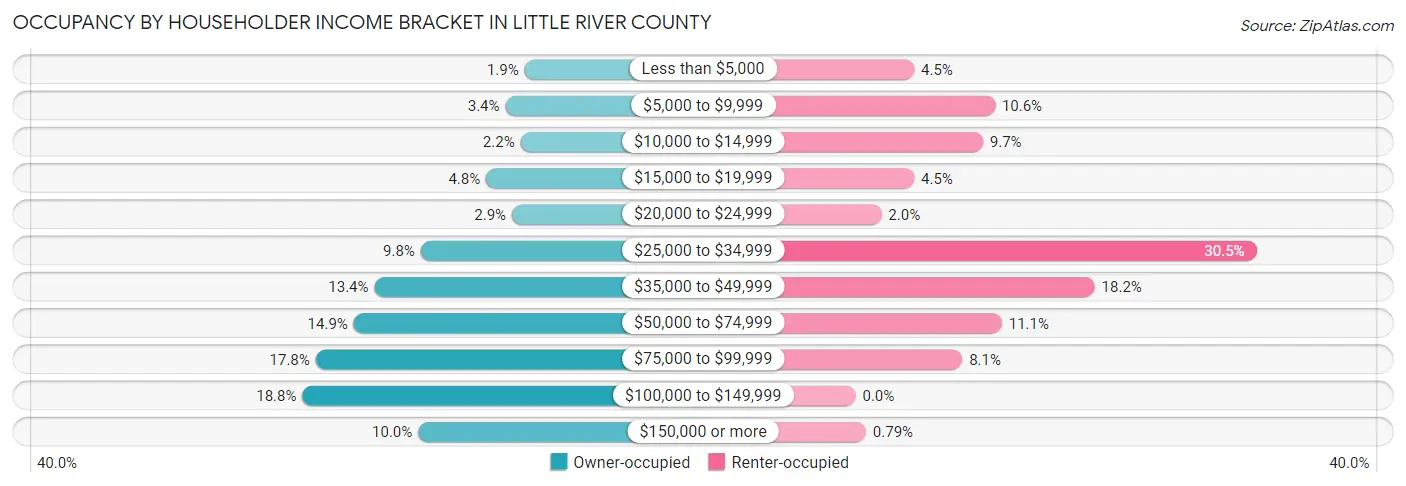
| Income Bracket | Owner-occupied | Renter-occupied |
| Less than $5,000 | 76 (1.9%) | 34 (4.5%) |
| $5,000 to $9,999 | 134 (3.4%) | 81 (10.6%) |
| $10,000 to $14,999 | 88 (2.2%) | 74 (9.7%) |
| $15,000 to $19,999 | 192 (4.8%) | 34 (4.5%) |
| $20,000 to $24,999 | 114 (2.9%) | 15 (2.0%) |
| $25,000 to $34,999 | 390 (9.8%) | 233 (30.5%) |
| $35,000 to $49,999 | 530 (13.4%) | 139 (18.2%) |
| $50,000 to $74,999 | 593 (14.9%) | 85 (11.1%) |
| $75,000 to $99,999 | 708 (17.8%) | 62 (8.1%) |
| $100,000 to $149,999 | 748 (18.8%) | 0 (0.0%) |
| $150,000 or more | 398 (10.0%) | 6 (0.8%) |
| Total | 3,971 (100.0%) | 763 (100.0%) |
Monthly Housing Cost Tiers in Little River County
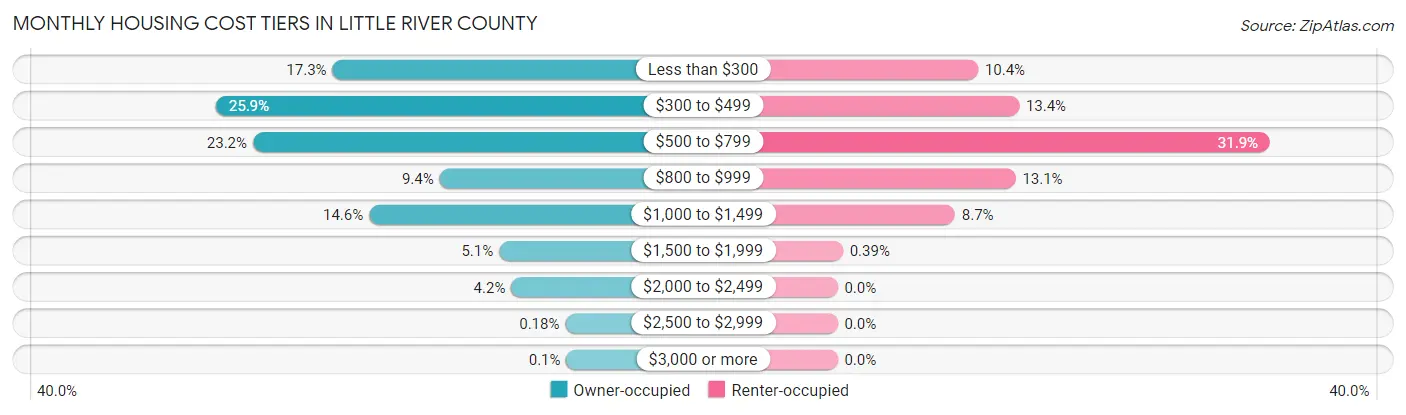
| Monthly Cost | Owner-occupied | Renter-occupied |
| Less than $300 | 688 (17.3%) | 79 (10.3%) |
| $300 to $499 | 1,029 (25.9%) | 102 (13.4%) |
| $500 to $799 | 921 (23.2%) | 243 (31.9%) |
| $800 to $999 | 375 (9.4%) | 100 (13.1%) |
| $1,000 to $1,499 | 581 (14.6%) | 66 (8.6%) |
| $1,500 to $1,999 | 201 (5.1%) | 3 (0.4%) |
| $2,000 to $2,499 | 165 (4.2%) | 0 (0.0%) |
| $2,500 to $2,999 | 7 (0.2%) | 0 (0.0%) |
| $3,000 or more | 4 (0.1%) | 0 (0.0%) |
| Total | 3,971 (100.0%) | 763 (100.0%) |
Physical Housing Characteristics in Little River County
Housing Structures in Little River County
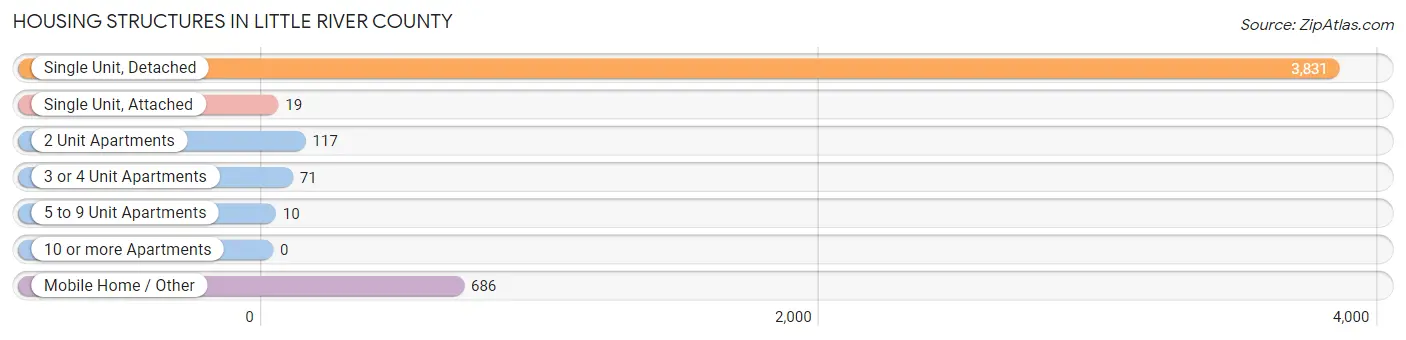
| Structure Type | # Housing Units | % Housing Units |
| Single Unit, Detached | 3,831 | 80.9% |
| Single Unit, Attached | 19 | 0.4% |
| 2 Unit Apartments | 117 | 2.5% |
| 3 or 4 Unit Apartments | 71 | 1.5% |
| 5 to 9 Unit Apartments | 10 | 0.2% |
| 10 or more Apartments | 0 | 0.0% |
| Mobile Home / Other | 686 | 14.5% |
| Total | 4,734 | 100.0% |
Housing Structures by Occupancy in Little River County
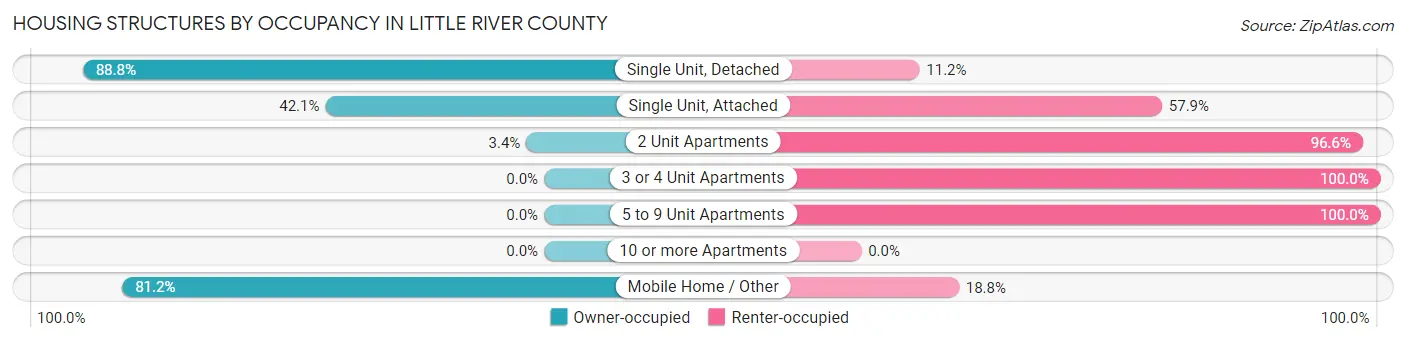
| Structure Type | Owner-occupied | Renter-occupied |
| Single Unit, Detached | 3,402 (88.8%) | 429 (11.2%) |
| Single Unit, Attached | 8 (42.1%) | 11 (57.9%) |
| 2 Unit Apartments | 4 (3.4%) | 113 (96.6%) |
| 3 or 4 Unit Apartments | 0 (0.0%) | 71 (100.0%) |
| 5 to 9 Unit Apartments | 0 (0.0%) | 10 (100.0%) |
| 10 or more Apartments | 0 (0.0%) | 0 (0.0%) |
| Mobile Home / Other | 557 (81.2%) | 129 (18.8%) |
| Total | 3,971 (83.9%) | 763 (16.1%) |
Housing Structures by Number of Rooms in Little River County
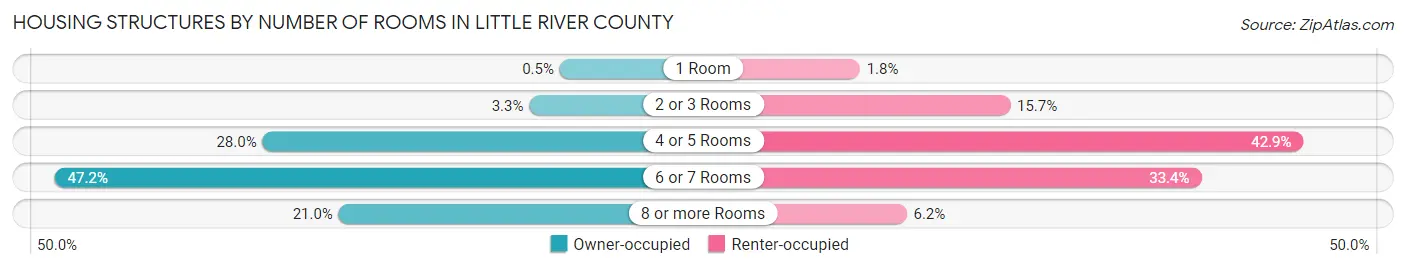
| Number of Rooms | Owner-occupied | Renter-occupied |
| 1 Room | 20 (0.5%) | 14 (1.8%) |
| 2 or 3 Rooms | 132 (3.3%) | 120 (15.7%) |
| 4 or 5 Rooms | 1,112 (28.0%) | 327 (42.9%) |
| 6 or 7 Rooms | 1,875 (47.2%) | 255 (33.4%) |
| 8 or more Rooms | 832 (20.9%) | 47 (6.2%) |
| Total | 3,971 (100.0%) | 763 (100.0%) |
Housing Structure by Heating Type in Little River County
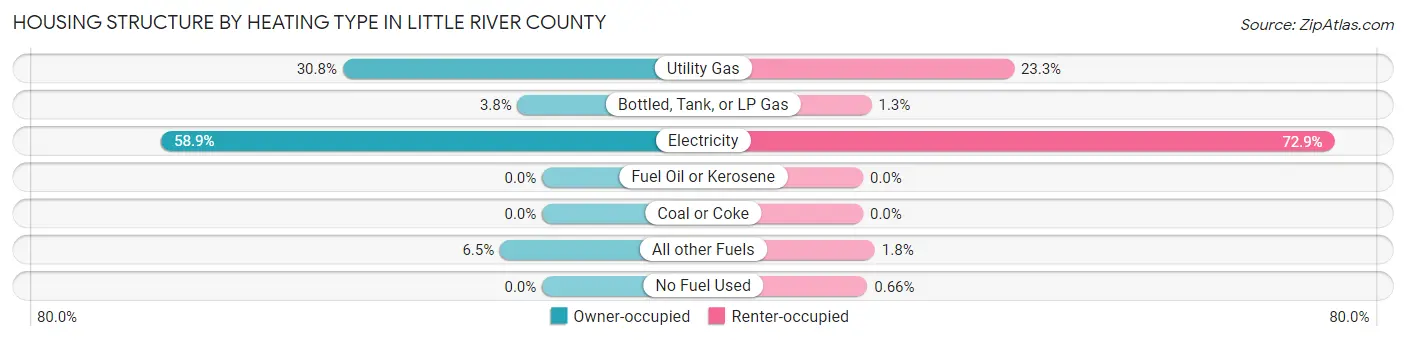
| Heating Type | Owner-occupied | Renter-occupied |
| Utility Gas | 1,224 (30.8%) | 178 (23.3%) |
| Bottled, Tank, or LP Gas | 151 (3.8%) | 10 (1.3%) |
| Electricity | 2,338 (58.9%) | 556 (72.9%) |
| Fuel Oil or Kerosene | 0 (0.0%) | 0 (0.0%) |
| Coal or Coke | 0 (0.0%) | 0 (0.0%) |
| All other Fuels | 258 (6.5%) | 14 (1.8%) |
| No Fuel Used | 0 (0.0%) | 5 (0.7%) |
| Total | 3,971 (100.0%) | 763 (100.0%) |
Household Vehicle Usage in Little River County
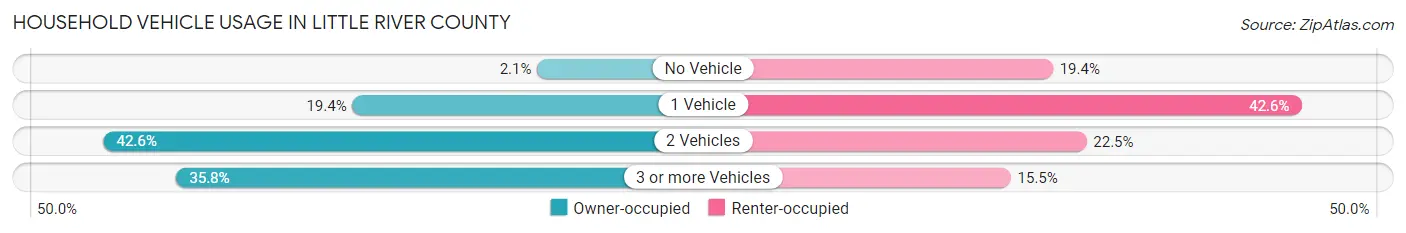
| Vehicles per Household | Owner-occupied | Renter-occupied |
| No Vehicle | 85 (2.1%) | 148 (19.4%) |
| 1 Vehicle | 770 (19.4%) | 325 (42.6%) |
| 2 Vehicles | 1,693 (42.6%) | 172 (22.5%) |
| 3 or more Vehicles | 1,423 (35.8%) | 118 (15.5%) |
| Total | 3,971 (100.0%) | 763 (100.0%) |
Real Estate & Mortgages in Little River County
Real Estate and Mortgage Overview in Little River County
| Characteristic | Without Mortgage | With Mortgage |
| Housing Units | 2,227 | 1,744 |
| Median Property Value | $94,000 | $119,200 |
| Median Household Income | $51,482 | $215 |
| Monthly Housing Costs | $373 | $4 |
| Real Estate Taxes | $460 | $225 |
Property Value by Mortgage Status in Little River County
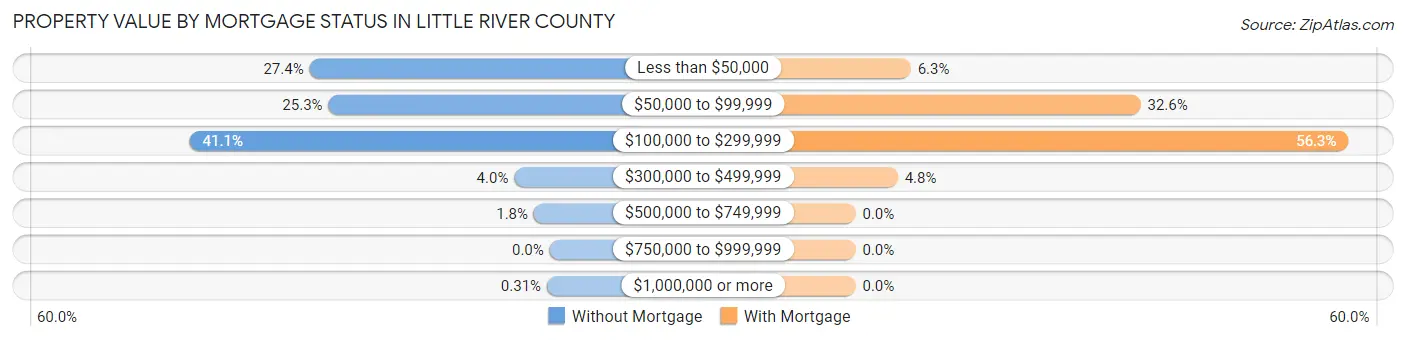
| Property Value | Without Mortgage | With Mortgage |
| Less than $50,000 | 611 (27.4%) | 110 (6.3%) |
| $50,000 to $99,999 | 563 (25.3%) | 568 (32.6%) |
| $100,000 to $299,999 | 916 (41.1%) | 982 (56.3%) |
| $300,000 to $499,999 | 90 (4.0%) | 84 (4.8%) |
| $500,000 to $749,999 | 40 (1.8%) | 0 (0.0%) |
| $750,000 to $999,999 | 0 (0.0%) | 0 (0.0%) |
| $1,000,000 or more | 7 (0.3%) | 0 (0.0%) |
| Total | 2,227 (100.0%) | 1,744 (100.0%) |
Household Income by Mortgage Status in Little River County
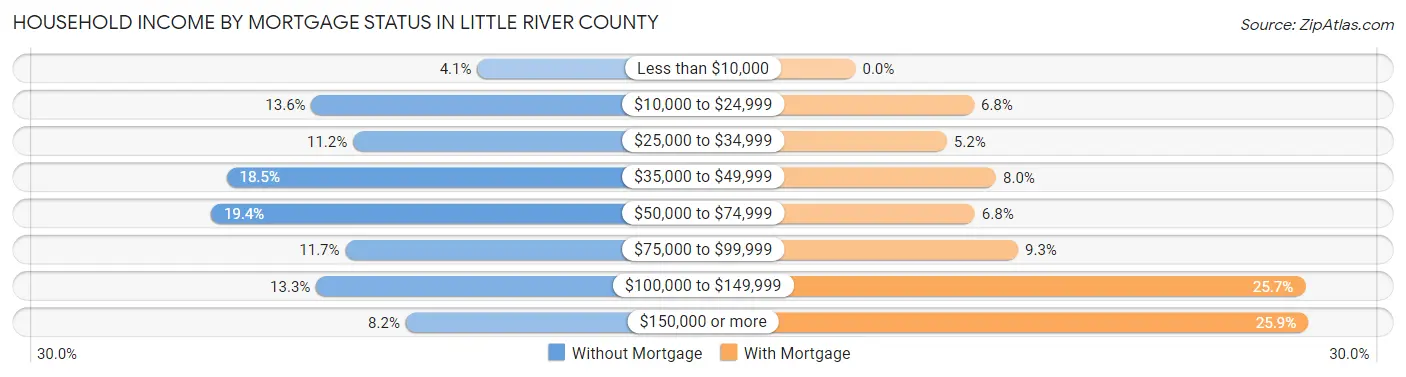
| Household Income | Without Mortgage | With Mortgage |
| Less than $10,000 | 92 (4.1%) | 0 (0.0%) |
| $10,000 to $24,999 | 303 (13.6%) | 118 (6.8%) |
| $25,000 to $34,999 | 250 (11.2%) | 91 (5.2%) |
| $35,000 to $49,999 | 411 (18.5%) | 140 (8.0%) |
| $50,000 to $74,999 | 431 (19.4%) | 119 (6.8%) |
| $75,000 to $99,999 | 260 (11.7%) | 162 (9.3%) |
| $100,000 to $149,999 | 297 (13.3%) | 448 (25.7%) |
| $150,000 or more | 183 (8.2%) | 451 (25.9%) |
| Total | 2,227 (100.0%) | 1,744 (100.0%) |
Property Value to Household Income Ratio in Little River County
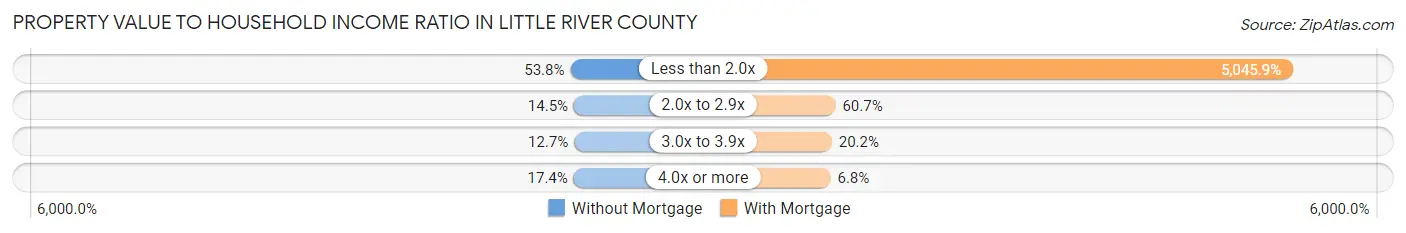
| Value-to-Income Ratio | Without Mortgage | With Mortgage |
| Less than 2.0x | 1,198 (53.8%) | 88,000 (5,045.9%) |
| 2.0x to 2.9x | 323 (14.5%) | 1,058 (60.7%) |
| 3.0x to 3.9x | 283 (12.7%) | 353 (20.2%) |
| 4.0x or more | 387 (17.4%) | 119 (6.8%) |
| Total | 2,227 (100.0%) | 1,744 (100.0%) |
Real Estate Taxes by Mortgage Status in Little River County
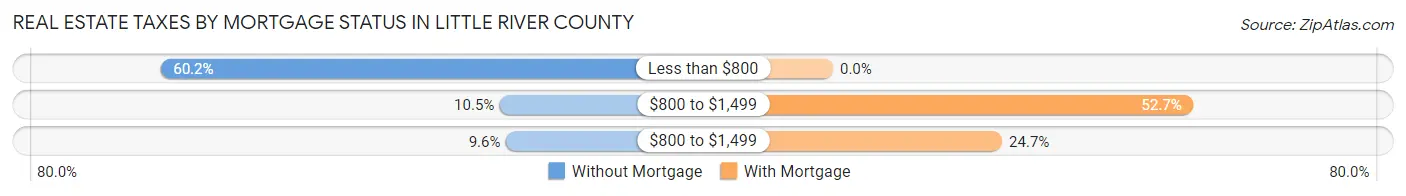
| Property Taxes | Without Mortgage | With Mortgage |
| Less than $800 | 1,340 (60.2%) | 0 (0.0%) |
| $800 to $1,499 | 234 (10.5%) | 919 (52.7%) |
| $800 to $1,499 | 214 (9.6%) | 431 (24.7%) |
| Total | 2,227 (100.0%) | 1,744 (100.0%) |
Health & Disability in Little River County
Health Insurance Coverage by Age in Little River County
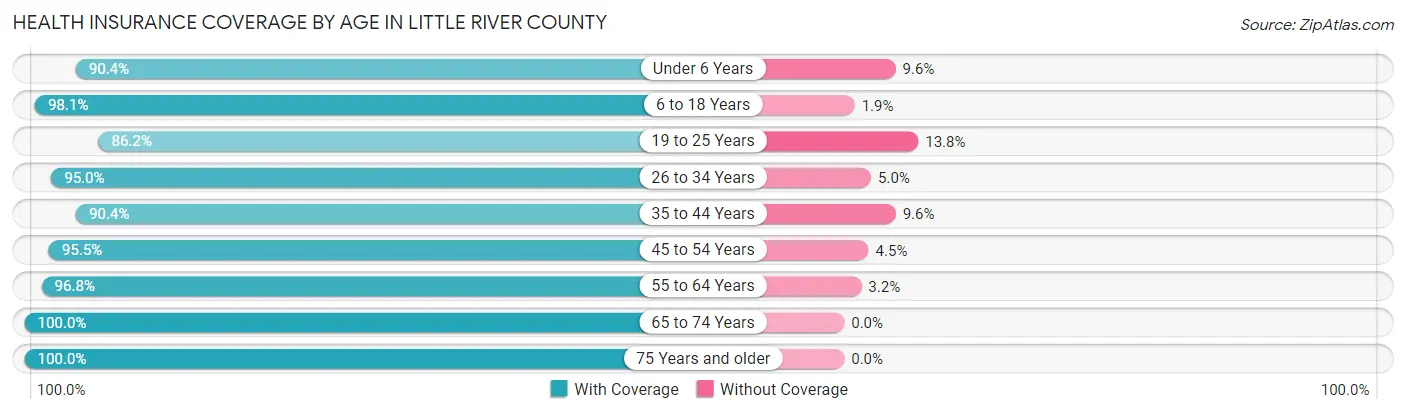
| Age Bracket | With Coverage | Without Coverage |
| Under 6 Years | 737 (90.4%) | 78 (9.6%) |
| 6 to 18 Years | 1,916 (98.1%) | 38 (1.9%) |
| 19 to 25 Years | 931 (86.2%) | 149 (13.8%) |
| 26 to 34 Years | 1,009 (95.0%) | 53 (5.0%) |
| 35 to 44 Years | 1,339 (90.4%) | 142 (9.6%) |
| 45 to 54 Years | 1,346 (95.5%) | 64 (4.5%) |
| 55 to 64 Years | 1,606 (96.8%) | 53 (3.2%) |
| 65 to 74 Years | 1,493 (100.0%) | 0 (0.0%) |
| 75 Years and older | 912 (100.0%) | 0 (0.0%) |
| Total | 11,289 (95.1%) | 577 (4.9%) |
Health Insurance Coverage by Citizenship Status in Little River County
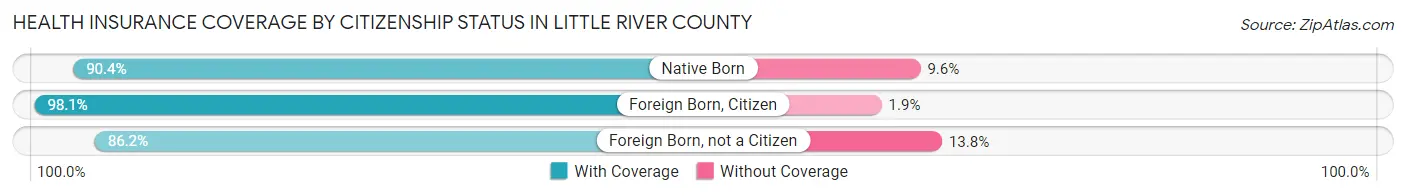
| Citizenship Status | With Coverage | Without Coverage |
| Native Born | 737 (90.4%) | 78 (9.6%) |
| Foreign Born, Citizen | 1,916 (98.1%) | 38 (1.9%) |
| Foreign Born, not a Citizen | 931 (86.2%) | 149 (13.8%) |
Health Insurance Coverage by Household Income in Little River County
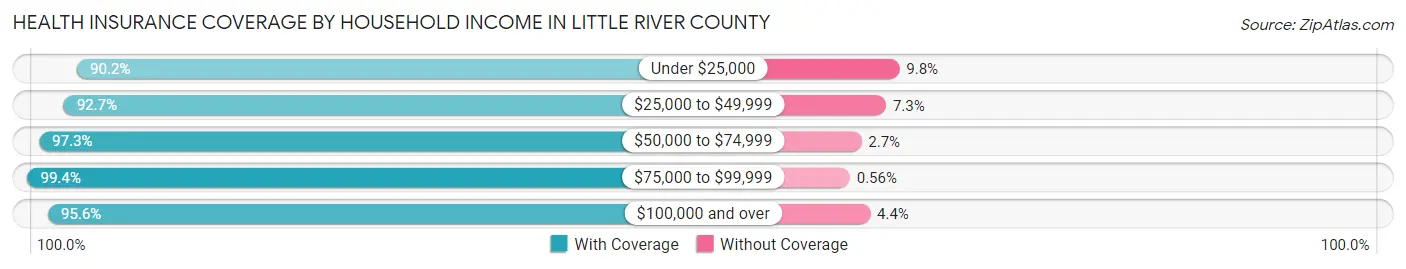
| Household Income | With Coverage | Without Coverage |
| Under $25,000 | 1,338 (90.2%) | 146 (9.8%) |
| $25,000 to $49,999 | 2,602 (92.7%) | 206 (7.3%) |
| $50,000 to $74,999 | 1,815 (97.3%) | 51 (2.7%) |
| $75,000 to $99,999 | 1,957 (99.4%) | 11 (0.6%) |
| $100,000 and over | 3,569 (95.6%) | 163 (4.4%) |
Public vs Private Health Insurance Coverage by Age in Little River County
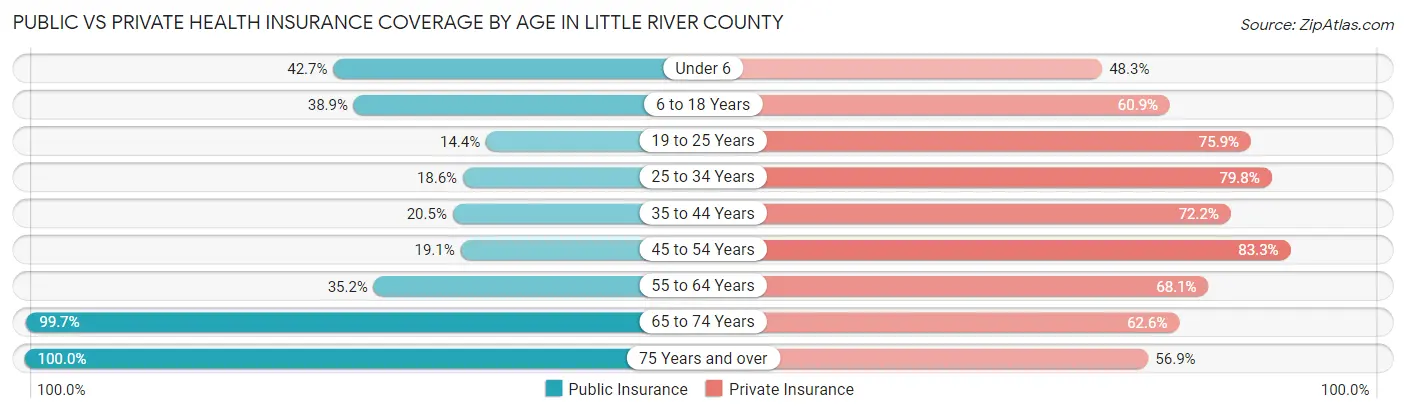
| Age Bracket | Public Insurance | Private Insurance |
| Under 6 | 348 (42.7%) | 394 (48.3%) |
| 6 to 18 Years | 760 (38.9%) | 1,190 (60.9%) |
| 19 to 25 Years | 155 (14.3%) | 820 (75.9%) |
| 25 to 34 Years | 198 (18.6%) | 847 (79.8%) |
| 35 to 44 Years | 304 (20.5%) | 1,069 (72.2%) |
| 45 to 54 Years | 269 (19.1%) | 1,174 (83.3%) |
| 55 to 64 Years | 584 (35.2%) | 1,129 (68.0%) |
| 65 to 74 Years | 1,488 (99.7%) | 935 (62.6%) |
| 75 Years and over | 912 (100.0%) | 519 (56.9%) |
| Total | 5,018 (42.3%) | 8,077 (68.1%) |
Disability Status by Sex by Age in Little River County
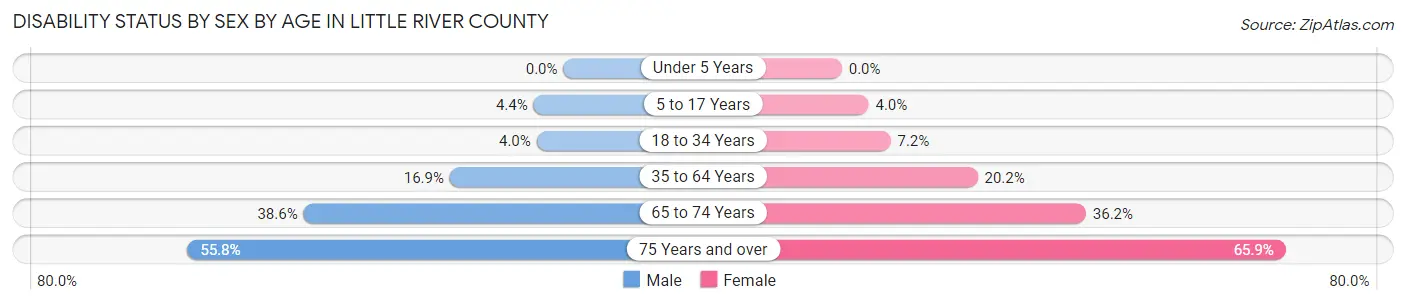
| Age Bracket | Male | Female |
| Under 5 Years | 0 (0.0%) | 0 (0.0%) |
| 5 to 17 Years | 50 (4.4%) | 34 (4.0%) |
| 18 to 34 Years | 47 (4.0%) | 77 (7.2%) |
| 35 to 64 Years | 349 (16.9%) | 500 (20.2%) |
| 65 to 74 Years | 262 (38.6%) | 295 (36.2%) |
| 75 Years and over | 239 (55.8%) | 319 (65.9%) |
Disability Class by Sex by Age in Little River County
Disability Class: Hearing Difficulty
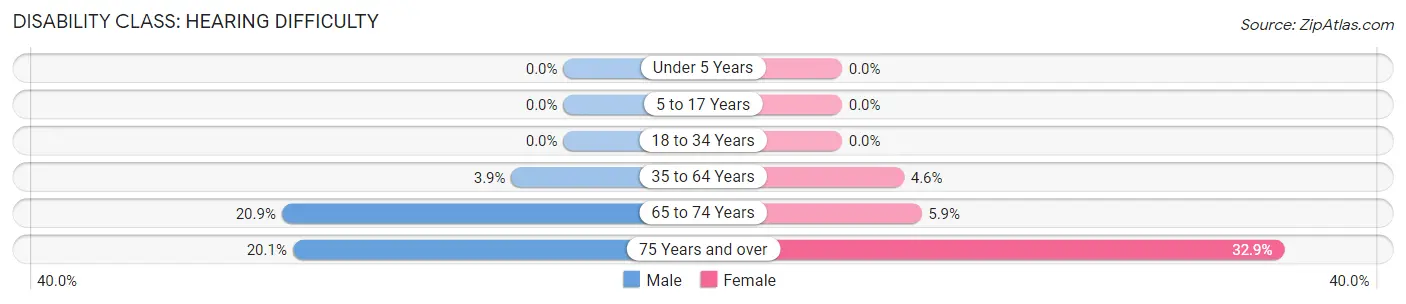
| Age Bracket | Male | Female |
| Under 5 Years | 0 (0.0%) | 0 (0.0%) |
| 5 to 17 Years | 0 (0.0%) | 0 (0.0%) |
| 18 to 34 Years | 0 (0.0%) | 0 (0.0%) |
| 35 to 64 Years | 80 (3.9%) | 114 (4.6%) |
| 65 to 74 Years | 142 (20.9%) | 48 (5.9%) |
| 75 Years and over | 86 (20.1%) | 159 (32.9%) |
Disability Class: Vision Difficulty
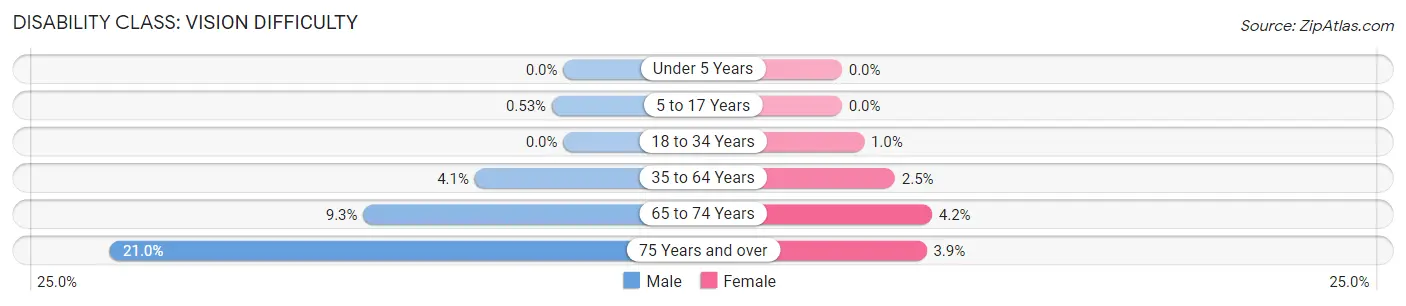
| Age Bracket | Male | Female |
| Under 5 Years | 0 (0.0%) | 0 (0.0%) |
| 5 to 17 Years | 6 (0.5%) | 0 (0.0%) |
| 18 to 34 Years | 0 (0.0%) | 11 (1.0%) |
| 35 to 64 Years | 85 (4.1%) | 61 (2.5%) |
| 65 to 74 Years | 63 (9.3%) | 34 (4.2%) |
| 75 Years and over | 90 (21.0%) | 19 (3.9%) |
Disability Class: Cognitive Difficulty
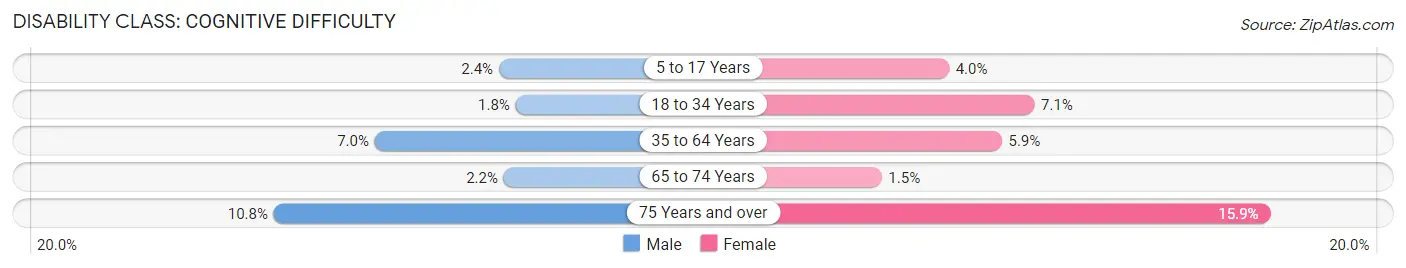
| Age Bracket | Male | Female |
| 5 to 17 Years | 27 (2.4%) | 34 (4.0%) |
| 18 to 34 Years | 21 (1.8%) | 76 (7.1%) |
| 35 to 64 Years | 145 (7.0%) | 147 (5.9%) |
| 65 to 74 Years | 15 (2.2%) | 12 (1.5%) |
| 75 Years and over | 46 (10.7%) | 77 (15.9%) |
Disability Class: Ambulatory Difficulty
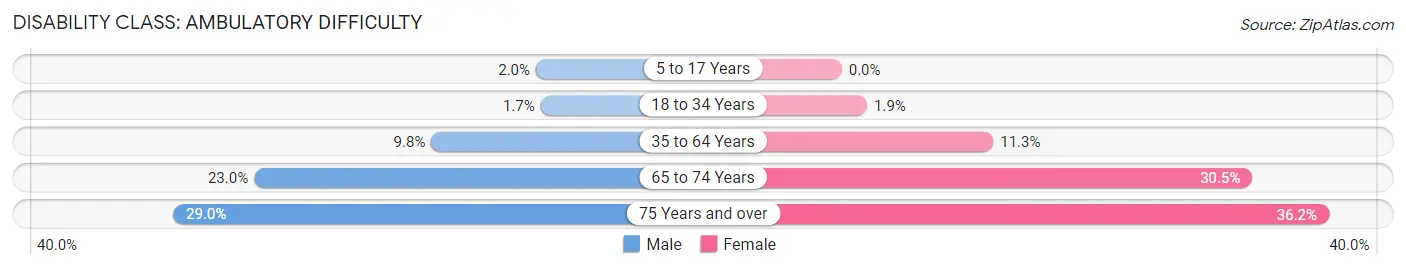
| Age Bracket | Male | Female |
| 5 to 17 Years | 23 (2.0%) | 0 (0.0%) |
| 18 to 34 Years | 20 (1.7%) | 20 (1.9%) |
| 35 to 64 Years | 203 (9.8%) | 279 (11.3%) |
| 65 to 74 Years | 156 (23.0%) | 248 (30.5%) |
| 75 Years and over | 124 (29.0%) | 175 (36.2%) |
Disability Class: Self-Care Difficulty
| Age Bracket | Male | Female |
| 5 to 17 Years | 23 (2.0%) | 0 (0.0%) |
| 18 to 34 Years | 0 (0.0%) | 20 (1.9%) |
| 35 to 64 Years | 117 (5.7%) | 70 (2.8%) |
| 65 to 74 Years | 27 (4.0%) | 37 (4.5%) |
| 75 Years and over | 64 (14.9%) | 66 (13.6%) |
Technology Access in Little River County
Computing Device Access in Little River County
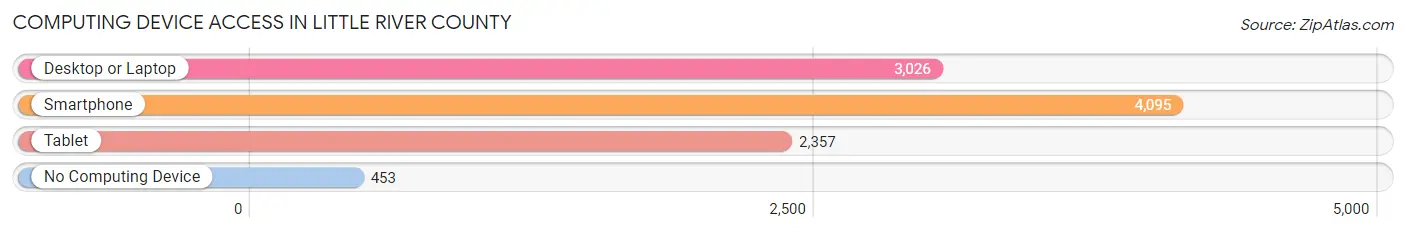
| Device Type | # Households | % Households |
| Desktop or Laptop | 3,026 | 63.9% |
| Smartphone | 4,095 | 86.5% |
| Tablet | 2,357 | 49.8% |
| No Computing Device | 453 | 9.6% |
| Total | 4,734 | 100.0% |
Internet Access in Little River County
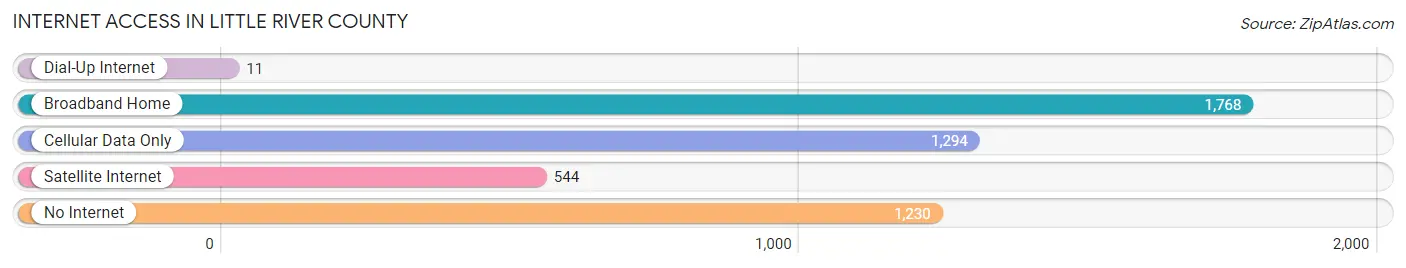
| Internet Type | # Households | % Households |
| Dial-Up Internet | 11 | 0.2% |
| Broadband Home | 1,768 | 37.3% |
| Cellular Data Only | 1,294 | 27.3% |
| Satellite Internet | 544 | 11.5% |
| No Internet | 1,230 | 26.0% |
| Total | 4,734 | 100.0% |
Little River County Summary
Little River County is located in the southwestern corner of Arkansas, bordered by the states of Texas and Oklahoma. It is part of the Texarkana, Arkansas-Texas Metropolitan Statistical Area. The county seat is Ashdown, and the largest city is Foreman. The county was established in 1867 and named for the Little River, which flows through the county.
Geography
Little River County covers an area of 745 square miles, making it the fourth-largest county in Arkansas. The terrain is mostly flat, with some rolling hills in the northern part of the county. The highest point in the county is located in the northwest corner, at an elevation of 590 feet. The county is drained by the Little River, which flows southward through the county and forms the border with Texas. Other major waterways include the Red River, which forms the border with Oklahoma, and the Sulphur River, which flows through the western part of the county.
The county is mostly rural, with a few small towns and villages scattered throughout. The largest town is Ashdown, which is the county seat. Other towns include Foreman, Wilton, Ogden, and Mineral Springs.
Demographics
As of the 2010 census, Little River County had a population of 13,171. The racial makeup of the county was 79.3% White, 17.7% Black or African American, 0.4% Native American, 0.3% Asian, 0.1% Pacific Islander, 0.7% from other races, and 1.5% from two or more races. Hispanic or Latino of any race were 2.2% of the population.
The median income for a household in the county was $30,945, and the median income for a family was $37,917. The per capita income for the county was $15,945. About 17.2% of families and 21.7% of the population were below the poverty line, including 28.3% of those under age 18 and 16.2% of those age 65 or over.
Economy
The economy of Little River County is largely based on agriculture. The county is home to a variety of crops, including cotton, soybeans, corn, and wheat. Livestock production is also important, with cattle, hogs, and poultry being the main animals raised.
The county is also home to several manufacturing companies, including a paper mill, a furniture factory, and a plastics plant. The county is also home to a number of retail stores, restaurants, and other businesses.
The county is served by two airports, the Ashdown Municipal Airport and the Foreman Municipal Airport. The county is also served by several highways, including Interstate 30, U.S. Route 59, and Arkansas Highway 41.
Conclusion
Little River County is a rural county located in the southwestern corner of Arkansas. It is home to a variety of crops and livestock, as well as several manufacturing companies and retail stores. The county is served by two airports and several highways, and its population is largely white and African American. The median income for a household in the county is lower than the state average, and the poverty rate is higher than the state average.
Common Questions
What is Per Capita Income in Little River County?
Per Capita income in Little River County is $28,764.
What is the Median Family Income in Little River County?
Median Family Income in Little River County is $76,776.
What is the Median Household income in Little River County?
Median Household Income in Little River County is $58,627.
What is Income or Wage Gap in Little River County?
Income or Wage Gap in Little River County is 20.6%.
Women in Little River County earn 79.4 cents for every dollar earned by a man.
What is Inequality or Gini Index in Little River County?
Inequality or Gini Index in Little River County is 0.41.
What is the Total Population of Little River County?
Total Population of Little River County is 12,024.
What is the Total Male Population of Little River County?
Total Male Population of Little River County is 5,849.
What is the Total Female Population of Little River County?
Total Female Population of Little River County is 6,175.
What is the Ratio of Males per 100 Females in Little River County?
There are 94.72 Males per 100 Females in Little River County.
What is the Ratio of Females per 100 Males in Little River County?
There are 105.57 Females per 100 Males in Little River County.
What is the Median Population Age in Little River County?
Median Population Age in Little River County is 42.3 Years.
What is the Average Family Size in Little River County
Average Family Size in Little River County is 3.1 People.
What is the Average Household Size in Little River County
Average Household Size in Little River County is 2.5 People.
How Large is the Labor Force in Little River County?
There are 5,484 People in the Labor Forcein in Little River County.
What is the Percentage of People in the Labor Force in Little River County?
57.0% of People are in the Labor Force in Little River County.
What is the Unemployment Rate in Little River County?
Unemployment Rate in Little River County is 8.0%.