Lee County, AR Map & Demographics
Lee County Map
Lee County Overview
$20,338
PER CAPITA INCOME
$50,338
AVG FAMILY INCOME
$33,801
AVG HOUSEHOLD INCOME
23.4%
WAGE / INCOME GAP [ % ]
76.6¢/ $1
WAGE / INCOME GAP [ $ ]
0.56
INEQUALITY / GINI INDEX
8,666
TOTAL POPULATION
4,882
MALE POPULATION
3,784
FEMALE POPULATION
129.02
MALES / 100 FEMALES
77.51
FEMALES / 100 MALES
41.6
MEDIAN AGE
3.6
AVG FAMILY SIZE
2.8
AVG HOUSEHOLD SIZE
2,954
LABOR FORCE [ PEOPLE ]
40.8%
PERCENT IN LABOR FORCE
14.3%
UNEMPLOYMENT RATE
Lee County Area Codes
Income in Lee County
Income Overview in Lee County
Per Capita Income in Lee County is $20,338, while median incomes of families and households are $50,338 and $33,801 respectively.
| Characteristic | Number | Measure |
| Per Capita Income | 8,666 | $20,338 |
| Median Family Income | 1,616 | $50,338 |
| Mean Family Income | 1,616 | $71,068 |
| Median Household Income | 2,586 | $33,801 |
| Mean Household Income | 2,586 | $56,868 |
| Income Deficit | 1,616 | $0 |
| Wage / Income Gap (%) | 8,666 | 23.40% |
| Wage / Income Gap ($) | 8,666 | 76.60¢ per $1 |
| Gini / Inequality Index | 8,666 | 0.56 |
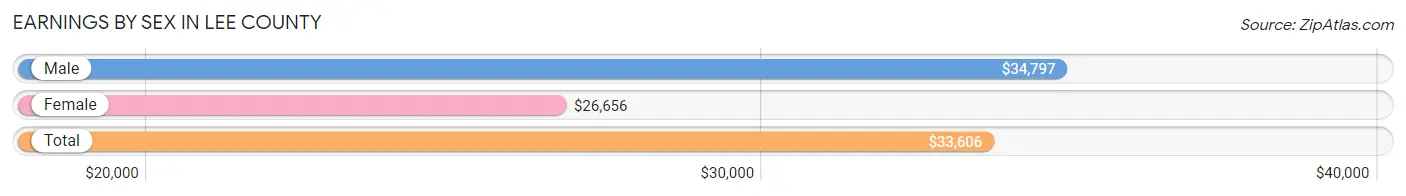
Earnings by Sex in Lee County
Average Earnings in Lee County are $33,606, $34,797 for men and $26,656 for women, a difference of 23.4%.
| Sex | Number | Average Earnings |
| Male | 1,937 (62.7%) | $34,797 |
| Female | 1,153 (37.3%) | $26,656 |
| Total | 3,090 (100.0%) | $33,606 |
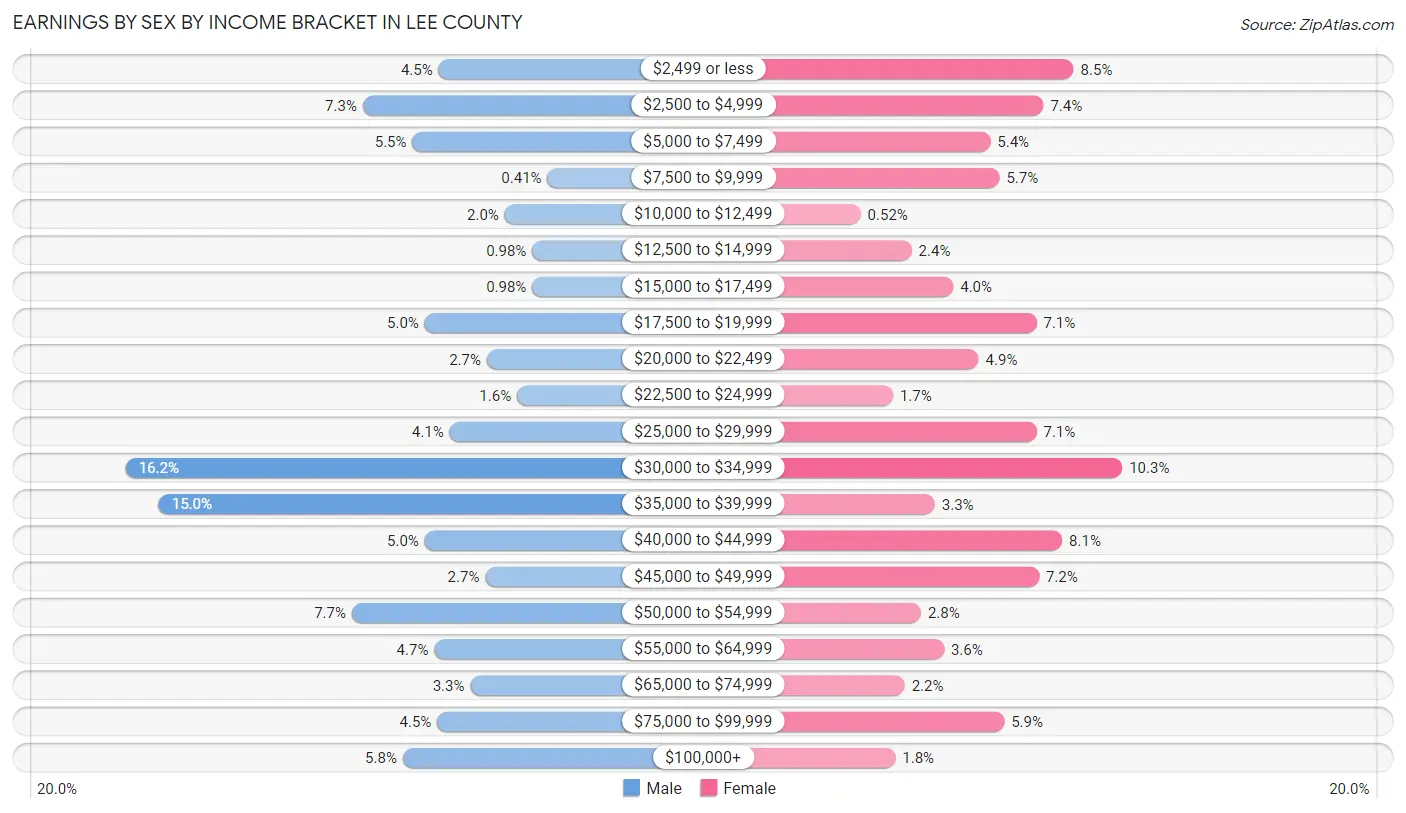
Earnings by Sex by Income Bracket in Lee County
The most common earnings brackets in Lee County are $30,000 to $34,999 for men (314 | 16.2%) and $30,000 to $34,999 for women (119 | 10.3%).
| Income | Male | Female |
| $2,499 or less | 87 (4.5%) | 98 (8.5%) |
| $2,500 to $4,999 | 142 (7.3%) | 85 (7.4%) |
| $5,000 to $7,499 | 106 (5.5%) | 62 (5.4%) |
| $7,500 to $9,999 | 8 (0.4%) | 66 (5.7%) |
| $10,000 to $12,499 | 39 (2.0%) | 6 (0.5%) |
| $12,500 to $14,999 | 19 (1.0%) | 28 (2.4%) |
| $15,000 to $17,499 | 19 (1.0%) | 46 (4.0%) |
| $17,500 to $19,999 | 97 (5.0%) | 82 (7.1%) |
| $20,000 to $22,499 | 52 (2.7%) | 57 (4.9%) |
| $22,500 to $24,999 | 30 (1.5%) | 20 (1.7%) |
| $25,000 to $29,999 | 79 (4.1%) | 82 (7.1%) |
| $30,000 to $34,999 | 314 (16.2%) | 119 (10.3%) |
| $35,000 to $39,999 | 290 (15.0%) | 38 (3.3%) |
| $40,000 to $44,999 | 97 (5.0%) | 93 (8.1%) |
| $45,000 to $49,999 | 53 (2.7%) | 83 (7.2%) |
| $50,000 to $54,999 | 150 (7.7%) | 32 (2.8%) |
| $55,000 to $64,999 | 90 (4.6%) | 42 (3.6%) |
| $65,000 to $74,999 | 64 (3.3%) | 25 (2.2%) |
| $75,000 to $99,999 | 88 (4.5%) | 68 (5.9%) |
| $100,000+ | 113 (5.8%) | 21 (1.8%) |
| Total | 1,937 (100.0%) | 1,153 (100.0%) |
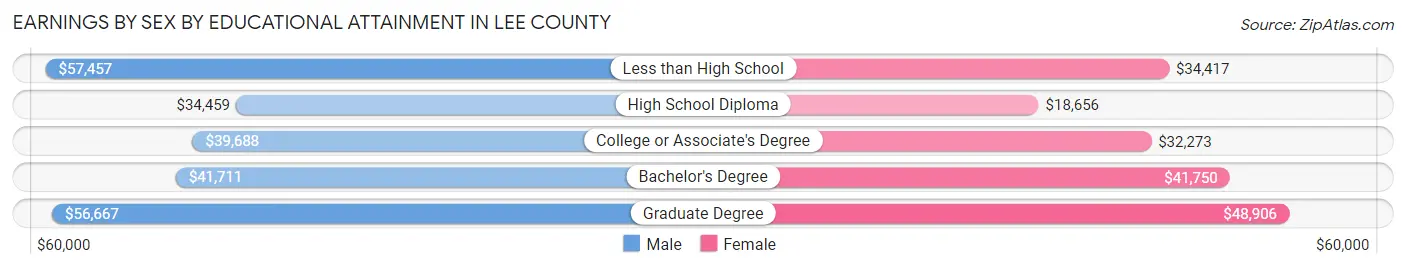
Earnings by Sex by Educational Attainment in Lee County
Average earnings in Lee County are $36,071 for men and $31,296 for women, a difference of 13.2%. Men with an educational attainment of less than high school enjoy the highest average annual earnings of $57,457, while those with high school diploma education earn the least with $34,459. Women with an educational attainment of graduate degree earn the most with the average annual earnings of $48,906, while those with high school diploma education have the smallest earnings of $18,656.
| Educational Attainment | Male Income | Female Income |
| Less than High School | $57,457 | $34,417 |
| High School Diploma | $34,459 | $18,656 |
| College or Associate's Degree | $39,688 | $32,273 |
| Bachelor's Degree | $41,711 | $41,750 |
| Graduate Degree | $56,667 | $48,906 |
| Total | $36,071 | $31,296 |
Family Income in Lee County
Family Income Brackets in Lee County
According to the Lee County family income data, there are 344 families falling into the $50,000 to $74,999 income range, which is the most common income bracket and makes up 21.3% of all families. Conversely, the $200,000+ income bracket is the least frequent group with only 40 families (2.5%) belonging to this category.
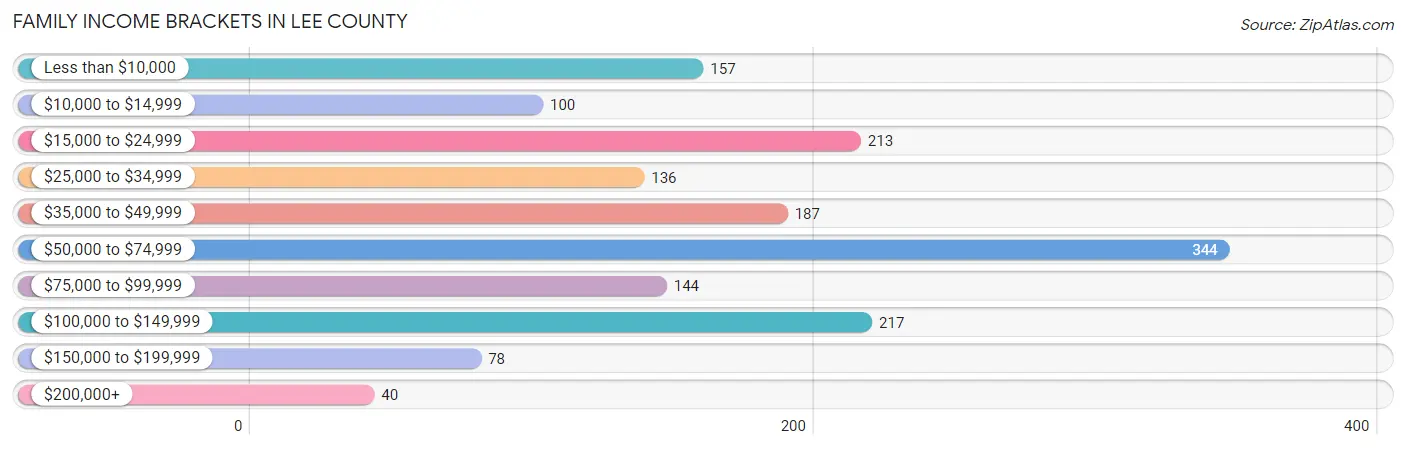
| Income Bracket | # Families | % Families |
| Less than $10,000 | 157 | 9.7% |
| $10,000 to $14,999 | 100 | 6.2% |
| $15,000 to $24,999 | 213 | 13.2% |
| $25,000 to $34,999 | 136 | 8.4% |
| $35,000 to $49,999 | 187 | 11.6% |
| $50,000 to $74,999 | 344 | 21.3% |
| $75,000 to $99,999 | 144 | 8.9% |
| $100,000 to $149,999 | 217 | 13.4% |
| $150,000 to $199,999 | 78 | 4.8% |
| $200,000+ | 40 | 2.5% |
Family Income by Famaliy Size in Lee County
5-person families (22 | 1.4%) account for the highest median family income in Lee County with $58,438 per family, while 2-person families (820 | 50.7%) have the highest median income of $24,176 per family member.
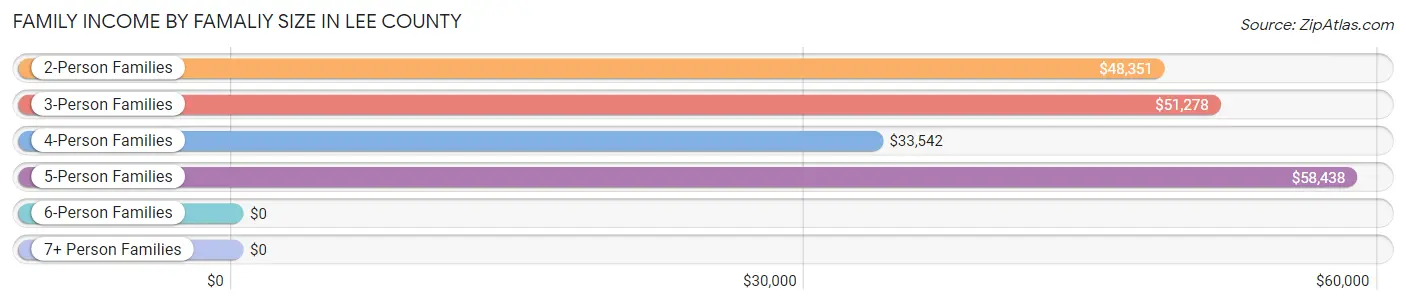
| Income Bracket | # Families | Median Income |
| 2-Person Families | 820 (50.7%) | $48,351 |
| 3-Person Families | 548 (33.9%) | $51,278 |
| 4-Person Families | 185 (11.5%) | $33,542 |
| 5-Person Families | 22 (1.4%) | $58,438 |
| 6-Person Families | 20 (1.2%) | $0 |
| 7+ Person Families | 21 (1.3%) | $0 |
| Total | 1,616 (100.0%) | $50,338 |
Family Income by Number of Earners in Lee County
The median family income in Lee County is $50,338, with families comprising 3+ earners (89) having the highest median family income of $105,179, while families with no earners (365) have the lowest median family income of $20,572, accounting for 5.5% and 22.6% of families, respectively.
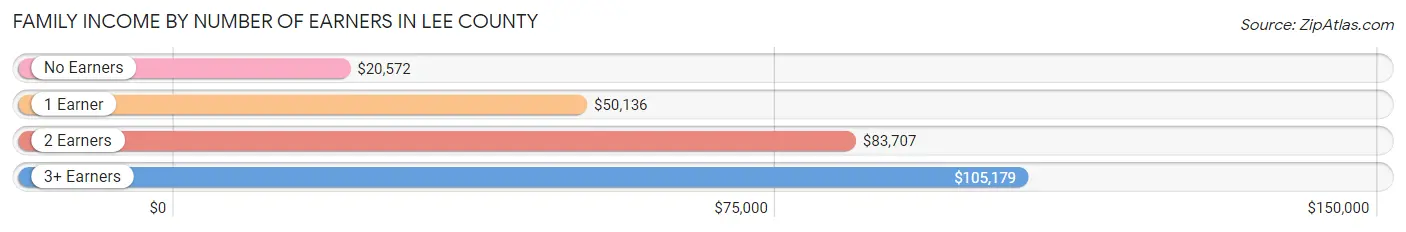
| Number of Earners | # Families | Median Income |
| No Earners | 365 (22.6%) | $20,572 |
| 1 Earner | 720 (44.6%) | $50,136 |
| 2 Earners | 442 (27.4%) | $83,707 |
| 3+ Earners | 89 (5.5%) | $105,179 |
| Total | 1,616 (100.0%) | $50,338 |
Household Income in Lee County
Household Income Brackets in Lee County
With 468 households falling in the category, the $15,000 to $24,999 income range is the most frequent in Lee County, accounting for 18.1% of all households. In contrast, only 72 households (2.8%) fall into the $200,000+ income bracket, making it the least populous group.
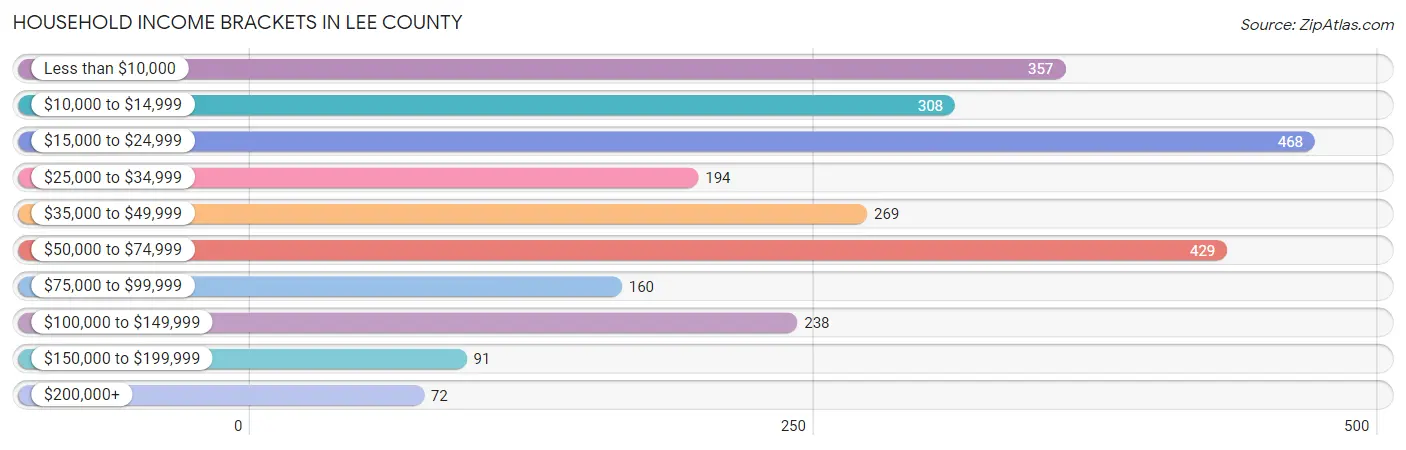
| Income Bracket | # Households | % Households |
| Less than $10,000 | 357 | 13.8% |
| $10,000 to $14,999 | 308 | 11.9% |
| $15,000 to $24,999 | 468 | 18.1% |
| $25,000 to $34,999 | 194 | 7.5% |
| $35,000 to $49,999 | 269 | 10.4% |
| $50,000 to $74,999 | 429 | 16.6% |
| $75,000 to $99,999 | 160 | 6.2% |
| $100,000 to $149,999 | 238 | 9.2% |
| $150,000 to $199,999 | 91 | 3.5% |
| $200,000+ | 72 | 2.8% |
Household Income by Householder Age in Lee County
The median household income in Lee County is $33,801, with the highest median household income of $48,983 found in the 45 to 64 years age bracket for the primary householder. A total of 883 households (34.2%) fall into this category. Meanwhile, the 15 to 24 years age bracket for the primary householder has the lowest median household income of $0, with 79 households (3.0%) in this group.
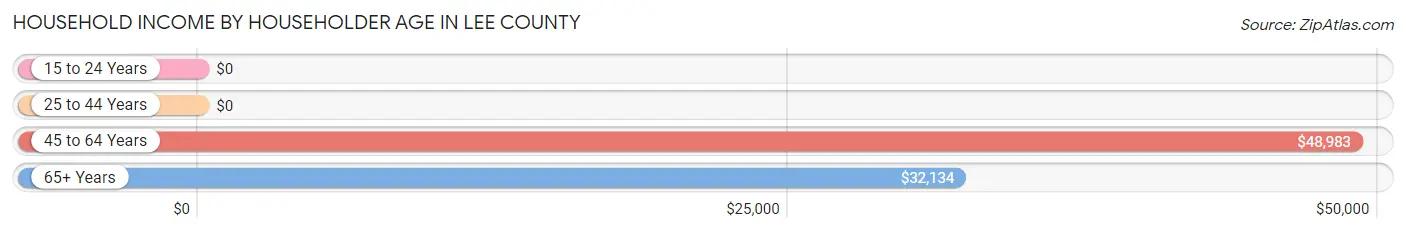
| Income Bracket | # Households | Median Income |
| 15 to 24 Years | 79 (3.0%) | $0 |
| 25 to 44 Years | 544 (21.0%) | $0 |
| 45 to 64 Years | 883 (34.2%) | $48,983 |
| 65+ Years | 1,080 (41.8%) | $32,134 |
| Total | 2,586 (100.0%) | $33,801 |
Poverty in Lee County
Income Below Poverty by Sex and Age in Lee County
With 22.8% poverty level for males and 32.0% for females among the residents of Lee County, 5 year old males and 15 year old females are the most vulnerable to poverty, with 27 males (67.5%) and 31 females (79.5%) in their respective age groups living below the poverty level.
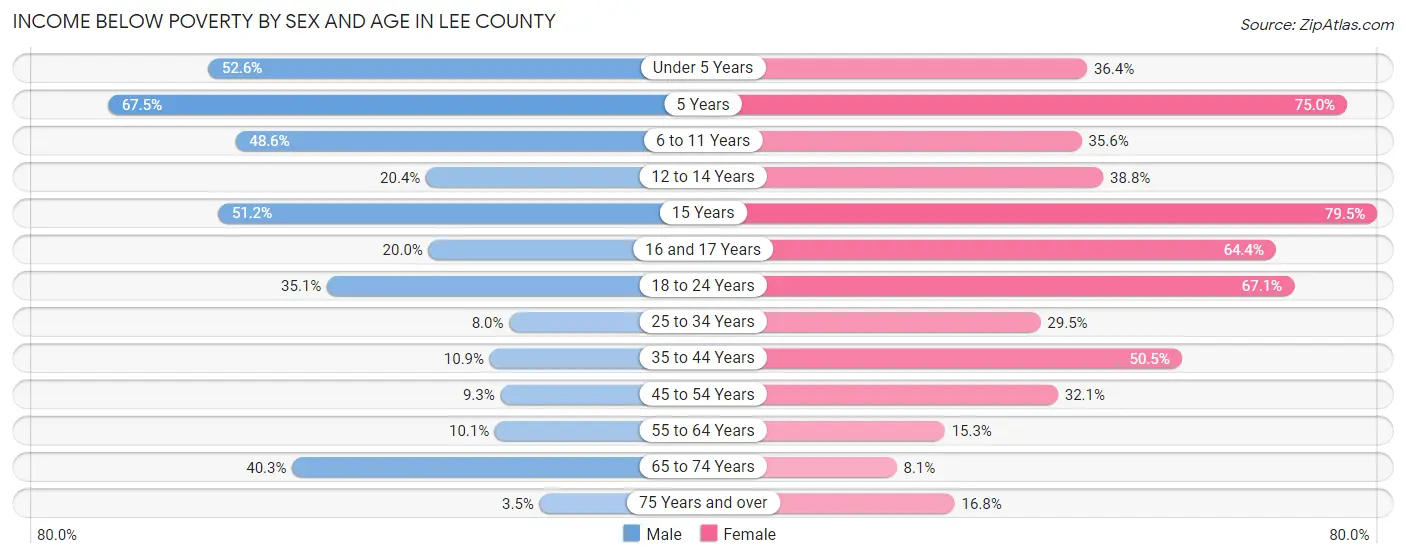
| Age Bracket | Male | Female |
| Under 5 Years | 140 (52.6%) | 79 (36.4%) |
| 5 Years | 27 (67.5%) | 6 (75.0%) |
| 6 to 11 Years | 84 (48.5%) | 100 (35.6%) |
| 12 to 14 Years | 33 (20.4%) | 52 (38.8%) |
| 15 Years | 22 (51.2%) | 31 (79.5%) |
| 16 and 17 Years | 10 (20.0%) | 87 (64.4%) |
| 18 to 24 Years | 128 (35.1%) | 239 (67.1%) |
| 25 to 34 Years | 33 (8.0%) | 64 (29.5%) |
| 35 to 44 Years | 49 (10.9%) | 170 (50.4%) |
| 45 to 54 Years | 34 (9.3%) | 169 (32.1%) |
| 55 to 64 Years | 45 (10.1%) | 81 (15.3%) |
| 65 to 74 Years | 163 (40.3%) | 43 (8.1%) |
| 75 Years and over | 8 (3.5%) | 67 (16.8%) |
| Total | 776 (22.8%) | 1,188 (32.0%) |
Income Above Poverty by Sex and Age in Lee County
According to the poverty statistics in Lee County, males aged 75 years and over and females aged 65 to 74 years are the age groups that are most secure financially, with 96.5% of males and 91.9% of females in these age groups living above the poverty line.
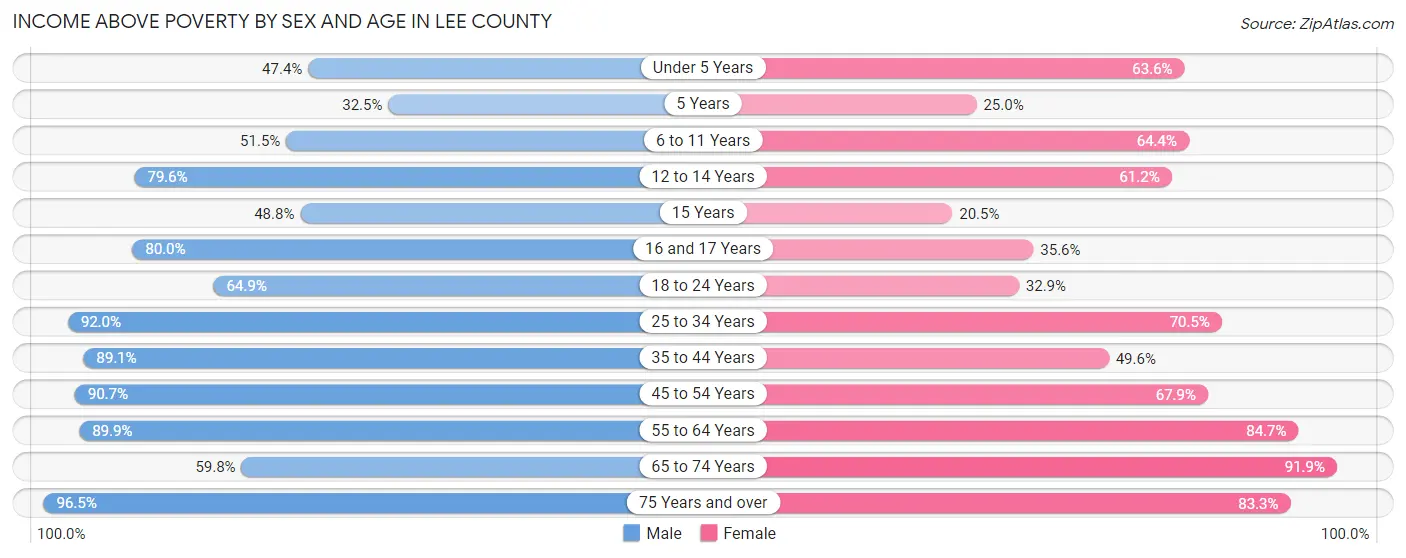
| Age Bracket | Male | Female |
| Under 5 Years | 126 (47.4%) | 138 (63.6%) |
| 5 Years | 13 (32.5%) | 2 (25.0%) |
| 6 to 11 Years | 89 (51.4%) | 181 (64.4%) |
| 12 to 14 Years | 129 (79.6%) | 82 (61.2%) |
| 15 Years | 21 (48.8%) | 8 (20.5%) |
| 16 and 17 Years | 40 (80.0%) | 48 (35.6%) |
| 18 to 24 Years | 237 (64.9%) | 117 (32.9%) |
| 25 to 34 Years | 378 (92.0%) | 153 (70.5%) |
| 35 to 44 Years | 400 (89.1%) | 167 (49.5%) |
| 45 to 54 Years | 331 (90.7%) | 358 (67.9%) |
| 55 to 64 Years | 399 (89.9%) | 449 (84.7%) |
| 65 to 74 Years | 242 (59.8%) | 486 (91.9%) |
| 75 Years and over | 220 (96.5%) | 333 (83.3%) |
| Total | 2,625 (77.2%) | 2,522 (68.0%) |
Income Below Poverty Among Married-Couple Families in Lee County
The poverty statistics for married-couple families in Lee County show that 4.4% or 39 of the total 887 families live below the poverty line. Families with 1 or 2 children have the highest poverty rate of 7.9%, comprising of 16 families. On the other hand, families with 3 or 4 children have the lowest poverty rate of 0.0%, which includes 0 families.
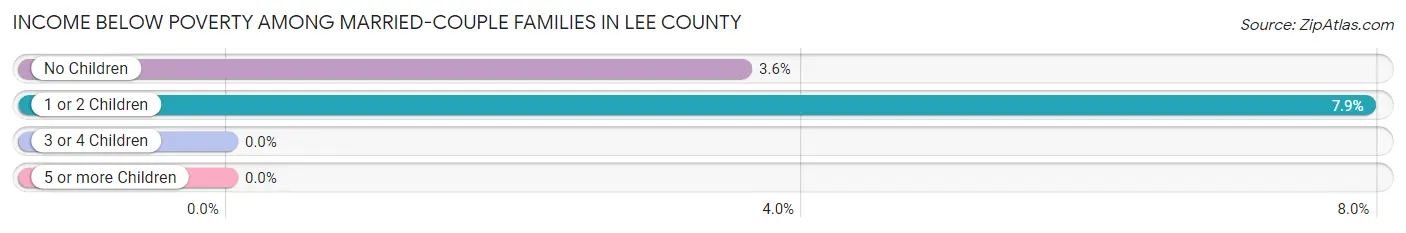
| Children | Above Poverty | Below Poverty |
| No Children | 620 (96.4%) | 23 (3.6%) |
| 1 or 2 Children | 186 (92.1%) | 16 (7.9%) |
| 3 or 4 Children | 31 (100.0%) | 0 (0.0%) |
| 5 or more Children | 11 (100.0%) | 0 (0.0%) |
| Total | 848 (95.6%) | 39 (4.4%) |
Income Below Poverty Among Single-Parent Households in Lee County
According to the poverty data in Lee County, 5.2% or 3 single-father households and 45.8% or 307 single-mother households are living below the poverty line. Among single-father households, those with 3 or 4 children have the highest poverty rate, with 3 households (100.0%) experiencing poverty. Likewise, among single-mother households, those with 1 or 2 children have the highest poverty rate, with 196 households (68.3%) falling below the poverty line.
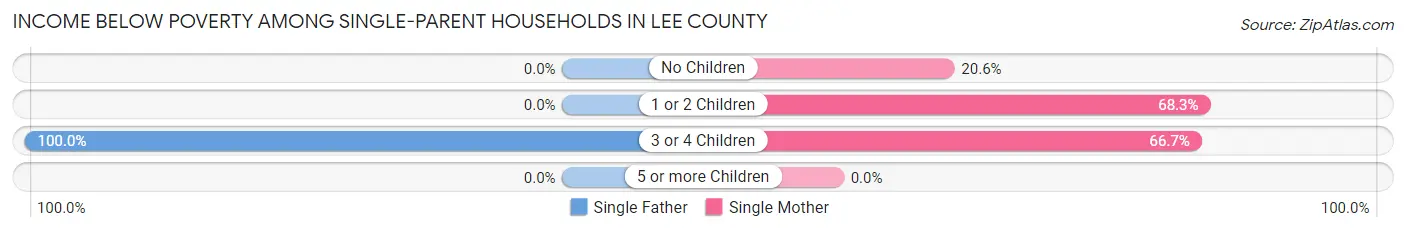
| Children | Single Father | Single Mother |
| No Children | 0 (0.0%) | 65 (20.6%) |
| 1 or 2 Children | 0 (0.0%) | 196 (68.3%) |
| 3 or 4 Children | 3 (100.0%) | 46 (66.7%) |
| 5 or more Children | 0 (0.0%) | 0 (0.0%) |
| Total | 3 (5.2%) | 307 (45.8%) |
Income Below Poverty Among Married-Couple vs Single-Parent Households in Lee County
The poverty data for Lee County shows that 39 of the married-couple family households (4.4%) and 310 of the single-parent households (42.5%) are living below the poverty level. Within the married-couple family households, those with 1 or 2 children have the highest poverty rate, with 16 households (7.9%) falling below the poverty line. Among the single-parent households, those with 3 or 4 children have the highest poverty rate, with 49 household (68.1%) living below poverty.
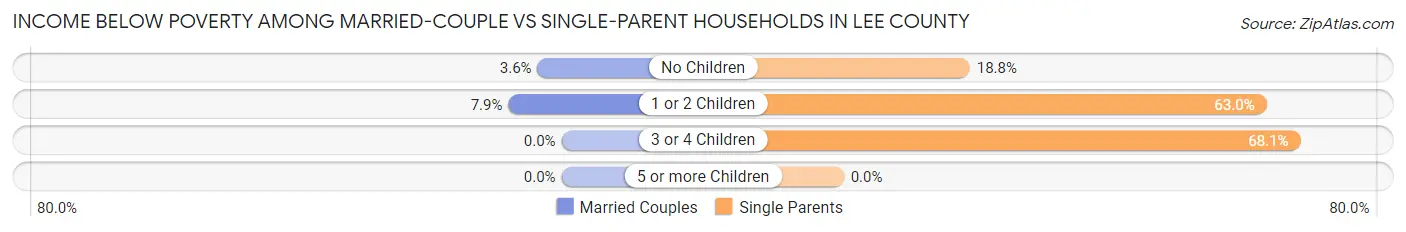
| Children | Married-Couple Families | Single-Parent Households |
| No Children | 23 (3.6%) | 65 (18.8%) |
| 1 or 2 Children | 16 (7.9%) | 196 (63.0%) |
| 3 or 4 Children | 0 (0.0%) | 49 (68.1%) |
| 5 or more Children | 0 (0.0%) | 0 (0.0%) |
| Total | 39 (4.4%) | 310 (42.5%) |
Race in Lee County
The most populous races in Lee County are Black / African American (4,793 | 55.3%), White / Caucasian (3,663 | 42.3%), and Hispanic or Latino (253 | 2.9%).
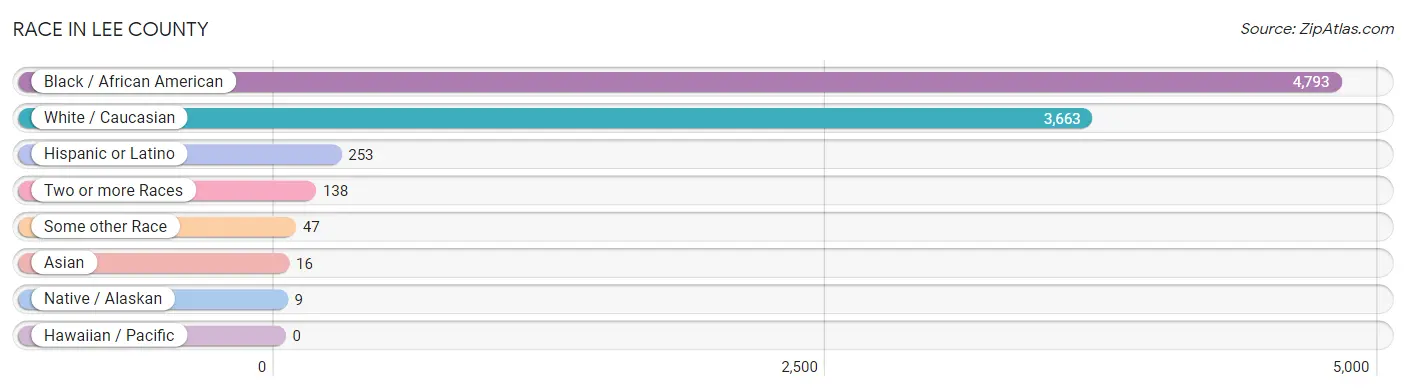
| Race | # Population | % Population |
| Asian | 16 | 0.2% |
| Black / African American | 4,793 | 55.3% |
| Hawaiian / Pacific | 0 | 0.0% |
| Hispanic or Latino | 253 | 2.9% |
| Native / Alaskan | 9 | 0.1% |
| White / Caucasian | 3,663 | 42.3% |
| Two or more Races | 138 | 1.6% |
| Some other Race | 47 | 0.5% |
| Total | 8,666 | 100.0% |
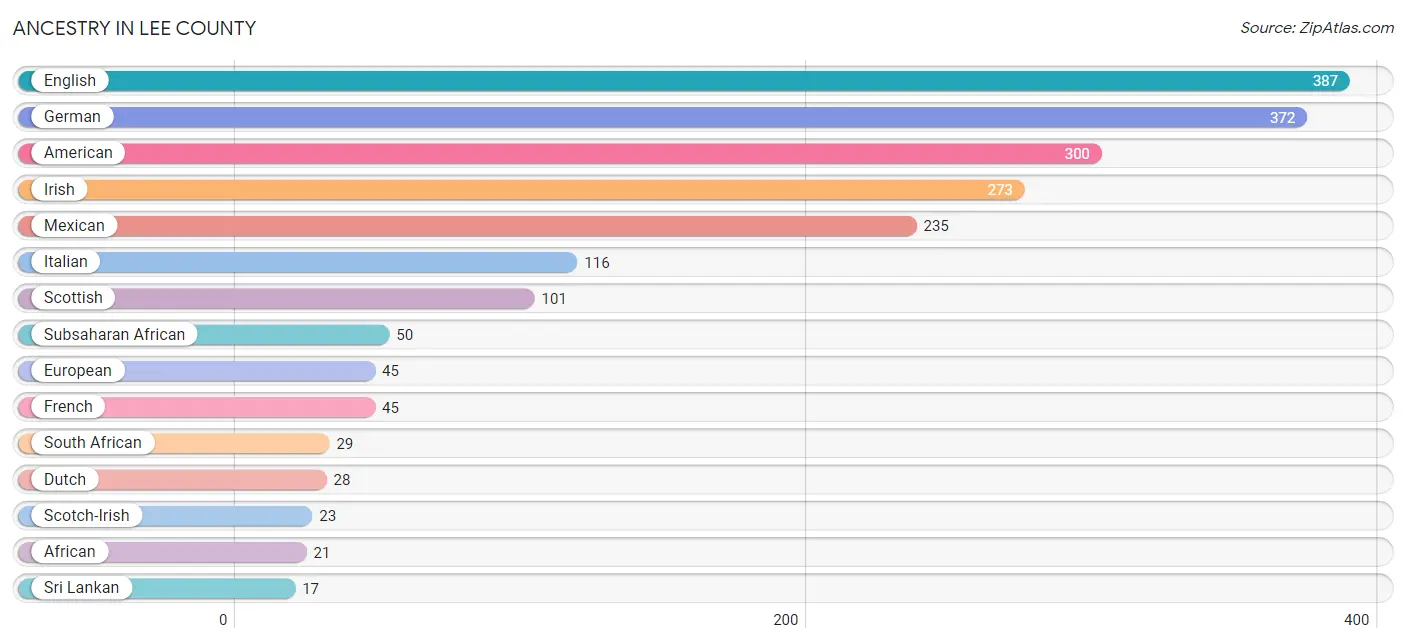
Ancestry in Lee County
The most populous ancestries reported in Lee County are English (387 | 4.5%), German (372 | 4.3%), American (300 | 3.5%), Irish (273 | 3.2%), and Mexican (235 | 2.7%), together accounting for 18.1% of all Lee County residents.
| Ancestry | # Population | % Population |
| African | 21 | 0.2% |
| American | 300 | 3.5% |
| British | 6 | 0.1% |
| Central American | 6 | 0.1% |
| Choctaw | 8 | 0.1% |
| Dutch | 28 | 0.3% |
| English | 387 | 4.5% |
| European | 45 | 0.5% |
| French | 45 | 0.5% |
| French Canadian | 5 | 0.1% |
| German | 372 | 4.3% |
| Irish | 273 | 3.2% |
| Italian | 116 | 1.3% |
| Mexican | 235 | 2.7% |
| Northern European | 3 | 0.0% |
| Panamanian | 1 | 0.0% |
| Polish | 1 | 0.0% |
| Puerto Rican | 1 | 0.0% |
| Salvadoran | 5 | 0.1% |
| Scandinavian | 12 | 0.1% |
| Scotch-Irish | 23 | 0.3% |
| Scottish | 101 | 1.2% |
| South African | 29 | 0.3% |
| Sri Lankan | 17 | 0.2% |
| Subsaharan African | 50 | 0.6% |
| Swedish | 9 | 0.1% |
| Welsh | 7 | 0.1% | View All 27 Rows |
Immigrants in Lee County
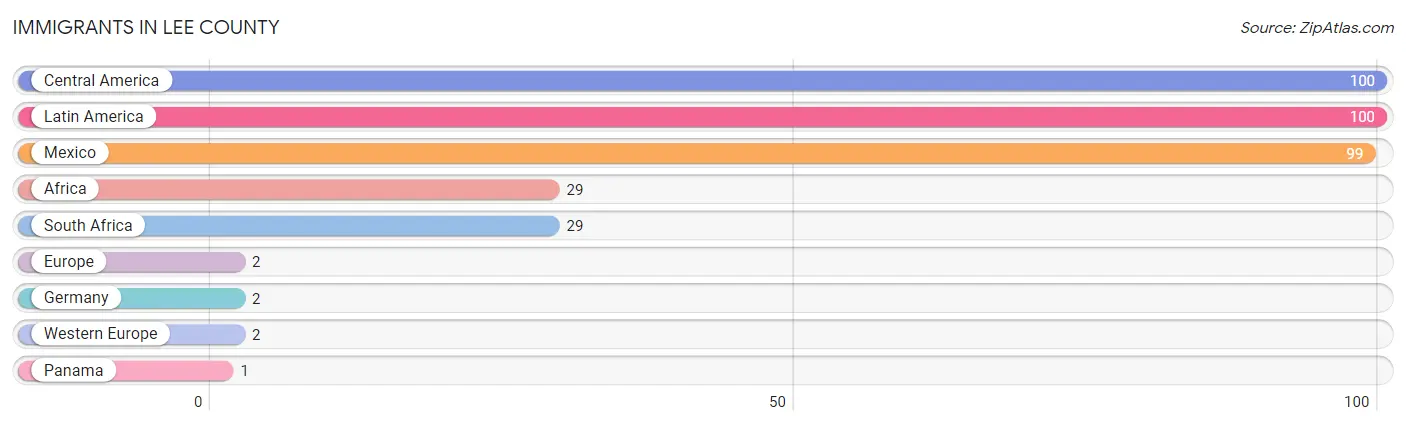
The most numerous immigrant groups reported in Lee County came from Central America (100 | 1.1%), Latin America (100 | 1.1%), Mexico (99 | 1.1%), Africa (29 | 0.3%), and South Africa (29 | 0.3%), together accounting for 4.1% of all Lee County residents.
| Immigration Origin | # Population | % Population |
| Africa | 29 | 0.3% |
| Central America | 100 | 1.1% |
| Europe | 2 | 0.0% |
| Germany | 2 | 0.0% |
| Latin America | 100 | 1.1% |
| Mexico | 99 | 1.1% |
| Panama | 1 | 0.0% |
| South Africa | 29 | 0.3% |
| Western Europe | 2 | 0.0% | View All 9 Rows |
Sex and Age in Lee County
Sex and Age in Lee County
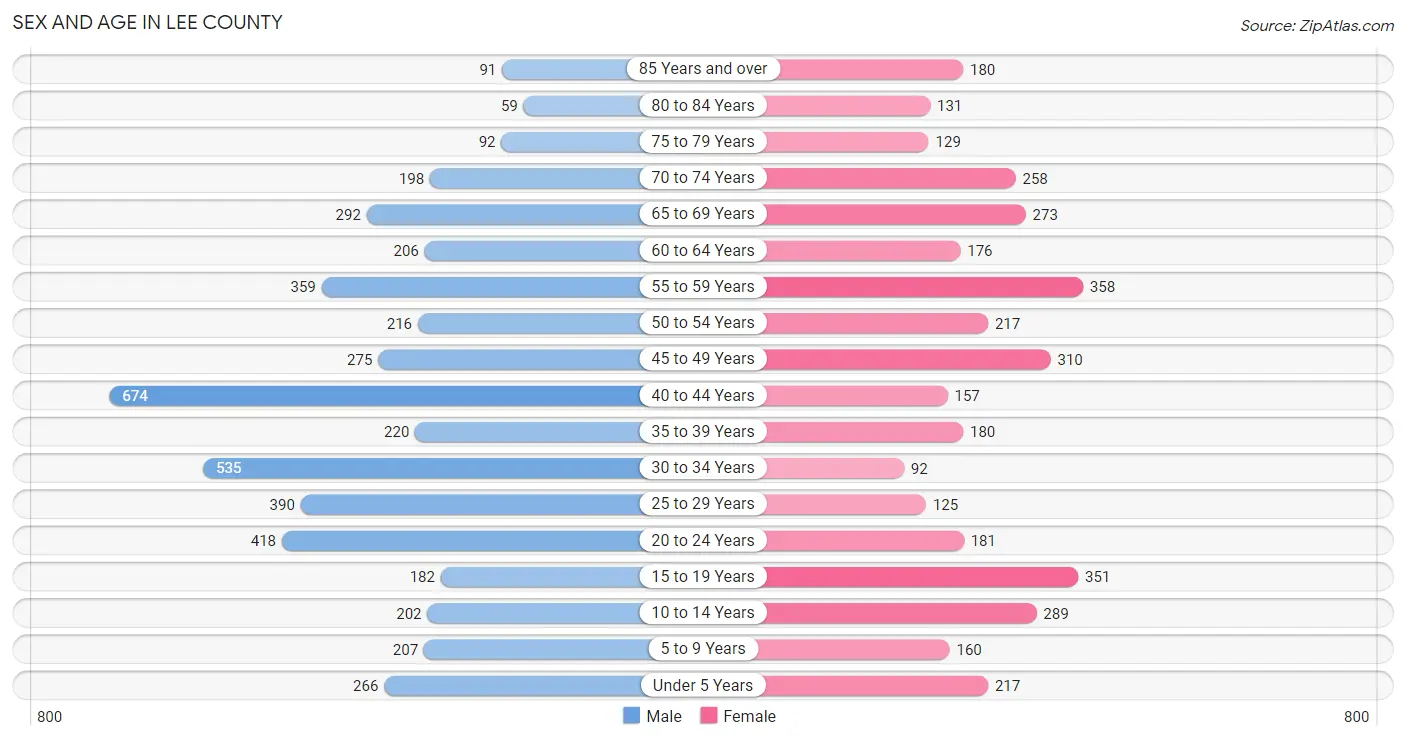
The most populous age groups in Lee County are 40 to 44 Years (674 | 13.8%) for men and 55 to 59 Years (358 | 9.5%) for women.
| Age Bracket | Male | Female |
| Under 5 Years | 266 (5.4%) | 217 (5.7%) |
| 5 to 9 Years | 207 (4.2%) | 160 (4.2%) |
| 10 to 14 Years | 202 (4.1%) | 289 (7.6%) |
| 15 to 19 Years | 182 (3.7%) | 351 (9.3%) |
| 20 to 24 Years | 418 (8.6%) | 181 (4.8%) |
| 25 to 29 Years | 390 (8.0%) | 125 (3.3%) |
| 30 to 34 Years | 535 (11.0%) | 92 (2.4%) |
| 35 to 39 Years | 220 (4.5%) | 180 (4.8%) |
| 40 to 44 Years | 674 (13.8%) | 157 (4.2%) |
| 45 to 49 Years | 275 (5.6%) | 310 (8.2%) |
| 50 to 54 Years | 216 (4.4%) | 217 (5.7%) |
| 55 to 59 Years | 359 (7.3%) | 358 (9.5%) |
| 60 to 64 Years | 206 (4.2%) | 176 (4.6%) |
| 65 to 69 Years | 292 (6.0%) | 273 (7.2%) |
| 70 to 74 Years | 198 (4.1%) | 258 (6.8%) |
| 75 to 79 Years | 92 (1.9%) | 129 (3.4%) |
| 80 to 84 Years | 59 (1.2%) | 131 (3.5%) |
| 85 Years and over | 91 (1.9%) | 180 (4.8%) |
| Total | 4,882 (100.0%) | 3,784 (100.0%) |
Families and Households in Lee County
Median Family Size in Lee County
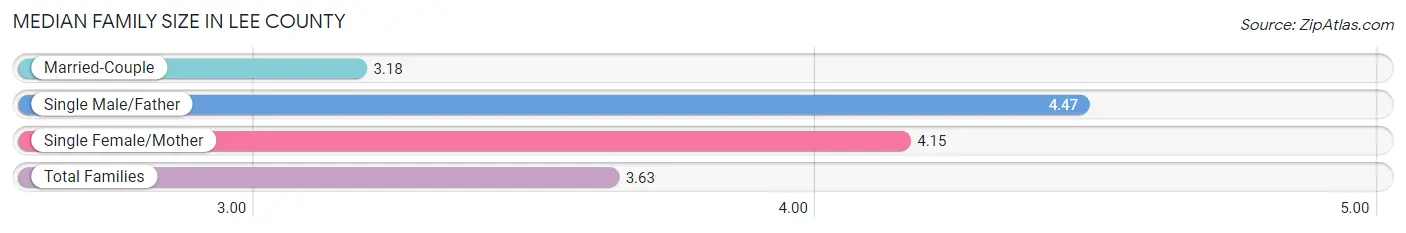
The median family size in Lee County is 3.63 persons per family, with single male/father families (58 | 3.6%) accounting for the largest median family size of 4.47 persons per family. On the other hand, married-couple families (887 | 54.9%) represent the smallest median family size with 3.18 persons per family.
| Family Type | # Families | Family Size |
| Married-Couple | 887 (54.9%) | 3.18 |
| Single Male/Father | 58 (3.6%) | 4.47 |
| Single Female/Mother | 671 (41.5%) | 4.15 |
| Total Families | 1,616 (100.0%) | 3.63 |
Median Household Size in Lee County
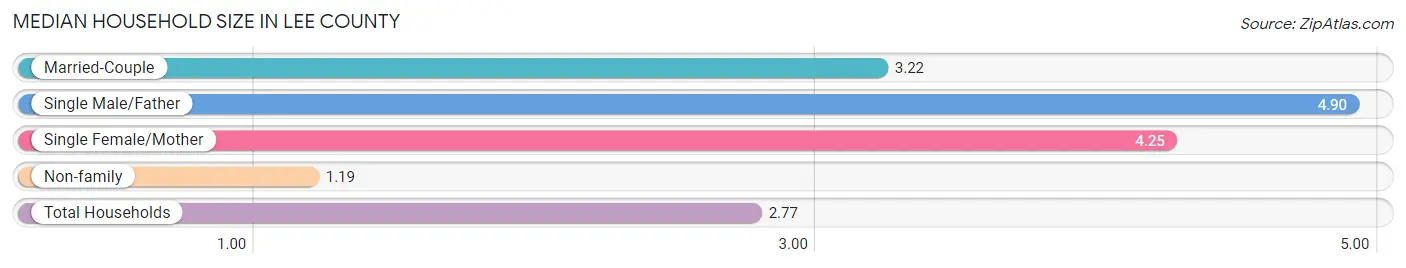
The median household size in Lee County is 2.77 persons per household, with single male/father households (58 | 2.2%) accounting for the largest median household size of 4.9 persons per household. non-family households (970 | 37.5%) represent the smallest median household size with 1.19 persons per household.
| Household Type | # Households | Household Size |
| Married-Couple | 887 (34.3%) | 3.22 |
| Single Male/Father | 58 (2.2%) | 4.90 |
| Single Female/Mother | 671 (26.0%) | 4.25 |
| Non-family | 970 (37.5%) | 1.19 |
| Total Households | 2,586 (100.0%) | 2.77 |
Household Size by Marriage Status in Lee County
Out of a total of 2,586 households in Lee County, 1,616 (62.5%) are family households, while 970 (37.5%) are nonfamily households. The most numerous type of family households are 2-person households, comprising 804, and the most common type of nonfamily households are 1-person households, comprising 899.
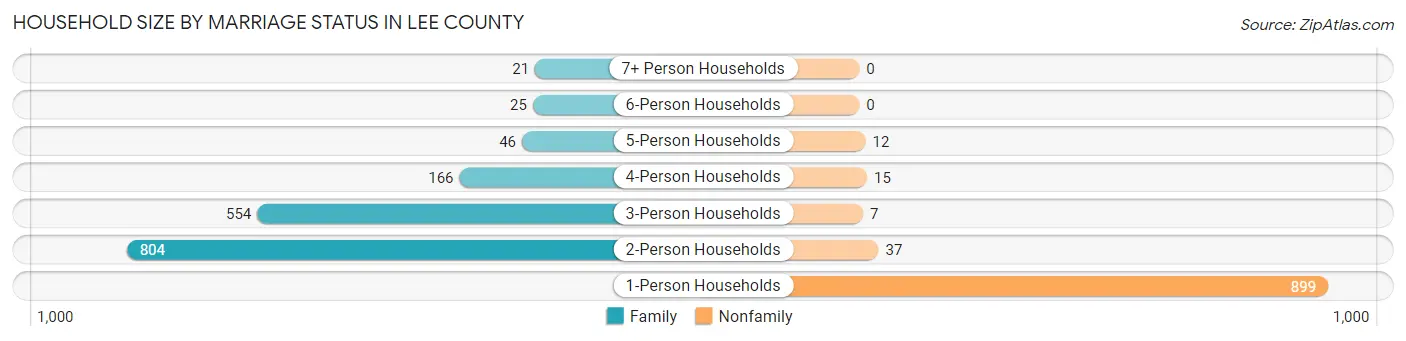
| Household Size | Family Households | Nonfamily Households |
| 1-Person Households | - | 899 (34.8%) |
| 2-Person Households | 804 (31.1%) | 37 (1.4%) |
| 3-Person Households | 554 (21.4%) | 7 (0.3%) |
| 4-Person Households | 166 (6.4%) | 15 (0.6%) |
| 5-Person Households | 46 (1.8%) | 12 (0.5%) |
| 6-Person Households | 25 (1.0%) | 0 (0.0%) |
| 7+ Person Households | 21 (0.8%) | 0 (0.0%) |
| Total | 1,616 (62.5%) | 970 (37.5%) |
Female Fertility in Lee County
Fertility by Age in Lee County
Average fertility rate in Lee County is 97.0 births per 1,000 women. Women in the age bracket of 20 to 34 years have the highest fertility rate with 224.0 births per 1,000 women. Women in the age bracket of 20 to 34 years acount for 64.0% of all women with births.
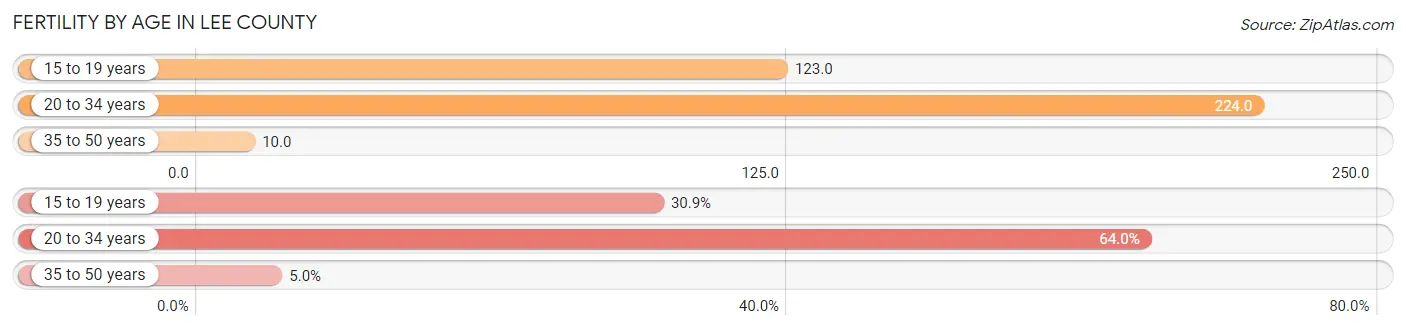
| Age Bracket | Women with Births | Births / 1,000 Women |
| 15 to 19 years | 43 (30.9%) | 123.0 |
| 20 to 34 years | 89 (64.0%) | 224.0 |
| 35 to 50 years | 7 (5.0%) | 10.0 |
| Total | 139 (100.0%) | 97.0 |
Fertility by Age by Marriage Status in Lee County
18.0% of women with births (139) in Lee County are married. The highest percentage of unmarried women with births falls into 15 to 19 years age bracket with 100.0% of them unmarried at the time of birth, while the lowest percentage of unmarried women with births belong to 35 to 50 years age bracket with 0.0% of them unmarried.
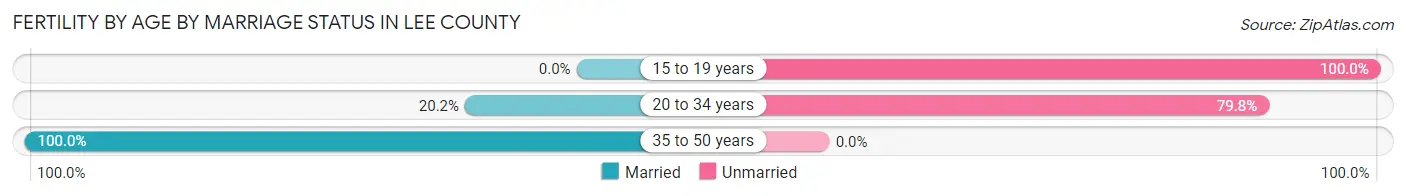
| Age Bracket | Married | Unmarried |
| 15 to 19 years | 0 (0.0%) | 43 (100.0%) |
| 20 to 34 years | 18 (20.2%) | 71 (79.8%) |
| 35 to 50 years | 7 (100.0%) | 0 (0.0%) |
| Total | 25 (18.0%) | 114 (82.0%) |
Fertility by Education in Lee County
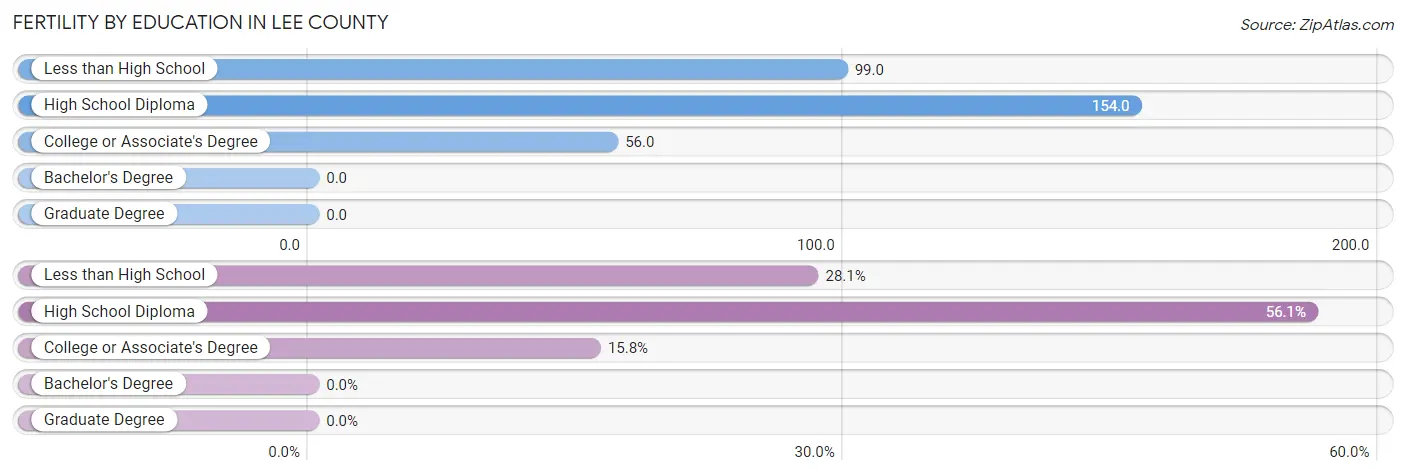
| Educational Attainment | Women with Births | Births / 1,000 Women |
| Less than High School | 39 (28.1%) | 99.0 |
| High School Diploma | 78 (56.1%) | 154.0 |
| College or Associate's Degree | 22 (15.8%) | 56.0 |
| Bachelor's Degree | 0 (0.0%) | 0.0 |
| Graduate Degree | 0 (0.0%) | 0.0 |
| Total | 139 (100.0%) | 97.0 |
Fertility by Education by Marriage Status in Lee County
82.0% of women with births in Lee County are unmarried. Women with the educational attainment of college or associate's degree are most likely to be married with 54.5% of them married at childbirth, while women with the educational attainment of high school diploma are least likely to be married with 93.6% of them unmarried at childbirth.
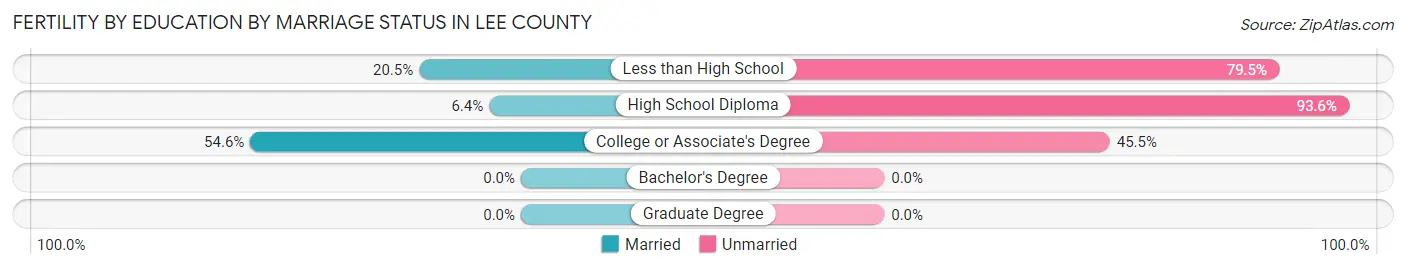
| Educational Attainment | Married | Unmarried |
| Less than High School | 8 (20.5%) | 31 (79.5%) |
| High School Diploma | 5 (6.4%) | 73 (93.6%) |
| College or Associate's Degree | 12 (54.5%) | 10 (45.5%) |
| Bachelor's Degree | 0 (0.0%) | 0 (0.0%) |
| Graduate Degree | 0 (0.0%) | 0 (0.0%) |
| Total | 25 (18.0%) | 114 (82.0%) |
Employment Characteristics in Lee County
Employment by Class of Employer in Lee County
Among the 2,514 employed individuals in Lee County, private company employees (1,432 | 57.0%), self-employed (not incorporated) (284 | 11.3%), and state government employees (240 | 9.6%) make up the most common classes of employment.
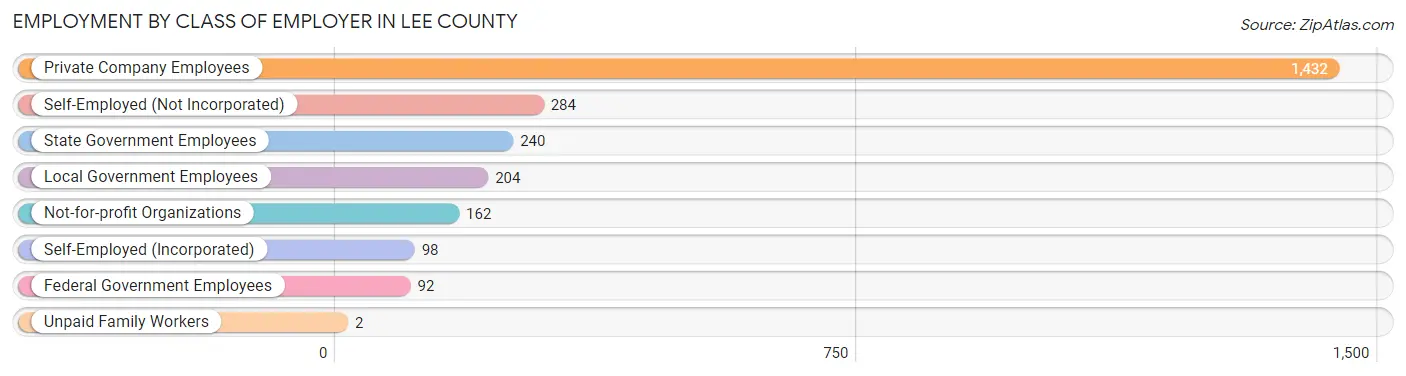
| Employer Class | # Employees | % Employees |
| Private Company Employees | 1,432 | 57.0% |
| Self-Employed (Incorporated) | 98 | 3.9% |
| Self-Employed (Not Incorporated) | 284 | 11.3% |
| Not-for-profit Organizations | 162 | 6.4% |
| Local Government Employees | 204 | 8.1% |
| State Government Employees | 240 | 9.6% |
| Federal Government Employees | 92 | 3.7% |
| Unpaid Family Workers | 2 | 0.1% |
| Total | 2,514 | 100.0% |
Employment Status by Age in Lee County
According to the labor force statistics for Lee County, out of the total population over 16 years of age (7,241), 40.8% or 2,954 individuals are in the labor force, with 14.3% or 422 of them unemployed. The age group with the highest labor force participation rate is 20 to 24 years, with 60.6% or 363 individuals in the labor force. Within the labor force, the 20 to 24 years age range has the highest percentage of unemployed individuals, with 31.4% or 114 of them being unemployed.
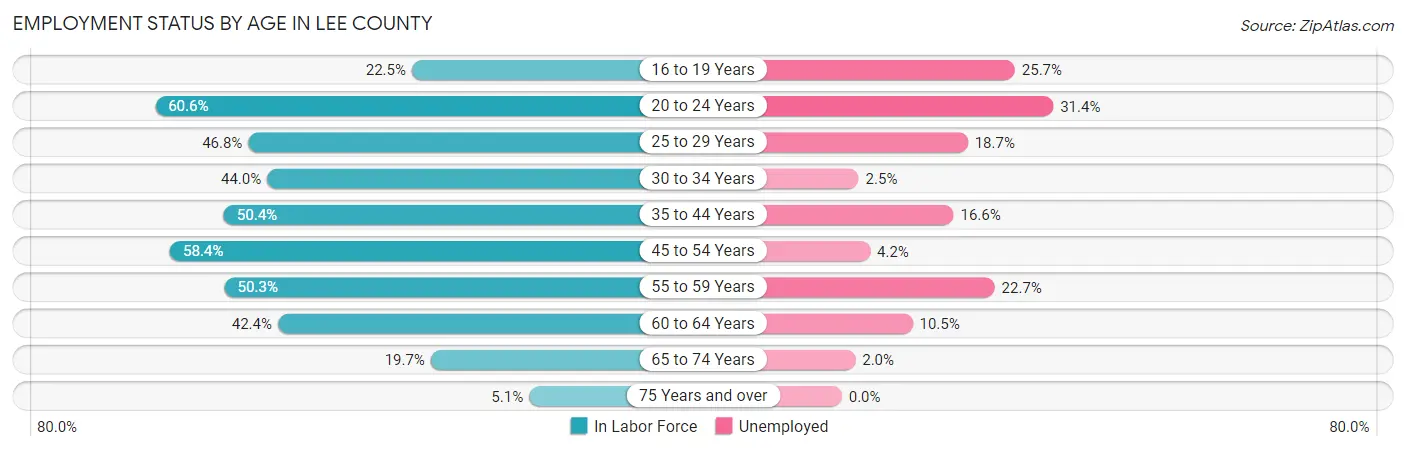
| Age Bracket | In Labor Force | Unemployed |
| 16 to 19 Years | 101 (22.5%) | 26 (25.7%) |
| 20 to 24 Years | 363 (60.6%) | 114 (31.4%) |
| 25 to 29 Years | 241 (46.8%) | 45 (18.7%) |
| 30 to 34 Years | 276 (44.0%) | 7 (2.5%) |
| 35 to 44 Years | 620 (50.4%) | 103 (16.6%) |
| 45 to 54 Years | 595 (58.4%) | 25 (4.2%) |
| 55 to 59 Years | 361 (50.3%) | 82 (22.7%) |
| 60 to 64 Years | 162 (42.4%) | 17 (10.5%) |
| 65 to 74 Years | 201 (19.7%) | 4 (2.0%) |
| 75 Years and over | 35 (5.1%) | 0 (0.0%) |
| Total | 2,954 (40.8%) | 422 (14.3%) |
Employment Status by Educational Attainment in Lee County
According to labor force statistics for Lee County, 50.2% of individuals (2,254) out of the total population between 25 and 64 years of age (4,490) are in the labor force, with 12.4% or 279 of them being unemployed. The group with the highest labor force participation rate are those with the educational attainment of bachelor's degree or higher, with 81.2% or 298 individuals in the labor force. Within the labor force, individuals with less than high school education have the highest percentage of unemployment, with 31.6% or 55 of them being unemployed.
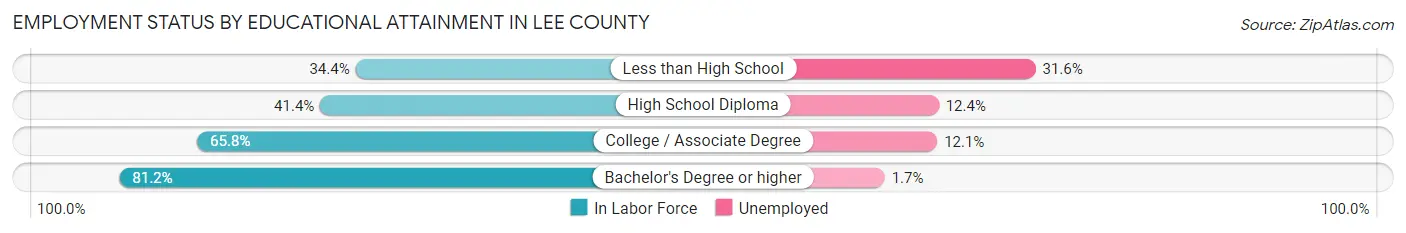
| Educational Attainment | In Labor Force | Unemployed |
| Less than High School | 174 (34.4%) | 160 (31.6%) |
| High School Diploma | 1,014 (41.4%) | 304 (12.4%) |
| College / Associate Degree | 769 (65.8%) | 141 (12.1%) |
| Bachelor's Degree or higher | 298 (81.2%) | 6 (1.7%) |
| Total | 2,254 (50.2%) | 557 (12.4%) |
Employment Occupations by Sex in Lee County
Management, Business, Science and Arts Occupations
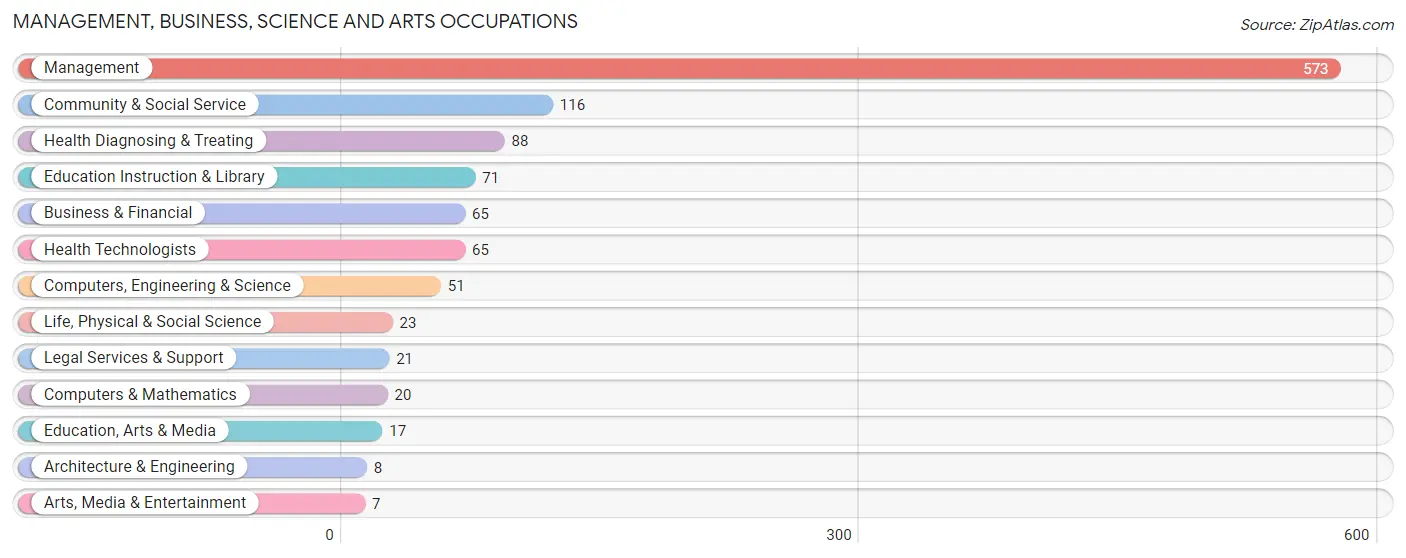
The most common Management, Business, Science and Arts occupations in Lee County are Management (573 | 22.6%), Community & Social Service (116 | 4.6%), Health Diagnosing & Treating (88 | 3.5%), Education Instruction & Library (71 | 2.8%), and Business & Financial (65 | 2.6%).
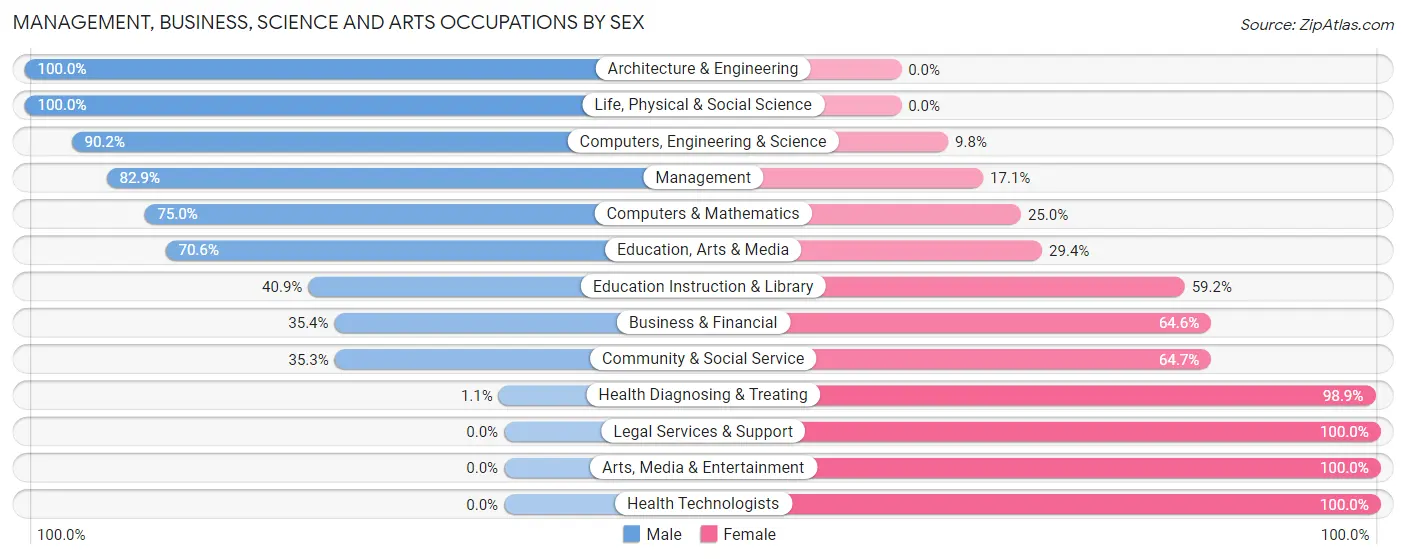
Management, Business, Science and Arts Occupations by Sex
Within the Management, Business, Science and Arts occupations in Lee County, the most male-oriented occupations are Architecture & Engineering (100.0%), Life, Physical & Social Science (100.0%), and Computers, Engineering & Science (90.2%), while the most female-oriented occupations are Legal Services & Support (100.0%), Arts, Media & Entertainment (100.0%), and Health Technologists (100.0%).
| Occupation | Male | Female |
| Management | 475 (82.9%) | 98 (17.1%) |
| Business & Financial | 23 (35.4%) | 42 (64.6%) |
| Computers, Engineering & Science | 46 (90.2%) | 5 (9.8%) |
| Computers & Mathematics | 15 (75.0%) | 5 (25.0%) |
| Architecture & Engineering | 8 (100.0%) | 0 (0.0%) |
| Life, Physical & Social Science | 23 (100.0%) | 0 (0.0%) |
| Community & Social Service | 41 (35.3%) | 75 (64.7%) |
| Education, Arts & Media | 12 (70.6%) | 5 (29.4%) |
| Legal Services & Support | 0 (0.0%) | 21 (100.0%) |
| Education Instruction & Library | 29 (40.8%) | 42 (59.2%) |
| Arts, Media & Entertainment | 0 (0.0%) | 7 (100.0%) |
| Health Diagnosing & Treating | 1 (1.1%) | 87 (98.9%) |
| Health Technologists | 0 (0.0%) | 65 (100.0%) |
| Total (Category) | 586 (65.6%) | 307 (34.4%) |
| Total (Overall) | 1,603 (63.3%) | 929 (36.7%) |
Services Occupations
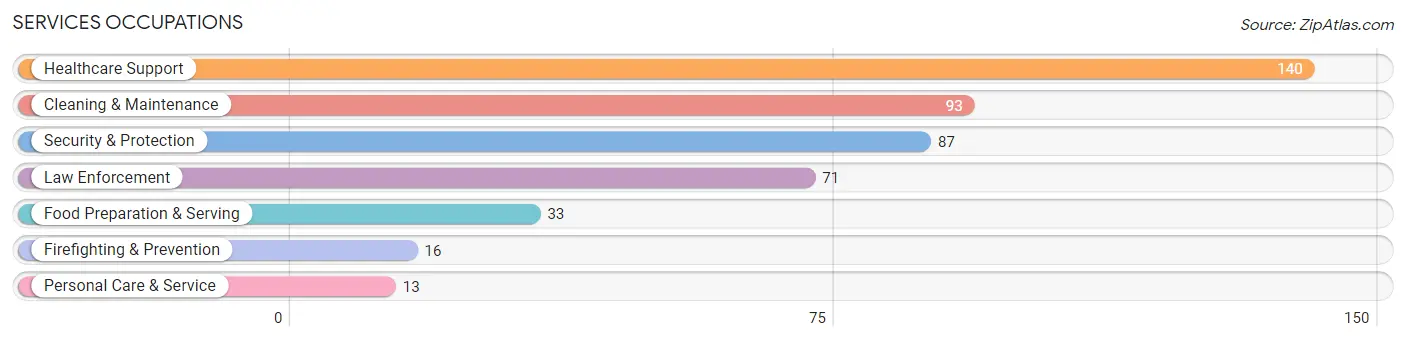
The most common Services occupations in Lee County are Healthcare Support (140 | 5.5%), Cleaning & Maintenance (93 | 3.7%), Security & Protection (87 | 3.4%), Law Enforcement (71 | 2.8%), and Food Preparation & Serving (33 | 1.3%).
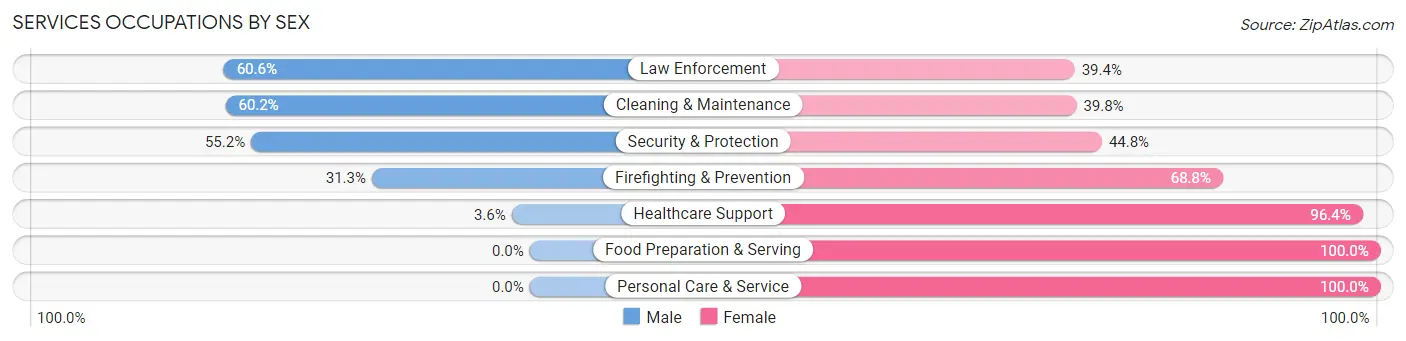
Services Occupations by Sex
Within the Services occupations in Lee County, the most male-oriented occupations are Law Enforcement (60.6%), Cleaning & Maintenance (60.2%), and Security & Protection (55.2%), while the most female-oriented occupations are Food Preparation & Serving (100.0%), Personal Care & Service (100.0%), and Healthcare Support (96.4%).
| Occupation | Male | Female |
| Healthcare Support | 5 (3.6%) | 135 (96.4%) |
| Security & Protection | 48 (55.2%) | 39 (44.8%) |
| Firefighting & Prevention | 5 (31.2%) | 11 (68.8%) |
| Law Enforcement | 43 (60.6%) | 28 (39.4%) |
| Food Preparation & Serving | 0 (0.0%) | 33 (100.0%) |
| Cleaning & Maintenance | 56 (60.2%) | 37 (39.8%) |
| Personal Care & Service | 0 (0.0%) | 13 (100.0%) |
| Total (Category) | 109 (29.8%) | 257 (70.2%) |
| Total (Overall) | 1,603 (63.3%) | 929 (36.7%) |
Sales and Office Occupations
The most common Sales and Office occupations in Lee County are Office & Administration (212 | 8.4%), and Sales & Related (194 | 7.7%).
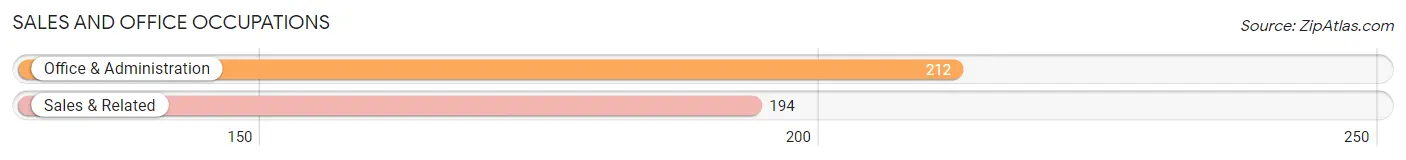
Sales and Office Occupations by Sex
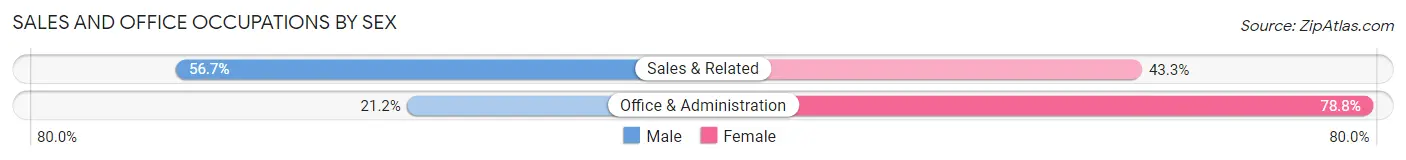
| Occupation | Male | Female |
| Sales & Related | 110 (56.7%) | 84 (43.3%) |
| Office & Administration | 45 (21.2%) | 167 (78.8%) |
| Total (Category) | 155 (38.2%) | 251 (61.8%) |
| Total (Overall) | 1,603 (63.3%) | 929 (36.7%) |
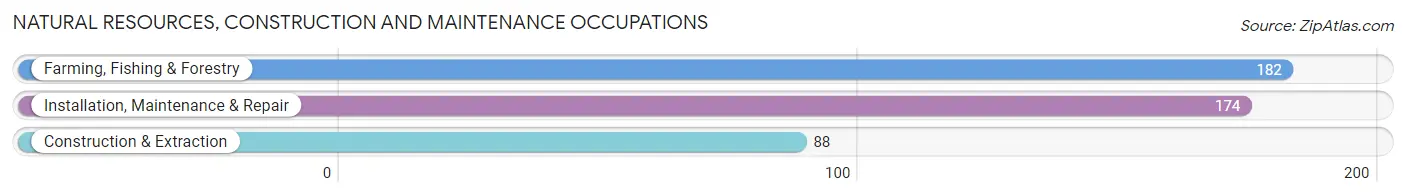
Natural Resources, Construction and Maintenance Occupations
The most common Natural Resources, Construction and Maintenance occupations in Lee County are Farming, Fishing & Forestry (182 | 7.2%), Installation, Maintenance & Repair (174 | 6.9%), and Construction & Extraction (88 | 3.5%).
Natural Resources, Construction and Maintenance Occupations by Sex
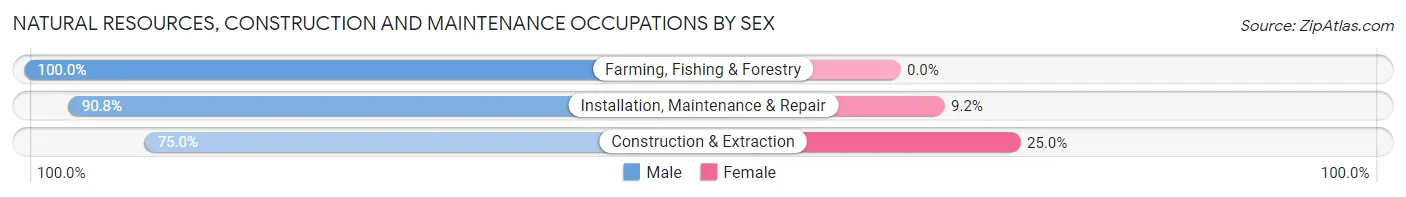
| Occupation | Male | Female |
| Farming, Fishing & Forestry | 182 (100.0%) | 0 (0.0%) |
| Construction & Extraction | 66 (75.0%) | 22 (25.0%) |
| Installation, Maintenance & Repair | 158 (90.8%) | 16 (9.2%) |
| Total (Category) | 406 (91.4%) | 38 (8.6%) |
| Total (Overall) | 1,603 (63.3%) | 929 (36.7%) |
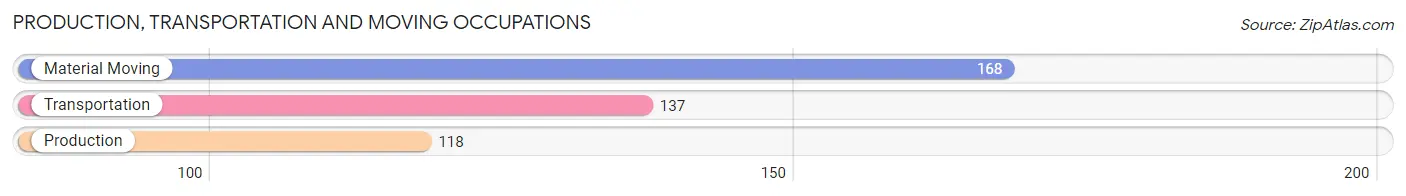
Production, Transportation and Moving Occupations
The most common Production, Transportation and Moving occupations in Lee County are Material Moving (168 | 6.6%), Transportation (137 | 5.4%), and Production (118 | 4.7%).
Production, Transportation and Moving Occupations by Sex
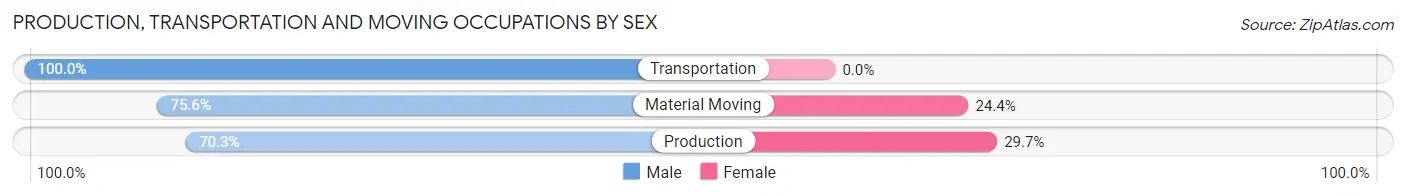
| Occupation | Male | Female |
| Production | 83 (70.3%) | 35 (29.7%) |
| Transportation | 137 (100.0%) | 0 (0.0%) |
| Material Moving | 127 (75.6%) | 41 (24.4%) |
| Total (Category) | 347 (82.0%) | 76 (18.0%) |
| Total (Overall) | 1,603 (63.3%) | 929 (36.7%) |
Employment Industries by Sex in Lee County
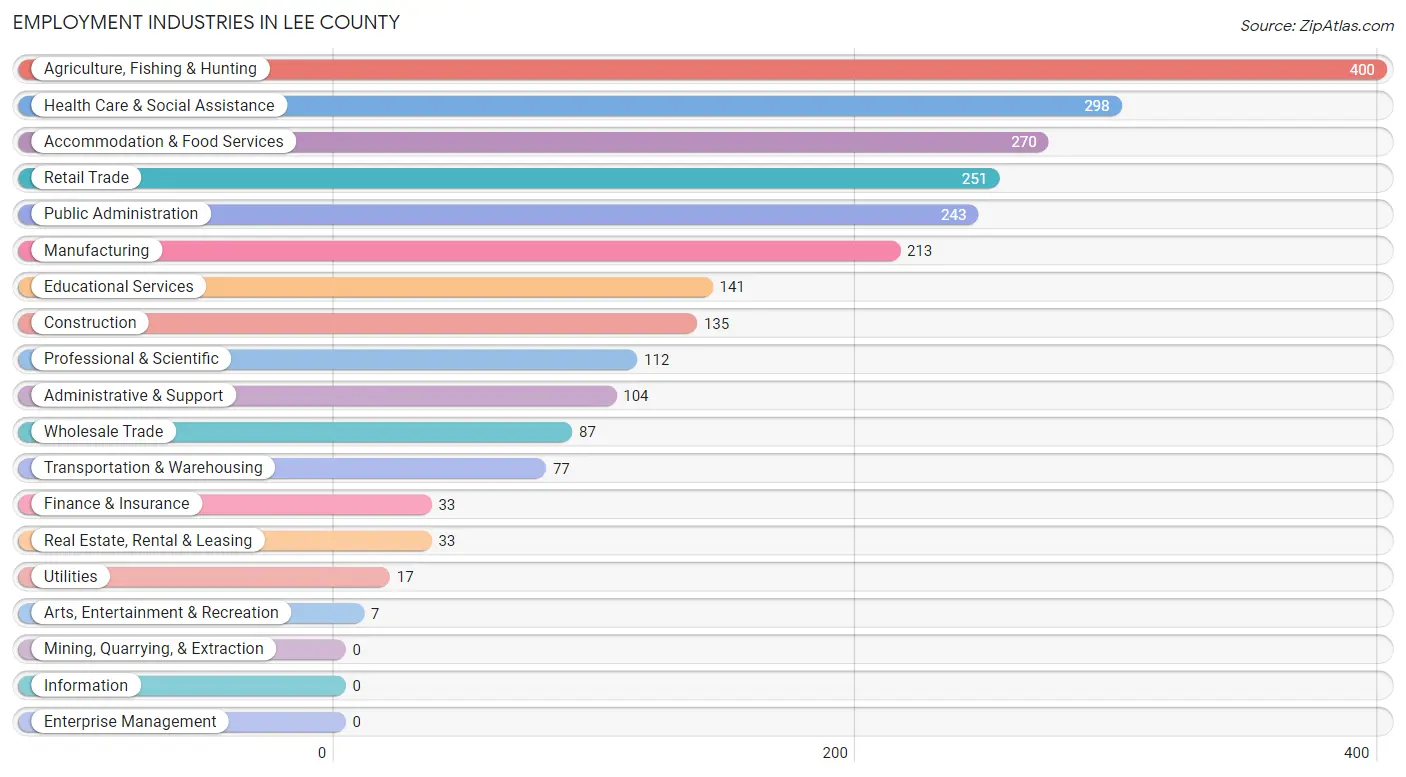
Employment Industries in Lee County
The major employment industries in Lee County include Agriculture, Fishing & Hunting (400 | 15.8%), Health Care & Social Assistance (298 | 11.8%), Accommodation & Food Services (270 | 10.7%), Retail Trade (251 | 9.9%), and Public Administration (243 | 9.6%).
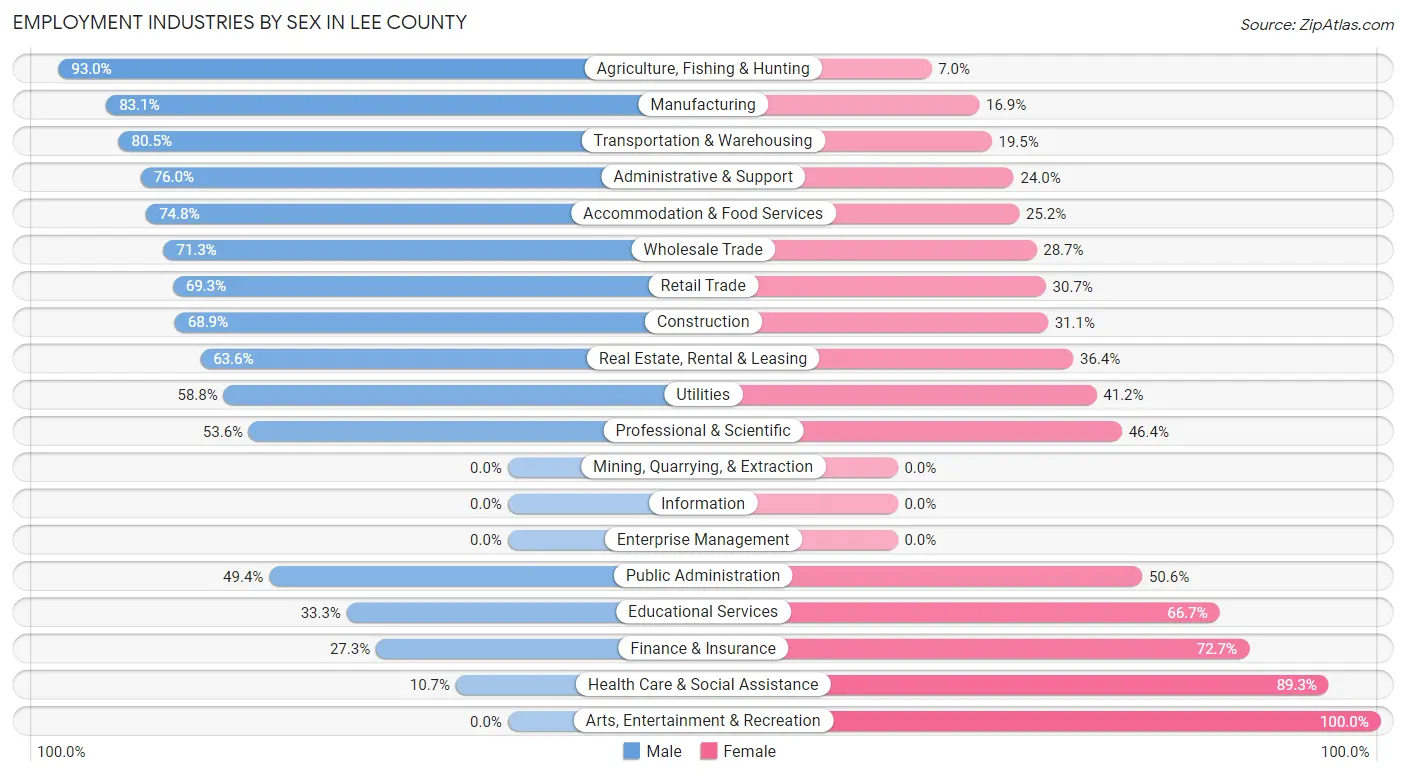
Employment Industries by Sex in Lee County
The Lee County industries that see more men than women are Agriculture, Fishing & Hunting (93.0%), Manufacturing (83.1%), and Transportation & Warehousing (80.5%), whereas the industries that tend to have a higher number of women are Arts, Entertainment & Recreation (100.0%), Health Care & Social Assistance (89.3%), and Finance & Insurance (72.7%).
| Industry | Male | Female |
| Agriculture, Fishing & Hunting | 372 (93.0%) | 28 (7.0%) |
| Mining, Quarrying, & Extraction | 0 (0.0%) | 0 (0.0%) |
| Construction | 93 (68.9%) | 42 (31.1%) |
| Manufacturing | 177 (83.1%) | 36 (16.9%) |
| Wholesale Trade | 62 (71.3%) | 25 (28.7%) |
| Retail Trade | 174 (69.3%) | 77 (30.7%) |
| Transportation & Warehousing | 62 (80.5%) | 15 (19.5%) |
| Utilities | 10 (58.8%) | 7 (41.2%) |
| Information | 0 (0.0%) | 0 (0.0%) |
| Finance & Insurance | 9 (27.3%) | 24 (72.7%) |
| Real Estate, Rental & Leasing | 21 (63.6%) | 12 (36.4%) |
| Professional & Scientific | 60 (53.6%) | 52 (46.4%) |
| Enterprise Management | 0 (0.0%) | 0 (0.0%) |
| Administrative & Support | 79 (76.0%) | 25 (24.0%) |
| Educational Services | 47 (33.3%) | 94 (66.7%) |
| Health Care & Social Assistance | 32 (10.7%) | 266 (89.3%) |
| Arts, Entertainment & Recreation | 0 (0.0%) | 7 (100.0%) |
| Accommodation & Food Services | 202 (74.8%) | 68 (25.2%) |
| Public Administration | 120 (49.4%) | 123 (50.6%) |
| Total | 1,603 (63.3%) | 929 (36.7%) |
Education in Lee County
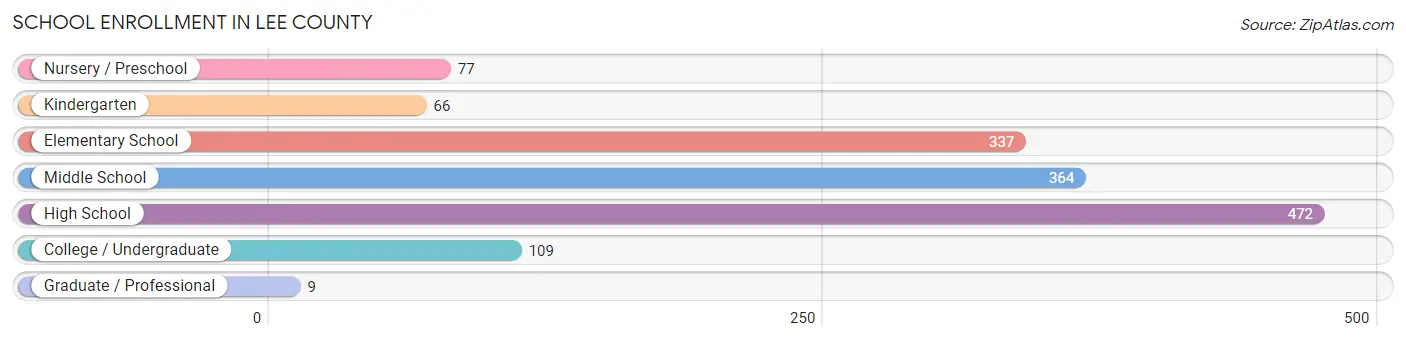
School Enrollment in Lee County
The most common levels of schooling among the 1,434 students in Lee County are high school (472 | 32.9%), middle school (364 | 25.4%), and elementary school (337 | 23.5%).
| School Level | # Students | % Students |
| Nursery / Preschool | 77 | 5.4% |
| Kindergarten | 66 | 4.6% |
| Elementary School | 337 | 23.5% |
| Middle School | 364 | 25.4% |
| High School | 472 | 32.9% |
| College / Undergraduate | 109 | 7.6% |
| Graduate / Professional | 9 | 0.6% |
| Total | 1,434 | 100.0% |
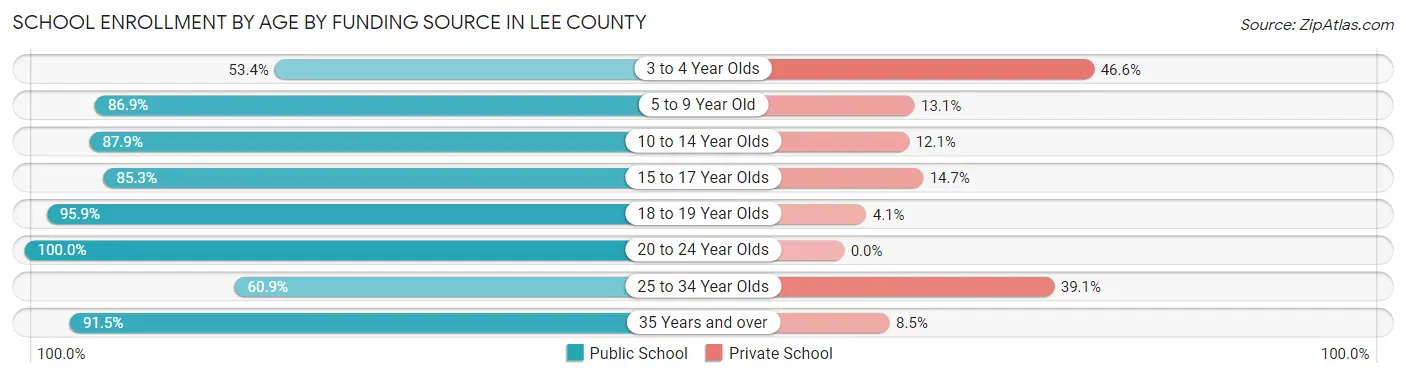
School Enrollment by Age by Funding Source in Lee County
Out of a total of 1,434 students who are enrolled in schools in Lee County, 195 (13.6%) attend a private institution, while the remaining 1,239 (86.4%) are enrolled in public schools. The age group of 3 to 4 year olds has the highest likelihood of being enrolled in private schools, with 34 (46.6% in the age bracket) enrolled. Conversely, the age group of 20 to 24 year olds has the lowest likelihood of being enrolled in a private school, with 37 (100.0% in the age bracket) attending a public institution.
| Age Bracket | Public School | Private School |
| 3 to 4 Year Olds | 39 (53.4%) | 34 (46.6%) |
| 5 to 9 Year Old | 285 (86.9%) | 43 (13.1%) |
| 10 to 14 Year Olds | 421 (87.9%) | 58 (12.1%) |
| 15 to 17 Year Olds | 226 (85.3%) | 39 (14.7%) |
| 18 to 19 Year Olds | 163 (95.9%) | 7 (4.1%) |
| 20 to 24 Year Olds | 37 (100.0%) | 0 (0.0%) |
| 25 to 34 Year Olds | 14 (60.9%) | 9 (39.1%) |
| 35 Years and over | 54 (91.5%) | 5 (8.5%) |
| Total | 1,239 (86.4%) | 195 (13.6%) |
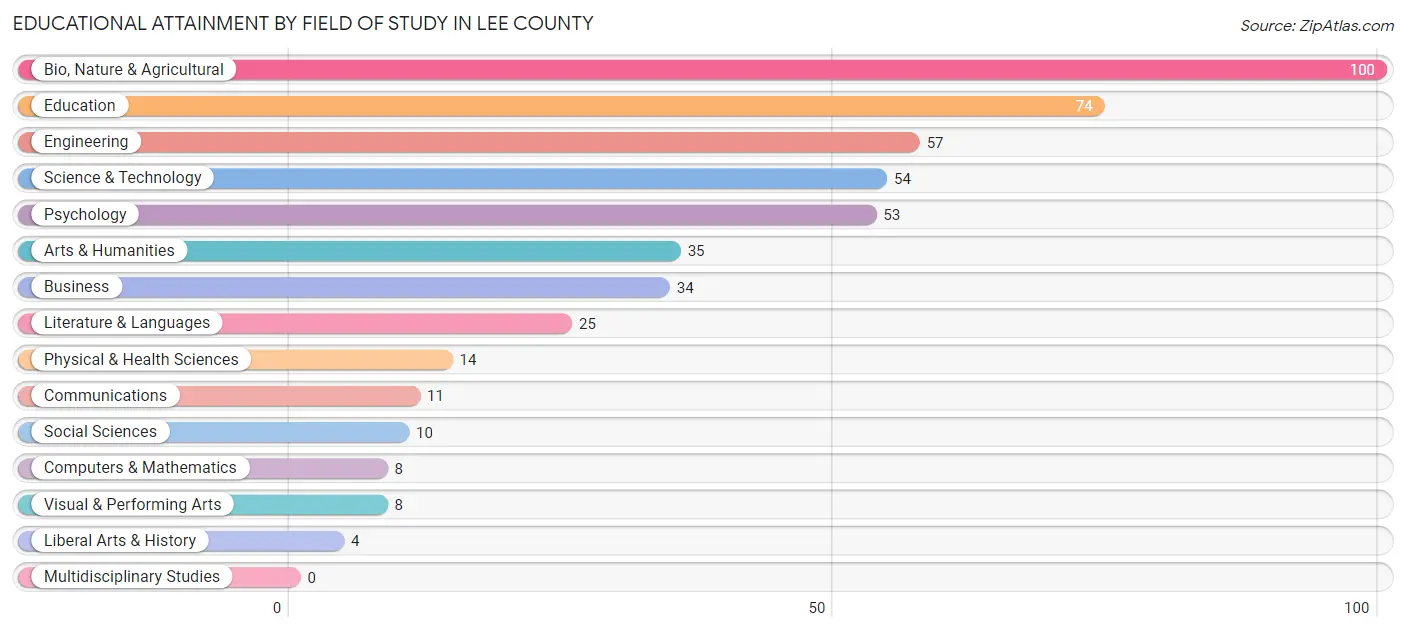
Educational Attainment by Field of Study in Lee County
Bio, nature & agricultural (100 | 20.5%), education (74 | 15.2%), engineering (57 | 11.7%), science & technology (54 | 11.1%), and psychology (53 | 10.9%) are the most common fields of study among 487 individuals in Lee County who have obtained a bachelor's degree or higher.
| Field of Study | # Graduates | % Graduates |
| Computers & Mathematics | 8 | 1.6% |
| Bio, Nature & Agricultural | 100 | 20.5% |
| Physical & Health Sciences | 14 | 2.9% |
| Psychology | 53 | 10.9% |
| Social Sciences | 10 | 2.1% |
| Engineering | 57 | 11.7% |
| Multidisciplinary Studies | 0 | 0.0% |
| Science & Technology | 54 | 11.1% |
| Business | 34 | 7.0% |
| Education | 74 | 15.2% |
| Literature & Languages | 25 | 5.1% |
| Liberal Arts & History | 4 | 0.8% |
| Visual & Performing Arts | 8 | 1.6% |
| Communications | 11 | 2.3% |
| Arts & Humanities | 35 | 7.2% |
| Total | 487 | 100.0% |
Transportation & Commute in Lee County
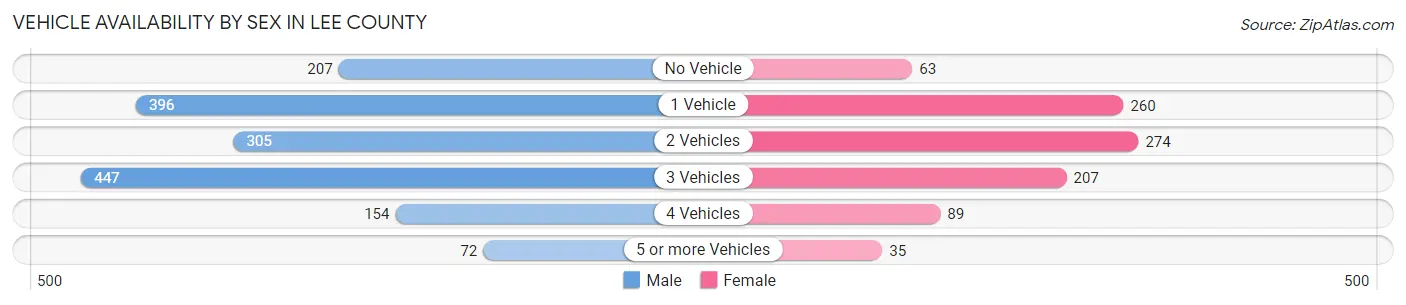
Vehicle Availability by Sex in Lee County
The most prevalent vehicle ownership categories in Lee County are males with 3 vehicles (447, accounting for 28.3%) and females with 3 vehicles (207, making up 48.2%).
| Vehicles Available | Male | Female |
| No Vehicle | 207 (13.1%) | 63 (6.8%) |
| 1 Vehicle | 396 (25.1%) | 260 (28.0%) |
| 2 Vehicles | 305 (19.3%) | 274 (29.5%) |
| 3 Vehicles | 447 (28.3%) | 207 (22.3%) |
| 4 Vehicles | 154 (9.7%) | 89 (9.6%) |
| 5 or more Vehicles | 72 (4.5%) | 35 (3.8%) |
| Total | 1,581 (100.0%) | 928 (100.0%) |
Commute Time in Lee County
The most frequently occuring commute durations in Lee County are 5 to 9 minutes (425 commuters, 19.5%), 20 to 24 minutes (284 commuters, 13.0%), and 10 to 14 minutes (275 commuters, 12.6%).
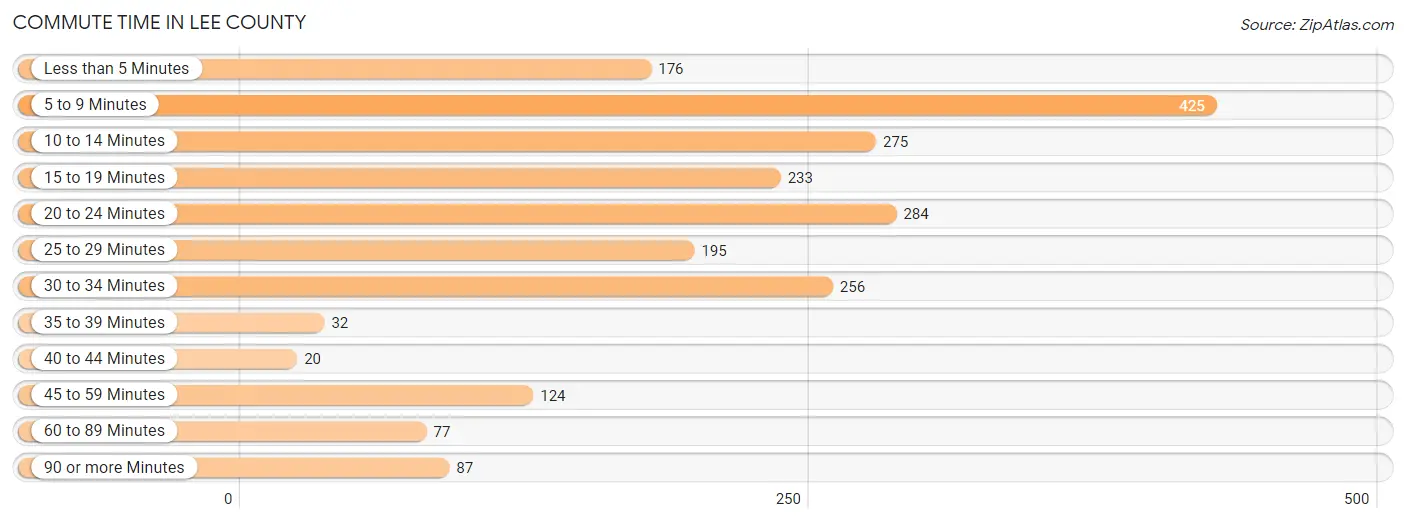
| Commute Time | # Commuters | % Commuters |
| Less than 5 Minutes | 176 | 8.1% |
| 5 to 9 Minutes | 425 | 19.5% |
| 10 to 14 Minutes | 275 | 12.6% |
| 15 to 19 Minutes | 233 | 10.7% |
| 20 to 24 Minutes | 284 | 13.0% |
| 25 to 29 Minutes | 195 | 8.9% |
| 30 to 34 Minutes | 256 | 11.7% |
| 35 to 39 Minutes | 32 | 1.5% |
| 40 to 44 Minutes | 20 | 0.9% |
| 45 to 59 Minutes | 124 | 5.7% |
| 60 to 89 Minutes | 77 | 3.5% |
| 90 or more Minutes | 87 | 4.0% |
Commute Time by Sex in Lee County
The most common commute times in Lee County are 5 to 9 minutes (338 commuters, 25.1%) for males and 30 to 34 minutes (118 commuters, 14.1%) for females.
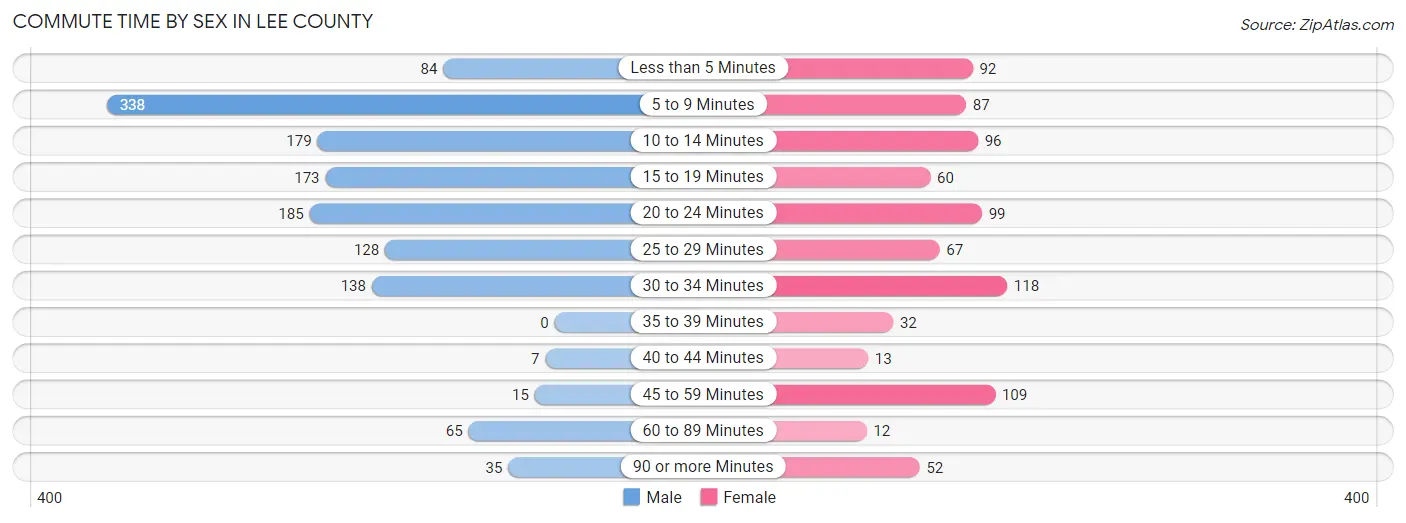
| Commute Time | Male | Female |
| Less than 5 Minutes | 84 (6.2%) | 92 (11.0%) |
| 5 to 9 Minutes | 338 (25.1%) | 87 (10.4%) |
| 10 to 14 Minutes | 179 (13.3%) | 96 (11.5%) |
| 15 to 19 Minutes | 173 (12.8%) | 60 (7.2%) |
| 20 to 24 Minutes | 185 (13.7%) | 99 (11.8%) |
| 25 to 29 Minutes | 128 (9.5%) | 67 (8.0%) |
| 30 to 34 Minutes | 138 (10.2%) | 118 (14.1%) |
| 35 to 39 Minutes | 0 (0.0%) | 32 (3.8%) |
| 40 to 44 Minutes | 7 (0.5%) | 13 (1.5%) |
| 45 to 59 Minutes | 15 (1.1%) | 109 (13.0%) |
| 60 to 89 Minutes | 65 (4.8%) | 12 (1.4%) |
| 90 or more Minutes | 35 (2.6%) | 52 (6.2%) |
Time of Departure to Work by Sex in Lee County
The most frequent times of departure to work in Lee County are 6:30 AM to 6:59 AM (399, 29.6%) for males and 8:00 AM to 8:29 AM (200, 23.9%) for females.
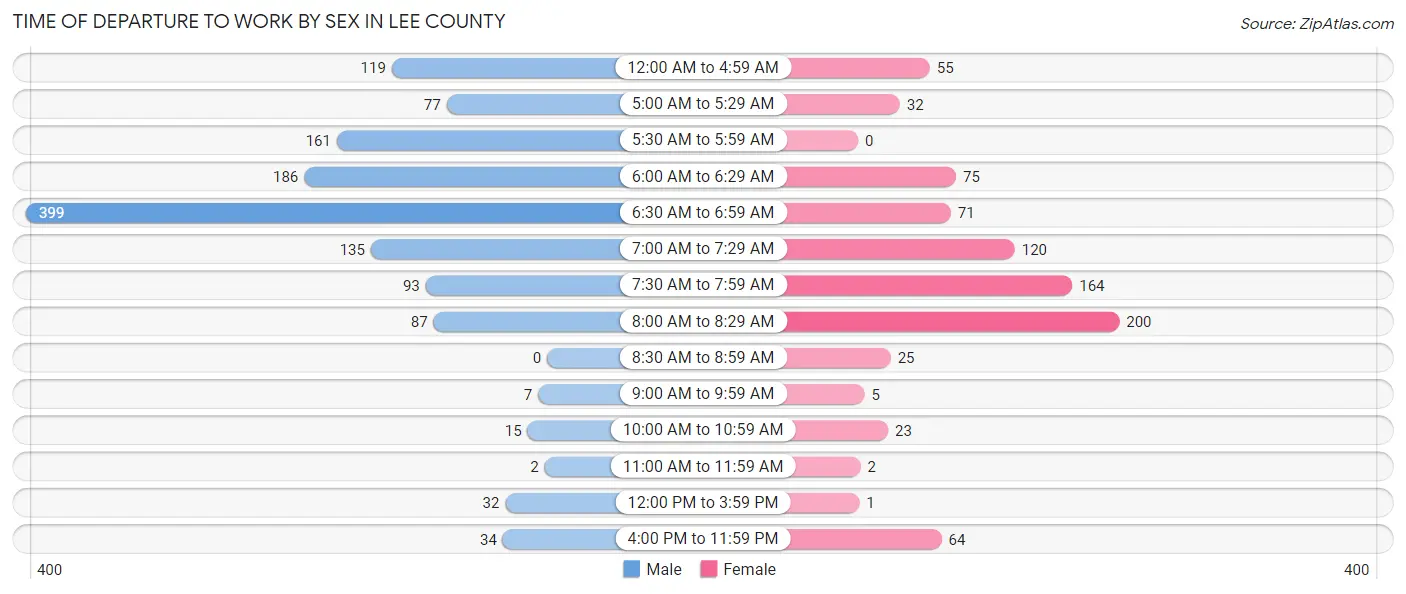
| Time of Departure | Male | Female |
| 12:00 AM to 4:59 AM | 119 (8.8%) | 55 (6.6%) |
| 5:00 AM to 5:29 AM | 77 (5.7%) | 32 (3.8%) |
| 5:30 AM to 5:59 AM | 161 (11.9%) | 0 (0.0%) |
| 6:00 AM to 6:29 AM | 186 (13.8%) | 75 (9.0%) |
| 6:30 AM to 6:59 AM | 399 (29.6%) | 71 (8.5%) |
| 7:00 AM to 7:29 AM | 135 (10.0%) | 120 (14.3%) |
| 7:30 AM to 7:59 AM | 93 (6.9%) | 164 (19.6%) |
| 8:00 AM to 8:29 AM | 87 (6.5%) | 200 (23.9%) |
| 8:30 AM to 8:59 AM | 0 (0.0%) | 25 (3.0%) |
| 9:00 AM to 9:59 AM | 7 (0.5%) | 5 (0.6%) |
| 10:00 AM to 10:59 AM | 15 (1.1%) | 23 (2.8%) |
| 11:00 AM to 11:59 AM | 2 (0.2%) | 2 (0.2%) |
| 12:00 PM to 3:59 PM | 32 (2.4%) | 1 (0.1%) |
| 4:00 PM to 11:59 PM | 34 (2.5%) | 64 (7.6%) |
| Total | 1,347 (100.0%) | 837 (100.0%) |
Housing Occupancy in Lee County
Occupancy by Ownership in Lee County
Of the total 2,586 dwellings in Lee County, owner-occupied units account for 1,601 (61.9%), while renter-occupied units make up 985 (38.1%).
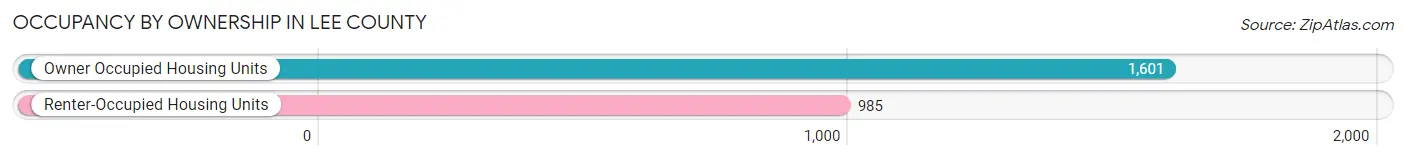
| Occupancy | # Housing Units | % Housing Units |
| Owner Occupied Housing Units | 1,601 | 61.9% |
| Renter-Occupied Housing Units | 985 | 38.1% |
| Total Occupied Housing Units | 2,586 | 100.0% |
Occupancy by Household Size in Lee County
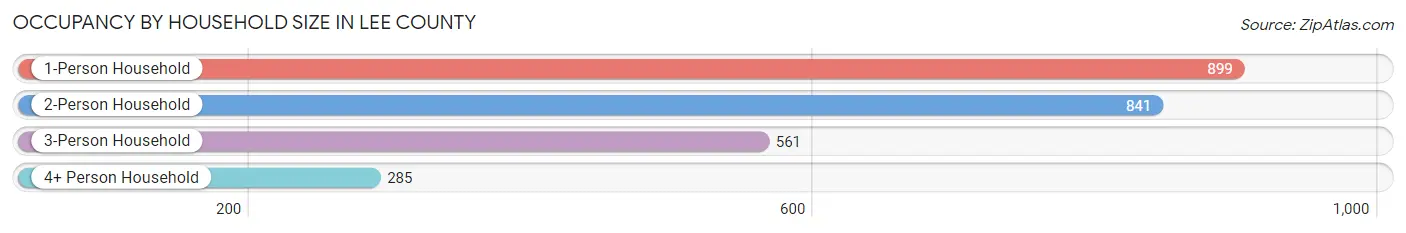
| Household Size | # Housing Units | % Housing Units |
| 1-Person Household | 899 | 34.8% |
| 2-Person Household | 841 | 32.5% |
| 3-Person Household | 561 | 21.7% |
| 4+ Person Household | 285 | 11.0% |
| Total Housing Units | 2,586 | 100.0% |
Occupancy by Ownership by Household Size in Lee County
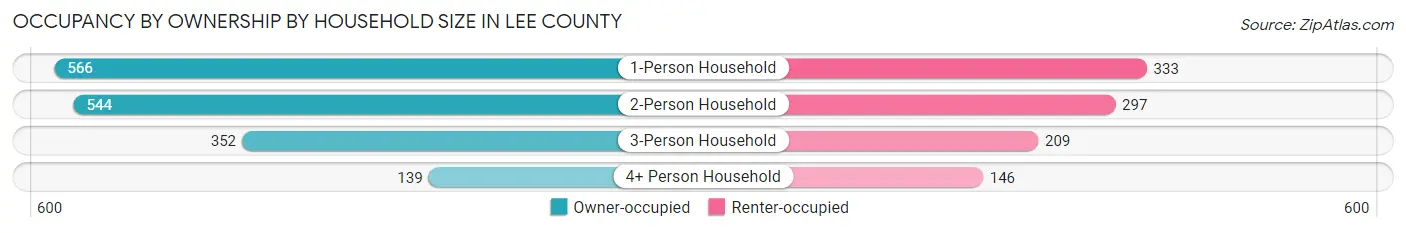
| Household Size | Owner-occupied | Renter-occupied |
| 1-Person Household | 566 (63.0%) | 333 (37.0%) |
| 2-Person Household | 544 (64.7%) | 297 (35.3%) |
| 3-Person Household | 352 (62.7%) | 209 (37.2%) |
| 4+ Person Household | 139 (48.8%) | 146 (51.2%) |
| Total Housing Units | 1,601 (61.9%) | 985 (38.1%) |
Occupancy by Educational Attainment in Lee County
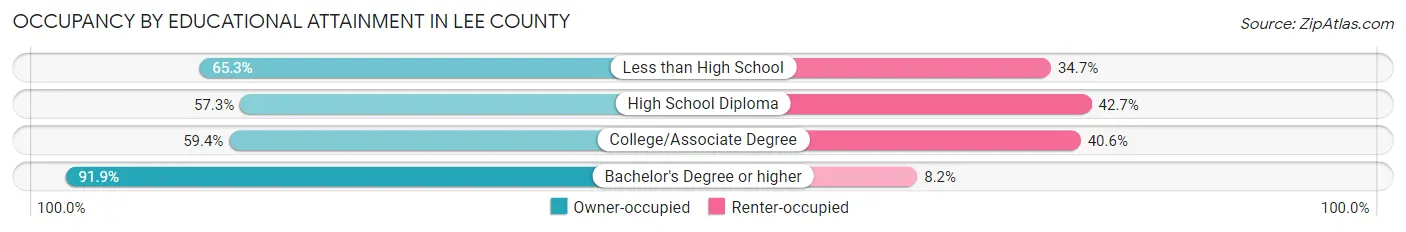
| Household Size | Owner-occupied | Renter-occupied |
| Less than High School | 296 (65.3%) | 157 (34.7%) |
| High School Diploma | 601 (57.3%) | 448 (42.7%) |
| College/Associate Degree | 535 (59.4%) | 365 (40.6%) |
| Bachelor's Degree or higher | 169 (91.8%) | 15 (8.2%) |
Occupancy by Age of Householder in Lee County
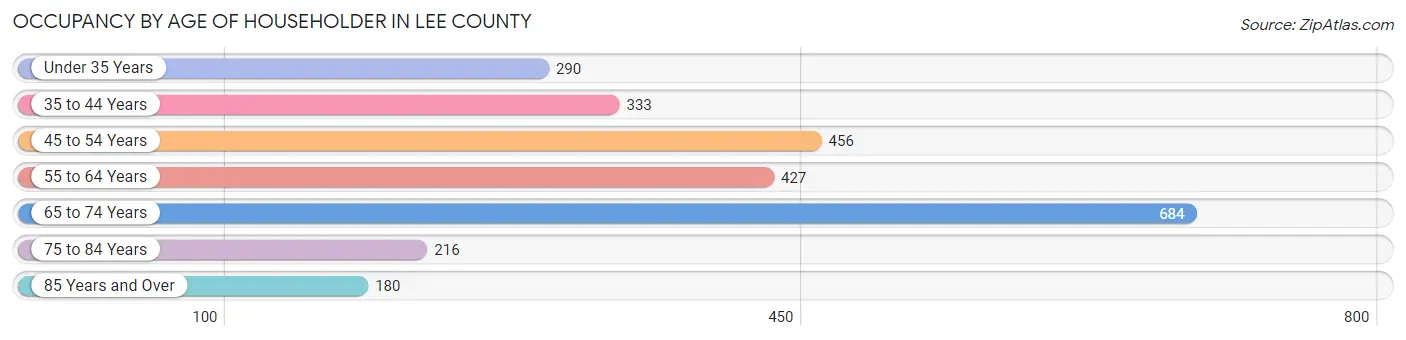
| Age Bracket | # Households | % Households |
| Under 35 Years | 290 | 11.2% |
| 35 to 44 Years | 333 | 12.9% |
| 45 to 54 Years | 456 | 17.6% |
| 55 to 64 Years | 427 | 16.5% |
| 65 to 74 Years | 684 | 26.5% |
| 75 to 84 Years | 216 | 8.4% |
| 85 Years and Over | 180 | 7.0% |
| Total | 2,586 | 100.0% |
Housing Finances in Lee County
Median Income by Occupancy in Lee County
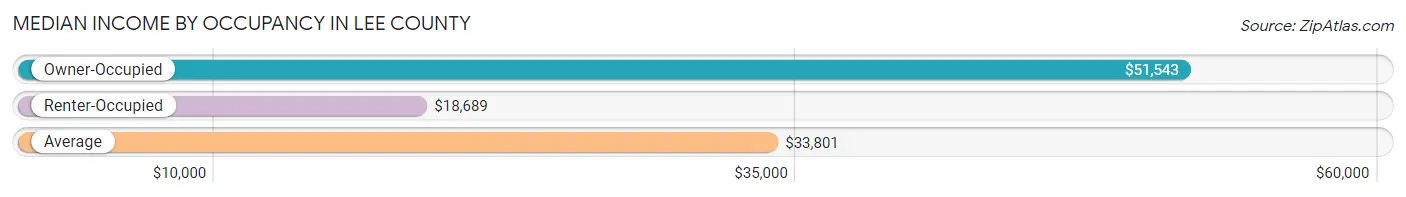
| Occupancy Type | # Households | Median Income |
| Owner-Occupied | 1,601 (61.9%) | $51,543 |
| Renter-Occupied | 985 (38.1%) | $18,689 |
| Average | 2,586 (100.0%) | $33,801 |
Occupancy by Householder Income Bracket in Lee County
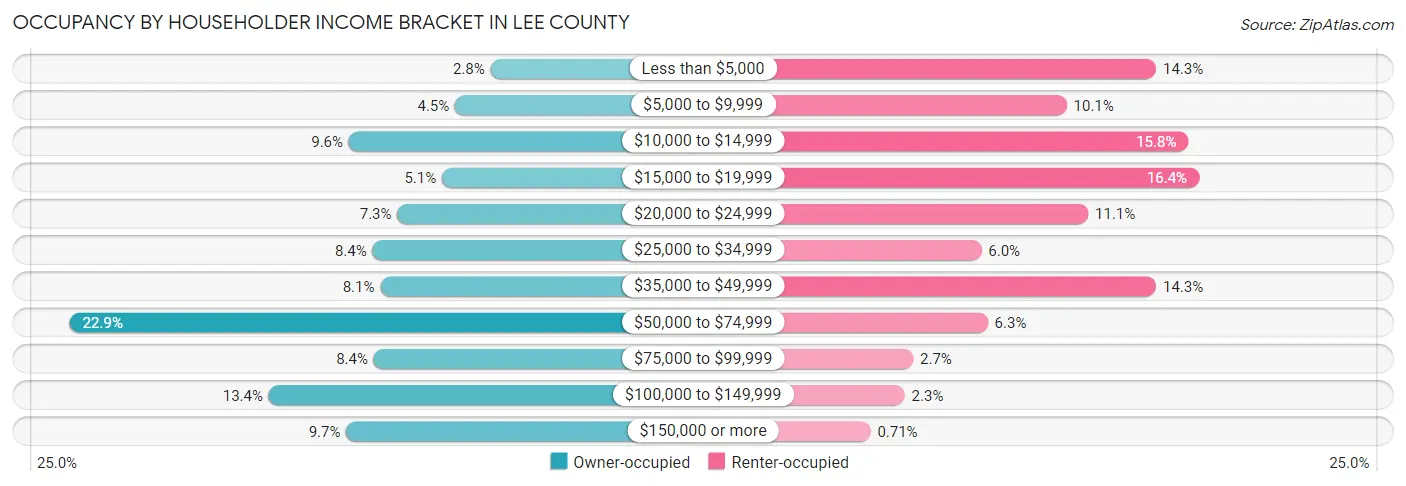
| Income Bracket | Owner-occupied | Renter-occupied |
| Less than $5,000 | 45 (2.8%) | 141 (14.3%) |
| $5,000 to $9,999 | 72 (4.5%) | 99 (10.1%) |
| $10,000 to $14,999 | 153 (9.6%) | 156 (15.8%) |
| $15,000 to $19,999 | 82 (5.1%) | 161 (16.4%) |
| $20,000 to $24,999 | 116 (7.2%) | 109 (11.1%) |
| $25,000 to $34,999 | 135 (8.4%) | 59 (6.0%) |
| $35,000 to $49,999 | 129 (8.1%) | 141 (14.3%) |
| $50,000 to $74,999 | 366 (22.9%) | 62 (6.3%) |
| $75,000 to $99,999 | 134 (8.4%) | 27 (2.7%) |
| $100,000 to $149,999 | 214 (13.4%) | 23 (2.3%) |
| $150,000 or more | 155 (9.7%) | 7 (0.7%) |
| Total | 1,601 (100.0%) | 985 (100.0%) |
Monthly Housing Cost Tiers in Lee County
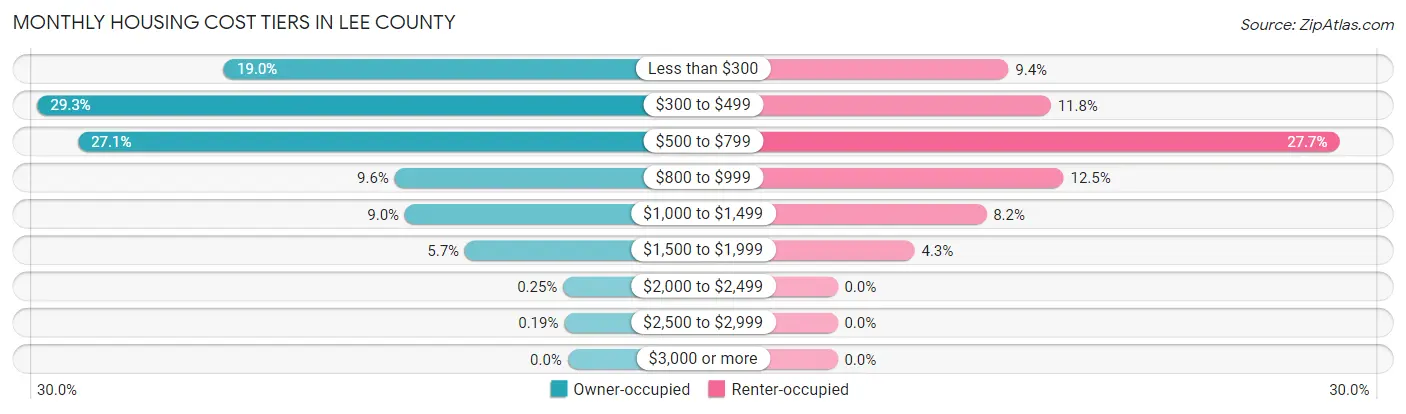
| Monthly Cost | Owner-occupied | Renter-occupied |
| Less than $300 | 304 (19.0%) | 93 (9.4%) |
| $300 to $499 | 469 (29.3%) | 116 (11.8%) |
| $500 to $799 | 433 (27.1%) | 273 (27.7%) |
| $800 to $999 | 153 (9.6%) | 123 (12.5%) |
| $1,000 to $1,499 | 144 (9.0%) | 81 (8.2%) |
| $1,500 to $1,999 | 91 (5.7%) | 42 (4.3%) |
| $2,000 to $2,499 | 4 (0.3%) | 0 (0.0%) |
| $2,500 to $2,999 | 3 (0.2%) | 0 (0.0%) |
| $3,000 or more | 0 (0.0%) | 0 (0.0%) |
| Total | 1,601 (100.0%) | 985 (100.0%) |
Physical Housing Characteristics in Lee County
Housing Structures in Lee County
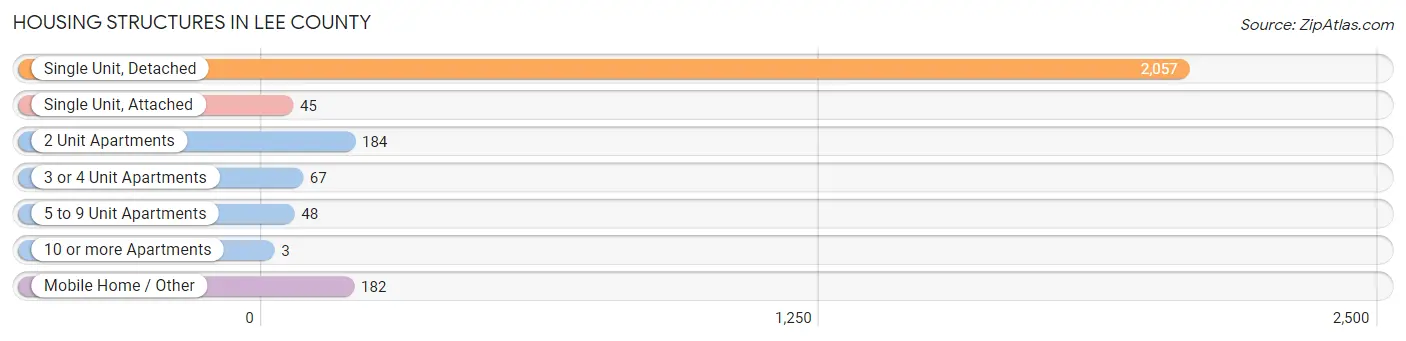
| Structure Type | # Housing Units | % Housing Units |
| Single Unit, Detached | 2,057 | 79.5% |
| Single Unit, Attached | 45 | 1.7% |
| 2 Unit Apartments | 184 | 7.1% |
| 3 or 4 Unit Apartments | 67 | 2.6% |
| 5 to 9 Unit Apartments | 48 | 1.9% |
| 10 or more Apartments | 3 | 0.1% |
| Mobile Home / Other | 182 | 7.0% |
| Total | 2,586 | 100.0% |
Housing Structures by Occupancy in Lee County
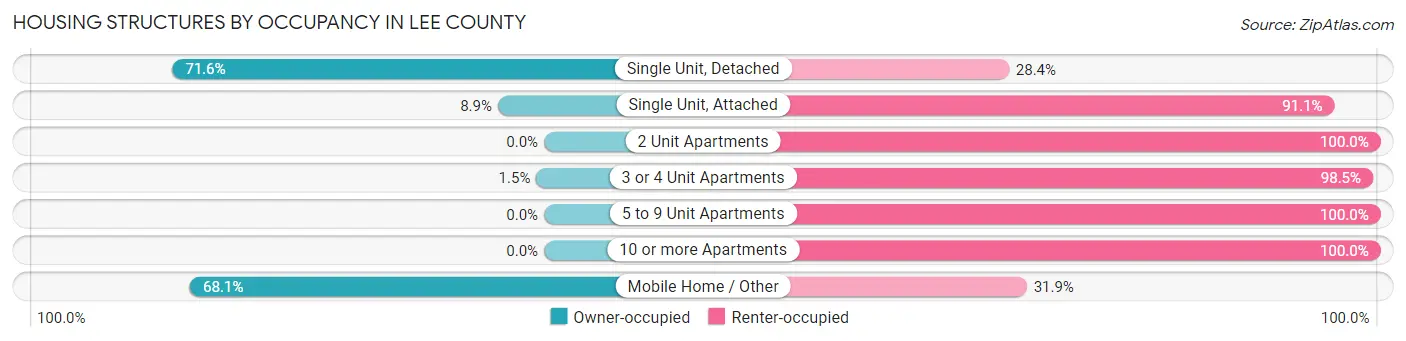
| Structure Type | Owner-occupied | Renter-occupied |
| Single Unit, Detached | 1,472 (71.6%) | 585 (28.4%) |
| Single Unit, Attached | 4 (8.9%) | 41 (91.1%) |
| 2 Unit Apartments | 0 (0.0%) | 184 (100.0%) |
| 3 or 4 Unit Apartments | 1 (1.5%) | 66 (98.5%) |
| 5 to 9 Unit Apartments | 0 (0.0%) | 48 (100.0%) |
| 10 or more Apartments | 0 (0.0%) | 3 (100.0%) |
| Mobile Home / Other | 124 (68.1%) | 58 (31.9%) |
| Total | 1,601 (61.9%) | 985 (38.1%) |
Housing Structures by Number of Rooms in Lee County
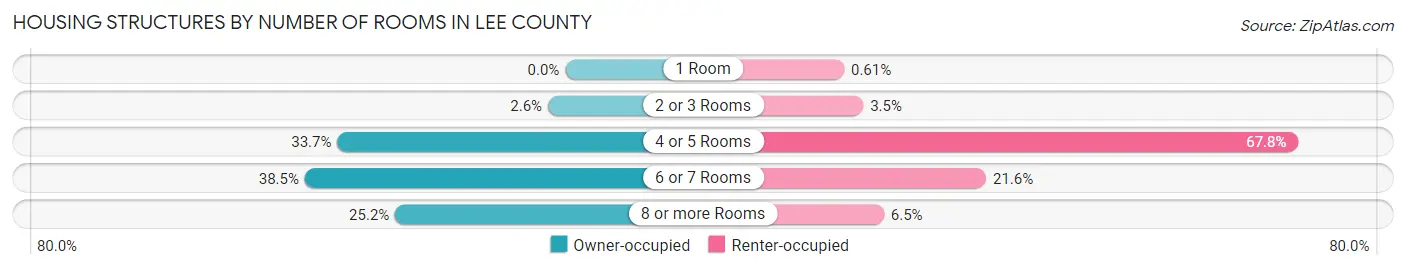
| Number of Rooms | Owner-occupied | Renter-occupied |
| 1 Room | 0 (0.0%) | 6 (0.6%) |
| 2 or 3 Rooms | 41 (2.6%) | 34 (3.5%) |
| 4 or 5 Rooms | 540 (33.7%) | 668 (67.8%) |
| 6 or 7 Rooms | 617 (38.5%) | 213 (21.6%) |
| 8 or more Rooms | 403 (25.2%) | 64 (6.5%) |
| Total | 1,601 (100.0%) | 985 (100.0%) |
Housing Structure by Heating Type in Lee County
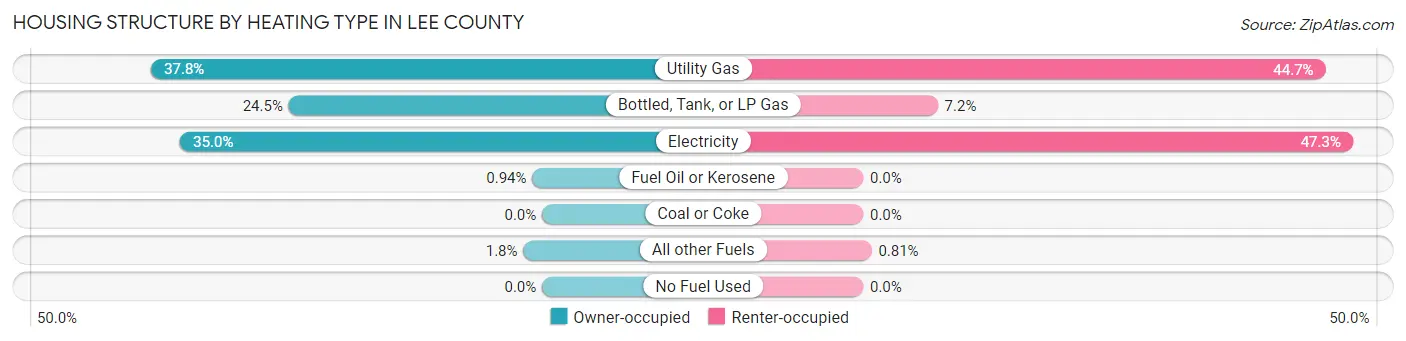
| Heating Type | Owner-occupied | Renter-occupied |
| Utility Gas | 605 (37.8%) | 440 (44.7%) |
| Bottled, Tank, or LP Gas | 392 (24.5%) | 71 (7.2%) |
| Electricity | 560 (35.0%) | 466 (47.3%) |
| Fuel Oil or Kerosene | 15 (0.9%) | 0 (0.0%) |
| Coal or Coke | 0 (0.0%) | 0 (0.0%) |
| All other Fuels | 29 (1.8%) | 8 (0.8%) |
| No Fuel Used | 0 (0.0%) | 0 (0.0%) |
| Total | 1,601 (100.0%) | 985 (100.0%) |
Household Vehicle Usage in Lee County
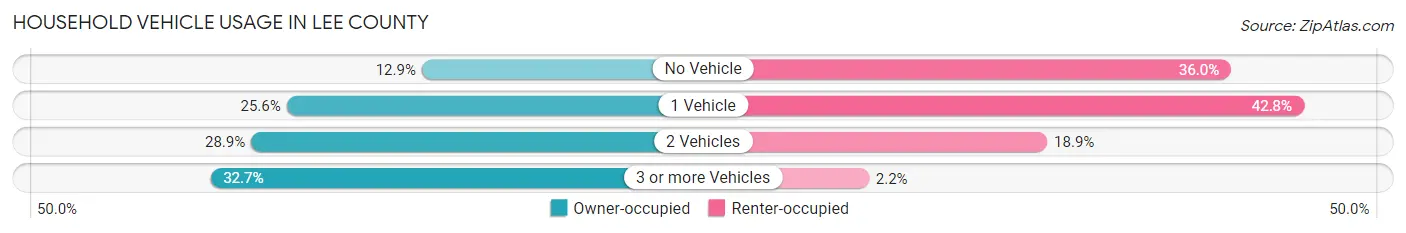
| Vehicles per Household | Owner-occupied | Renter-occupied |
| No Vehicle | 207 (12.9%) | 355 (36.0%) |
| 1 Vehicle | 409 (25.6%) | 422 (42.8%) |
| 2 Vehicles | 462 (28.9%) | 186 (18.9%) |
| 3 or more Vehicles | 523 (32.7%) | 22 (2.2%) |
| Total | 1,601 (100.0%) | 985 (100.0%) |
Real Estate & Mortgages in Lee County
Real Estate and Mortgage Overview in Lee County
| Characteristic | Without Mortgage | With Mortgage |
| Housing Units | 1,168 | 433 |
| Median Property Value | $73,000 | $97,900 |
| Median Household Income | $42,292 | $78 |
| Monthly Housing Costs | $434 | $0 |
| Real Estate Taxes | $411 | $13 |
Property Value by Mortgage Status in Lee County
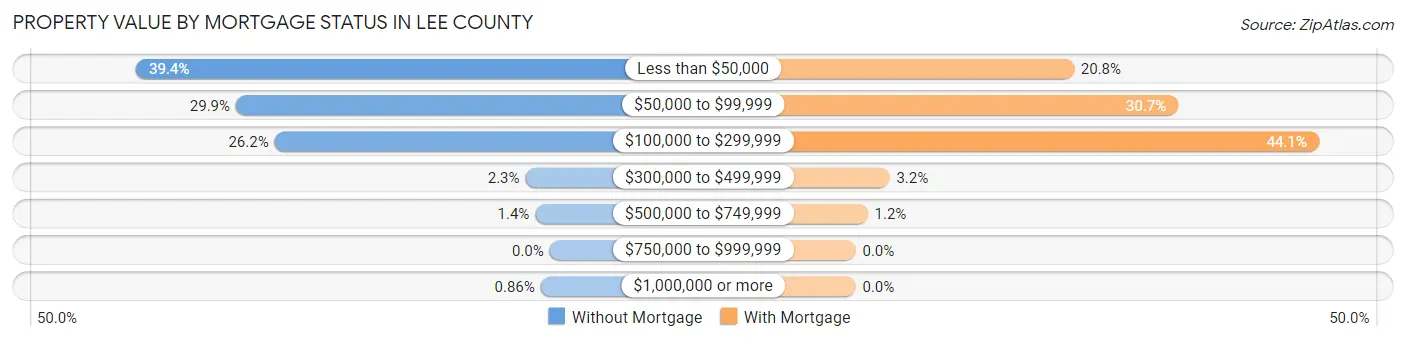
| Property Value | Without Mortgage | With Mortgage |
| Less than $50,000 | 460 (39.4%) | 90 (20.8%) |
| $50,000 to $99,999 | 349 (29.9%) | 133 (30.7%) |
| $100,000 to $299,999 | 306 (26.2%) | 191 (44.1%) |
| $300,000 to $499,999 | 27 (2.3%) | 14 (3.2%) |
| $500,000 to $749,999 | 16 (1.4%) | 5 (1.1%) |
| $750,000 to $999,999 | 0 (0.0%) | 0 (0.0%) |
| $1,000,000 or more | 10 (0.9%) | 0 (0.0%) |
| Total | 1,168 (100.0%) | 433 (100.0%) |
Household Income by Mortgage Status in Lee County
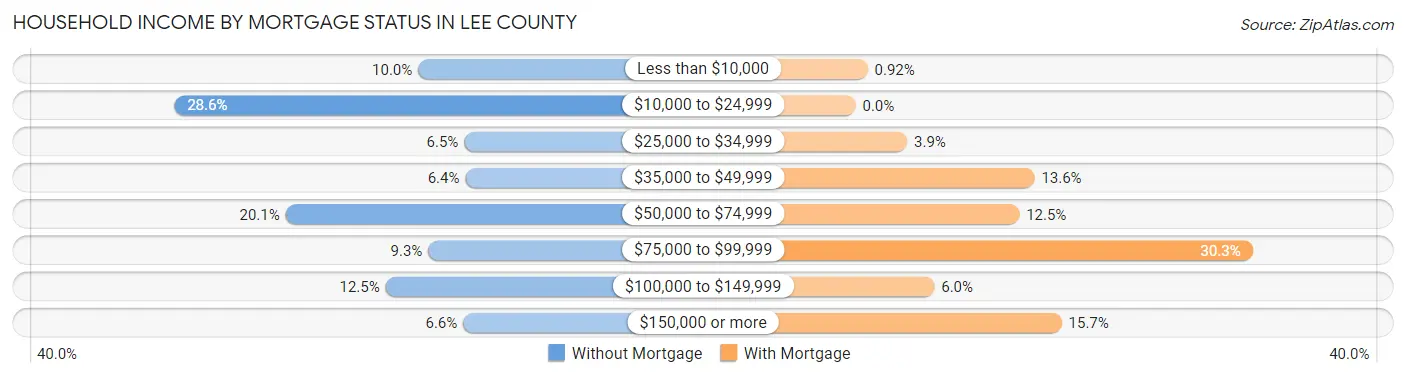
| Household Income | Without Mortgage | With Mortgage |
| Less than $10,000 | 117 (10.0%) | 4 (0.9%) |
| $10,000 to $24,999 | 334 (28.6%) | 0 (0.0%) |
| $25,000 to $34,999 | 76 (6.5%) | 17 (3.9%) |
| $35,000 to $49,999 | 75 (6.4%) | 59 (13.6%) |
| $50,000 to $74,999 | 235 (20.1%) | 54 (12.5%) |
| $75,000 to $99,999 | 108 (9.2%) | 131 (30.2%) |
| $100,000 to $149,999 | 146 (12.5%) | 26 (6.0%) |
| $150,000 or more | 77 (6.6%) | 68 (15.7%) |
| Total | 1,168 (100.0%) | 433 (100.0%) |
Property Value to Household Income Ratio in Lee County
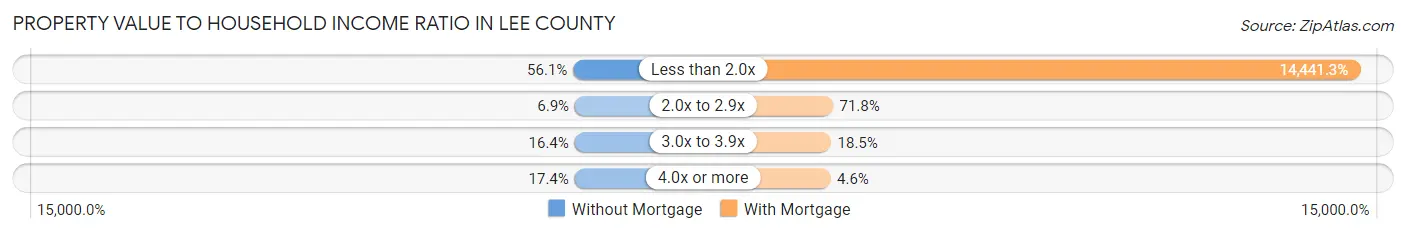
| Value-to-Income Ratio | Without Mortgage | With Mortgage |
| Less than 2.0x | 655 (56.1%) | 62,531 (14,441.3%) |
| 2.0x to 2.9x | 81 (6.9%) | 311 (71.8%) |
| 3.0x to 3.9x | 191 (16.4%) | 80 (18.5%) |
| 4.0x or more | 203 (17.4%) | 20 (4.6%) |
| Total | 1,168 (100.0%) | 433 (100.0%) |
Real Estate Taxes by Mortgage Status in Lee County
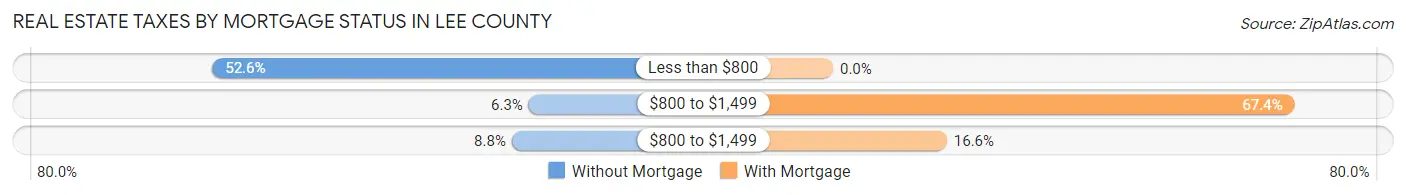
| Property Taxes | Without Mortgage | With Mortgage |
| Less than $800 | 614 (52.6%) | 0 (0.0%) |
| $800 to $1,499 | 74 (6.3%) | 292 (67.4%) |
| $800 to $1,499 | 103 (8.8%) | 72 (16.6%) |
| Total | 1,168 (100.0%) | 433 (100.0%) |
Health & Disability in Lee County
Health Insurance Coverage by Age in Lee County
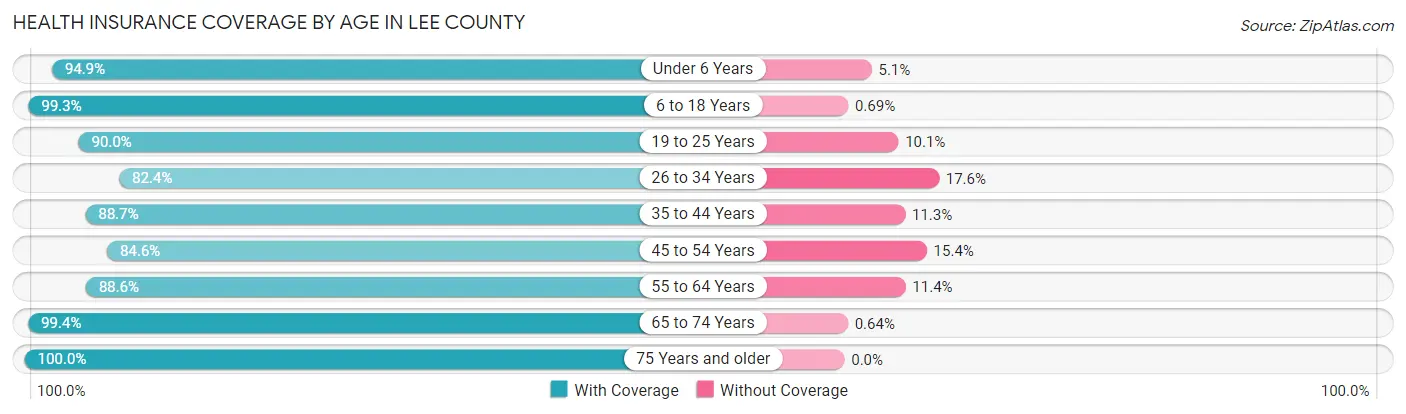
| Age Bracket | With Coverage | Without Coverage |
| Under 6 Years | 504 (94.9%) | 27 (5.1%) |
| 6 to 18 Years | 1,149 (99.3%) | 8 (0.7%) |
| 19 to 25 Years | 671 (89.9%) | 75 (10.1%) |
| 26 to 34 Years | 430 (82.4%) | 92 (17.6%) |
| 35 to 44 Years | 697 (88.7%) | 89 (11.3%) |
| 45 to 54 Years | 755 (84.6%) | 137 (15.4%) |
| 55 to 64 Years | 863 (88.6%) | 111 (11.4%) |
| 65 to 74 Years | 928 (99.4%) | 6 (0.6%) |
| 75 Years and older | 628 (100.0%) | 0 (0.0%) |
| Total | 6,625 (92.4%) | 545 (7.6%) |
Health Insurance Coverage by Citizenship Status in Lee County
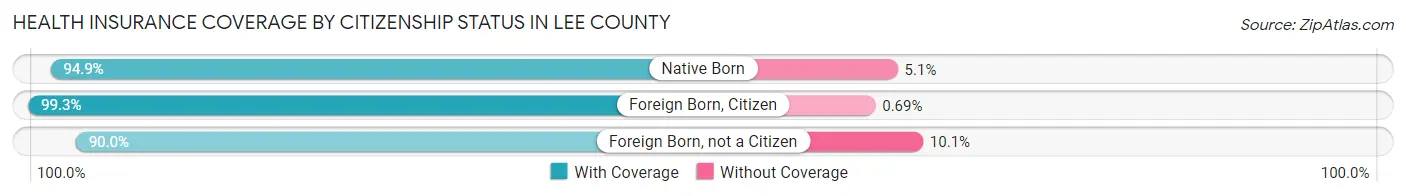
| Citizenship Status | With Coverage | Without Coverage |
| Native Born | 504 (94.9%) | 27 (5.1%) |
| Foreign Born, Citizen | 1,149 (99.3%) | 8 (0.7%) |
| Foreign Born, not a Citizen | 671 (89.9%) | 75 (10.1%) |
Health Insurance Coverage by Household Income in Lee County
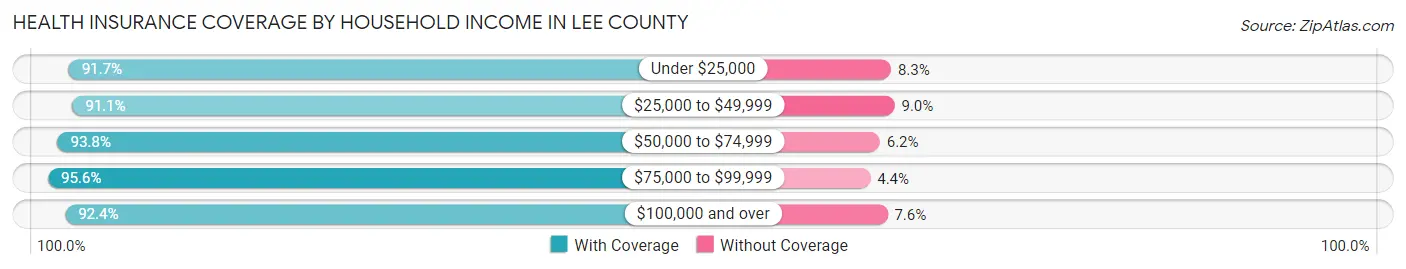
| Household Income | With Coverage | Without Coverage |
| Under $25,000 | 2,217 (91.7%) | 200 (8.3%) |
| $25,000 to $49,999 | 1,129 (91.0%) | 111 (8.9%) |
| $50,000 to $74,999 | 1,291 (93.8%) | 85 (6.2%) |
| $75,000 to $99,999 | 586 (95.6%) | 27 (4.4%) |
| $100,000 and over | 1,394 (92.4%) | 115 (7.6%) |
Public vs Private Health Insurance Coverage by Age in Lee County
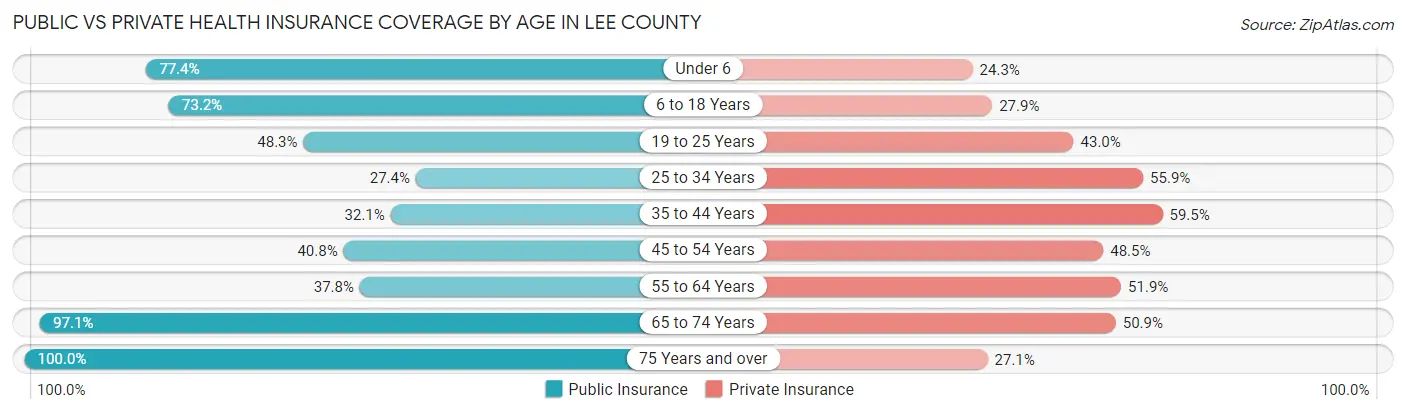
| Age Bracket | Public Insurance | Private Insurance |
| Under 6 | 411 (77.4%) | 129 (24.3%) |
| 6 to 18 Years | 847 (73.2%) | 323 (27.9%) |
| 19 to 25 Years | 360 (48.3%) | 321 (43.0%) |
| 25 to 34 Years | 143 (27.4%) | 292 (55.9%) |
| 35 to 44 Years | 252 (32.1%) | 468 (59.5%) |
| 45 to 54 Years | 364 (40.8%) | 433 (48.5%) |
| 55 to 64 Years | 368 (37.8%) | 505 (51.8%) |
| 65 to 74 Years | 907 (97.1%) | 475 (50.9%) |
| 75 Years and over | 628 (100.0%) | 170 (27.1%) |
| Total | 4,280 (59.7%) | 3,116 (43.5%) |
Disability Status by Sex by Age in Lee County
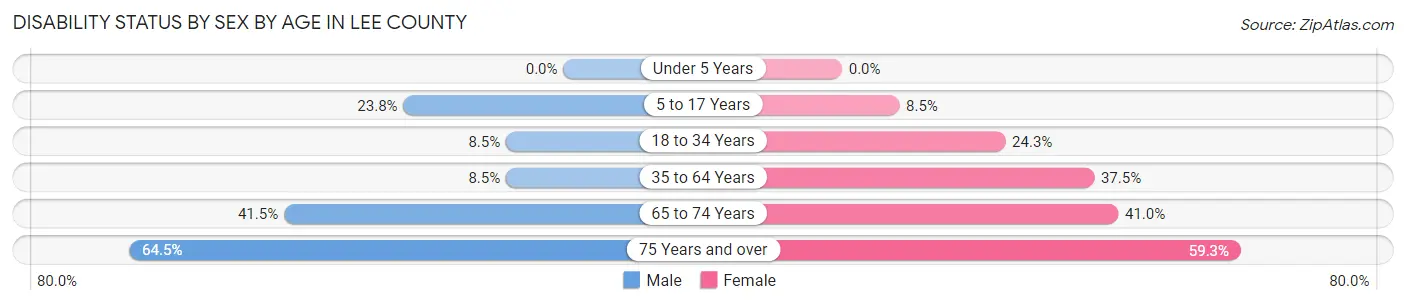
| Age Bracket | Male | Female |
| Under 5 Years | 0 (0.0%) | 0 (0.0%) |
| 5 to 17 Years | 119 (23.7%) | 53 (8.5%) |
| 18 to 34 Years | 66 (8.5%) | 139 (24.3%) |
| 35 to 64 Years | 107 (8.5%) | 522 (37.4%) |
| 65 to 74 Years | 168 (41.5%) | 217 (41.0%) |
| 75 Years and over | 147 (64.5%) | 237 (59.3%) |
Disability Class by Sex by Age in Lee County
Disability Class: Hearing Difficulty
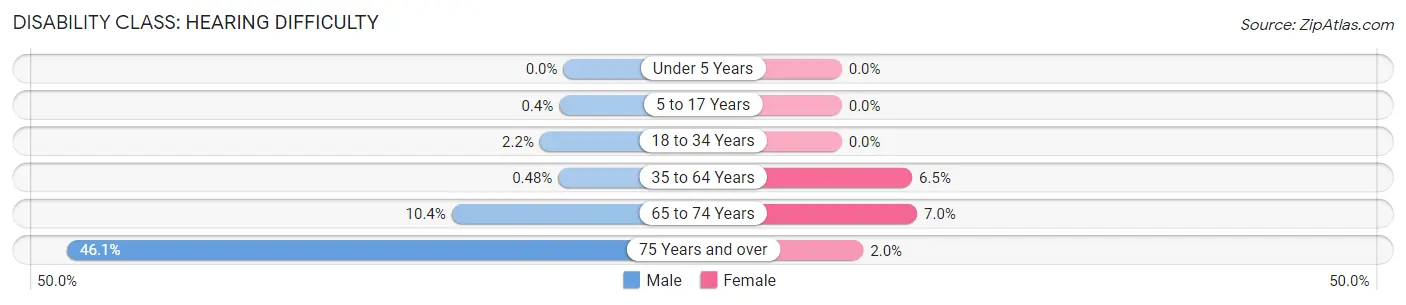
| Age Bracket | Male | Female |
| Under 5 Years | 0 (0.0%) | 0 (0.0%) |
| 5 to 17 Years | 2 (0.4%) | 0 (0.0%) |
| 18 to 34 Years | 17 (2.2%) | 0 (0.0%) |
| 35 to 64 Years | 6 (0.5%) | 91 (6.5%) |
| 65 to 74 Years | 42 (10.4%) | 37 (7.0%) |
| 75 Years and over | 105 (46.1%) | 8 (2.0%) |
Disability Class: Vision Difficulty
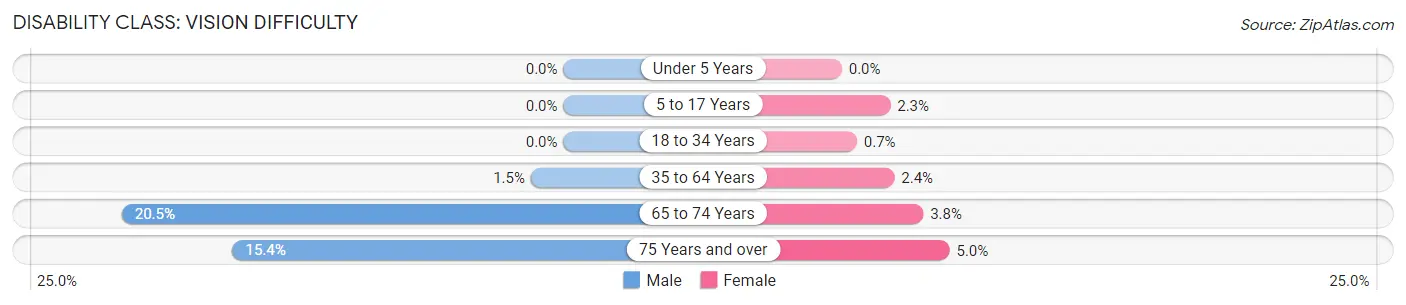
| Age Bracket | Male | Female |
| Under 5 Years | 0 (0.0%) | 0 (0.0%) |
| 5 to 17 Years | 0 (0.0%) | 14 (2.2%) |
| 18 to 34 Years | 0 (0.0%) | 4 (0.7%) |
| 35 to 64 Years | 19 (1.5%) | 34 (2.4%) |
| 65 to 74 Years | 83 (20.5%) | 20 (3.8%) |
| 75 Years and over | 35 (15.3%) | 20 (5.0%) |
Disability Class: Cognitive Difficulty
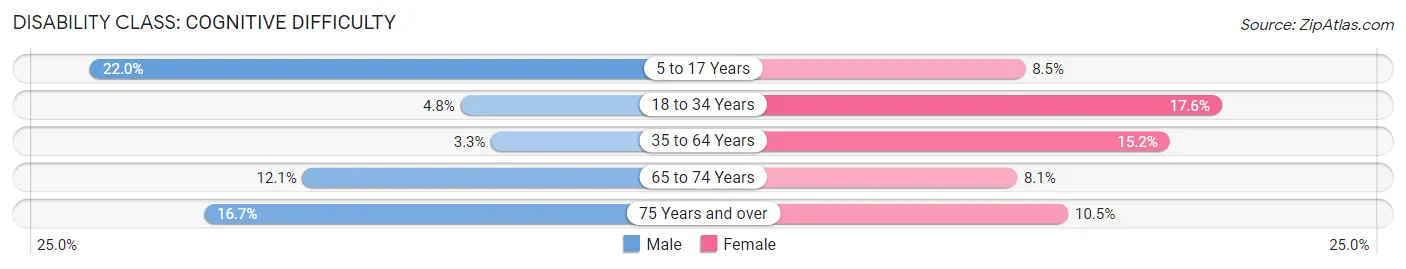
| Age Bracket | Male | Female |
| 5 to 17 Years | 110 (22.0%) | 53 (8.5%) |
| 18 to 34 Years | 37 (4.8%) | 101 (17.6%) |
| 35 to 64 Years | 42 (3.3%) | 212 (15.2%) |
| 65 to 74 Years | 49 (12.1%) | 43 (8.1%) |
| 75 Years and over | 38 (16.7%) | 42 (10.5%) |
Disability Class: Ambulatory Difficulty
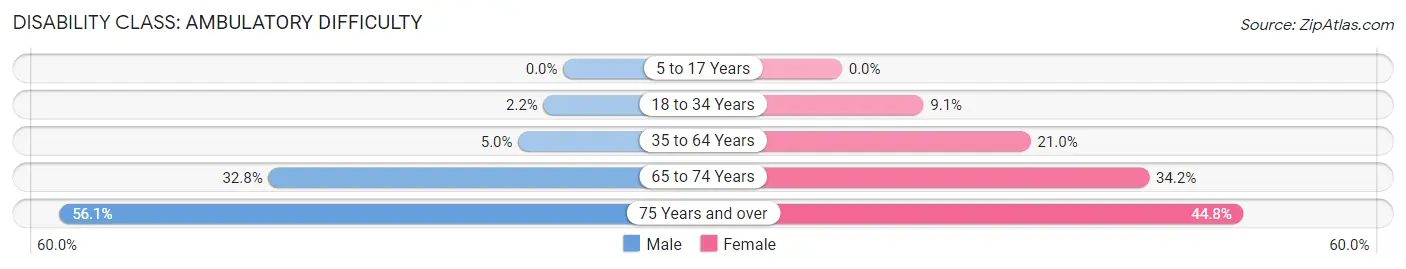
| Age Bracket | Male | Female |
| 5 to 17 Years | 0 (0.0%) | 0 (0.0%) |
| 18 to 34 Years | 17 (2.2%) | 52 (9.1%) |
| 35 to 64 Years | 63 (5.0%) | 293 (21.0%) |
| 65 to 74 Years | 133 (32.8%) | 181 (34.2%) |
| 75 Years and over | 128 (56.1%) | 179 (44.8%) |
Disability Class: Self-Care Difficulty
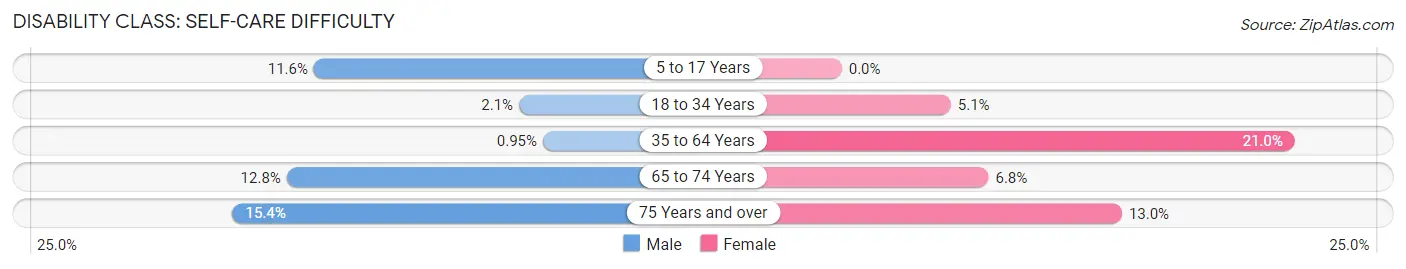
| Age Bracket | Male | Female |
| 5 to 17 Years | 58 (11.6%) | 0 (0.0%) |
| 18 to 34 Years | 16 (2.1%) | 29 (5.1%) |
| 35 to 64 Years | 12 (0.9%) | 293 (21.0%) |
| 65 to 74 Years | 52 (12.8%) | 36 (6.8%) |
| 75 Years and over | 35 (15.3%) | 52 (13.0%) |
Technology Access in Lee County
Computing Device Access in Lee County
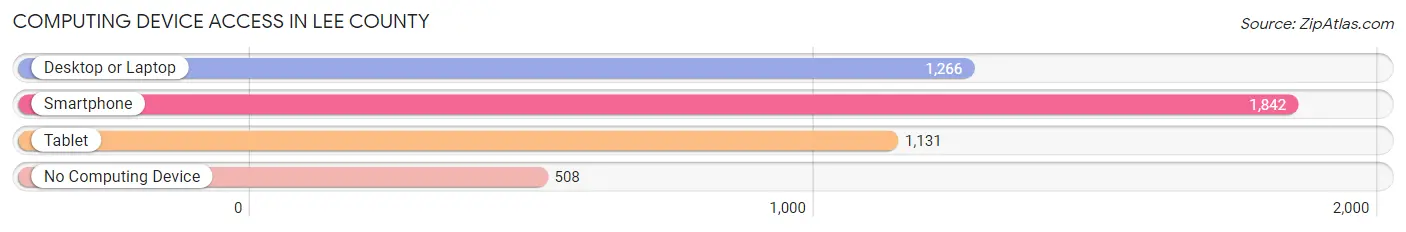
| Device Type | # Households | % Households |
| Desktop or Laptop | 1,266 | 49.0% |
| Smartphone | 1,842 | 71.2% |
| Tablet | 1,131 | 43.7% |
| No Computing Device | 508 | 19.6% |
| Total | 2,586 | 100.0% |
Internet Access in Lee County
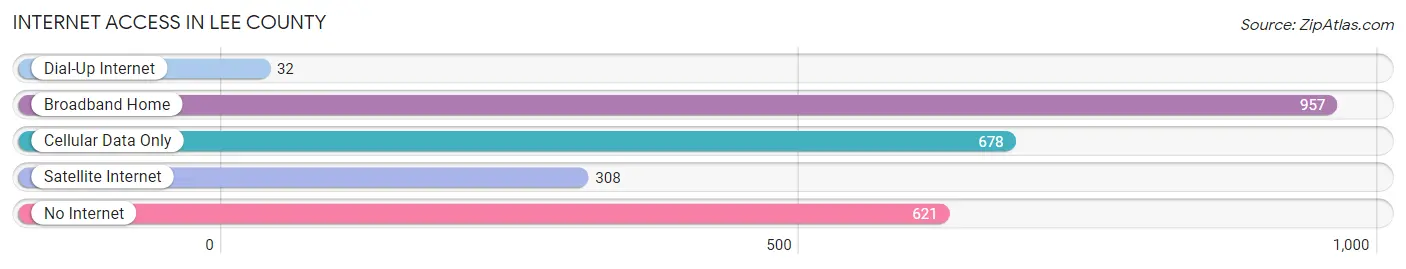
| Internet Type | # Households | % Households |
| Dial-Up Internet | 32 | 1.2% |
| Broadband Home | 957 | 37.0% |
| Cellular Data Only | 678 | 26.2% |
| Satellite Internet | 308 | 11.9% |
| No Internet | 621 | 24.0% |
| Total | 2,586 | 100.0% |
Lee County Summary
Lee County is located in the Arkansas Delta region of the state of Arkansas. It is bordered by Phillips County to the north, Monroe County to the east, St. Francis County to the south, and Crittenden County to the west. The county seat is Marianna, and the largest city is Marianna. The county has a total area of 602 square miles, of which 599 square miles is land and 3 square miles is water.
History
Lee County was established on April 17, 1873, and was named for Confederate General Robert E. Lee. The county was formed from parts of Phillips, Monroe, St. Francis, and Crittenden counties. The first settlers in the area were Native Americans, who were later displaced by European settlers. The first European settlers in the area were French and Spanish traders, who were followed by American settlers in the early 1800s.
The county was largely agricultural in its early years, with cotton being the main crop. The county was also home to several sawmills and gristmills. The county seat of Marianna was established in 1873, and the first courthouse was built in 1875.
Geography
Lee County is located in the Arkansas Delta region of the state of Arkansas. It is bordered by Phillips County to the north, Monroe County to the east, St. Francis County to the south, and Crittenden County to the west. The county has a total area of 602 square miles, of which 599 square miles is land and 3 square miles is water. The county is mostly flat, with some rolling hills in the northern part of the county. The St. Francis River runs through the county, and there are several small lakes and ponds in the area.
The climate in Lee County is humid subtropical, with hot, humid summers and mild winters. The average annual temperature is around 65°F, and the average annual precipitation is around 48 inches.
Economy
Lee County has a diversified economy, with agriculture, manufacturing, and tourism being the main industries. The county is home to several large agricultural operations, including cotton, soybeans, corn, and rice. The county is also home to several manufacturing companies, including a paper mill, a furniture factory, and a plastics factory.
Tourism is also an important part of the economy, with several state parks and recreational areas in the county. The county is also home to several historic sites, including the Marianna Confederate Cemetery and the Marianna Historic District.
Demographics
As of the 2010 census, there were 10,424 people, 3,945 households, and 2,717 families living in Lee County. The population density was 17.3 people per square mile. The racial makeup of the county was 63.3% White, 33.3% Black or African American, 0.3% Native American, 0.3% Asian, 0.1% Pacific Islander, 1.2% from other races, and 1.5% from two or more races. Hispanic or Latino of any race were 2.7% of the population.
The median income for a household in the county was $30,945, and the median income for a family was $37,945. The per capita income for the county was $15,845. About 19.3% of the population was below the poverty line.
Common Questions
What is Per Capita Income in Lee County?
Per Capita income in Lee County is $20,338.
What is the Median Family Income in Lee County?
Median Family Income in Lee County is $50,338.
What is the Median Household income in Lee County?
Median Household Income in Lee County is $33,801.
What is Income or Wage Gap in Lee County?
Income or Wage Gap in Lee County is 23.4%.
Women in Lee County earn 76.6 cents for every dollar earned by a man.
What is Inequality or Gini Index in Lee County?
Inequality or Gini Index in Lee County is 0.56.
What is the Total Population of Lee County?
Total Population of Lee County is 8,666.
What is the Total Male Population of Lee County?
Total Male Population of Lee County is 4,882.
What is the Total Female Population of Lee County?
Total Female Population of Lee County is 3,784.
What is the Ratio of Males per 100 Females in Lee County?
There are 129.02 Males per 100 Females in Lee County.
What is the Ratio of Females per 100 Males in Lee County?
There are 77.51 Females per 100 Males in Lee County.
What is the Median Population Age in Lee County?
Median Population Age in Lee County is 41.6 Years.
What is the Average Family Size in Lee County
Average Family Size in Lee County is 3.6 People.
What is the Average Household Size in Lee County
Average Household Size in Lee County is 2.8 People.
How Large is the Labor Force in Lee County?
There are 2,954 People in the Labor Forcein in Lee County.
What is the Percentage of People in the Labor Force in Lee County?
40.8% of People are in the Labor Force in Lee County.
What is the Unemployment Rate in Lee County?
Unemployment Rate in Lee County is 14.3%.