Conway County, AR Map & Demographics
Conway County Map
Conway County Overview
$28,694
PER CAPITA INCOME
$61,839
AVG FAMILY INCOME
$50,282
AVG HOUSEHOLD INCOME
38.2%
WAGE / INCOME GAP [ % ]
61.8¢/ $1
WAGE / INCOME GAP [ $ ]
$11,489
FAMILY INCOME DEFICIT
0.47
INEQUALITY / GINI INDEX
20,782
TOTAL POPULATION
10,354
MALE POPULATION
10,428
FEMALE POPULATION
99.29
MALES / 100 FEMALES
100.71
FEMALES / 100 MALES
42.2
MEDIAN AGE
3.0
AVG FAMILY SIZE
2.5
AVG HOUSEHOLD SIZE
9,644
LABOR FORCE [ PEOPLE ]
58.3%
PERCENT IN LABOR FORCE
7.1%
UNEMPLOYMENT RATE
Conway County Area Codes
Income in Conway County
Income Overview in Conway County
Per Capita Income in Conway County is $28,694, while median incomes of families and households are $61,839 and $50,282 respectively.
| Characteristic | Number | Measure |
| Per Capita Income | 20,782 | $28,694 |
| Median Family Income | 5,761 | $61,839 |
| Mean Family Income | 5,761 | $79,734 |
| Median Household Income | 8,422 | $50,282 |
| Mean Household Income | 8,422 | $68,736 |
| Income Deficit | 5,761 | $11,489 |
| Wage / Income Gap (%) | 20,782 | 38.19% |
| Wage / Income Gap ($) | 20,782 | 61.81¢ per $1 |
| Gini / Inequality Index | 20,782 | 0.47 |
Earnings by Sex in Conway County
Average Earnings in Conway County are $30,189, $40,329 for men and $24,927 for women, a difference of 38.2%.
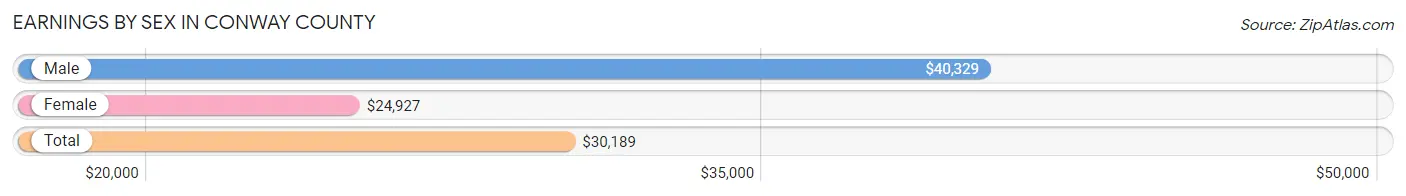
| Sex | Number | Average Earnings |
| Male | 5,150 (50.9%) | $40,329 |
| Female | 4,965 (49.1%) | $24,927 |
| Total | 10,115 (100.0%) | $30,189 |
Earnings by Sex by Income Bracket in Conway County
The most common earnings brackets in Conway County are $75,000 to $99,999 for men (614 | 11.9%) and $25,000 to $29,999 for women (497 | 10.0%).
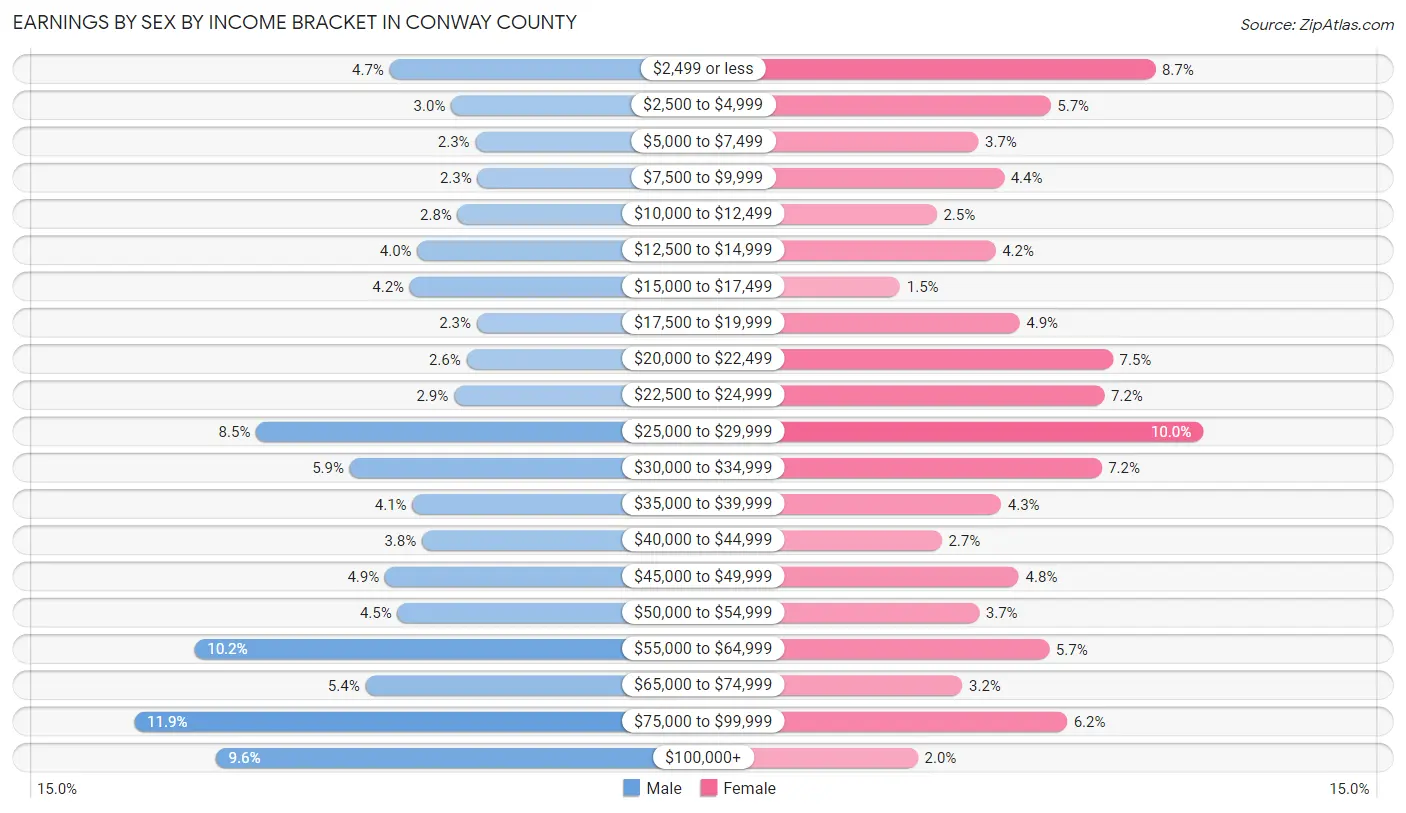
| Income | Male | Female |
| $2,499 or less | 244 (4.7%) | 430 (8.7%) |
| $2,500 to $4,999 | 155 (3.0%) | 284 (5.7%) |
| $5,000 to $7,499 | 120 (2.3%) | 183 (3.7%) |
| $7,500 to $9,999 | 117 (2.3%) | 219 (4.4%) |
| $10,000 to $12,499 | 146 (2.8%) | 125 (2.5%) |
| $12,500 to $14,999 | 204 (4.0%) | 207 (4.2%) |
| $15,000 to $17,499 | 215 (4.2%) | 74 (1.5%) |
| $17,500 to $19,999 | 118 (2.3%) | 241 (4.9%) |
| $20,000 to $22,499 | 133 (2.6%) | 371 (7.5%) |
| $22,500 to $24,999 | 151 (2.9%) | 359 (7.2%) |
| $25,000 to $29,999 | 437 (8.5%) | 497 (10.0%) |
| $30,000 to $34,999 | 302 (5.9%) | 355 (7.1%) |
| $35,000 to $39,999 | 211 (4.1%) | 215 (4.3%) |
| $40,000 to $44,999 | 197 (3.8%) | 132 (2.7%) |
| $45,000 to $49,999 | 251 (4.9%) | 240 (4.8%) |
| $50,000 to $54,999 | 233 (4.5%) | 184 (3.7%) |
| $55,000 to $64,999 | 527 (10.2%) | 282 (5.7%) |
| $65,000 to $74,999 | 279 (5.4%) | 161 (3.2%) |
| $75,000 to $99,999 | 614 (11.9%) | 307 (6.2%) |
| $100,000+ | 496 (9.6%) | 99 (2.0%) |
| Total | 5,150 (100.0%) | 4,965 (100.0%) |
Earnings by Sex by Educational Attainment in Conway County
Average earnings in Conway County are $47,020 for men and $28,025 for women, a difference of 40.4%. Men with an educational attainment of graduate degree enjoy the highest average annual earnings of $77,138, while those with less than high school education earn the least with $27,344. Women with an educational attainment of graduate degree earn the most with the average annual earnings of $66,125, while those with high school diploma education have the smallest earnings of $19,644.
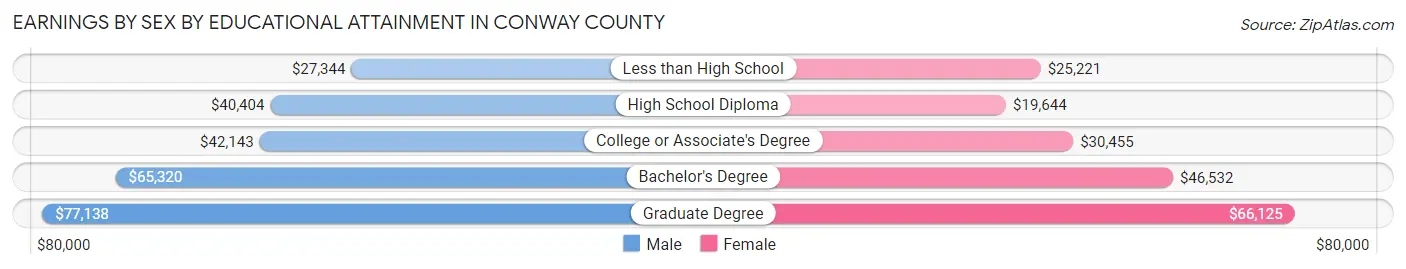
| Educational Attainment | Male Income | Female Income |
| Less than High School | $27,344 | $25,221 |
| High School Diploma | $40,404 | $19,644 |
| College or Associate's Degree | $42,143 | $30,455 |
| Bachelor's Degree | $65,320 | $46,532 |
| Graduate Degree | $77,138 | $66,125 |
| Total | $47,020 | $28,025 |
Family Income in Conway County
Family Income Brackets in Conway County
According to the Conway County family income data, there are 1,123 families falling into the $50,000 to $74,999 income range, which is the most common income bracket and makes up 19.5% of all families. Conversely, the $10,000 to $14,999 income bracket is the least frequent group with only 98 families (1.7%) belonging to this category.
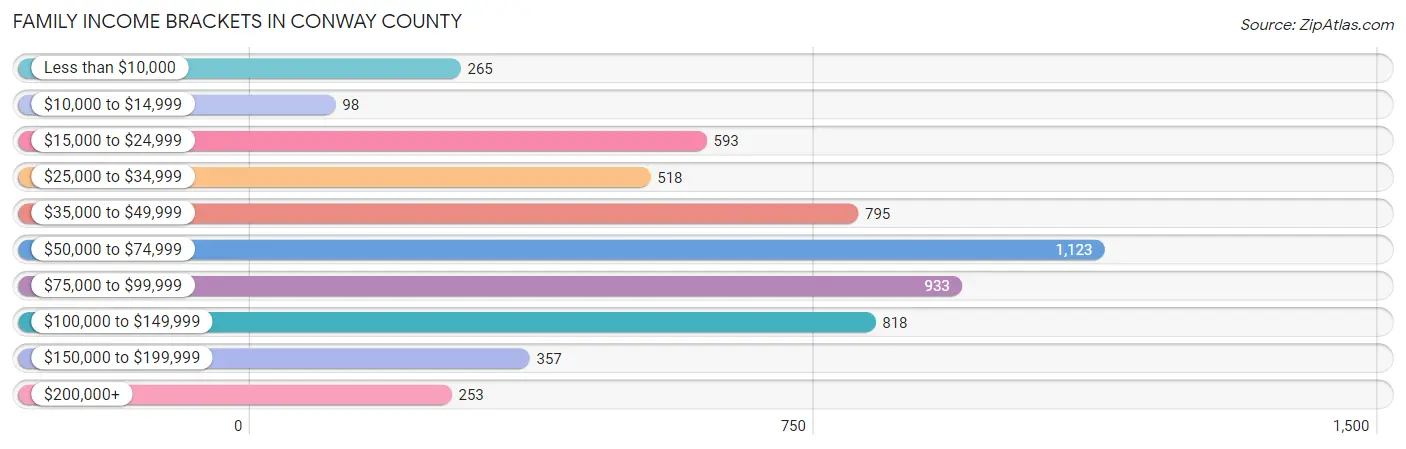
| Income Bracket | # Families | % Families |
| Less than $10,000 | 265 | 4.6% |
| $10,000 to $14,999 | 98 | 1.7% |
| $15,000 to $24,999 | 593 | 10.3% |
| $25,000 to $34,999 | 518 | 9.0% |
| $35,000 to $49,999 | 795 | 13.8% |
| $50,000 to $74,999 | 1,123 | 19.5% |
| $75,000 to $99,999 | 933 | 16.2% |
| $100,000 to $149,999 | 818 | 14.2% |
| $150,000 to $199,999 | 357 | 6.2% |
| $200,000+ | 253 | 4.4% |
Family Income by Famaliy Size in Conway County
5-person families (307 | 5.3%) account for the highest median family income in Conway County with $85,117 per family, while 2-person families (3,150 | 54.7%) have the highest median income of $28,960 per family member.
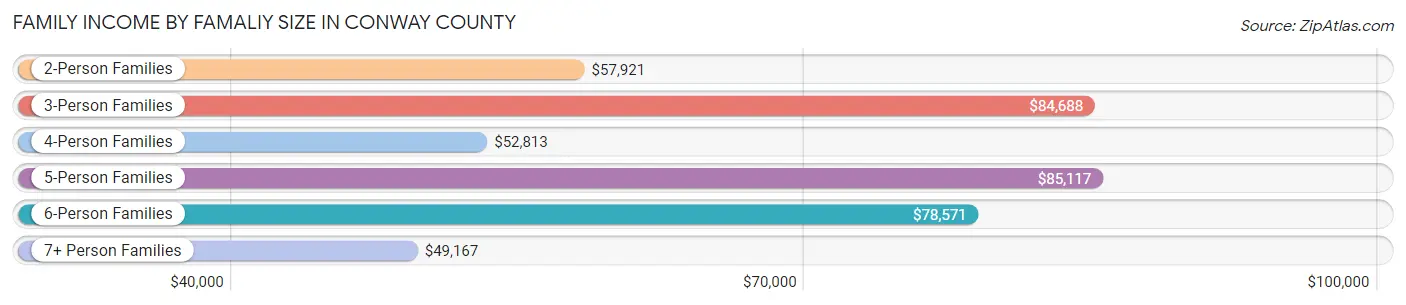
| Income Bracket | # Families | Median Income |
| 2-Person Families | 3,150 (54.7%) | $57,921 |
| 3-Person Families | 1,163 (20.2%) | $84,688 |
| 4-Person Families | 861 (14.9%) | $52,813 |
| 5-Person Families | 307 (5.3%) | $85,117 |
| 6-Person Families | 244 (4.2%) | $78,571 |
| 7+ Person Families | 36 (0.6%) | $49,167 |
| Total | 5,761 (100.0%) | $61,839 |
Family Income by Number of Earners in Conway County
The median family income in Conway County is $61,839, with families comprising 3+ earners (597) having the highest median family income of $107,765, while families with no earners (1,074) have the lowest median family income of $30,313, accounting for 10.4% and 18.6% of families, respectively.
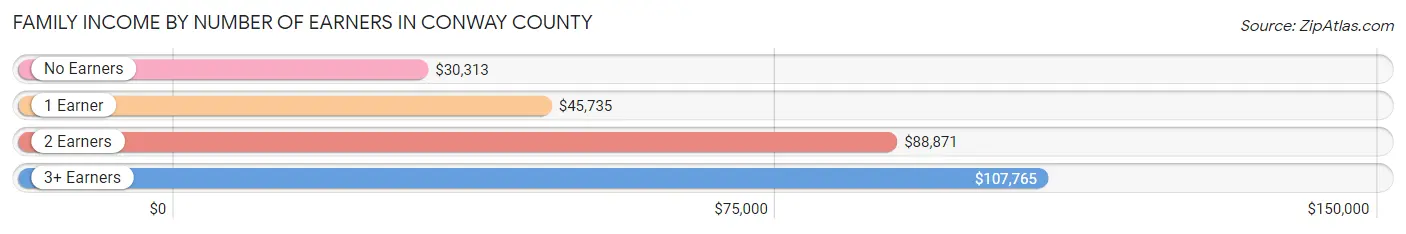
| Number of Earners | # Families | Median Income |
| No Earners | 1,074 (18.6%) | $30,313 |
| 1 Earner | 2,042 (35.4%) | $45,735 |
| 2 Earners | 2,048 (35.5%) | $88,871 |
| 3+ Earners | 597 (10.4%) | $107,765 |
| Total | 5,761 (100.0%) | $61,839 |
Household Income in Conway County
Household Income Brackets in Conway County
With 1,423 households falling in the category, the $50,000 to $74,999 income range is the most frequent in Conway County, accounting for 16.9% of all households. In contrast, only 278 households (3.3%) fall into the $200,000+ income bracket, making it the least populous group.
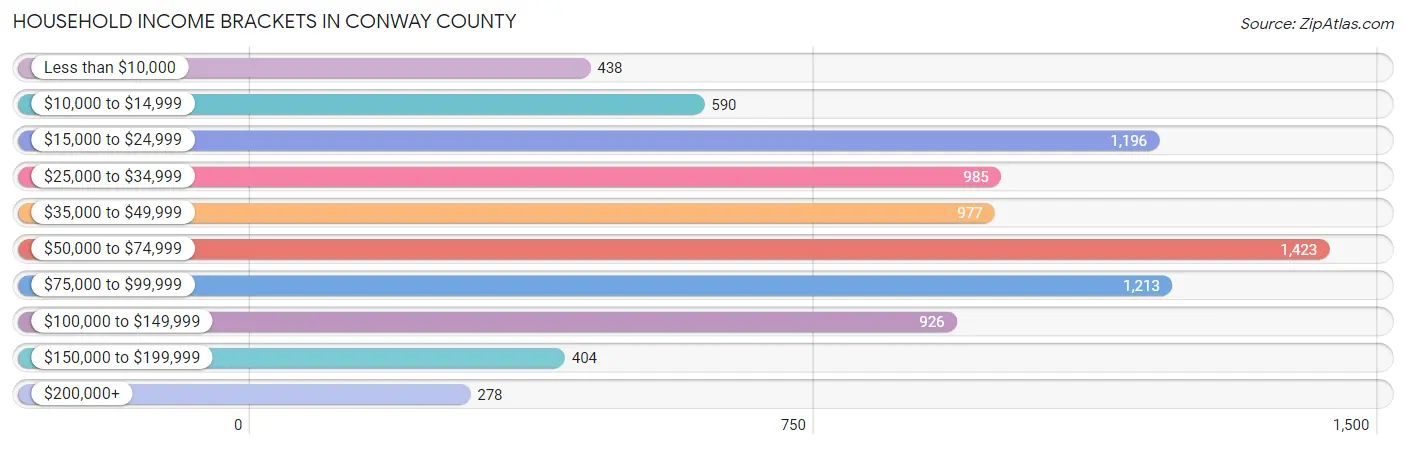
| Income Bracket | # Households | % Households |
| Less than $10,000 | 438 | 5.2% |
| $10,000 to $14,999 | 590 | 7.0% |
| $15,000 to $24,999 | 1,196 | 14.2% |
| $25,000 to $34,999 | 985 | 11.7% |
| $35,000 to $49,999 | 977 | 11.6% |
| $50,000 to $74,999 | 1,423 | 16.9% |
| $75,000 to $99,999 | 1,213 | 14.4% |
| $100,000 to $149,999 | 926 | 11.0% |
| $150,000 to $199,999 | 404 | 4.8% |
| $200,000+ | 278 | 3.3% |
Household Income by Householder Age in Conway County
The median household income in Conway County is $50,282, with the highest median household income of $62,532 found in the 45 to 64 years age bracket for the primary householder. A total of 3,369 households (40.0%) fall into this category. Meanwhile, the 15 to 24 years age bracket for the primary householder has the lowest median household income of $37,679, with 252 households (3.0%) in this group.
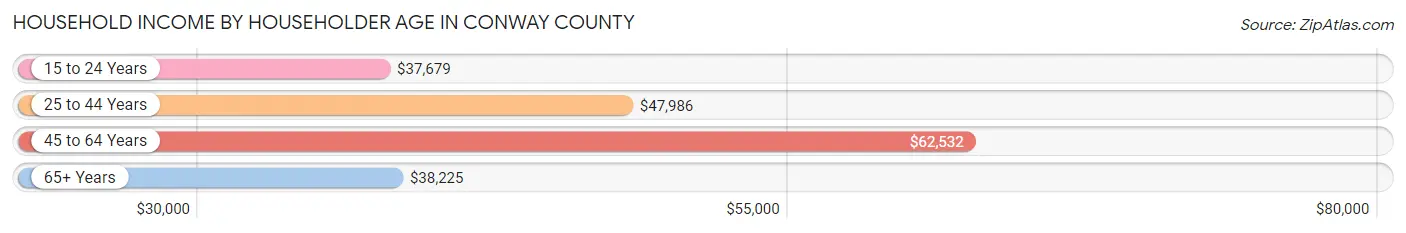
| Income Bracket | # Households | Median Income |
| 15 to 24 Years | 252 (3.0%) | $37,679 |
| 25 to 44 Years | 2,241 (26.6%) | $47,986 |
| 45 to 64 Years | 3,369 (40.0%) | $62,532 |
| 65+ Years | 2,560 (30.4%) | $38,225 |
| Total | 8,422 (100.0%) | $50,282 |
Poverty in Conway County
Income Below Poverty by Sex and Age in Conway County
With 21.0% poverty level for males and 20.7% for females among the residents of Conway County, 5 year old males and 25 to 34 year old females are the most vulnerable to poverty, with 121 males (60.5%) and 431 females (36.4%) in their respective age groups living below the poverty level.
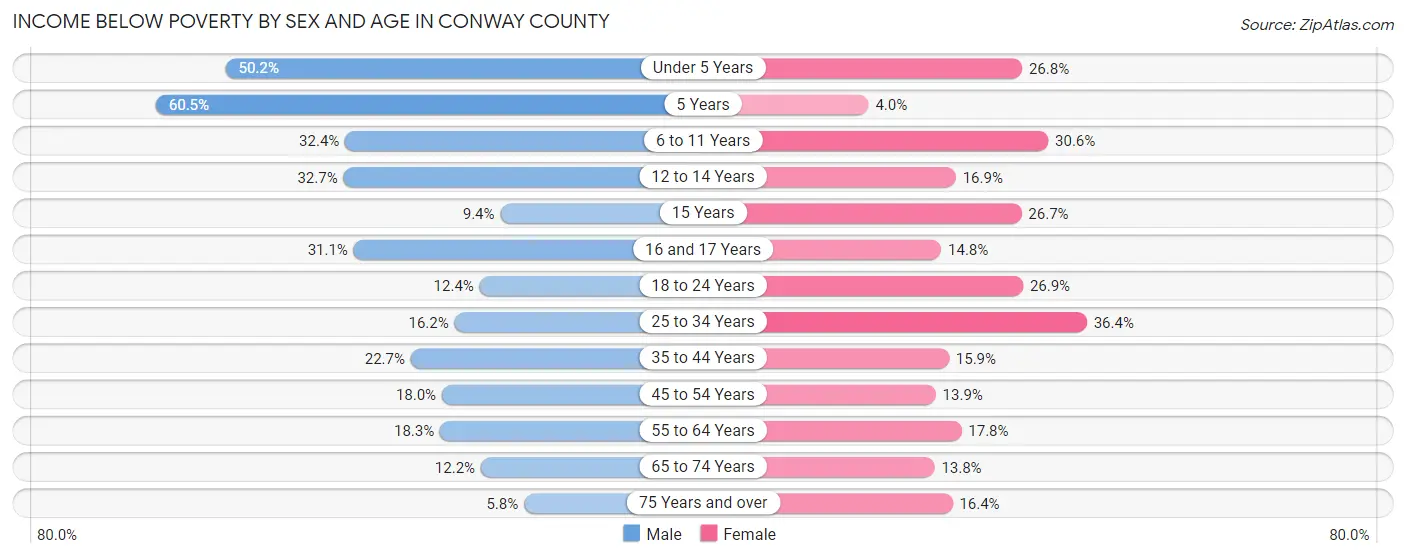
| Age Bracket | Male | Female |
| Under 5 Years | 305 (50.2%) | 141 (26.8%) |
| 5 Years | 121 (60.5%) | 4 (4.0%) |
| 6 to 11 Years | 266 (32.4%) | 265 (30.6%) |
| 12 to 14 Years | 128 (32.7%) | 67 (16.9%) |
| 15 Years | 13 (9.3%) | 40 (26.7%) |
| 16 and 17 Years | 80 (31.1%) | 27 (14.7%) |
| 18 to 24 Years | 104 (12.4%) | 209 (26.9%) |
| 25 to 34 Years | 203 (16.2%) | 431 (36.4%) |
| 35 to 44 Years | 255 (22.7%) | 187 (15.9%) |
| 45 to 54 Years | 231 (18.0%) | 186 (13.9%) |
| 55 to 64 Years | 283 (18.3%) | 270 (17.7%) |
| 65 to 74 Years | 137 (12.2%) | 165 (13.8%) |
| 75 Years and over | 42 (5.8%) | 153 (16.4%) |
| Total | 2,168 (21.0%) | 2,145 (20.7%) |
Income Above Poverty by Sex and Age in Conway County
According to the poverty statistics in Conway County, males aged 75 years and over and females aged 5 years are the age groups that are most secure financially, with 94.2% of males and 96.0% of females in these age groups living above the poverty line.
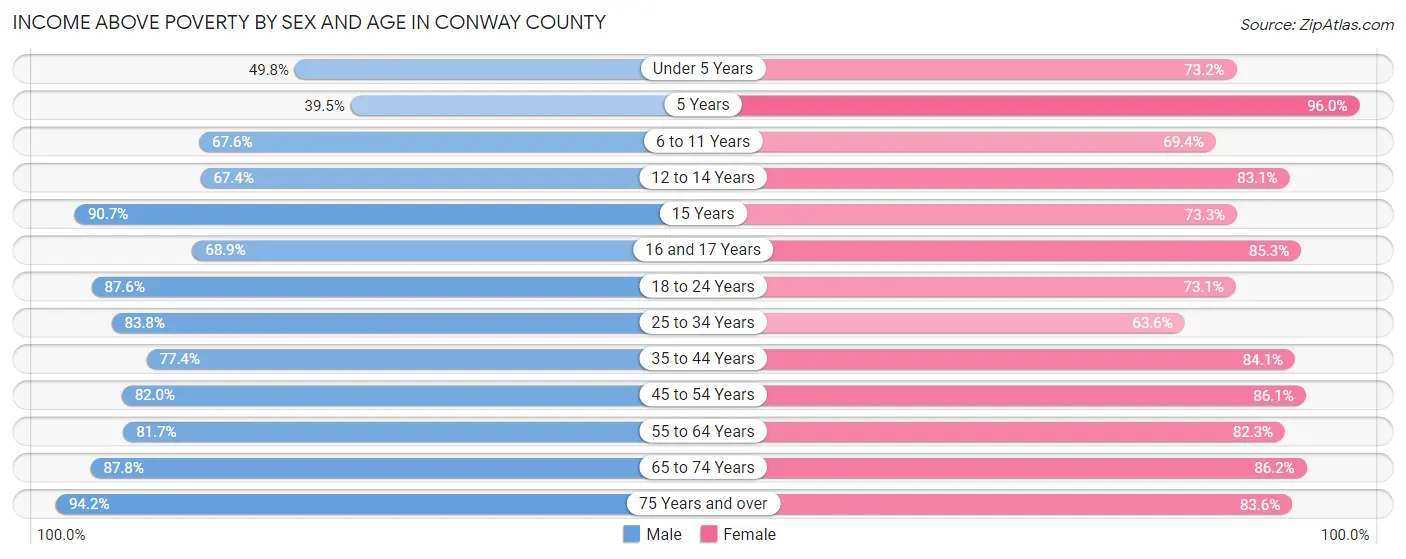
| Age Bracket | Male | Female |
| Under 5 Years | 303 (49.8%) | 386 (73.2%) |
| 5 Years | 79 (39.5%) | 97 (96.0%) |
| 6 to 11 Years | 555 (67.6%) | 600 (69.4%) |
| 12 to 14 Years | 264 (67.3%) | 329 (83.1%) |
| 15 Years | 126 (90.6%) | 110 (73.3%) |
| 16 and 17 Years | 177 (68.9%) | 156 (85.3%) |
| 18 to 24 Years | 733 (87.6%) | 568 (73.1%) |
| 25 to 34 Years | 1,053 (83.8%) | 754 (63.6%) |
| 35 to 44 Years | 871 (77.3%) | 989 (84.1%) |
| 45 to 54 Years | 1,050 (82.0%) | 1,148 (86.1%) |
| 55 to 64 Years | 1,263 (81.7%) | 1,251 (82.3%) |
| 65 to 74 Years | 982 (87.8%) | 1,034 (86.2%) |
| 75 Years and over | 678 (94.2%) | 778 (83.6%) |
| Total | 8,134 (79.0%) | 8,200 (79.3%) |
Income Below Poverty Among Married-Couple Families in Conway County
The poverty statistics for married-couple families in Conway County show that 8.8% or 347 of the total 3,949 families live below the poverty line. Families with 5 or more children have the highest poverty rate of 87.5%, comprising of 7 families. On the other hand, families with no children have the lowest poverty rate of 4.0%, which includes 97 families.
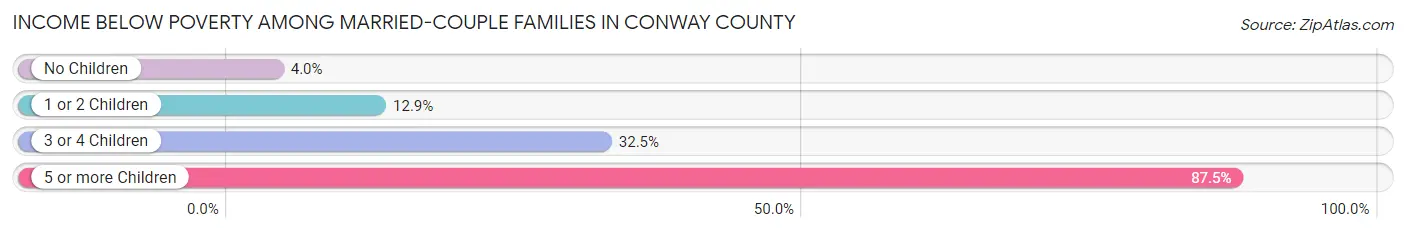
| Children | Above Poverty | Below Poverty |
| No Children | 2,343 (96.0%) | 97 (4.0%) |
| 1 or 2 Children | 1,088 (87.1%) | 161 (12.9%) |
| 3 or 4 Children | 170 (67.5%) | 82 (32.5%) |
| 5 or more Children | 1 (12.5%) | 7 (87.5%) |
| Total | 3,602 (91.2%) | 347 (8.8%) |
Income Below Poverty Among Single-Parent Households in Conway County
According to the poverty data in Conway County, 28.7% or 116 single-father households and 25.5% or 359 single-mother households are living below the poverty line. Among single-father households, those with 3 or 4 children have the highest poverty rate, with 63 households (100.0%) experiencing poverty. Likewise, among single-mother households, those with 5 or more children have the highest poverty rate, with 8 households (100.0%) falling below the poverty line.
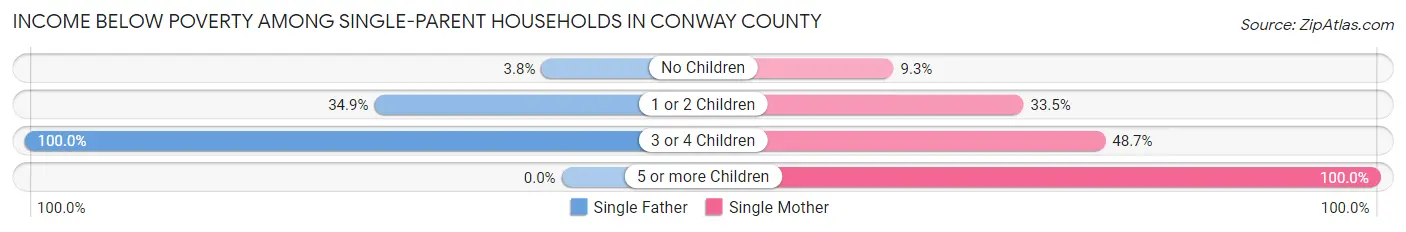
| Children | Single Father | Single Mother |
| No Children | 8 (3.8%) | 57 (9.3%) |
| 1 or 2 Children | 45 (34.9%) | 197 (33.5%) |
| 3 or 4 Children | 63 (100.0%) | 97 (48.7%) |
| 5 or more Children | 0 (0.0%) | 8 (100.0%) |
| Total | 116 (28.7%) | 359 (25.5%) |
Income Below Poverty Among Married-Couple vs Single-Parent Households in Conway County
The poverty data for Conway County shows that 347 of the married-couple family households (8.8%) and 475 of the single-parent households (26.2%) are living below the poverty level. Within the married-couple family households, those with 5 or more children have the highest poverty rate, with 7 households (87.5%) falling below the poverty line. Among the single-parent households, those with 5 or more children have the highest poverty rate, with 8 household (100.0%) living below poverty.
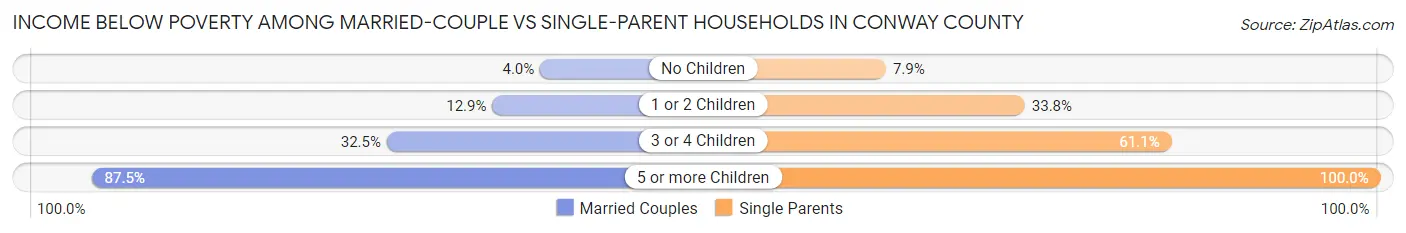
| Children | Married-Couple Families | Single-Parent Households |
| No Children | 97 (4.0%) | 65 (7.9%) |
| 1 or 2 Children | 161 (12.9%) | 242 (33.8%) |
| 3 or 4 Children | 82 (32.5%) | 160 (61.1%) |
| 5 or more Children | 7 (87.5%) | 8 (100.0%) |
| Total | 347 (8.8%) | 475 (26.2%) |
Race in Conway County
The most populous races in Conway County are White / Caucasian (17,343 | 83.5%), Black / African American (2,290 | 11.0%), and Hispanic or Latino (910 | 4.4%).
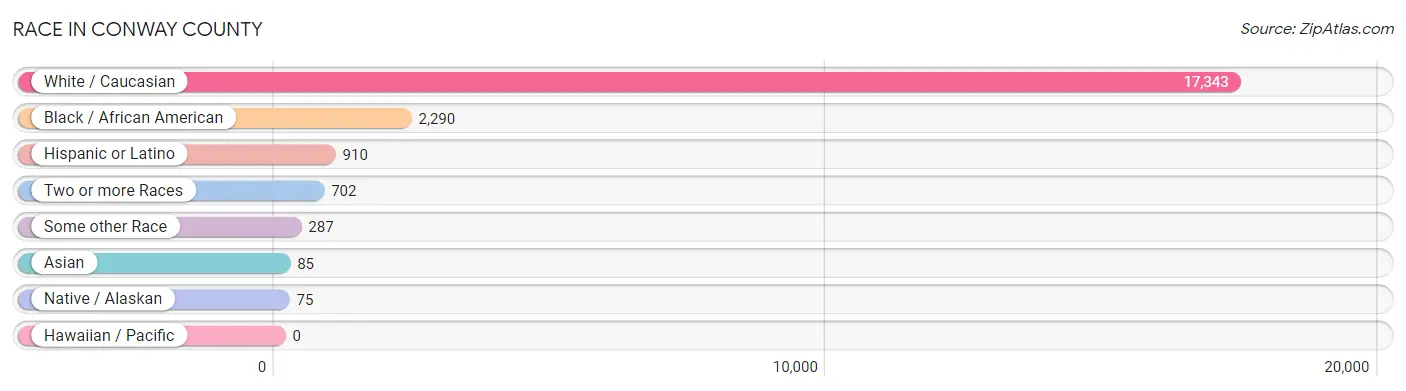
| Race | # Population | % Population |
| Asian | 85 | 0.4% |
| Black / African American | 2,290 | 11.0% |
| Hawaiian / Pacific | 0 | 0.0% |
| Hispanic or Latino | 910 | 4.4% |
| Native / Alaskan | 75 | 0.4% |
| White / Caucasian | 17,343 | 83.5% |
| Two or more Races | 702 | 3.4% |
| Some other Race | 287 | 1.4% |
| Total | 20,782 | 100.0% |
Ancestry in Conway County
The most populous ancestries reported in Conway County are American (2,957 | 14.2%), German (2,223 | 10.7%), English (2,218 | 10.7%), Irish (2,031 | 9.8%), and Mexican (836 | 4.0%), together accounting for 49.4% of all Conway County residents.
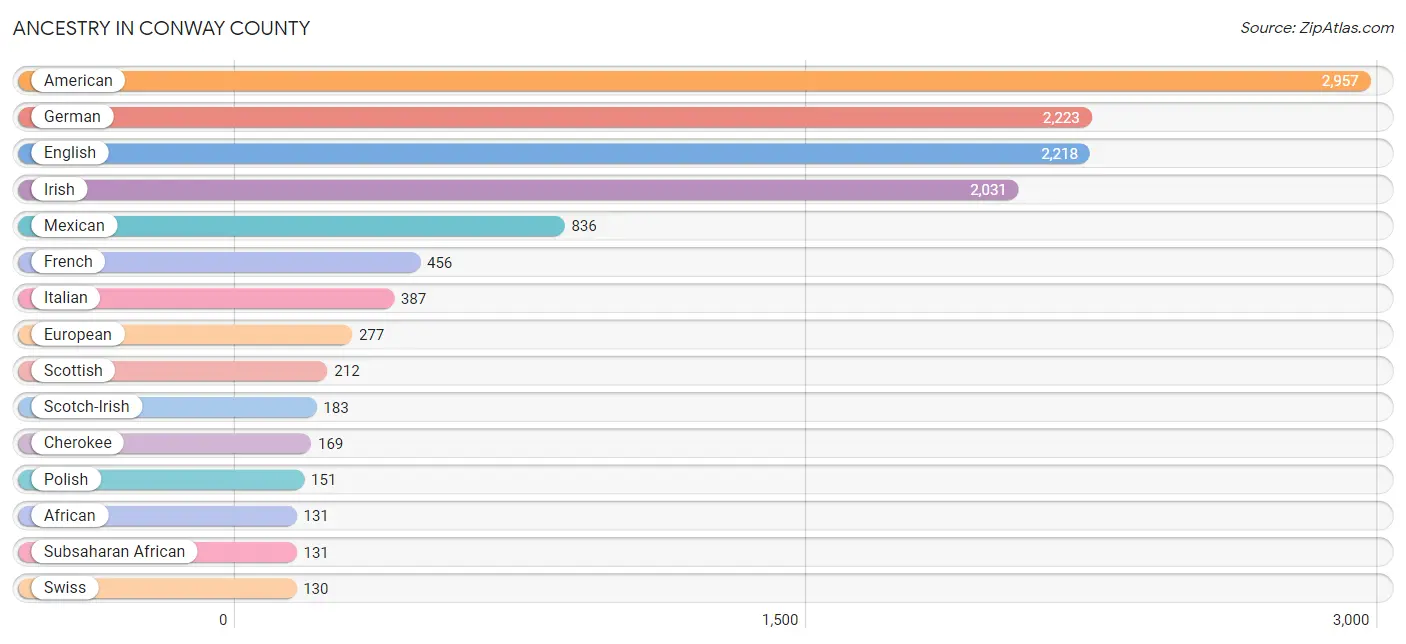
| Ancestry | # Population | % Population |
| African | 131 | 0.6% |
| American | 2,957 | 14.2% |
| Apache | 51 | 0.3% |
| Arab | 7 | 0.0% |
| Austrian | 23 | 0.1% |
| Belgian | 47 | 0.2% |
| Blackfeet | 5 | 0.0% |
| British | 36 | 0.2% |
| Canadian | 18 | 0.1% |
| Central American | 20 | 0.1% |
| Cherokee | 169 | 0.8% |
| Chilean | 7 | 0.0% |
| Choctaw | 114 | 0.5% |
| Czech | 6 | 0.0% |
| Czechoslovakian | 12 | 0.1% |
| Danish | 7 | 0.0% |
| Dutch | 100 | 0.5% |
| Dutch West Indian | 49 | 0.2% |
| English | 2,218 | 10.7% |
| European | 277 | 1.3% |
| French | 456 | 2.2% |
| German | 2,223 | 10.7% |
| Greek | 1 | 0.0% |
| Hungarian | 22 | 0.1% |
| Indian (Asian) | 83 | 0.4% |
| Irish | 2,031 | 9.8% |
| Italian | 387 | 1.9% |
| Korean | 43 | 0.2% |
| Mexican | 836 | 4.0% |
| Navajo | 2 | 0.0% |
| Northern European | 2 | 0.0% |
| Norwegian | 85 | 0.4% |
| Osage | 19 | 0.1% |
| Polish | 151 | 0.7% |
| Portuguese | 73 | 0.4% |
| Salvadoran | 20 | 0.1% |
| Scandinavian | 20 | 0.1% |
| Scotch-Irish | 183 | 0.9% |
| Scottish | 212 | 1.0% |
| South American | 7 | 0.0% |
| Spaniard | 37 | 0.2% |
| Spanish | 10 | 0.1% |
| Subsaharan African | 131 | 0.6% |
| Swedish | 46 | 0.2% |
| Swiss | 130 | 0.6% |
| Welsh | 106 | 0.5% | View All 46 Rows |
Immigrants in Conway County
The most numerous immigrant groups reported in Conway County came from Latin America (466 | 2.2%), Central America (459 | 2.2%), Mexico (439 | 2.1%), Asia (69 | 0.3%), and China (50 | 0.2%), together accounting for 7.1% of all Conway County residents.
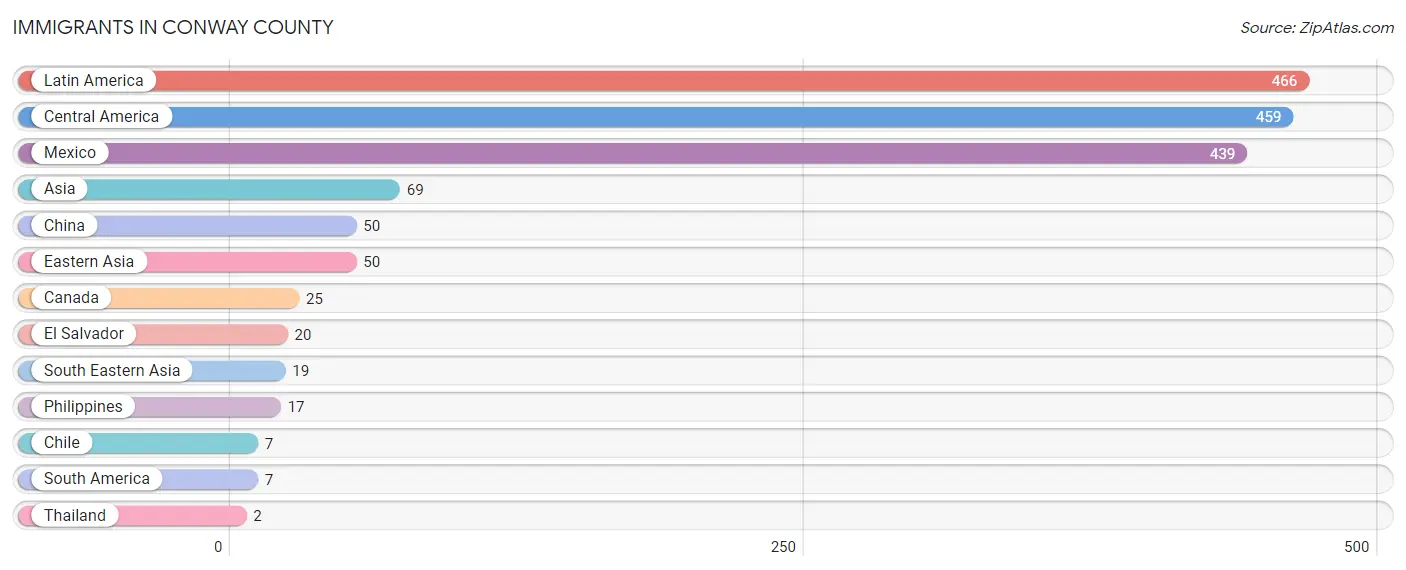
| Immigration Origin | # Population | % Population |
| Asia | 69 | 0.3% |
| Canada | 25 | 0.1% |
| Central America | 459 | 2.2% |
| Chile | 7 | 0.0% |
| China | 50 | 0.2% |
| Eastern Asia | 50 | 0.2% |
| El Salvador | 20 | 0.1% |
| Latin America | 466 | 2.2% |
| Mexico | 439 | 2.1% |
| Philippines | 17 | 0.1% |
| South America | 7 | 0.0% |
| South Eastern Asia | 19 | 0.1% |
| Thailand | 2 | 0.0% | View All 13 Rows |
Sex and Age in Conway County
Sex and Age in Conway County
The most populous age groups in Conway County are 55 to 59 Years (899 | 8.7%) for men and 60 to 64 Years (780 | 7.5%) for women.
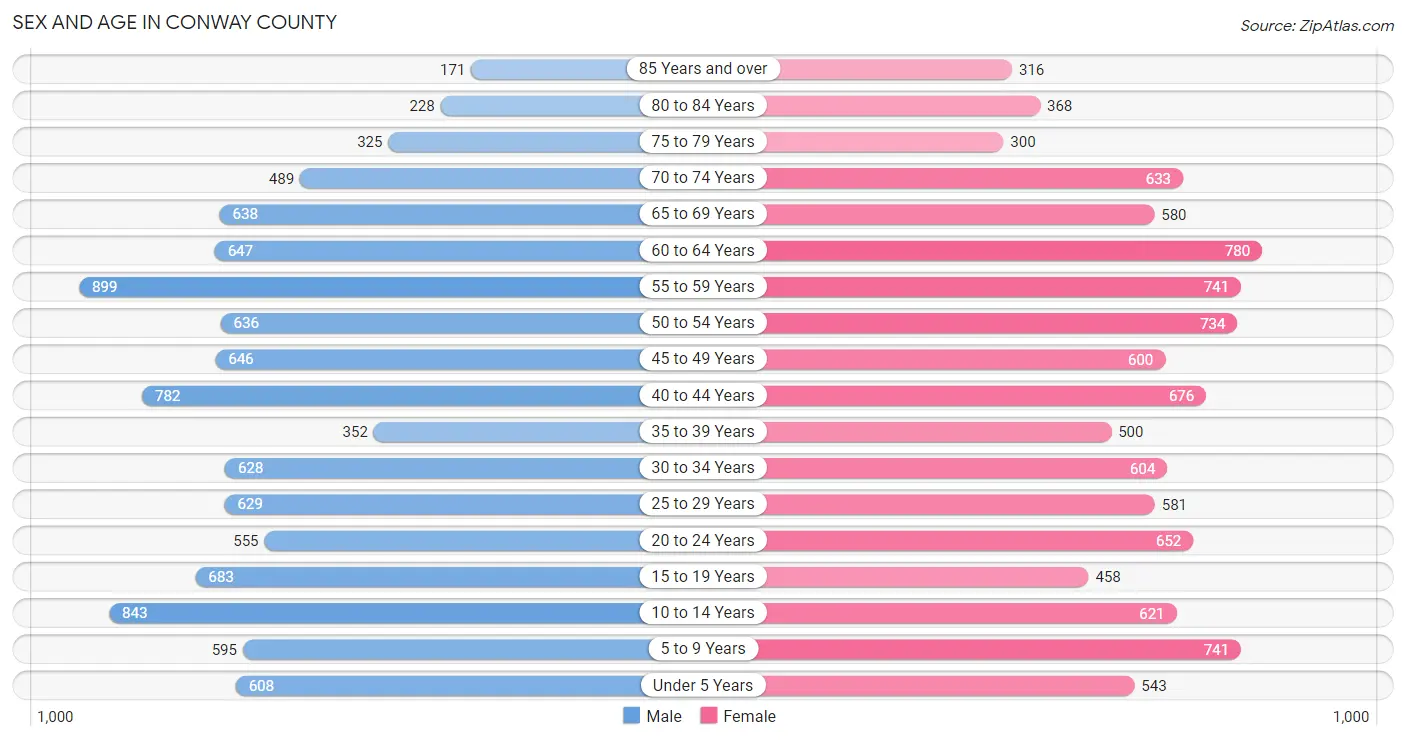
| Age Bracket | Male | Female |
| Under 5 Years | 608 (5.9%) | 543 (5.2%) |
| 5 to 9 Years | 595 (5.8%) | 741 (7.1%) |
| 10 to 14 Years | 843 (8.1%) | 621 (6.0%) |
| 15 to 19 Years | 683 (6.6%) | 458 (4.4%) |
| 20 to 24 Years | 555 (5.4%) | 652 (6.2%) |
| 25 to 29 Years | 629 (6.1%) | 581 (5.6%) |
| 30 to 34 Years | 628 (6.1%) | 604 (5.8%) |
| 35 to 39 Years | 352 (3.4%) | 500 (4.8%) |
| 40 to 44 Years | 782 (7.5%) | 676 (6.5%) |
| 45 to 49 Years | 646 (6.2%) | 600 (5.8%) |
| 50 to 54 Years | 636 (6.1%) | 734 (7.0%) |
| 55 to 59 Years | 899 (8.7%) | 741 (7.1%) |
| 60 to 64 Years | 647 (6.2%) | 780 (7.5%) |
| 65 to 69 Years | 638 (6.2%) | 580 (5.6%) |
| 70 to 74 Years | 489 (4.7%) | 633 (6.1%) |
| 75 to 79 Years | 325 (3.1%) | 300 (2.9%) |
| 80 to 84 Years | 228 (2.2%) | 368 (3.5%) |
| 85 Years and over | 171 (1.7%) | 316 (3.0%) |
| Total | 10,354 (100.0%) | 10,428 (100.0%) |
Families and Households in Conway County
Median Family Size in Conway County
The median family size in Conway County is 2.95 persons per family, with married-couple families (3,949 | 68.5%) accounting for the largest median family size of 3.07 persons per family. On the other hand, single male/father families (404 | 7.0%) represent the smallest median family size with 2.39 persons per family.
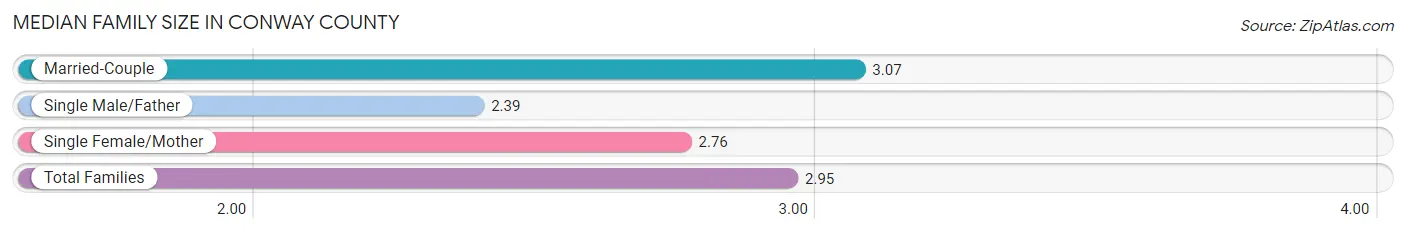
| Family Type | # Families | Family Size |
| Married-Couple | 3,949 (68.5%) | 3.07 |
| Single Male/Father | 404 (7.0%) | 2.39 |
| Single Female/Mother | 1,408 (24.4%) | 2.76 |
| Total Families | 5,761 (100.0%) | 2.95 |
Median Household Size in Conway County
The median household size in Conway County is 2.45 persons per household, with married-couple households (3,949 | 46.9%) accounting for the largest median household size of 3.1 persons per household. non-family households (2,661 | 31.6%) represent the smallest median household size with 1.16 persons per household.
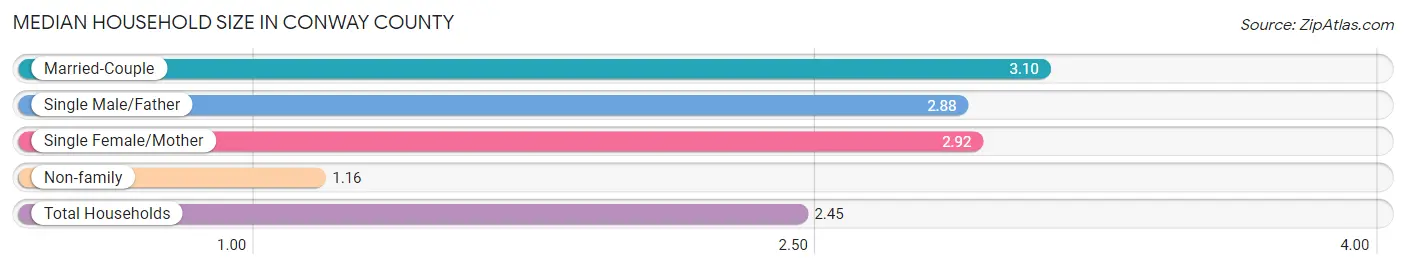
| Household Type | # Households | Household Size |
| Married-Couple | 3,949 (46.9%) | 3.10 |
| Single Male/Father | 404 (4.8%) | 2.88 |
| Single Female/Mother | 1,408 (16.7%) | 2.92 |
| Non-family | 2,661 (31.6%) | 1.16 |
| Total Households | 8,422 (100.0%) | 2.45 |
Household Size by Marriage Status in Conway County
Out of a total of 8,422 households in Conway County, 5,761 (68.4%) are family households, while 2,661 (31.6%) are nonfamily households. The most numerous type of family households are 2-person households, comprising 2,897, and the most common type of nonfamily households are 1-person households, comprising 2,251.
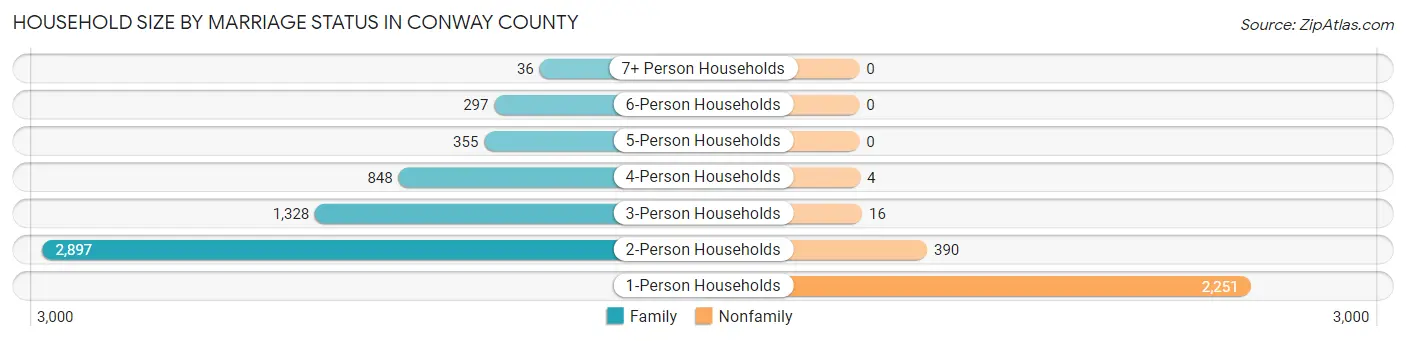
| Household Size | Family Households | Nonfamily Households |
| 1-Person Households | - | 2,251 (26.7%) |
| 2-Person Households | 2,897 (34.4%) | 390 (4.6%) |
| 3-Person Households | 1,328 (15.8%) | 16 (0.2%) |
| 4-Person Households | 848 (10.1%) | 4 (0.1%) |
| 5-Person Households | 355 (4.2%) | 0 (0.0%) |
| 6-Person Households | 297 (3.5%) | 0 (0.0%) |
| 7+ Person Households | 36 (0.4%) | 0 (0.0%) |
| Total | 5,761 (68.4%) | 2,661 (31.6%) |
Female Fertility in Conway County
Fertility by Age in Conway County
Average fertility rate in Conway County is 30.0 births per 1,000 women. Women in the age bracket of 20 to 34 years have the highest fertility rate with 65.0 births per 1,000 women. Women in the age bracket of 20 to 34 years acount for 92.2% of all women with births.
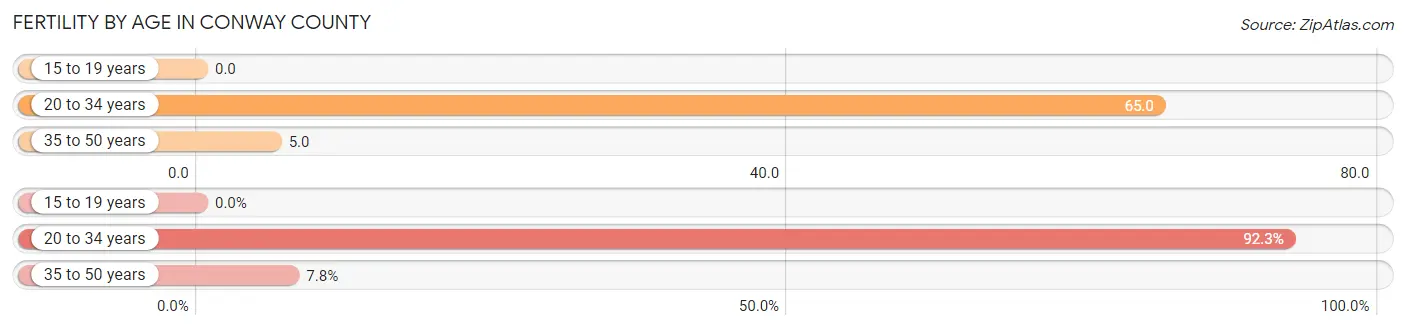
| Age Bracket | Women with Births | Births / 1,000 Women |
| 15 to 19 years | 0 (0.0%) | 0.0 |
| 20 to 34 years | 119 (92.2%) | 65.0 |
| 35 to 50 years | 10 (7.7%) | 5.0 |
| Total | 129 (100.0%) | 30.0 |
Fertility by Age by Marriage Status in Conway County
75.2% of women with births (129) in Conway County are married. The highest percentage of unmarried women with births falls into 20 to 34 years age bracket with 26.9% of them unmarried at the time of birth, while the lowest percentage of unmarried women with births belong to 35 to 50 years age bracket with 0.0% of them unmarried.
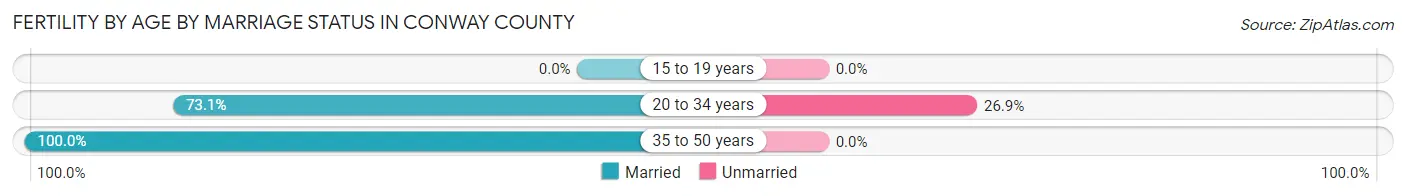
| Age Bracket | Married | Unmarried |
| 15 to 19 years | 0 (0.0%) | 0 (0.0%) |
| 20 to 34 years | 87 (73.1%) | 32 (26.9%) |
| 35 to 50 years | 10 (100.0%) | 0 (0.0%) |
| Total | 97 (75.2%) | 32 (24.8%) |
Fertility by Education in Conway County
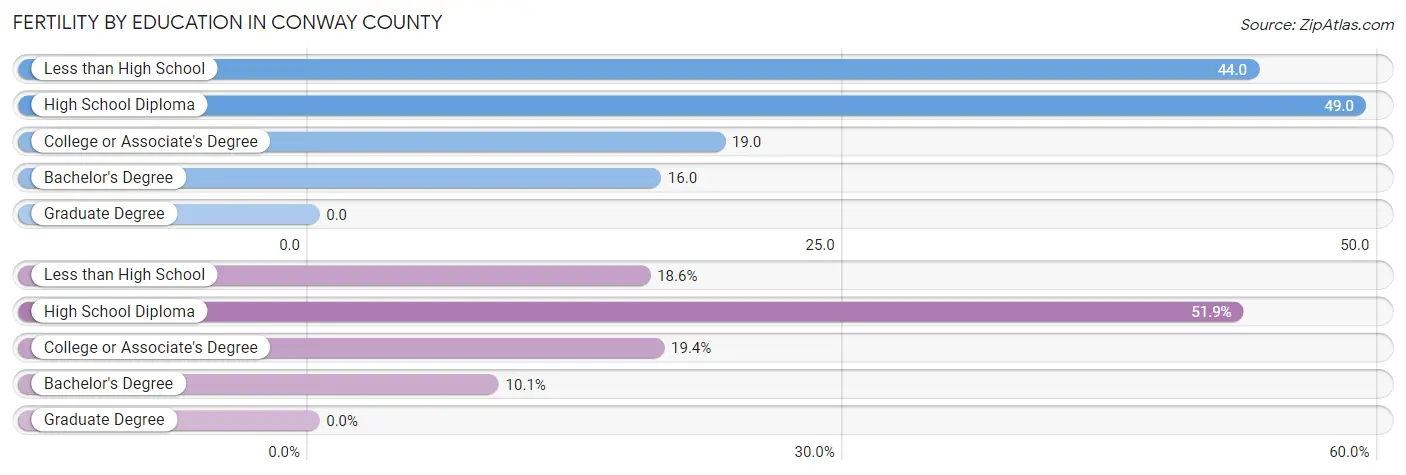
| Educational Attainment | Women with Births | Births / 1,000 Women |
| Less than High School | 24 (18.6%) | 44.0 |
| High School Diploma | 67 (51.9%) | 49.0 |
| College or Associate's Degree | 25 (19.4%) | 19.0 |
| Bachelor's Degree | 13 (10.1%) | 16.0 |
| Graduate Degree | 0 (0.0%) | 0.0 |
| Total | 129 (100.0%) | 30.0 |
Fertility by Education by Marriage Status in Conway County
24.8% of women with births in Conway County are unmarried. Women with the educational attainment of high school diploma are most likely to be married with 100.0% of them married at childbirth, while women with the educational attainment of less than high school are least likely to be married with 83.3% of them unmarried at childbirth.
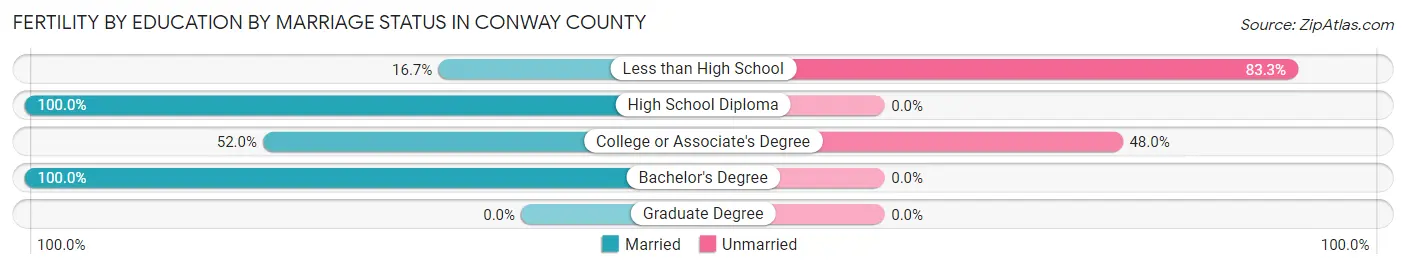
| Educational Attainment | Married | Unmarried |
| Less than High School | 4 (16.7%) | 20 (83.3%) |
| High School Diploma | 67 (100.0%) | 0 (0.0%) |
| College or Associate's Degree | 13 (52.0%) | 12 (48.0%) |
| Bachelor's Degree | 13 (100.0%) | 0 (0.0%) |
| Graduate Degree | 0 (0.0%) | 0 (0.0%) |
| Total | 97 (75.2%) | 32 (24.8%) |
Employment Characteristics in Conway County
Employment by Class of Employer in Conway County
Among the 8,867 employed individuals in Conway County, private company employees (5,661 | 63.8%), self-employed (not incorporated) (775 | 8.7%), and not-for-profit organizations (666 | 7.5%) make up the most common classes of employment.
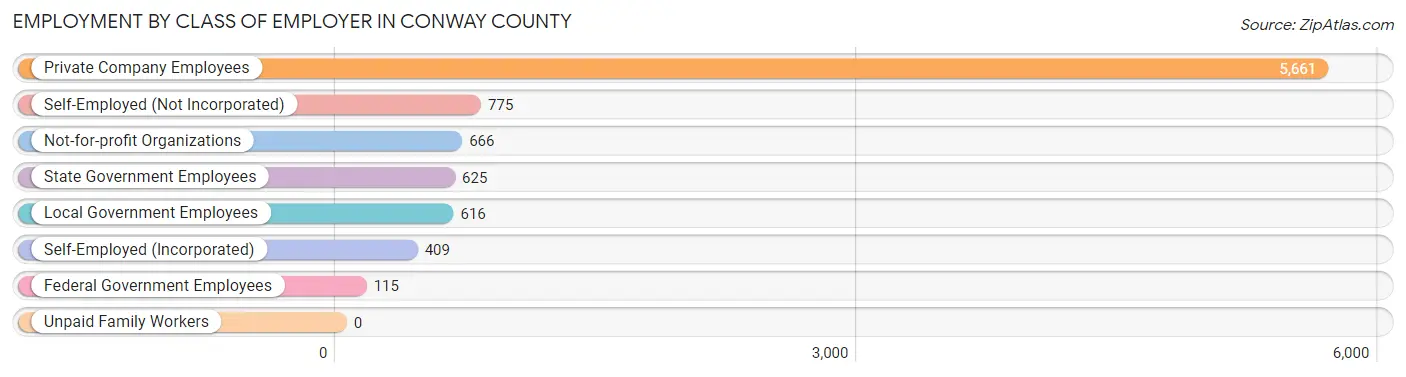
| Employer Class | # Employees | % Employees |
| Private Company Employees | 5,661 | 63.8% |
| Self-Employed (Incorporated) | 409 | 4.6% |
| Self-Employed (Not Incorporated) | 775 | 8.7% |
| Not-for-profit Organizations | 666 | 7.5% |
| Local Government Employees | 616 | 7.0% |
| State Government Employees | 625 | 7.0% |
| Federal Government Employees | 115 | 1.3% |
| Unpaid Family Workers | 0 | 0.0% |
| Total | 8,867 | 100.0% |
Employment Status by Age in Conway County
According to the labor force statistics for Conway County, out of the total population over 16 years of age (16,542), 58.3% or 9,644 individuals are in the labor force, with 7.1% or 685 of them unemployed. The age group with the highest labor force participation rate is 20 to 24 years, with 83.1% or 1,003 individuals in the labor force. Within the labor force, the 16 to 19 years age range has the highest percentage of unemployed individuals, with 18.7% or 55 of them being unemployed.
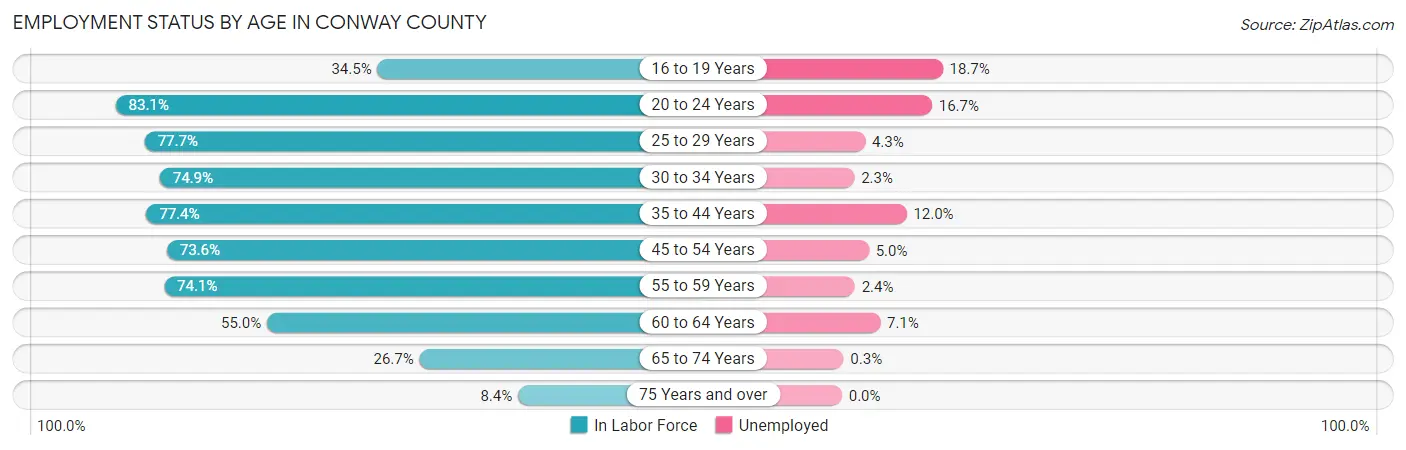
| Age Bracket | In Labor Force | Unemployed |
| 16 to 19 Years | 294 (34.5%) | 55 (18.7%) |
| 20 to 24 Years | 1,003 (83.1%) | 168 (16.7%) |
| 25 to 29 Years | 940 (77.7%) | 40 (4.3%) |
| 30 to 34 Years | 923 (74.9%) | 21 (2.3%) |
| 35 to 44 Years | 1,788 (77.4%) | 215 (12.0%) |
| 45 to 54 Years | 1,925 (73.6%) | 96 (5.0%) |
| 55 to 59 Years | 1,215 (74.1%) | 29 (2.4%) |
| 60 to 64 Years | 785 (55.0%) | 56 (7.1%) |
| 65 to 74 Years | 625 (26.7%) | 2 (0.3%) |
| 75 Years and over | 143 (8.4%) | 0 (0.0%) |
| Total | 9,644 (58.3%) | 685 (7.1%) |
Employment Status by Educational Attainment in Conway County
According to labor force statistics for Conway County, 72.6% of individuals (7,576) out of the total population between 25 and 64 years of age (10,435) are in the labor force, with 6.0% or 455 of them being unemployed. The group with the highest labor force participation rate are those with the educational attainment of bachelor's degree or higher, with 88.8% or 1,981 individuals in the labor force. Within the labor force, individuals with college / associate degree education have the highest percentage of unemployment, with 7.0% or 157 of them being unemployed.
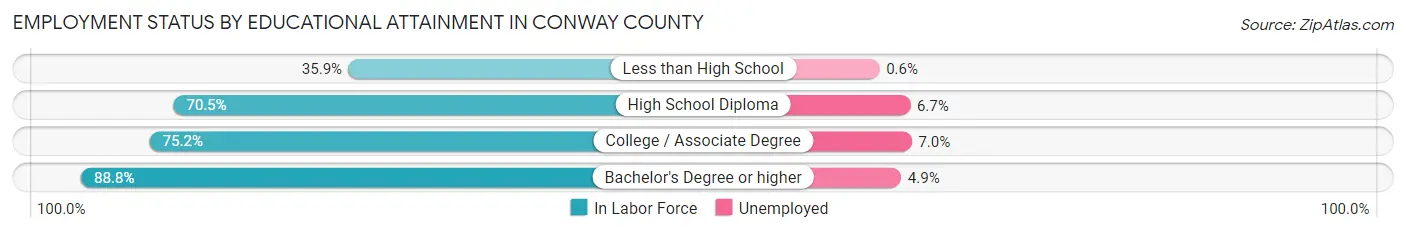
| Educational Attainment | In Labor Force | Unemployed |
| Less than High School | 340 (35.9%) | 6 (0.6%) |
| High School Diploma | 3,012 (70.5%) | 286 (6.7%) |
| College / Associate Degree | 2,245 (75.2%) | 209 (7.0%) |
| Bachelor's Degree or higher | 1,981 (88.8%) | 109 (4.9%) |
| Total | 7,576 (72.6%) | 626 (6.0%) |
Employment Occupations by Sex in Conway County
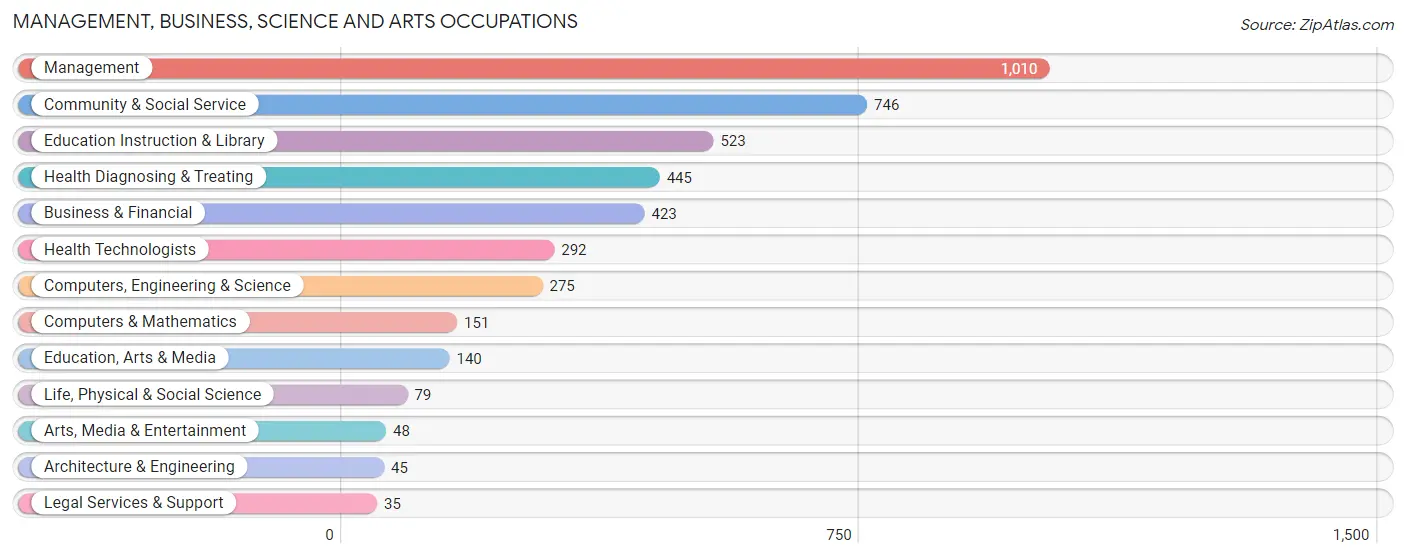
Management, Business, Science and Arts Occupations
The most common Management, Business, Science and Arts occupations in Conway County are Management (1,010 | 11.3%), Community & Social Service (746 | 8.3%), Education Instruction & Library (523 | 5.8%), Health Diagnosing & Treating (445 | 5.0%), and Business & Financial (423 | 4.7%).
Management, Business, Science and Arts Occupations by Sex
Within the Management, Business, Science and Arts occupations in Conway County, the most male-oriented occupations are Architecture & Engineering (100.0%), Life, Physical & Social Science (82.3%), and Arts, Media & Entertainment (68.8%), while the most female-oriented occupations are Health Technologists (83.2%), Health Diagnosing & Treating (82.5%), and Education Instruction & Library (74.6%).
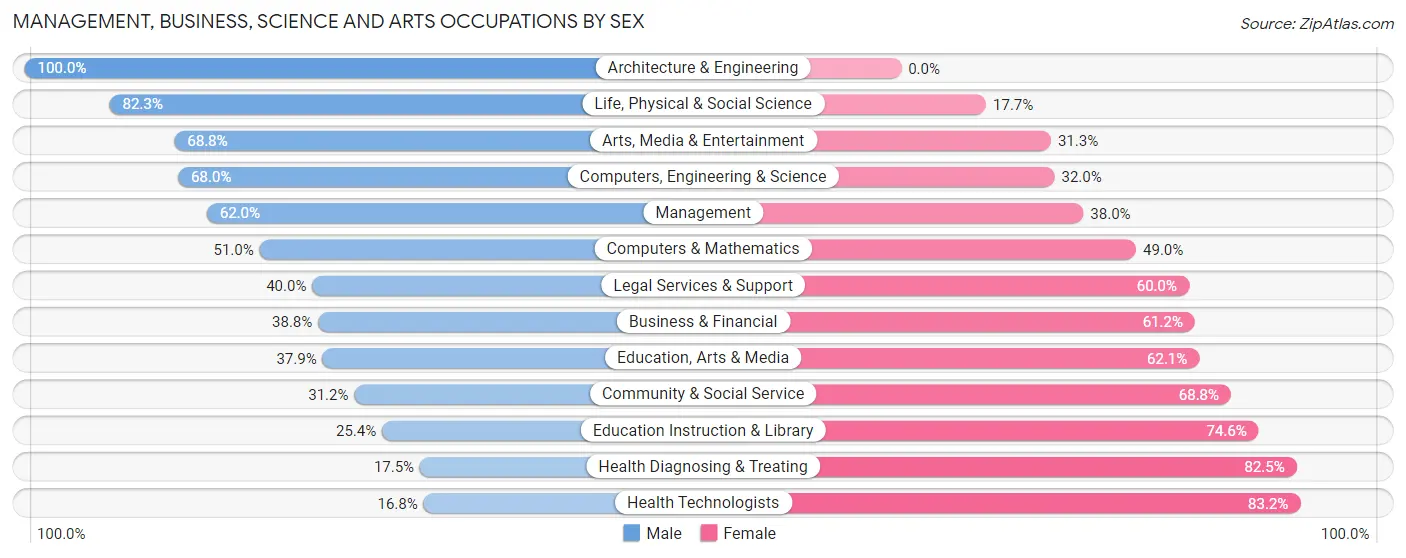
| Occupation | Male | Female |
| Management | 626 (62.0%) | 384 (38.0%) |
| Business & Financial | 164 (38.8%) | 259 (61.2%) |
| Computers, Engineering & Science | 187 (68.0%) | 88 (32.0%) |
| Computers & Mathematics | 77 (51.0%) | 74 (49.0%) |
| Architecture & Engineering | 45 (100.0%) | 0 (0.0%) |
| Life, Physical & Social Science | 65 (82.3%) | 14 (17.7%) |
| Community & Social Service | 233 (31.2%) | 513 (68.8%) |
| Education, Arts & Media | 53 (37.9%) | 87 (62.1%) |
| Legal Services & Support | 14 (40.0%) | 21 (60.0%) |
| Education Instruction & Library | 133 (25.4%) | 390 (74.6%) |
| Arts, Media & Entertainment | 33 (68.8%) | 15 (31.2%) |
| Health Diagnosing & Treating | 78 (17.5%) | 367 (82.5%) |
| Health Technologists | 49 (16.8%) | 243 (83.2%) |
| Total (Category) | 1,288 (44.4%) | 1,611 (55.6%) |
| Total (Overall) | 4,589 (51.2%) | 4,369 (48.8%) |
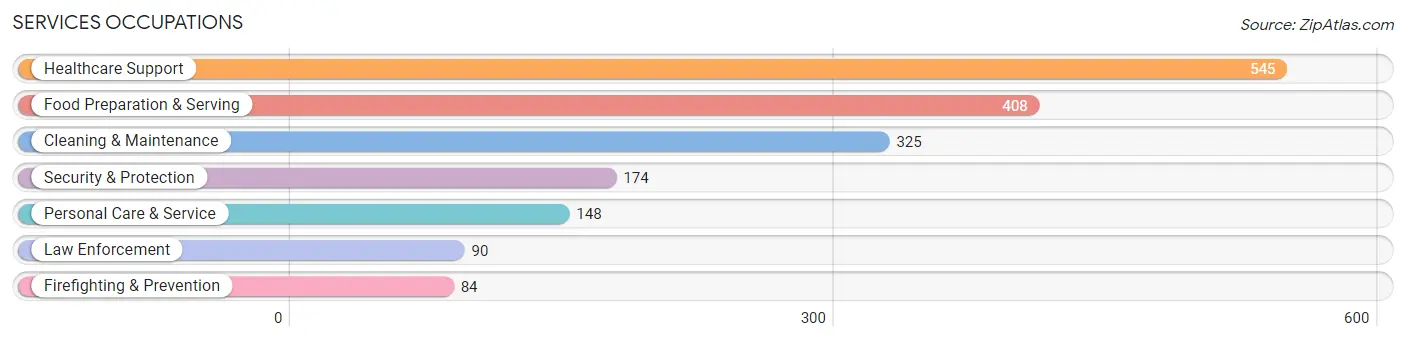
Services Occupations
The most common Services occupations in Conway County are Healthcare Support (545 | 6.1%), Food Preparation & Serving (408 | 4.5%), Cleaning & Maintenance (325 | 3.6%), Security & Protection (174 | 1.9%), and Personal Care & Service (148 | 1.7%).
Services Occupations by Sex
Within the Services occupations in Conway County, the most male-oriented occupations are Law Enforcement (100.0%), Security & Protection (94.8%), and Firefighting & Prevention (89.3%), while the most female-oriented occupations are Healthcare Support (100.0%), Personal Care & Service (76.3%), and Food Preparation & Serving (74.5%).
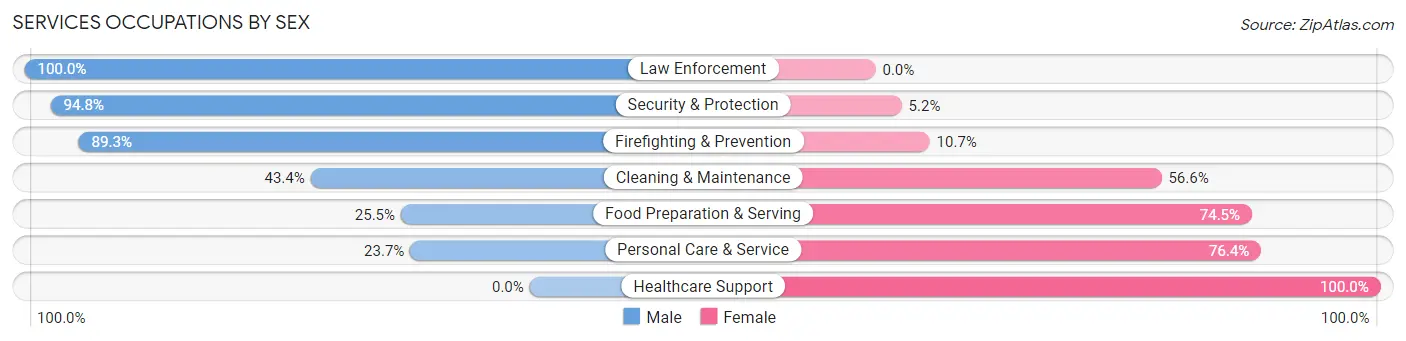
| Occupation | Male | Female |
| Healthcare Support | 0 (0.0%) | 545 (100.0%) |
| Security & Protection | 165 (94.8%) | 9 (5.2%) |
| Firefighting & Prevention | 75 (89.3%) | 9 (10.7%) |
| Law Enforcement | 90 (100.0%) | 0 (0.0%) |
| Food Preparation & Serving | 104 (25.5%) | 304 (74.5%) |
| Cleaning & Maintenance | 141 (43.4%) | 184 (56.6%) |
| Personal Care & Service | 35 (23.6%) | 113 (76.3%) |
| Total (Category) | 445 (27.8%) | 1,155 (72.2%) |
| Total (Overall) | 4,589 (51.2%) | 4,369 (48.8%) |
Sales and Office Occupations
The most common Sales and Office occupations in Conway County are Office & Administration (865 | 9.7%), and Sales & Related (571 | 6.4%).

Sales and Office Occupations by Sex
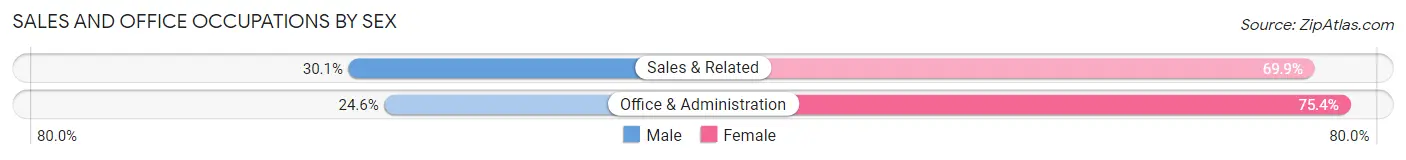
| Occupation | Male | Female |
| Sales & Related | 172 (30.1%) | 399 (69.9%) |
| Office & Administration | 213 (24.6%) | 652 (75.4%) |
| Total (Category) | 385 (26.8%) | 1,051 (73.2%) |
| Total (Overall) | 4,589 (51.2%) | 4,369 (48.8%) |
Natural Resources, Construction and Maintenance Occupations
The most common Natural Resources, Construction and Maintenance occupations in Conway County are Construction & Extraction (667 | 7.4%), Installation, Maintenance & Repair (439 | 4.9%), and Farming, Fishing & Forestry (233 | 2.6%).

Natural Resources, Construction and Maintenance Occupations by Sex

| Occupation | Male | Female |
| Farming, Fishing & Forestry | 98 (42.1%) | 135 (57.9%) |
| Construction & Extraction | 657 (98.5%) | 10 (1.5%) |
| Installation, Maintenance & Repair | 411 (93.6%) | 28 (6.4%) |
| Total (Category) | 1,166 (87.1%) | 173 (12.9%) |
| Total (Overall) | 4,589 (51.2%) | 4,369 (48.8%) |
Production, Transportation and Moving Occupations
The most common Production, Transportation and Moving occupations in Conway County are Production (879 | 9.8%), Material Moving (530 | 5.9%), and Transportation (275 | 3.1%).
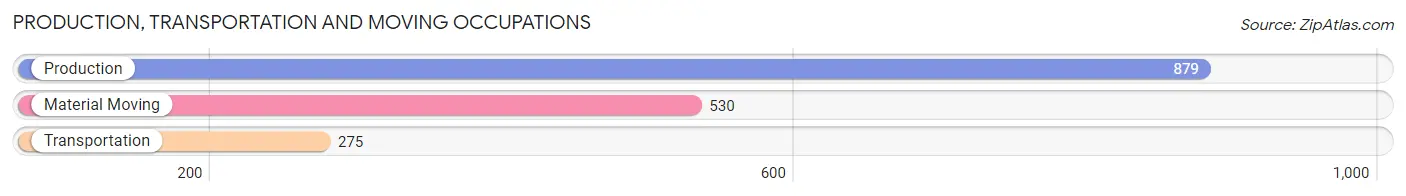
Production, Transportation and Moving Occupations by Sex
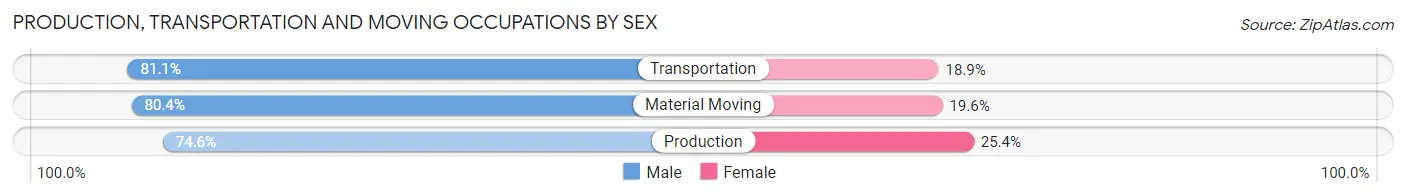
| Occupation | Male | Female |
| Production | 656 (74.6%) | 223 (25.4%) |
| Transportation | 223 (81.1%) | 52 (18.9%) |
| Material Moving | 426 (80.4%) | 104 (19.6%) |
| Total (Category) | 1,305 (77.5%) | 379 (22.5%) |
| Total (Overall) | 4,589 (51.2%) | 4,369 (48.8%) |
Employment Industries by Sex in Conway County
Employment Industries in Conway County
The major employment industries in Conway County include Manufacturing (1,409 | 15.7%), Health Care & Social Assistance (1,304 | 14.6%), Retail Trade (929 | 10.4%), Construction (785 | 8.8%), and Educational Services (712 | 8.0%).
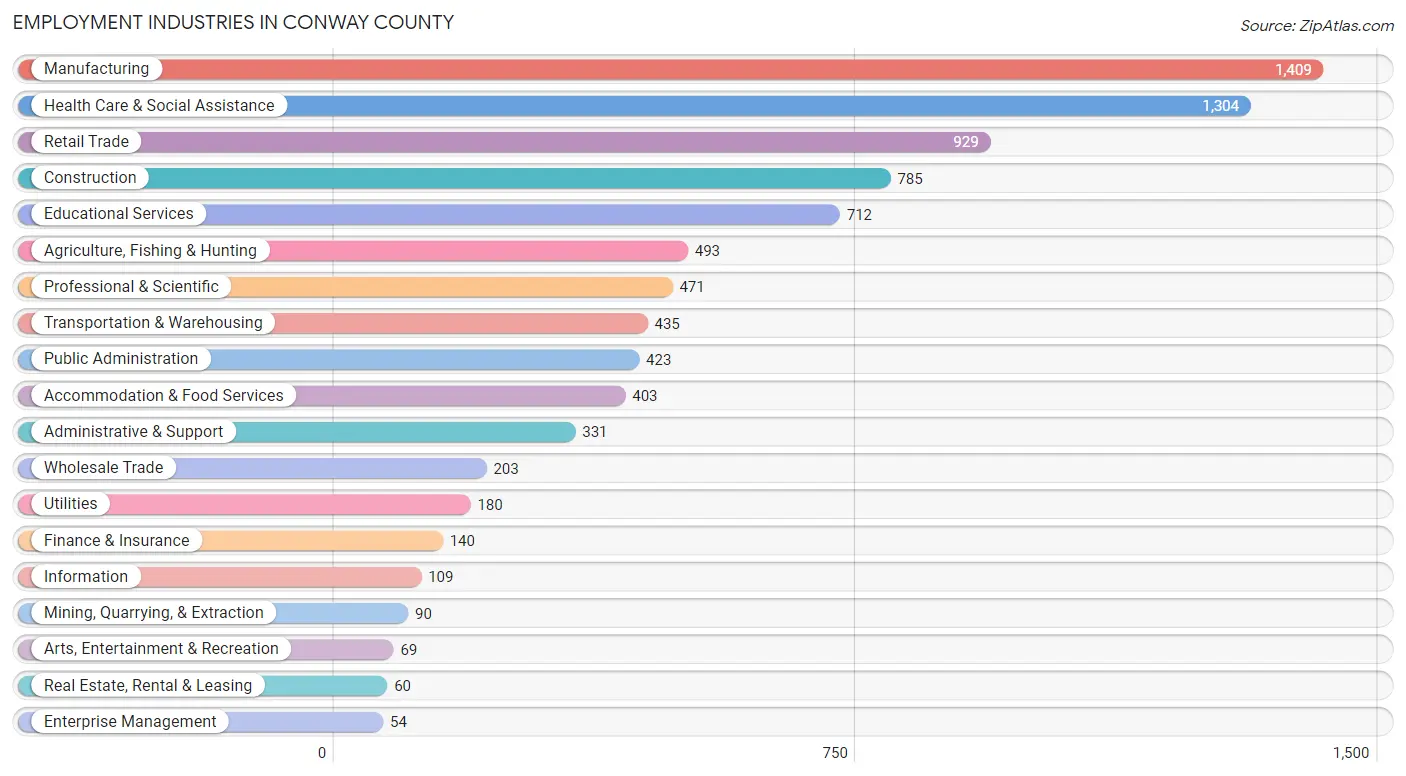
Employment Industries by Sex in Conway County
The Conway County industries that see more men than women are Mining, Quarrying, & Extraction (100.0%), Utilities (91.1%), and Manufacturing (77.5%), whereas the industries that tend to have a higher number of women are Enterprise Management (100.0%), Health Care & Social Assistance (84.1%), and Professional & Scientific (77.3%).
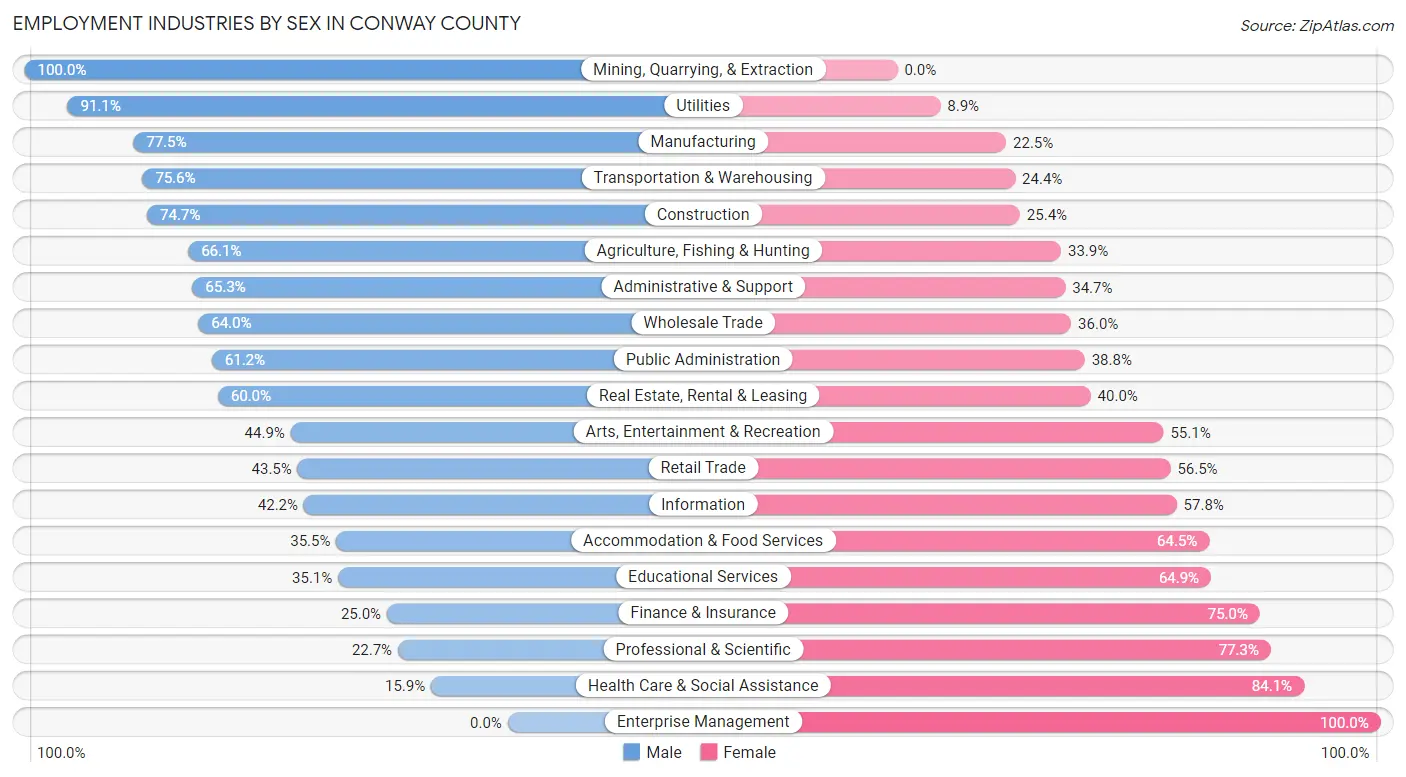
| Industry | Male | Female |
| Agriculture, Fishing & Hunting | 326 (66.1%) | 167 (33.9%) |
| Mining, Quarrying, & Extraction | 90 (100.0%) | 0 (0.0%) |
| Construction | 586 (74.7%) | 199 (25.4%) |
| Manufacturing | 1,092 (77.5%) | 317 (22.5%) |
| Wholesale Trade | 130 (64.0%) | 73 (36.0%) |
| Retail Trade | 404 (43.5%) | 525 (56.5%) |
| Transportation & Warehousing | 329 (75.6%) | 106 (24.4%) |
| Utilities | 164 (91.1%) | 16 (8.9%) |
| Information | 46 (42.2%) | 63 (57.8%) |
| Finance & Insurance | 35 (25.0%) | 105 (75.0%) |
| Real Estate, Rental & Leasing | 36 (60.0%) | 24 (40.0%) |
| Professional & Scientific | 107 (22.7%) | 364 (77.3%) |
| Enterprise Management | 0 (0.0%) | 54 (100.0%) |
| Administrative & Support | 216 (65.3%) | 115 (34.7%) |
| Educational Services | 250 (35.1%) | 462 (64.9%) |
| Health Care & Social Assistance | 207 (15.9%) | 1,097 (84.1%) |
| Arts, Entertainment & Recreation | 31 (44.9%) | 38 (55.1%) |
| Accommodation & Food Services | 143 (35.5%) | 260 (64.5%) |
| Public Administration | 259 (61.2%) | 164 (38.8%) |
| Total | 4,589 (51.2%) | 4,369 (48.8%) |
Education in Conway County
School Enrollment in Conway County
The most common levels of schooling among the 4,738 students in Conway County are middle school (1,308 | 27.6%), elementary school (923 | 19.5%), and college / undergraduate (866 | 18.3%).
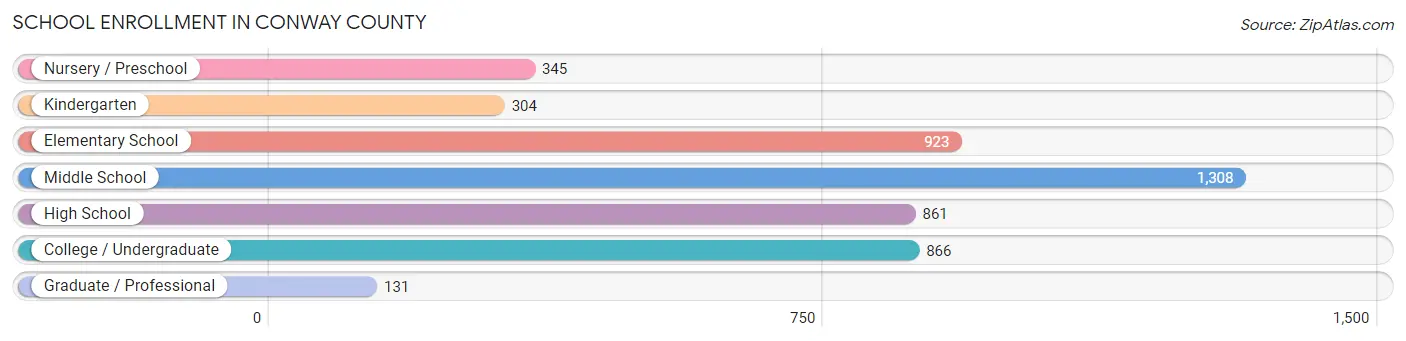
| School Level | # Students | % Students |
| Nursery / Preschool | 345 | 7.3% |
| Kindergarten | 304 | 6.4% |
| Elementary School | 923 | 19.5% |
| Middle School | 1,308 | 27.6% |
| High School | 861 | 18.2% |
| College / Undergraduate | 866 | 18.3% |
| Graduate / Professional | 131 | 2.8% |
| Total | 4,738 | 100.0% |
School Enrollment by Age by Funding Source in Conway County
Out of a total of 4,738 students who are enrolled in schools in Conway County, 701 (14.8%) attend a private institution, while the remaining 4,037 (85.2%) are enrolled in public schools. The age group of 35 years and over has the highest likelihood of being enrolled in private schools, with 50 (27.3% in the age bracket) enrolled. Conversely, the age group of 25 to 34 year olds has the lowest likelihood of being enrolled in a private school, with 236 (100.0% in the age bracket) attending a public institution.
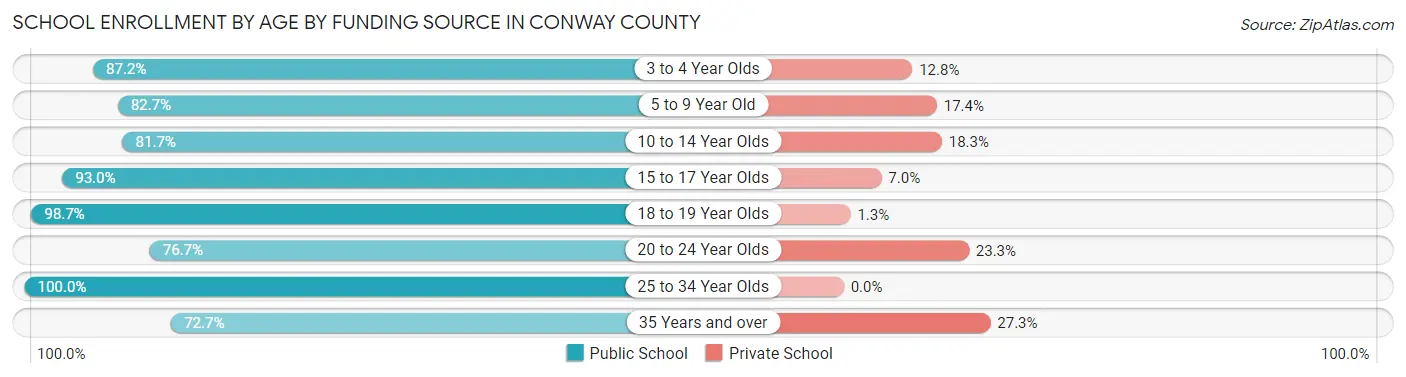
| Age Bracket | Public School | Private School |
| 3 to 4 Year Olds | 164 (87.2%) | 24 (12.8%) |
| 5 to 9 Year Old | 1,081 (82.7%) | 227 (17.3%) |
| 10 to 14 Year Olds | 1,163 (81.7%) | 260 (18.3%) |
| 15 to 17 Year Olds | 661 (93.0%) | 50 (7.0%) |
| 18 to 19 Year Olds | 312 (98.7%) | 4 (1.3%) |
| 20 to 24 Year Olds | 286 (76.7%) | 87 (23.3%) |
| 25 to 34 Year Olds | 236 (100.0%) | 0 (0.0%) |
| 35 Years and over | 133 (72.7%) | 50 (27.3%) |
| Total | 4,037 (85.2%) | 701 (14.8%) |
Educational Attainment by Field of Study in Conway County
Education (673 | 22.4%), science & technology (507 | 16.8%), business (463 | 15.4%), bio, nature & agricultural (275 | 9.1%), and visual & performing arts (202 | 6.7%) are the most common fields of study among 3,010 individuals in Conway County who have obtained a bachelor's degree or higher.
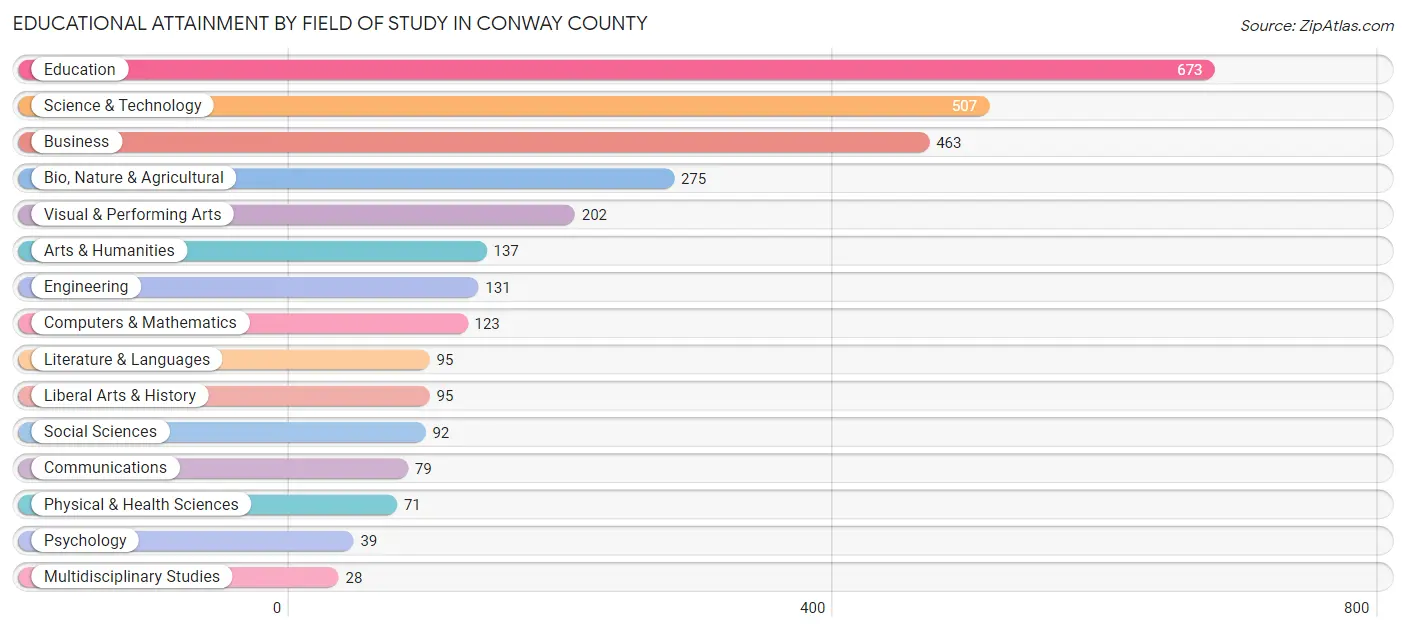
| Field of Study | # Graduates | % Graduates |
| Computers & Mathematics | 123 | 4.1% |
| Bio, Nature & Agricultural | 275 | 9.1% |
| Physical & Health Sciences | 71 | 2.4% |
| Psychology | 39 | 1.3% |
| Social Sciences | 92 | 3.1% |
| Engineering | 131 | 4.3% |
| Multidisciplinary Studies | 28 | 0.9% |
| Science & Technology | 507 | 16.8% |
| Business | 463 | 15.4% |
| Education | 673 | 22.4% |
| Literature & Languages | 95 | 3.2% |
| Liberal Arts & History | 95 | 3.2% |
| Visual & Performing Arts | 202 | 6.7% |
| Communications | 79 | 2.6% |
| Arts & Humanities | 137 | 4.5% |
| Total | 3,010 | 100.0% |
Transportation & Commute in Conway County
Vehicle Availability by Sex in Conway County
The most prevalent vehicle ownership categories in Conway County are males with 2 vehicles (1,725, accounting for 38.0%) and females with 2 vehicles (1,407, making up 39.8%).
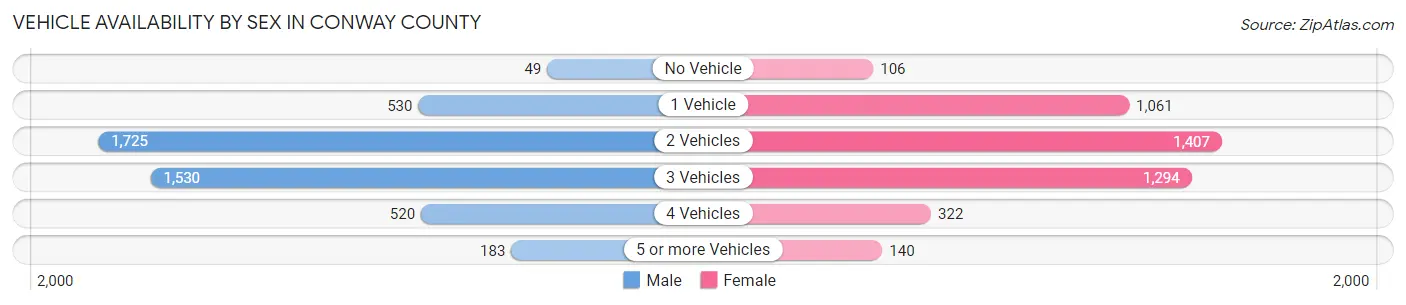
| Vehicles Available | Male | Female |
| No Vehicle | 49 (1.1%) | 106 (2.5%) |
| 1 Vehicle | 530 (11.7%) | 1,061 (24.5%) |
| 2 Vehicles | 1,725 (38.0%) | 1,407 (32.5%) |
| 3 Vehicles | 1,530 (33.7%) | 1,294 (29.9%) |
| 4 Vehicles | 520 (11.5%) | 322 (7.4%) |
| 5 or more Vehicles | 183 (4.0%) | 140 (3.2%) |
| Total | 4,537 (100.0%) | 4,330 (100.0%) |
Commute Time in Conway County
The most frequently occuring commute durations in Conway County are 30 to 34 minutes (1,397 commuters, 16.9%), 5 to 9 minutes (1,141 commuters, 13.8%), and 15 to 19 minutes (1,117 commuters, 13.5%).
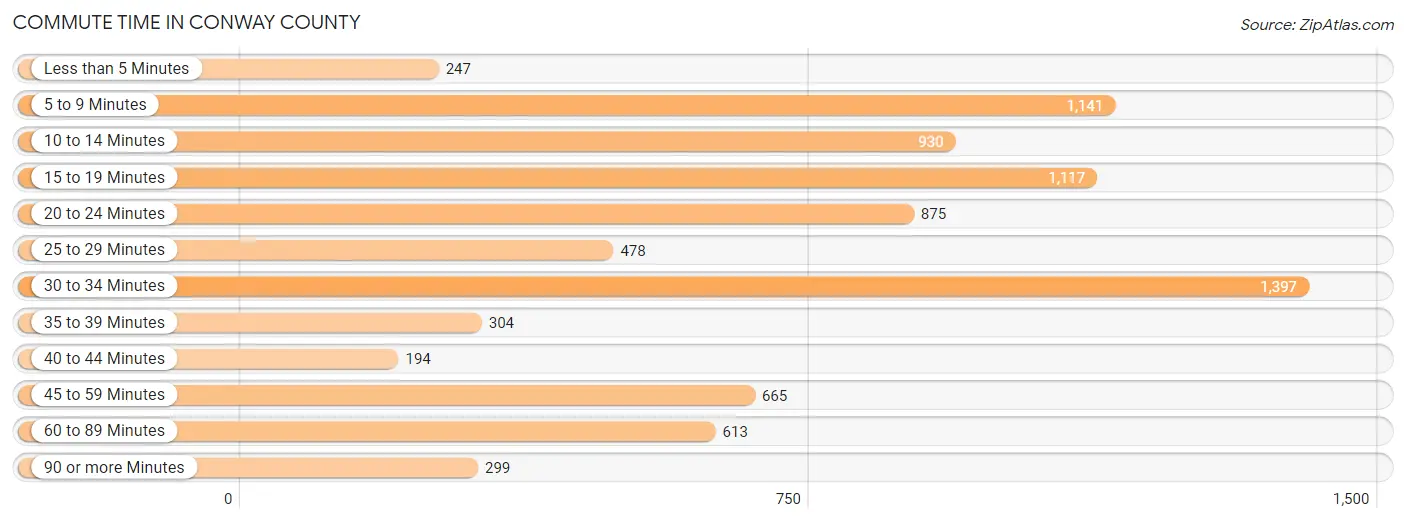
| Commute Time | # Commuters | % Commuters |
| Less than 5 Minutes | 247 | 3.0% |
| 5 to 9 Minutes | 1,141 | 13.8% |
| 10 to 14 Minutes | 930 | 11.3% |
| 15 to 19 Minutes | 1,117 | 13.5% |
| 20 to 24 Minutes | 875 | 10.6% |
| 25 to 29 Minutes | 478 | 5.8% |
| 30 to 34 Minutes | 1,397 | 16.9% |
| 35 to 39 Minutes | 304 | 3.7% |
| 40 to 44 Minutes | 194 | 2.4% |
| 45 to 59 Minutes | 665 | 8.1% |
| 60 to 89 Minutes | 613 | 7.4% |
| 90 or more Minutes | 299 | 3.6% |
Commute Time by Sex in Conway County
The most common commute times in Conway County are 30 to 34 minutes (811 commuters, 19.0%) for males and 15 to 19 minutes (706 commuters, 17.7%) for females.
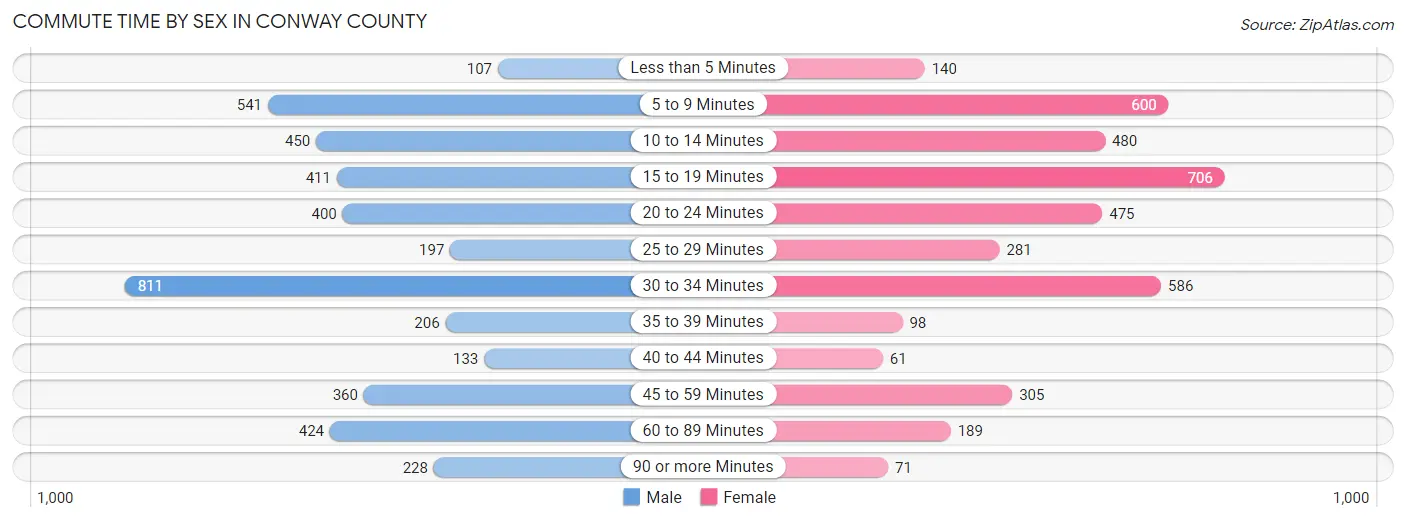
| Commute Time | Male | Female |
| Less than 5 Minutes | 107 (2.5%) | 140 (3.5%) |
| 5 to 9 Minutes | 541 (12.7%) | 600 (15.0%) |
| 10 to 14 Minutes | 450 (10.5%) | 480 (12.0%) |
| 15 to 19 Minutes | 411 (9.6%) | 706 (17.7%) |
| 20 to 24 Minutes | 400 (9.4%) | 475 (11.9%) |
| 25 to 29 Minutes | 197 (4.6%) | 281 (7.0%) |
| 30 to 34 Minutes | 811 (19.0%) | 586 (14.7%) |
| 35 to 39 Minutes | 206 (4.8%) | 98 (2.5%) |
| 40 to 44 Minutes | 133 (3.1%) | 61 (1.5%) |
| 45 to 59 Minutes | 360 (8.4%) | 305 (7.6%) |
| 60 to 89 Minutes | 424 (9.9%) | 189 (4.7%) |
| 90 or more Minutes | 228 (5.3%) | 71 (1.8%) |
Time of Departure to Work by Sex in Conway County
The most frequent times of departure to work in Conway County are 6:30 AM to 6:59 AM (597, 14.0%) for males and 7:00 AM to 7:29 AM (1,043, 26.1%) for females.
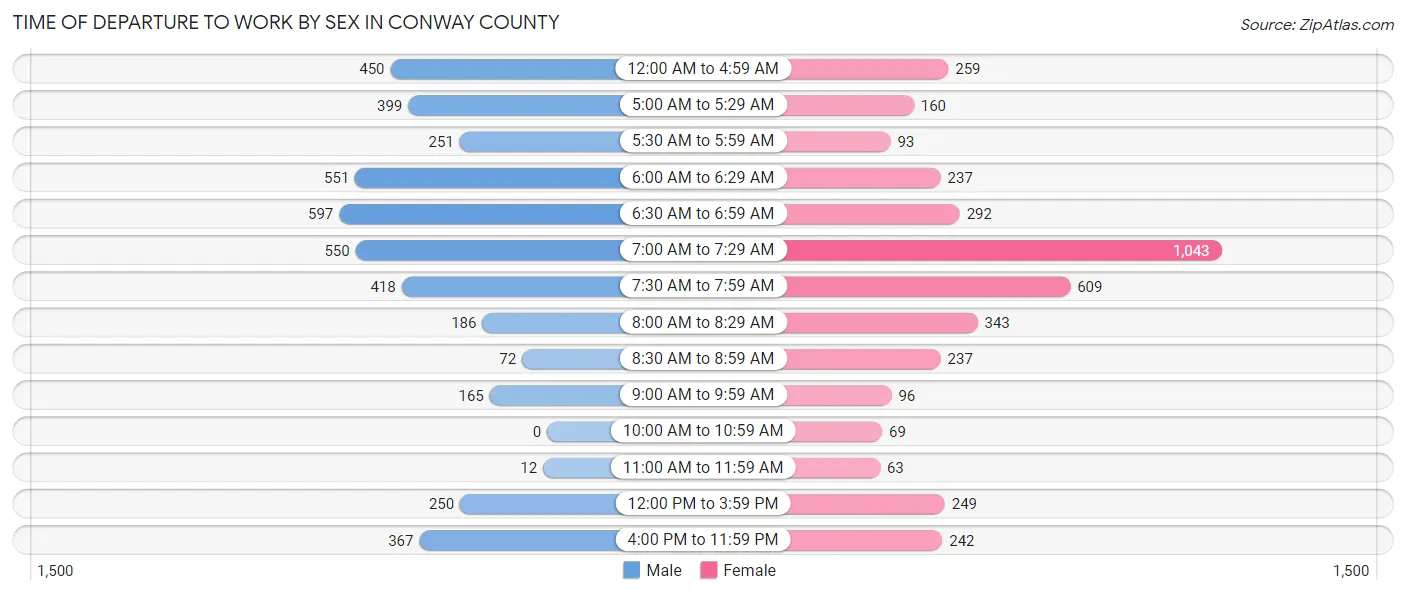
| Time of Departure | Male | Female |
| 12:00 AM to 4:59 AM | 450 (10.5%) | 259 (6.5%) |
| 5:00 AM to 5:29 AM | 399 (9.3%) | 160 (4.0%) |
| 5:30 AM to 5:59 AM | 251 (5.9%) | 93 (2.3%) |
| 6:00 AM to 6:29 AM | 551 (12.9%) | 237 (5.9%) |
| 6:30 AM to 6:59 AM | 597 (14.0%) | 292 (7.3%) |
| 7:00 AM to 7:29 AM | 550 (12.9%) | 1,043 (26.1%) |
| 7:30 AM to 7:59 AM | 418 (9.8%) | 609 (15.3%) |
| 8:00 AM to 8:29 AM | 186 (4.4%) | 343 (8.6%) |
| 8:30 AM to 8:59 AM | 72 (1.7%) | 237 (5.9%) |
| 9:00 AM to 9:59 AM | 165 (3.9%) | 96 (2.4%) |
| 10:00 AM to 10:59 AM | 0 (0.0%) | 69 (1.7%) |
| 11:00 AM to 11:59 AM | 12 (0.3%) | 63 (1.6%) |
| 12:00 PM to 3:59 PM | 250 (5.9%) | 249 (6.2%) |
| 4:00 PM to 11:59 PM | 367 (8.6%) | 242 (6.1%) |
| Total | 4,268 (100.0%) | 3,992 (100.0%) |
Housing Occupancy in Conway County
Occupancy by Ownership in Conway County
Of the total 8,422 dwellings in Conway County, owner-occupied units account for 5,742 (68.2%), while renter-occupied units make up 2,680 (31.8%).
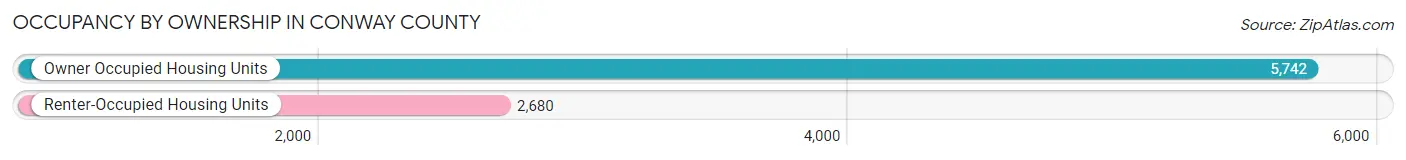
| Occupancy | # Housing Units | % Housing Units |
| Owner Occupied Housing Units | 5,742 | 68.2% |
| Renter-Occupied Housing Units | 2,680 | 31.8% |
| Total Occupied Housing Units | 8,422 | 100.0% |
Occupancy by Household Size in Conway County
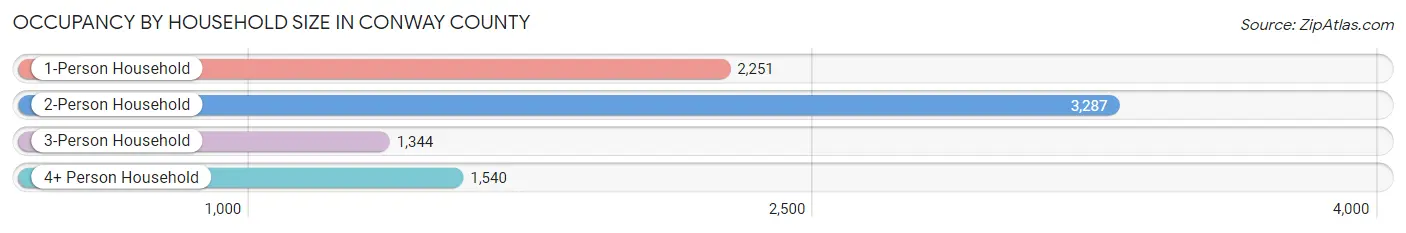
| Household Size | # Housing Units | % Housing Units |
| 1-Person Household | 2,251 | 26.7% |
| 2-Person Household | 3,287 | 39.0% |
| 3-Person Household | 1,344 | 16.0% |
| 4+ Person Household | 1,540 | 18.3% |
| Total Housing Units | 8,422 | 100.0% |
Occupancy by Ownership by Household Size in Conway County
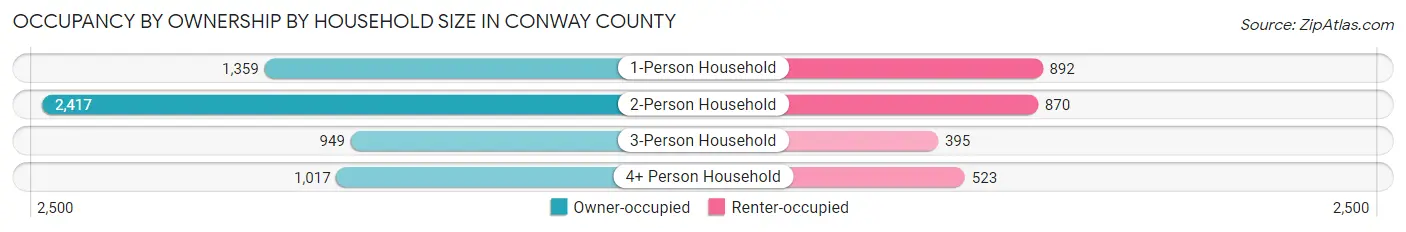
| Household Size | Owner-occupied | Renter-occupied |
| 1-Person Household | 1,359 (60.4%) | 892 (39.6%) |
| 2-Person Household | 2,417 (73.5%) | 870 (26.5%) |
| 3-Person Household | 949 (70.6%) | 395 (29.4%) |
| 4+ Person Household | 1,017 (66.0%) | 523 (34.0%) |
| Total Housing Units | 5,742 (68.2%) | 2,680 (31.8%) |
Occupancy by Educational Attainment in Conway County
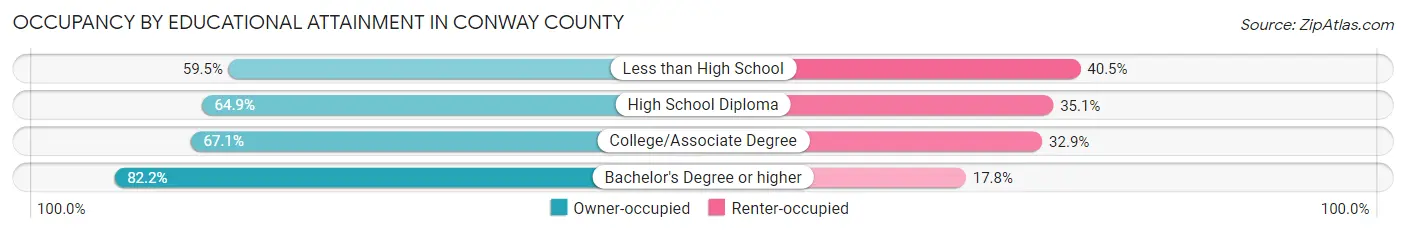
| Household Size | Owner-occupied | Renter-occupied |
| Less than High School | 625 (59.5%) | 425 (40.5%) |
| High School Diploma | 2,206 (64.9%) | 1,193 (35.1%) |
| College/Associate Degree | 1,578 (67.1%) | 774 (32.9%) |
| Bachelor's Degree or higher | 1,333 (82.2%) | 288 (17.8%) |
Occupancy by Age of Householder in Conway County
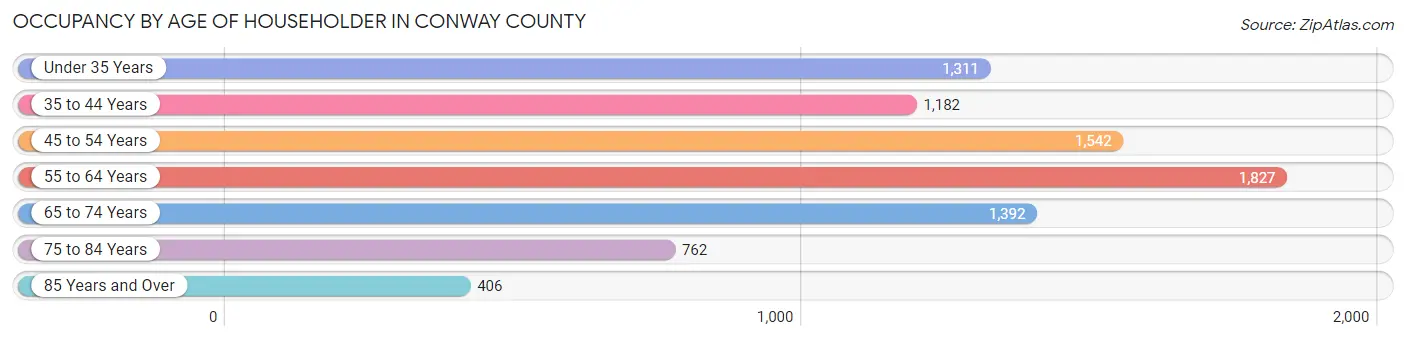
| Age Bracket | # Households | % Households |
| Under 35 Years | 1,311 | 15.6% |
| 35 to 44 Years | 1,182 | 14.0% |
| 45 to 54 Years | 1,542 | 18.3% |
| 55 to 64 Years | 1,827 | 21.7% |
| 65 to 74 Years | 1,392 | 16.5% |
| 75 to 84 Years | 762 | 9.0% |
| 85 Years and Over | 406 | 4.8% |
| Total | 8,422 | 100.0% |
Housing Finances in Conway County
Median Income by Occupancy in Conway County
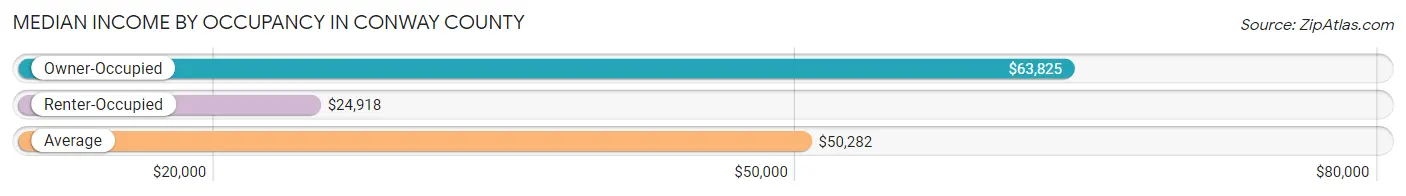
| Occupancy Type | # Households | Median Income |
| Owner-Occupied | 5,742 (68.2%) | $63,825 |
| Renter-Occupied | 2,680 (31.8%) | $24,918 |
| Average | 8,422 (100.0%) | $50,282 |
Occupancy by Householder Income Bracket in Conway County
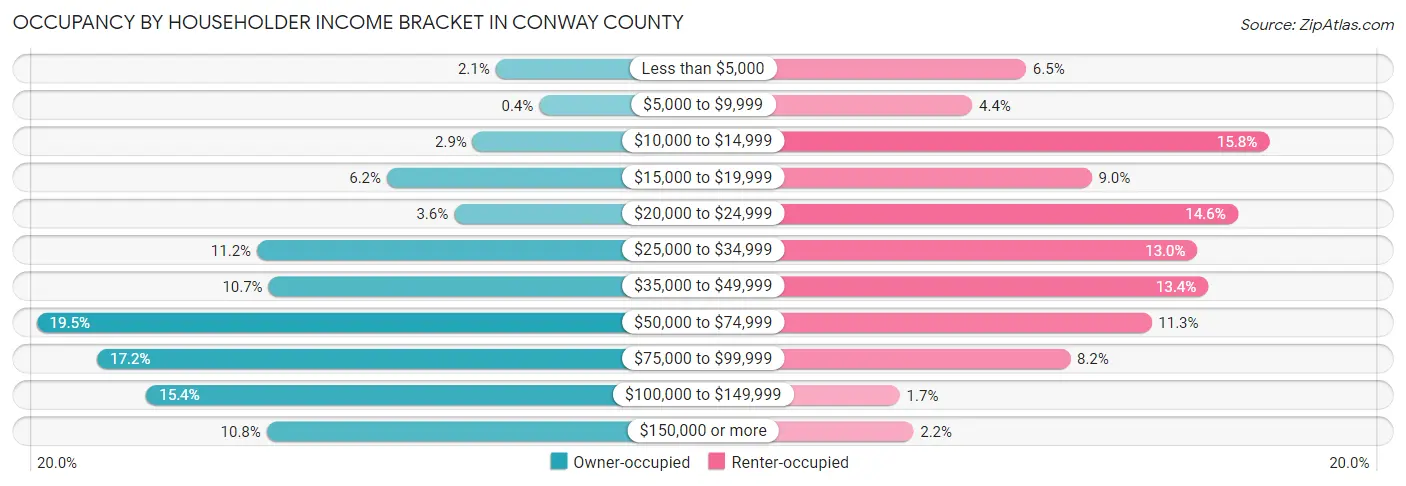
| Income Bracket | Owner-occupied | Renter-occupied |
| Less than $5,000 | 118 (2.1%) | 174 (6.5%) |
| $5,000 to $9,999 | 23 (0.4%) | 119 (4.4%) |
| $10,000 to $14,999 | 168 (2.9%) | 422 (15.8%) |
| $15,000 to $19,999 | 356 (6.2%) | 241 (9.0%) |
| $20,000 to $24,999 | 209 (3.6%) | 390 (14.5%) |
| $25,000 to $34,999 | 640 (11.2%) | 349 (13.0%) |
| $35,000 to $49,999 | 615 (10.7%) | 360 (13.4%) |
| $50,000 to $74,999 | 1,122 (19.5%) | 302 (11.3%) |
| $75,000 to $99,999 | 990 (17.2%) | 219 (8.2%) |
| $100,000 to $149,999 | 882 (15.4%) | 45 (1.7%) |
| $150,000 or more | 619 (10.8%) | 59 (2.2%) |
| Total | 5,742 (100.0%) | 2,680 (100.0%) |
Monthly Housing Cost Tiers in Conway County
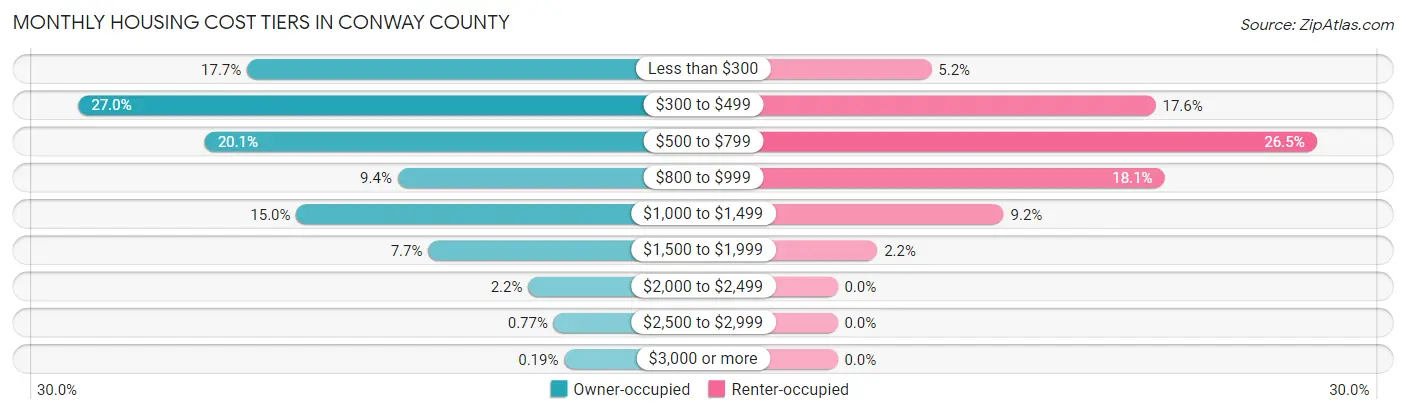
| Monthly Cost | Owner-occupied | Renter-occupied |
| Less than $300 | 1,017 (17.7%) | 139 (5.2%) |
| $300 to $499 | 1,552 (27.0%) | 471 (17.6%) |
| $500 to $799 | 1,151 (20.1%) | 709 (26.5%) |
| $800 to $999 | 539 (9.4%) | 484 (18.1%) |
| $1,000 to $1,499 | 861 (15.0%) | 246 (9.2%) |
| $1,500 to $1,999 | 442 (7.7%) | 59 (2.2%) |
| $2,000 to $2,499 | 125 (2.2%) | 0 (0.0%) |
| $2,500 to $2,999 | 44 (0.8%) | 0 (0.0%) |
| $3,000 or more | 11 (0.2%) | 0 (0.0%) |
| Total | 5,742 (100.0%) | 2,680 (100.0%) |
Physical Housing Characteristics in Conway County
Housing Structures in Conway County
| Structure Type | # Housing Units | % Housing Units |
| Single Unit, Detached | 6,026 | 71.6% |
| Single Unit, Attached | 95 | 1.1% |
| 2 Unit Apartments | 258 | 3.1% |
| 3 or 4 Unit Apartments | 55 | 0.6% |
| 5 to 9 Unit Apartments | 267 | 3.2% |
| 10 or more Apartments | 164 | 1.9% |
| Mobile Home / Other | 1,557 | 18.5% |
| Total | 8,422 | 100.0% |
Housing Structures by Occupancy in Conway County
| Structure Type | Owner-occupied | Renter-occupied |
| Single Unit, Detached | 4,535 (75.3%) | 1,491 (24.7%) |
| Single Unit, Attached | 34 (35.8%) | 61 (64.2%) |
| 2 Unit Apartments | 0 (0.0%) | 258 (100.0%) |
| 3 or 4 Unit Apartments | 0 (0.0%) | 55 (100.0%) |
| 5 to 9 Unit Apartments | 0 (0.0%) | 267 (100.0%) |
| 10 or more Apartments | 0 (0.0%) | 164 (100.0%) |
| Mobile Home / Other | 1,173 (75.3%) | 384 (24.7%) |
| Total | 5,742 (68.2%) | 2,680 (31.8%) |
Housing Structures by Number of Rooms in Conway County
| Number of Rooms | Owner-occupied | Renter-occupied |
| 1 Room | 20 (0.4%) | 208 (7.8%) |
| 2 or 3 Rooms | 248 (4.3%) | 179 (6.7%) |
| 4 or 5 Rooms | 1,814 (31.6%) | 1,413 (52.7%) |
| 6 or 7 Rooms | 2,637 (45.9%) | 727 (27.1%) |
| 8 or more Rooms | 1,023 (17.8%) | 153 (5.7%) |
| Total | 5,742 (100.0%) | 2,680 (100.0%) |
Housing Structure by Heating Type in Conway County
| Heating Type | Owner-occupied | Renter-occupied |
| Utility Gas | 1,332 (23.2%) | 692 (25.8%) |
| Bottled, Tank, or LP Gas | 537 (9.3%) | 38 (1.4%) |
| Electricity | 3,519 (61.3%) | 1,687 (62.9%) |
| Fuel Oil or Kerosene | 68 (1.2%) | 65 (2.4%) |
| Coal or Coke | 0 (0.0%) | 0 (0.0%) |
| All other Fuels | 286 (5.0%) | 194 (7.2%) |
| No Fuel Used | 0 (0.0%) | 4 (0.2%) |
| Total | 5,742 (100.0%) | 2,680 (100.0%) |
Household Vehicle Usage in Conway County
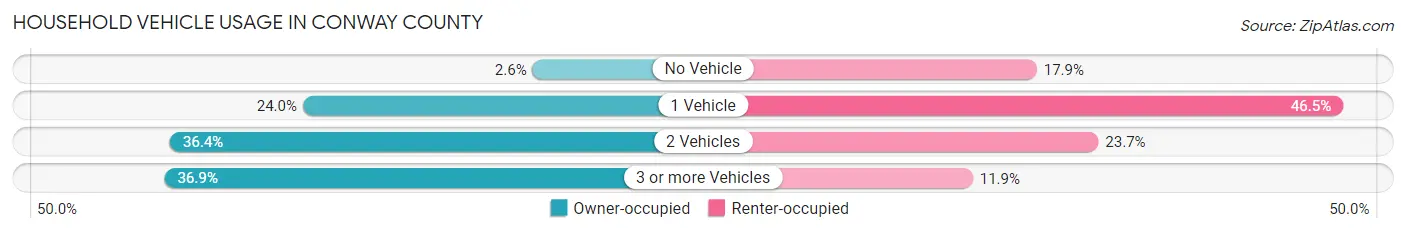
| Vehicles per Household | Owner-occupied | Renter-occupied |
| No Vehicle | 149 (2.6%) | 480 (17.9%) |
| 1 Vehicle | 1,380 (24.0%) | 1,246 (46.5%) |
| 2 Vehicles | 2,092 (36.4%) | 634 (23.7%) |
| 3 or more Vehicles | 2,121 (36.9%) | 320 (11.9%) |
| Total | 5,742 (100.0%) | 2,680 (100.0%) |
Real Estate & Mortgages in Conway County
Real Estate and Mortgage Overview in Conway County
| Characteristic | Without Mortgage | With Mortgage |
| Housing Units | 3,222 | 2,520 |
| Median Property Value | $120,000 | $136,400 |
| Median Household Income | $57,336 | $368 |
| Monthly Housing Costs | $384 | $4 |
| Real Estate Taxes | $620 | $220 |
Property Value by Mortgage Status in Conway County
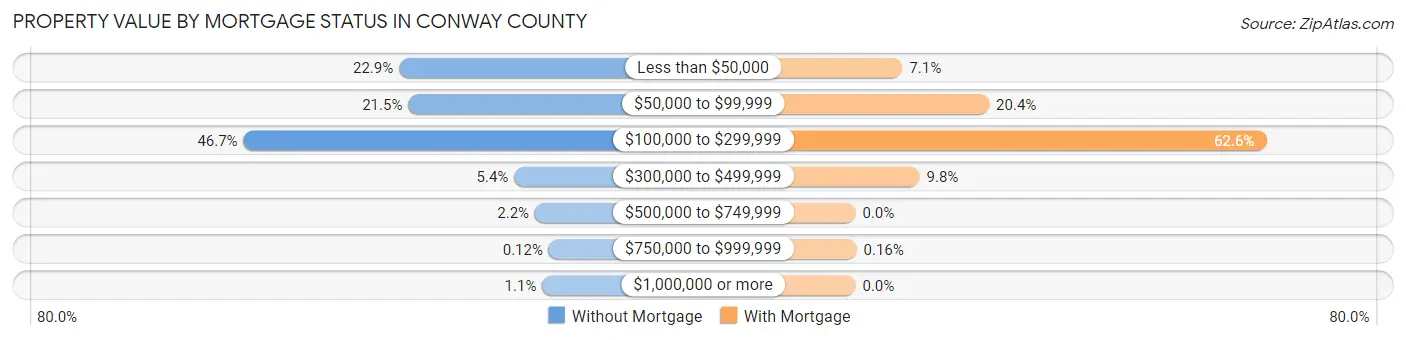
| Property Value | Without Mortgage | With Mortgage |
| Less than $50,000 | 739 (22.9%) | 180 (7.1%) |
| $50,000 to $99,999 | 694 (21.5%) | 513 (20.4%) |
| $100,000 to $299,999 | 1,503 (46.7%) | 1,577 (62.6%) |
| $300,000 to $499,999 | 174 (5.4%) | 246 (9.8%) |
| $500,000 to $749,999 | 72 (2.2%) | 0 (0.0%) |
| $750,000 to $999,999 | 4 (0.1%) | 4 (0.2%) |
| $1,000,000 or more | 36 (1.1%) | 0 (0.0%) |
| Total | 3,222 (100.0%) | 2,520 (100.0%) |
Household Income by Mortgage Status in Conway County
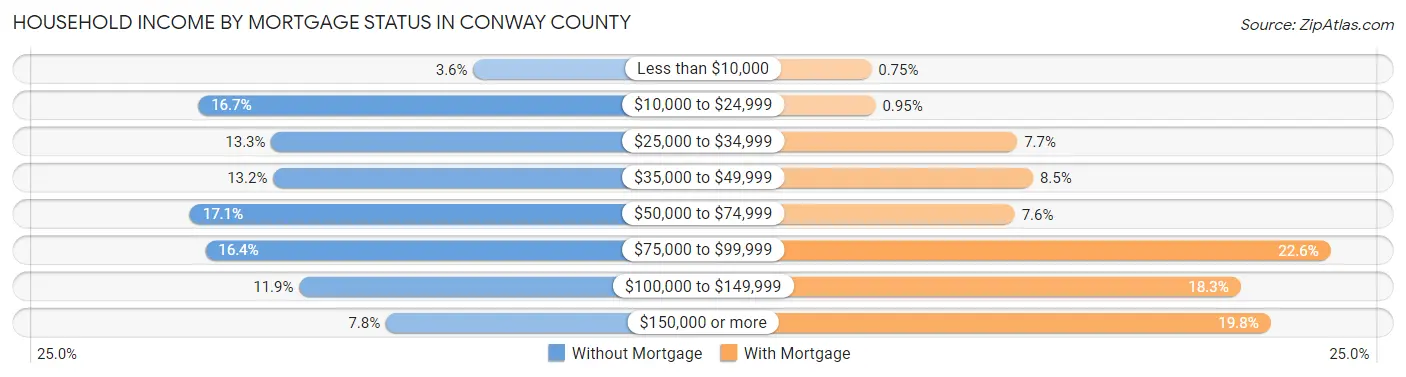
| Household Income | Without Mortgage | With Mortgage |
| Less than $10,000 | 117 (3.6%) | 19 (0.7%) |
| $10,000 to $24,999 | 539 (16.7%) | 24 (0.9%) |
| $25,000 to $34,999 | 427 (13.3%) | 194 (7.7%) |
| $35,000 to $49,999 | 424 (13.2%) | 213 (8.5%) |
| $50,000 to $74,999 | 552 (17.1%) | 191 (7.6%) |
| $75,000 to $99,999 | 528 (16.4%) | 570 (22.6%) |
| $100,000 to $149,999 | 384 (11.9%) | 462 (18.3%) |
| $150,000 or more | 251 (7.8%) | 498 (19.8%) |
| Total | 3,222 (100.0%) | 2,520 (100.0%) |
Property Value to Household Income Ratio in Conway County
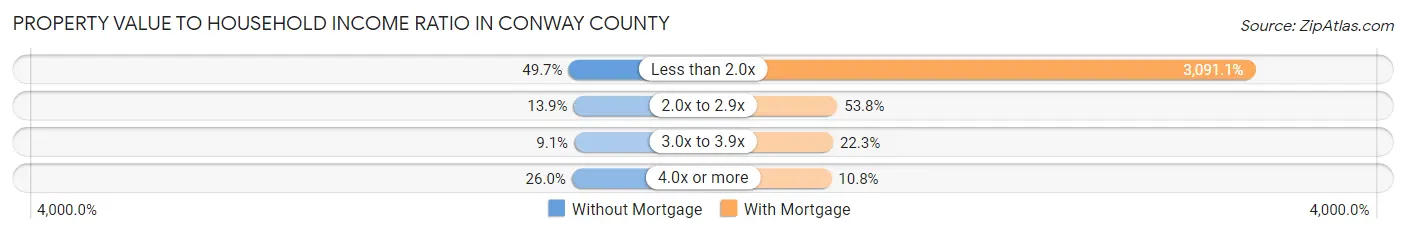
| Value-to-Income Ratio | Without Mortgage | With Mortgage |
| Less than 2.0x | 1,600 (49.7%) | 77,895 (3,091.1%) |
| 2.0x to 2.9x | 448 (13.9%) | 1,355 (53.8%) |
| 3.0x to 3.9x | 293 (9.1%) | 561 (22.3%) |
| 4.0x or more | 836 (26.0%) | 272 (10.8%) |
| Total | 3,222 (100.0%) | 2,520 (100.0%) |
Real Estate Taxes by Mortgage Status in Conway County
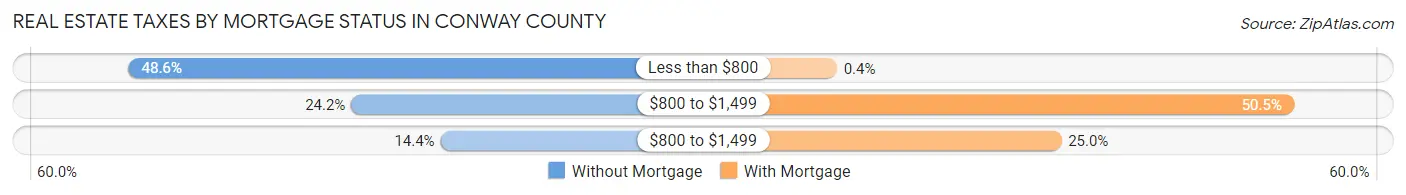
| Property Taxes | Without Mortgage | With Mortgage |
| Less than $800 | 1,566 (48.6%) | 10 (0.4%) |
| $800 to $1,499 | 780 (24.2%) | 1,272 (50.5%) |
| $800 to $1,499 | 465 (14.4%) | 630 (25.0%) |
| Total | 3,222 (100.0%) | 2,520 (100.0%) |
Health & Disability in Conway County
Health Insurance Coverage by Age in Conway County
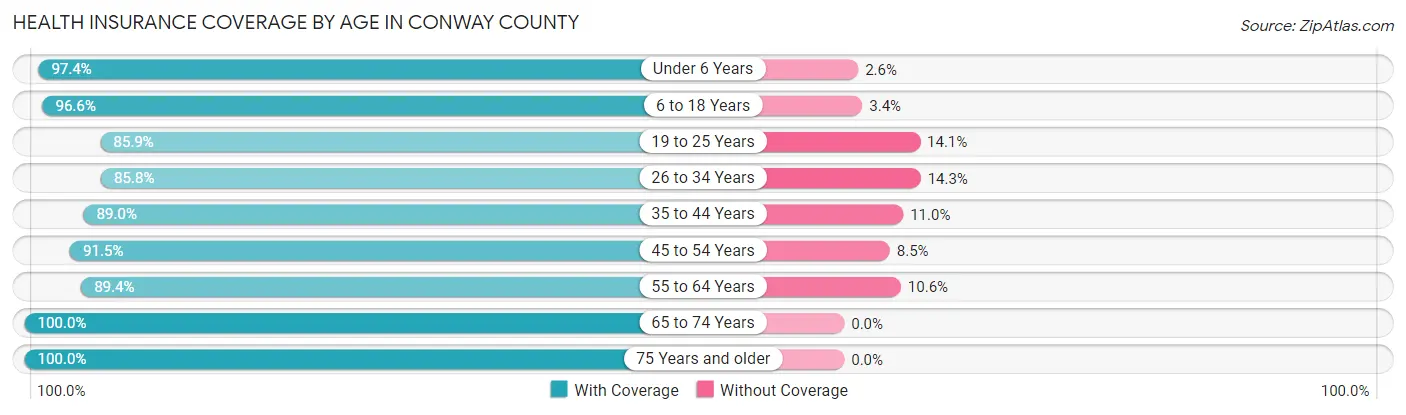
| Age Bracket | With Coverage | Without Coverage |
| Under 6 Years | 1,430 (97.4%) | 38 (2.6%) |
| 6 to 18 Years | 3,280 (96.6%) | 114 (3.4%) |
| 19 to 25 Years | 1,421 (85.9%) | 234 (14.1%) |
| 26 to 34 Years | 1,902 (85.8%) | 316 (14.2%) |
| 35 to 44 Years | 2,049 (89.0%) | 253 (11.0%) |
| 45 to 54 Years | 2,393 (91.5%) | 222 (8.5%) |
| 55 to 64 Years | 2,743 (89.4%) | 324 (10.6%) |
| 65 to 74 Years | 2,318 (100.0%) | 0 (0.0%) |
| 75 Years and older | 1,651 (100.0%) | 0 (0.0%) |
| Total | 19,187 (92.7%) | 1,501 (7.3%) |
Health Insurance Coverage by Citizenship Status in Conway County
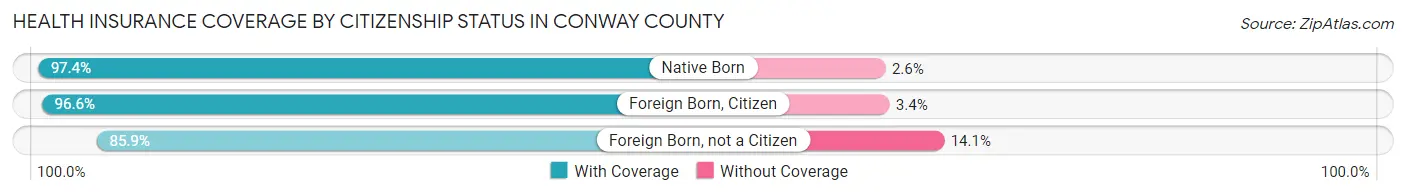
| Citizenship Status | With Coverage | Without Coverage |
| Native Born | 1,430 (97.4%) | 38 (2.6%) |
| Foreign Born, Citizen | 3,280 (96.6%) | 114 (3.4%) |
| Foreign Born, not a Citizen | 1,421 (85.9%) | 234 (14.1%) |
Health Insurance Coverage by Household Income in Conway County
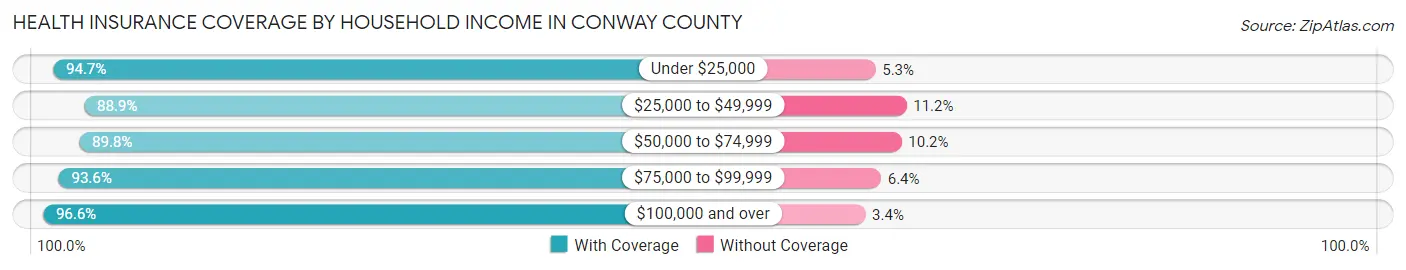
| Household Income | With Coverage | Without Coverage |
| Under $25,000 | 3,918 (94.7%) | 221 (5.3%) |
| $25,000 to $49,999 | 4,246 (88.8%) | 533 (11.2%) |
| $50,000 to $74,999 | 3,022 (89.8%) | 344 (10.2%) |
| $75,000 to $99,999 | 3,192 (93.6%) | 217 (6.4%) |
| $100,000 and over | 4,743 (96.6%) | 169 (3.4%) |
Public vs Private Health Insurance Coverage by Age in Conway County
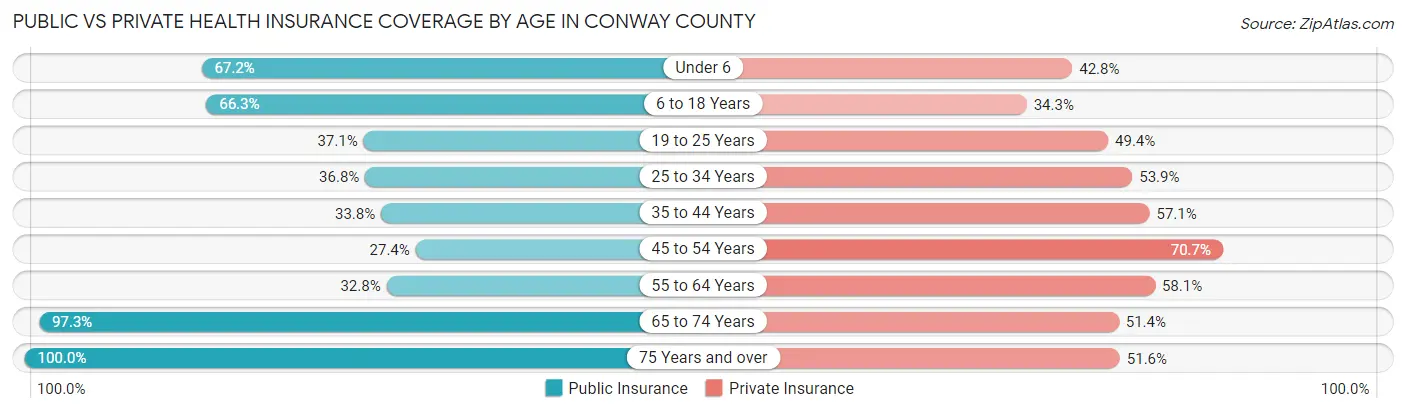
| Age Bracket | Public Insurance | Private Insurance |
| Under 6 | 986 (67.2%) | 628 (42.8%) |
| 6 to 18 Years | 2,249 (66.3%) | 1,165 (34.3%) |
| 19 to 25 Years | 614 (37.1%) | 818 (49.4%) |
| 25 to 34 Years | 816 (36.8%) | 1,196 (53.9%) |
| 35 to 44 Years | 779 (33.8%) | 1,315 (57.1%) |
| 45 to 54 Years | 717 (27.4%) | 1,849 (70.7%) |
| 55 to 64 Years | 1,007 (32.8%) | 1,783 (58.1%) |
| 65 to 74 Years | 2,256 (97.3%) | 1,192 (51.4%) |
| 75 Years and over | 1,651 (100.0%) | 852 (51.6%) |
| Total | 11,075 (53.5%) | 10,798 (52.2%) |
Disability Status by Sex by Age in Conway County
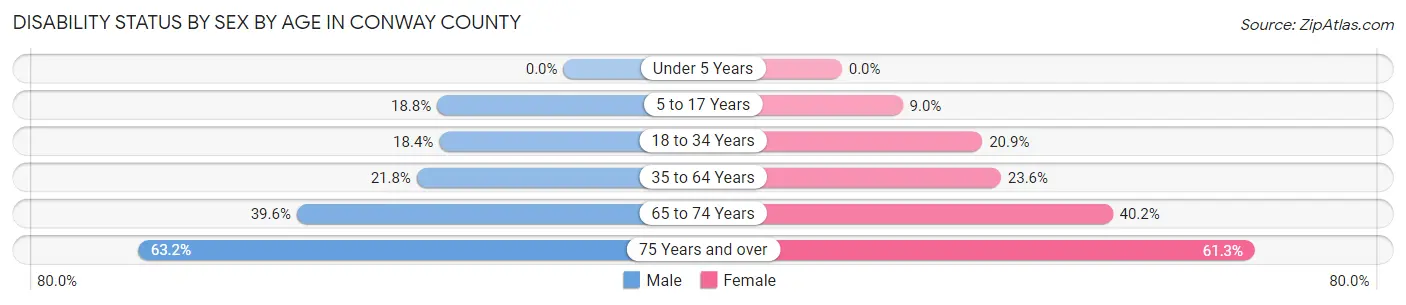
| Age Bracket | Male | Female |
| Under 5 Years | 0 (0.0%) | 0 (0.0%) |
| 5 to 17 Years | 344 (18.8%) | 153 (9.0%) |
| 18 to 34 Years | 386 (18.4%) | 409 (20.8%) |
| 35 to 64 Years | 861 (21.8%) | 952 (23.6%) |
| 65 to 74 Years | 443 (39.6%) | 482 (40.2%) |
| 75 Years and over | 455 (63.2%) | 571 (61.3%) |
Disability Class by Sex by Age in Conway County
Disability Class: Hearing Difficulty
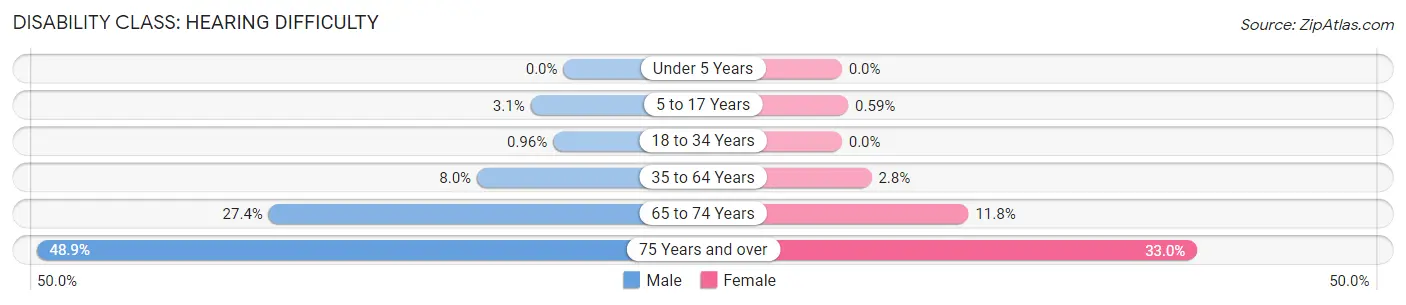
| Age Bracket | Male | Female |
| Under 5 Years | 0 (0.0%) | 0 (0.0%) |
| 5 to 17 Years | 56 (3.0%) | 10 (0.6%) |
| 18 to 34 Years | 20 (1.0%) | 0 (0.0%) |
| 35 to 64 Years | 317 (8.0%) | 111 (2.8%) |
| 65 to 74 Years | 306 (27.4%) | 141 (11.8%) |
| 75 Years and over | 352 (48.9%) | 307 (33.0%) |
Disability Class: Vision Difficulty
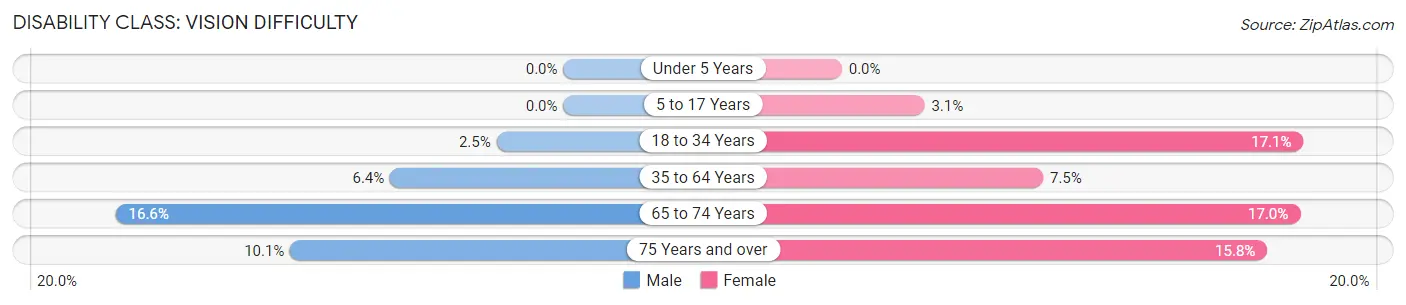
| Age Bracket | Male | Female |
| Under 5 Years | 0 (0.0%) | 0 (0.0%) |
| 5 to 17 Years | 0 (0.0%) | 52 (3.1%) |
| 18 to 34 Years | 52 (2.5%) | 336 (17.1%) |
| 35 to 64 Years | 254 (6.4%) | 301 (7.5%) |
| 65 to 74 Years | 186 (16.6%) | 204 (17.0%) |
| 75 Years and over | 73 (10.1%) | 147 (15.8%) |
Disability Class: Cognitive Difficulty
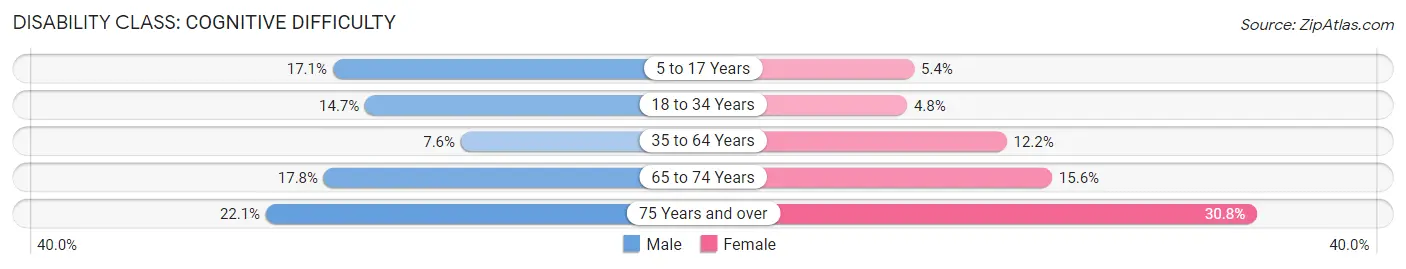
| Age Bracket | Male | Female |
| 5 to 17 Years | 314 (17.1%) | 91 (5.4%) |
| 18 to 34 Years | 308 (14.7%) | 95 (4.8%) |
| 35 to 64 Years | 301 (7.6%) | 493 (12.2%) |
| 65 to 74 Years | 199 (17.8%) | 187 (15.6%) |
| 75 Years and over | 159 (22.1%) | 287 (30.8%) |
Disability Class: Ambulatory Difficulty
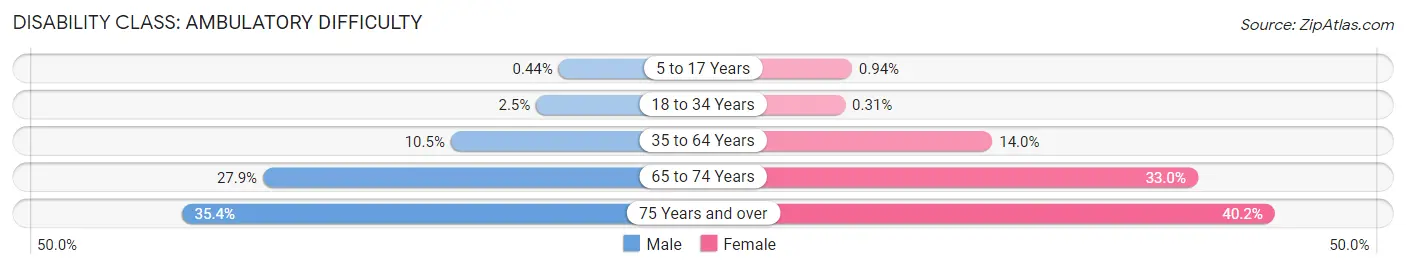
| Age Bracket | Male | Female |
| 5 to 17 Years | 8 (0.4%) | 16 (0.9%) |
| 18 to 34 Years | 53 (2.5%) | 6 (0.3%) |
| 35 to 64 Years | 413 (10.4%) | 563 (14.0%) |
| 65 to 74 Years | 312 (27.9%) | 396 (33.0%) |
| 75 Years and over | 255 (35.4%) | 374 (40.2%) |
Disability Class: Self-Care Difficulty
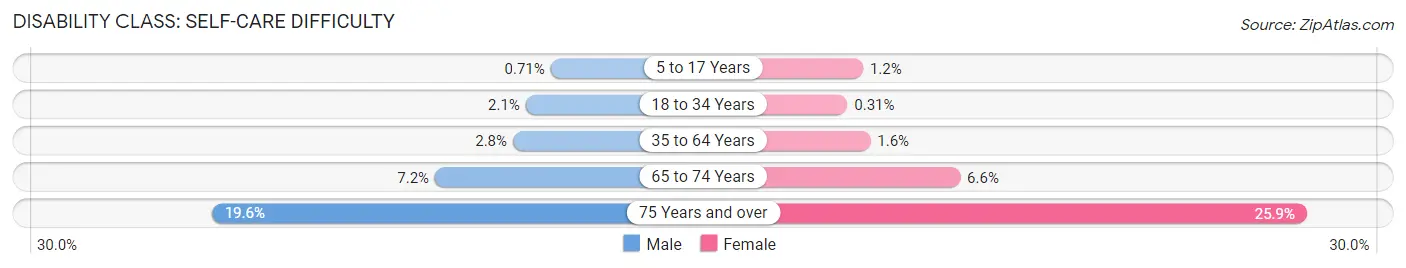
| Age Bracket | Male | Female |
| 5 to 17 Years | 13 (0.7%) | 20 (1.2%) |
| 18 to 34 Years | 44 (2.1%) | 6 (0.3%) |
| 35 to 64 Years | 111 (2.8%) | 64 (1.6%) |
| 65 to 74 Years | 80 (7.1%) | 79 (6.6%) |
| 75 Years and over | 141 (19.6%) | 241 (25.9%) |
Technology Access in Conway County
Computing Device Access in Conway County
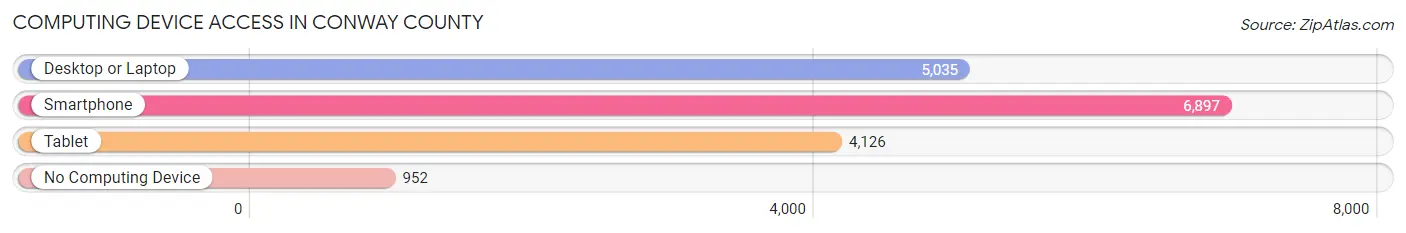
| Device Type | # Households | % Households |
| Desktop or Laptop | 5,035 | 59.8% |
| Smartphone | 6,897 | 81.9% |
| Tablet | 4,126 | 49.0% |
| No Computing Device | 952 | 11.3% |
| Total | 8,422 | 100.0% |
Internet Access in Conway County
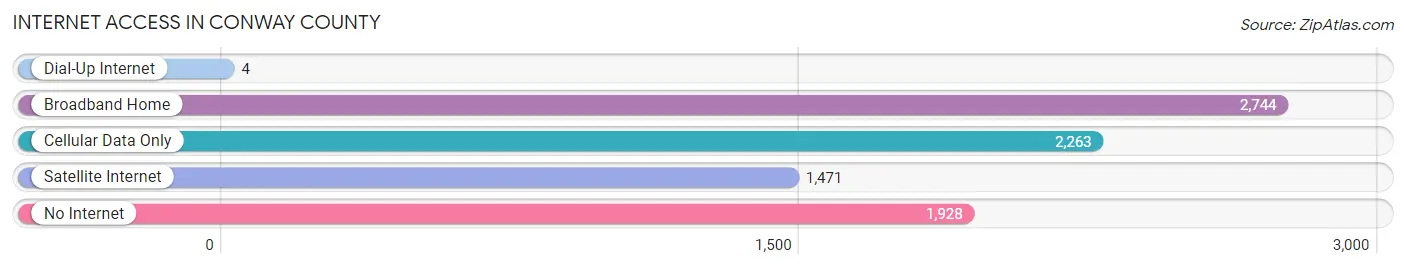
| Internet Type | # Households | % Households |
| Dial-Up Internet | 4 | 0.1% |
| Broadband Home | 2,744 | 32.6% |
| Cellular Data Only | 2,263 | 26.9% |
| Satellite Internet | 1,471 | 17.5% |
| No Internet | 1,928 | 22.9% |
| Total | 8,422 | 100.0% |
Conway County Summary
Conway County is located in the central part of Arkansas, and is bordered by Faulkner County to the north, Pope County to the east, Perry County to the south, and Van Buren County to the west. The county seat is Morrilton, and the county has a total area of 602 square miles. As of the 2010 census, the population was 21,273, making it the 33rd most populous county in Arkansas.
Geography
Conway County is located in the Arkansas River Valley, and is characterized by rolling hills and valleys. The county is drained by the Cadron Creek, which flows through the center of the county. The highest point in the county is located in the northwest corner, at an elevation of 1,000 feet. The county is mostly covered in forest, with some agricultural land in the valleys.
Climate
Conway County has a humid subtropical climate, with hot, humid summers and mild winters. The average annual temperature is 63°F, and the average annual precipitation is 48 inches.
History
Conway County was formed in 1825 from a portion of Pulaski County. It was named for Henry Wharton Conway, a politician and soldier who served in the War of 1812. The county seat was established at Cadron in 1825, but was moved to Morrilton in 1876.
The county was largely rural until the early 20th century, when the timber industry began to develop. The timber industry was the main economic driver in the county until the 1950s, when the poultry industry began to take off. The poultry industry is still a major employer in the county today.
Economy
The economy of Conway County is largely based on agriculture and manufacturing. The county is home to several poultry processing plants, as well as a number of other food processing plants. The county also has a number of manufacturing plants, including a paper mill and a furniture factory.
The county is also home to several tourist attractions, including the Petit Jean State Park, the Arkansas River Valley Arts Center, and the Conway County Museum.
Demographics
As of the 2010 census, the population of Conway County was 21,273, with a population density of 35.3 people per square mile. The racial makeup of the county was 87.3% White, 9.2% Black or African American, 0.5% Native American, 0.4% Asian, 0.1% Pacific Islander, 1.2% from other races, and 1.3% from two or more races. Hispanic or Latino of any race were 2.7% of the population.
The median income for a household in the county was $35,945, and the median income for a family was $43,945. The per capita income for the county was $17,945. About 16.2% of the population was below the poverty line.
Conway County is served by the Morrilton School District, which includes four elementary schools, one middle school, and one high school. The county is also home to the University of Arkansas Community College at Morrilton, which offers associate degrees and certificate programs.
Common Questions
What is Per Capita Income in Conway County?
Per Capita income in Conway County is $28,694.
What is the Median Family Income in Conway County?
Median Family Income in Conway County is $61,839.
What is the Median Household income in Conway County?
Median Household Income in Conway County is $50,282.
What is Income or Wage Gap in Conway County?
Income or Wage Gap in Conway County is 38.2%.
Women in Conway County earn 61.8 cents for every dollar earned by a man.
What is Family Income Deficit in Conway County?
Family Income Deficit in Conway County is $11,489.
Families that are below poverty line in Conway County earn $11,489 less on average than the poverty threshold level.
What is Inequality or Gini Index in Conway County?
Inequality or Gini Index in Conway County is 0.47.
What is the Total Population of Conway County?
Total Population of Conway County is 20,782.
What is the Total Male Population of Conway County?
Total Male Population of Conway County is 10,354.
What is the Total Female Population of Conway County?
Total Female Population of Conway County is 10,428.
What is the Ratio of Males per 100 Females in Conway County?
There are 99.29 Males per 100 Females in Conway County.
What is the Ratio of Females per 100 Males in Conway County?
There are 100.71 Females per 100 Males in Conway County.
What is the Median Population Age in Conway County?
Median Population Age in Conway County is 42.2 Years.
What is the Average Family Size in Conway County
Average Family Size in Conway County is 3.0 People.
What is the Average Household Size in Conway County
Average Household Size in Conway County is 2.5 People.
How Large is the Labor Force in Conway County?
There are 9,644 People in the Labor Forcein in Conway County.
What is the Percentage of People in the Labor Force in Conway County?
58.3% of People are in the Labor Force in Conway County.
What is the Unemployment Rate in Conway County?
Unemployment Rate in Conway County is 7.1%.