Clark County, AR Map & Demographics
Clark County Map
Clark County Overview
$24,532
PER CAPITA INCOME
$66,543
AVG FAMILY INCOME
$48,071
AVG HOUSEHOLD INCOME
42.3%
WAGE / INCOME GAP [ % ]
57.7¢/ $1
WAGE / INCOME GAP [ $ ]
$10,621
FAMILY INCOME DEFICIT
0.45
INEQUALITY / GINI INDEX
21,469
TOTAL POPULATION
10,113
MALE POPULATION
11,356
FEMALE POPULATION
89.05
MALES / 100 FEMALES
112.29
FEMALES / 100 MALES
31.7
MEDIAN AGE
3.1
AVG FAMILY SIZE
2.4
AVG HOUSEHOLD SIZE
10,307
LABOR FORCE [ PEOPLE ]
58.0%
PERCENT IN LABOR FORCE
4.1%
UNEMPLOYMENT RATE
Clark County Area Codes
Income in Clark County
Income Overview in Clark County
Per Capita Income in Clark County is $24,532, while median incomes of families and households are $66,543 and $48,071 respectively.
| Characteristic | Number | Measure |
| Per Capita Income | 21,469 | $24,532 |
| Median Family Income | 4,829 | $66,543 |
| Mean Family Income | 4,829 | $80,668 |
| Median Household Income | 7,955 | $48,071 |
| Mean Household Income | 7,955 | $63,424 |
| Income Deficit | 4,829 | $10,621 |
| Wage / Income Gap (%) | 21,469 | 42.28% |
| Wage / Income Gap ($) | 21,469 | 57.72¢ per $1 |
| Gini / Inequality Index | 21,469 | 0.45 |
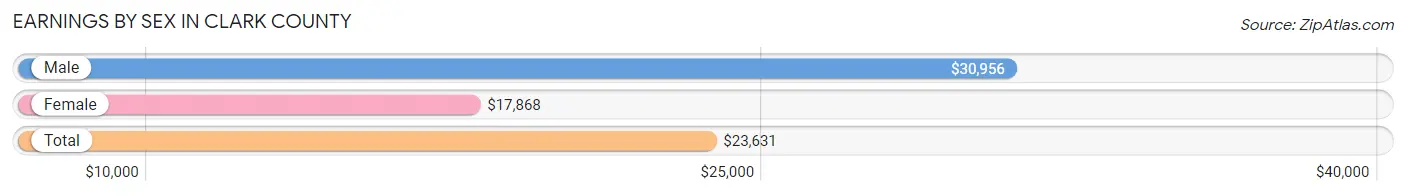
Earnings by Sex in Clark County
Average Earnings in Clark County are $23,631, $30,956 for men and $17,868 for women, a difference of 42.3%.
| Sex | Number | Average Earnings |
| Male | 5,718 (48.6%) | $30,956 |
| Female | 6,040 (51.4%) | $17,868 |
| Total | 11,758 (100.0%) | $23,631 |
Earnings by Sex by Income Bracket in Clark County
The most common earnings brackets in Clark County are $2,499 or less for men (511 | 8.9%) and $2,499 or less for women (771 | 12.8%).
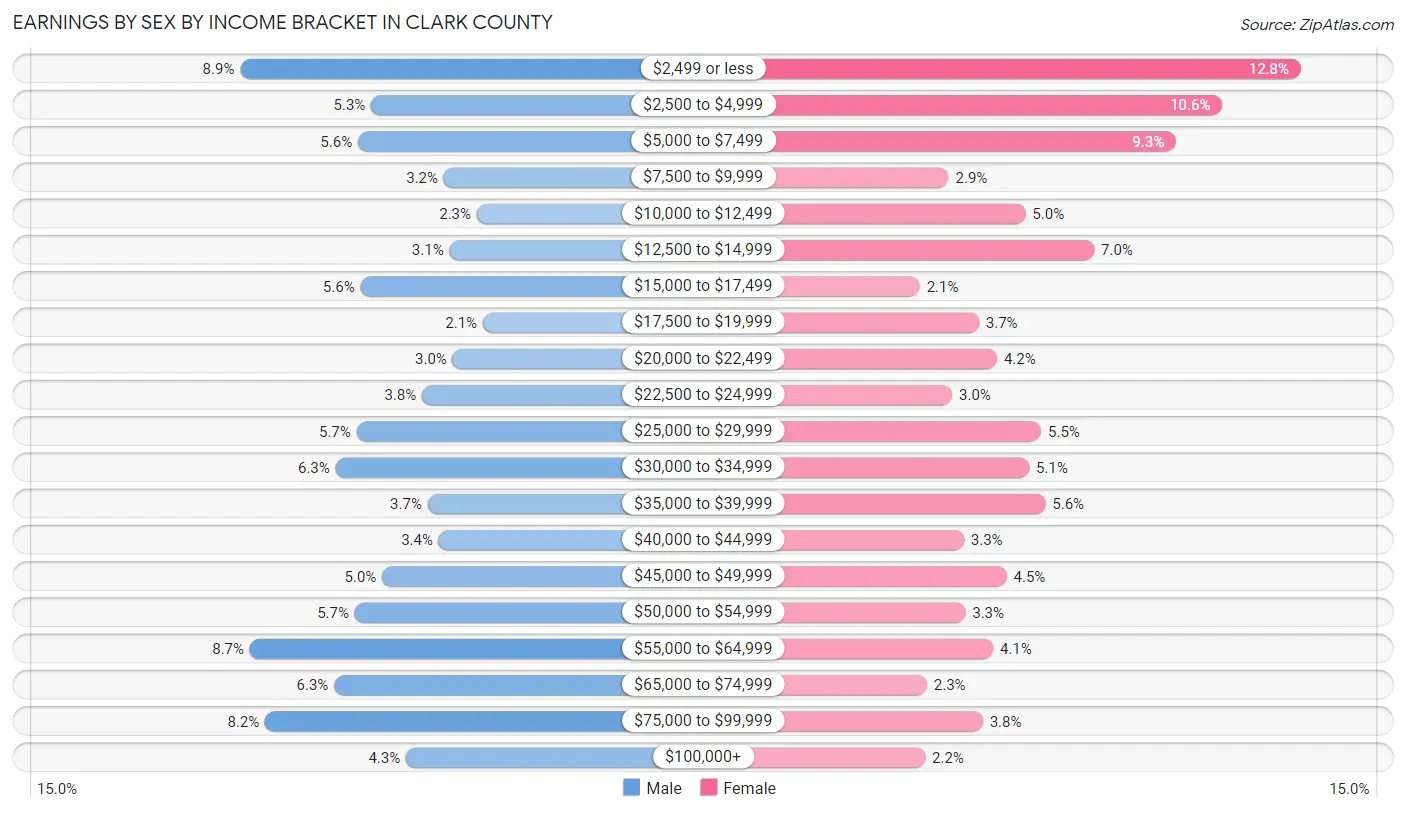
| Income | Male | Female |
| $2,499 or less | 511 (8.9%) | 771 (12.8%) |
| $2,500 to $4,999 | 301 (5.3%) | 637 (10.5%) |
| $5,000 to $7,499 | 322 (5.6%) | 559 (9.2%) |
| $7,500 to $9,999 | 184 (3.2%) | 173 (2.9%) |
| $10,000 to $12,499 | 131 (2.3%) | 303 (5.0%) |
| $12,500 to $14,999 | 175 (3.1%) | 420 (7.0%) |
| $15,000 to $17,499 | 318 (5.6%) | 124 (2.1%) |
| $17,500 to $19,999 | 121 (2.1%) | 224 (3.7%) |
| $20,000 to $22,499 | 170 (3.0%) | 255 (4.2%) |
| $22,500 to $24,999 | 219 (3.8%) | 179 (3.0%) |
| $25,000 to $29,999 | 324 (5.7%) | 330 (5.5%) |
| $30,000 to $34,999 | 358 (6.3%) | 309 (5.1%) |
| $35,000 to $39,999 | 210 (3.7%) | 337 (5.6%) |
| $40,000 to $44,999 | 192 (3.4%) | 199 (3.3%) |
| $45,000 to $49,999 | 283 (5.0%) | 271 (4.5%) |
| $50,000 to $54,999 | 327 (5.7%) | 201 (3.3%) |
| $55,000 to $64,999 | 496 (8.7%) | 248 (4.1%) |
| $65,000 to $74,999 | 360 (6.3%) | 136 (2.2%) |
| $75,000 to $99,999 | 471 (8.2%) | 231 (3.8%) |
| $100,000+ | 245 (4.3%) | 133 (2.2%) |
| Total | 5,718 (100.0%) | 6,040 (100.0%) |
Earnings by Sex by Educational Attainment in Clark County
Average earnings in Clark County are $45,954 for men and $30,058 for women, a difference of 34.6%. Men with an educational attainment of graduate degree enjoy the highest average annual earnings of $69,265, while those with less than high school education earn the least with $31,786. Women with an educational attainment of graduate degree earn the most with the average annual earnings of $52,500, while those with less than high school education have the smallest earnings of $14,130.
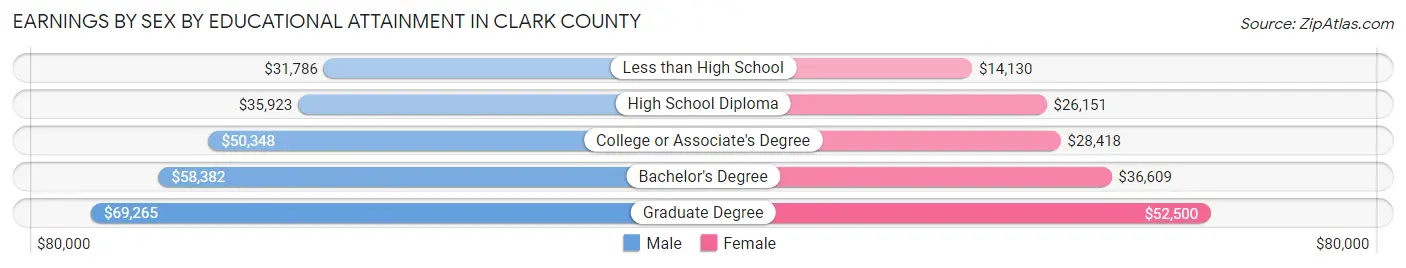
| Educational Attainment | Male Income | Female Income |
| Less than High School | $31,786 | $14,130 |
| High School Diploma | $35,923 | $26,151 |
| College or Associate's Degree | $50,348 | $28,418 |
| Bachelor's Degree | $58,382 | $36,609 |
| Graduate Degree | $69,265 | $52,500 |
| Total | $45,954 | $30,058 |
Family Income in Clark County
Family Income Brackets in Clark County
According to the Clark County family income data, there are 932 families falling into the $75,000 to $99,999 income range, which is the most common income bracket and makes up 19.3% of all families. Conversely, the $10,000 to $14,999 income bracket is the least frequent group with only 111 families (2.3%) belonging to this category.
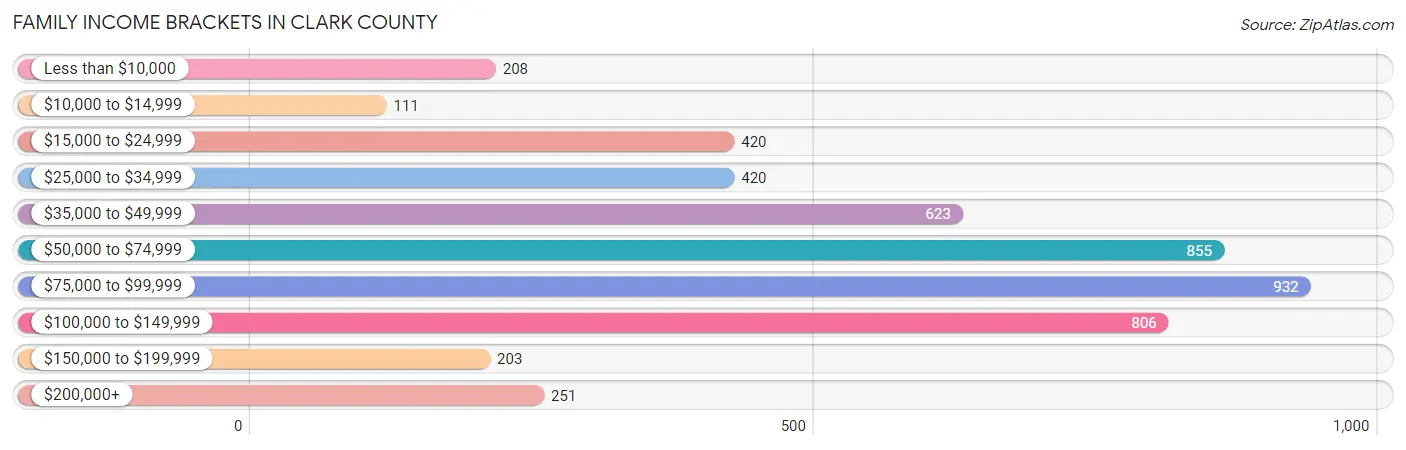
| Income Bracket | # Families | % Families |
| Less than $10,000 | 208 | 4.3% |
| $10,000 to $14,999 | 111 | 2.3% |
| $15,000 to $24,999 | 420 | 8.7% |
| $25,000 to $34,999 | 420 | 8.7% |
| $35,000 to $49,999 | 623 | 12.9% |
| $50,000 to $74,999 | 855 | 17.7% |
| $75,000 to $99,999 | 932 | 19.3% |
| $100,000 to $149,999 | 806 | 16.7% |
| $150,000 to $199,999 | 203 | 4.2% |
| $200,000+ | 251 | 5.2% |
Family Income by Famaliy Size in Clark County
4-person families (759 | 15.7%) account for the highest median family income in Clark County with $94,196 per family, while 2-person families (2,533 | 52.4%) have the highest median income of $30,382 per family member.
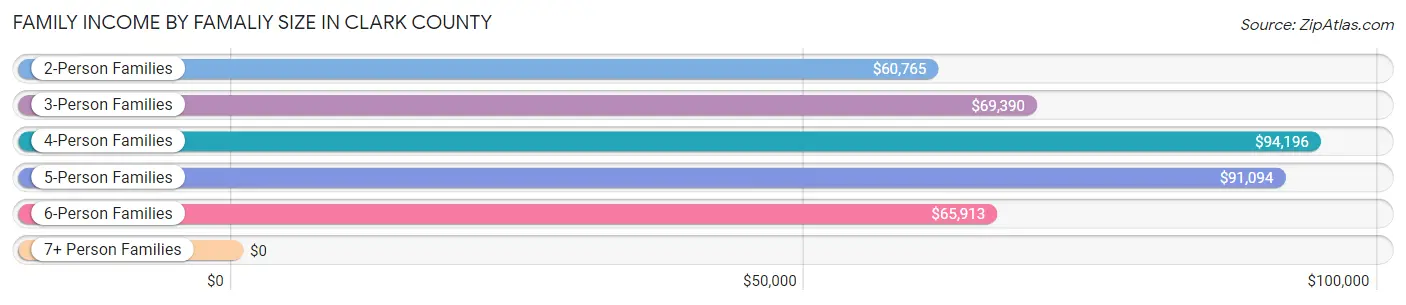
| Income Bracket | # Families | Median Income |
| 2-Person Families | 2,533 (52.4%) | $60,765 |
| 3-Person Families | 959 (19.9%) | $69,390 |
| 4-Person Families | 759 (15.7%) | $94,196 |
| 5-Person Families | 405 (8.4%) | $91,094 |
| 6-Person Families | 101 (2.1%) | $65,913 |
| 7+ Person Families | 72 (1.5%) | $0 |
| Total | 4,829 (100.0%) | $66,543 |
Family Income by Number of Earners in Clark County
The median family income in Clark County is $66,543, with families comprising 3+ earners (489) having the highest median family income of $119,033, while families with no earners (755) have the lowest median family income of $36,322, accounting for 10.1% and 15.6% of families, respectively.
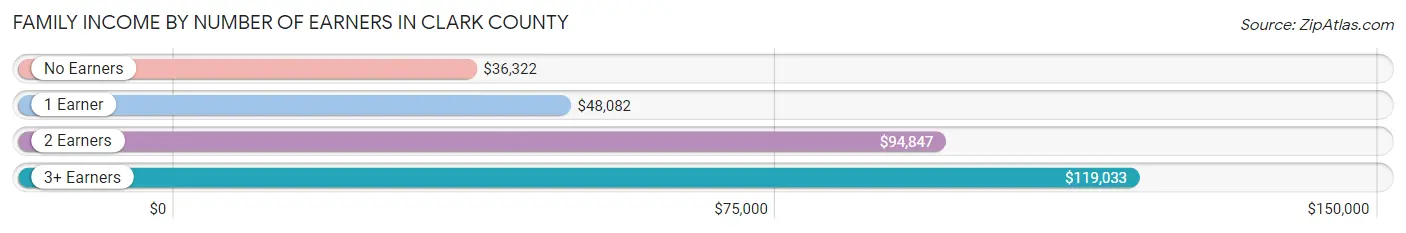
| Number of Earners | # Families | Median Income |
| No Earners | 755 (15.6%) | $36,322 |
| 1 Earner | 1,968 (40.7%) | $48,082 |
| 2 Earners | 1,617 (33.5%) | $94,847 |
| 3+ Earners | 489 (10.1%) | $119,033 |
| Total | 4,829 (100.0%) | $66,543 |
Household Income in Clark County
Household Income Brackets in Clark County
With 1,241 households falling in the category, the $50,000 to $74,999 income range is the most frequent in Clark County, accounting for 15.6% of all households. In contrast, only 215 households (2.7%) fall into the $150,000 to $199,999 income bracket, making it the least populous group.
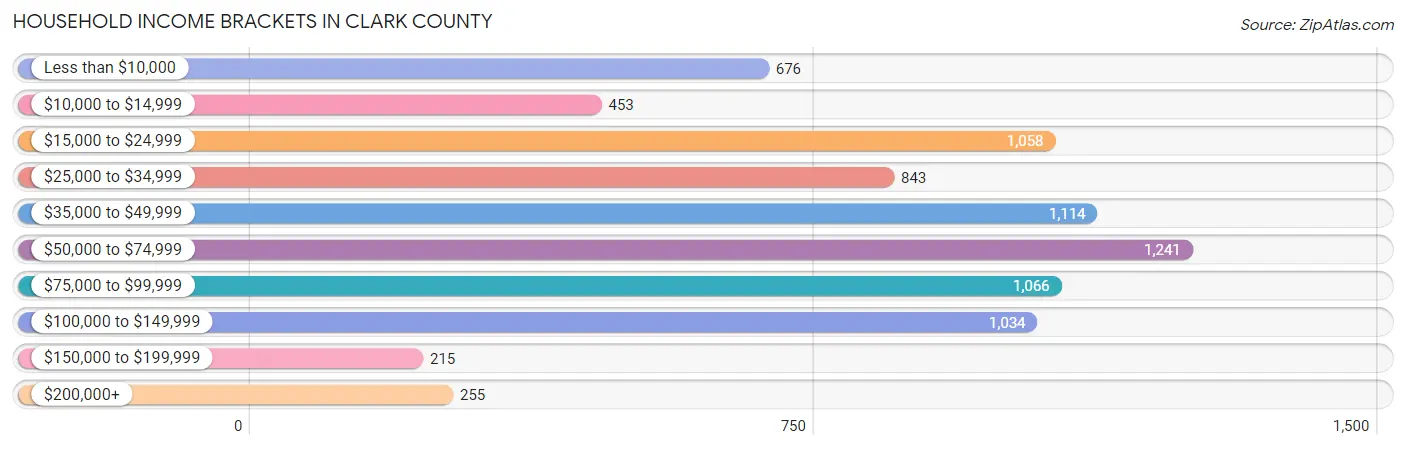
| Income Bracket | # Households | % Households |
| Less than $10,000 | 676 | 8.5% |
| $10,000 to $14,999 | 453 | 5.7% |
| $15,000 to $24,999 | 1,058 | 13.3% |
| $25,000 to $34,999 | 843 | 10.6% |
| $35,000 to $49,999 | 1,114 | 14.0% |
| $50,000 to $74,999 | 1,241 | 15.6% |
| $75,000 to $99,999 | 1,066 | 13.4% |
| $100,000 to $149,999 | 1,034 | 13.0% |
| $150,000 to $199,999 | 215 | 2.7% |
| $200,000+ | 255 | 3.2% |
Household Income by Householder Age in Clark County
The median household income in Clark County is $48,071, with the highest median household income of $63,921 found in the 45 to 64 years age bracket for the primary householder. A total of 2,671 households (33.6%) fall into this category. Meanwhile, the 15 to 24 years age bracket for the primary householder has the lowest median household income of $24,648, with 895 households (11.3%) in this group.
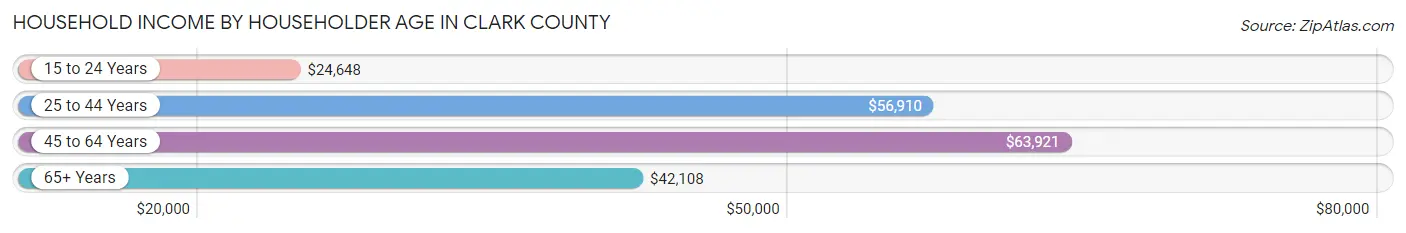
| Income Bracket | # Households | Median Income |
| 15 to 24 Years | 895 (11.3%) | $24,648 |
| 25 to 44 Years | 2,183 (27.4%) | $56,910 |
| 45 to 64 Years | 2,671 (33.6%) | $63,921 |
| 65+ Years | 2,206 (27.7%) | $42,108 |
| Total | 7,955 (100.0%) | $48,071 |
Poverty in Clark County
Income Below Poverty by Sex and Age in Clark County
With 17.5% poverty level for males and 22.3% for females among the residents of Clark County, 18 to 24 year old males and under 5 year old females are the most vulnerable to poverty, with 599 males (38.9%) and 280 females (46.8%) in their respective age groups living below the poverty level.
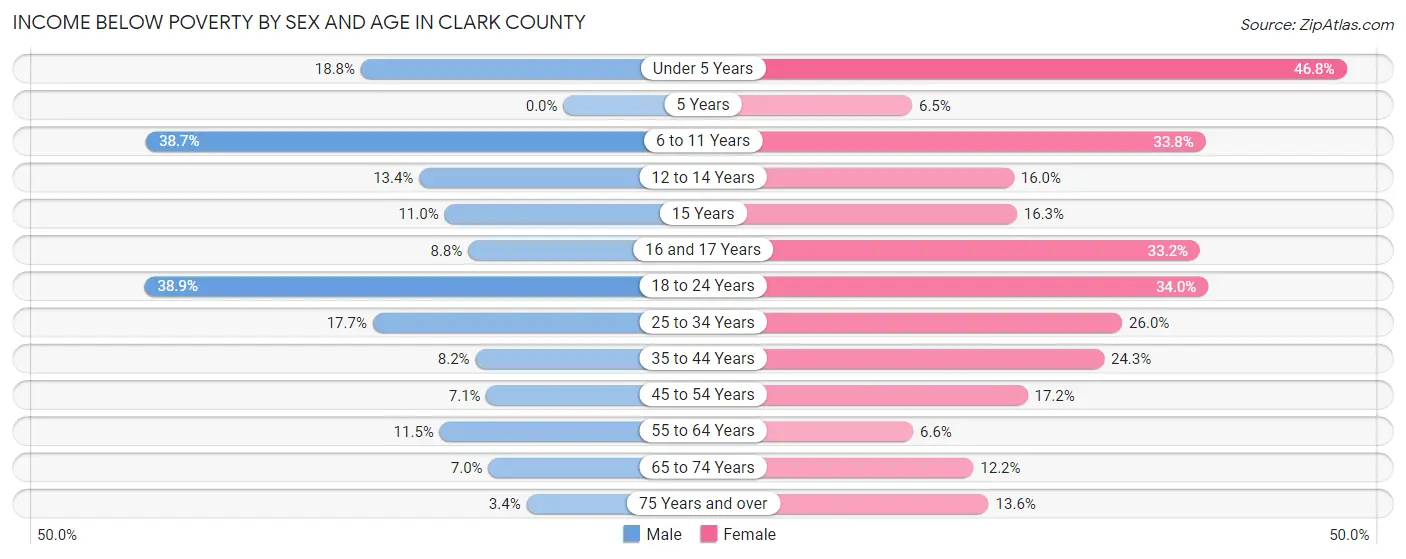
| Age Bracket | Male | Female |
| Under 5 Years | 90 (18.8%) | 280 (46.8%) |
| 5 Years | 0 (0.0%) | 3 (6.5%) |
| 6 to 11 Years | 266 (38.7%) | 236 (33.8%) |
| 12 to 14 Years | 59 (13.4%) | 69 (16.0%) |
| 15 Years | 15 (11.0%) | 13 (16.3%) |
| 16 and 17 Years | 13 (8.8%) | 103 (33.2%) |
| 18 to 24 Years | 599 (38.9%) | 409 (34.0%) |
| 25 to 34 Years | 224 (17.7%) | 281 (26.0%) |
| 35 to 44 Years | 67 (8.2%) | 296 (24.3%) |
| 45 to 54 Years | 72 (7.1%) | 187 (17.2%) |
| 55 to 64 Years | 128 (11.5%) | 83 (6.6%) |
| 65 to 74 Years | 63 (7.0%) | 126 (12.2%) |
| 75 Years and over | 20 (3.4%) | 110 (13.6%) |
| Total | 1,616 (17.5%) | 2,196 (22.3%) |
Income Above Poverty by Sex and Age in Clark County
According to the poverty statistics in Clark County, males aged 5 years and females aged 5 years are the age groups that are most secure financially, with 100.0% of males and 93.5% of females in these age groups living above the poverty line.
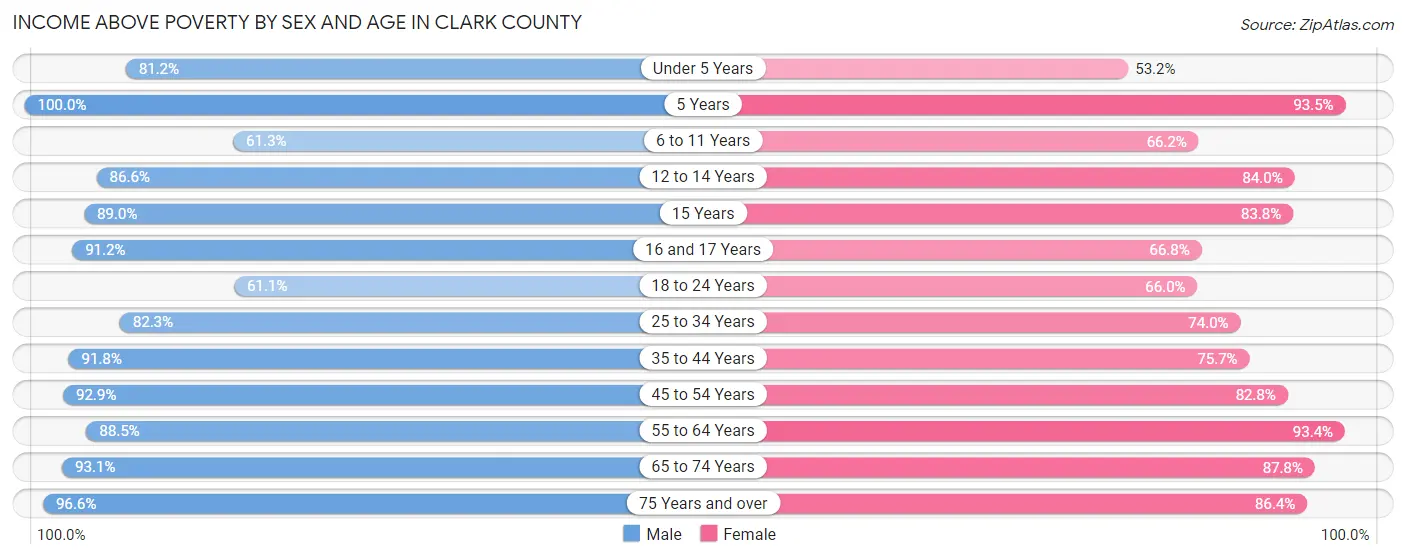
| Age Bracket | Male | Female |
| Under 5 Years | 389 (81.2%) | 318 (53.2%) |
| 5 Years | 96 (100.0%) | 43 (93.5%) |
| 6 to 11 Years | 421 (61.3%) | 463 (66.2%) |
| 12 to 14 Years | 382 (86.6%) | 363 (84.0%) |
| 15 Years | 121 (89.0%) | 67 (83.8%) |
| 16 and 17 Years | 134 (91.2%) | 207 (66.8%) |
| 18 to 24 Years | 942 (61.1%) | 794 (66.0%) |
| 25 to 34 Years | 1,042 (82.3%) | 799 (74.0%) |
| 35 to 44 Years | 754 (91.8%) | 920 (75.7%) |
| 45 to 54 Years | 936 (92.9%) | 898 (82.8%) |
| 55 to 64 Years | 987 (88.5%) | 1,170 (93.4%) |
| 65 to 74 Years | 844 (93.0%) | 906 (87.8%) |
| 75 Years and over | 565 (96.6%) | 697 (86.4%) |
| Total | 7,613 (82.5%) | 7,645 (77.7%) |
Income Below Poverty Among Married-Couple Families in Clark County
The poverty statistics for married-couple families in Clark County show that 6.2% or 221 of the total 3,590 families live below the poverty line. Families with 3 or 4 children have the highest poverty rate of 15.8%, comprising of 41 families. On the other hand, families with 5 or more children have the lowest poverty rate of 0.0%, which includes 0 families.
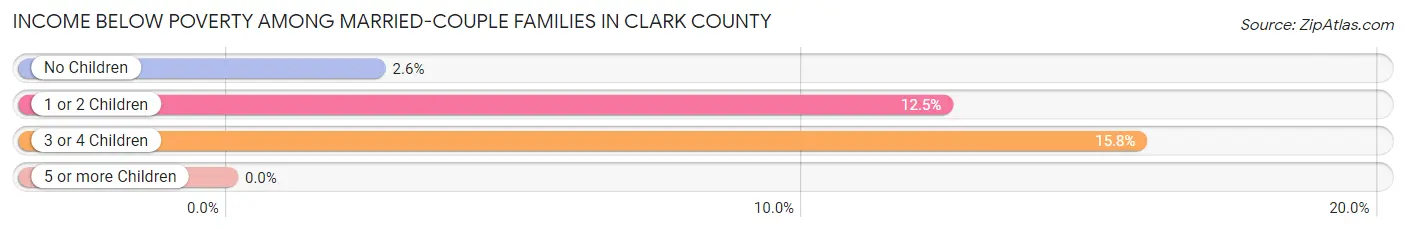
| Children | Above Poverty | Below Poverty |
| No Children | 2,241 (97.4%) | 59 (2.6%) |
| 1 or 2 Children | 851 (87.5%) | 121 (12.4%) |
| 3 or 4 Children | 218 (84.2%) | 41 (15.8%) |
| 5 or more Children | 59 (100.0%) | 0 (0.0%) |
| Total | 3,369 (93.8%) | 221 (6.2%) |
Income Below Poverty Among Single-Parent Households in Clark County
According to the poverty data in Clark County, 32.5% or 89 single-father households and 32.8% or 316 single-mother households are living below the poverty line. Among single-father households, those with 3 or 4 children have the highest poverty rate, with 24 households (75.0%) experiencing poverty. Likewise, among single-mother households, those with 3 or 4 children have the highest poverty rate, with 66 households (80.5%) falling below the poverty line.
| Children | Single Father | Single Mother |
| No Children | 29 (24.0%) | 55 (14.4%) |
| 1 or 2 Children | 36 (29.7%) | 195 (40.5%) |
| 3 or 4 Children | 24 (75.0%) | 66 (80.5%) |
| 5 or more Children | 0 (0.0%) | 0 (0.0%) |
| Total | 89 (32.5%) | 316 (32.8%) |
Income Below Poverty Among Married-Couple vs Single-Parent Households in Clark County
The poverty data for Clark County shows that 221 of the married-couple family households (6.2%) and 405 of the single-parent households (32.7%) are living below the poverty level. Within the married-couple family households, those with 3 or 4 children have the highest poverty rate, with 41 households (15.8%) falling below the poverty line. Among the single-parent households, those with 3 or 4 children have the highest poverty rate, with 90 household (78.9%) living below poverty.
| Children | Married-Couple Families | Single-Parent Households |
| No Children | 59 (2.6%) | 84 (16.7%) |
| 1 or 2 Children | 121 (12.4%) | 231 (38.4%) |
| 3 or 4 Children | 41 (15.8%) | 90 (78.9%) |
| 5 or more Children | 0 (0.0%) | 0 (0.0%) |
| Total | 221 (6.2%) | 405 (32.7%) |
Race in Clark County
The most populous races in Clark County are White / Caucasian (14,848 | 69.2%), Black / African American (5,157 | 24.0%), and Hispanic or Latino (1,092 | 5.1%).
| Race | # Population | % Population |
| Asian | 140 | 0.6% |
| Black / African American | 5,157 | 24.0% |
| Hawaiian / Pacific | 9 | 0.0% |
| Hispanic or Latino | 1,092 | 5.1% |
| Native / Alaskan | 17 | 0.1% |
| White / Caucasian | 14,848 | 69.2% |
| Two or more Races | 698 | 3.3% |
| Some other Race | 600 | 2.8% |
| Total | 21,469 | 100.0% |
Ancestry in Clark County
The most populous ancestries reported in Clark County are English (1,862 | 8.7%), Irish (1,848 | 8.6%), American (1,791 | 8.3%), German (1,153 | 5.4%), and Mexican (825 | 3.8%), together accounting for 34.8% of all Clark County residents.
| Ancestry | # Population | % Population |
| African | 57 | 0.3% |
| American | 1,791 | 8.3% |
| Belgian | 7 | 0.0% |
| Bhutanese | 26 | 0.1% |
| Blackfeet | 5 | 0.0% |
| British | 138 | 0.6% |
| Burmese | 13 | 0.1% |
| Cajun | 4 | 0.0% |
| Canadian | 4 | 0.0% |
| Central American | 43 | 0.2% |
| Cherokee | 41 | 0.2% |
| Chickasaw | 13 | 0.1% |
| Chilean | 3 | 0.0% |
| Choctaw | 25 | 0.1% |
| Colombian | 90 | 0.4% |
| Costa Rican | 13 | 0.1% |
| Creek | 15 | 0.1% |
| Cuban | 19 | 0.1% |
| Czech | 27 | 0.1% |
| Czechoslovakian | 100 | 0.5% |
| Danish | 17 | 0.1% |
| Dutch | 185 | 0.9% |
| Ecuadorian | 12 | 0.1% |
| English | 1,862 | 8.7% |
| European | 278 | 1.3% |
| Finnish | 1 | 0.0% |
| French | 449 | 2.1% |
| French Canadian | 101 | 0.5% |
| German | 1,153 | 5.4% |
| Ghanaian | 6 | 0.0% |
| Greek | 3 | 0.0% |
| Guatemalan | 7 | 0.0% |
| Honduran | 13 | 0.1% |
| Hungarian | 22 | 0.1% |
| Indian (Asian) | 116 | 0.5% |
| Irish | 1,848 | 8.6% |
| Italian | 241 | 1.1% |
| Korean | 4 | 0.0% |
| Lithuanian | 5 | 0.0% |
| Mexican | 825 | 3.8% |
| Native Hawaiian | 3 | 0.0% |
| Nigerian | 4 | 0.0% |
| Northern European | 16 | 0.1% |
| Norwegian | 72 | 0.3% |
| Pennsylvania German | 18 | 0.1% |
| Peruvian | 36 | 0.2% |
| Polish | 24 | 0.1% |
| Puerto Rican | 25 | 0.1% |
| Romanian | 8 | 0.0% |
| Russian | 65 | 0.3% |
| Salvadoran | 10 | 0.1% |
| Scandinavian | 20 | 0.1% |
| Scotch-Irish | 138 | 0.6% |
| Scottish | 401 | 1.9% |
| Slovak | 4 | 0.0% |
| South American | 153 | 0.7% |
| Spanish | 5 | 0.0% |
| Sri Lankan | 8 | 0.0% |
| Subsaharan African | 70 | 0.3% |
| Swedish | 32 | 0.2% |
| Swiss | 4 | 0.0% |
| Thai | 21 | 0.1% |
| Ukrainian | 2 | 0.0% |
| Uruguayan | 12 | 0.1% |
| Welsh | 41 | 0.2% | View All 65 Rows |
Immigrants in Clark County
The most numerous immigrant groups reported in Clark County came from Latin America (258 | 1.2%), Central America (243 | 1.1%), Mexico (224 | 1.0%), Asia (123 | 0.6%), and Eastern Asia (123 | 0.6%), together accounting for 4.5% of all Clark County residents.
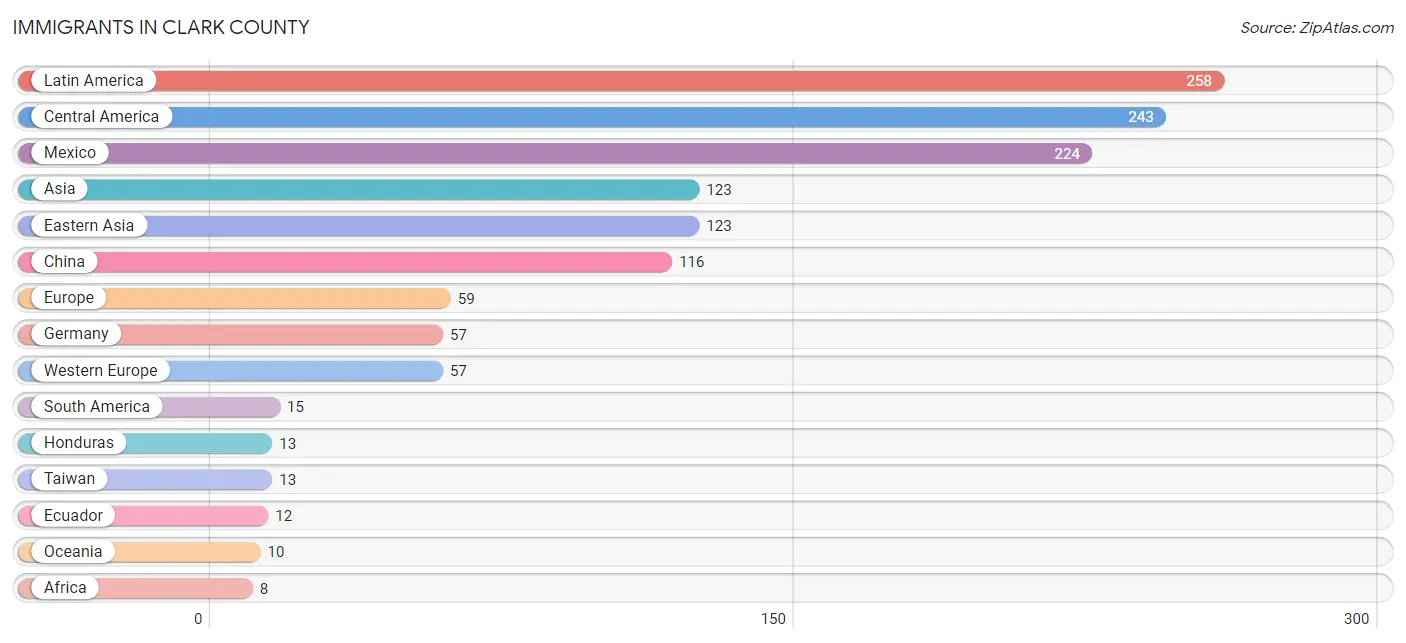
| Immigration Origin | # Population | % Population |
| Africa | 8 | 0.0% |
| Asia | 123 | 0.6% |
| Australia | 4 | 0.0% |
| Canada | 6 | 0.0% |
| Central America | 243 | 1.1% |
| Chile | 3 | 0.0% |
| China | 116 | 0.5% |
| Eastern Asia | 123 | 0.6% |
| Eastern Europe | 2 | 0.0% |
| Ecuador | 12 | 0.1% |
| El Salvador | 6 | 0.0% |
| Europe | 59 | 0.3% |
| Fiji | 6 | 0.0% |
| Germany | 57 | 0.3% |
| Ghana | 6 | 0.0% |
| Honduras | 13 | 0.1% |
| Japan | 7 | 0.0% |
| Latin America | 258 | 1.2% |
| Mexico | 224 | 1.0% |
| Oceania | 10 | 0.1% |
| South America | 15 | 0.1% |
| Taiwan | 13 | 0.1% |
| Ukraine | 2 | 0.0% |
| Western Africa | 8 | 0.0% |
| Western Europe | 57 | 0.3% | View All 25 Rows |
Sex and Age in Clark County
Sex and Age in Clark County
The most populous age groups in Clark County are 20 to 24 Years (1,596 | 15.8%) for men and 20 to 24 Years (1,701 | 15.0%) for women.
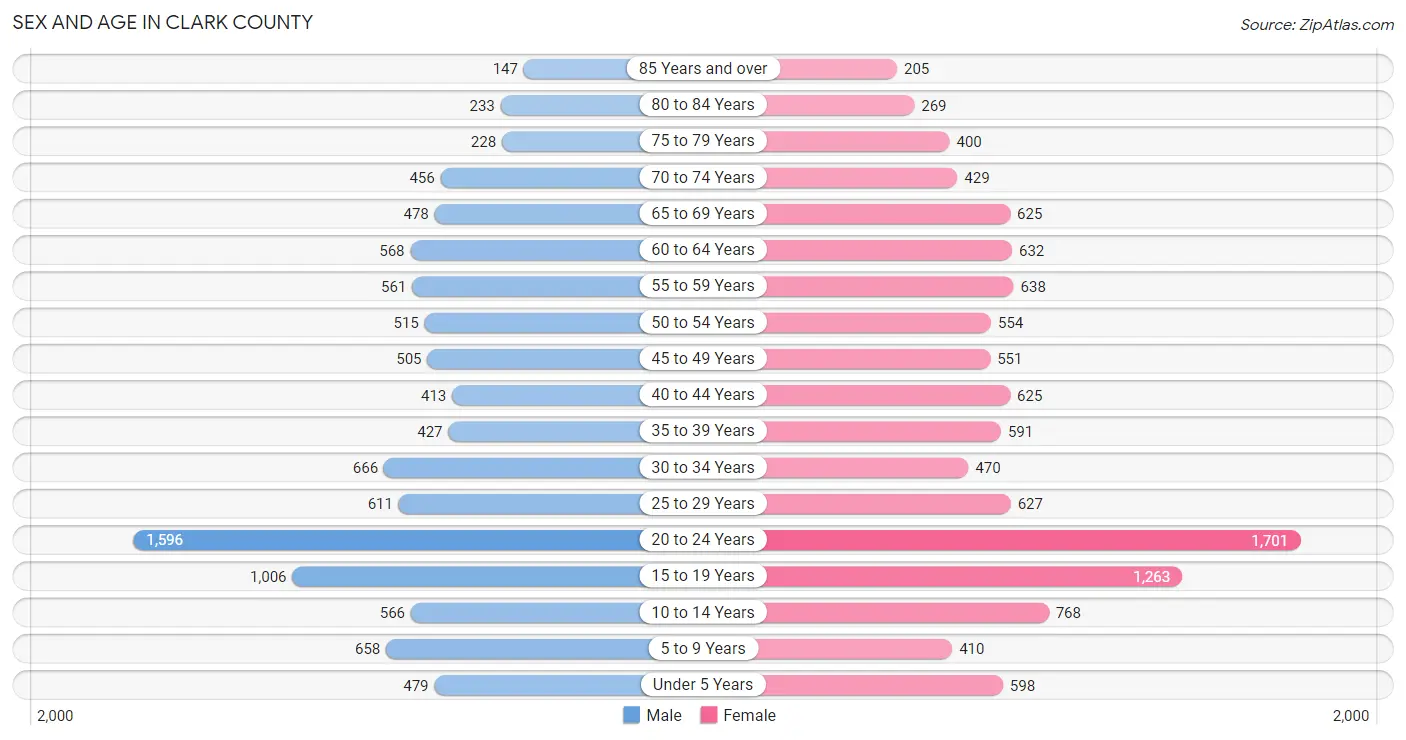
| Age Bracket | Male | Female |
| Under 5 Years | 479 (4.7%) | 598 (5.3%) |
| 5 to 9 Years | 658 (6.5%) | 410 (3.6%) |
| 10 to 14 Years | 566 (5.6%) | 768 (6.8%) |
| 15 to 19 Years | 1,006 (10.0%) | 1,263 (11.1%) |
| 20 to 24 Years | 1,596 (15.8%) | 1,701 (15.0%) |
| 25 to 29 Years | 611 (6.0%) | 627 (5.5%) |
| 30 to 34 Years | 666 (6.6%) | 470 (4.1%) |
| 35 to 39 Years | 427 (4.2%) | 591 (5.2%) |
| 40 to 44 Years | 413 (4.1%) | 625 (5.5%) |
| 45 to 49 Years | 505 (5.0%) | 551 (4.9%) |
| 50 to 54 Years | 515 (5.1%) | 554 (4.9%) |
| 55 to 59 Years | 561 (5.6%) | 638 (5.6%) |
| 60 to 64 Years | 568 (5.6%) | 632 (5.6%) |
| 65 to 69 Years | 478 (4.7%) | 625 (5.5%) |
| 70 to 74 Years | 456 (4.5%) | 429 (3.8%) |
| 75 to 79 Years | 228 (2.2%) | 400 (3.5%) |
| 80 to 84 Years | 233 (2.3%) | 269 (2.4%) |
| 85 Years and over | 147 (1.5%) | 205 (1.8%) |
| Total | 10,113 (100.0%) | 11,356 (100.0%) |
Families and Households in Clark County
Median Family Size in Clark County
The median family size in Clark County is 3.06 persons per family, with single female/mother families (965 | 20.0%) accounting for the largest median family size of 3.08 persons per family. On the other hand, married-couple families (3,590 | 74.3%) represent the smallest median family size with 3.05 persons per family.
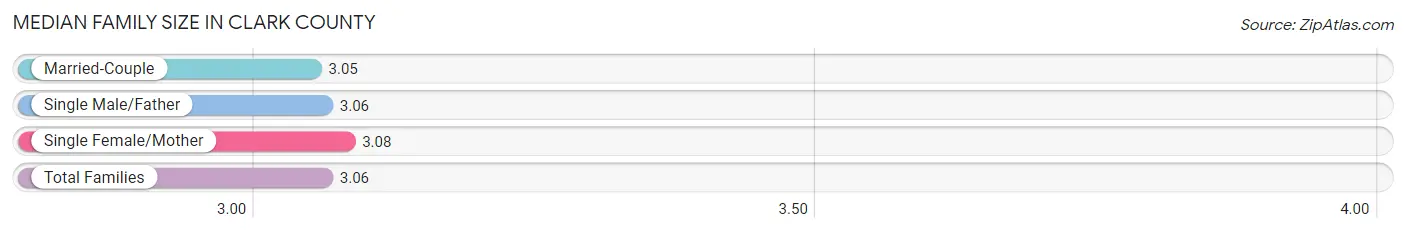
| Family Type | # Families | Family Size |
| Married-Couple | 3,590 (74.3%) | 3.05 |
| Single Male/Father | 274 (5.7%) | 3.06 |
| Single Female/Mother | 965 (20.0%) | 3.08 |
| Total Families | 4,829 (100.0%) | 3.06 |
Median Household Size in Clark County
The median household size in Clark County is 2.38 persons per household, with single male/father households (274 | 3.4%) accounting for the largest median household size of 3.23 persons per household. non-family households (3,126 | 39.3%) represent the smallest median household size with 1.27 persons per household.
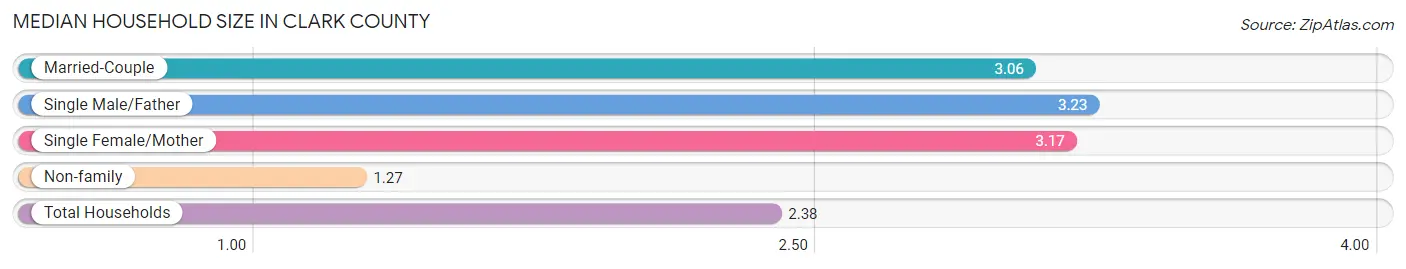
| Household Type | # Households | Household Size |
| Married-Couple | 3,590 (45.1%) | 3.06 |
| Single Male/Father | 274 (3.4%) | 3.23 |
| Single Female/Mother | 965 (12.1%) | 3.17 |
| Non-family | 3,126 (39.3%) | 1.27 |
| Total Households | 7,955 (100.0%) | 2.38 |
Household Size by Marriage Status in Clark County
Out of a total of 7,955 households in Clark County, 4,829 (60.7%) are family households, while 3,126 (39.3%) are nonfamily households. The most numerous type of family households are 2-person households, comprising 2,460, and the most common type of nonfamily households are 1-person households, comprising 2,381.
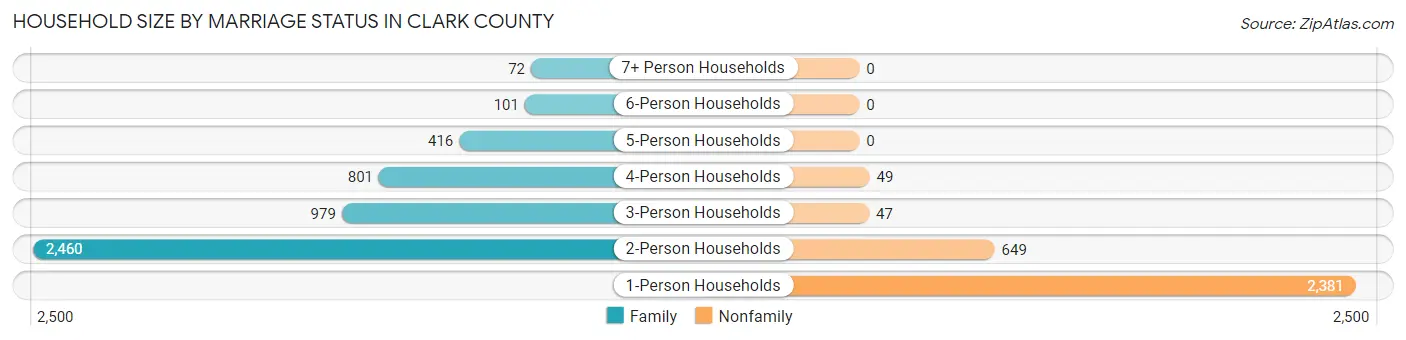
| Household Size | Family Households | Nonfamily Households |
| 1-Person Households | - | 2,381 (29.9%) |
| 2-Person Households | 2,460 (30.9%) | 649 (8.2%) |
| 3-Person Households | 979 (12.3%) | 47 (0.6%) |
| 4-Person Households | 801 (10.1%) | 49 (0.6%) |
| 5-Person Households | 416 (5.2%) | 0 (0.0%) |
| 6-Person Households | 101 (1.3%) | 0 (0.0%) |
| 7+ Person Households | 72 (0.9%) | 0 (0.0%) |
| Total | 4,829 (60.7%) | 3,126 (39.3%) |
Female Fertility in Clark County
Fertility by Age in Clark County
Average fertility rate in Clark County is 40.0 births per 1,000 women. Women in the age bracket of 20 to 34 years have the highest fertility rate with 59.0 births per 1,000 women. Women in the age bracket of 20 to 34 years acount for 70.1% of all women with births.
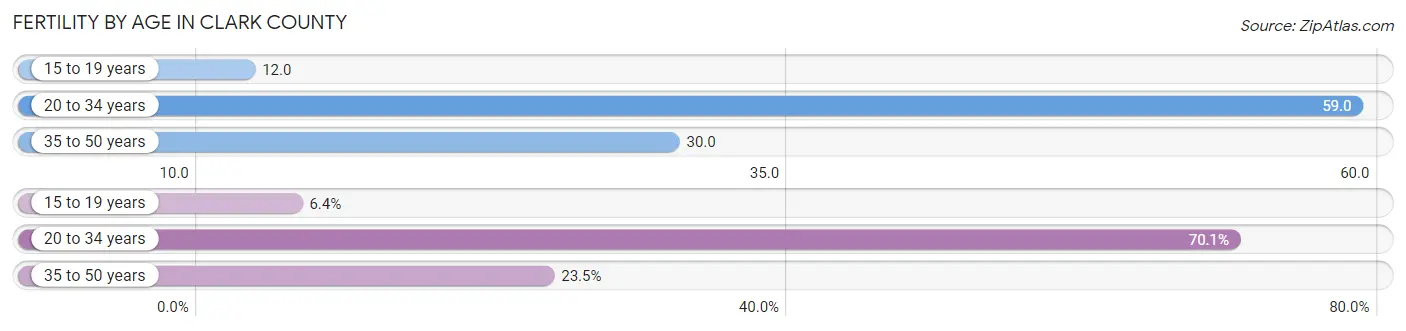
| Age Bracket | Women with Births | Births / 1,000 Women |
| 15 to 19 years | 15 (6.4%) | 12.0 |
| 20 to 34 years | 164 (70.1%) | 59.0 |
| 35 to 50 years | 55 (23.5%) | 30.0 |
| Total | 234 (100.0%) | 40.0 |
Fertility by Age by Marriage Status in Clark County
72.2% of women with births (234) in Clark County are married. The highest percentage of unmarried women with births falls into 15 to 19 years age bracket with 40.0% of them unmarried at the time of birth, while the lowest percentage of unmarried women with births belong to 20 to 34 years age bracket with 26.2% of them unmarried.
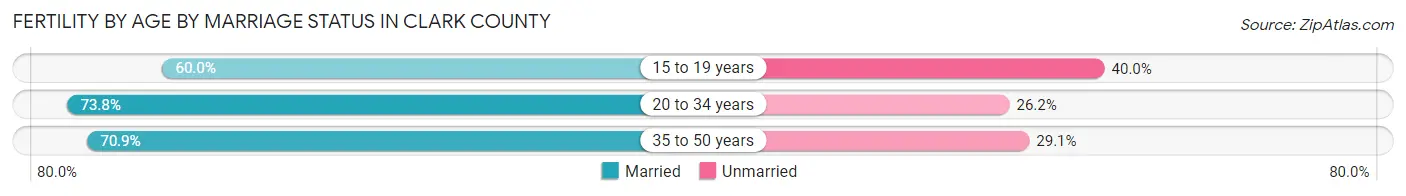
| Age Bracket | Married | Unmarried |
| 15 to 19 years | 9 (60.0%) | 6 (40.0%) |
| 20 to 34 years | 121 (73.8%) | 43 (26.2%) |
| 35 to 50 years | 39 (70.9%) | 16 (29.1%) |
| Total | 169 (72.2%) | 65 (27.8%) |
Fertility by Education in Clark County
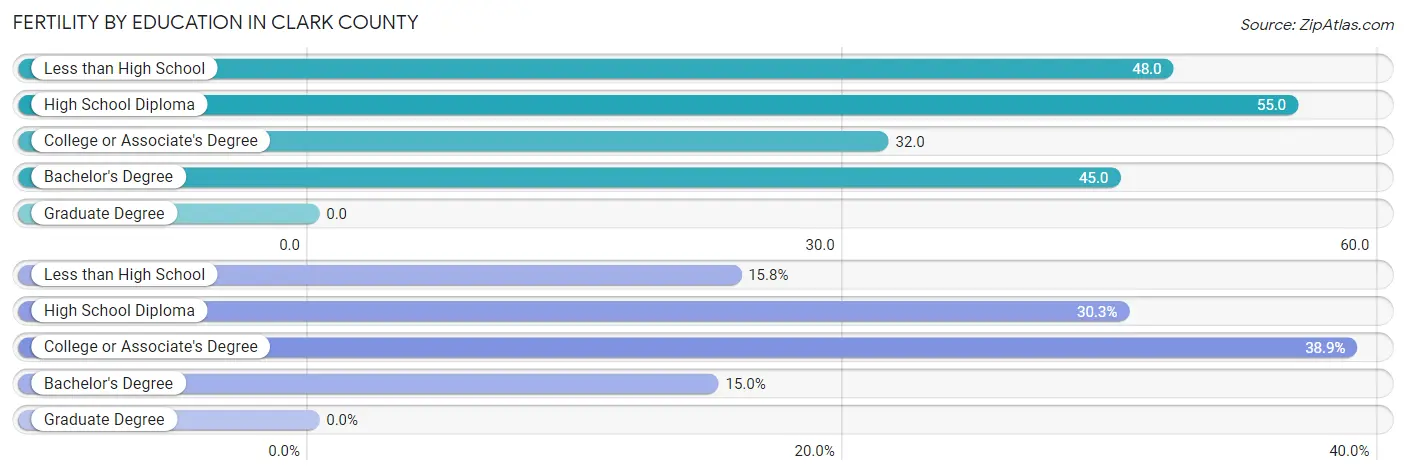
| Educational Attainment | Women with Births | Births / 1,000 Women |
| Less than High School | 37 (15.8%) | 48.0 |
| High School Diploma | 71 (30.3%) | 55.0 |
| College or Associate's Degree | 91 (38.9%) | 32.0 |
| Bachelor's Degree | 35 (15.0%) | 45.0 |
| Graduate Degree | 0 (0.0%) | 0.0 |
| Total | 234 (100.0%) | 40.0 |
Fertility by Education by Marriage Status in Clark County
27.8% of women with births in Clark County are unmarried. Women with the educational attainment of less than high school are most likely to be married with 86.5% of them married at childbirth, while women with the educational attainment of college or associate's degree are least likely to be married with 35.2% of them unmarried at childbirth.
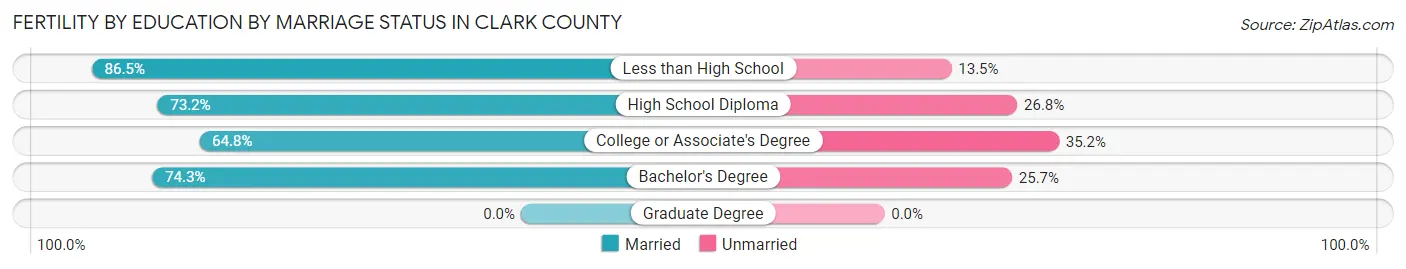
| Educational Attainment | Married | Unmarried |
| Less than High School | 32 (86.5%) | 5 (13.5%) |
| High School Diploma | 52 (73.2%) | 19 (26.8%) |
| College or Associate's Degree | 59 (64.8%) | 32 (35.2%) |
| Bachelor's Degree | 26 (74.3%) | 9 (25.7%) |
| Graduate Degree | 0 (0.0%) | 0 (0.0%) |
| Total | 169 (72.2%) | 65 (27.8%) |
Employment Characteristics in Clark County
Employment by Class of Employer in Clark County
Among the 9,777 employed individuals in Clark County, private company employees (6,694 | 68.5%), state government employees (898 | 9.2%), and not-for-profit organizations (838 | 8.6%) make up the most common classes of employment.
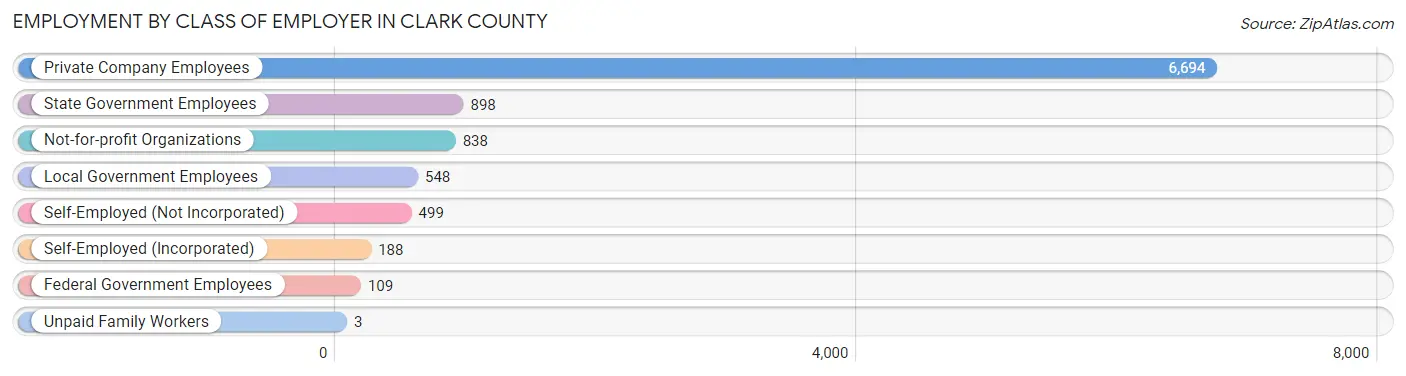
| Employer Class | # Employees | % Employees |
| Private Company Employees | 6,694 | 68.5% |
| Self-Employed (Incorporated) | 188 | 1.9% |
| Self-Employed (Not Incorporated) | 499 | 5.1% |
| Not-for-profit Organizations | 838 | 8.6% |
| Local Government Employees | 548 | 5.6% |
| State Government Employees | 898 | 9.2% |
| Federal Government Employees | 109 | 1.1% |
| Unpaid Family Workers | 3 | 0.0% |
| Total | 9,777 | 100.0% |
Employment Status by Age in Clark County
According to the labor force statistics for Clark County, out of the total population over 16 years of age (17,770), 58.0% or 10,307 individuals are in the labor force, with 4.1% or 423 of them unemployed. The age group with the highest labor force participation rate is 35 to 44 years, with 82.0% or 1,686 individuals in the labor force. Within the labor force, the 16 to 19 years age range has the highest percentage of unemployed individuals, with 13.9% or 131 of them being unemployed.
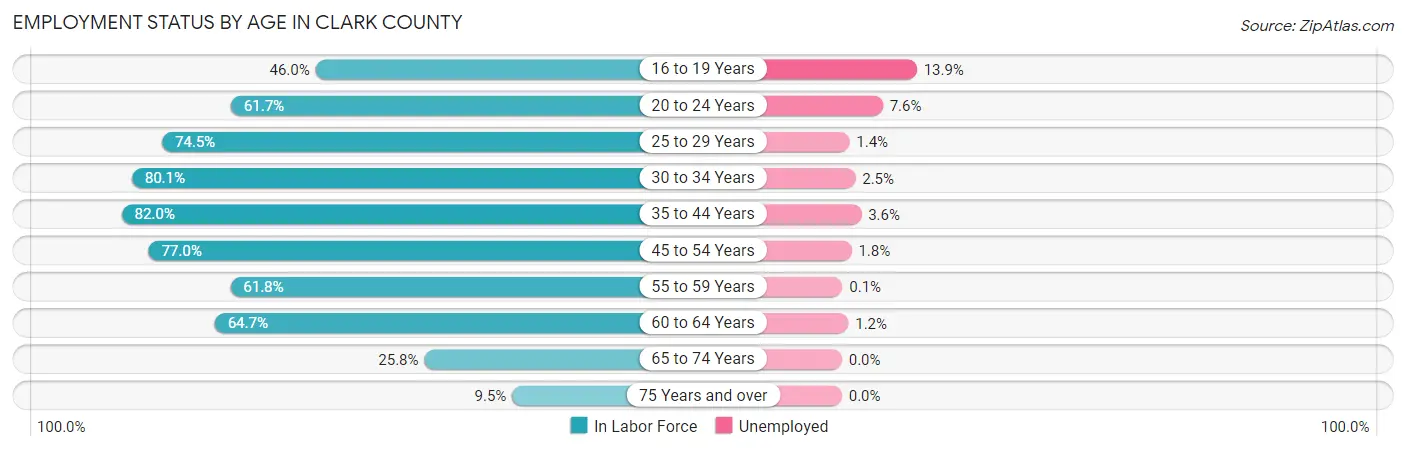
| Age Bracket | In Labor Force | Unemployed |
| 16 to 19 Years | 943 (46.0%) | 131 (13.9%) |
| 20 to 24 Years | 2,034 (61.7%) | 155 (7.6%) |
| 25 to 29 Years | 922 (74.5%) | 13 (1.4%) |
| 30 to 34 Years | 910 (80.1%) | 23 (2.5%) |
| 35 to 44 Years | 1,686 (82.0%) | 61 (3.6%) |
| 45 to 54 Years | 1,636 (77.0%) | 29 (1.8%) |
| 55 to 59 Years | 741 (61.8%) | 1 (0.1%) |
| 60 to 64 Years | 776 (64.7%) | 9 (1.2%) |
| 65 to 74 Years | 513 (25.8%) | 0 (0.0%) |
| 75 Years and over | 141 (9.5%) | 0 (0.0%) |
| Total | 10,307 (58.0%) | 423 (4.1%) |
Employment Status by Educational Attainment in Clark County
According to labor force statistics for Clark County, 74.5% of individuals (6,671) out of the total population between 25 and 64 years of age (8,954) are in the labor force, with 2.0% or 133 of them being unemployed. The group with the highest labor force participation rate are those with the educational attainment of bachelor's degree or higher, with 82.5% or 1,930 individuals in the labor force. Within the labor force, individuals with college / associate degree education have the highest percentage of unemployment, with 3.6% or 81 of them being unemployed.
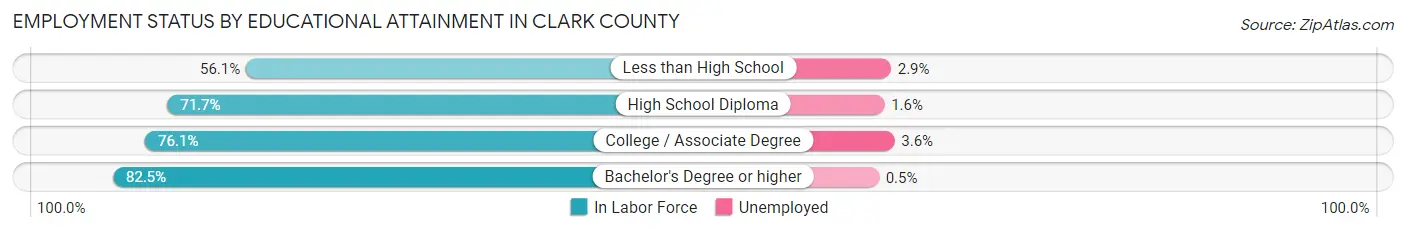
| Educational Attainment | In Labor Force | Unemployed |
| Less than High School | 487 (56.1%) | 25 (2.9%) |
| High School Diploma | 2,005 (71.7%) | 45 (1.6%) |
| College / Associate Degree | 2,246 (76.1%) | 106 (3.6%) |
| Bachelor's Degree or higher | 1,930 (82.5%) | 12 (0.5%) |
| Total | 6,671 (74.5%) | 179 (2.0%) |
Employment Occupations by Sex in Clark County
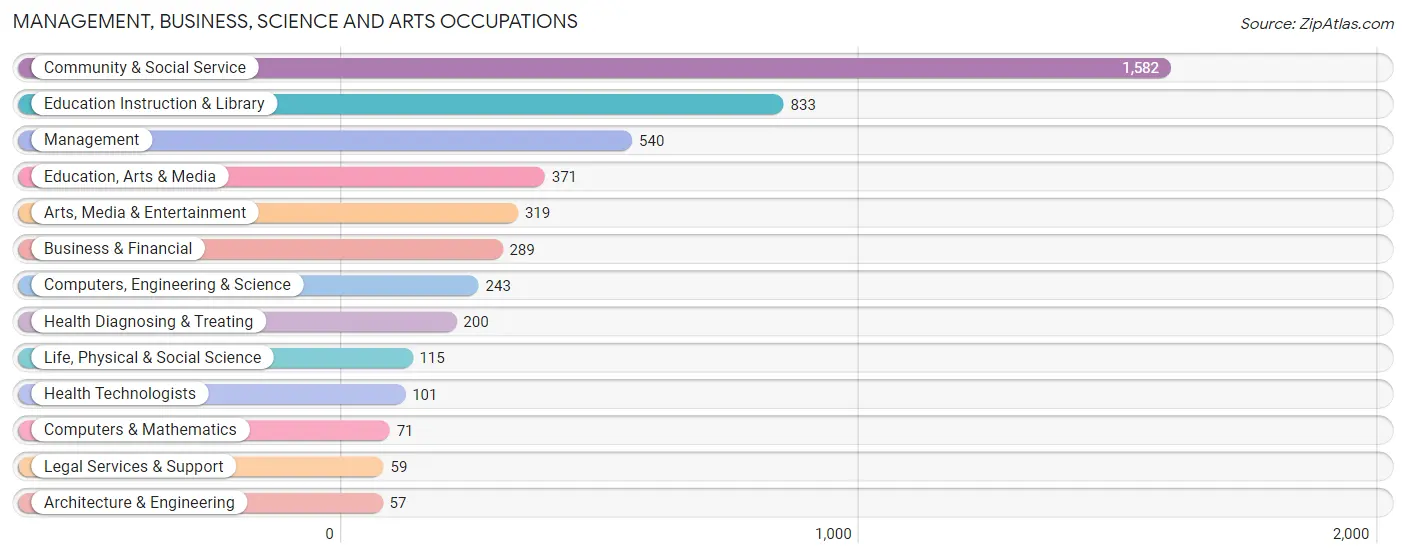
Management, Business, Science and Arts Occupations
The most common Management, Business, Science and Arts occupations in Clark County are Community & Social Service (1,582 | 16.0%), Education Instruction & Library (833 | 8.4%), Management (540 | 5.5%), Education, Arts & Media (371 | 3.8%), and Arts, Media & Entertainment (319 | 3.2%).
Management, Business, Science and Arts Occupations by Sex
Within the Management, Business, Science and Arts occupations in Clark County, the most male-oriented occupations are Computers & Mathematics (100.0%), Architecture & Engineering (86.0%), and Computers, Engineering & Science (83.1%), while the most female-oriented occupations are Health Diagnosing & Treating (95.5%), Health Technologists (95.1%), and Business & Financial (78.9%).
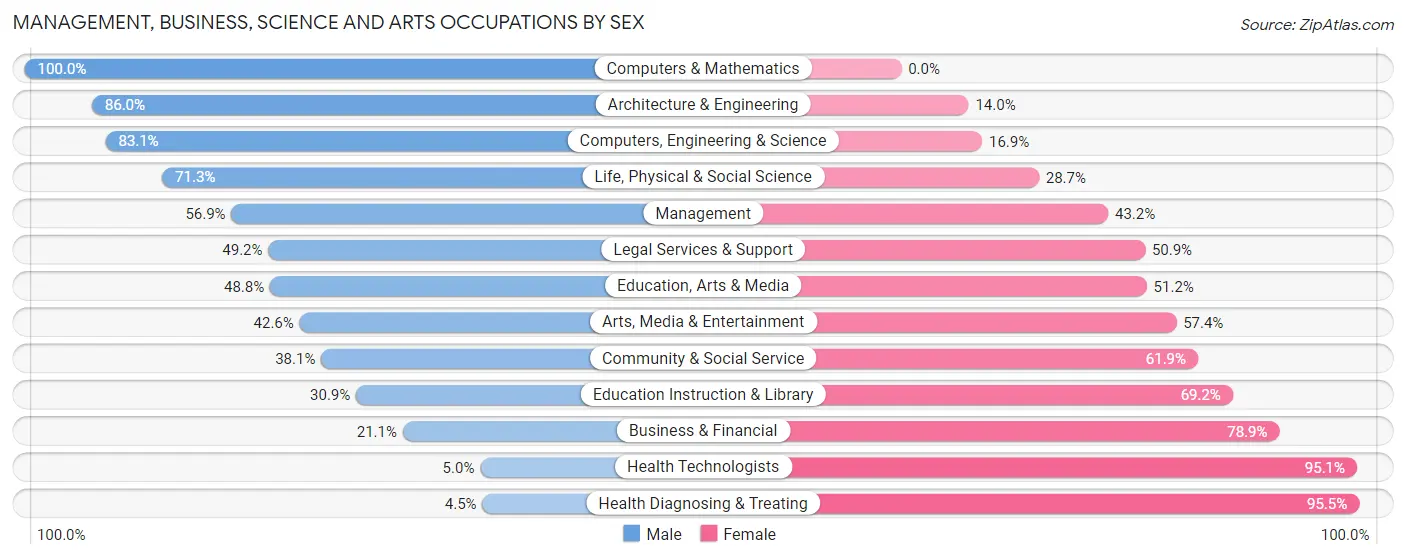
| Occupation | Male | Female |
| Management | 307 (56.9%) | 233 (43.1%) |
| Business & Financial | 61 (21.1%) | 228 (78.9%) |
| Computers, Engineering & Science | 202 (83.1%) | 41 (16.9%) |
| Computers & Mathematics | 71 (100.0%) | 0 (0.0%) |
| Architecture & Engineering | 49 (86.0%) | 8 (14.0%) |
| Life, Physical & Social Science | 82 (71.3%) | 33 (28.7%) |
| Community & Social Service | 603 (38.1%) | 979 (61.9%) |
| Education, Arts & Media | 181 (48.8%) | 190 (51.2%) |
| Legal Services & Support | 29 (49.1%) | 30 (50.8%) |
| Education Instruction & Library | 257 (30.8%) | 576 (69.2%) |
| Arts, Media & Entertainment | 136 (42.6%) | 183 (57.4%) |
| Health Diagnosing & Treating | 9 (4.5%) | 191 (95.5%) |
| Health Technologists | 5 (5.0%) | 96 (95.1%) |
| Total (Category) | 1,182 (41.4%) | 1,672 (58.6%) |
| Total (Overall) | 4,957 (50.2%) | 4,912 (49.8%) |
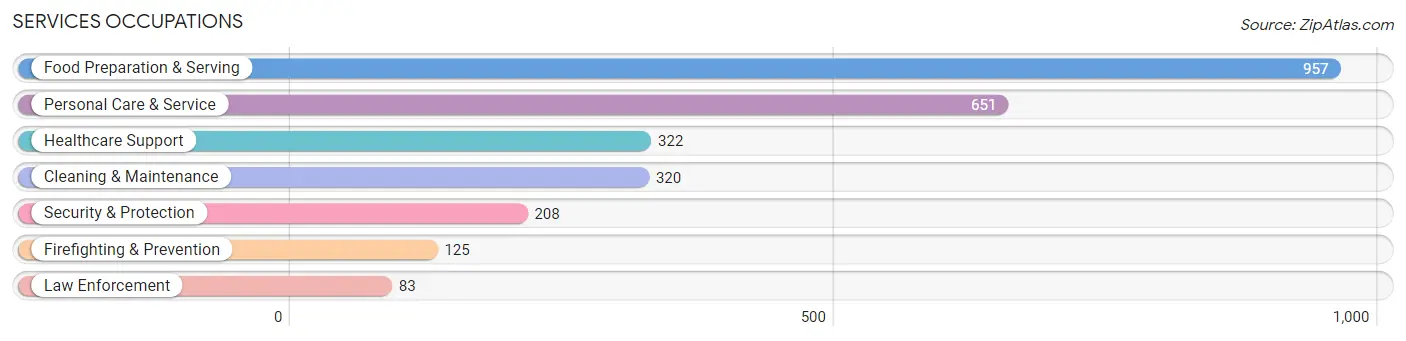
Services Occupations
The most common Services occupations in Clark County are Food Preparation & Serving (957 | 9.7%), Personal Care & Service (651 | 6.6%), Healthcare Support (322 | 3.3%), Cleaning & Maintenance (320 | 3.2%), and Security & Protection (208 | 2.1%).
Services Occupations by Sex
Within the Services occupations in Clark County, the most male-oriented occupations are Law Enforcement (84.3%), Security & Protection (62.0%), and Cleaning & Maintenance (59.1%), while the most female-oriented occupations are Healthcare Support (78.6%), Personal Care & Service (65.0%), and Food Preparation & Serving (63.4%).
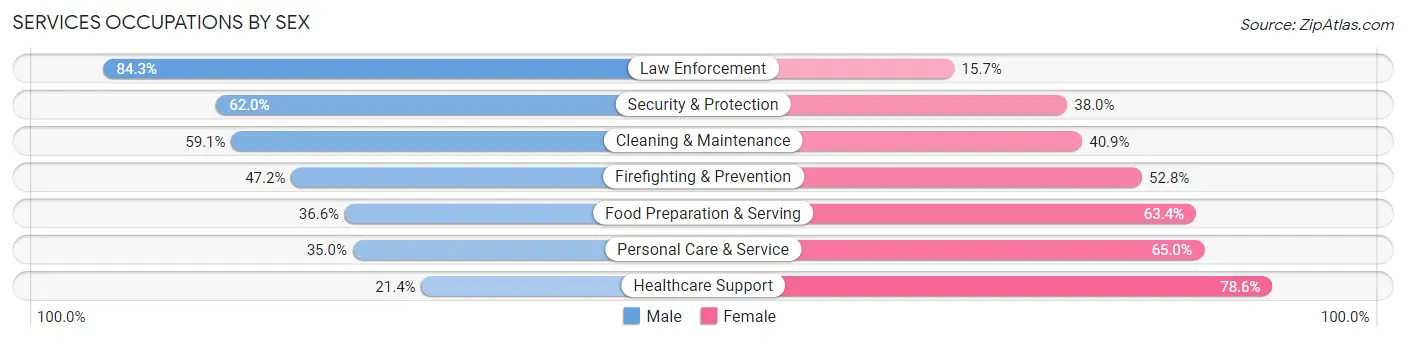
| Occupation | Male | Female |
| Healthcare Support | 69 (21.4%) | 253 (78.6%) |
| Security & Protection | 129 (62.0%) | 79 (38.0%) |
| Firefighting & Prevention | 59 (47.2%) | 66 (52.8%) |
| Law Enforcement | 70 (84.3%) | 13 (15.7%) |
| Food Preparation & Serving | 350 (36.6%) | 607 (63.4%) |
| Cleaning & Maintenance | 189 (59.1%) | 131 (40.9%) |
| Personal Care & Service | 228 (35.0%) | 423 (65.0%) |
| Total (Category) | 965 (39.3%) | 1,493 (60.7%) |
| Total (Overall) | 4,957 (50.2%) | 4,912 (49.8%) |
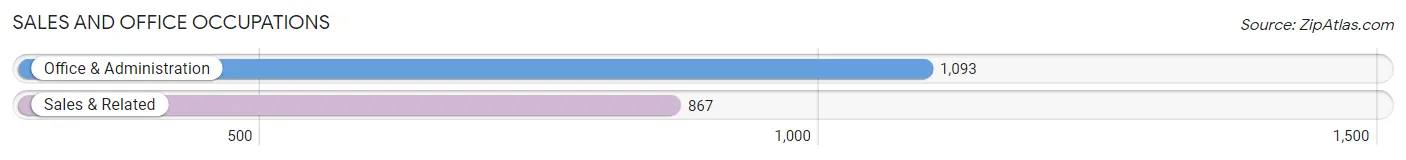
Sales and Office Occupations
The most common Sales and Office occupations in Clark County are Office & Administration (1,093 | 11.1%), and Sales & Related (867 | 8.8%).
Sales and Office Occupations by Sex
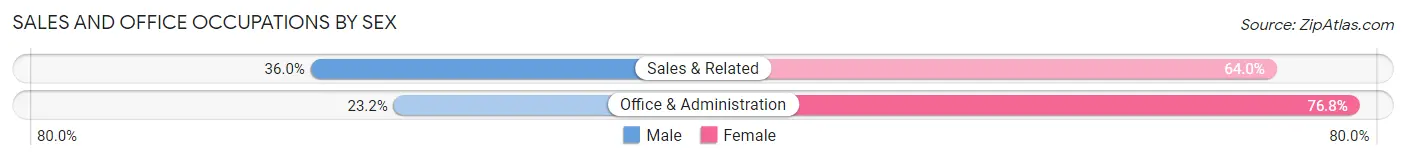
| Occupation | Male | Female |
| Sales & Related | 312 (36.0%) | 555 (64.0%) |
| Office & Administration | 254 (23.2%) | 839 (76.8%) |
| Total (Category) | 566 (28.9%) | 1,394 (71.1%) |
| Total (Overall) | 4,957 (50.2%) | 4,912 (49.8%) |
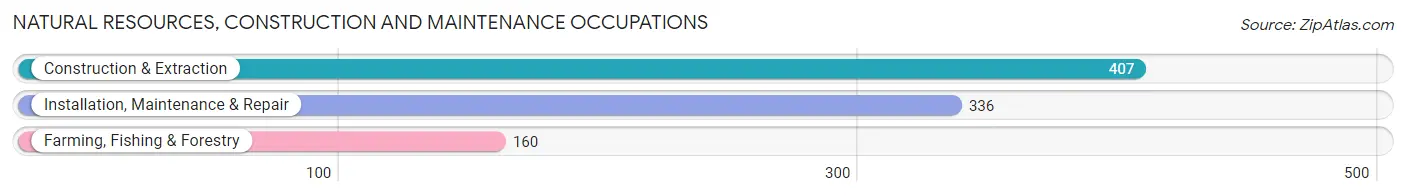
Natural Resources, Construction and Maintenance Occupations
The most common Natural Resources, Construction and Maintenance occupations in Clark County are Construction & Extraction (407 | 4.1%), Installation, Maintenance & Repair (336 | 3.4%), and Farming, Fishing & Forestry (160 | 1.6%).
Natural Resources, Construction and Maintenance Occupations by Sex
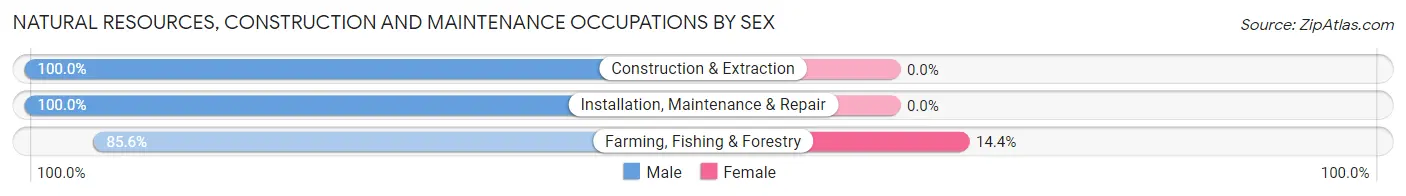
| Occupation | Male | Female |
| Farming, Fishing & Forestry | 137 (85.6%) | 23 (14.4%) |
| Construction & Extraction | 407 (100.0%) | 0 (0.0%) |
| Installation, Maintenance & Repair | 336 (100.0%) | 0 (0.0%) |
| Total (Category) | 880 (97.5%) | 23 (2.5%) |
| Total (Overall) | 4,957 (50.2%) | 4,912 (49.8%) |
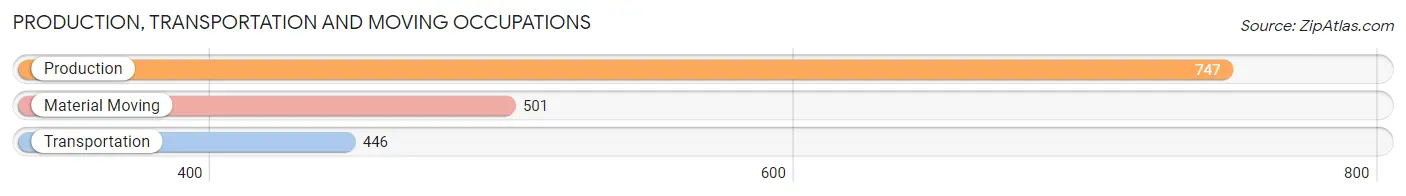
Production, Transportation and Moving Occupations
The most common Production, Transportation and Moving occupations in Clark County are Production (747 | 7.6%), Material Moving (501 | 5.1%), and Transportation (446 | 4.5%).
Production, Transportation and Moving Occupations by Sex
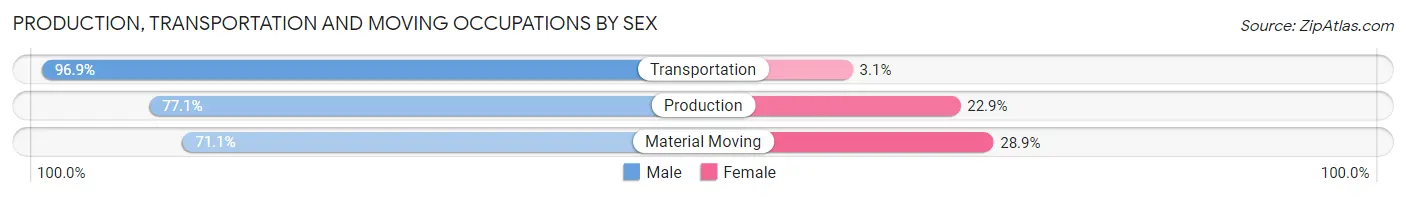
| Occupation | Male | Female |
| Production | 576 (77.1%) | 171 (22.9%) |
| Transportation | 432 (96.9%) | 14 (3.1%) |
| Material Moving | 356 (71.1%) | 145 (28.9%) |
| Total (Category) | 1,364 (80.5%) | 330 (19.5%) |
| Total (Overall) | 4,957 (50.2%) | 4,912 (49.8%) |
Employment Industries by Sex in Clark County
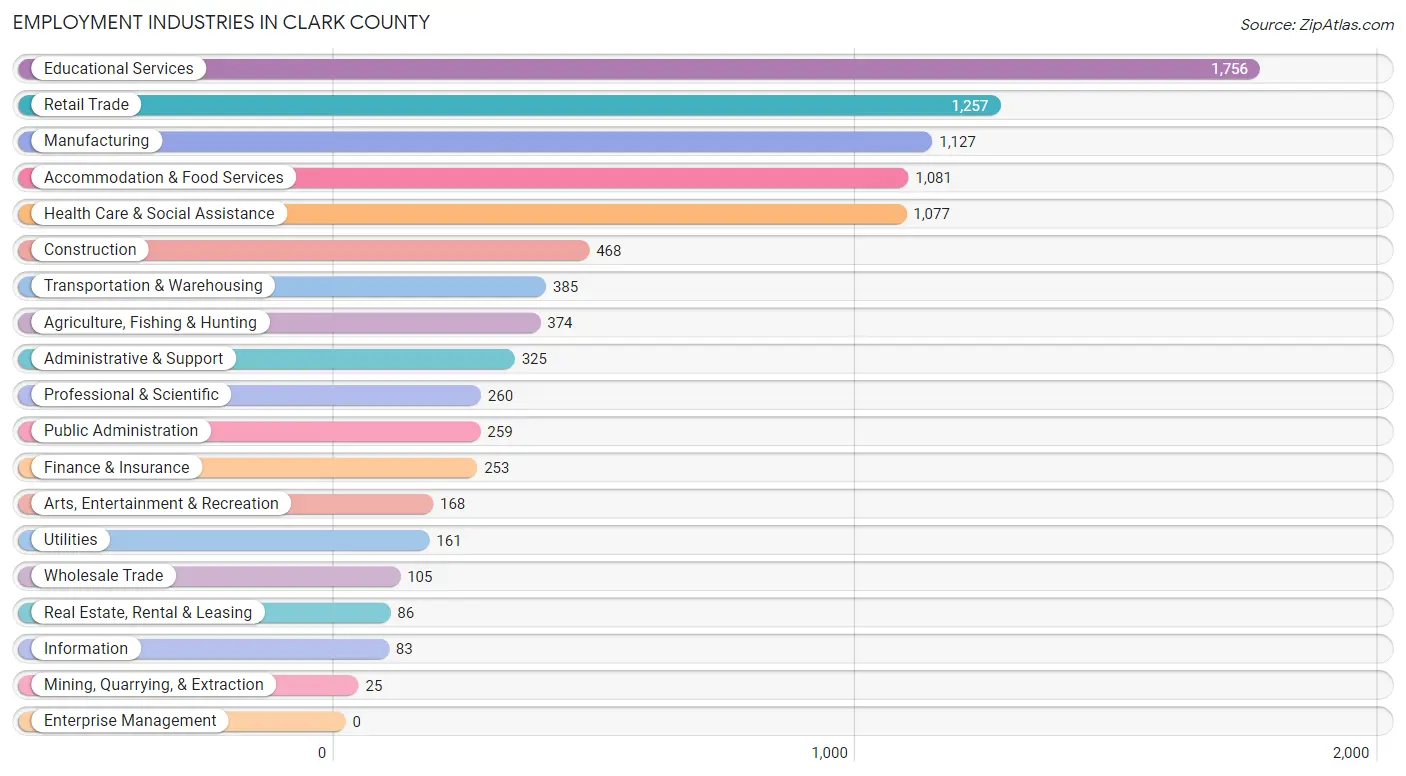
Employment Industries in Clark County
The major employment industries in Clark County include Educational Services (1,756 | 17.8%), Retail Trade (1,257 | 12.7%), Manufacturing (1,127 | 11.4%), Accommodation & Food Services (1,081 | 11.0%), and Health Care & Social Assistance (1,077 | 10.9%).
Employment Industries by Sex in Clark County
The Clark County industries that see more men than women are Wholesale Trade (100.0%), Information (97.6%), and Construction (90.0%), whereas the industries that tend to have a higher number of women are Finance & Insurance (87.4%), Health Care & Social Assistance (73.4%), and Educational Services (71.4%).
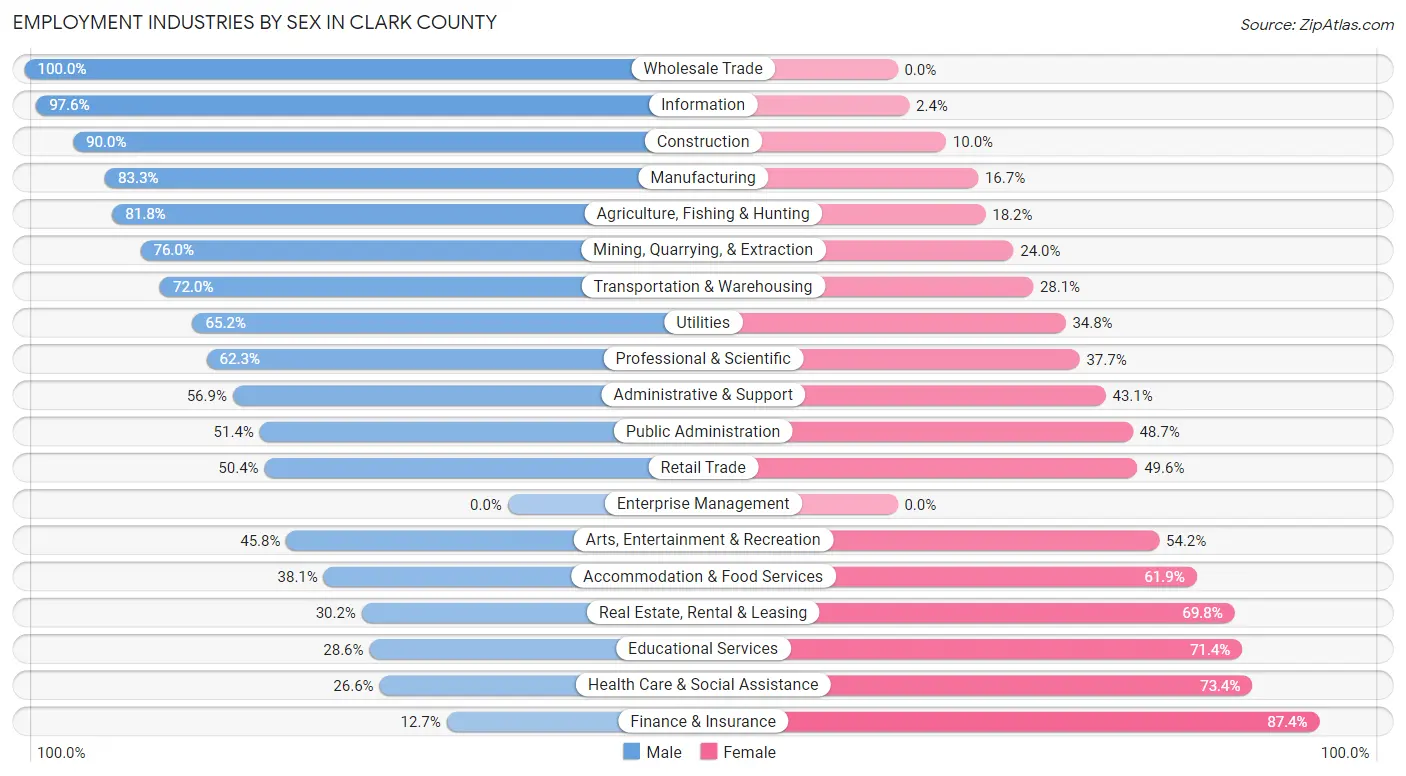
| Industry | Male | Female |
| Agriculture, Fishing & Hunting | 306 (81.8%) | 68 (18.2%) |
| Mining, Quarrying, & Extraction | 19 (76.0%) | 6 (24.0%) |
| Construction | 421 (90.0%) | 47 (10.0%) |
| Manufacturing | 939 (83.3%) | 188 (16.7%) |
| Wholesale Trade | 105 (100.0%) | 0 (0.0%) |
| Retail Trade | 633 (50.4%) | 624 (49.6%) |
| Transportation & Warehousing | 277 (72.0%) | 108 (28.1%) |
| Utilities | 105 (65.2%) | 56 (34.8%) |
| Information | 81 (97.6%) | 2 (2.4%) |
| Finance & Insurance | 32 (12.7%) | 221 (87.4%) |
| Real Estate, Rental & Leasing | 26 (30.2%) | 60 (69.8%) |
| Professional & Scientific | 162 (62.3%) | 98 (37.7%) |
| Enterprise Management | 0 (0.0%) | 0 (0.0%) |
| Administrative & Support | 185 (56.9%) | 140 (43.1%) |
| Educational Services | 503 (28.6%) | 1,253 (71.4%) |
| Health Care & Social Assistance | 286 (26.6%) | 791 (73.4%) |
| Arts, Entertainment & Recreation | 77 (45.8%) | 91 (54.2%) |
| Accommodation & Food Services | 412 (38.1%) | 669 (61.9%) |
| Public Administration | 133 (51.3%) | 126 (48.6%) |
| Total | 4,957 (50.2%) | 4,912 (49.8%) |
Education in Clark County
School Enrollment in Clark County
The most common levels of schooling among the 7,188 students in Clark County are college / undergraduate (3,831 | 53.3%), middle school (1,052 | 14.6%), and elementary school (989 | 13.8%).
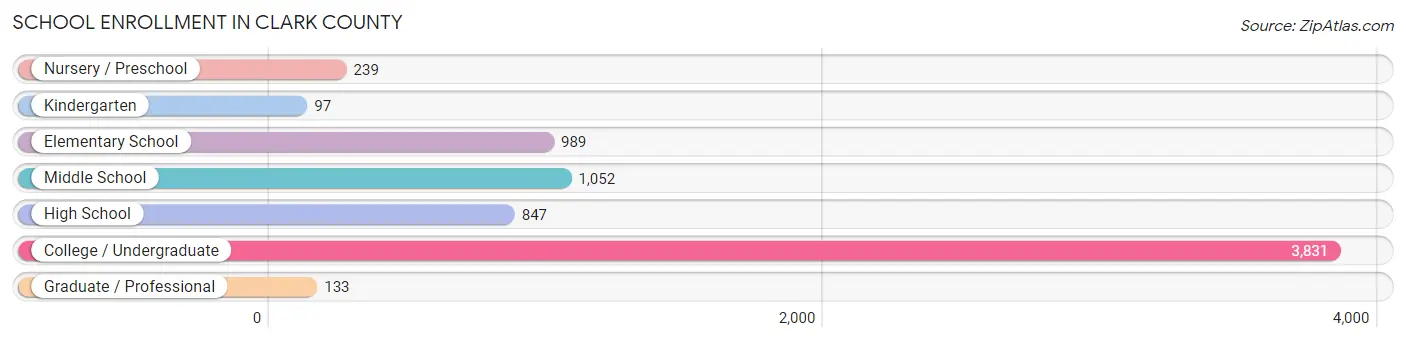
| School Level | # Students | % Students |
| Nursery / Preschool | 239 | 3.3% |
| Kindergarten | 97 | 1.3% |
| Elementary School | 989 | 13.8% |
| Middle School | 1,052 | 14.6% |
| High School | 847 | 11.8% |
| College / Undergraduate | 3,831 | 53.3% |
| Graduate / Professional | 133 | 1.8% |
| Total | 7,188 | 100.0% |
School Enrollment by Age by Funding Source in Clark County
Out of a total of 7,188 students who are enrolled in schools in Clark County, 1,028 (14.3%) attend a private institution, while the remaining 6,160 (85.7%) are enrolled in public schools. The age group of 35 years and over has the highest likelihood of being enrolled in private schools, with 50 (25.1% in the age bracket) enrolled. Conversely, the age group of 15 to 17 year olds has the lowest likelihood of being enrolled in a private school, with 681 (99.3% in the age bracket) attending a public institution.
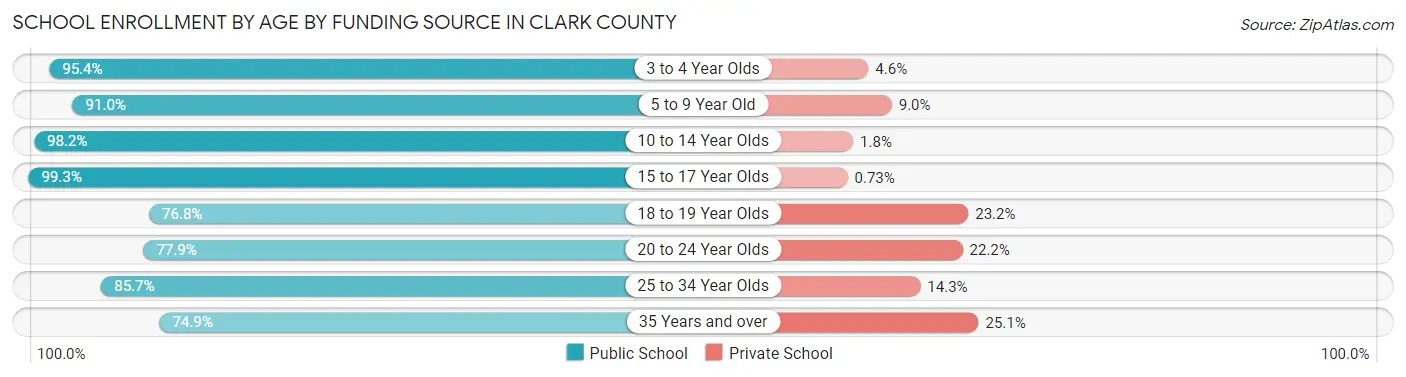
| Age Bracket | Public School | Private School |
| 3 to 4 Year Olds | 145 (95.4%) | 7 (4.6%) |
| 5 to 9 Year Old | 935 (91.0%) | 92 (9.0%) |
| 10 to 14 Year Olds | 1,218 (98.2%) | 22 (1.8%) |
| 15 to 17 Year Olds | 681 (99.3%) | 5 (0.7%) |
| 18 to 19 Year Olds | 1,049 (76.8%) | 317 (23.2%) |
| 20 to 24 Year Olds | 1,726 (77.8%) | 491 (22.2%) |
| 25 to 34 Year Olds | 258 (85.7%) | 43 (14.3%) |
| 35 Years and over | 149 (74.9%) | 50 (25.1%) |
| Total | 6,160 (85.7%) | 1,028 (14.3%) |
Educational Attainment by Field of Study in Clark County
Education (951 | 27.1%), business (523 | 14.9%), liberal arts & history (308 | 8.8%), arts & humanities (295 | 8.4%), and psychology (281 | 8.0%) are the most common fields of study among 3,505 individuals in Clark County who have obtained a bachelor's degree or higher.
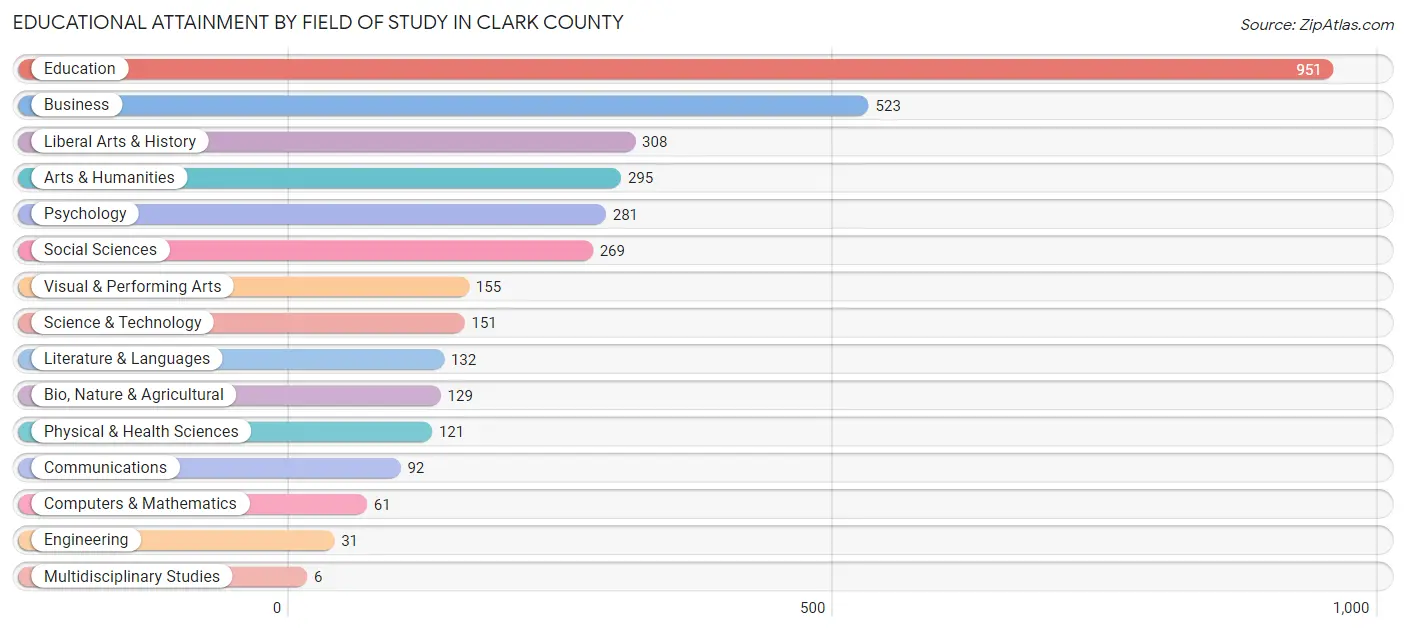
| Field of Study | # Graduates | % Graduates |
| Computers & Mathematics | 61 | 1.7% |
| Bio, Nature & Agricultural | 129 | 3.7% |
| Physical & Health Sciences | 121 | 3.5% |
| Psychology | 281 | 8.0% |
| Social Sciences | 269 | 7.7% |
| Engineering | 31 | 0.9% |
| Multidisciplinary Studies | 6 | 0.2% |
| Science & Technology | 151 | 4.3% |
| Business | 523 | 14.9% |
| Education | 951 | 27.1% |
| Literature & Languages | 132 | 3.8% |
| Liberal Arts & History | 308 | 8.8% |
| Visual & Performing Arts | 155 | 4.4% |
| Communications | 92 | 2.6% |
| Arts & Humanities | 295 | 8.4% |
| Total | 3,505 | 100.0% |
Transportation & Commute in Clark County
Vehicle Availability by Sex in Clark County
The most prevalent vehicle ownership categories in Clark County are males with 2 vehicles (1,731, accounting for 38.6%) and females with 2 vehicles (1,693, making up 43.0%).
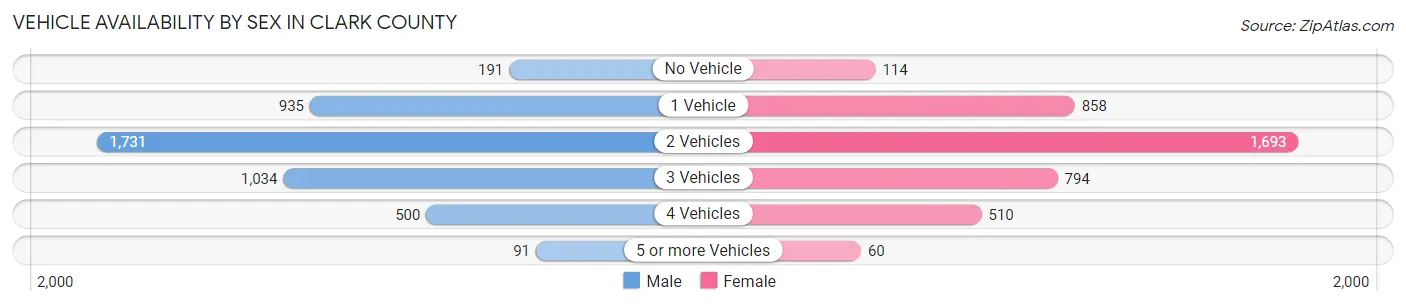
| Vehicles Available | Male | Female |
| No Vehicle | 191 (4.3%) | 114 (2.8%) |
| 1 Vehicle | 935 (20.9%) | 858 (21.3%) |
| 2 Vehicles | 1,731 (38.6%) | 1,693 (42.0%) |
| 3 Vehicles | 1,034 (23.1%) | 794 (19.7%) |
| 4 Vehicles | 500 (11.2%) | 510 (12.7%) |
| 5 or more Vehicles | 91 (2.0%) | 60 (1.5%) |
| Total | 4,482 (100.0%) | 4,029 (100.0%) |
Commute Time in Clark County
The most frequently occuring commute durations in Clark County are 5 to 9 minutes (2,404 commuters, 26.0%), 10 to 14 minutes (1,771 commuters, 19.1%), and 15 to 19 minutes (1,284 commuters, 13.9%).
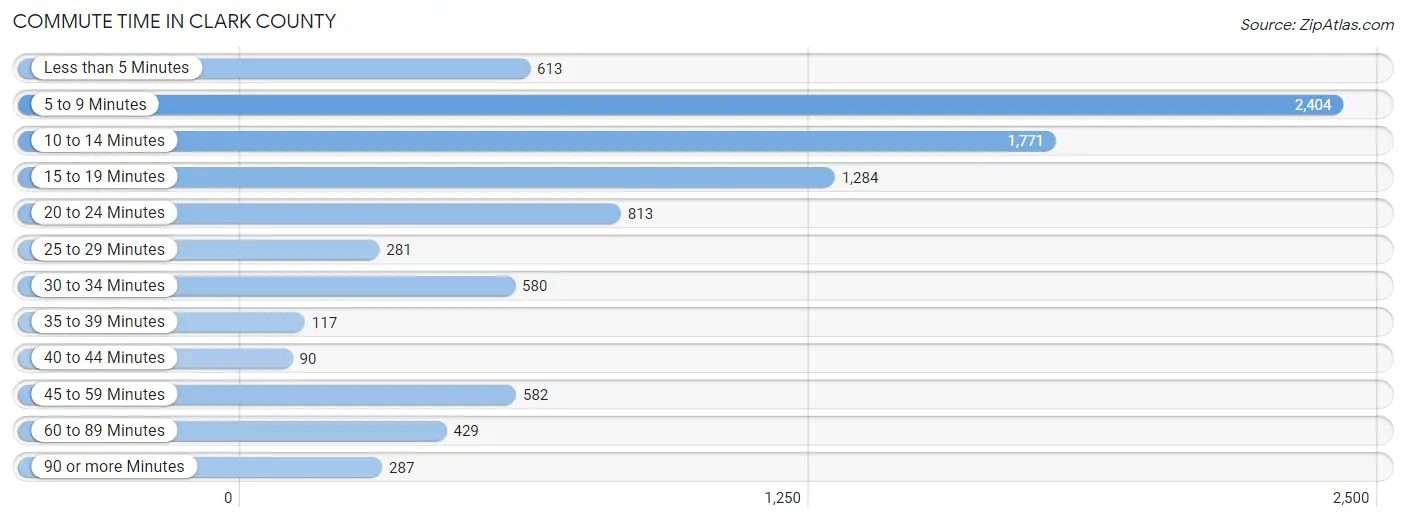
| Commute Time | # Commuters | % Commuters |
| Less than 5 Minutes | 613 | 6.6% |
| 5 to 9 Minutes | 2,404 | 26.0% |
| 10 to 14 Minutes | 1,771 | 19.1% |
| 15 to 19 Minutes | 1,284 | 13.9% |
| 20 to 24 Minutes | 813 | 8.8% |
| 25 to 29 Minutes | 281 | 3.0% |
| 30 to 34 Minutes | 580 | 6.3% |
| 35 to 39 Minutes | 117 | 1.3% |
| 40 to 44 Minutes | 90 | 1.0% |
| 45 to 59 Minutes | 582 | 6.3% |
| 60 to 89 Minutes | 429 | 4.6% |
| 90 or more Minutes | 287 | 3.1% |
Commute Time by Sex in Clark County
The most common commute times in Clark County are 5 to 9 minutes (1,240 commuters, 26.0%) for males and 5 to 9 minutes (1,164 commuters, 26.0%) for females.
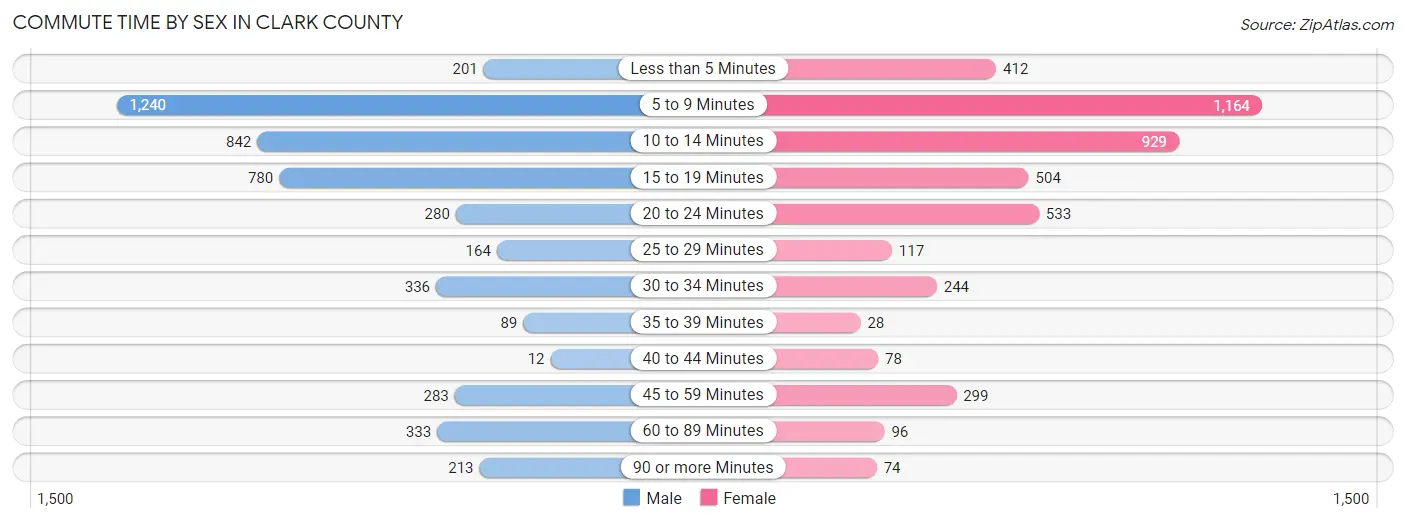
| Commute Time | Male | Female |
| Less than 5 Minutes | 201 (4.2%) | 412 (9.2%) |
| 5 to 9 Minutes | 1,240 (26.0%) | 1,164 (26.0%) |
| 10 to 14 Minutes | 842 (17.6%) | 929 (20.7%) |
| 15 to 19 Minutes | 780 (16.3%) | 504 (11.3%) |
| 20 to 24 Minutes | 280 (5.9%) | 533 (11.9%) |
| 25 to 29 Minutes | 164 (3.4%) | 117 (2.6%) |
| 30 to 34 Minutes | 336 (7.0%) | 244 (5.4%) |
| 35 to 39 Minutes | 89 (1.9%) | 28 (0.6%) |
| 40 to 44 Minutes | 12 (0.3%) | 78 (1.7%) |
| 45 to 59 Minutes | 283 (5.9%) | 299 (6.7%) |
| 60 to 89 Minutes | 333 (7.0%) | 96 (2.1%) |
| 90 or more Minutes | 213 (4.5%) | 74 (1.7%) |
Time of Departure to Work by Sex in Clark County
The most frequent times of departure to work in Clark County are 7:30 AM to 7:59 AM (799, 16.7%) for males and 7:30 AM to 7:59 AM (922, 20.6%) for females.
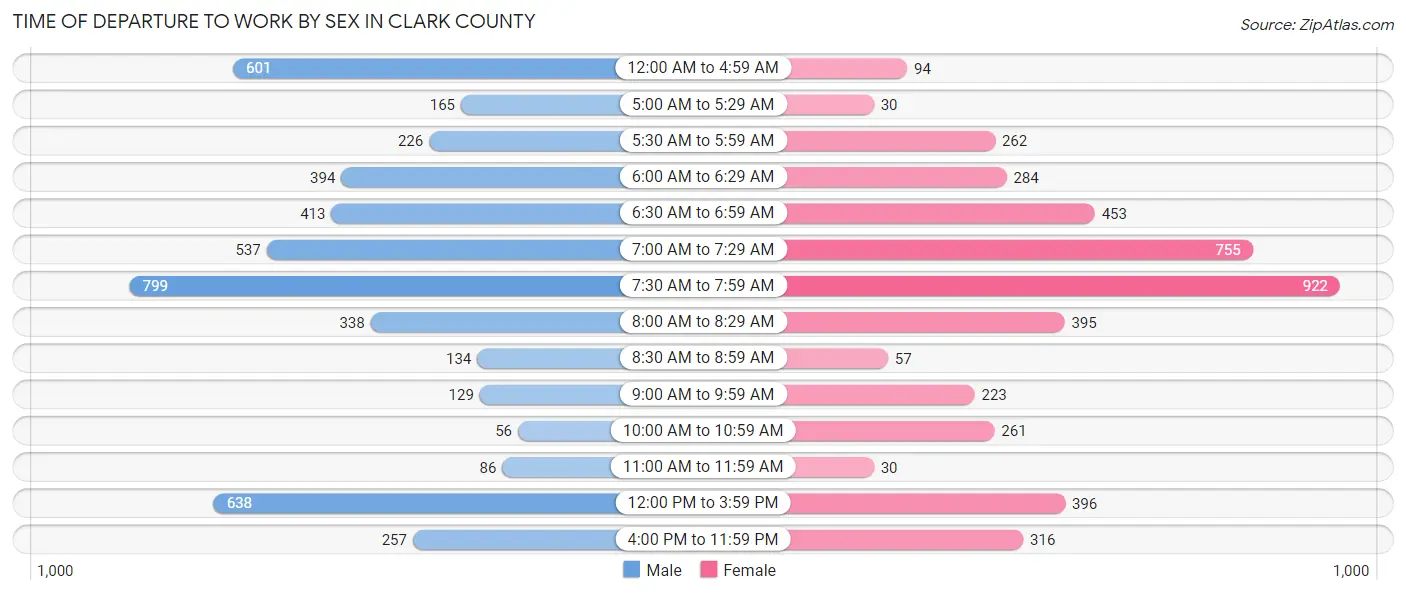
| Time of Departure | Male | Female |
| 12:00 AM to 4:59 AM | 601 (12.6%) | 94 (2.1%) |
| 5:00 AM to 5:29 AM | 165 (3.5%) | 30 (0.7%) |
| 5:30 AM to 5:59 AM | 226 (4.7%) | 262 (5.9%) |
| 6:00 AM to 6:29 AM | 394 (8.3%) | 284 (6.3%) |
| 6:30 AM to 6:59 AM | 413 (8.6%) | 453 (10.1%) |
| 7:00 AM to 7:29 AM | 537 (11.3%) | 755 (16.9%) |
| 7:30 AM to 7:59 AM | 799 (16.7%) | 922 (20.6%) |
| 8:00 AM to 8:29 AM | 338 (7.1%) | 395 (8.8%) |
| 8:30 AM to 8:59 AM | 134 (2.8%) | 57 (1.3%) |
| 9:00 AM to 9:59 AM | 129 (2.7%) | 223 (5.0%) |
| 10:00 AM to 10:59 AM | 56 (1.2%) | 261 (5.8%) |
| 11:00 AM to 11:59 AM | 86 (1.8%) | 30 (0.7%) |
| 12:00 PM to 3:59 PM | 638 (13.4%) | 396 (8.8%) |
| 4:00 PM to 11:59 PM | 257 (5.4%) | 316 (7.1%) |
| Total | 4,773 (100.0%) | 4,478 (100.0%) |
Housing Occupancy in Clark County
Occupancy by Ownership in Clark County
Of the total 7,955 dwellings in Clark County, owner-occupied units account for 4,964 (62.4%), while renter-occupied units make up 2,991 (37.6%).
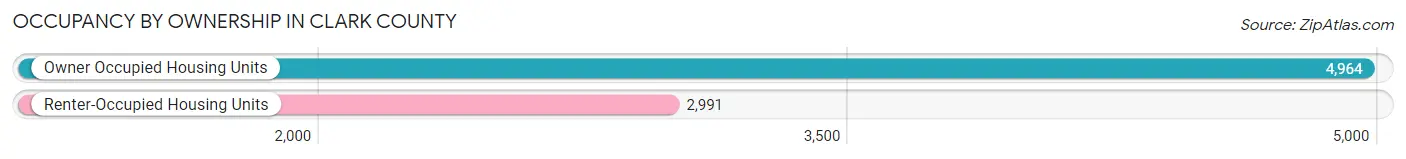
| Occupancy | # Housing Units | % Housing Units |
| Owner Occupied Housing Units | 4,964 | 62.4% |
| Renter-Occupied Housing Units | 2,991 | 37.6% |
| Total Occupied Housing Units | 7,955 | 100.0% |
Occupancy by Household Size in Clark County
| Household Size | # Housing Units | % Housing Units |
| 1-Person Household | 2,381 | 29.9% |
| 2-Person Household | 3,109 | 39.1% |
| 3-Person Household | 1,026 | 12.9% |
| 4+ Person Household | 1,439 | 18.1% |
| Total Housing Units | 7,955 | 100.0% |
Occupancy by Ownership by Household Size in Clark County
| Household Size | Owner-occupied | Renter-occupied |
| 1-Person Household | 1,120 (47.0%) | 1,261 (53.0%) |
| 2-Person Household | 2,133 (68.6%) | 976 (31.4%) |
| 3-Person Household | 737 (71.8%) | 289 (28.2%) |
| 4+ Person Household | 974 (67.7%) | 465 (32.3%) |
| Total Housing Units | 4,964 (62.4%) | 2,991 (37.6%) |
Occupancy by Educational Attainment in Clark County
| Household Size | Owner-occupied | Renter-occupied |
| Less than High School | 461 (61.6%) | 287 (38.4%) |
| High School Diploma | 1,452 (64.2%) | 811 (35.8%) |
| College/Associate Degree | 1,586 (55.7%) | 1,260 (44.3%) |
| Bachelor's Degree or higher | 1,465 (69.8%) | 633 (30.2%) |
Occupancy by Age of Householder in Clark County
| Age Bracket | # Households | % Households |
| Under 35 Years | 1,942 | 24.4% |
| 35 to 44 Years | 1,136 | 14.3% |
| 45 to 54 Years | 1,164 | 14.6% |
| 55 to 64 Years | 1,507 | 18.9% |
| 65 to 74 Years | 1,197 | 15.0% |
| 75 to 84 Years | 813 | 10.2% |
| 85 Years and Over | 196 | 2.5% |
| Total | 7,955 | 100.0% |
Housing Finances in Clark County
Median Income by Occupancy in Clark County
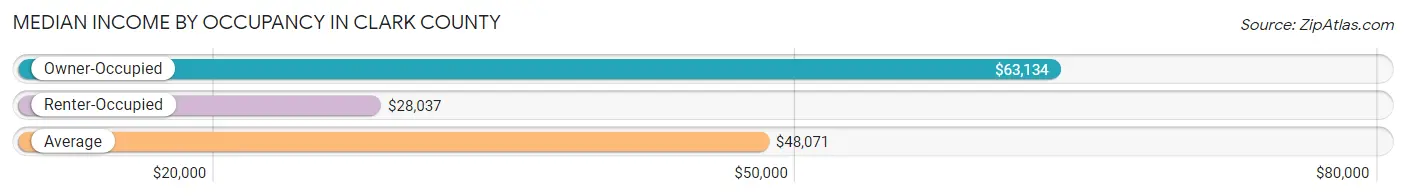
| Occupancy Type | # Households | Median Income |
| Owner-Occupied | 4,964 (62.4%) | $63,134 |
| Renter-Occupied | 2,991 (37.6%) | $28,037 |
| Average | 7,955 (100.0%) | $48,071 |
Occupancy by Householder Income Bracket in Clark County
| Income Bracket | Owner-occupied | Renter-occupied |
| Less than $5,000 | 102 (2.1%) | 333 (11.1%) |
| $5,000 to $9,999 | 102 (2.1%) | 143 (4.8%) |
| $10,000 to $14,999 | 99 (2.0%) | 353 (11.8%) |
| $15,000 to $19,999 | 168 (3.4%) | 234 (7.8%) |
| $20,000 to $24,999 | 342 (6.9%) | 313 (10.5%) |
| $25,000 to $34,999 | 407 (8.2%) | 437 (14.6%) |
| $35,000 to $49,999 | 770 (15.5%) | 345 (11.5%) |
| $50,000 to $74,999 | 906 (18.2%) | 333 (11.1%) |
| $75,000 to $99,999 | 783 (15.8%) | 280 (9.4%) |
| $100,000 to $149,999 | 852 (17.2%) | 184 (6.1%) |
| $150,000 or more | 433 (8.7%) | 36 (1.2%) |
| Total | 4,964 (100.0%) | 2,991 (100.0%) |
Monthly Housing Cost Tiers in Clark County
| Monthly Cost | Owner-occupied | Renter-occupied |
| Less than $300 | 740 (14.9%) | 177 (5.9%) |
| $300 to $499 | 1,254 (25.3%) | 361 (12.1%) |
| $500 to $799 | 966 (19.5%) | 1,181 (39.5%) |
| $800 to $999 | 499 (10.1%) | 638 (21.3%) |
| $1,000 to $1,499 | 729 (14.7%) | 403 (13.5%) |
| $1,500 to $1,999 | 564 (11.4%) | 0 (0.0%) |
| $2,000 to $2,499 | 114 (2.3%) | 0 (0.0%) |
| $2,500 to $2,999 | 28 (0.6%) | 0 (0.0%) |
| $3,000 or more | 70 (1.4%) | 4 (0.1%) |
| Total | 4,964 (100.0%) | 2,991 (100.0%) |
Physical Housing Characteristics in Clark County
Housing Structures in Clark County
| Structure Type | # Housing Units | % Housing Units |
| Single Unit, Detached | 5,006 | 62.9% |
| Single Unit, Attached | 60 | 0.7% |
| 2 Unit Apartments | 164 | 2.1% |
| 3 or 4 Unit Apartments | 290 | 3.6% |
| 5 to 9 Unit Apartments | 516 | 6.5% |
| 10 or more Apartments | 647 | 8.1% |
| Mobile Home / Other | 1,272 | 16.0% |
| Total | 7,955 | 100.0% |
Housing Structures by Occupancy in Clark County
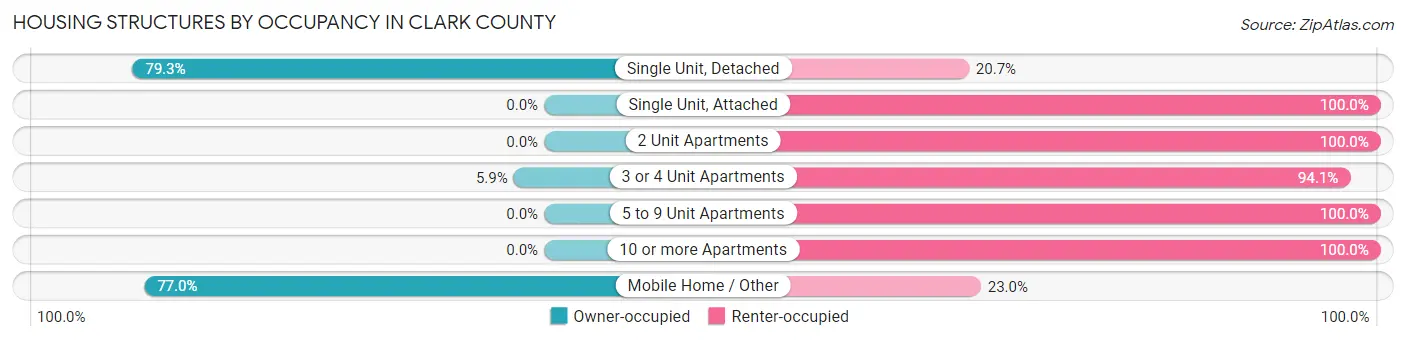
| Structure Type | Owner-occupied | Renter-occupied |
| Single Unit, Detached | 3,968 (79.3%) | 1,038 (20.7%) |
| Single Unit, Attached | 0 (0.0%) | 60 (100.0%) |
| 2 Unit Apartments | 0 (0.0%) | 164 (100.0%) |
| 3 or 4 Unit Apartments | 17 (5.9%) | 273 (94.1%) |
| 5 to 9 Unit Apartments | 0 (0.0%) | 516 (100.0%) |
| 10 or more Apartments | 0 (0.0%) | 647 (100.0%) |
| Mobile Home / Other | 979 (77.0%) | 293 (23.0%) |
| Total | 4,964 (62.4%) | 2,991 (37.6%) |
Housing Structures by Number of Rooms in Clark County
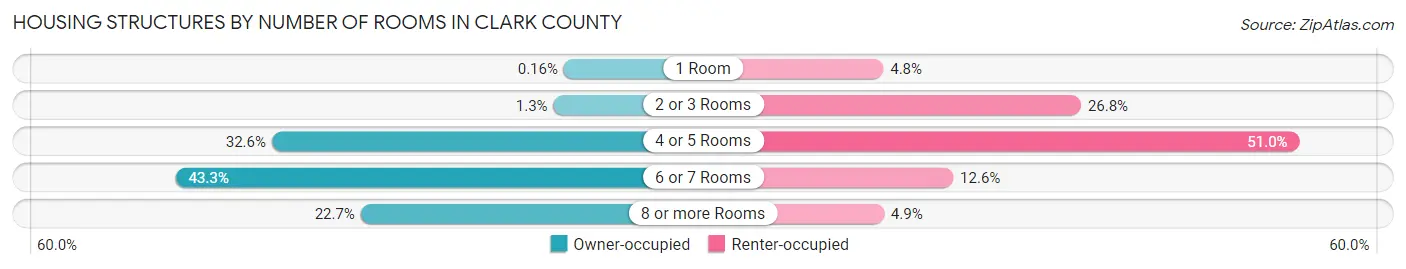
| Number of Rooms | Owner-occupied | Renter-occupied |
| 1 Room | 8 (0.2%) | 144 (4.8%) |
| 2 or 3 Rooms | 65 (1.3%) | 800 (26.8%) |
| 4 or 5 Rooms | 1,617 (32.6%) | 1,525 (51.0%) |
| 6 or 7 Rooms | 2,147 (43.2%) | 376 (12.6%) |
| 8 or more Rooms | 1,127 (22.7%) | 146 (4.9%) |
| Total | 4,964 (100.0%) | 2,991 (100.0%) |
Housing Structure by Heating Type in Clark County
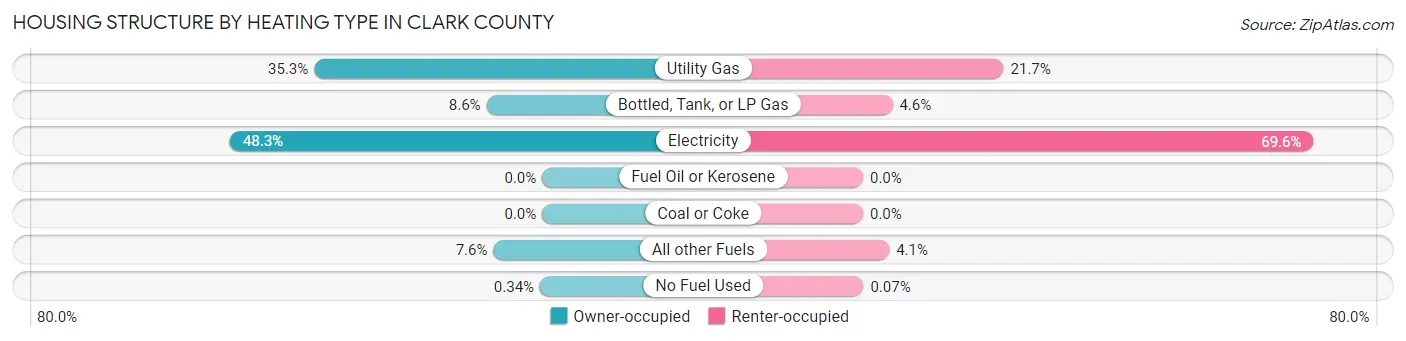
| Heating Type | Owner-occupied | Renter-occupied |
| Utility Gas | 1,750 (35.2%) | 650 (21.7%) |
| Bottled, Tank, or LP Gas | 427 (8.6%) | 136 (4.5%) |
| Electricity | 2,395 (48.2%) | 2,082 (69.6%) |
| Fuel Oil or Kerosene | 0 (0.0%) | 0 (0.0%) |
| Coal or Coke | 0 (0.0%) | 0 (0.0%) |
| All other Fuels | 375 (7.5%) | 121 (4.1%) |
| No Fuel Used | 17 (0.3%) | 2 (0.1%) |
| Total | 4,964 (100.0%) | 2,991 (100.0%) |
Household Vehicle Usage in Clark County
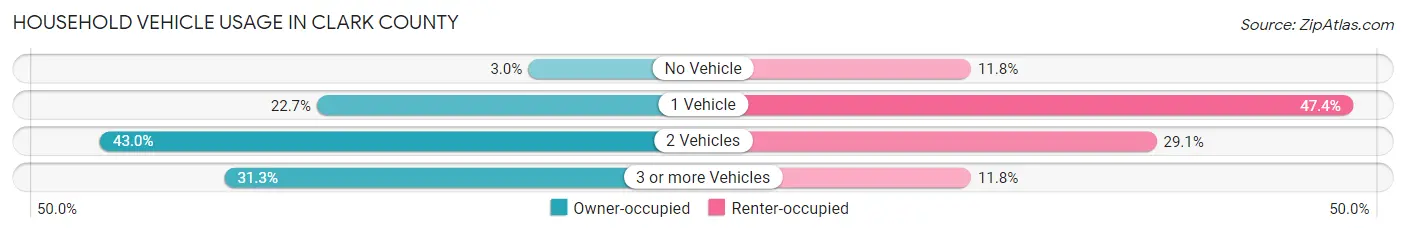
| Vehicles per Household | Owner-occupied | Renter-occupied |
| No Vehicle | 149 (3.0%) | 352 (11.8%) |
| 1 Vehicle | 1,128 (22.7%) | 1,417 (47.4%) |
| 2 Vehicles | 2,132 (42.9%) | 870 (29.1%) |
| 3 or more Vehicles | 1,555 (31.3%) | 352 (11.8%) |
| Total | 4,964 (100.0%) | 2,991 (100.0%) |
Real Estate & Mortgages in Clark County
Real Estate and Mortgage Overview in Clark County
| Characteristic | Without Mortgage | With Mortgage |
| Housing Units | 2,586 | 2,378 |
| Median Property Value | $109,500 | $170,000 |
| Median Household Income | $48,966 | $367 |
| Monthly Housing Costs | $388 | $70 |
| Real Estate Taxes | $734 | $114 |
Property Value by Mortgage Status in Clark County
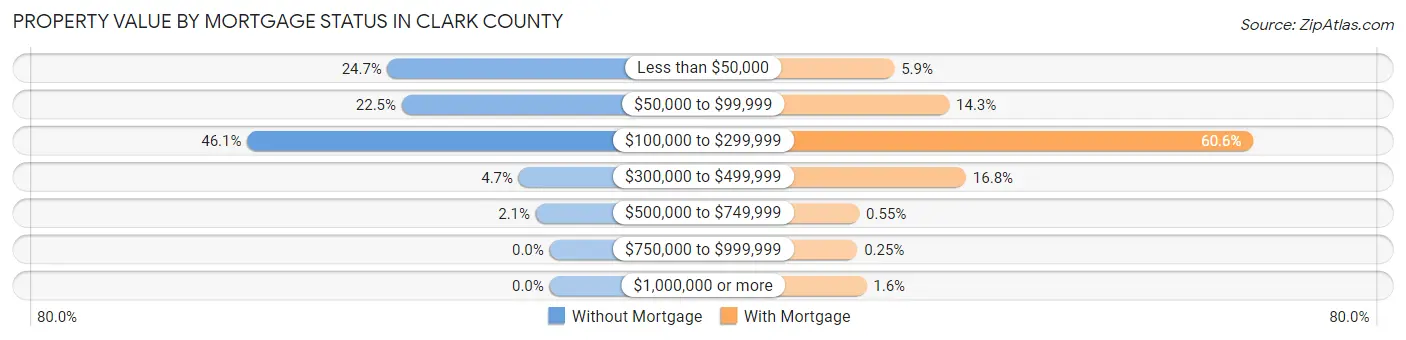
| Property Value | Without Mortgage | With Mortgage |
| Less than $50,000 | 638 (24.7%) | 140 (5.9%) |
| $50,000 to $99,999 | 582 (22.5%) | 339 (14.3%) |
| $100,000 to $299,999 | 1,191 (46.1%) | 1,441 (60.6%) |
| $300,000 to $499,999 | 121 (4.7%) | 400 (16.8%) |
| $500,000 to $749,999 | 54 (2.1%) | 13 (0.5%) |
| $750,000 to $999,999 | 0 (0.0%) | 6 (0.3%) |
| $1,000,000 or more | 0 (0.0%) | 39 (1.6%) |
| Total | 2,586 (100.0%) | 2,378 (100.0%) |
Household Income by Mortgage Status in Clark County
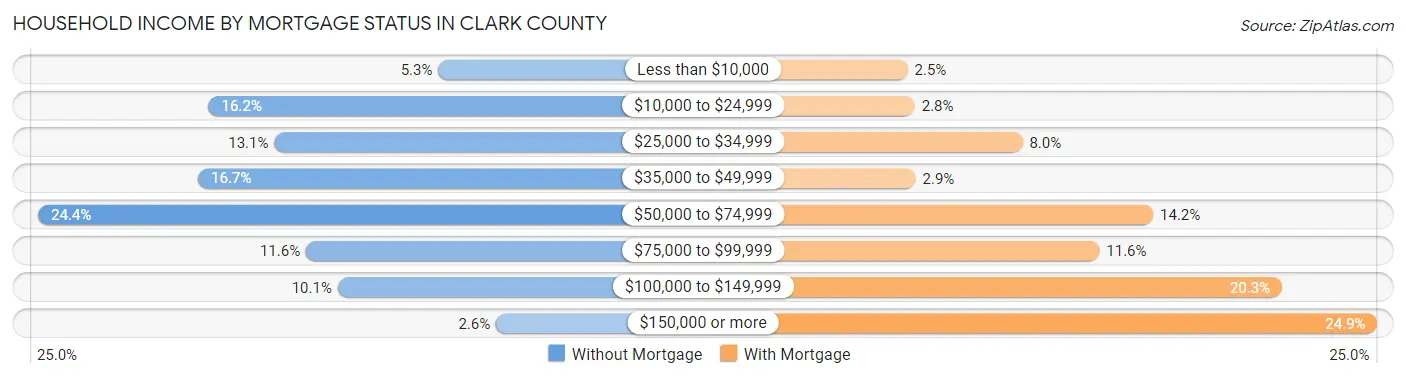
| Household Income | Without Mortgage | With Mortgage |
| Less than $10,000 | 137 (5.3%) | 59 (2.5%) |
| $10,000 to $24,999 | 420 (16.2%) | 67 (2.8%) |
| $25,000 to $34,999 | 339 (13.1%) | 189 (8.0%) |
| $35,000 to $49,999 | 433 (16.7%) | 68 (2.9%) |
| $50,000 to $74,999 | 630 (24.4%) | 337 (14.2%) |
| $75,000 to $99,999 | 300 (11.6%) | 276 (11.6%) |
| $100,000 to $149,999 | 261 (10.1%) | 483 (20.3%) |
| $150,000 or more | 66 (2.5%) | 591 (24.8%) |
| Total | 2,586 (100.0%) | 2,378 (100.0%) |
Property Value to Household Income Ratio in Clark County
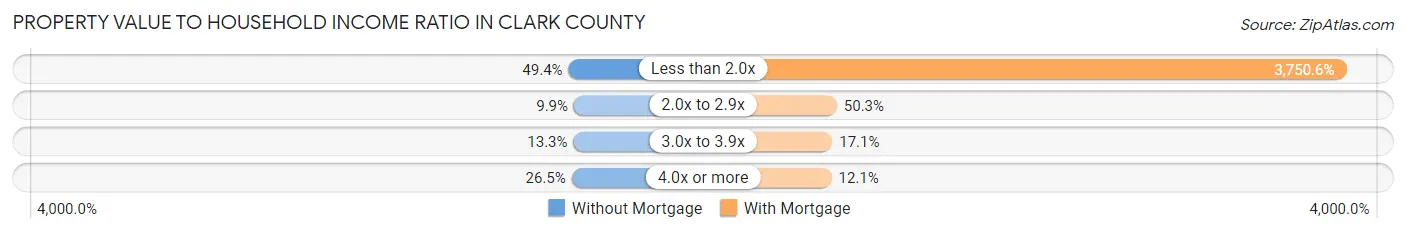
| Value-to-Income Ratio | Without Mortgage | With Mortgage |
| Less than 2.0x | 1,277 (49.4%) | 89,190 (3,750.6%) |
| 2.0x to 2.9x | 256 (9.9%) | 1,195 (50.2%) |
| 3.0x to 3.9x | 345 (13.3%) | 406 (17.1%) |
| 4.0x or more | 684 (26.5%) | 287 (12.1%) |
| Total | 2,586 (100.0%) | 2,378 (100.0%) |
Real Estate Taxes by Mortgage Status in Clark County
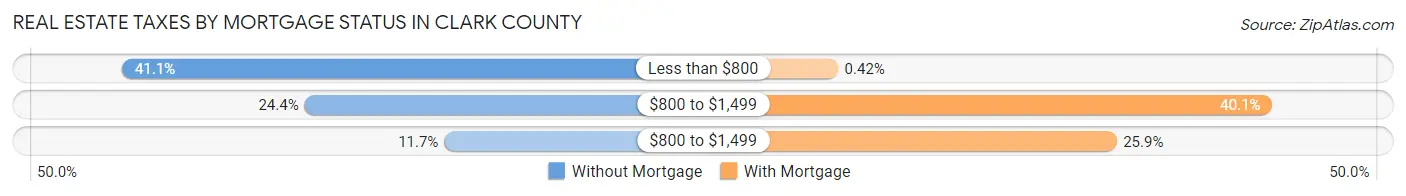
| Property Taxes | Without Mortgage | With Mortgage |
| Less than $800 | 1,063 (41.1%) | 10 (0.4%) |
| $800 to $1,499 | 632 (24.4%) | 954 (40.1%) |
| $800 to $1,499 | 302 (11.7%) | 615 (25.9%) |
| Total | 2,586 (100.0%) | 2,378 (100.0%) |
Health & Disability in Clark County
Health Insurance Coverage by Age in Clark County
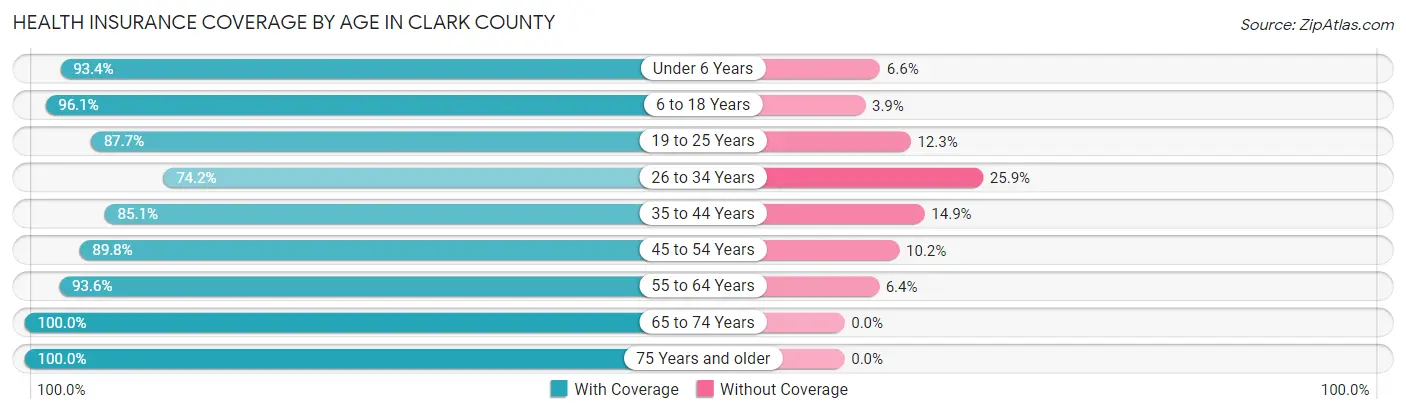
| Age Bracket | With Coverage | Without Coverage |
| Under 6 Years | 1,138 (93.4%) | 81 (6.6%) |
| 6 to 18 Years | 3,475 (96.1%) | 140 (3.9%) |
| 19 to 25 Years | 3,920 (87.7%) | 552 (12.3%) |
| 26 to 34 Years | 1,552 (74.2%) | 541 (25.9%) |
| 35 to 44 Years | 1,725 (85.1%) | 303 (14.9%) |
| 45 to 54 Years | 1,879 (89.8%) | 214 (10.2%) |
| 55 to 64 Years | 2,216 (93.6%) | 152 (6.4%) |
| 65 to 74 Years | 1,939 (100.0%) | 0 (0.0%) |
| 75 Years and older | 1,392 (100.0%) | 0 (0.0%) |
| Total | 19,236 (90.6%) | 1,983 (9.3%) |
Health Insurance Coverage by Citizenship Status in Clark County
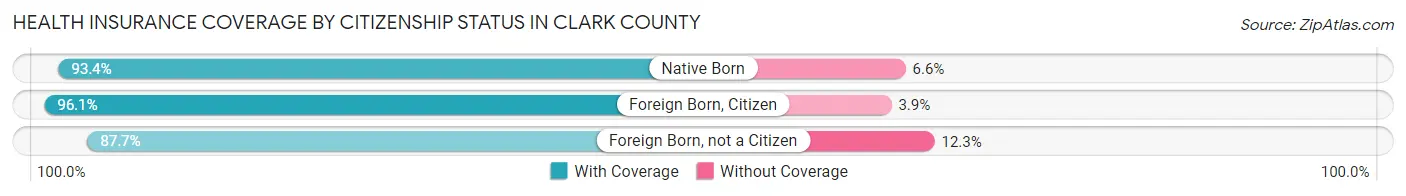
| Citizenship Status | With Coverage | Without Coverage |
| Native Born | 1,138 (93.4%) | 81 (6.6%) |
| Foreign Born, Citizen | 3,475 (96.1%) | 140 (3.9%) |
| Foreign Born, not a Citizen | 3,920 (87.7%) | 552 (12.3%) |
Health Insurance Coverage by Household Income in Clark County
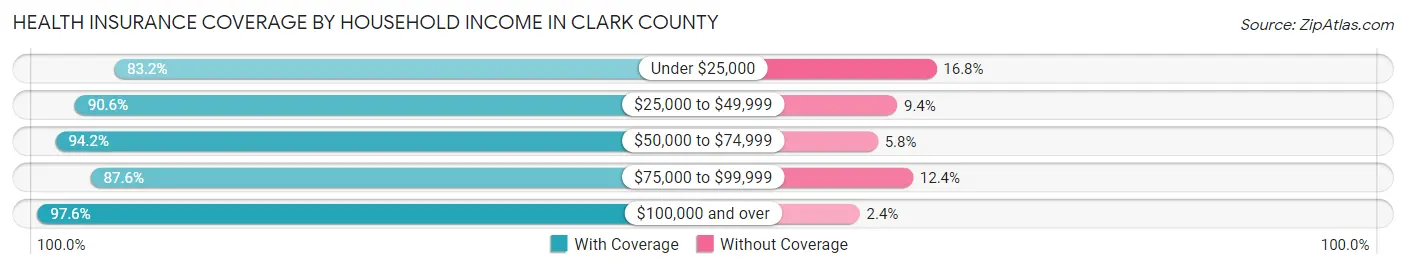
| Household Income | With Coverage | Without Coverage |
| Under $25,000 | 3,288 (83.2%) | 663 (16.8%) |
| $25,000 to $49,999 | 3,523 (90.6%) | 366 (9.4%) |
| $50,000 to $74,999 | 2,670 (94.2%) | 164 (5.8%) |
| $75,000 to $99,999 | 2,973 (87.6%) | 420 (12.4%) |
| $100,000 and over | 4,710 (97.6%) | 116 (2.4%) |
Public vs Private Health Insurance Coverage by Age in Clark County
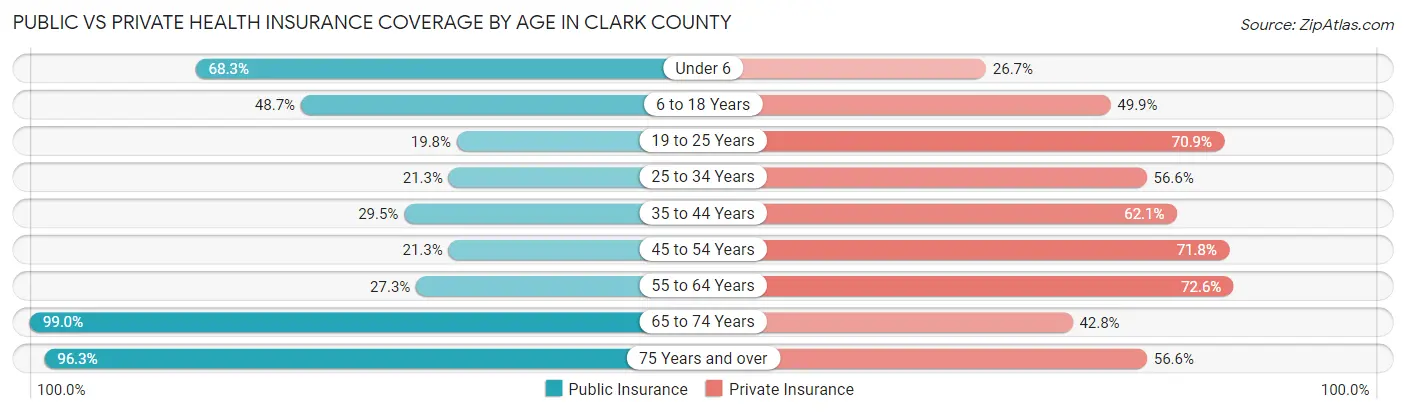
| Age Bracket | Public Insurance | Private Insurance |
| Under 6 | 832 (68.2%) | 326 (26.7%) |
| 6 to 18 Years | 1,761 (48.7%) | 1,802 (49.8%) |
| 19 to 25 Years | 884 (19.8%) | 3,171 (70.9%) |
| 25 to 34 Years | 445 (21.3%) | 1,184 (56.6%) |
| 35 to 44 Years | 599 (29.5%) | 1,259 (62.1%) |
| 45 to 54 Years | 446 (21.3%) | 1,503 (71.8%) |
| 55 to 64 Years | 647 (27.3%) | 1,720 (72.6%) |
| 65 to 74 Years | 1,920 (99.0%) | 830 (42.8%) |
| 75 Years and over | 1,341 (96.3%) | 788 (56.6%) |
| Total | 8,875 (41.8%) | 12,583 (59.3%) |
Disability Status by Sex by Age in Clark County
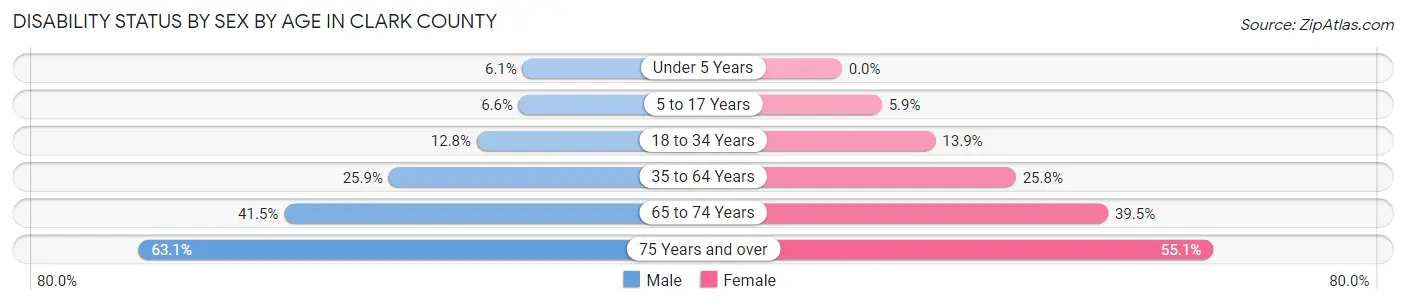
| Age Bracket | Male | Female |
| Under 5 Years | 29 (6.0%) | 0 (0.0%) |
| 5 to 17 Years | 100 (6.6%) | 93 (5.9%) |
| 18 to 34 Years | 460 (12.8%) | 509 (13.9%) |
| 35 to 64 Years | 761 (25.9%) | 918 (25.8%) |
| 65 to 74 Years | 376 (41.5%) | 408 (39.5%) |
| 75 Years and over | 369 (63.1%) | 445 (55.1%) |
Disability Class by Sex by Age in Clark County
Disability Class: Hearing Difficulty
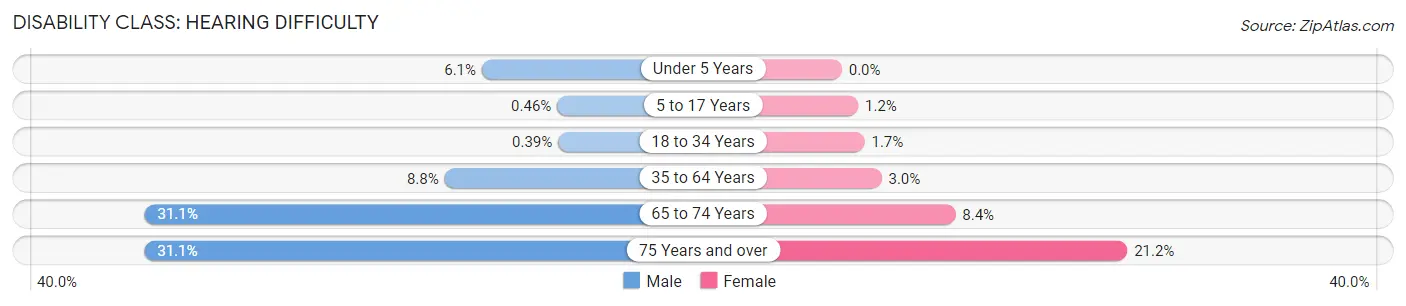
| Age Bracket | Male | Female |
| Under 5 Years | 29 (6.0%) | 0 (0.0%) |
| 5 to 17 Years | 7 (0.5%) | 19 (1.2%) |
| 18 to 34 Years | 14 (0.4%) | 62 (1.7%) |
| 35 to 64 Years | 259 (8.8%) | 105 (2.9%) |
| 65 to 74 Years | 282 (31.1%) | 87 (8.4%) |
| 75 Years and over | 182 (31.1%) | 171 (21.2%) |
Disability Class: Vision Difficulty
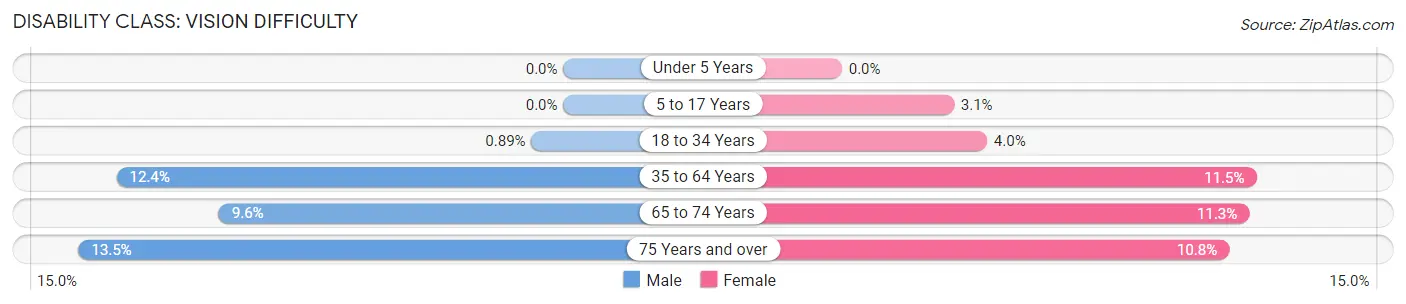
| Age Bracket | Male | Female |
| Under 5 Years | 0 (0.0%) | 0 (0.0%) |
| 5 to 17 Years | 0 (0.0%) | 49 (3.1%) |
| 18 to 34 Years | 32 (0.9%) | 148 (4.0%) |
| 35 to 64 Years | 365 (12.4%) | 410 (11.5%) |
| 65 to 74 Years | 87 (9.6%) | 117 (11.3%) |
| 75 Years and over | 79 (13.5%) | 87 (10.8%) |
Disability Class: Cognitive Difficulty
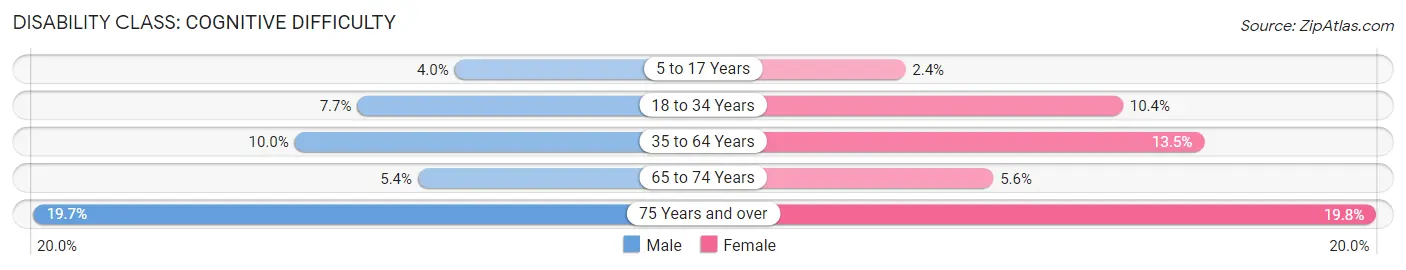
| Age Bracket | Male | Female |
| 5 to 17 Years | 61 (4.0%) | 37 (2.4%) |
| 18 to 34 Years | 274 (7.6%) | 382 (10.4%) |
| 35 to 64 Years | 293 (10.0%) | 478 (13.5%) |
| 65 to 74 Years | 49 (5.4%) | 58 (5.6%) |
| 75 Years and over | 115 (19.7%) | 160 (19.8%) |
Disability Class: Ambulatory Difficulty
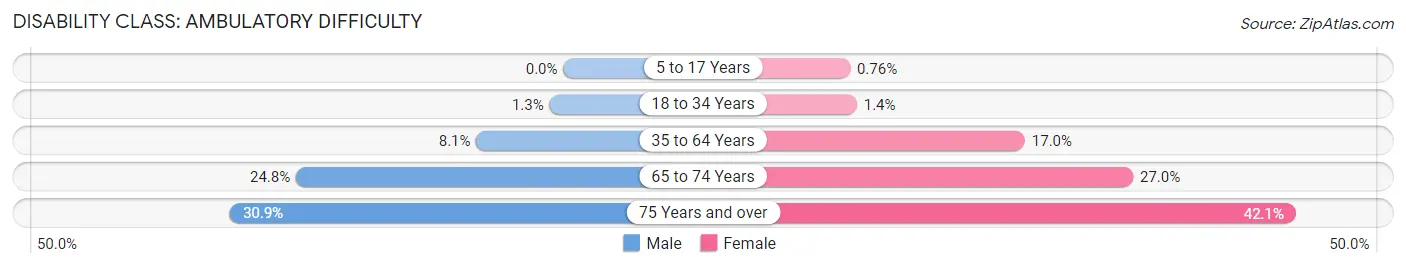
| Age Bracket | Male | Female |
| 5 to 17 Years | 0 (0.0%) | 12 (0.8%) |
| 18 to 34 Years | 46 (1.3%) | 51 (1.4%) |
| 35 to 64 Years | 237 (8.1%) | 604 (17.0%) |
| 65 to 74 Years | 225 (24.8%) | 279 (27.0%) |
| 75 Years and over | 181 (30.9%) | 340 (42.1%) |
Disability Class: Self-Care Difficulty
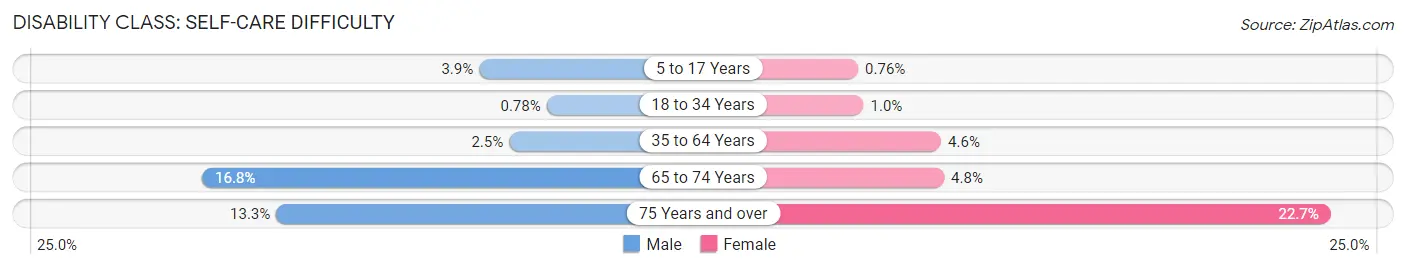
| Age Bracket | Male | Female |
| 5 to 17 Years | 59 (3.9%) | 12 (0.8%) |
| 18 to 34 Years | 28 (0.8%) | 37 (1.0%) |
| 35 to 64 Years | 74 (2.5%) | 164 (4.6%) |
| 65 to 74 Years | 152 (16.8%) | 49 (4.8%) |
| 75 Years and over | 78 (13.3%) | 183 (22.7%) |
Technology Access in Clark County
Computing Device Access in Clark County
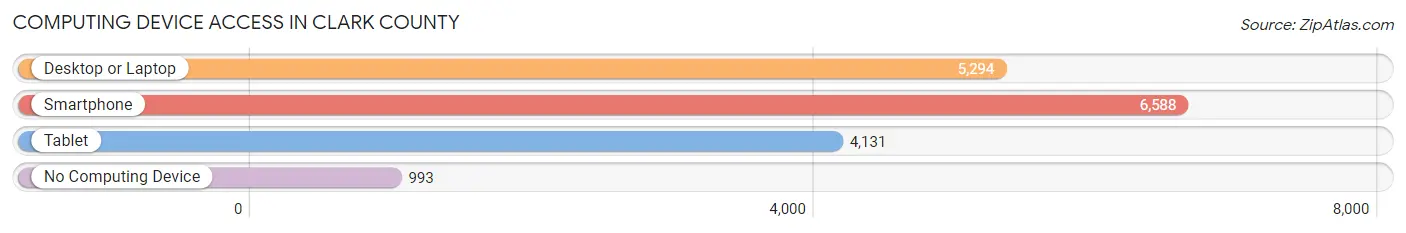
| Device Type | # Households | % Households |
| Desktop or Laptop | 5,294 | 66.5% |
| Smartphone | 6,588 | 82.8% |
| Tablet | 4,131 | 51.9% |
| No Computing Device | 993 | 12.5% |
| Total | 7,955 | 100.0% |
Internet Access in Clark County
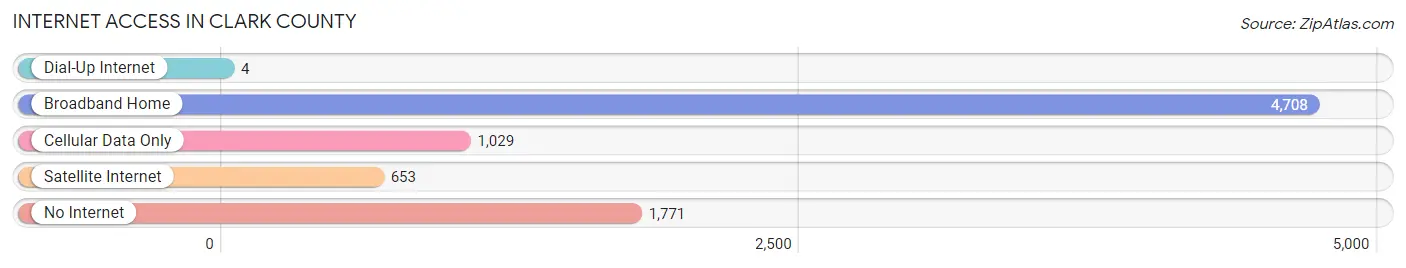
| Internet Type | # Households | % Households |
| Dial-Up Internet | 4 | 0.1% |
| Broadband Home | 4,708 | 59.2% |
| Cellular Data Only | 1,029 | 12.9% |
| Satellite Internet | 653 | 8.2% |
| No Internet | 1,771 | 22.3% |
| Total | 7,955 | 100.0% |
Clark County Summary
Clark County is located in the southwestern corner of Arkansas, and is bordered by Nevada, Hempstead, and Pike counties. It is part of the Texarkana metropolitan area, and is the second-smallest county in the state. The county seat is Arkadelphia, and the county has a total area of 517 square miles.
History
Clark County was established in 1818, and was named after William Clark, who was the leader of the Lewis and Clark Expedition. The county was originally part of the Arkansas Territory, and was later part of the state of Arkansas when it was admitted to the Union in 1836.
The county was home to several Native American tribes, including the Caddo, Choctaw, and Quapaw. The first European settlers arrived in the area in the early 1800s, and the county was officially organized in 1818.
The county was home to several Civil War battles, including the Battle of Elkin’s Ferry and the Battle of Poison Spring. After the war, the county experienced a period of economic growth, and several railroads were built in the area.
Geography
Clark County is located in the southwestern corner of Arkansas, and is bordered by Nevada, Hempstead, and Pike counties. It is part of the Texarkana metropolitan area, and is the second-smallest county in the state. The county has a total area of 517 square miles, and is mostly covered in forests and rolling hills.
The county is home to several rivers and streams, including the Ouachita River, the Little Missouri River, and the Caddo River. The county is also home to several lakes, including Lake DeGray, Lake Greeson, and Lake Hamilton.
Economy
The economy of Clark County is largely based on agriculture and forestry. The county is home to several large farms, and the main crops grown in the area are cotton, soybeans, corn, and wheat. The county is also home to several timber companies, and the main products produced in the area are lumber and paper products.
The county is also home to several manufacturing companies, and the main products produced in the area are furniture, clothing, and food products. The county is also home to several mining companies, and the main minerals mined in the area are coal, oil, and natural gas.
Demographics
As of the 2010 census, the population of Clark County was 22,995. The population is mostly white (86.3%), with small percentages of African Americans (9.2%), Hispanics (2.2%), and Native Americans (0.7%).
The median household income in the county is $37,945, and the median family income is $45,945. The per capita income in the county is $19,945, and the poverty rate is 17.3%.
The county is home to several educational institutions, including Henderson State University, Ouachita Baptist University, and Arkansas Tech University. The county is also home to several healthcare facilities, including the Clark County Medical Center and the Clark County Regional Medical Center.
Common Questions
What is Per Capita Income in Clark County?
Per Capita income in Clark County is $24,532.
What is the Median Family Income in Clark County?
Median Family Income in Clark County is $66,543.
What is the Median Household income in Clark County?
Median Household Income in Clark County is $48,071.
What is Income or Wage Gap in Clark County?
Income or Wage Gap in Clark County is 42.3%.
Women in Clark County earn 57.7 cents for every dollar earned by a man.
What is Family Income Deficit in Clark County?
Family Income Deficit in Clark County is $10,621.
Families that are below poverty line in Clark County earn $10,621 less on average than the poverty threshold level.
What is Inequality or Gini Index in Clark County?
Inequality or Gini Index in Clark County is 0.45.
What is the Total Population of Clark County?
Total Population of Clark County is 21,469.
What is the Total Male Population of Clark County?
Total Male Population of Clark County is 10,113.
What is the Total Female Population of Clark County?
Total Female Population of Clark County is 11,356.
What is the Ratio of Males per 100 Females in Clark County?
There are 89.05 Males per 100 Females in Clark County.
What is the Ratio of Females per 100 Males in Clark County?
There are 112.29 Females per 100 Males in Clark County.
What is the Median Population Age in Clark County?
Median Population Age in Clark County is 31.7 Years.
What is the Average Family Size in Clark County
Average Family Size in Clark County is 3.1 People.
What is the Average Household Size in Clark County
Average Household Size in Clark County is 2.4 People.
How Large is the Labor Force in Clark County?
There are 10,307 People in the Labor Forcein in Clark County.
What is the Percentage of People in the Labor Force in Clark County?
58.0% of People are in the Labor Force in Clark County.
What is the Unemployment Rate in Clark County?
Unemployment Rate in Clark County is 4.1%.