Bodcaw, AR Map & Demographics
Bodcaw Map
Bodcaw Overview
$24,281
PER CAPITA INCOME
$49,514
AVG FAMILY INCOME
$49,464
AVG HOUSEHOLD INCOME
94.5%
WAGE / INCOME GAP [ % ]
5.5¢/ $1
WAGE / INCOME GAP [ $ ]
0.27
INEQUALITY / GINI INDEX
143
TOTAL POPULATION
90
MALE POPULATION
53
FEMALE POPULATION
169.81
MALES / 100 FEMALES
58.89
FEMALES / 100 MALES
30.9
MEDIAN AGE
2.9
AVG FAMILY SIZE
3.2
AVG HOUSEHOLD SIZE
71
LABOR FORCE [ PEOPLE ]
77.2%
PERCENT IN LABOR FORCE
Income in Bodcaw
Income Overview in Bodcaw
Per Capita Income in Bodcaw is $24,281, while median incomes of families and households are $49,514 and $49,464 respectively.
| Characteristic | Number | Measure |
| Per Capita Income | 143 | $24,281 |
| Median Family Income | 35 | $49,514 |
| Mean Family Income | 35 | $69,954 |
| Median Household Income | 45 | $49,464 |
| Mean Household Income | 45 | $64,991 |
| Income Deficit | 35 | $0 |
| Wage / Income Gap (%) | 143 | 94.51% |
| Wage / Income Gap ($) | 143 | 5.49¢ per $1 |
| Gini / Inequality Index | 143 | 0.27 |
Earnings by Sex in Bodcaw
Average Earnings in Bodcaw are $42,031, $45,515 for men and $2,499 for women, a difference of 94.5%.
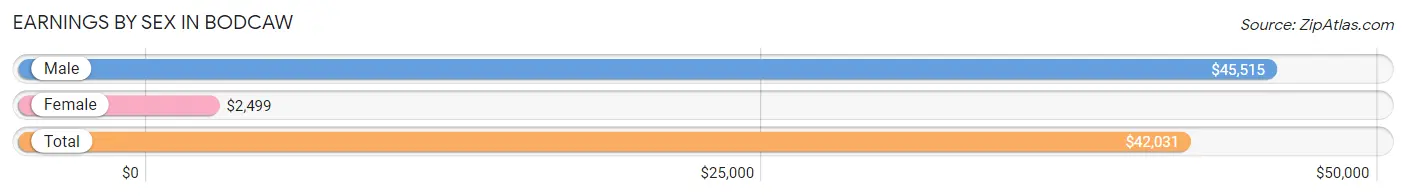
| Sex | Number | Average Earnings |
| Male | 43 (58.9%) | $45,515 |
| Female | 30 (41.1%) | $2,499 |
| Total | 73 (100.0%) | $42,031 |
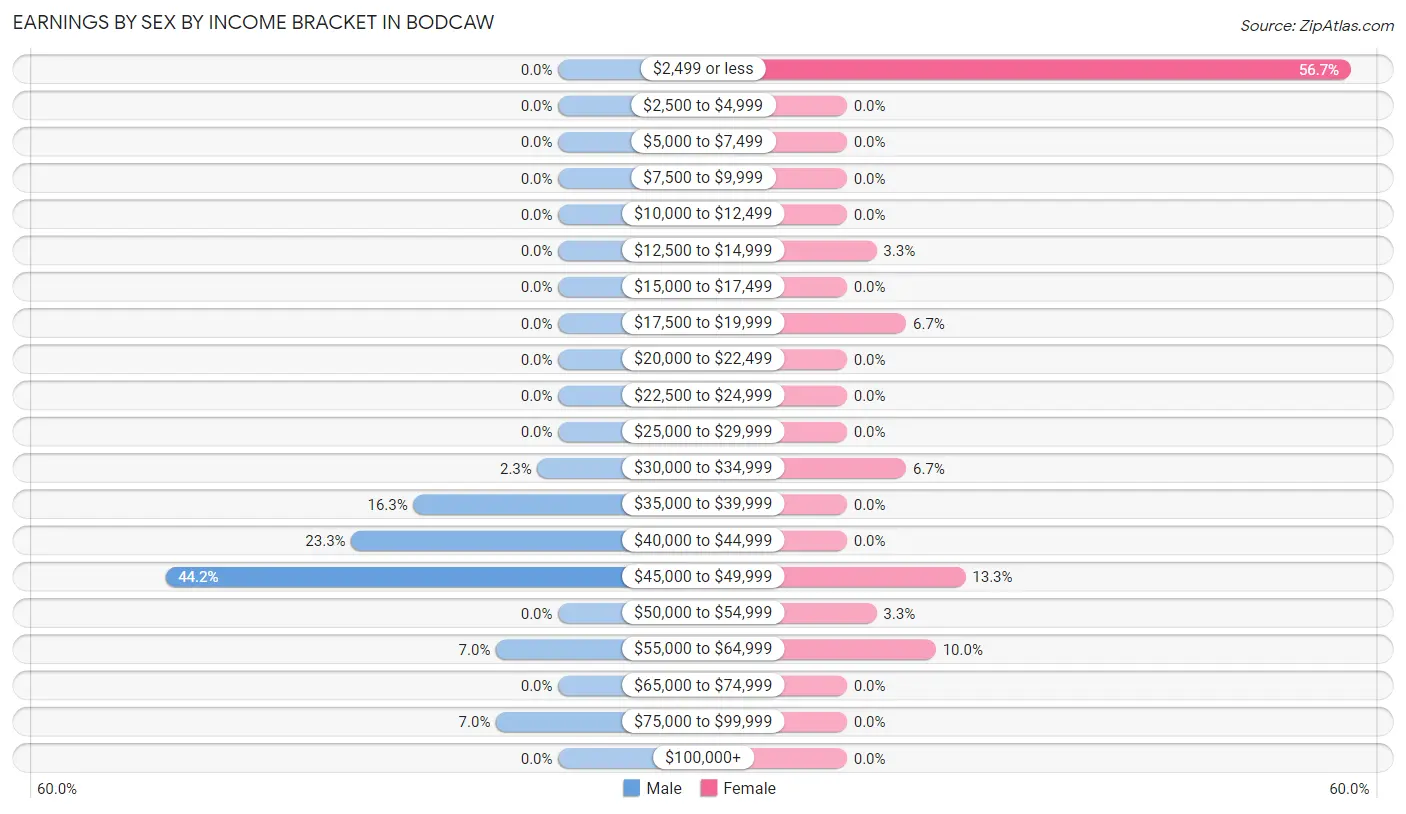
Earnings by Sex by Income Bracket in Bodcaw
The most common earnings brackets in Bodcaw are $45,000 to $49,999 for men (19 | 44.2%) and $2,499 or less for women (17 | 56.7%).
| Income | Male | Female |
| $2,499 or less | 0 (0.0%) | 17 (56.7%) |
| $2,500 to $4,999 | 0 (0.0%) | 0 (0.0%) |
| $5,000 to $7,499 | 0 (0.0%) | 0 (0.0%) |
| $7,500 to $9,999 | 0 (0.0%) | 0 (0.0%) |
| $10,000 to $12,499 | 0 (0.0%) | 0 (0.0%) |
| $12,500 to $14,999 | 0 (0.0%) | 1 (3.3%) |
| $15,000 to $17,499 | 0 (0.0%) | 0 (0.0%) |
| $17,500 to $19,999 | 0 (0.0%) | 2 (6.7%) |
| $20,000 to $22,499 | 0 (0.0%) | 0 (0.0%) |
| $22,500 to $24,999 | 0 (0.0%) | 0 (0.0%) |
| $25,000 to $29,999 | 0 (0.0%) | 0 (0.0%) |
| $30,000 to $34,999 | 1 (2.3%) | 2 (6.7%) |
| $35,000 to $39,999 | 7 (16.3%) | 0 (0.0%) |
| $40,000 to $44,999 | 10 (23.3%) | 0 (0.0%) |
| $45,000 to $49,999 | 19 (44.2%) | 4 (13.3%) |
| $50,000 to $54,999 | 0 (0.0%) | 1 (3.3%) |
| $55,000 to $64,999 | 3 (7.0%) | 3 (10.0%) |
| $65,000 to $74,999 | 0 (0.0%) | 0 (0.0%) |
| $75,000 to $99,999 | 3 (7.0%) | 0 (0.0%) |
| $100,000+ | 0 (0.0%) | 0 (0.0%) |
| Total | 43 (100.0%) | 30 (100.0%) |
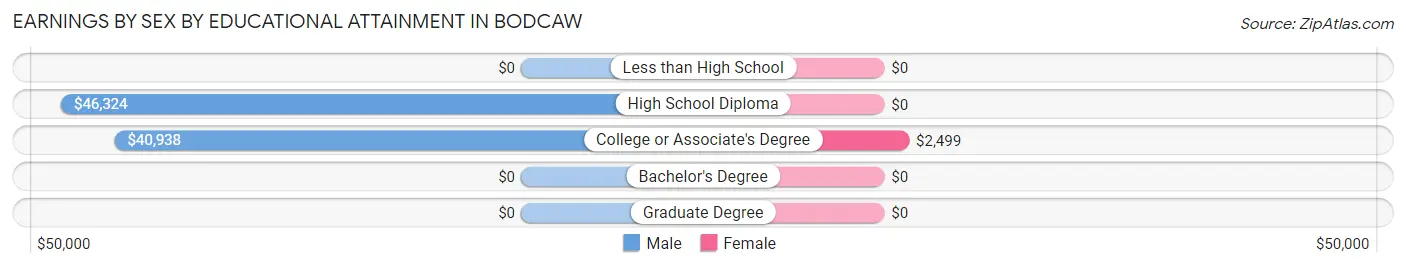
Earnings by Sex by Educational Attainment in Bodcaw
Average earnings in Bodcaw are $45,588 for men and $2,499 for women, a difference of 94.5%. Men with an educational attainment of high school diploma enjoy the highest average annual earnings of $46,324, while those with college or associate's degree education earn the least with $40,938. Women with an educational attainment of college or associate's degree earn the most with the average annual earnings of $2,499, while those with college or associate's degree education have the smallest earnings of $2,499.
| Educational Attainment | Male Income | Female Income |
| Less than High School | - | - |
| High School Diploma | $46,324 | $0 |
| College or Associate's Degree | $40,938 | $2,499 |
| Bachelor's Degree | - | - |
| Graduate Degree | - | - |
| Total | $45,588 | $2,499 |
Family Income in Bodcaw
Family Income Brackets in Bodcaw
According to the Bodcaw family income data, there are 20 families falling into the $35,000 to $49,999 income range, which is the most common income bracket and makes up 57.1% of all families.
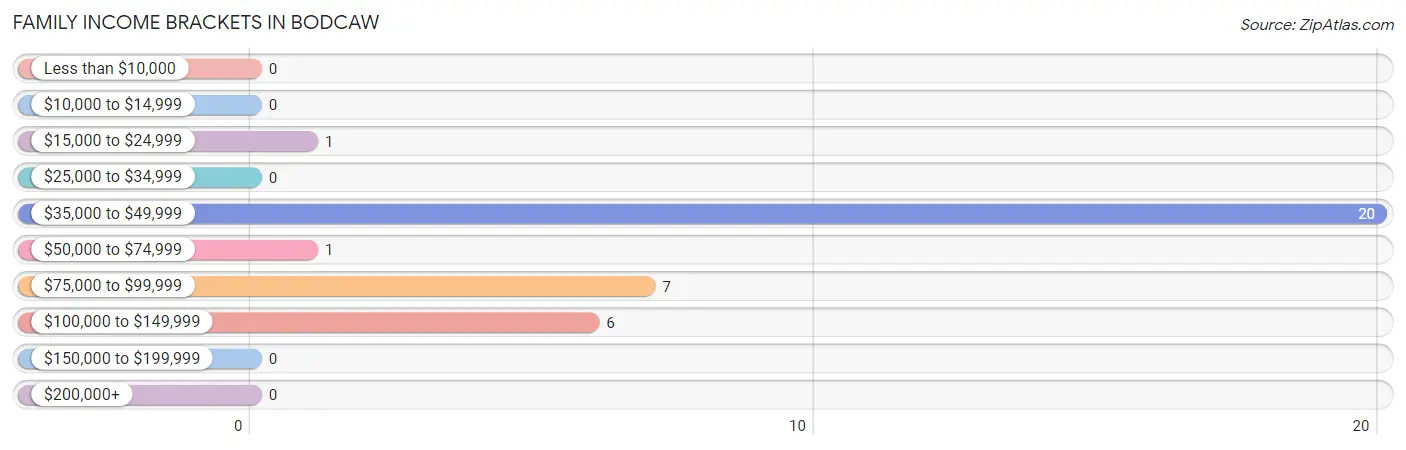
| Income Bracket | # Families | % Families |
| Less than $10,000 | 0 | 0.0% |
| $10,000 to $14,999 | 0 | 0.0% |
| $15,000 to $24,999 | 1 | 2.9% |
| $25,000 to $34,999 | 0 | 0.0% |
| $35,000 to $49,999 | 20 | 57.1% |
| $50,000 to $74,999 | 1 | 2.9% |
| $75,000 to $99,999 | 7 | 20.0% |
| $100,000 to $149,999 | 6 | 17.1% |
| $150,000 to $199,999 | 0 | 0.0% |
| $200,000+ | 0 | 0.0% |
Family Income by Famaliy Size in Bodcaw
3-person families (6 | 17.1%) account for the highest median family income in Bodcaw with $76,250 per family, while 3-person families (6 | 17.1%) have the highest median income of $25,417 per family member.
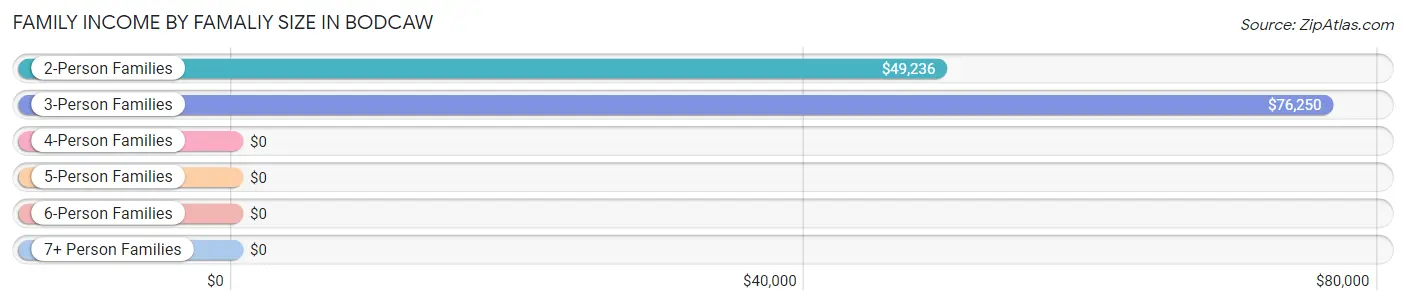
| Income Bracket | # Families | Median Income |
| 2-Person Families | 27 (77.1%) | $49,236 |
| 3-Person Families | 6 (17.1%) | $76,250 |
| 4-Person Families | 1 (2.9%) | $0 |
| 5-Person Families | 1 (2.9%) | $0 |
| 6-Person Families | 0 (0.0%) | $0 |
| 7+ Person Families | 0 (0.0%) | $0 |
| Total | 35 (100.0%) | $49,514 |
Family Income by Number of Earners in Bodcaw
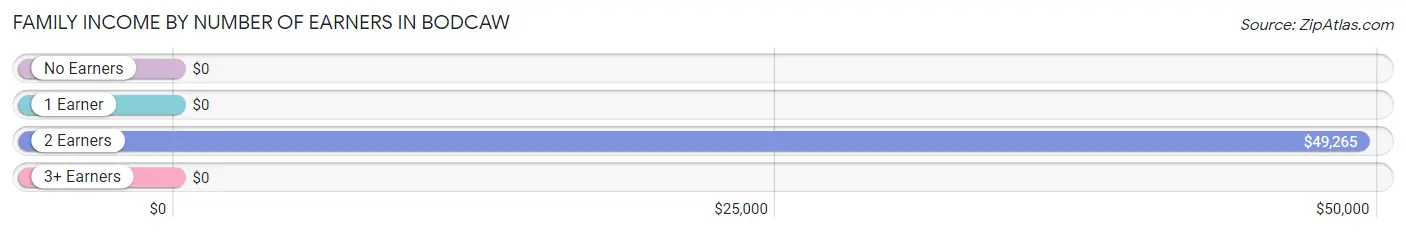
| Number of Earners | # Families | Median Income |
| No Earners | 5 (14.3%) | $0 |
| 1 Earner | 5 (14.3%) | $0 |
| 2 Earners | 24 (68.6%) | $49,265 |
| 3+ Earners | 1 (2.9%) | $0 |
| Total | 35 (100.0%) | $49,514 |
Household Income in Bodcaw
Household Income Brackets in Bodcaw
With 23 households falling in the category, the $35,000 to $49,999 income range is the most frequent in Bodcaw, accounting for 51.1% of all households.
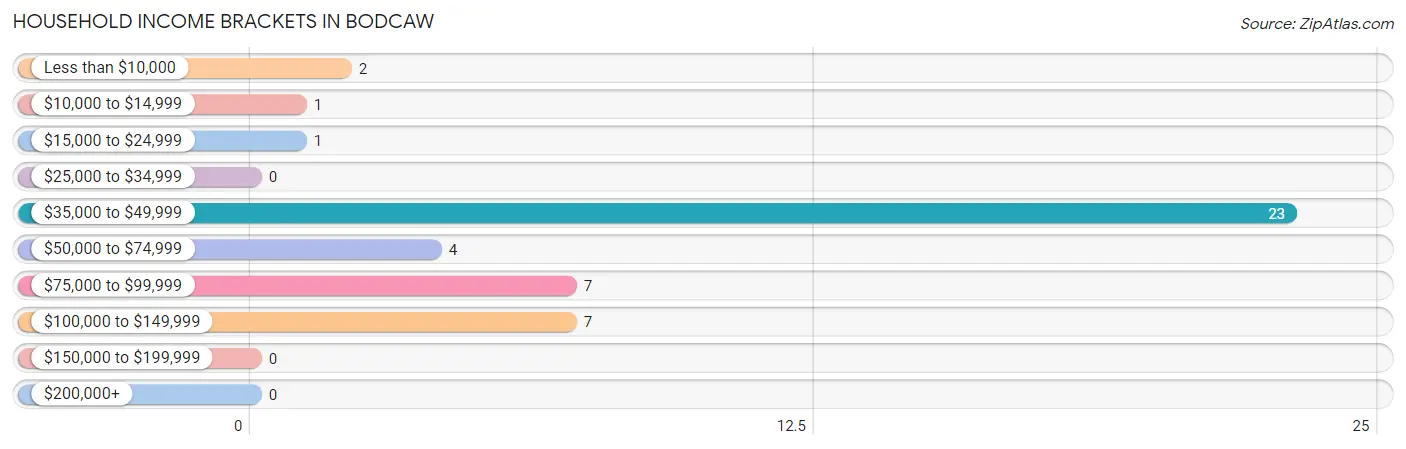
| Income Bracket | # Households | % Households |
| Less than $10,000 | 2 | 4.4% |
| $10,000 to $14,999 | 1 | 2.2% |
| $15,000 to $24,999 | 1 | 2.2% |
| $25,000 to $34,999 | 0 | 0.0% |
| $35,000 to $49,999 | 23 | 51.1% |
| $50,000 to $74,999 | 4 | 8.9% |
| $75,000 to $99,999 | 7 | 15.6% |
| $100,000 to $149,999 | 7 | 15.6% |
| $150,000 to $199,999 | 0 | 0.0% |
| $200,000+ | 0 | 0.0% |
Household Income by Householder Age in Bodcaw
The median household income in Bodcaw is $49,464, with the highest median household income of $71,250 found in the 65+ years age bracket for the primary householder. A total of 11 households (24.4%) fall into this category.
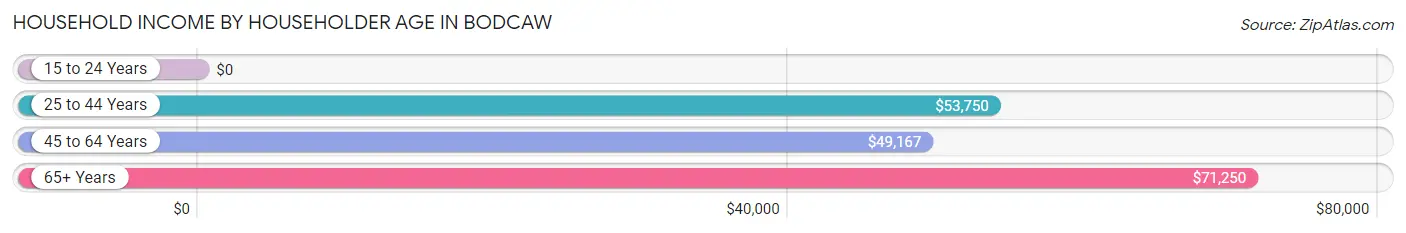
| Income Bracket | # Households | Median Income |
| 15 to 24 Years | 0 (0.0%) | $0 |
| 25 to 44 Years | 4 (8.9%) | $53,750 |
| 45 to 64 Years | 30 (66.7%) | $49,167 |
| 65+ Years | 11 (24.4%) | $71,250 |
| Total | 45 (100.0%) | $49,464 |
Poverty in Bodcaw
Income Below Poverty by Sex and Age in Bodcaw
With 4.2% poverty level for males and 5.3% for females among the residents of Bodcaw, 55 to 64 year old males and 55 to 64 year old females are the most vulnerable to poverty, with 1 males (25.0%) and 1 females (25.0%) in their respective age groups living below the poverty level.
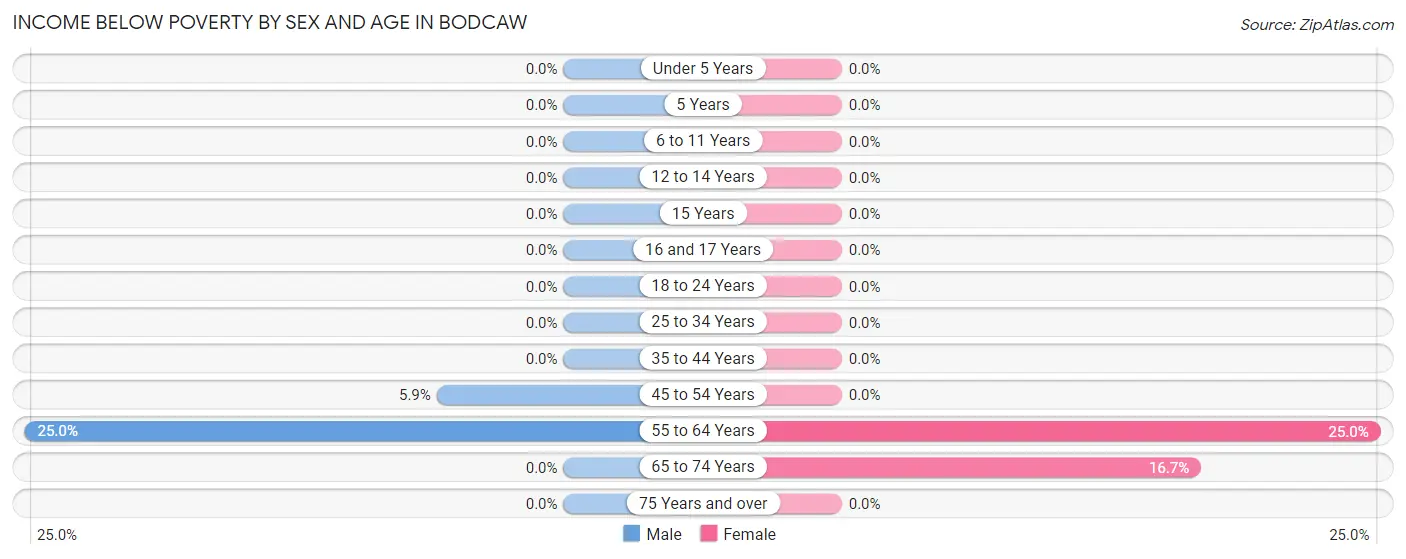
| Age Bracket | Male | Female |
| Under 5 Years | 0 (0.0%) | 0 (0.0%) |
| 5 Years | 0 (0.0%) | 0 (0.0%) |
| 6 to 11 Years | 0 (0.0%) | 0 (0.0%) |
| 12 to 14 Years | 0 (0.0%) | 0 (0.0%) |
| 15 Years | 0 (0.0%) | 0 (0.0%) |
| 16 and 17 Years | 0 (0.0%) | 0 (0.0%) |
| 18 to 24 Years | 0 (0.0%) | 0 (0.0%) |
| 25 to 34 Years | 0 (0.0%) | 0 (0.0%) |
| 35 to 44 Years | 0 (0.0%) | 0 (0.0%) |
| 45 to 54 Years | 2 (5.9%) | 0 (0.0%) |
| 55 to 64 Years | 1 (25.0%) | 1 (25.0%) |
| 65 to 74 Years | 0 (0.0%) | 1 (16.7%) |
| 75 Years and over | 0 (0.0%) | 0 (0.0%) |
| Total | 3 (4.2%) | 2 (5.3%) |
Income Above Poverty by Sex and Age in Bodcaw
According to the poverty statistics in Bodcaw, males aged under 5 years and females aged 5 years are the age groups that are most secure financially, with 100.0% of males and 100.0% of females in these age groups living above the poverty line.
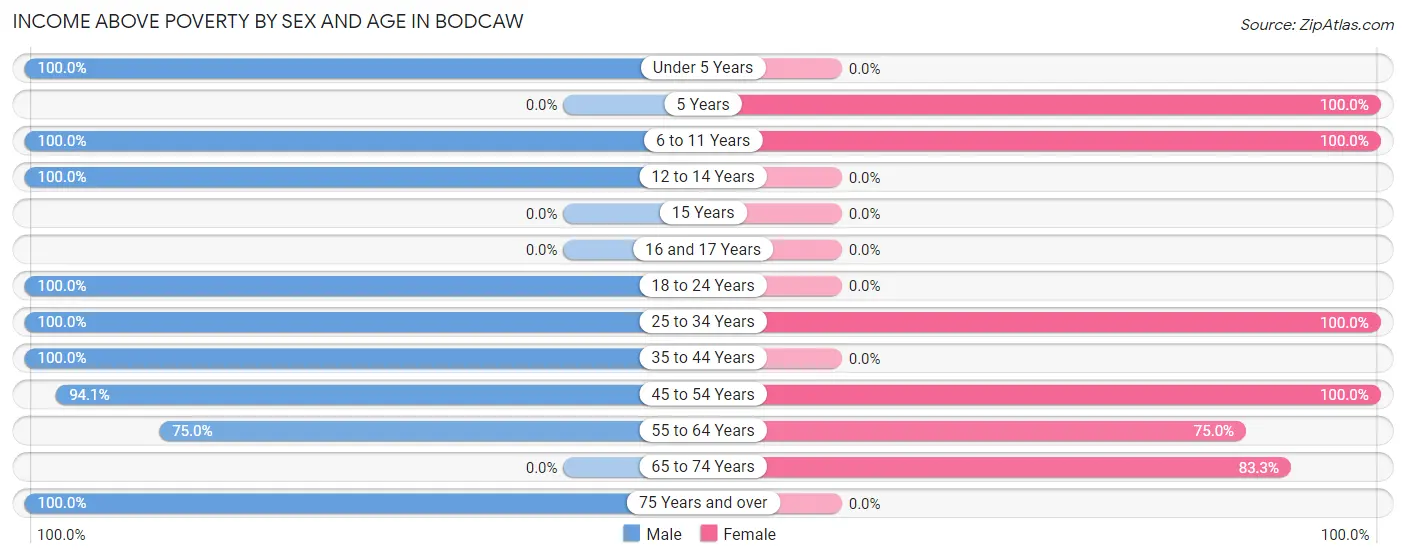
| Age Bracket | Male | Female |
| Under 5 Years | 6 (100.0%) | 0 (0.0%) |
| 5 Years | 0 (0.0%) | 2 (100.0%) |
| 6 to 11 Years | 8 (100.0%) | 1 (100.0%) |
| 12 to 14 Years | 1 (100.0%) | 0 (0.0%) |
| 15 Years | 0 (0.0%) | 0 (0.0%) |
| 16 and 17 Years | 0 (0.0%) | 0 (0.0%) |
| 18 to 24 Years | 1 (100.0%) | 0 (0.0%) |
| 25 to 34 Years | 9 (100.0%) | 19 (100.0%) |
| 35 to 44 Years | 2 (100.0%) | 0 (0.0%) |
| 45 to 54 Years | 32 (94.1%) | 6 (100.0%) |
| 55 to 64 Years | 3 (75.0%) | 3 (75.0%) |
| 65 to 74 Years | 0 (0.0%) | 5 (83.3%) |
| 75 Years and over | 7 (100.0%) | 0 (0.0%) |
| Total | 69 (95.8%) | 36 (94.7%) |
Income Below Poverty Among Married-Couple Families in Bodcaw
The poverty statistics for married-couple families in Bodcaw show that 3.0% or 1 of the total 33 families live below the poverty line. Families with no children have the highest poverty rate of 3.6%, comprising of 1 families. On the other hand, families with 1 or 2 children have the lowest poverty rate of 0.0%, which includes 0 families.
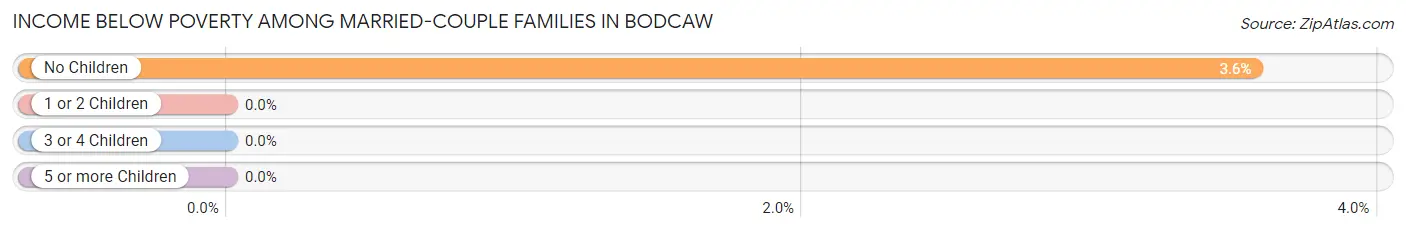
| Children | Above Poverty | Below Poverty |
| No Children | 27 (96.4%) | 1 (3.6%) |
| 1 or 2 Children | 4 (100.0%) | 0 (0.0%) |
| 3 or 4 Children | 1 (100.0%) | 0 (0.0%) |
| 5 or more Children | 0 (0.0%) | 0 (0.0%) |
| Total | 32 (97.0%) | 1 (3.0%) |
Income Below Poverty Among Single-Parent Households in Bodcaw
| Children | Single Father | Single Mother |
| No Children | 0 (0.0%) | 0 (0.0%) |
| 1 or 2 Children | 0 (0.0%) | 0 (0.0%) |
| 3 or 4 Children | 0 (0.0%) | 0 (0.0%) |
| 5 or more Children | 0 (0.0%) | 0 (0.0%) |
| Total | 0 (0.0%) | 0 (0.0%) |
Income Below Poverty Among Married-Couple vs Single-Parent Households in Bodcaw
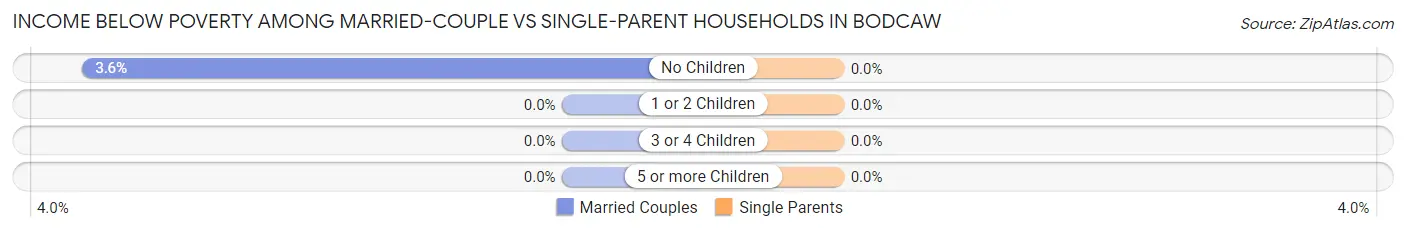
| Children | Married-Couple Families | Single-Parent Households |
| No Children | 1 (3.6%) | 0 (0.0%) |
| 1 or 2 Children | 0 (0.0%) | 0 (0.0%) |
| 3 or 4 Children | 0 (0.0%) | 0 (0.0%) |
| 5 or more Children | 0 (0.0%) | 0 (0.0%) |
| Total | 1 (3.0%) | 0 (0.0%) |
Race in Bodcaw
The most populous races in Bodcaw are White / Caucasian (136 | 95.1%), Black / African American (5 | 3.5%), and Two or more Races (2 | 1.4%).
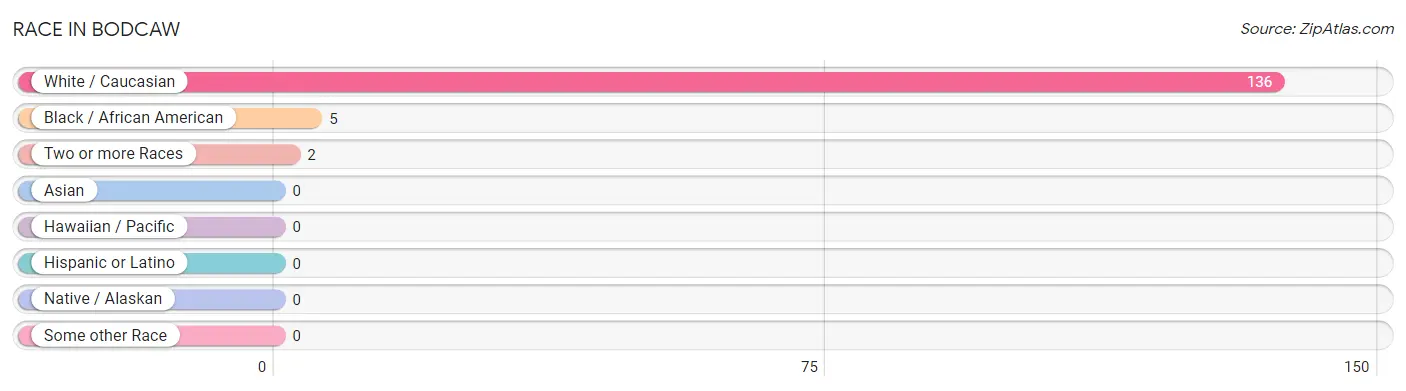
| Race | # Population | % Population |
| Asian | 0 | 0.0% |
| Black / African American | 5 | 3.5% |
| Hawaiian / Pacific | 0 | 0.0% |
| Hispanic or Latino | 0 | 0.0% |
| Native / Alaskan | 0 | 0.0% |
| White / Caucasian | 136 | 95.1% |
| Two or more Races | 2 | 1.4% |
| Some other Race | 0 | 0.0% |
| Total | 143 | 100.0% |
Ancestry in Bodcaw
The most populous ancestries reported in Bodcaw are Irish (16 | 11.2%), German (14 | 9.8%), American (5 | 3.5%), and English (2 | 1.4%), together accounting for 25.9% of all Bodcaw residents.
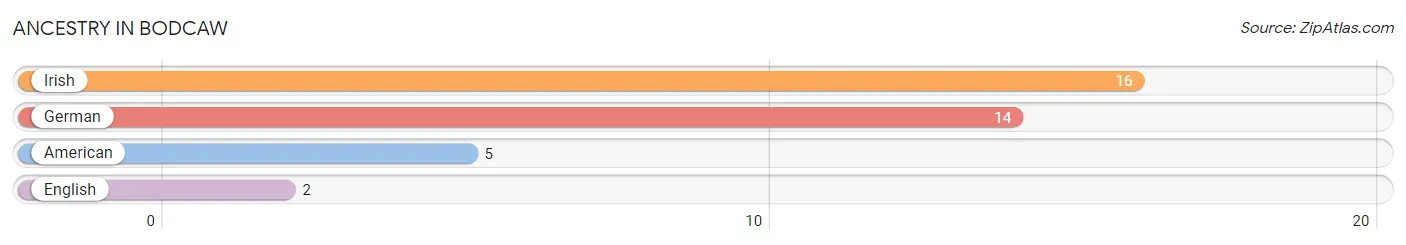
| Ancestry | # Population | % Population |
| American | 5 | 3.5% |
| English | 2 | 1.4% |
| German | 14 | 9.8% |
| Irish | 16 | 11.2% | View All 4 Rows |
Immigrants in Bodcaw

| Immigration Origin | # Population | % Population | View All 0 Rows |
Sex and Age in Bodcaw
Sex and Age in Bodcaw
The most populous age groups in Bodcaw are 5 to 9 Years (26 | 28.9%) for men and 30 to 34 Years (17 | 32.1%) for women.
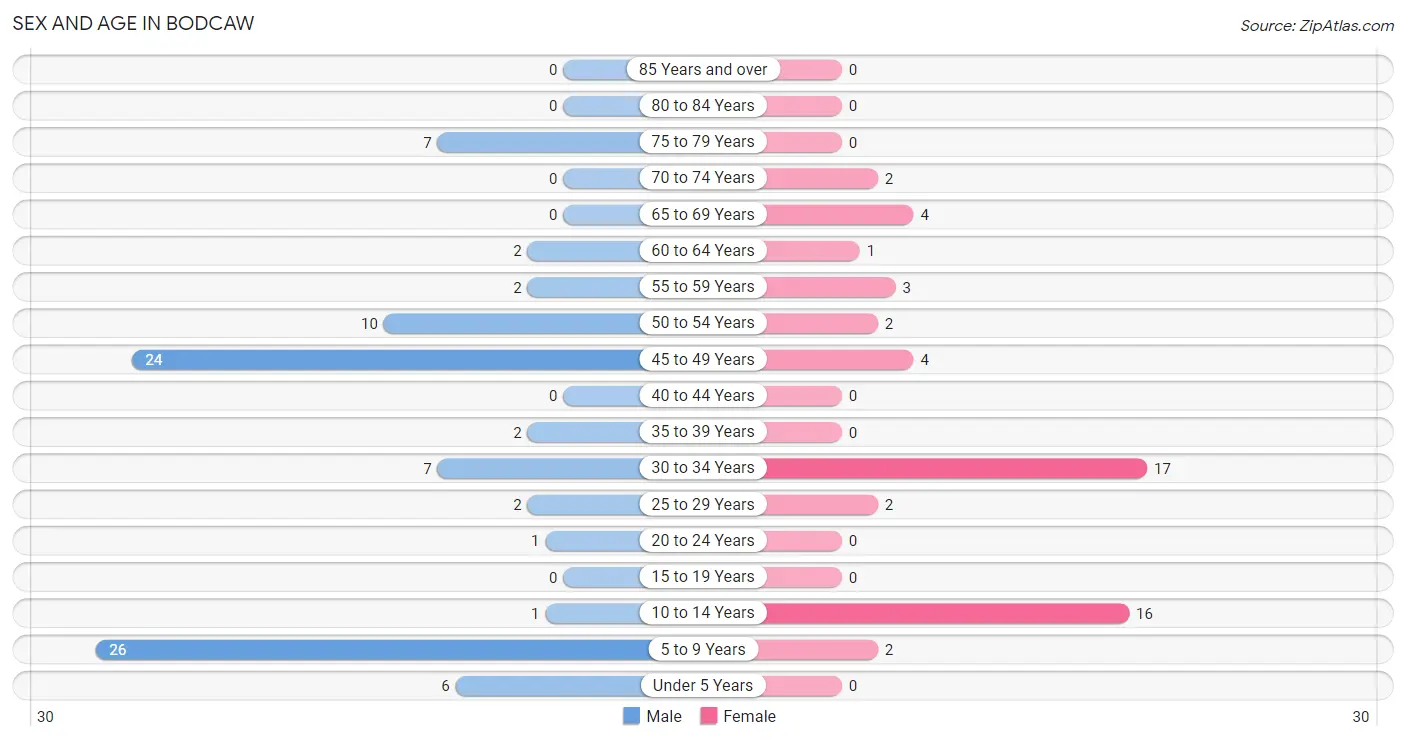
| Age Bracket | Male | Female |
| Under 5 Years | 6 (6.7%) | 0 (0.0%) |
| 5 to 9 Years | 26 (28.9%) | 2 (3.8%) |
| 10 to 14 Years | 1 (1.1%) | 16 (30.2%) |
| 15 to 19 Years | 0 (0.0%) | 0 (0.0%) |
| 20 to 24 Years | 1 (1.1%) | 0 (0.0%) |
| 25 to 29 Years | 2 (2.2%) | 2 (3.8%) |
| 30 to 34 Years | 7 (7.8%) | 17 (32.1%) |
| 35 to 39 Years | 2 (2.2%) | 0 (0.0%) |
| 40 to 44 Years | 0 (0.0%) | 0 (0.0%) |
| 45 to 49 Years | 24 (26.7%) | 4 (7.5%) |
| 50 to 54 Years | 10 (11.1%) | 2 (3.8%) |
| 55 to 59 Years | 2 (2.2%) | 3 (5.7%) |
| 60 to 64 Years | 2 (2.2%) | 1 (1.9%) |
| 65 to 69 Years | 0 (0.0%) | 4 (7.5%) |
| 70 to 74 Years | 0 (0.0%) | 2 (3.8%) |
| 75 to 79 Years | 7 (7.8%) | 0 (0.0%) |
| 80 to 84 Years | 0 (0.0%) | 0 (0.0%) |
| 85 Years and over | 0 (0.0%) | 0 (0.0%) |
| Total | 90 (100.0%) | 53 (100.0%) |
Families and Households in Bodcaw
Median Family Size in Bodcaw
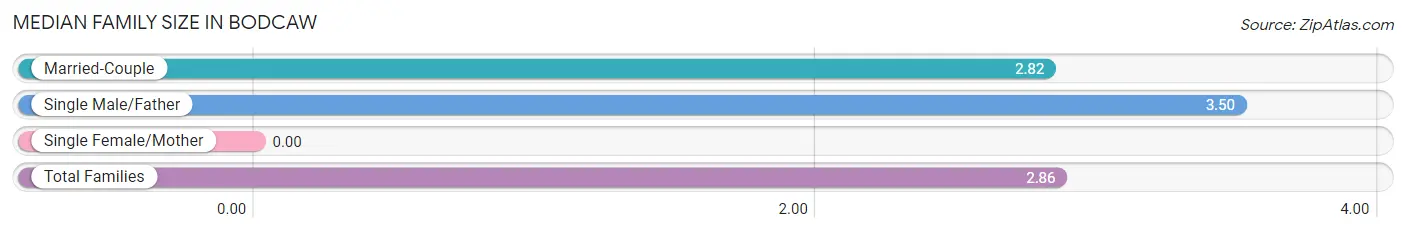
| Family Type | # Families | Family Size |
| Married-Couple | 33 (94.3%) | 2.82 |
| Single Male/Father | 2 (5.7%) | 3.50 |
| Single Female/Mother | 0 (0.0%) | - |
| Total Families | 35 (100.0%) | 2.86 |
Median Household Size in Bodcaw
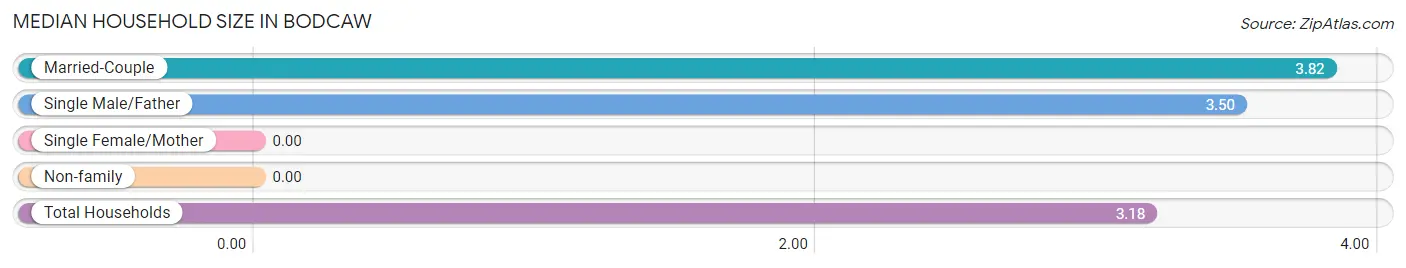
| Household Type | # Households | Household Size |
| Married-Couple | 33 (73.3%) | 3.82 |
| Single Male/Father | 2 (4.4%) | 3.50 |
| Single Female/Mother | 0 (0.0%) | - |
| Non-family | 10 (22.2%) | - |
| Total Households | 45 (100.0%) | 3.18 |
Household Size by Marriage Status in Bodcaw
Out of a total of 45 households in Bodcaw, 35 (77.8%) are family households, while 10 (22.2%) are nonfamily households. The most numerous type of family households are 4-person households, comprising 18, and the most common type of nonfamily households are 1-person households, comprising 10.
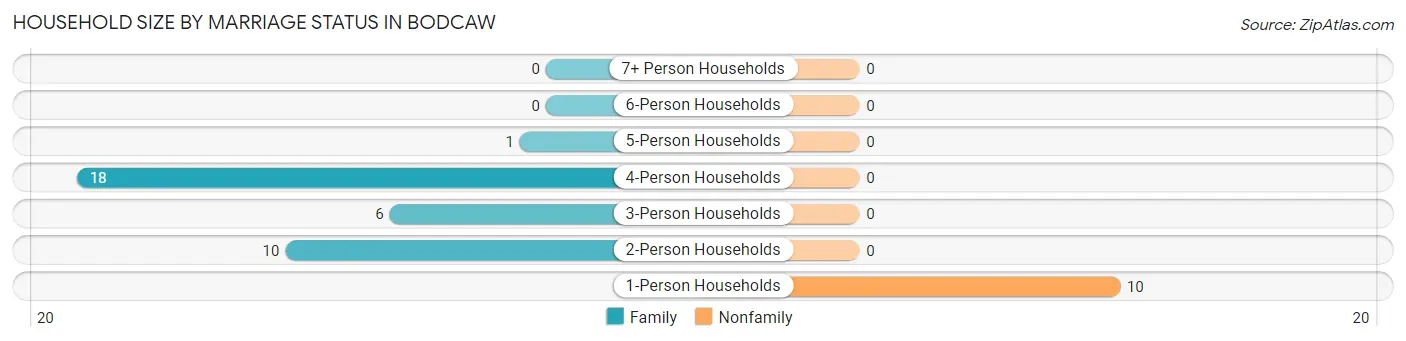
| Household Size | Family Households | Nonfamily Households |
| 1-Person Households | - | 10 (22.2%) |
| 2-Person Households | 10 (22.2%) | 0 (0.0%) |
| 3-Person Households | 6 (13.3%) | 0 (0.0%) |
| 4-Person Households | 18 (40.0%) | 0 (0.0%) |
| 5-Person Households | 1 (2.2%) | 0 (0.0%) |
| 6-Person Households | 0 (0.0%) | 0 (0.0%) |
| 7+ Person Households | 0 (0.0%) | 0 (0.0%) |
| Total | 35 (77.8%) | 10 (22.2%) |
Female Fertility in Bodcaw
Fertility by Age in Bodcaw
| Age Bracket | Women with Births | Births / 1,000 Women |
| 15 to 19 years | 0 (0.0%) | 0.0 |
| 20 to 34 years | 0 (0.0%) | 0.0 |
| 35 to 50 years | 0 (0.0%) | 0.0 |
| Total | 0 (0.0%) | 0.0 |
Fertility by Age by Marriage Status in Bodcaw
| Age Bracket | Married | Unmarried |
| 15 to 19 years | 0 (0.0%) | 0 (0.0%) |
| 20 to 34 years | 0 (0.0%) | 0 (0.0%) |
| 35 to 50 years | 0 (0.0%) | 0 (0.0%) |
| Total | 0 (0.0%) | 0 (0.0%) |
Fertility by Education in Bodcaw
| Educational Attainment | Women with Births | Births / 1,000 Women |
| Less than High School | 0 (0.0%) | 0.0 |
| High School Diploma | 0 (0.0%) | 0.0 |
| College or Associate's Degree | 0 (0.0%) | 0.0 |
| Bachelor's Degree | 0 (0.0%) | 0.0 |
| Graduate Degree | 0 (0.0%) | 0.0 |
| Total | 0 (0.0%) | 0.0 |
Fertility by Education by Marriage Status in Bodcaw
| Educational Attainment | Married | Unmarried |
| Less than High School | 0 (0.0%) | 0 (0.0%) |
| High School Diploma | 0 (0.0%) | 0 (0.0%) |
| College or Associate's Degree | 0 (0.0%) | 0 (0.0%) |
| Bachelor's Degree | 0 (0.0%) | 0 (0.0%) |
| Graduate Degree | 0 (0.0%) | 0 (0.0%) |
| Total | 0 (0.0%) | 0 (0.0%) |
Employment Characteristics in Bodcaw
Employment by Class of Employer in Bodcaw
Among the 71 employed individuals in Bodcaw, private company employees (57 | 80.3%), self-employed (incorporated) (11 | 15.5%), and local government employees (2 | 2.8%) make up the most common classes of employment.
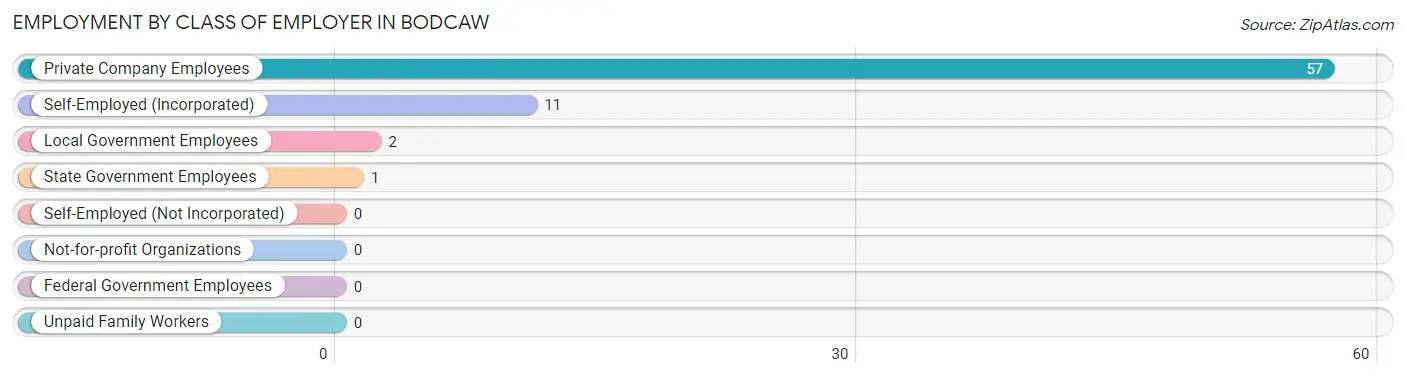
| Employer Class | # Employees | % Employees |
| Private Company Employees | 57 | 80.3% |
| Self-Employed (Incorporated) | 11 | 15.5% |
| Self-Employed (Not Incorporated) | 0 | 0.0% |
| Not-for-profit Organizations | 0 | 0.0% |
| Local Government Employees | 2 | 2.8% |
| State Government Employees | 1 | 1.4% |
| Federal Government Employees | 0 | 0.0% |
| Unpaid Family Workers | 0 | 0.0% |
| Total | 71 | 100.0% |
Employment Status by Age in Bodcaw
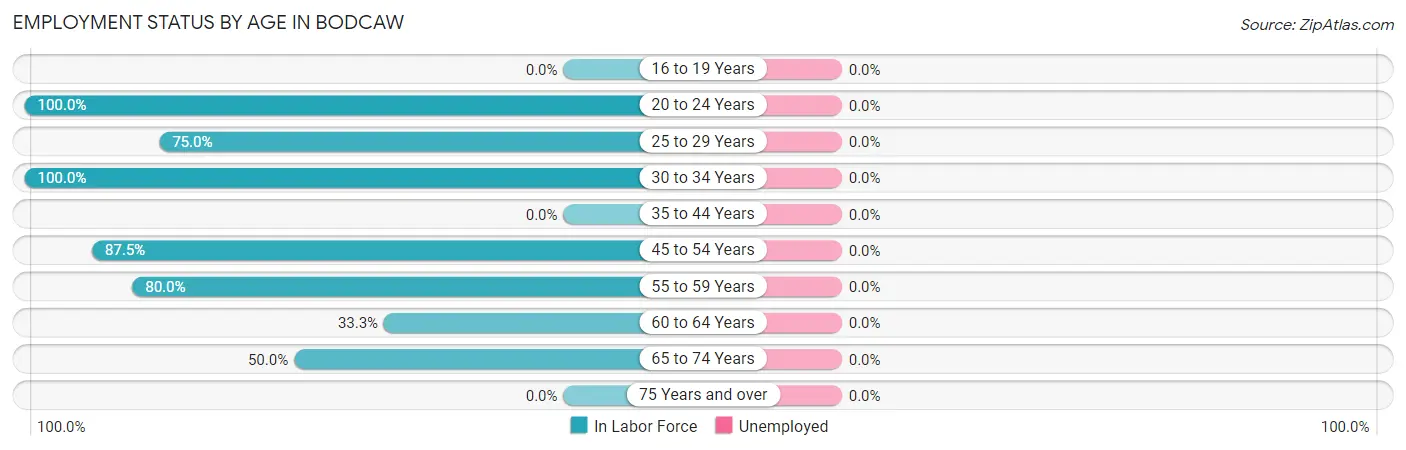
| Age Bracket | In Labor Force | Unemployed |
| 16 to 19 Years | 0 (0.0%) | 0 (0.0%) |
| 20 to 24 Years | 1 (100.0%) | 0 (0.0%) |
| 25 to 29 Years | 3 (75.0%) | 0 (0.0%) |
| 30 to 34 Years | 24 (100.0%) | 0 (0.0%) |
| 35 to 44 Years | 0 (0.0%) | 0 (0.0%) |
| 45 to 54 Years | 35 (87.5%) | 0 (0.0%) |
| 55 to 59 Years | 4 (80.0%) | 0 (0.0%) |
| 60 to 64 Years | 1 (33.3%) | 0 (0.0%) |
| 65 to 74 Years | 3 (50.0%) | 0 (0.0%) |
| 75 Years and over | 0 (0.0%) | 0 (0.0%) |
| Total | 71 (77.2%) | 0 (0.0%) |
Employment Status by Educational Attainment in Bodcaw
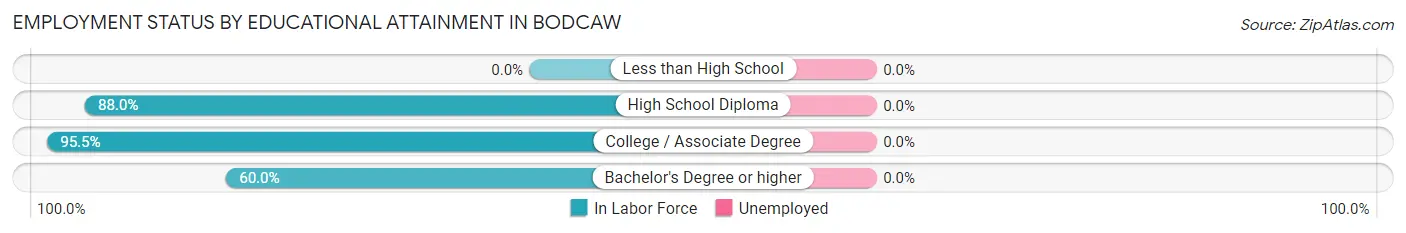
| Educational Attainment | In Labor Force | Unemployed |
| Less than High School | 0 (0.0%) | 0 (0.0%) |
| High School Diploma | 22 (88.0%) | 0 (0.0%) |
| College / Associate Degree | 42 (95.5%) | 0 (0.0%) |
| Bachelor's Degree or higher | 3 (60.0%) | 0 (0.0%) |
| Total | 67 (85.9%) | 0 (0.0%) |
Employment Occupations by Sex in Bodcaw
Management, Business, Science and Arts Occupations
The most common Management, Business, Science and Arts occupations in Bodcaw are Management (3 | 4.2%), Community & Social Service (3 | 4.2%), Education Instruction & Library (3 | 4.2%), and Health Diagnosing & Treating (2 | 2.8%).
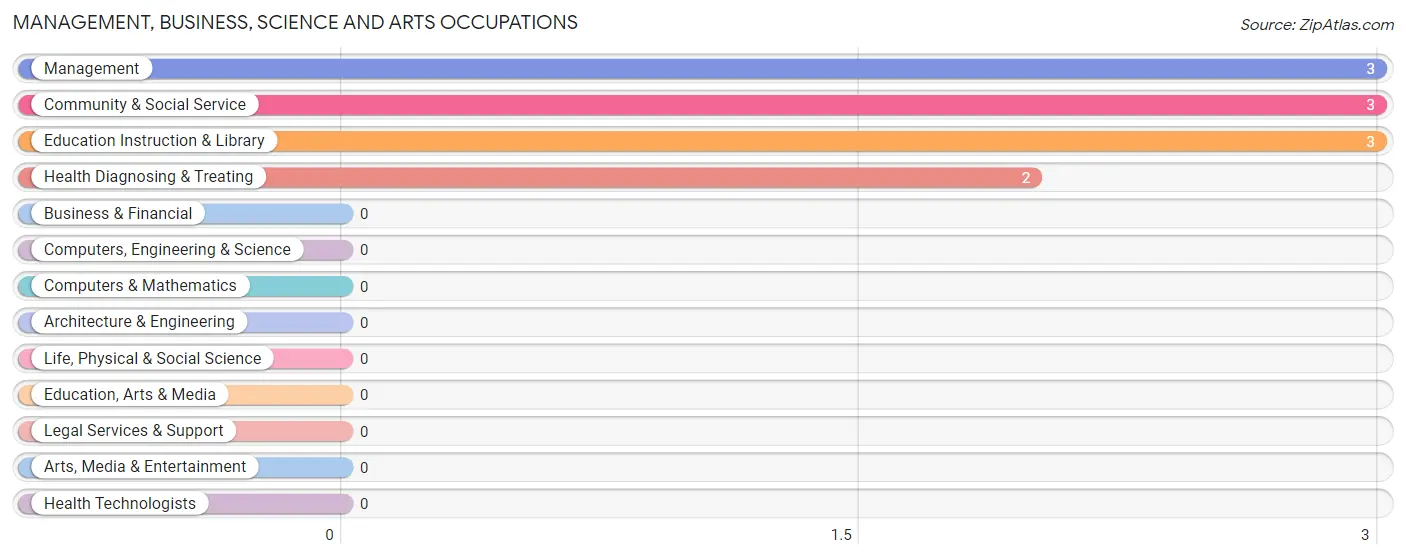
Management, Business, Science and Arts Occupations by Sex
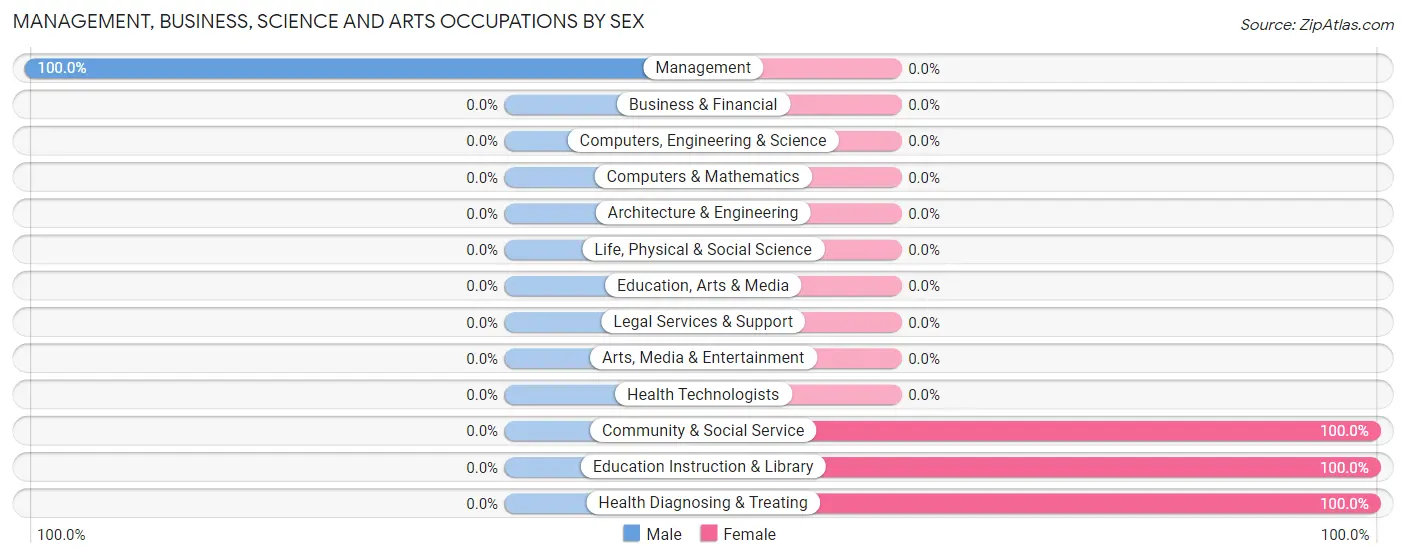
| Occupation | Male | Female |
| Management | 3 (100.0%) | 0 (0.0%) |
| Business & Financial | 0 (0.0%) | 0 (0.0%) |
| Computers, Engineering & Science | 0 (0.0%) | 0 (0.0%) |
| Computers & Mathematics | 0 (0.0%) | 0 (0.0%) |
| Architecture & Engineering | 0 (0.0%) | 0 (0.0%) |
| Life, Physical & Social Science | 0 (0.0%) | 0 (0.0%) |
| Community & Social Service | 0 (0.0%) | 3 (100.0%) |
| Education, Arts & Media | 0 (0.0%) | 0 (0.0%) |
| Legal Services & Support | 0 (0.0%) | 0 (0.0%) |
| Education Instruction & Library | 0 (0.0%) | 3 (100.0%) |
| Arts, Media & Entertainment | 0 (0.0%) | 0 (0.0%) |
| Health Diagnosing & Treating | 0 (0.0%) | 2 (100.0%) |
| Health Technologists | 0 (0.0%) | 0 (0.0%) |
| Total (Category) | 3 (37.5%) | 5 (62.5%) |
| Total (Overall) | 41 (57.8%) | 30 (42.2%) |
Services Occupations
The most common Services occupations in Bodcaw are , and Cleaning & Maintenance (17 | 23.9%).
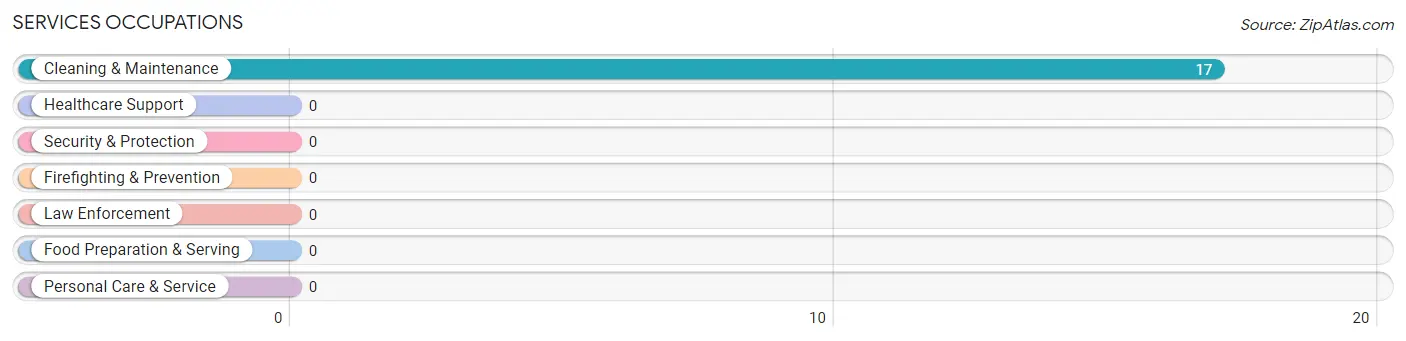
Services Occupations by Sex
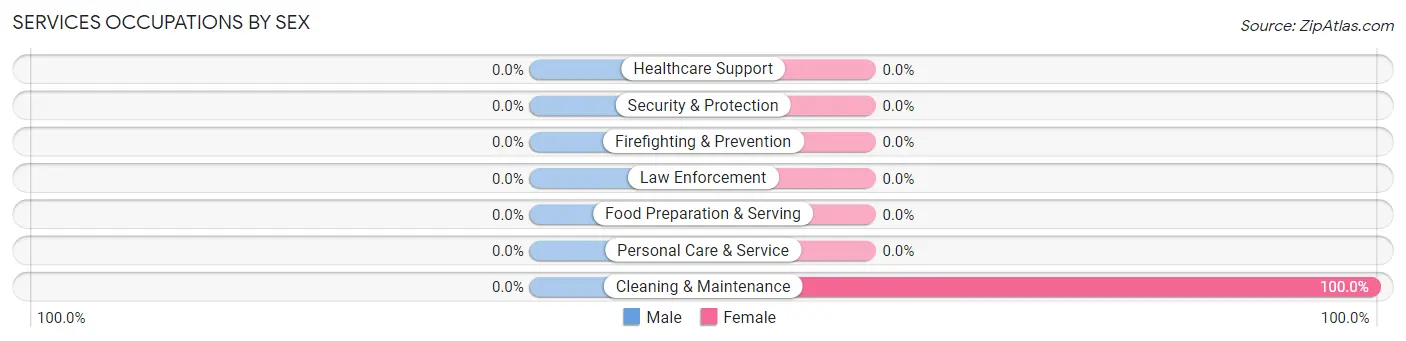
| Occupation | Male | Female |
| Healthcare Support | 0 (0.0%) | 0 (0.0%) |
| Security & Protection | 0 (0.0%) | 0 (0.0%) |
| Firefighting & Prevention | 0 (0.0%) | 0 (0.0%) |
| Law Enforcement | 0 (0.0%) | 0 (0.0%) |
| Food Preparation & Serving | 0 (0.0%) | 0 (0.0%) |
| Cleaning & Maintenance | 0 (0.0%) | 17 (100.0%) |
| Personal Care & Service | 0 (0.0%) | 0 (0.0%) |
| Total (Category) | 0 (0.0%) | 17 (100.0%) |
| Total (Overall) | 41 (57.8%) | 30 (42.2%) |
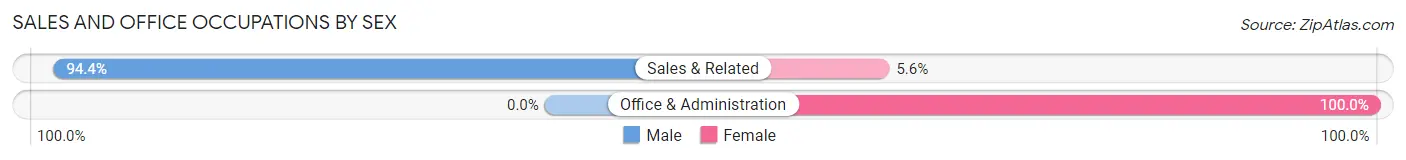
Sales and Office Occupations
The most common Sales and Office occupations in Bodcaw are Sales & Related (18 | 25.4%), and Office & Administration (3 | 4.2%).
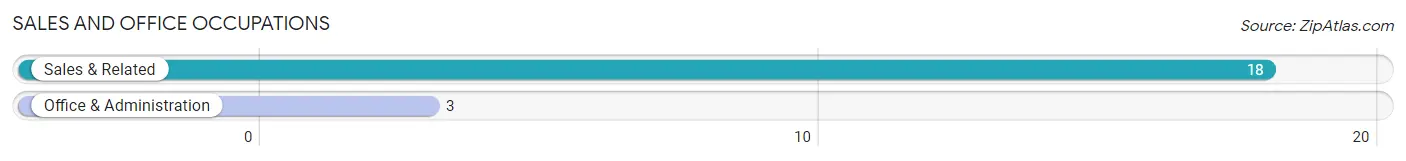
Sales and Office Occupations by Sex
| Occupation | Male | Female |
| Sales & Related | 17 (94.4%) | 1 (5.6%) |
| Office & Administration | 0 (0.0%) | 3 (100.0%) |
| Total (Category) | 17 (80.9%) | 4 (19.1%) |
| Total (Overall) | 41 (57.8%) | 30 (42.2%) |
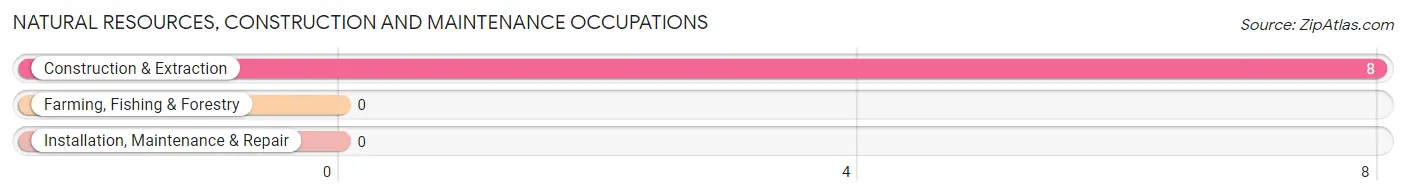
Natural Resources, Construction and Maintenance Occupations
The most common Natural Resources, Construction and Maintenance occupations in Bodcaw are , and Construction & Extraction (8 | 11.3%).
Natural Resources, Construction and Maintenance Occupations by Sex
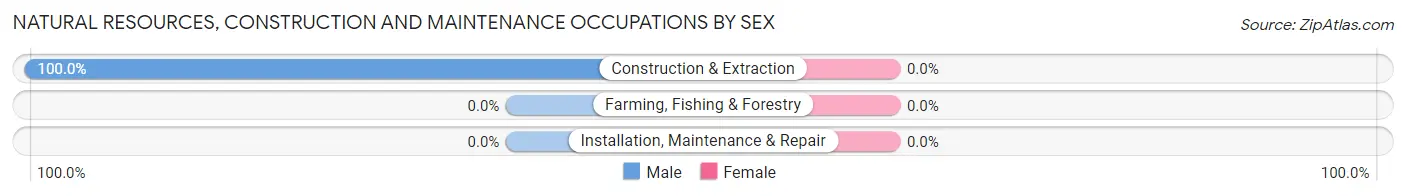
| Occupation | Male | Female |
| Farming, Fishing & Forestry | 0 (0.0%) | 0 (0.0%) |
| Construction & Extraction | 8 (100.0%) | 0 (0.0%) |
| Installation, Maintenance & Repair | 0 (0.0%) | 0 (0.0%) |
| Total (Category) | 8 (100.0%) | 0 (0.0%) |
| Total (Overall) | 41 (57.8%) | 30 (42.2%) |
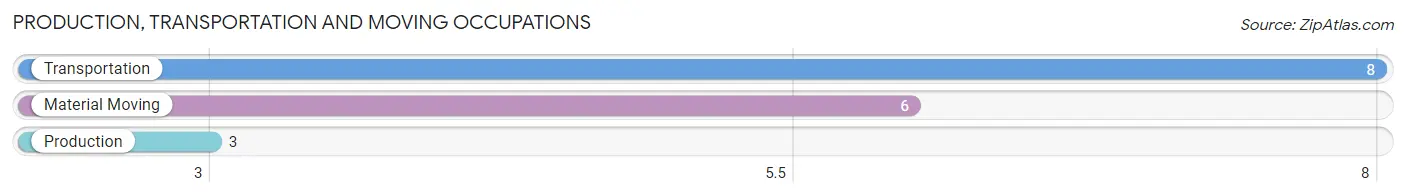
Production, Transportation and Moving Occupations
The most common Production, Transportation and Moving occupations in Bodcaw are Transportation (8 | 11.3%), Material Moving (6 | 8.5%), and Production (3 | 4.2%).
Production, Transportation and Moving Occupations by Sex
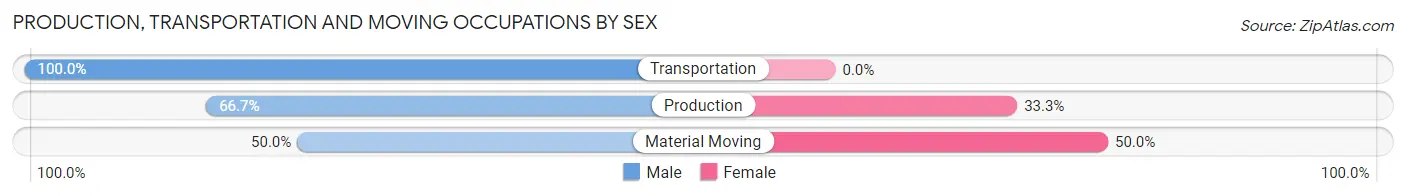
| Occupation | Male | Female |
| Production | 2 (66.7%) | 1 (33.3%) |
| Transportation | 8 (100.0%) | 0 (0.0%) |
| Material Moving | 3 (50.0%) | 3 (50.0%) |
| Total (Category) | 13 (76.5%) | 4 (23.5%) |
| Total (Overall) | 41 (57.8%) | 30 (42.2%) |
Employment Industries by Sex in Bodcaw
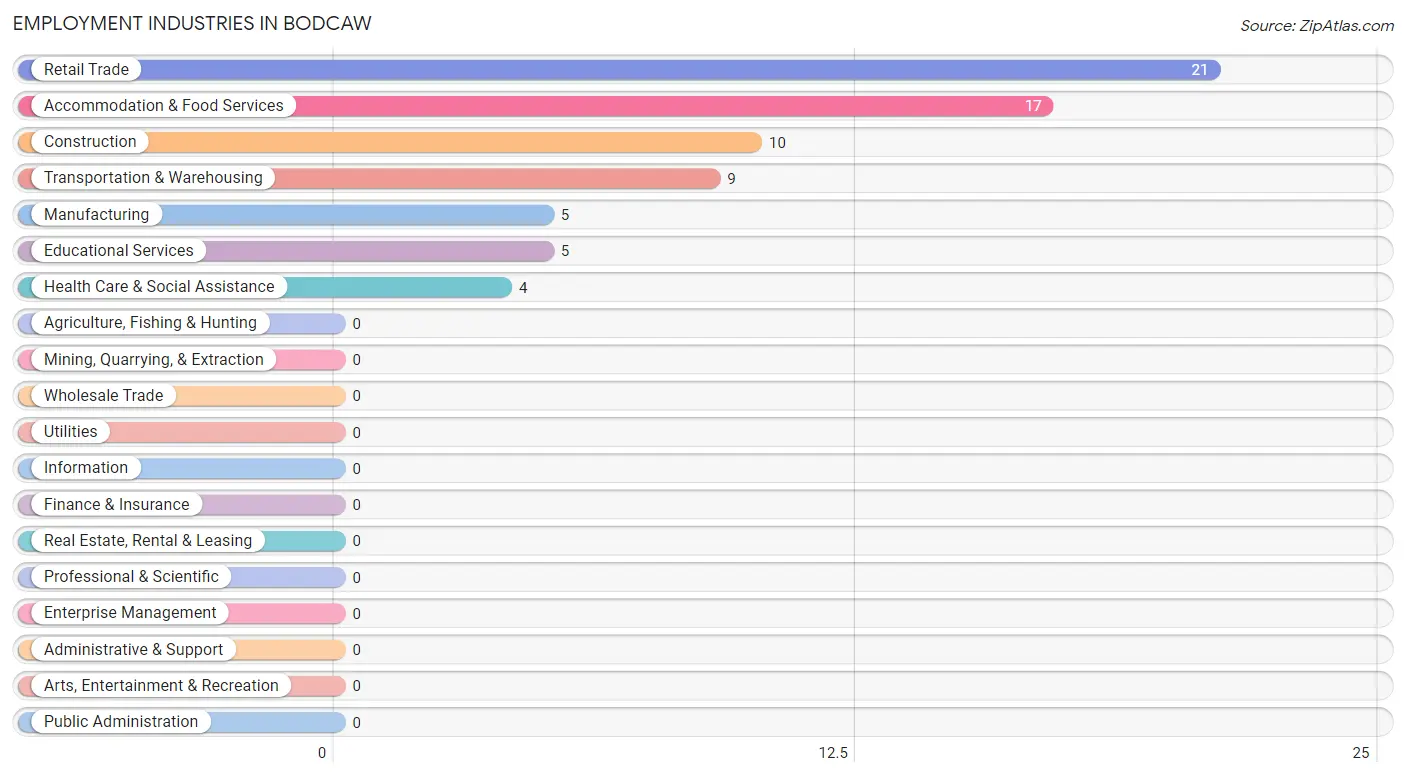
Employment Industries in Bodcaw
The major employment industries in Bodcaw include Retail Trade (21 | 29.6%), Accommodation & Food Services (17 | 23.9%), Construction (10 | 14.1%), Transportation & Warehousing (9 | 12.7%), and Manufacturing (5 | 7.0%).
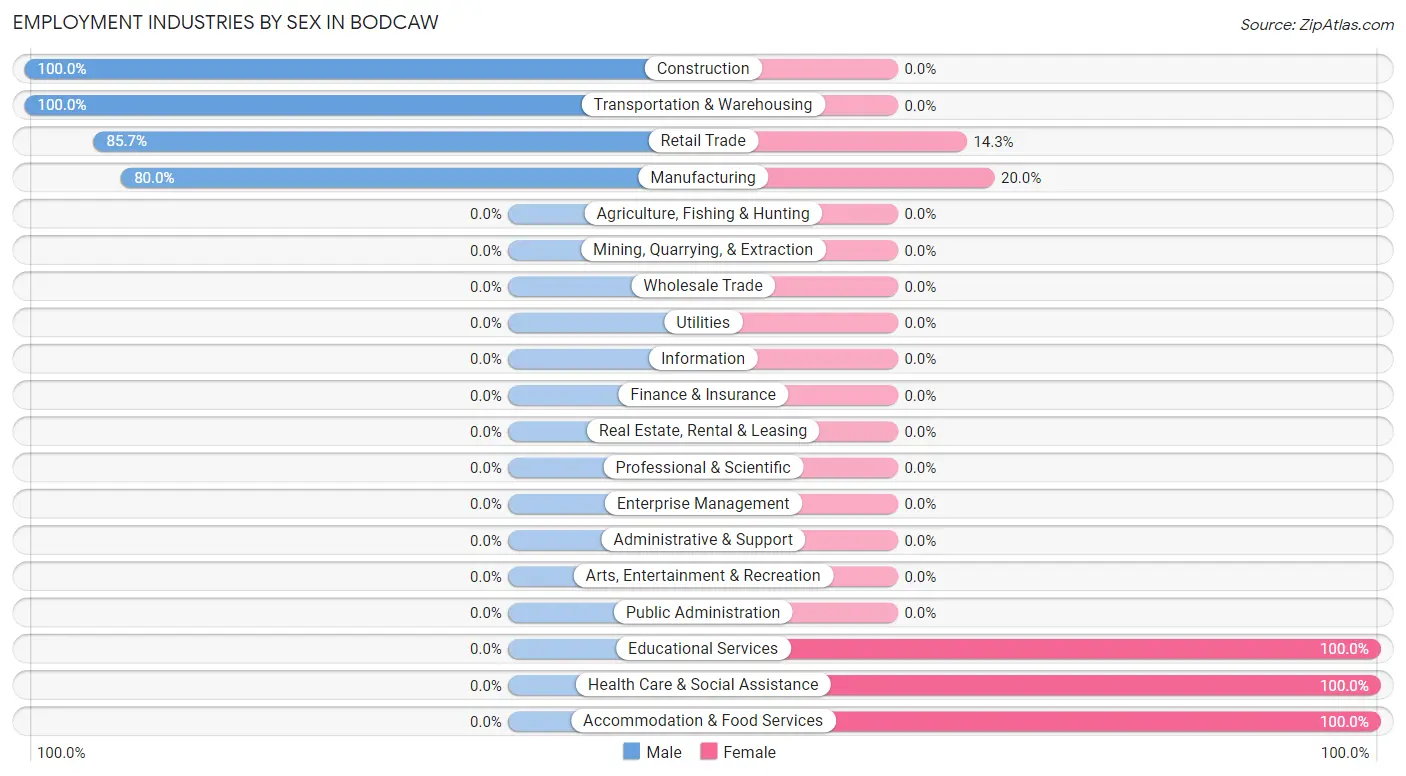
Employment Industries by Sex in Bodcaw
The Bodcaw industries that see more men than women are Construction (100.0%), Transportation & Warehousing (100.0%), and Retail Trade (85.7%), whereas the industries that tend to have a higher number of women are Educational Services (100.0%), Health Care & Social Assistance (100.0%), and Accommodation & Food Services (100.0%).
| Industry | Male | Female |
| Agriculture, Fishing & Hunting | 0 (0.0%) | 0 (0.0%) |
| Mining, Quarrying, & Extraction | 0 (0.0%) | 0 (0.0%) |
| Construction | 10 (100.0%) | 0 (0.0%) |
| Manufacturing | 4 (80.0%) | 1 (20.0%) |
| Wholesale Trade | 0 (0.0%) | 0 (0.0%) |
| Retail Trade | 18 (85.7%) | 3 (14.3%) |
| Transportation & Warehousing | 9 (100.0%) | 0 (0.0%) |
| Utilities | 0 (0.0%) | 0 (0.0%) |
| Information | 0 (0.0%) | 0 (0.0%) |
| Finance & Insurance | 0 (0.0%) | 0 (0.0%) |
| Real Estate, Rental & Leasing | 0 (0.0%) | 0 (0.0%) |
| Professional & Scientific | 0 (0.0%) | 0 (0.0%) |
| Enterprise Management | 0 (0.0%) | 0 (0.0%) |
| Administrative & Support | 0 (0.0%) | 0 (0.0%) |
| Educational Services | 0 (0.0%) | 5 (100.0%) |
| Health Care & Social Assistance | 0 (0.0%) | 4 (100.0%) |
| Arts, Entertainment & Recreation | 0 (0.0%) | 0 (0.0%) |
| Accommodation & Food Services | 0 (0.0%) | 17 (100.0%) |
| Public Administration | 0 (0.0%) | 0 (0.0%) |
| Total | 41 (57.8%) | 30 (42.2%) |
Education in Bodcaw
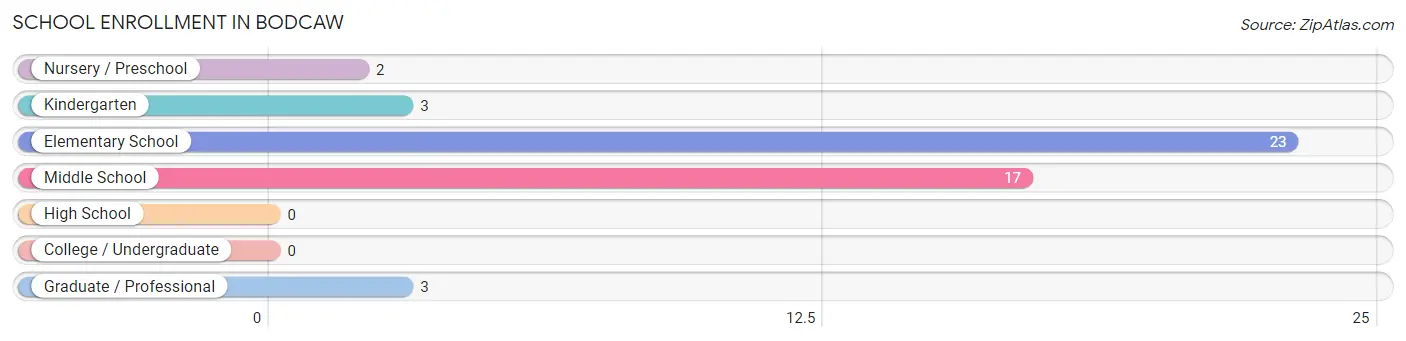
School Enrollment in Bodcaw
The most common levels of schooling among the 48 students in Bodcaw are elementary school (23 | 47.9%), middle school (17 | 35.4%), and kindergarten (3 | 6.2%).
| School Level | # Students | % Students |
| Nursery / Preschool | 2 | 4.2% |
| Kindergarten | 3 | 6.2% |
| Elementary School | 23 | 47.9% |
| Middle School | 17 | 35.4% |
| High School | 0 | 0.0% |
| College / Undergraduate | 0 | 0.0% |
| Graduate / Professional | 3 | 6.2% |
| Total | 48 | 100.0% |
School Enrollment by Age by Funding Source in Bodcaw
Out of a total of 48 students who are enrolled in schools in Bodcaw, 6 (12.5%) attend a private institution, while the remaining 42 (87.5%) are enrolled in public schools. The age group of 35 years and over has the highest likelihood of being enrolled in private schools, with 3 (100.0% in the age bracket) enrolled. Conversely, the age group of 10 to 14 year olds has the lowest likelihood of being enrolled in a private school, with 17 (100.0% in the age bracket) attending a public institution.
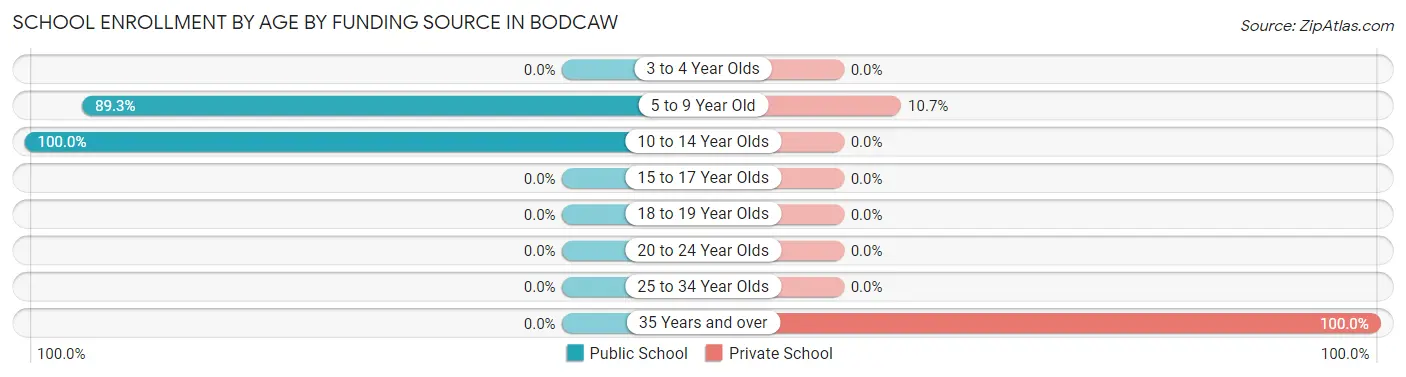
| Age Bracket | Public School | Private School |
| 3 to 4 Year Olds | 0 (0.0%) | 0 (0.0%) |
| 5 to 9 Year Old | 25 (89.3%) | 3 (10.7%) |
| 10 to 14 Year Olds | 17 (100.0%) | 0 (0.0%) |
| 15 to 17 Year Olds | 0 (0.0%) | 0 (0.0%) |
| 18 to 19 Year Olds | 0 (0.0%) | 0 (0.0%) |
| 20 to 24 Year Olds | 0 (0.0%) | 0 (0.0%) |
| 25 to 34 Year Olds | 0 (0.0%) | 0 (0.0%) |
| 35 Years and over | 0 (0.0%) | 3 (100.0%) |
| Total | 42 (87.5%) | 6 (12.5%) |
Educational Attainment by Field of Study in Bodcaw
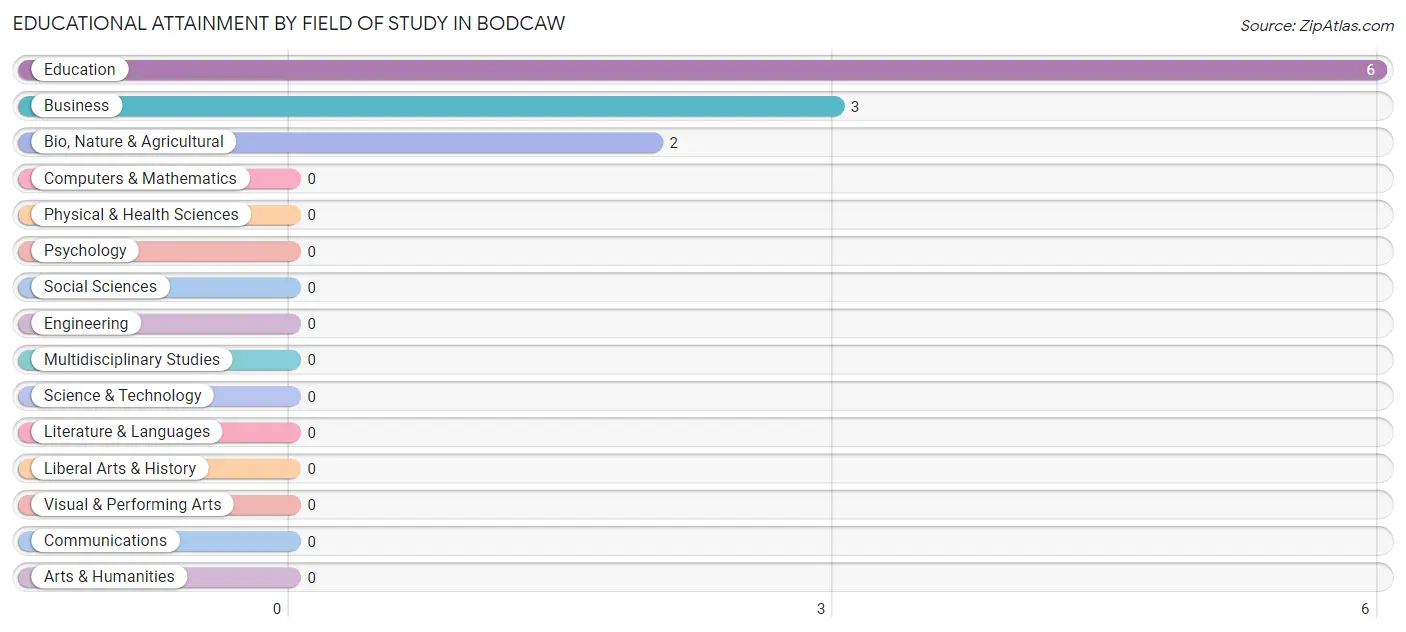
Education (6 | 54.5%), business (3 | 27.3%), and bio, nature & agricultural (2 | 18.2%) are the most common fields of study among 11 individuals in Bodcaw who have obtained a bachelor's degree or higher.
| Field of Study | # Graduates | % Graduates |
| Computers & Mathematics | 0 | 0.0% |
| Bio, Nature & Agricultural | 2 | 18.2% |
| Physical & Health Sciences | 0 | 0.0% |
| Psychology | 0 | 0.0% |
| Social Sciences | 0 | 0.0% |
| Engineering | 0 | 0.0% |
| Multidisciplinary Studies | 0 | 0.0% |
| Science & Technology | 0 | 0.0% |
| Business | 3 | 27.3% |
| Education | 6 | 54.5% |
| Literature & Languages | 0 | 0.0% |
| Liberal Arts & History | 0 | 0.0% |
| Visual & Performing Arts | 0 | 0.0% |
| Communications | 0 | 0.0% |
| Arts & Humanities | 0 | 0.0% |
| Total | 11 | 100.0% |
Transportation & Commute in Bodcaw
Vehicle Availability by Sex in Bodcaw
The most prevalent vehicle ownership categories in Bodcaw are males with 3 vehicles (19, accounting for 46.3%) and females with 3 vehicles (10, making up 63.3%).
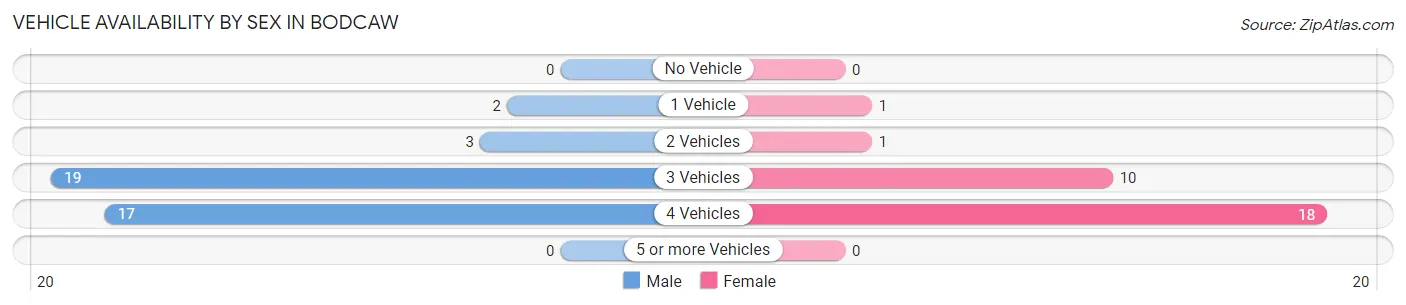
| Vehicles Available | Male | Female |
| No Vehicle | 0 (0.0%) | 0 (0.0%) |
| 1 Vehicle | 2 (4.9%) | 1 (3.3%) |
| 2 Vehicles | 3 (7.3%) | 1 (3.3%) |
| 3 Vehicles | 19 (46.3%) | 10 (33.3%) |
| 4 Vehicles | 17 (41.5%) | 18 (60.0%) |
| 5 or more Vehicles | 0 (0.0%) | 0 (0.0%) |
| Total | 41 (100.0%) | 30 (100.0%) |
Commute Time in Bodcaw
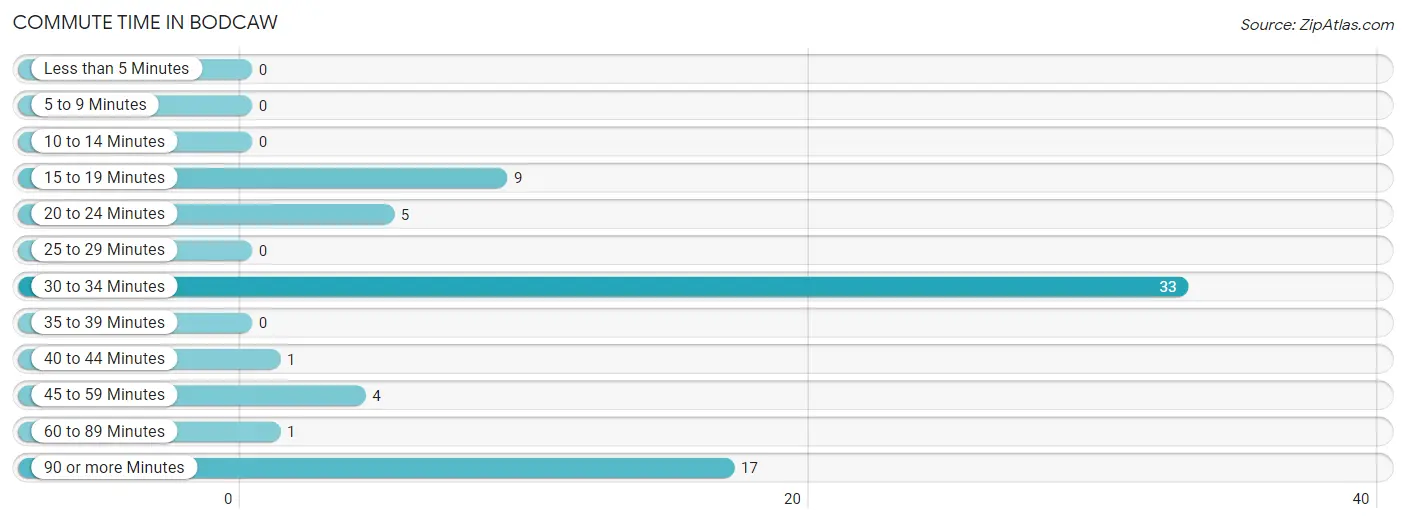
The most frequently occuring commute durations in Bodcaw are 30 to 34 minutes (33 commuters, 47.1%), 90 or more minutes (17 commuters, 24.3%), and 15 to 19 minutes (9 commuters, 12.9%).
| Commute Time | # Commuters | % Commuters |
| Less than 5 Minutes | 0 | 0.0% |
| 5 to 9 Minutes | 0 | 0.0% |
| 10 to 14 Minutes | 0 | 0.0% |
| 15 to 19 Minutes | 9 | 12.9% |
| 20 to 24 Minutes | 5 | 7.1% |
| 25 to 29 Minutes | 0 | 0.0% |
| 30 to 34 Minutes | 33 | 47.1% |
| 35 to 39 Minutes | 0 | 0.0% |
| 40 to 44 Minutes | 1 | 1.4% |
| 45 to 59 Minutes | 4 | 5.7% |
| 60 to 89 Minutes | 1 | 1.4% |
| 90 or more Minutes | 17 | 24.3% |
Commute Time by Sex in Bodcaw
The most common commute times in Bodcaw are 90 or more minutes (17 commuters, 42.5%) for males and 30 to 34 minutes (23 commuters, 76.7%) for females.
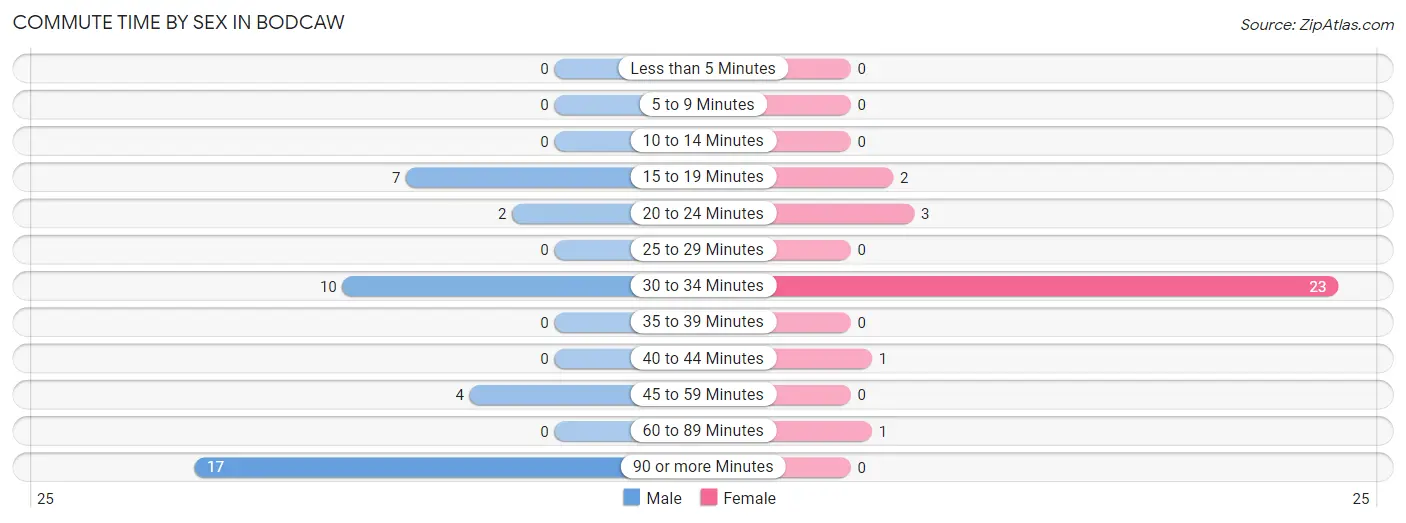
| Commute Time | Male | Female |
| Less than 5 Minutes | 0 (0.0%) | 0 (0.0%) |
| 5 to 9 Minutes | 0 (0.0%) | 0 (0.0%) |
| 10 to 14 Minutes | 0 (0.0%) | 0 (0.0%) |
| 15 to 19 Minutes | 7 (17.5%) | 2 (6.7%) |
| 20 to 24 Minutes | 2 (5.0%) | 3 (10.0%) |
| 25 to 29 Minutes | 0 (0.0%) | 0 (0.0%) |
| 30 to 34 Minutes | 10 (25.0%) | 23 (76.7%) |
| 35 to 39 Minutes | 0 (0.0%) | 0 (0.0%) |
| 40 to 44 Minutes | 0 (0.0%) | 1 (3.3%) |
| 45 to 59 Minutes | 4 (10.0%) | 0 (0.0%) |
| 60 to 89 Minutes | 0 (0.0%) | 1 (3.3%) |
| 90 or more Minutes | 17 (42.5%) | 0 (0.0%) |
Time of Departure to Work by Sex in Bodcaw
The most frequent times of departure to work in Bodcaw are 6:00 AM to 6:29 AM (26, 65.0%) for males and 7:30 AM to 7:59 AM (20, 66.7%) for females.
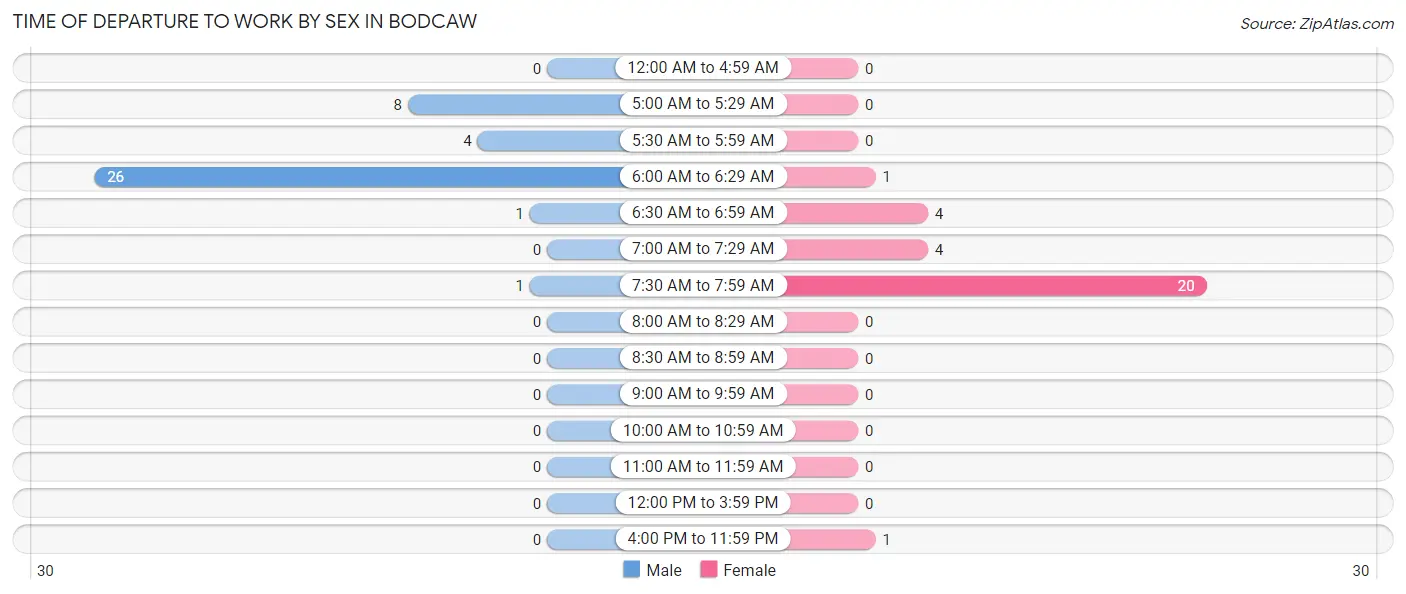
| Time of Departure | Male | Female |
| 12:00 AM to 4:59 AM | 0 (0.0%) | 0 (0.0%) |
| 5:00 AM to 5:29 AM | 8 (20.0%) | 0 (0.0%) |
| 5:30 AM to 5:59 AM | 4 (10.0%) | 0 (0.0%) |
| 6:00 AM to 6:29 AM | 26 (65.0%) | 1 (3.3%) |
| 6:30 AM to 6:59 AM | 1 (2.5%) | 4 (13.3%) |
| 7:00 AM to 7:29 AM | 0 (0.0%) | 4 (13.3%) |
| 7:30 AM to 7:59 AM | 1 (2.5%) | 20 (66.7%) |
| 8:00 AM to 8:29 AM | 0 (0.0%) | 0 (0.0%) |
| 8:30 AM to 8:59 AM | 0 (0.0%) | 0 (0.0%) |
| 9:00 AM to 9:59 AM | 0 (0.0%) | 0 (0.0%) |
| 10:00 AM to 10:59 AM | 0 (0.0%) | 0 (0.0%) |
| 11:00 AM to 11:59 AM | 0 (0.0%) | 0 (0.0%) |
| 12:00 PM to 3:59 PM | 0 (0.0%) | 0 (0.0%) |
| 4:00 PM to 11:59 PM | 0 (0.0%) | 1 (3.3%) |
| Total | 40 (100.0%) | 30 (100.0%) |
Housing Occupancy in Bodcaw
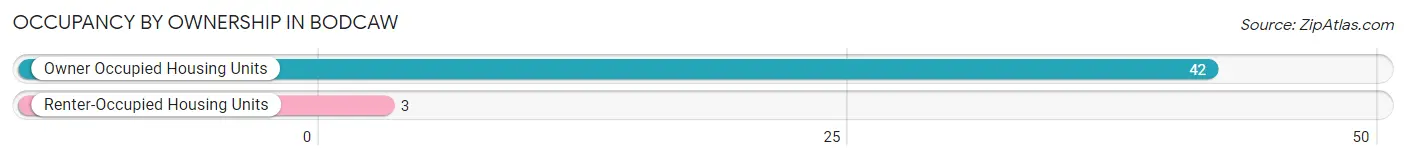
Occupancy by Ownership in Bodcaw
Of the total 45 dwellings in Bodcaw, owner-occupied units account for 42 (93.3%), while renter-occupied units make up 3 (6.7%).
| Occupancy | # Housing Units | % Housing Units |
| Owner Occupied Housing Units | 42 | 93.3% |
| Renter-Occupied Housing Units | 3 | 6.7% |
| Total Occupied Housing Units | 45 | 100.0% |
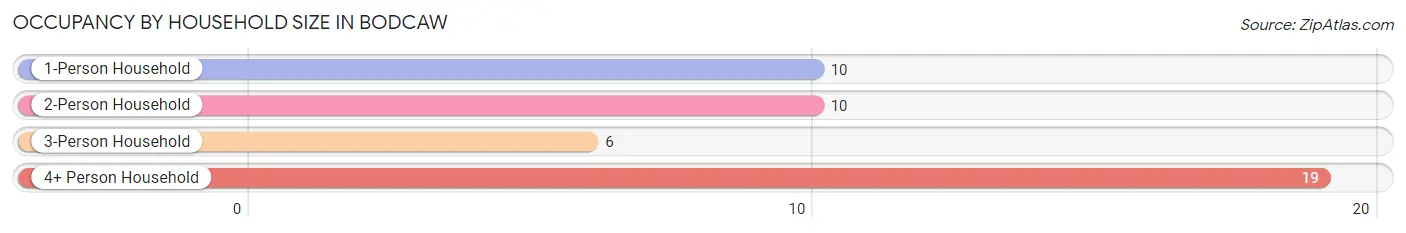
Occupancy by Household Size in Bodcaw
| Household Size | # Housing Units | % Housing Units |
| 1-Person Household | 10 | 22.2% |
| 2-Person Household | 10 | 22.2% |
| 3-Person Household | 6 | 13.3% |
| 4+ Person Household | 19 | 42.2% |
| Total Housing Units | 45 | 100.0% |
Occupancy by Ownership by Household Size in Bodcaw
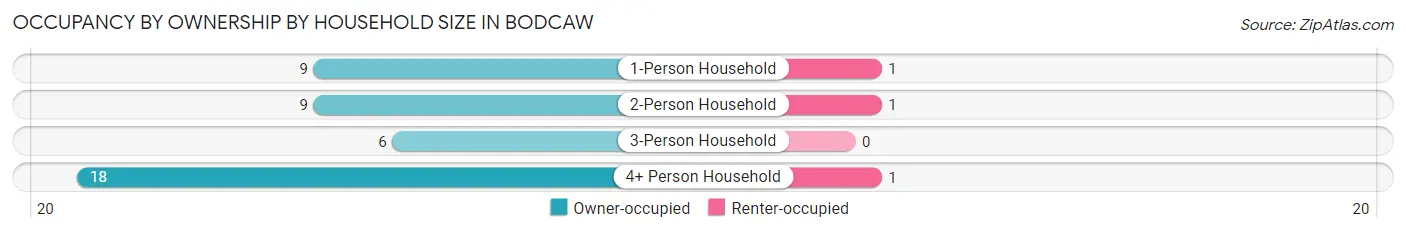
| Household Size | Owner-occupied | Renter-occupied |
| 1-Person Household | 9 (90.0%) | 1 (10.0%) |
| 2-Person Household | 9 (90.0%) | 1 (10.0%) |
| 3-Person Household | 6 (100.0%) | 0 (0.0%) |
| 4+ Person Household | 18 (94.7%) | 1 (5.3%) |
| Total Housing Units | 42 (93.3%) | 3 (6.7%) |
Occupancy by Educational Attainment in Bodcaw
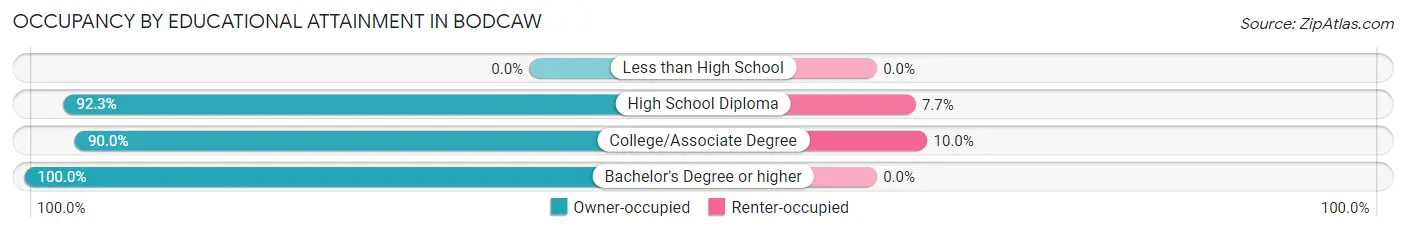
| Household Size | Owner-occupied | Renter-occupied |
| Less than High School | 0 (0.0%) | 0 (0.0%) |
| High School Diploma | 24 (92.3%) | 2 (7.7%) |
| College/Associate Degree | 9 (90.0%) | 1 (10.0%) |
| Bachelor's Degree or higher | 9 (100.0%) | 0 (0.0%) |
Occupancy by Age of Householder in Bodcaw
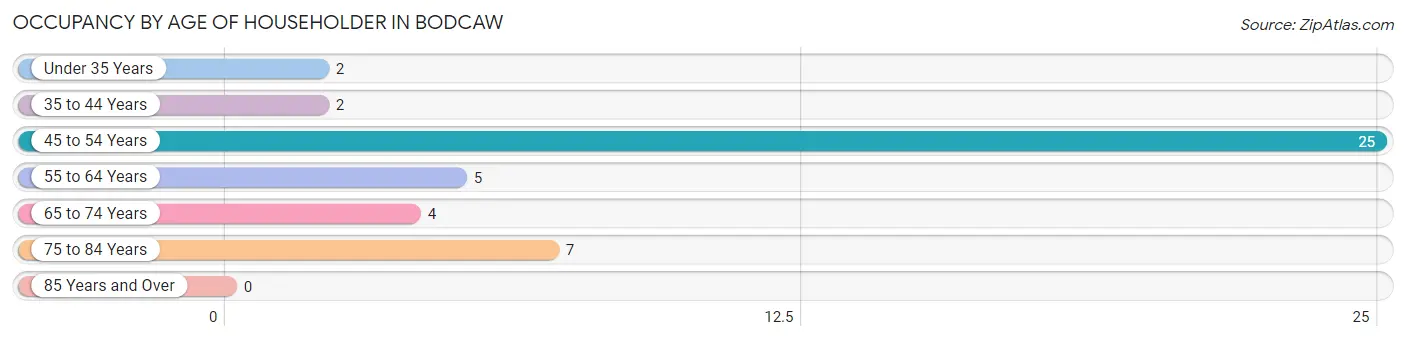
| Age Bracket | # Households | % Households |
| Under 35 Years | 2 | 4.4% |
| 35 to 44 Years | 2 | 4.4% |
| 45 to 54 Years | 25 | 55.6% |
| 55 to 64 Years | 5 | 11.1% |
| 65 to 74 Years | 4 | 8.9% |
| 75 to 84 Years | 7 | 15.6% |
| 85 Years and Over | 0 | 0.0% |
| Total | 45 | 100.0% |
Housing Finances in Bodcaw
Median Income by Occupancy in Bodcaw
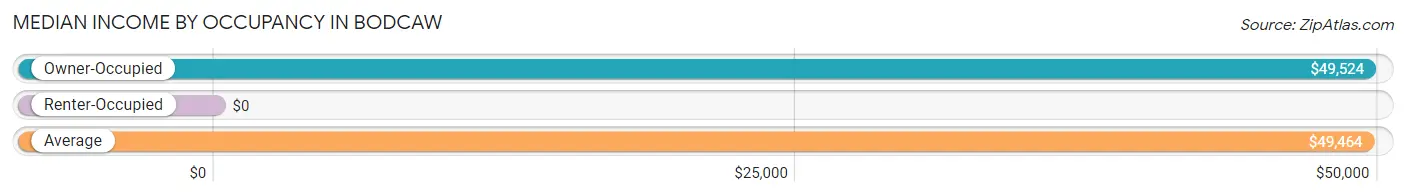
| Occupancy Type | # Households | Median Income |
| Owner-Occupied | 42 (93.3%) | $49,524 |
| Renter-Occupied | 3 (6.7%) | $0 |
| Average | 45 (100.0%) | $49,464 |
Occupancy by Householder Income Bracket in Bodcaw
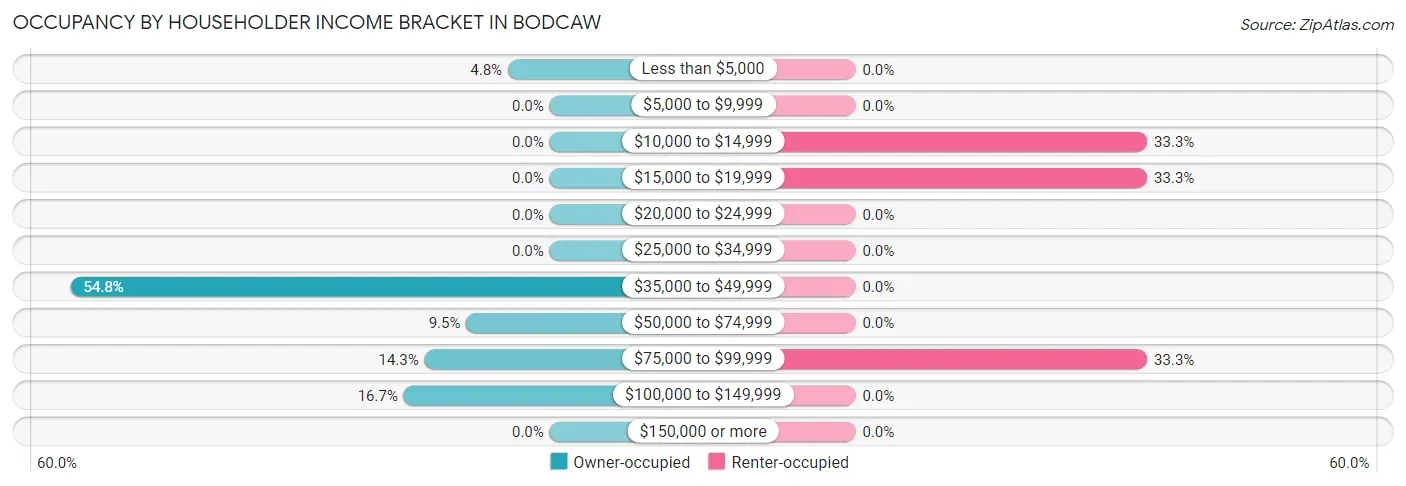
| Income Bracket | Owner-occupied | Renter-occupied |
| Less than $5,000 | 2 (4.8%) | 0 (0.0%) |
| $5,000 to $9,999 | 0 (0.0%) | 0 (0.0%) |
| $10,000 to $14,999 | 0 (0.0%) | 1 (33.3%) |
| $15,000 to $19,999 | 0 (0.0%) | 1 (33.3%) |
| $20,000 to $24,999 | 0 (0.0%) | 0 (0.0%) |
| $25,000 to $34,999 | 0 (0.0%) | 0 (0.0%) |
| $35,000 to $49,999 | 23 (54.8%) | 0 (0.0%) |
| $50,000 to $74,999 | 4 (9.5%) | 0 (0.0%) |
| $75,000 to $99,999 | 6 (14.3%) | 1 (33.3%) |
| $100,000 to $149,999 | 7 (16.7%) | 0 (0.0%) |
| $150,000 or more | 0 (0.0%) | 0 (0.0%) |
| Total | 42 (100.0%) | 3 (100.0%) |
Monthly Housing Cost Tiers in Bodcaw
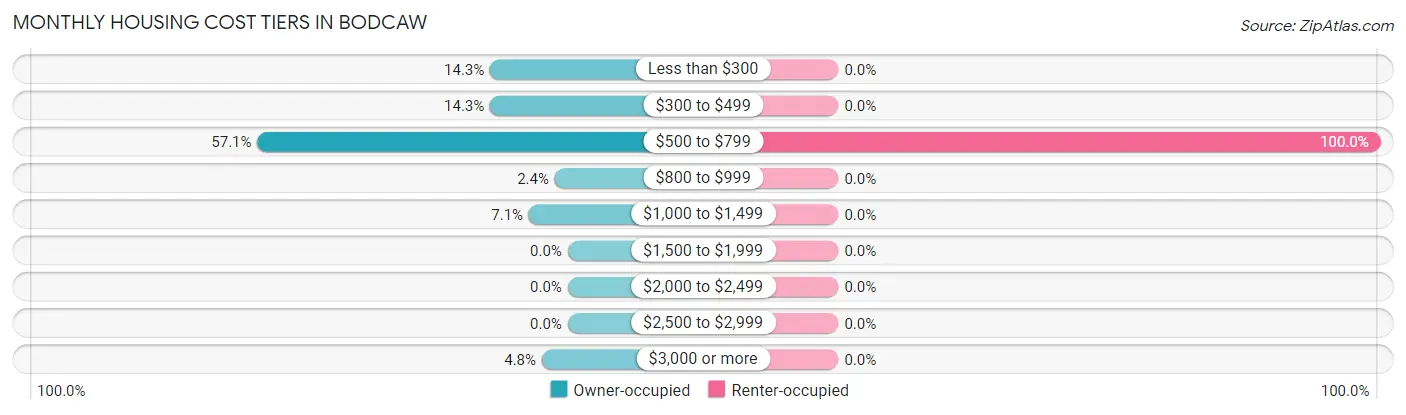
| Monthly Cost | Owner-occupied | Renter-occupied |
| Less than $300 | 6 (14.3%) | 0 (0.0%) |
| $300 to $499 | 6 (14.3%) | 0 (0.0%) |
| $500 to $799 | 24 (57.1%) | 3 (100.0%) |
| $800 to $999 | 1 (2.4%) | 0 (0.0%) |
| $1,000 to $1,499 | 3 (7.1%) | 0 (0.0%) |
| $1,500 to $1,999 | 0 (0.0%) | 0 (0.0%) |
| $2,000 to $2,499 | 0 (0.0%) | 0 (0.0%) |
| $2,500 to $2,999 | 0 (0.0%) | 0 (0.0%) |
| $3,000 or more | 2 (4.8%) | 0 (0.0%) |
| Total | 42 (100.0%) | 3 (100.0%) |
Physical Housing Characteristics in Bodcaw
Housing Structures in Bodcaw
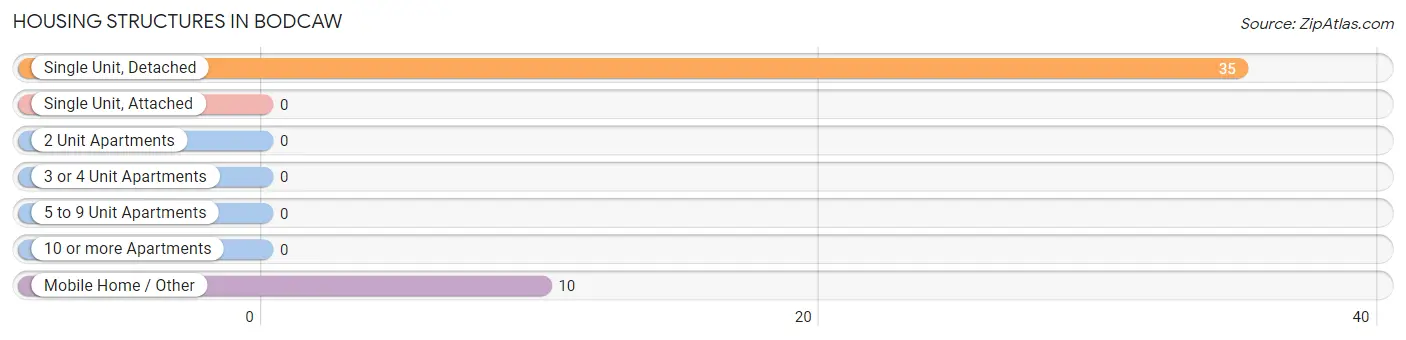
| Structure Type | # Housing Units | % Housing Units |
| Single Unit, Detached | 35 | 77.8% |
| Single Unit, Attached | 0 | 0.0% |
| 2 Unit Apartments | 0 | 0.0% |
| 3 or 4 Unit Apartments | 0 | 0.0% |
| 5 to 9 Unit Apartments | 0 | 0.0% |
| 10 or more Apartments | 0 | 0.0% |
| Mobile Home / Other | 10 | 22.2% |
| Total | 45 | 100.0% |
Housing Structures by Occupancy in Bodcaw
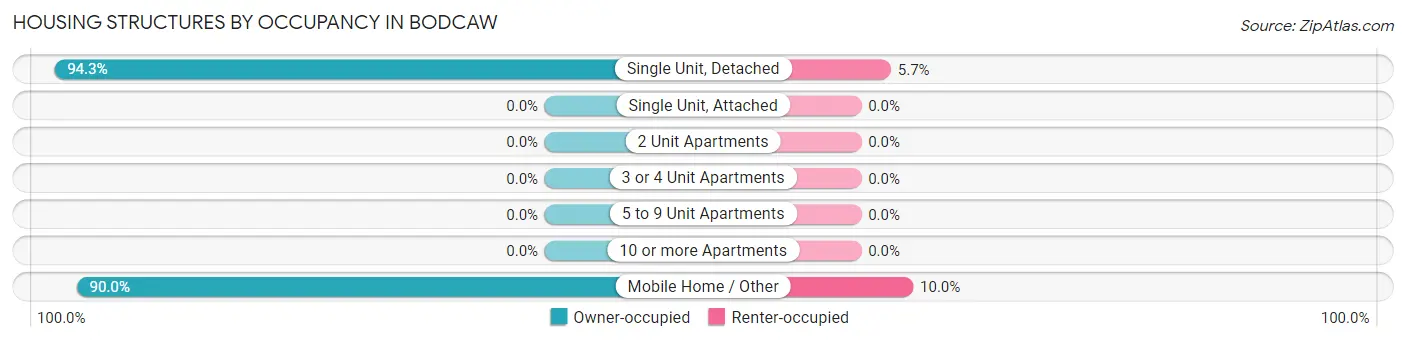
| Structure Type | Owner-occupied | Renter-occupied |
| Single Unit, Detached | 33 (94.3%) | 2 (5.7%) |
| Single Unit, Attached | 0 (0.0%) | 0 (0.0%) |
| 2 Unit Apartments | 0 (0.0%) | 0 (0.0%) |
| 3 or 4 Unit Apartments | 0 (0.0%) | 0 (0.0%) |
| 5 to 9 Unit Apartments | 0 (0.0%) | 0 (0.0%) |
| 10 or more Apartments | 0 (0.0%) | 0 (0.0%) |
| Mobile Home / Other | 9 (90.0%) | 1 (10.0%) |
| Total | 42 (93.3%) | 3 (6.7%) |
Housing Structures by Number of Rooms in Bodcaw
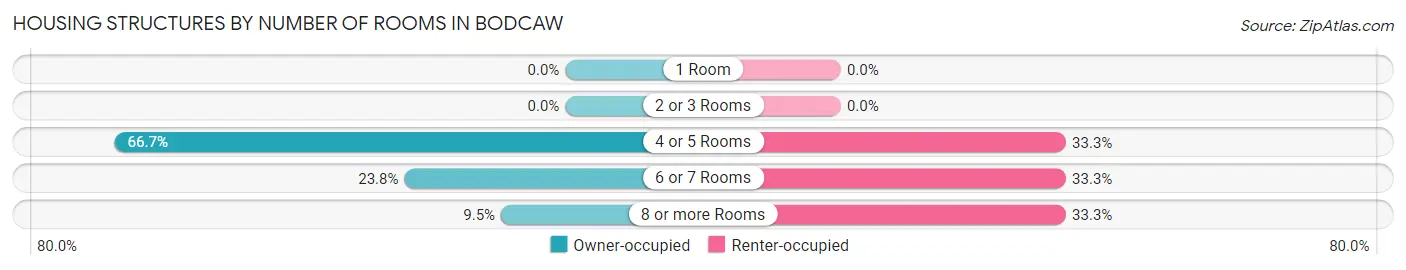
| Number of Rooms | Owner-occupied | Renter-occupied |
| 1 Room | 0 (0.0%) | 0 (0.0%) |
| 2 or 3 Rooms | 0 (0.0%) | 0 (0.0%) |
| 4 or 5 Rooms | 28 (66.7%) | 1 (33.3%) |
| 6 or 7 Rooms | 10 (23.8%) | 1 (33.3%) |
| 8 or more Rooms | 4 (9.5%) | 1 (33.3%) |
| Total | 42 (100.0%) | 3 (100.0%) |
Housing Structure by Heating Type in Bodcaw
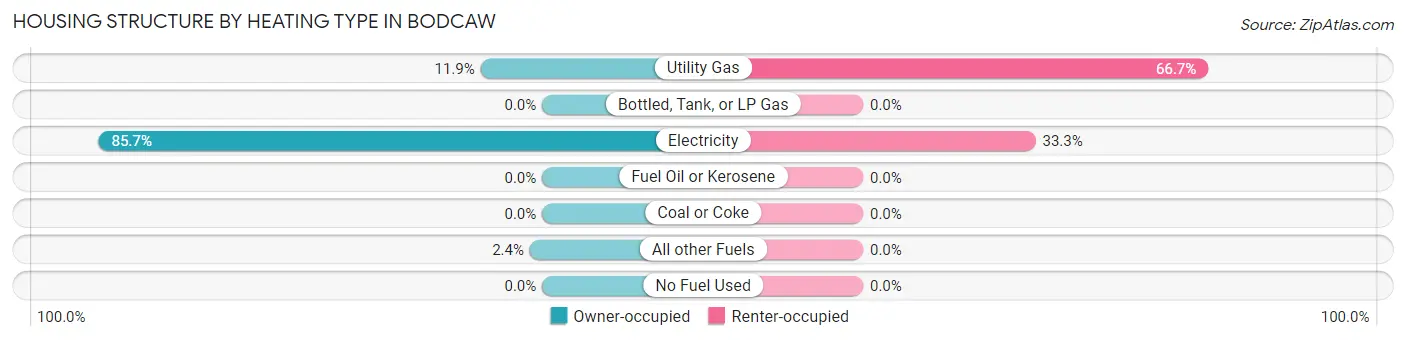
| Heating Type | Owner-occupied | Renter-occupied |
| Utility Gas | 5 (11.9%) | 2 (66.7%) |
| Bottled, Tank, or LP Gas | 0 (0.0%) | 0 (0.0%) |
| Electricity | 36 (85.7%) | 1 (33.3%) |
| Fuel Oil or Kerosene | 0 (0.0%) | 0 (0.0%) |
| Coal or Coke | 0 (0.0%) | 0 (0.0%) |
| All other Fuels | 1 (2.4%) | 0 (0.0%) |
| No Fuel Used | 0 (0.0%) | 0 (0.0%) |
| Total | 42 (100.0%) | 3 (100.0%) |
Household Vehicle Usage in Bodcaw
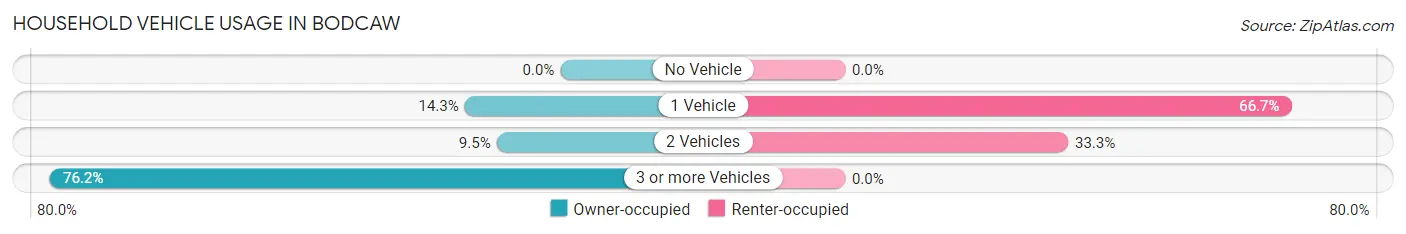
| Vehicles per Household | Owner-occupied | Renter-occupied |
| No Vehicle | 0 (0.0%) | 0 (0.0%) |
| 1 Vehicle | 6 (14.3%) | 2 (66.7%) |
| 2 Vehicles | 4 (9.5%) | 1 (33.3%) |
| 3 or more Vehicles | 32 (76.2%) | 0 (0.0%) |
| Total | 42 (100.0%) | 3 (100.0%) |
Real Estate & Mortgages in Bodcaw
Real Estate and Mortgage Overview in Bodcaw
| Characteristic | Without Mortgage | With Mortgage |
| Housing Units | 16 | 26 |
| Median Property Value | $55,000 | $77,600 |
| Median Household Income | $77,500 | $0 |
| Monthly Housing Costs | $370 | $2 |
| Real Estate Taxes | $199 | $2 |
Property Value by Mortgage Status in Bodcaw
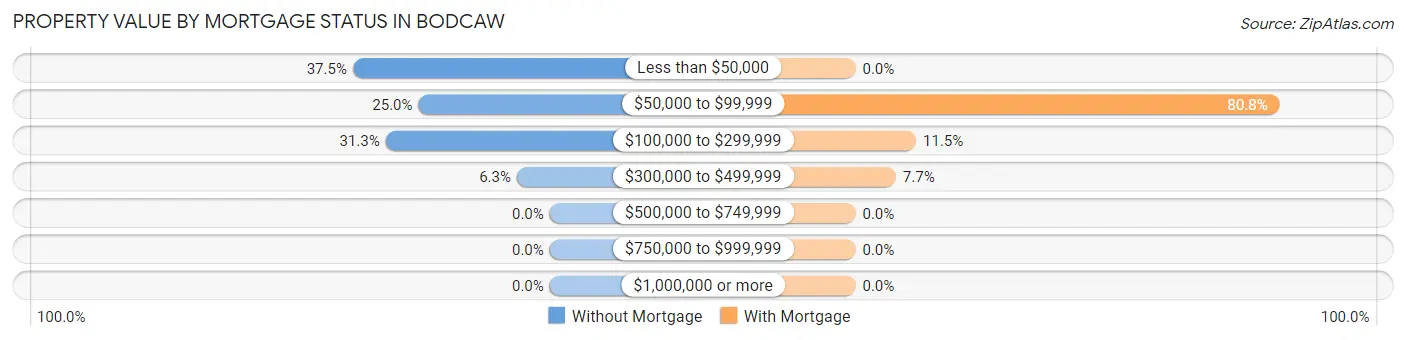
| Property Value | Without Mortgage | With Mortgage |
| Less than $50,000 | 6 (37.5%) | 0 (0.0%) |
| $50,000 to $99,999 | 4 (25.0%) | 21 (80.8%) |
| $100,000 to $299,999 | 5 (31.2%) | 3 (11.5%) |
| $300,000 to $499,999 | 1 (6.2%) | 2 (7.7%) |
| $500,000 to $749,999 | 0 (0.0%) | 0 (0.0%) |
| $750,000 to $999,999 | 0 (0.0%) | 0 (0.0%) |
| $1,000,000 or more | 0 (0.0%) | 0 (0.0%) |
| Total | 16 (100.0%) | 26 (100.0%) |
Household Income by Mortgage Status in Bodcaw
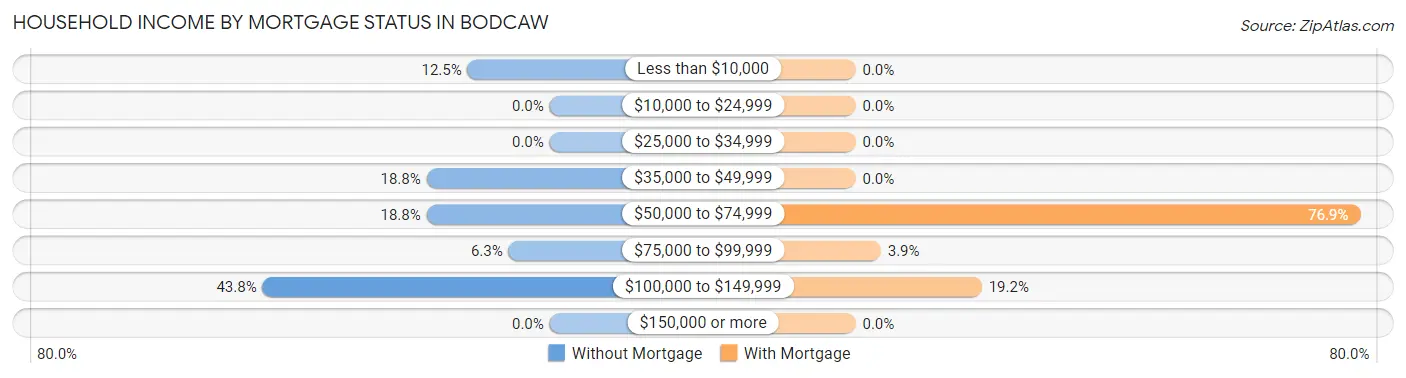
| Household Income | Without Mortgage | With Mortgage |
| Less than $10,000 | 2 (12.5%) | 0 (0.0%) |
| $10,000 to $24,999 | 0 (0.0%) | 0 (0.0%) |
| $25,000 to $34,999 | 0 (0.0%) | 0 (0.0%) |
| $35,000 to $49,999 | 3 (18.8%) | 0 (0.0%) |
| $50,000 to $74,999 | 3 (18.8%) | 20 (76.9%) |
| $75,000 to $99,999 | 1 (6.2%) | 1 (3.8%) |
| $100,000 to $149,999 | 7 (43.8%) | 5 (19.2%) |
| $150,000 or more | 0 (0.0%) | 0 (0.0%) |
| Total | 16 (100.0%) | 26 (100.0%) |
Property Value to Household Income Ratio in Bodcaw
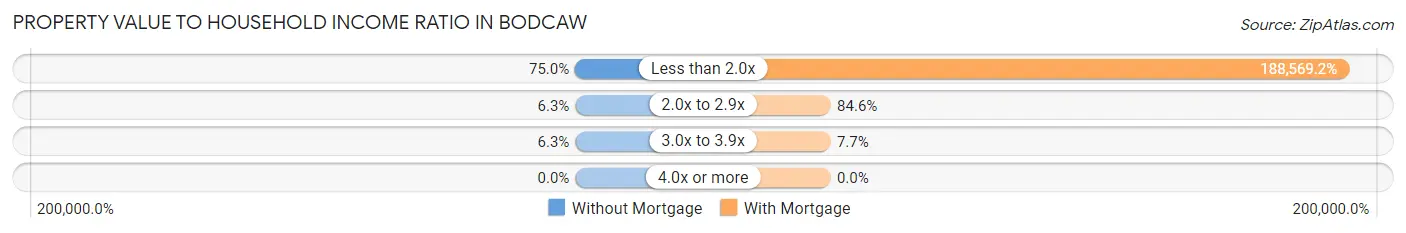
| Value-to-Income Ratio | Without Mortgage | With Mortgage |
| Less than 2.0x | 12 (75.0%) | 49,028 (188,569.2%) |
| 2.0x to 2.9x | 1 (6.2%) | 22 (84.6%) |
| 3.0x to 3.9x | 1 (6.2%) | 2 (7.7%) |
| 4.0x or more | 0 (0.0%) | 0 (0.0%) |
| Total | 16 (100.0%) | 26 (100.0%) |
Real Estate Taxes by Mortgage Status in Bodcaw
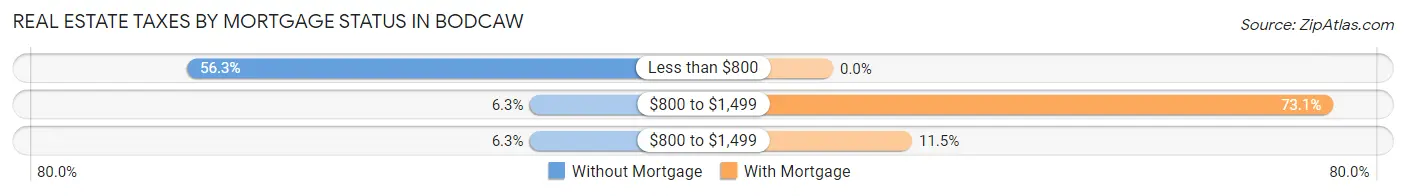
| Property Taxes | Without Mortgage | With Mortgage |
| Less than $800 | 9 (56.2%) | 0 (0.0%) |
| $800 to $1,499 | 1 (6.2%) | 19 (73.1%) |
| $800 to $1,499 | 1 (6.2%) | 3 (11.5%) |
| Total | 16 (100.0%) | 26 (100.0%) |
Health & Disability in Bodcaw
Health Insurance Coverage by Age in Bodcaw
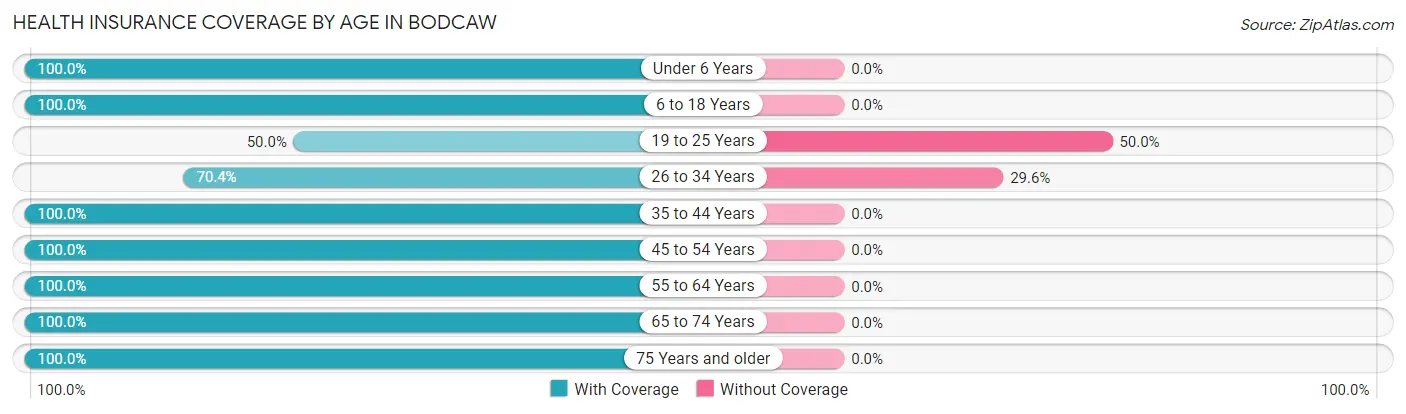
| Age Bracket | With Coverage | Without Coverage |
| Under 6 Years | 8 (100.0%) | 0 (0.0%) |
| 6 to 18 Years | 43 (100.0%) | 0 (0.0%) |
| 19 to 25 Years | 1 (50.0%) | 1 (50.0%) |
| 26 to 34 Years | 19 (70.4%) | 8 (29.6%) |
| 35 to 44 Years | 2 (100.0%) | 0 (0.0%) |
| 45 to 54 Years | 40 (100.0%) | 0 (0.0%) |
| 55 to 64 Years | 8 (100.0%) | 0 (0.0%) |
| 65 to 74 Years | 6 (100.0%) | 0 (0.0%) |
| 75 Years and older | 7 (100.0%) | 0 (0.0%) |
| Total | 134 (93.7%) | 9 (6.3%) |
Health Insurance Coverage by Citizenship Status in Bodcaw
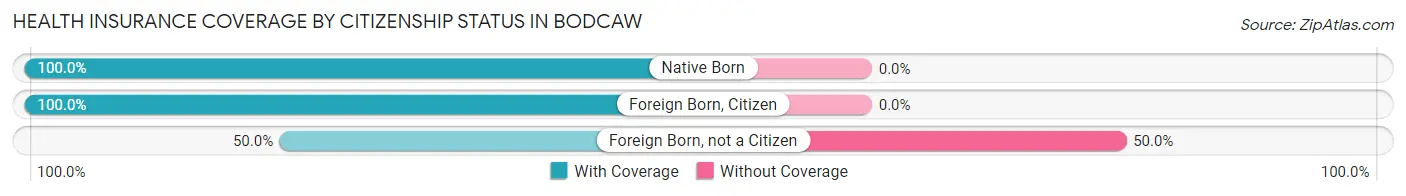
| Citizenship Status | With Coverage | Without Coverage |
| Native Born | 8 (100.0%) | 0 (0.0%) |
| Foreign Born, Citizen | 43 (100.0%) | 0 (0.0%) |
| Foreign Born, not a Citizen | 1 (50.0%) | 1 (50.0%) |
Health Insurance Coverage by Household Income in Bodcaw
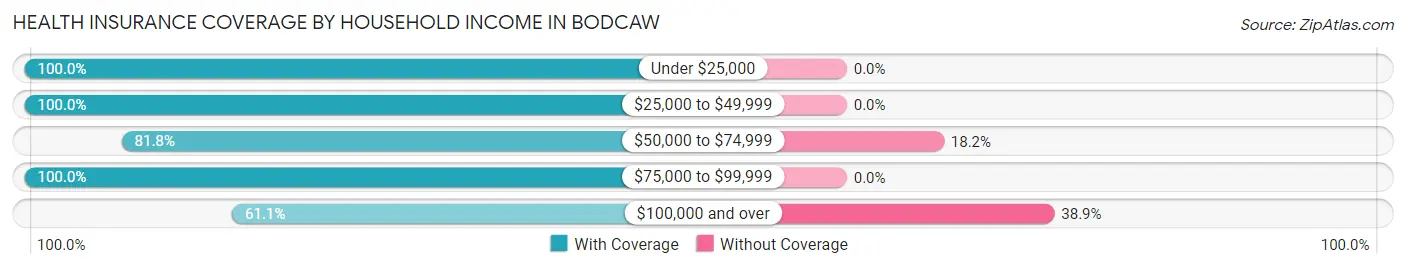
| Household Income | With Coverage | Without Coverage |
| Under $25,000 | 5 (100.0%) | 0 (0.0%) |
| $25,000 to $49,999 | 80 (100.0%) | 0 (0.0%) |
| $50,000 to $74,999 | 9 (81.8%) | 2 (18.2%) |
| $75,000 to $99,999 | 29 (100.0%) | 0 (0.0%) |
| $100,000 and over | 11 (61.1%) | 7 (38.9%) |
Public vs Private Health Insurance Coverage by Age in Bodcaw
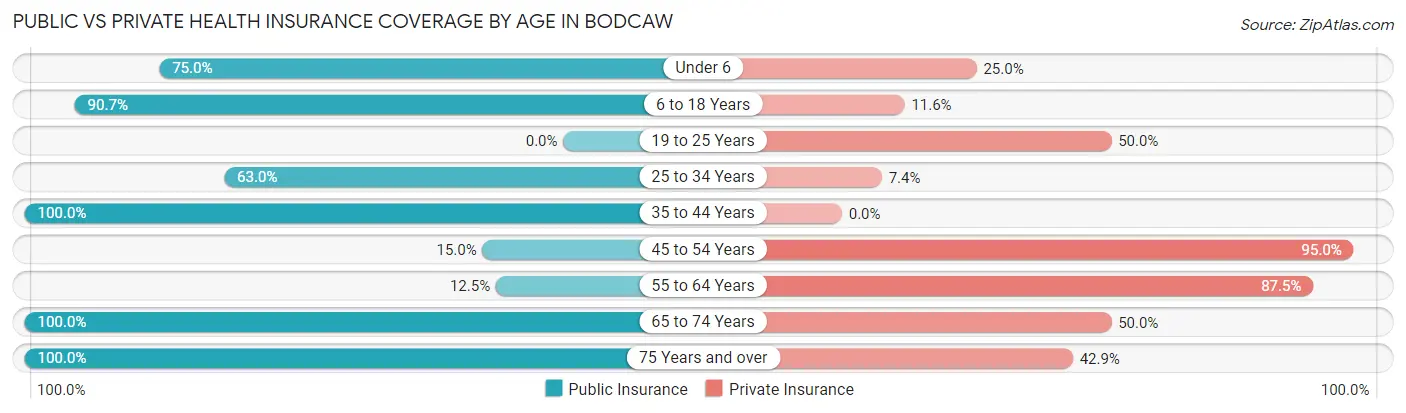
| Age Bracket | Public Insurance | Private Insurance |
| Under 6 | 6 (75.0%) | 2 (25.0%) |
| 6 to 18 Years | 39 (90.7%) | 5 (11.6%) |
| 19 to 25 Years | 0 (0.0%) | 1 (50.0%) |
| 25 to 34 Years | 17 (63.0%) | 2 (7.4%) |
| 35 to 44 Years | 2 (100.0%) | 0 (0.0%) |
| 45 to 54 Years | 6 (15.0%) | 38 (95.0%) |
| 55 to 64 Years | 1 (12.5%) | 7 (87.5%) |
| 65 to 74 Years | 6 (100.0%) | 3 (50.0%) |
| 75 Years and over | 7 (100.0%) | 3 (42.9%) |
| Total | 84 (58.7%) | 61 (42.7%) |
Disability Status by Sex by Age in Bodcaw
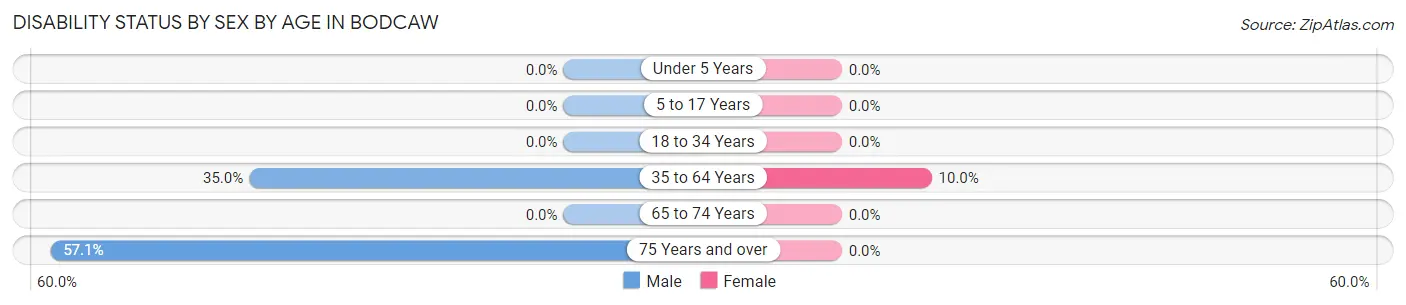
| Age Bracket | Male | Female |
| Under 5 Years | 0 (0.0%) | 0 (0.0%) |
| 5 to 17 Years | 0 (0.0%) | 0 (0.0%) |
| 18 to 34 Years | 0 (0.0%) | 0 (0.0%) |
| 35 to 64 Years | 14 (35.0%) | 1 (10.0%) |
| 65 to 74 Years | 0 (0.0%) | 0 (0.0%) |
| 75 Years and over | 4 (57.1%) | 0 (0.0%) |
Disability Class by Sex by Age in Bodcaw
Disability Class: Hearing Difficulty
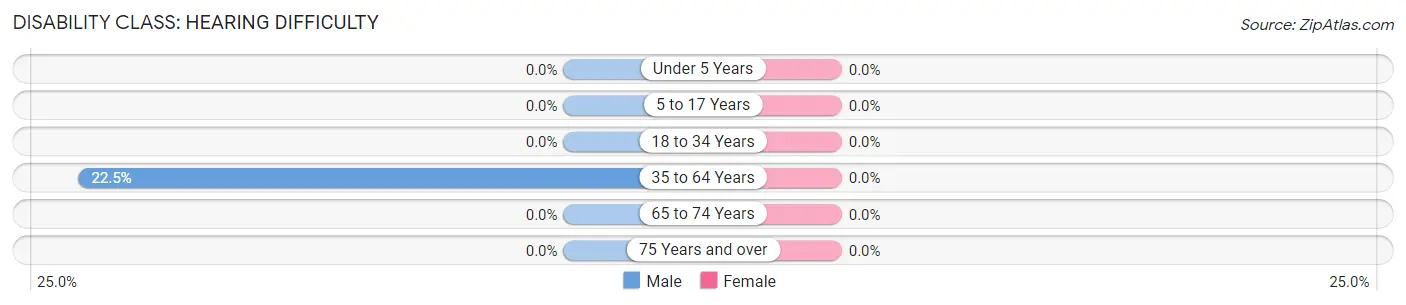
| Age Bracket | Male | Female |
| Under 5 Years | 0 (0.0%) | 0 (0.0%) |
| 5 to 17 Years | 0 (0.0%) | 0 (0.0%) |
| 18 to 34 Years | 0 (0.0%) | 0 (0.0%) |
| 35 to 64 Years | 9 (22.5%) | 0 (0.0%) |
| 65 to 74 Years | 0 (0.0%) | 0 (0.0%) |
| 75 Years and over | 0 (0.0%) | 0 (0.0%) |
Disability Class: Vision Difficulty
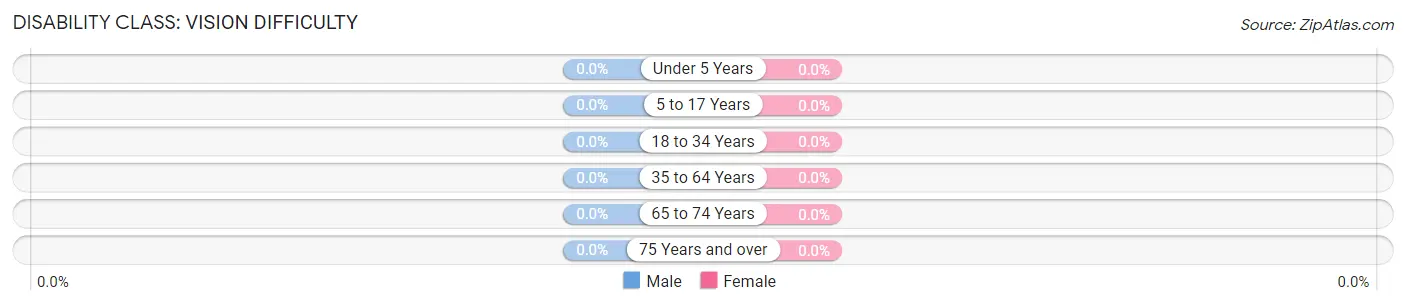
| Age Bracket | Male | Female |
| Under 5 Years | 0 (0.0%) | 0 (0.0%) |
| 5 to 17 Years | 0 (0.0%) | 0 (0.0%) |
| 18 to 34 Years | 0 (0.0%) | 0 (0.0%) |
| 35 to 64 Years | 0 (0.0%) | 0 (0.0%) |
| 65 to 74 Years | 0 (0.0%) | 0 (0.0%) |
| 75 Years and over | 0 (0.0%) | 0 (0.0%) |
Disability Class: Cognitive Difficulty
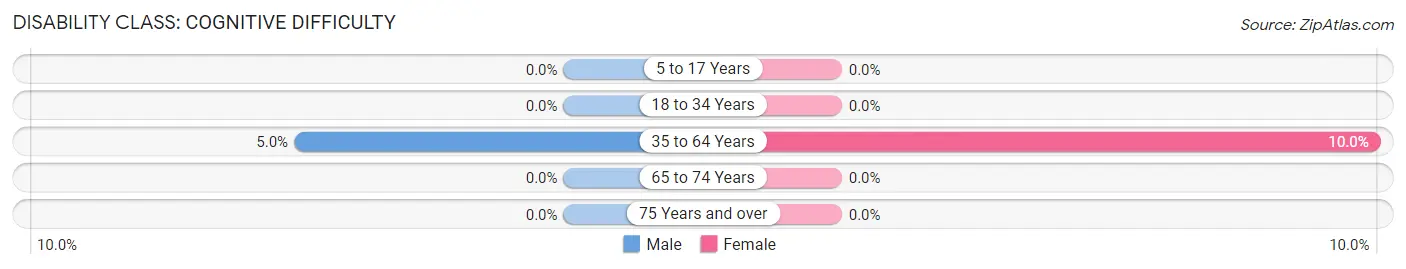
| Age Bracket | Male | Female |
| 5 to 17 Years | 0 (0.0%) | 0 (0.0%) |
| 18 to 34 Years | 0 (0.0%) | 0 (0.0%) |
| 35 to 64 Years | 2 (5.0%) | 1 (10.0%) |
| 65 to 74 Years | 0 (0.0%) | 0 (0.0%) |
| 75 Years and over | 0 (0.0%) | 0 (0.0%) |
Disability Class: Ambulatory Difficulty
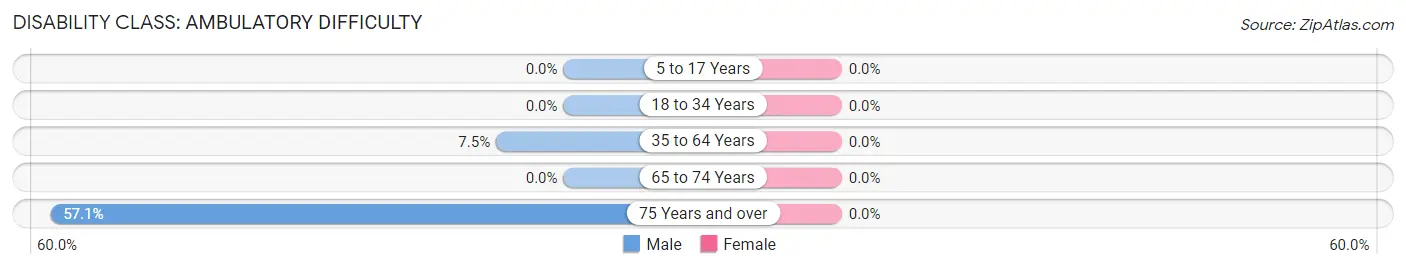
| Age Bracket | Male | Female |
| 5 to 17 Years | 0 (0.0%) | 0 (0.0%) |
| 18 to 34 Years | 0 (0.0%) | 0 (0.0%) |
| 35 to 64 Years | 3 (7.5%) | 0 (0.0%) |
| 65 to 74 Years | 0 (0.0%) | 0 (0.0%) |
| 75 Years and over | 4 (57.1%) | 0 (0.0%) |
Disability Class: Self-Care Difficulty
| Age Bracket | Male | Female |
| 5 to 17 Years | 0 (0.0%) | 0 (0.0%) |
| 18 to 34 Years | 0 (0.0%) | 0 (0.0%) |
| 35 to 64 Years | 0 (0.0%) | 0 (0.0%) |
| 65 to 74 Years | 0 (0.0%) | 0 (0.0%) |
| 75 Years and over | 0 (0.0%) | 0 (0.0%) |
Technology Access in Bodcaw
Computing Device Access in Bodcaw
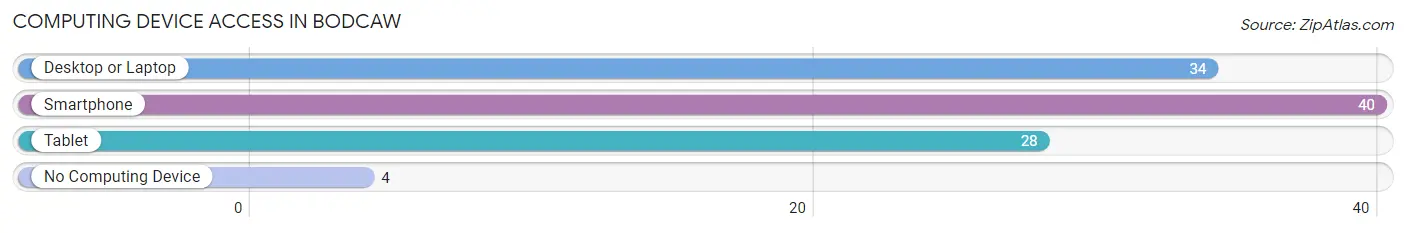
| Device Type | # Households | % Households |
| Desktop or Laptop | 34 | 75.6% |
| Smartphone | 40 | 88.9% |
| Tablet | 28 | 62.2% |
| No Computing Device | 4 | 8.9% |
| Total | 45 | 100.0% |
Internet Access in Bodcaw
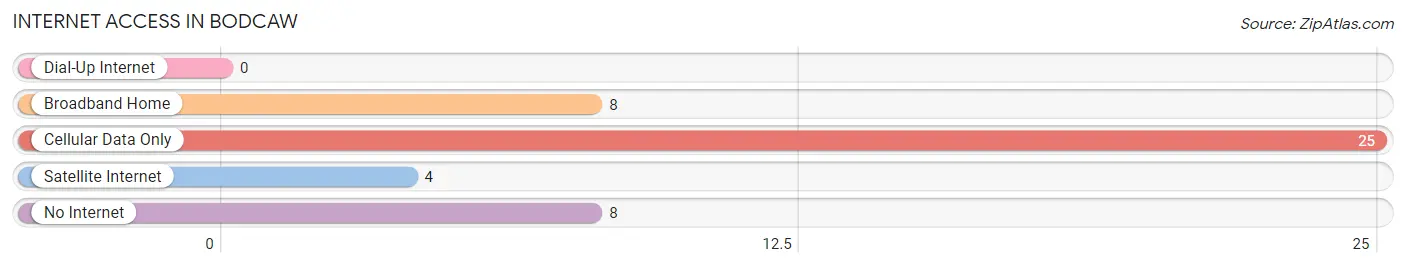
| Internet Type | # Households | % Households |
| Dial-Up Internet | 0 | 0.0% |
| Broadband Home | 8 | 17.8% |
| Cellular Data Only | 25 | 55.6% |
| Satellite Internet | 4 | 8.9% |
| No Internet | 8 | 17.8% |
| Total | 45 | 100.0% |
Bodcaw Summary
Bodcaw is a small unincorporated community located in Nevada County, Arkansas. It is situated in the southwestern corner of the state, approximately 20 miles south of the city of Hope. The population of Bodcaw was estimated to be around 200 people in 2000.
History
Bodcaw was first settled in the late 1800s by a group of settlers from the nearby town of Prescott. The town was named after the Bodcaw Creek, which runs through the area. The creek was named after a Choctaw Indian chief who lived in the area.
The first post office in Bodcaw was established in 1891. The town was incorporated in 1895 and the first mayor was elected in 1896.
In the early 1900s, Bodcaw was a thriving agricultural community. Cotton was the main crop grown in the area, and the town had several cotton gins and a cottonseed oil mill. The town also had a sawmill, a gristmill, and a blacksmith shop.
In the 1920s, Bodcaw began to decline as the cotton industry moved away from the area. The town’s population decreased and many of the businesses closed.
In the 1950s, Bodcaw began to experience a resurgence as the timber industry moved into the area. The town had several sawmills and a wood-treating plant. The timber industry provided jobs for many of the town’s residents.
Geography
Bodcaw is located in the southwestern corner of Nevada County, Arkansas. It is situated in the Ouachita Mountains, approximately 20 miles south of the city of Hope. The town is surrounded by rolling hills and forests.
The Bodcaw Creek runs through the town and is a popular spot for fishing and swimming. The creek is also home to several species of fish, including bass, catfish, and crappie.
The climate in Bodcaw is mild and humid. The average temperature in the summer is around 80 degrees Fahrenheit and the average temperature in the winter is around 40 degrees Fahrenheit.
Economy
The economy of Bodcaw is largely based on the timber industry. The town has several sawmills and a wood-treating plant. The timber industry provides jobs for many of the town’s residents.
The town also has a few small businesses, including a grocery store, a hardware store, and a gas station.
Demographics
The population of Bodcaw was estimated to be around 200 people in 2000. The town is predominantly white, with a small African American population. The median household income in Bodcaw is around $30,000.
Common Questions
What is Per Capita Income in Bodcaw?
Per Capita income in Bodcaw is $24,281.
What is the Median Family Income in Bodcaw?
Median Family Income in Bodcaw is $49,514.
What is the Median Household income in Bodcaw?
Median Household Income in Bodcaw is $49,464.
What is Income or Wage Gap in Bodcaw?
Income or Wage Gap in Bodcaw is 94.5%.
Women in Bodcaw earn 5.5 cents for every dollar earned by a man.
What is Inequality or Gini Index in Bodcaw?
Inequality or Gini Index in Bodcaw is 0.27.
What is the Total Population of Bodcaw?
Total Population of Bodcaw is 143.
What is the Total Male Population of Bodcaw?
Total Male Population of Bodcaw is 90.
What is the Total Female Population of Bodcaw?
Total Female Population of Bodcaw is 53.
What is the Ratio of Males per 100 Females in Bodcaw?
There are 169.81 Males per 100 Females in Bodcaw.
What is the Ratio of Females per 100 Males in Bodcaw?
There are 58.89 Females per 100 Males in Bodcaw.
What is the Median Population Age in Bodcaw?
Median Population Age in Bodcaw is 30.9 Years.
What is the Average Family Size in Bodcaw
Average Family Size in Bodcaw is 2.9 People.
What is the Average Household Size in Bodcaw
Average Household Size in Bodcaw is 3.2 People.
How Large is the Labor Force in Bodcaw?
There are 71 People in the Labor Forcein in Bodcaw.
What is the Percentage of People in the Labor Force in Bodcaw?
77.2% of People are in the Labor Force in Bodcaw.