Zip Codes with the Highest Percentage of Households Without a Vehicle in Jonesboro, AR
RELATED REPORTS & OPTIONS
Households without a Cars
Jonesboro
Compare Zip Codes
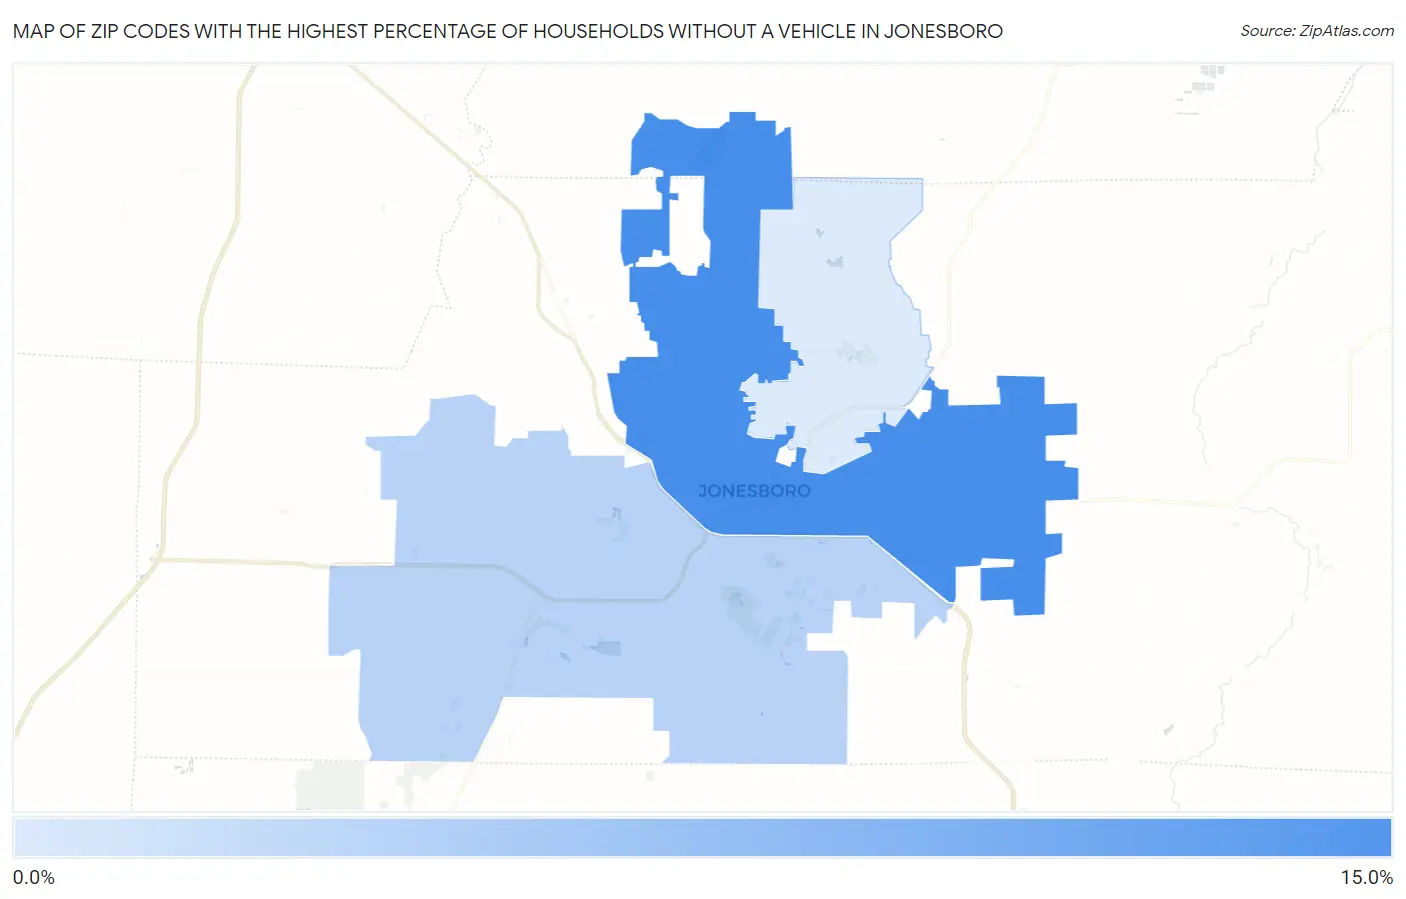
Map of Zip Codes with the Highest Percentage of Households Without a Vehicle in Jonesboro
2.5%
11.5%
Zip Codes with the Highest Percentage of Households Without a Vehicle in Jonesboro, AR
| Zip Code | Housholds Without a Car | vs State | vs National | |
| 1. | 72401 | 11.5% | 6.0%(+5.50)#70 | 8.3%(+3.20)#3,818 |
| 2. | 72404 | 4.6% | 6.0%(-1.40)#253 | 8.3%(-3.70)#13,916 |
| 3. | 72405 | 2.5% | 6.0%(-3.50)#364 | 8.3%(-5.80)#20,767 |
1
Common Questions
What are the Top Zip Codes with the Highest Percentage of Households Without a Vehicle in Jonesboro, AR?
Top Zip Codes with the Highest Percentage of Households Without a Vehicle in Jonesboro, AR are:
What zip code has the Highest Percentage of Households Without a Vehicle in Jonesboro, AR?
72401 has the Highest Percentage of Households Without a Vehicle in Jonesboro, AR with 11.5%.
What is the Percentage of Households Without a Vehicle in Jonesboro, AR?
Percentage of Households Without a Vehicle in Jonesboro is 8.5%.
What is the Percentage of Households Without a Vehicle in Arkansas?
Percentage of Households Without a Vehicle in Arkansas is 6.0%.
What is the Percentage of Households Without a Vehicle in the United States?
Percentage of Households Without a Vehicle in the United States is 8.3%.