Immigrants from Romania vs Yup'ik 4 or more Vehicles in Household

COMPARE

Immigrants from Romania
Race
Ancestry
AfghanAfricanAlaska NativeAlaskan AthabascanAlbanianAleutAlsatianAmericanApacheArabArapahoArgentineanArmenianAssyrian/Chaldean/SyriacAustralianAustrianBahamianBangladeshiBarbadianBasqueBelgianBelizeanBermudanBhutaneseBlackfeetBolivianBrazilianBritishBritish West IndianBulgarianBurmeseCajunCambodianCanadianCape VerdeanCarpatho RusynCelticCentral AmericanCentral American IndianCherokeeCheyenneChickasawChileanChineseChippewaChoctawColombianColvilleComancheCosta RicanCreeCreekCroatianCrowCubanCypriotCzechCzechoslovakianDanishDelawareDominicanDutchDutch West IndianEastern EuropeanEcuadorianEgyptianEnglishEstonianEthiopianEuropeanFijianFilipinoFinnishFrenchFrench American IndianFrench CanadianGermanGerman RussianGhanaianGreekGuamanian/ChamorroGuatemalanGuyaneseHaitianHmongHonduranHopiHoumaHungarianIcelanderIndian (Asian)IndonesianInupiatIranianIraqiIrishIroquoisIsraeliItalianJamaicanJapaneseJordanianKenyanKiowaKoreanLaotianLatvianLebaneseLiberianLithuanianLumbeeLuxembourgerMacedonianMalaysianMalteseMarshalleseMenomineeMexicanMexican American IndianMongolianMoroccanNative HawaiianNavajoNepaleseNew ZealanderNicaraguanNigerianNorthern EuropeanNorwegianOkinawanOsageOttawaPaiutePakistaniPalestinianPanamanianParaguayanPennsylvania GermanPeruvianPimaPolishPortuguesePotawatomiPuebloPuerto RicanPuget Sound SalishRomanianRussianSalvadoranSamoanScandinavianScotch-IrishScottishSeminoleSenegaleseSerbianShoshoneSierra LeoneanSiouxSlavicSlovakSloveneSomaliSouth AfricanSouth AmericanSouth American IndianSoviet UnionSpaniardSpanishSpanish AmericanSpanish American IndianSri LankanSubsaharan AfricanSudaneseSwedishSwissSyrianTaiwaneseThaiTlingit-HaidaTohono O'OdhamTonganTrinidadian and TobagonianTsimshianTurkishU.S. Virgin IslanderUgandanUkrainianUruguayanUteVenezuelanVietnameseWelshWest IndianYakamaYaquiYugoslavianYumanZimbabwean
Immigration
NonimmigrantsImmigrantsAfghanistanAfricaAlbaniaArgentinaArmeniaAsiaAustraliaAustriaBahamasBangladeshBarbadosBelarusBelgiumBelizeBoliviaBosnia and HerzegovinaBrazilBulgariaBurma/MyanmarCabo VerdeCambodiaCameroonCanadaCaribbeanCentral AmericaChileChinaColombiaCongoCosta RicaCroatiaCubaCzechoslovakiaDenmarkDominicaDominican RepublicEastern AfricaEastern AsiaEastern EuropeEcuadorEgyptEl SalvadorEnglandEritreaEthiopiaEuropeFijiFranceGermanyGhanaGreeceGrenadaGuatemalaGuyanaHaitiHondurasHong KongHungaryIndiaIndonesiaIranIraqIrelandIsraelItalyJamaicaJapanJordanKazakhstanKenyaKoreaKuwaitLaosLatin AmericaLatviaLebanonLiberiaLithuaniaMalaysiaMexicoMicronesiaMiddle AfricaMoldovaMoroccoNepalNetherlandsNicaraguaNigeriaNorth AmericaNorth MacedoniaNorthern AfricaNorthern EuropeNorwayOceaniaPakistanPanamaPeruPhilippinesPolandPortugalRomaniaRussiaSaudi ArabiaScotlandSenegalSerbiaSierra LeoneSingaporeSomaliaSouth AfricaSouth AmericaSouth Central AsiaSouth Eastern AsiaSouthern EuropeSpainSri LankaSt. Vincent and the GrenadinesSudanSwedenSwitzerlandSyriaTaiwanThailandTrinidad and TobagoTurkeyUgandaUkraineUruguayUzbekistanVenezuelaVietnamWest IndiesWestern AfricaWestern AsiaWestern EuropeYemenZaireZimbabweAzores
Yup'ik
Race
Ancestry
AfghanAfricanAlaska NativeAlaskan AthabascanAlbanianAleutAlsatianAmericanApacheArabArapahoArgentineanArmenianAssyrian/Chaldean/SyriacAustralianAustrianBahamianBangladeshiBarbadianBasqueBelgianBelizeanBermudanBhutaneseBlackfeetBolivianBrazilianBritishBritish West IndianBulgarianBurmeseCajunCambodianCanadianCape VerdeanCarpatho RusynCelticCentral AmericanCentral American IndianCherokeeCheyenneChickasawChileanChineseChippewaChoctawColombianColvilleComancheCosta RicanCreeCreekCroatianCrowCubanCypriotCzechCzechoslovakianDanishDelawareDominicanDutchDutch West IndianEastern EuropeanEcuadorianEgyptianEnglishEstonianEthiopianEuropeanFijianFilipinoFinnishFrenchFrench American IndianFrench CanadianGermanGerman RussianGhanaianGreekGuamanian/ChamorroGuatemalanGuyaneseHaitianHmongHonduranHopiHoumaHungarianIcelanderIndian (Asian)IndonesianInupiatIranianIraqiIrishIroquoisIsraeliItalianJamaicanJapaneseJordanianKenyanKiowaKoreanLaotianLatvianLebaneseLiberianLithuanianLumbeeLuxembourgerMacedonianMalaysianMalteseMarshalleseMenomineeMexicanMexican American IndianMongolianMoroccanNative HawaiianNavajoNepaleseNew ZealanderNicaraguanNigerianNorthern EuropeanNorwegianOkinawanOsageOttawaPaiutePakistaniPalestinianPanamanianParaguayanPennsylvania GermanPeruvianPimaPolishPortuguesePotawatomiPuebloPuerto RicanPuget Sound SalishRomanianRussianSalvadoranSamoanScandinavianScotch-IrishScottishSeminoleSenegaleseSerbianShoshoneSierra LeoneanSiouxSlavicSlovakSloveneSomaliSouth AfricanSouth AmericanSouth American IndianSoviet UnionSpaniardSpanishSpanish AmericanSpanish American IndianSri LankanSubsaharan AfricanSudaneseSwedishSwissSyrianTaiwaneseThaiTlingit-HaidaTohono O'OdhamTonganTrinidadian and TobagonianTsimshianTurkishU.S. Virgin IslanderUgandanUkrainianUruguayanUteVenezuelanVietnameseWelshWest IndianYakamaYaquiYugoslavianYumanYup'ikZimbabwean
Immigration
NonimmigrantsImmigrantsAfghanistanAfricaAlbaniaArgentinaArmeniaAsiaAustraliaAustriaBahamasBangladeshBarbadosBelarusBelgiumBelizeBoliviaBosnia and HerzegovinaBrazilBulgariaBurma/MyanmarCabo VerdeCambodiaCameroonCanadaCaribbeanCentral AmericaChileChinaColombiaCongoCosta RicaCroatiaCubaCzechoslovakiaDenmarkDominicaDominican RepublicEastern AfricaEastern AsiaEastern EuropeEcuadorEgyptEl SalvadorEnglandEritreaEthiopiaEuropeFijiFranceGermanyGhanaGreeceGrenadaGuatemalaGuyanaHaitiHondurasHong KongHungaryIndiaIndonesiaIranIraqIrelandIsraelItalyJamaicaJapanJordanKazakhstanKenyaKoreaKuwaitLaosLatin AmericaLatviaLebanonLiberiaLithuaniaMalaysiaMexicoMicronesiaMiddle AfricaMoldovaMoroccoNepalNetherlandsNicaraguaNigeriaNorth AmericaNorth MacedoniaNorthern AfricaNorthern EuropeNorwayOceaniaPakistanPanamaPeruPhilippinesPolandPortugalRussiaSaudi ArabiaScotlandSenegalSerbiaSierra LeoneSingaporeSomaliaSouth AfricaSouth AmericaSouth Central AsiaSouth Eastern AsiaSouthern EuropeSpainSri LankaSt. Vincent and the GrenadinesSudanSwedenSwitzerlandSyriaTaiwanThailandTrinidad and TobagoTurkeyUgandaUkraineUruguayUzbekistanVenezuelaVietnamWest IndiesWestern AfricaWestern AsiaWestern EuropeYemenZaireZimbabweAzores
4 or more Vehicles in Household
Income
Poverty
Unemployment
Labor Participation
Family Structure
Vehicle Availability
Education Level
Disability

4 or more Vehicles in Household Comparison

Immigrants from Romania

Yup'ik

Poor
Tragic
6.0%
4 OR MORE VEHICLES IN HOUSEHOLD
13.8/ 100
METRIC RATING
216th/ 347
METRIC RANK
5.7%
4 OR MORE VEHICLES IN HOUSEHOLD
1.5/ 100
METRIC RATING
255th/ 347
METRIC RANK

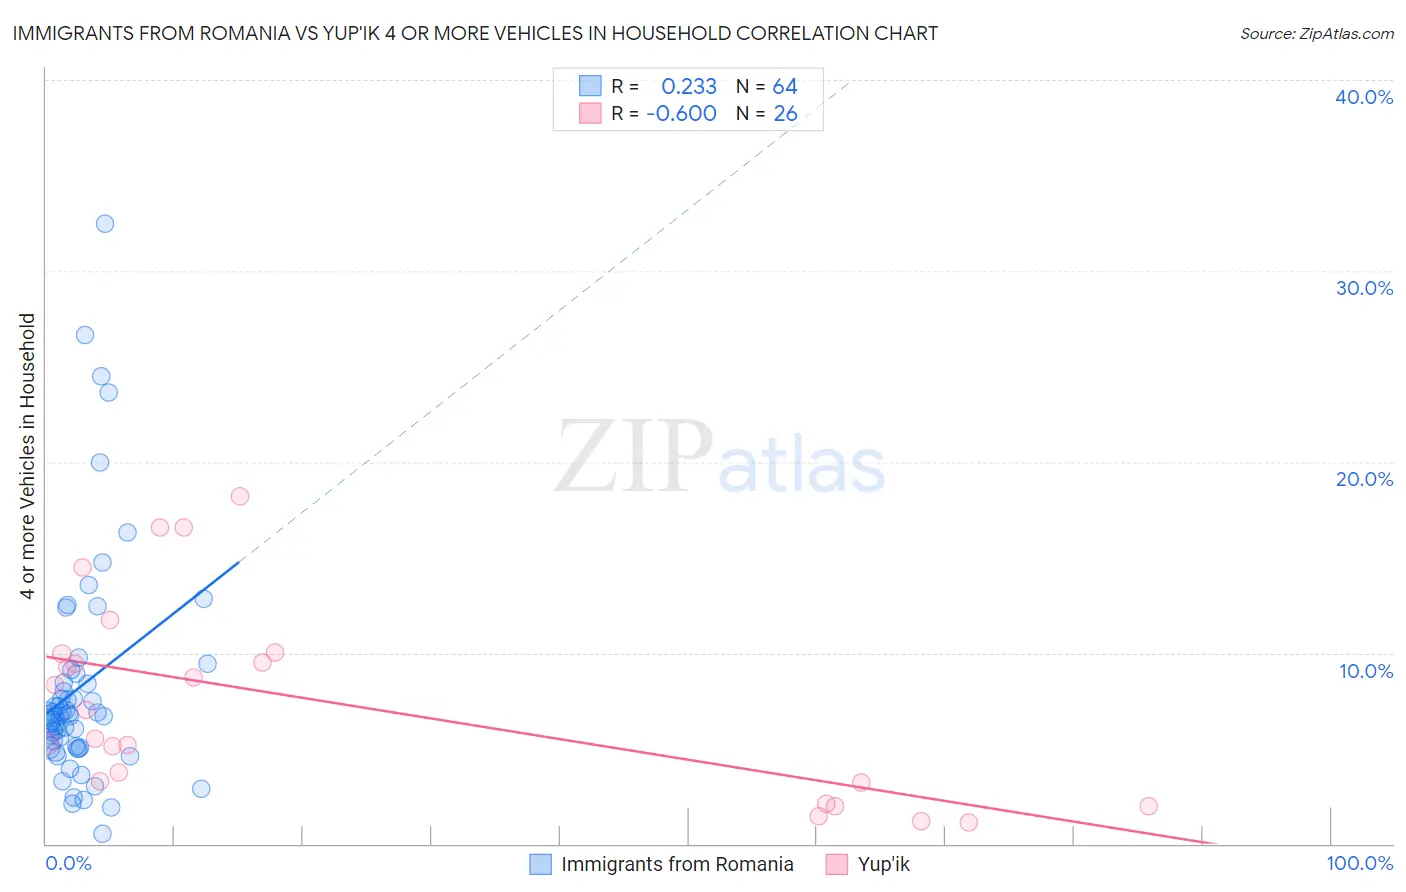
Immigrants from Romania vs Yup'ik 4 or more Vehicles in Household Correlation Chart

The statistical analysis conducted on geographies consisting of 256,113,445 people shows a weak positive correlation between the proportion of Immigrants from Romania and percentage of households with 4 or more vehicles available in the United States with a correlation coefficient (R) of 0.233 and weighted average of 6.0%. Similarly, the statistical analysis conducted on geographies consisting of 39,858,552 people shows a significant negative correlation between the proportion of Yup'ik and percentage of households with 4 or more vehicles available in the United States with a correlation coefficient (R) of -0.600 and weighted average of 5.7%, a difference of 6.7%.
Immigrants from Romania vs Yup'ik 4 or more Vehicles in Household

4 or more Vehicles in Household Correlation Summary

MeasurementImmigrants from RomaniaYup'ik
Minimum0.55%1.1%
Maximum32.5%18.2%
Range31.9%17.1%
Mean8.2%7.3%
Median6.7%6.2%
Interquartile 25% (IQ1)5.0%3.2%
Interquartile 75% (IQ3)8.7%10.0%
Interquartile Range (IQR)3.6%6.8%
Standard Deviation (Sample)6.0%5.1%
Standard Deviation (Population)6.0%5.0%

Similar Demographics by 4 or more Vehicles in Household

Demographics Similar to Immigrants from Romania by 4 or more Vehicles in Household

In terms of 4 or more vehicles in household, the demographic groups most similar to Immigrants from Romania are Immigrants from China (6.0%, a difference of 0.0%), Immigrants from Austria (6.0%, a difference of 0.11%), Arab (6.0%, a difference of 0.13%), Immigrants from Egypt (6.0%, a difference of 0.19%), and Panamanian (6.0%, a difference of 0.20%).
DemographicsRating | Rank4 or more Vehicles in Household
Immigrants | Honduras
15.4
/100
|
#209
Poor
6.1%
Immigrants | Zimbabwe
15.1
/100
|
#210
Poor
6.0%
Panamanians
14.8
/100
|
#211
Poor
6.0%
Immigrants | Egypt
14.7
/100
|
#212
Poor
6.0%
Arabs
14.4
/100
|
#213
Poor
6.0%
Immigrants | Austria
14.3
/100
|
#214
Poor
6.0%
Immigrants | China
13.8
/100
|
#215
Poor
6.0%
Immigrants | Romania
13.8
/100
|
#216
Poor
6.0%
Nigerians
12.2
/100
|
#217
Poor
6.0%
Immigrants | Italy
11.0
/100
|
#218
Poor
6.0%
Serbians
11.0
/100
|
#219
Poor
6.0%
Russians
10.3
/100
|
#220
Poor
6.0%
Immigrants | Moldova
9.3
/100
|
#221
Tragic
6.0%
Cajuns
9.2
/100
|
#222
Tragic
6.0%
Immigrants | Kenya
9.2
/100
|
#223
Tragic
6.0%

Demographics Similar to Yup'ik by 4 or more Vehicles in Household

In terms of 4 or more vehicles in household, the demographic groups most similar to Yup'ik are Immigrants from Turkey (5.7%, a difference of 0.040%), Immigrants from Panama (5.7%, a difference of 0.090%), Immigrants from Northern Africa (5.6%, a difference of 0.12%), Immigrants from Cuba (5.7%, a difference of 0.22%), and Immigrants from Lithuania (5.6%, a difference of 0.25%).
DemographicsRating | Rank4 or more Vehicles in Household
Immigrants | Eastern Africa
2.4
/100
|
#248
Tragic
5.7%
Immigrants | Southern Europe
2.3
/100
|
#249
Tragic
5.7%
Immigrants | Europe
2.3
/100
|
#250
Tragic
5.7%
Ugandans
2.2
/100
|
#251
Tragic
5.7%
Sub-Saharan Africans
2.1
/100
|
#252
Tragic
5.7%
Immigrants | Cuba
1.6
/100
|
#253
Tragic
5.7%
Immigrants | Panama
1.5
/100
|
#254
Tragic
5.7%
Yup'ik
1.5
/100
|
#255
Tragic
5.7%
Immigrants | Turkey
1.5
/100
|
#256
Tragic
5.7%
Immigrants | Northern Africa
1.4
/100
|
#257
Tragic
5.6%
Immigrants | Lithuania
1.4
/100
|
#258
Tragic
5.6%
Immigrants | France
1.3
/100
|
#259
Tragic
5.6%
Uruguayans
1.3
/100
|
#260
Tragic
5.6%
Sudanese
1.2
/100
|
#261
Tragic
5.6%
Bermudans
1.2
/100
|
#262
Tragic
5.6%