Gainesboro, TN Map & Demographics
Gainesboro Map
Gainesboro Overview
$22,192
PER CAPITA INCOME
$46,739
AVG FAMILY INCOME
$37,404
AVG HOUSEHOLD INCOME
10.9%
WAGE / INCOME GAP [ % ]
89.1¢/ $1
WAGE / INCOME GAP [ $ ]
$10,745
FAMILY INCOME DEFICIT
0.49
INEQUALITY / GINI INDEX
1,086
TOTAL POPULATION
542
MALE POPULATION
544
FEMALE POPULATION
99.63
MALES / 100 FEMALES
100.37
FEMALES / 100 MALES
49.5
MEDIAN AGE
3.3
AVG FAMILY SIZE
2.7
AVG HOUSEHOLD SIZE
371
LABOR FORCE [ PEOPLE ]
39.6%
PERCENT IN LABOR FORCE
8.6%
UNEMPLOYMENT RATE
Gainesboro Zip Codes
Gainesboro Area Codes
Income in Gainesboro
Income Overview in Gainesboro
Per Capita Income in Gainesboro is $22,192, while median incomes of families and households are $46,739 and $37,404 respectively.
| Characteristic | Number | Measure |
| Per Capita Income | 1,086 | $22,192 |
| Median Family Income | 230 | $46,739 |
| Mean Family Income | 230 | $73,520 |
| Median Household Income | 341 | $37,404 |
| Mean Household Income | 341 | $57,721 |
| Income Deficit | 230 | $10,745 |
| Wage / Income Gap (%) | 1,086 | 10.94% |
| Wage / Income Gap ($) | 1,086 | 89.06¢ per $1 |
| Gini / Inequality Index | 1,086 | 0.49 |
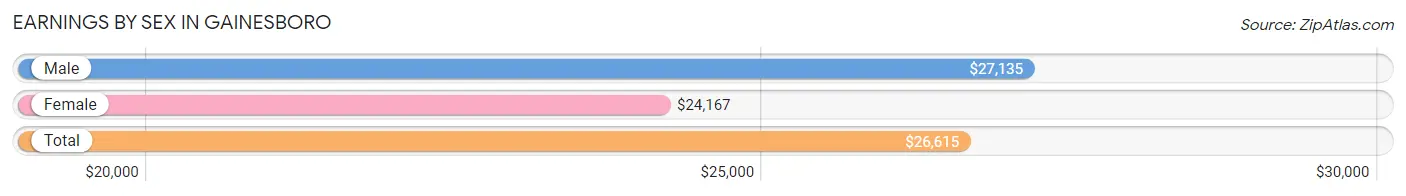
Earnings by Sex in Gainesboro
Average Earnings in Gainesboro are $26,615, $27,135 for men and $24,167 for women, a difference of 10.9%.
| Sex | Number | Average Earnings |
| Male | 235 (52.6%) | $27,135 |
| Female | 212 (47.4%) | $24,167 |
| Total | 447 (100.0%) | $26,615 |
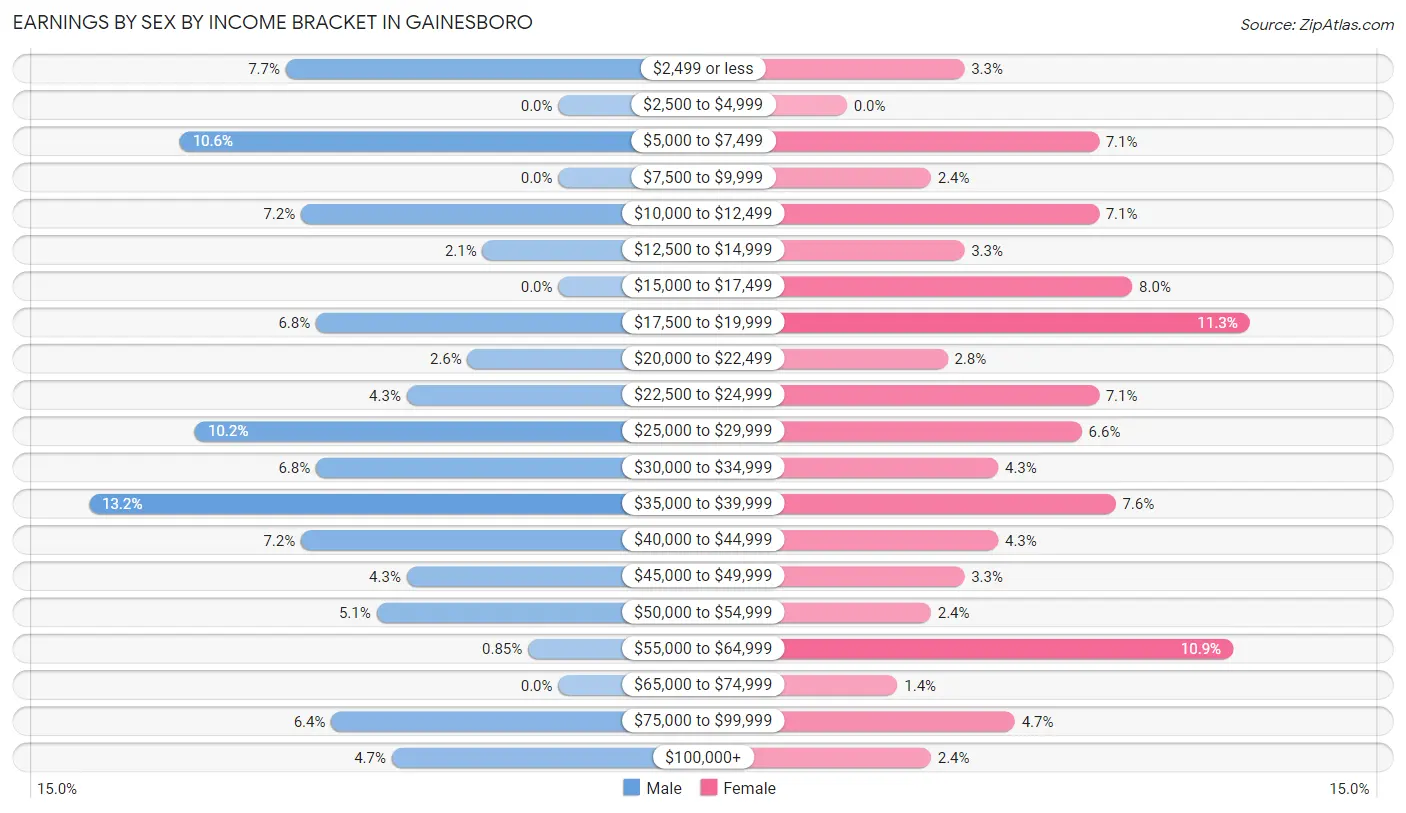
Earnings by Sex by Income Bracket in Gainesboro
The most common earnings brackets in Gainesboro are $35,000 to $39,999 for men (31 | 13.2%) and $17,500 to $19,999 for women (24 | 11.3%).
| Income | Male | Female |
| $2,499 or less | 18 (7.7%) | 7 (3.3%) |
| $2,500 to $4,999 | 0 (0.0%) | 0 (0.0%) |
| $5,000 to $7,499 | 25 (10.6%) | 15 (7.1%) |
| $7,500 to $9,999 | 0 (0.0%) | 5 (2.4%) |
| $10,000 to $12,499 | 17 (7.2%) | 15 (7.1%) |
| $12,500 to $14,999 | 5 (2.1%) | 7 (3.3%) |
| $15,000 to $17,499 | 0 (0.0%) | 17 (8.0%) |
| $17,500 to $19,999 | 16 (6.8%) | 24 (11.3%) |
| $20,000 to $22,499 | 6 (2.5%) | 6 (2.8%) |
| $22,500 to $24,999 | 10 (4.3%) | 15 (7.1%) |
| $25,000 to $29,999 | 24 (10.2%) | 14 (6.6%) |
| $30,000 to $34,999 | 16 (6.8%) | 9 (4.3%) |
| $35,000 to $39,999 | 31 (13.2%) | 16 (7.5%) |
| $40,000 to $44,999 | 17 (7.2%) | 9 (4.3%) |
| $45,000 to $49,999 | 10 (4.3%) | 7 (3.3%) |
| $50,000 to $54,999 | 12 (5.1%) | 5 (2.4%) |
| $55,000 to $64,999 | 2 (0.9%) | 23 (10.8%) |
| $65,000 to $74,999 | 0 (0.0%) | 3 (1.4%) |
| $75,000 to $99,999 | 15 (6.4%) | 10 (4.7%) |
| $100,000+ | 11 (4.7%) | 5 (2.4%) |
| Total | 235 (100.0%) | 212 (100.0%) |
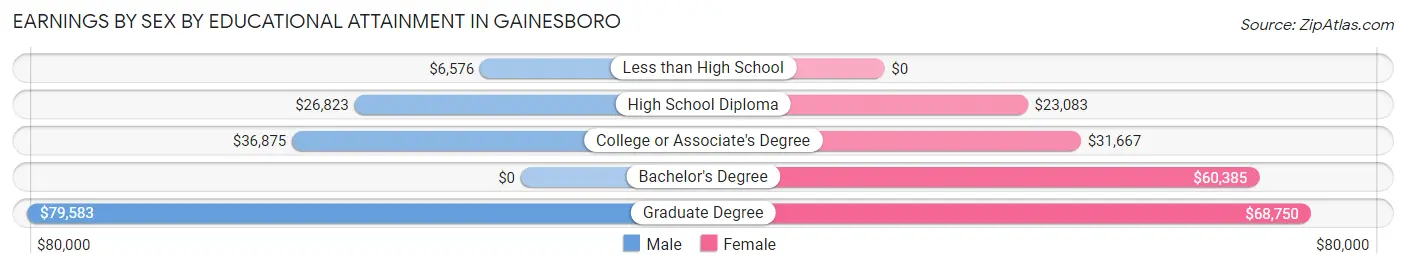
Earnings by Sex by Educational Attainment in Gainesboro
Average earnings in Gainesboro are $33,077 for men and $29,554 for women, a difference of 10.6%. Men with an educational attainment of graduate degree enjoy the highest average annual earnings of $79,583, while those with less than high school education earn the least with $6,576. Women with an educational attainment of graduate degree earn the most with the average annual earnings of $68,750, while those with high school diploma education have the smallest earnings of $23,083.
| Educational Attainment | Male Income | Female Income |
| Less than High School | $6,576 | $0 |
| High School Diploma | $26,823 | $23,083 |
| College or Associate's Degree | $36,875 | $31,667 |
| Bachelor's Degree | - | - |
| Graduate Degree | $79,583 | $68,750 |
| Total | $33,077 | $29,554 |
Family Income in Gainesboro
Family Income Brackets in Gainesboro
According to the Gainesboro family income data, there are 46 families falling into the $35,000 to $49,999 income range, which is the most common income bracket and makes up 20.0% of all families. Conversely, the $10,000 to $14,999 income bracket is the least frequent group with only 3 families (1.3%) belonging to this category.
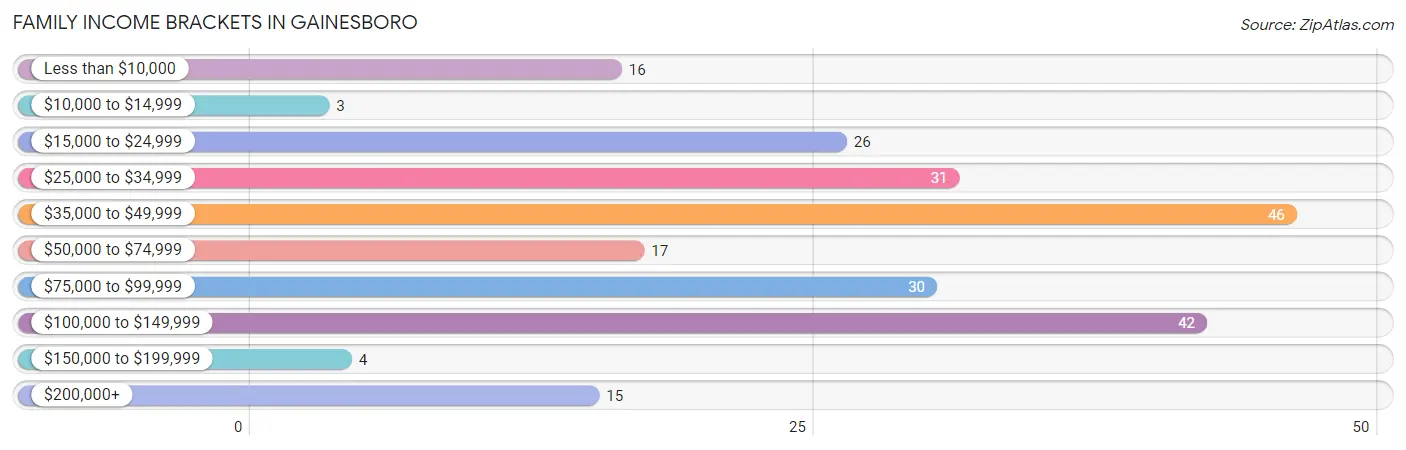
| Income Bracket | # Families | % Families |
| Less than $10,000 | 16 | 7.0% |
| $10,000 to $14,999 | 3 | 1.3% |
| $15,000 to $24,999 | 26 | 11.3% |
| $25,000 to $34,999 | 31 | 13.5% |
| $35,000 to $49,999 | 46 | 20.0% |
| $50,000 to $74,999 | 17 | 7.4% |
| $75,000 to $99,999 | 30 | 13.0% |
| $100,000 to $149,999 | 42 | 18.3% |
| $150,000 to $199,999 | 4 | 1.7% |
| $200,000+ | 15 | 6.5% |
Family Income by Famaliy Size in Gainesboro
2-person families (111 | 48.3%) account for the highest median family income in Gainesboro with $83,229 per family, while 2-person families (111 | 48.3%) have the highest median income of $41,614 per family member.
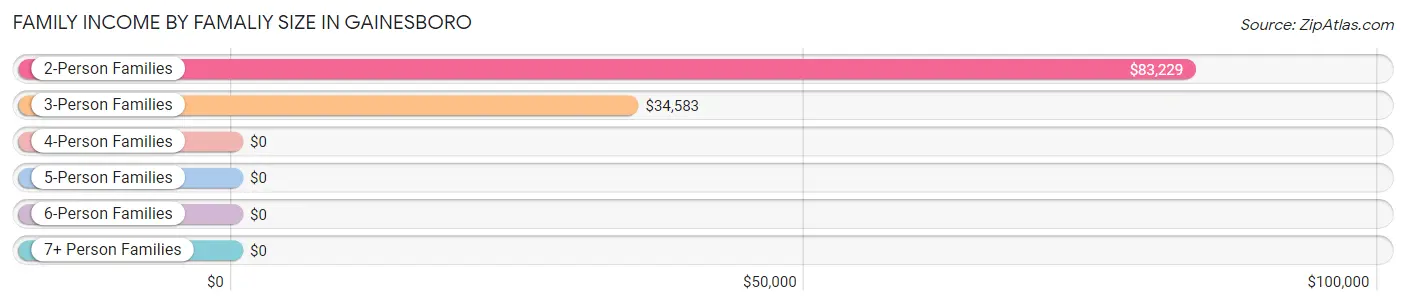
| Income Bracket | # Families | Median Income |
| 2-Person Families | 111 (48.3%) | $83,229 |
| 3-Person Families | 51 (22.2%) | $34,583 |
| 4-Person Families | 44 (19.1%) | $0 |
| 5-Person Families | 24 (10.4%) | $0 |
| 6-Person Families | 0 (0.0%) | $0 |
| 7+ Person Families | 0 (0.0%) | $0 |
| Total | 230 (100.0%) | $46,739 |
Family Income by Number of Earners in Gainesboro
The median family income in Gainesboro is $46,739, with families comprising 3+ earners (9) having the highest median family income of $113,125, while families with no earners (51) have the lowest median family income of $32,083, accounting for 3.9% and 22.2% of families, respectively.
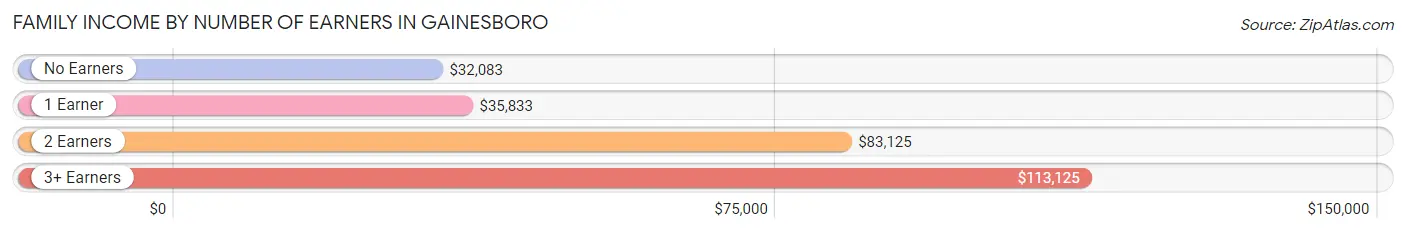
| Number of Earners | # Families | Median Income |
| No Earners | 51 (22.2%) | $32,083 |
| 1 Earner | 76 (33.0%) | $35,833 |
| 2 Earners | 94 (40.9%) | $83,125 |
| 3+ Earners | 9 (3.9%) | $113,125 |
| Total | 230 (100.0%) | $46,739 |
Household Income in Gainesboro
Household Income Brackets in Gainesboro
With 61 households falling in the category, the $35,000 to $49,999 income range is the most frequent in Gainesboro, accounting for 17.9% of all households. In contrast, only 4 households (1.2%) fall into the $150,000 to $199,999 income bracket, making it the least populous group.
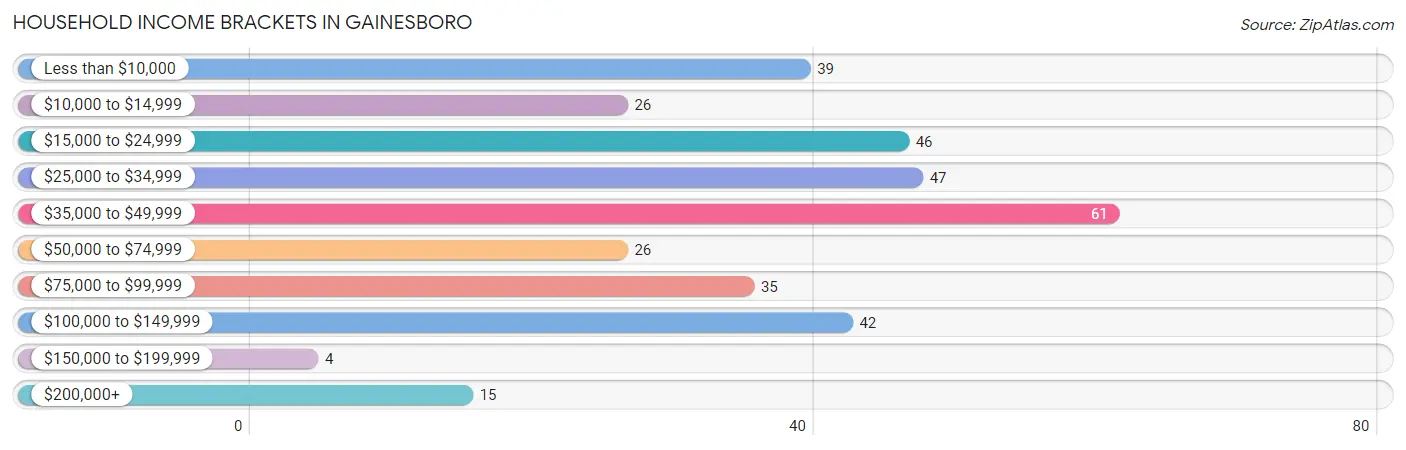
| Income Bracket | # Households | % Households |
| Less than $10,000 | 39 | 11.4% |
| $10,000 to $14,999 | 26 | 7.6% |
| $15,000 to $24,999 | 46 | 13.5% |
| $25,000 to $34,999 | 47 | 13.8% |
| $35,000 to $49,999 | 61 | 17.9% |
| $50,000 to $74,999 | 26 | 7.6% |
| $75,000 to $99,999 | 35 | 10.3% |
| $100,000 to $149,999 | 42 | 12.3% |
| $150,000 to $199,999 | 4 | 1.2% |
| $200,000+ | 15 | 4.4% |
Household Income by Householder Age in Gainesboro
The median household income in Gainesboro is $37,404, with the highest median household income of $45,795 found in the 25 to 44 years age bracket for the primary householder. A total of 83 households (24.3%) fall into this category. Meanwhile, the 15 to 24 years age bracket for the primary householder has the lowest median household income of $0, with 11 households (3.2%) in this group.
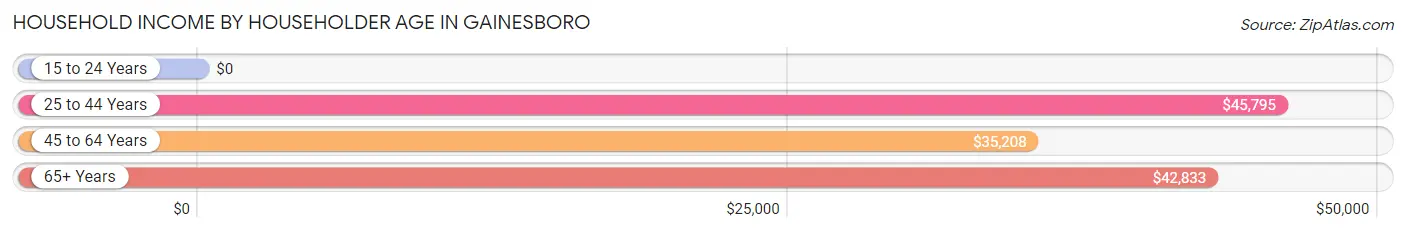
| Income Bracket | # Households | Median Income |
| 15 to 24 Years | 11 (3.2%) | $0 |
| 25 to 44 Years | 83 (24.3%) | $45,795 |
| 45 to 64 Years | 109 (32.0%) | $35,208 |
| 65+ Years | 138 (40.5%) | $42,833 |
| Total | 341 (100.0%) | $37,404 |
Poverty in Gainesboro
Income Below Poverty by Sex and Age in Gainesboro
With 23.3% poverty level for males and 34.1% for females among the residents of Gainesboro, 45 to 54 year old males and 16 and 17 year old females are the most vulnerable to poverty, with 62 males (58.5%) and 2 females (100.0%) in their respective age groups living below the poverty level.
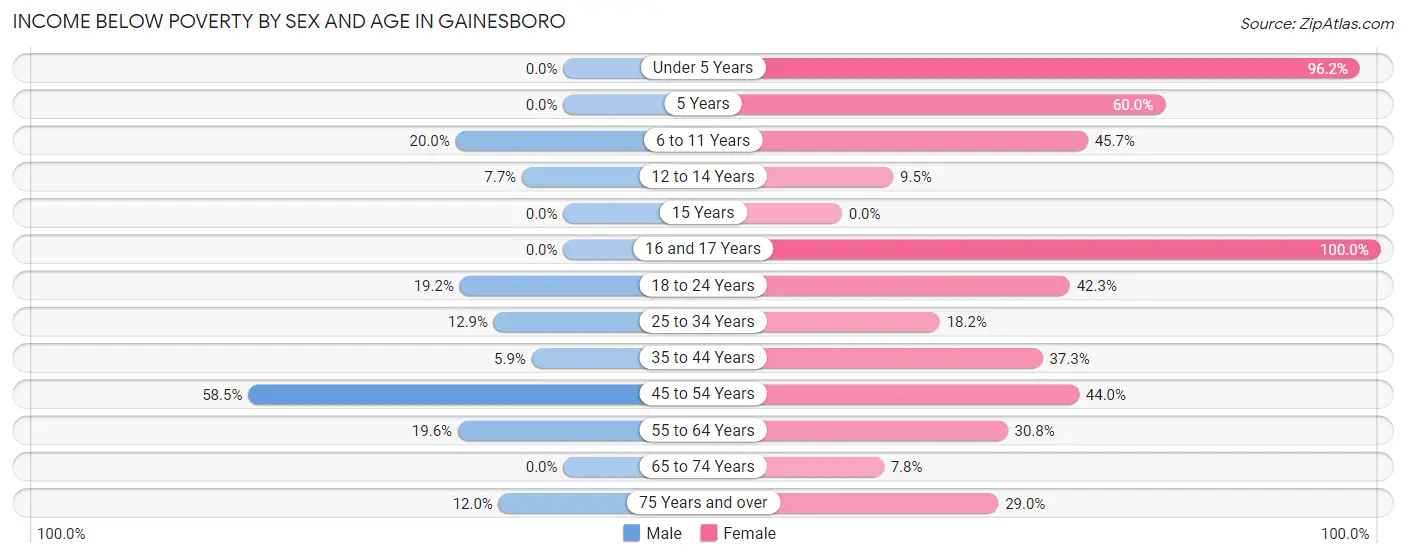
| Age Bracket | Male | Female |
| Under 5 Years | 0 (0.0%) | 25 (96.2%) |
| 5 Years | 0 (0.0%) | 3 (60.0%) |
| 6 to 11 Years | 2 (20.0%) | 21 (45.7%) |
| 12 to 14 Years | 2 (7.7%) | 2 (9.5%) |
| 15 Years | 0 (0.0%) | 0 (0.0%) |
| 16 and 17 Years | 0 (0.0%) | 2 (100.0%) |
| 18 to 24 Years | 10 (19.2%) | 11 (42.3%) |
| 25 to 34 Years | 4 (12.9%) | 6 (18.2%) |
| 35 to 44 Years | 2 (5.9%) | 19 (37.2%) |
| 45 to 54 Years | 62 (58.5%) | 44 (44.0%) |
| 55 to 64 Years | 9 (19.6%) | 20 (30.8%) |
| 65 to 74 Years | 0 (0.0%) | 7 (7.8%) |
| 75 Years and over | 6 (12.0%) | 9 (29.0%) |
| Total | 97 (23.3%) | 169 (34.1%) |
Income Above Poverty by Sex and Age in Gainesboro
According to the poverty statistics in Gainesboro, males aged under 5 years and females aged 65 to 74 years are the age groups that are most secure financially, with 100.0% of males and 92.2% of females in these age groups living above the poverty line.
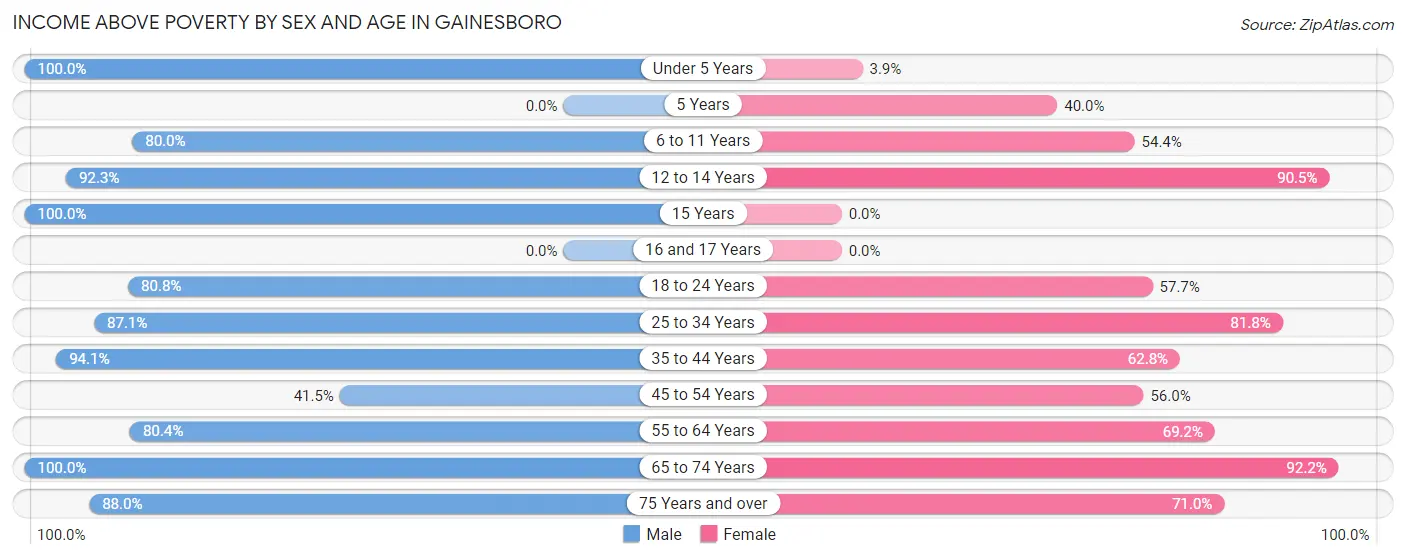
| Age Bracket | Male | Female |
| Under 5 Years | 10 (100.0%) | 1 (3.8%) |
| 5 Years | 0 (0.0%) | 2 (40.0%) |
| 6 to 11 Years | 8 (80.0%) | 25 (54.3%) |
| 12 to 14 Years | 24 (92.3%) | 19 (90.5%) |
| 15 Years | 4 (100.0%) | 0 (0.0%) |
| 16 and 17 Years | 0 (0.0%) | 0 (0.0%) |
| 18 to 24 Years | 42 (80.8%) | 15 (57.7%) |
| 25 to 34 Years | 27 (87.1%) | 27 (81.8%) |
| 35 to 44 Years | 32 (94.1%) | 32 (62.7%) |
| 45 to 54 Years | 44 (41.5%) | 56 (56.0%) |
| 55 to 64 Years | 37 (80.4%) | 45 (69.2%) |
| 65 to 74 Years | 48 (100.0%) | 83 (92.2%) |
| 75 Years and over | 44 (88.0%) | 22 (71.0%) |
| Total | 320 (76.7%) | 327 (65.9%) |
Income Below Poverty Among Married-Couple Families in Gainesboro
The poverty statistics for married-couple families in Gainesboro show that 4.6% or 8 of the total 175 families live below the poverty line. Families with 1 or 2 children have the highest poverty rate of 11.1%, comprising of 5 families. On the other hand, families with 3 or 4 children have the lowest poverty rate of 0.0%, which includes 0 families.
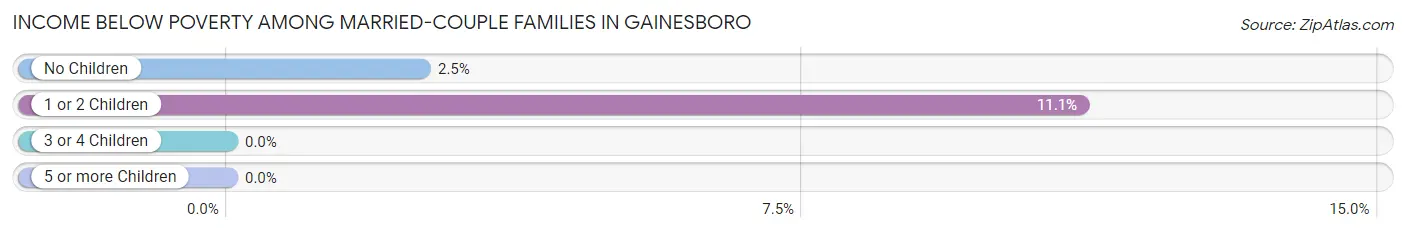
| Children | Above Poverty | Below Poverty |
| No Children | 116 (97.5%) | 3 (2.5%) |
| 1 or 2 Children | 40 (88.9%) | 5 (11.1%) |
| 3 or 4 Children | 11 (100.0%) | 0 (0.0%) |
| 5 or more Children | 0 (0.0%) | 0 (0.0%) |
| Total | 167 (95.4%) | 8 (4.6%) |
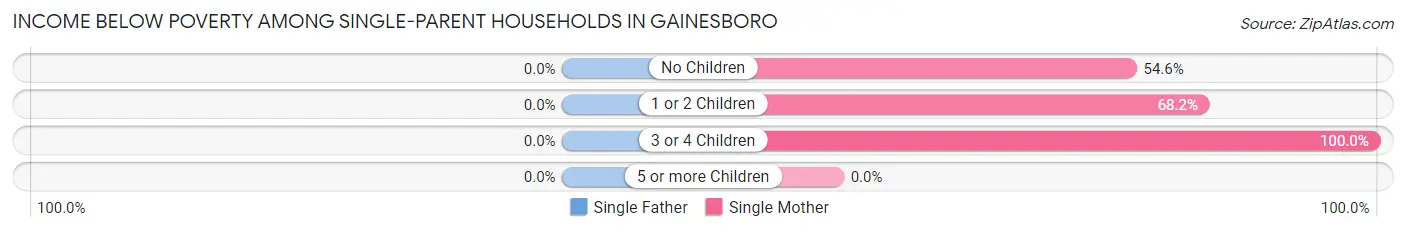
Income Below Poverty Among Single-Parent Households in Gainesboro
| Children | Single Father | Single Mother |
| No Children | 0 (0.0%) | 6 (54.5%) |
| 1 or 2 Children | 0 (0.0%) | 15 (68.2%) |
| 3 or 4 Children | 0 (0.0%) | 15 (100.0%) |
| 5 or more Children | 0 (0.0%) | 0 (0.0%) |
| Total | 0 (0.0%) | 36 (75.0%) |
Income Below Poverty Among Married-Couple vs Single-Parent Households in Gainesboro
The poverty data for Gainesboro shows that 8 of the married-couple family households (4.6%) and 36 of the single-parent households (65.4%) are living below the poverty level. Within the married-couple family households, those with 1 or 2 children have the highest poverty rate, with 5 households (11.1%) falling below the poverty line. Among the single-parent households, those with 3 or 4 children have the highest poverty rate, with 15 household (100.0%) living below poverty.
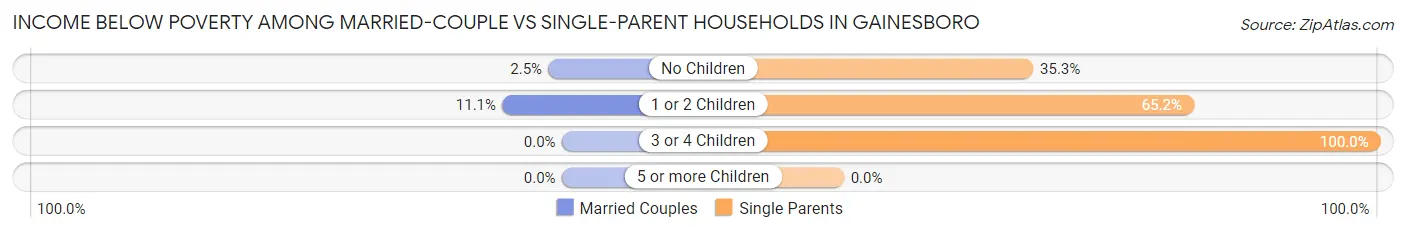
| Children | Married-Couple Families | Single-Parent Households |
| No Children | 3 (2.5%) | 6 (35.3%) |
| 1 or 2 Children | 5 (11.1%) | 15 (65.2%) |
| 3 or 4 Children | 0 (0.0%) | 15 (100.0%) |
| 5 or more Children | 0 (0.0%) | 0 (0.0%) |
| Total | 8 (4.6%) | 36 (65.4%) |
Race in Gainesboro
The most populous races in Gainesboro are White / Caucasian (978 | 90.1%), Two or more Races (62 | 5.7%), and Hispanic or Latino (38 | 3.5%).
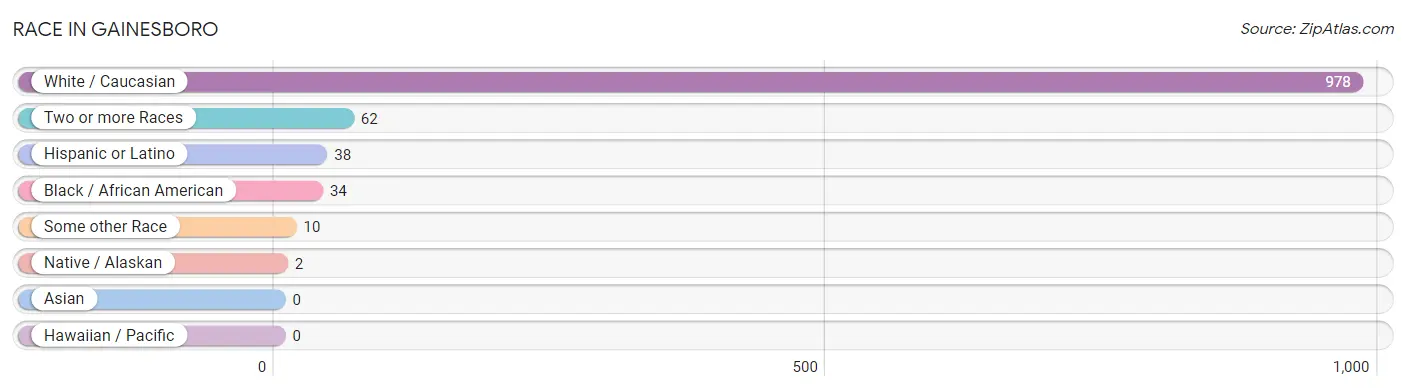
| Race | # Population | % Population |
| Asian | 0 | 0.0% |
| Black / African American | 34 | 3.1% |
| Hawaiian / Pacific | 0 | 0.0% |
| Hispanic or Latino | 38 | 3.5% |
| Native / Alaskan | 2 | 0.2% |
| White / Caucasian | 978 | 90.1% |
| Two or more Races | 62 | 5.7% |
| Some other Race | 10 | 0.9% |
| Total | 1,086 | 100.0% |
Ancestry in Gainesboro
The most populous ancestries reported in Gainesboro are Irish (187 | 17.2%), American (179 | 16.5%), English (133 | 12.2%), German (94 | 8.7%), and Italian (31 | 2.9%), together accounting for 57.5% of all Gainesboro residents.
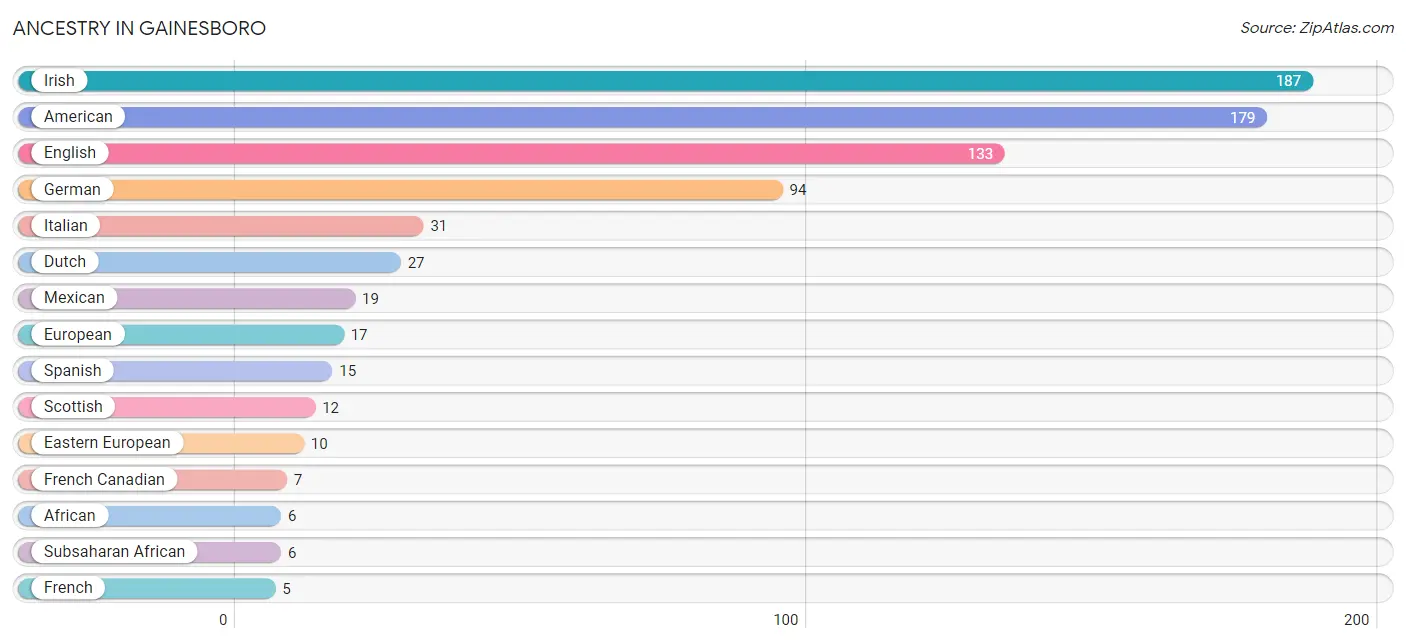
| Ancestry | # Population | % Population |
| African | 6 | 0.5% |
| American | 179 | 16.5% |
| Apache | 1 | 0.1% |
| British | 2 | 0.2% |
| Creek | 1 | 0.1% |
| Dominican | 4 | 0.4% |
| Dutch | 27 | 2.5% |
| Eastern European | 10 | 0.9% |
| English | 133 | 12.2% |
| European | 17 | 1.6% |
| French | 5 | 0.5% |
| French Canadian | 7 | 0.6% |
| German | 94 | 8.7% |
| Hungarian | 2 | 0.2% |
| Irish | 187 | 17.2% |
| Italian | 31 | 2.9% |
| Mexican | 19 | 1.8% |
| Polish | 5 | 0.5% |
| Scandinavian | 2 | 0.2% |
| Scotch-Irish | 2 | 0.2% |
| Scottish | 12 | 1.1% |
| Sioux | 2 | 0.2% |
| Spanish | 15 | 1.4% |
| Subsaharan African | 6 | 0.5% | View All 24 Rows |
Immigrants in Gainesboro
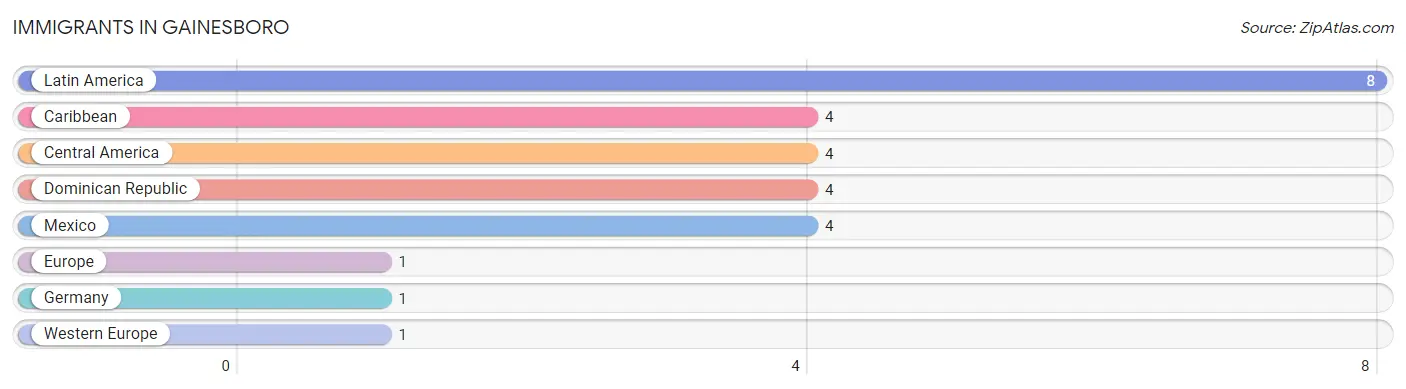
The most numerous immigrant groups reported in Gainesboro came from Latin America (8 | 0.7%), Caribbean (4 | 0.4%), Central America (4 | 0.4%), Dominican Republic (4 | 0.4%), and Mexico (4 | 0.4%), together accounting for 2.2% of all Gainesboro residents.
| Immigration Origin | # Population | % Population |
| Caribbean | 4 | 0.4% |
| Central America | 4 | 0.4% |
| Dominican Republic | 4 | 0.4% |
| Europe | 1 | 0.1% |
| Germany | 1 | 0.1% |
| Latin America | 8 | 0.7% |
| Mexico | 4 | 0.4% |
| Western Europe | 1 | 0.1% | View All 8 Rows |
Sex and Age in Gainesboro
Sex and Age in Gainesboro
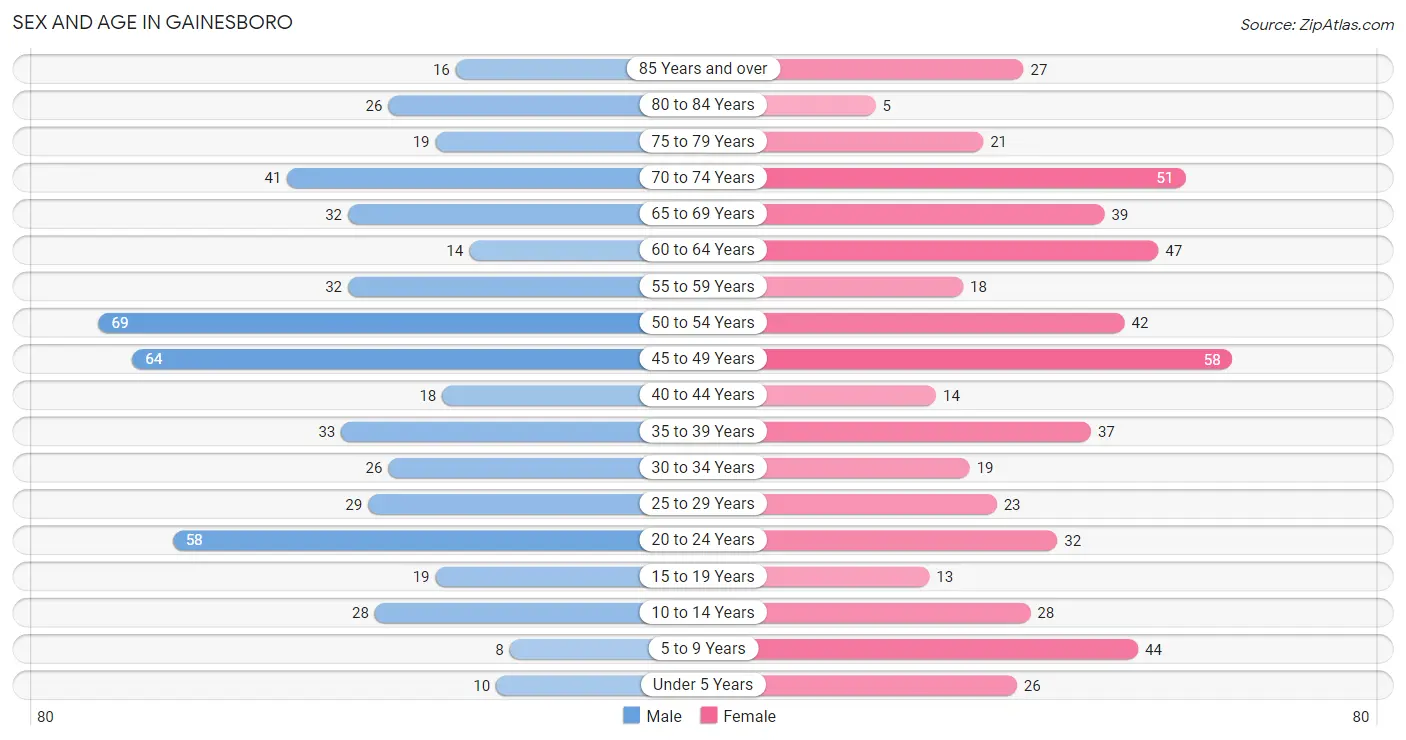
The most populous age groups in Gainesboro are 50 to 54 Years (69 | 12.7%) for men and 45 to 49 Years (58 | 10.7%) for women.
| Age Bracket | Male | Female |
| Under 5 Years | 10 (1.8%) | 26 (4.8%) |
| 5 to 9 Years | 8 (1.5%) | 44 (8.1%) |
| 10 to 14 Years | 28 (5.2%) | 28 (5.1%) |
| 15 to 19 Years | 19 (3.5%) | 13 (2.4%) |
| 20 to 24 Years | 58 (10.7%) | 32 (5.9%) |
| 25 to 29 Years | 29 (5.3%) | 23 (4.2%) |
| 30 to 34 Years | 26 (4.8%) | 19 (3.5%) |
| 35 to 39 Years | 33 (6.1%) | 37 (6.8%) |
| 40 to 44 Years | 18 (3.3%) | 14 (2.6%) |
| 45 to 49 Years | 64 (11.8%) | 58 (10.7%) |
| 50 to 54 Years | 69 (12.7%) | 42 (7.7%) |
| 55 to 59 Years | 32 (5.9%) | 18 (3.3%) |
| 60 to 64 Years | 14 (2.6%) | 47 (8.6%) |
| 65 to 69 Years | 32 (5.9%) | 39 (7.2%) |
| 70 to 74 Years | 41 (7.6%) | 51 (9.4%) |
| 75 to 79 Years | 19 (3.5%) | 21 (3.9%) |
| 80 to 84 Years | 26 (4.8%) | 5 (0.9%) |
| 85 Years and over | 16 (2.9%) | 27 (5.0%) |
| Total | 542 (100.0%) | 544 (100.0%) |
Families and Households in Gainesboro
Median Family Size in Gainesboro
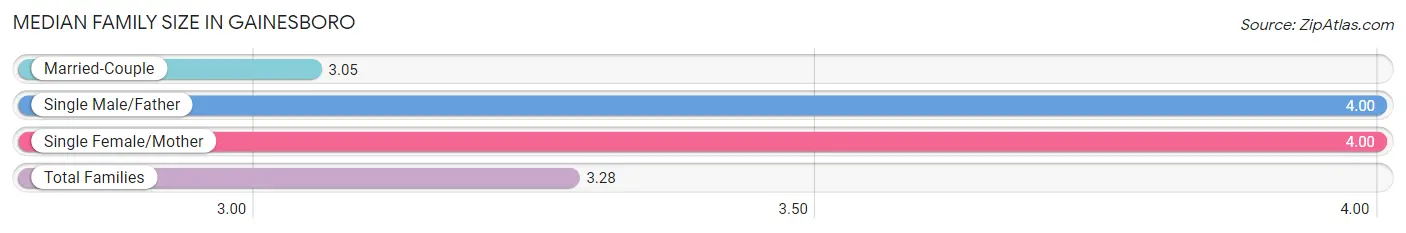
The median family size in Gainesboro is 3.28 persons per family, with single male/father families (7 | 3.0%) accounting for the largest median family size of 4 persons per family. On the other hand, married-couple families (175 | 76.1%) represent the smallest median family size with 3.05 persons per family.
| Family Type | # Families | Family Size |
| Married-Couple | 175 (76.1%) | 3.05 |
| Single Male/Father | 7 (3.0%) | 4.00 |
| Single Female/Mother | 48 (20.9%) | 4.00 |
| Total Families | 230 (100.0%) | 3.28 |
Median Household Size in Gainesboro
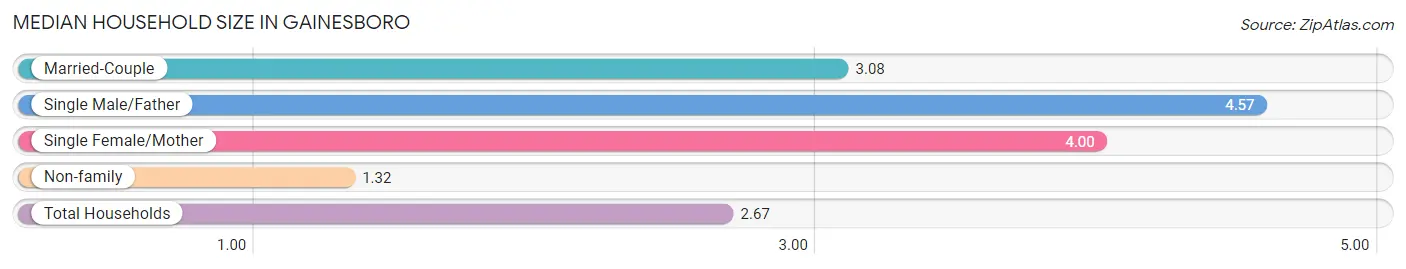
The median household size in Gainesboro is 2.67 persons per household, with single male/father households (7 | 2.1%) accounting for the largest median household size of 4.57 persons per household. non-family households (111 | 32.6%) represent the smallest median household size with 1.32 persons per household.
| Household Type | # Households | Household Size |
| Married-Couple | 175 (51.3%) | 3.08 |
| Single Male/Father | 7 (2.1%) | 4.57 |
| Single Female/Mother | 48 (14.1%) | 4.00 |
| Non-family | 111 (32.6%) | 1.32 |
| Total Households | 341 (100.0%) | 2.67 |
Household Size by Marriage Status in Gainesboro
Out of a total of 341 households in Gainesboro, 230 (67.4%) are family households, while 111 (32.6%) are nonfamily households. The most numerous type of family households are 2-person households, comprising 110, and the most common type of nonfamily households are 1-person households, comprising 98.
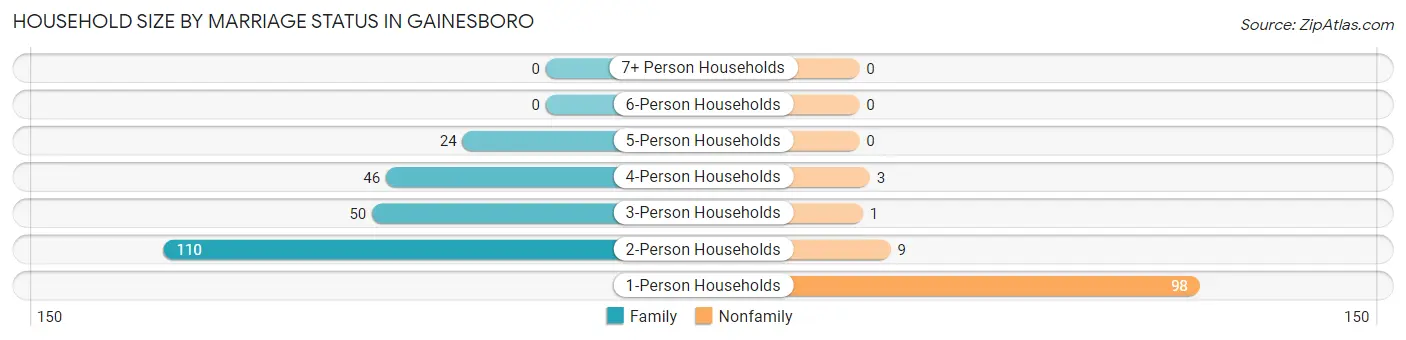
| Household Size | Family Households | Nonfamily Households |
| 1-Person Households | - | 98 (28.7%) |
| 2-Person Households | 110 (32.3%) | 9 (2.6%) |
| 3-Person Households | 50 (14.7%) | 1 (0.3%) |
| 4-Person Households | 46 (13.5%) | 3 (0.9%) |
| 5-Person Households | 24 (7.0%) | 0 (0.0%) |
| 6-Person Households | 0 (0.0%) | 0 (0.0%) |
| 7+ Person Households | 0 (0.0%) | 0 (0.0%) |
| Total | 230 (67.4%) | 111 (32.6%) |
Female Fertility in Gainesboro
Fertility by Age in Gainesboro
Average fertility rate in Gainesboro is 25.0 births per 1,000 women. Women in the age bracket of 20 to 34 years have the highest fertility rate with 68.0 births per 1,000 women. Women in the age bracket of 20 to 34 years acount for 100.0% of all women with births.
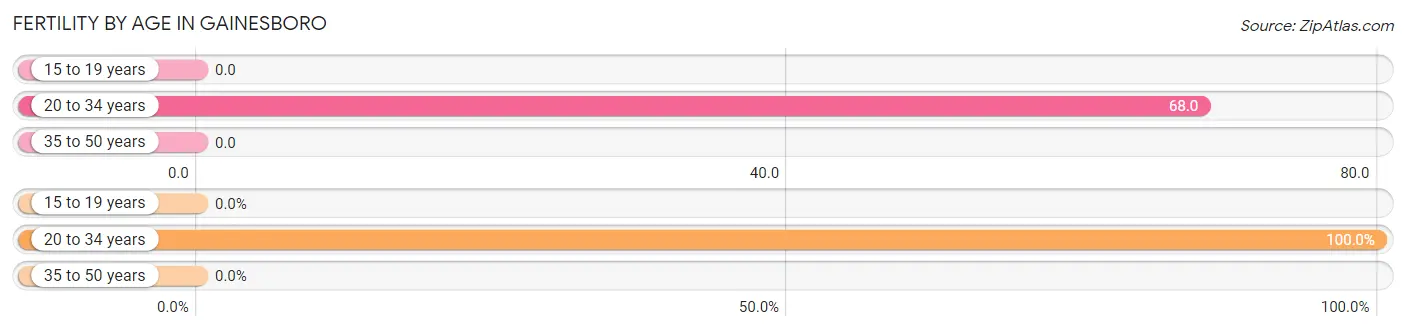
| Age Bracket | Women with Births | Births / 1,000 Women |
| 15 to 19 years | 0 (0.0%) | 0.0 |
| 20 to 34 years | 5 (100.0%) | 68.0 |
| 35 to 50 years | 0 (0.0%) | 0.0 |
| Total | 5 (100.0%) | 25.0 |
Fertility by Age by Marriage Status in Gainesboro
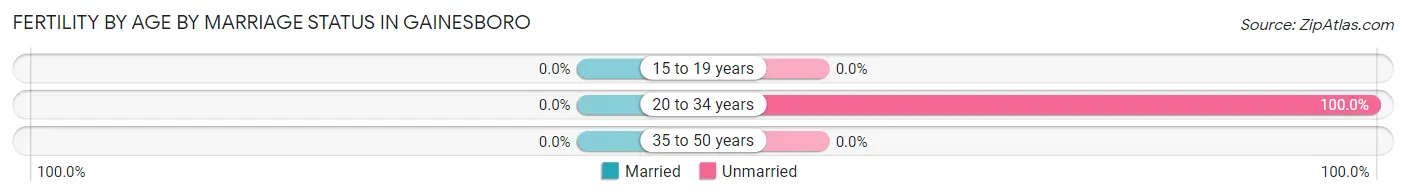
| Age Bracket | Married | Unmarried |
| 15 to 19 years | 0 (0.0%) | 0 (0.0%) |
| 20 to 34 years | 0 (0.0%) | 5 (100.0%) |
| 35 to 50 years | 0 (0.0%) | 0 (0.0%) |
| Total | 0 (0.0%) | 5 (100.0%) |
Fertility by Education in Gainesboro
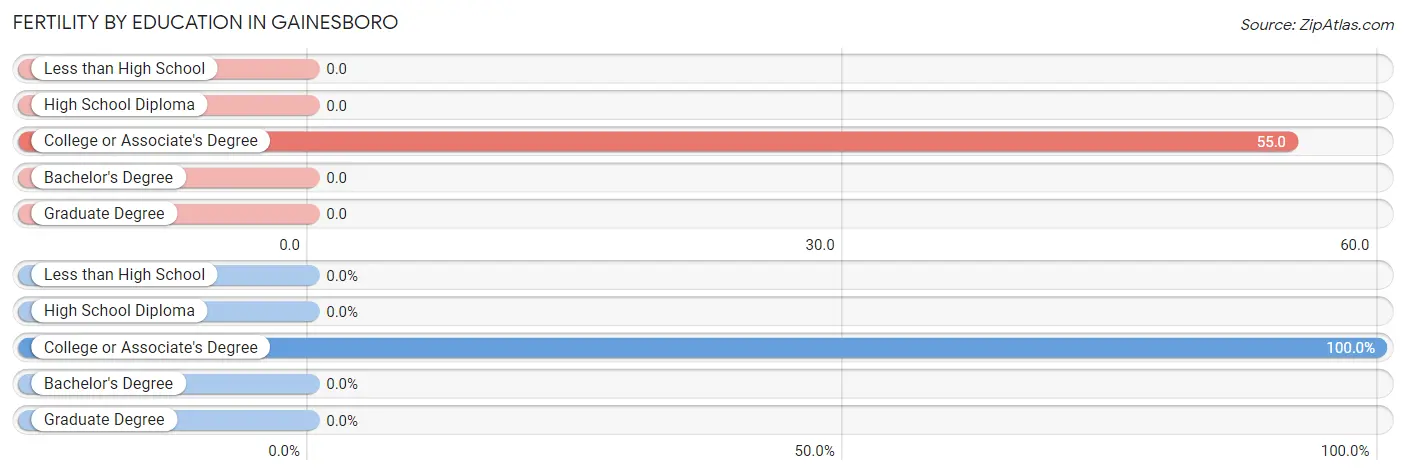
| Educational Attainment | Women with Births | Births / 1,000 Women |
| Less than High School | 0 (0.0%) | 0.0 |
| High School Diploma | 0 (0.0%) | 0.0 |
| College or Associate's Degree | 5 (100.0%) | 55.0 |
| Bachelor's Degree | 0 (0.0%) | 0.0 |
| Graduate Degree | 0 (0.0%) | 0.0 |
| Total | 5 (100.0%) | 25.0 |
Fertility by Education by Marriage Status in Gainesboro
| Educational Attainment | Married | Unmarried |
| Less than High School | 0 (0.0%) | 0 (0.0%) |
| High School Diploma | 0 (0.0%) | 0 (0.0%) |
| College or Associate's Degree | 0 (0.0%) | 5 (100.0%) |
| Bachelor's Degree | 0 (0.0%) | 0 (0.0%) |
| Graduate Degree | 0 (0.0%) | 0 (0.0%) |
| Total | 0 (0.0%) | 5 (100.0%) |
Employment Characteristics in Gainesboro
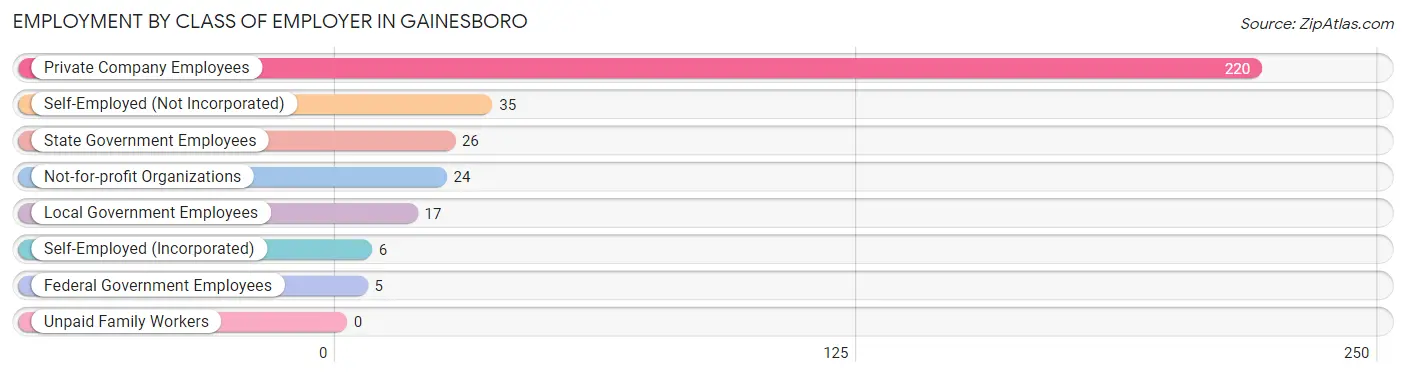
Employment by Class of Employer in Gainesboro
Among the 333 employed individuals in Gainesboro, private company employees (220 | 66.1%), self-employed (not incorporated) (35 | 10.5%), and state government employees (26 | 7.8%) make up the most common classes of employment.
| Employer Class | # Employees | % Employees |
| Private Company Employees | 220 | 66.1% |
| Self-Employed (Incorporated) | 6 | 1.8% |
| Self-Employed (Not Incorporated) | 35 | 10.5% |
| Not-for-profit Organizations | 24 | 7.2% |
| Local Government Employees | 17 | 5.1% |
| State Government Employees | 26 | 7.8% |
| Federal Government Employees | 5 | 1.5% |
| Unpaid Family Workers | 0 | 0.0% |
| Total | 333 | 100.0% |
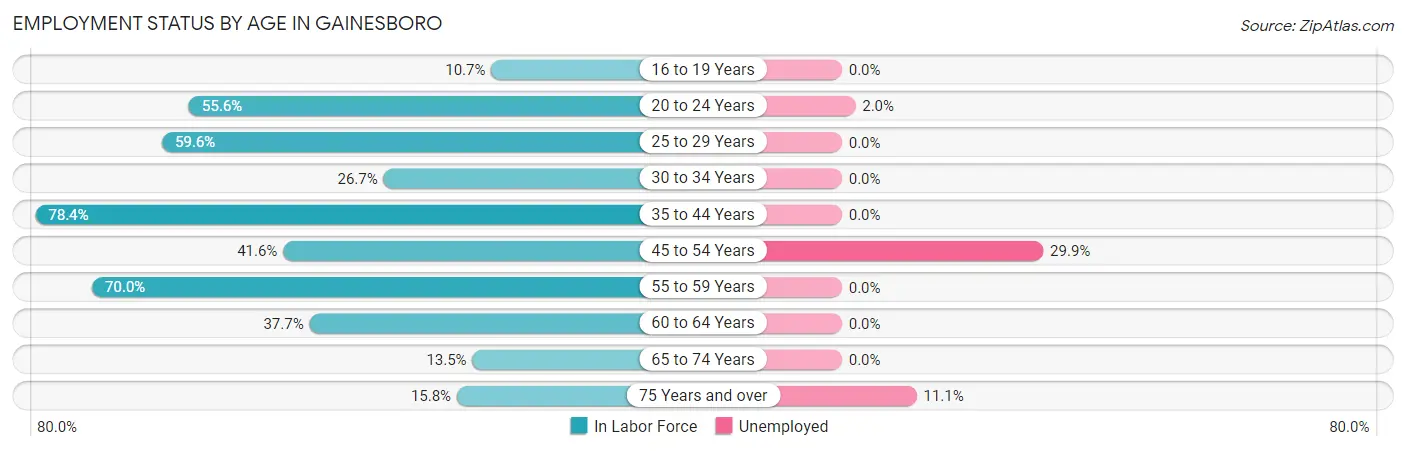
Employment Status by Age in Gainesboro
According to the labor force statistics for Gainesboro, out of the total population over 16 years of age (938), 39.6% or 371 individuals are in the labor force, with 8.6% or 32 of them unemployed. The age group with the highest labor force participation rate is 35 to 44 years, with 78.4% or 80 individuals in the labor force. Within the labor force, the 45 to 54 years age range has the highest percentage of unemployed individuals, with 29.9% or 29 of them being unemployed.
| Age Bracket | In Labor Force | Unemployed |
| 16 to 19 Years | 3 (10.7%) | 0 (0.0%) |
| 20 to 24 Years | 50 (55.6%) | 1 (2.0%) |
| 25 to 29 Years | 31 (59.6%) | 0 (0.0%) |
| 30 to 34 Years | 12 (26.7%) | 0 (0.0%) |
| 35 to 44 Years | 80 (78.4%) | 0 (0.0%) |
| 45 to 54 Years | 97 (41.6%) | 29 (29.9%) |
| 55 to 59 Years | 35 (70.0%) | 0 (0.0%) |
| 60 to 64 Years | 23 (37.7%) | 0 (0.0%) |
| 65 to 74 Years | 22 (13.5%) | 0 (0.0%) |
| 75 Years and over | 18 (15.8%) | 2 (11.1%) |
| Total | 371 (39.6%) | 32 (8.6%) |
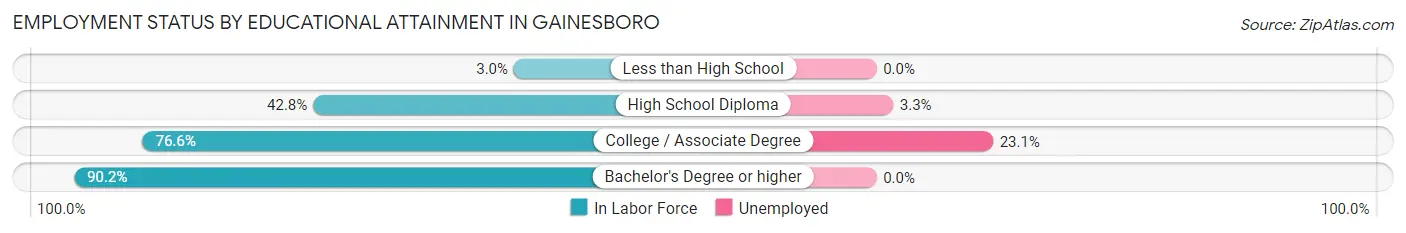
Employment Status by Educational Attainment in Gainesboro
According to labor force statistics for Gainesboro, 51.2% of individuals (278) out of the total population between 25 and 64 years of age (543) are in the labor force, with 10.4% or 29 of them being unemployed. The group with the highest labor force participation rate are those with the educational attainment of bachelor's degree or higher, with 90.2% or 46 individuals in the labor force. Within the labor force, individuals with college / associate degree education have the highest percentage of unemployment, with 23.1% or 25 of them being unemployed.
| Educational Attainment | In Labor Force | Unemployed |
| Less than High School | 2 (3.0%) | 0 (0.0%) |
| High School Diploma | 122 (42.8%) | 9 (3.3%) |
| College / Associate Degree | 108 (76.6%) | 33 (23.1%) |
| Bachelor's Degree or higher | 46 (90.2%) | 0 (0.0%) |
| Total | 278 (51.2%) | 56 (10.4%) |
Employment Occupations by Sex in Gainesboro
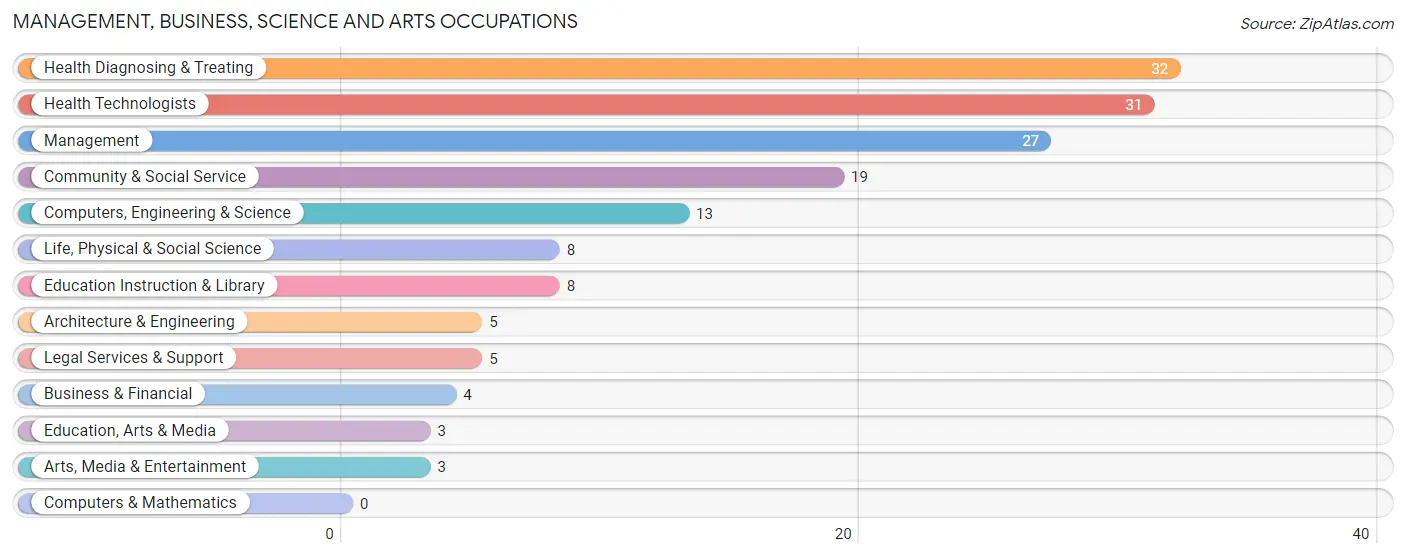
Management, Business, Science and Arts Occupations
The most common Management, Business, Science and Arts occupations in Gainesboro are Health Diagnosing & Treating (32 | 9.4%), Health Technologists (31 | 9.1%), Management (27 | 8.0%), Community & Social Service (19 | 5.6%), and Computers, Engineering & Science (13 | 3.8%).
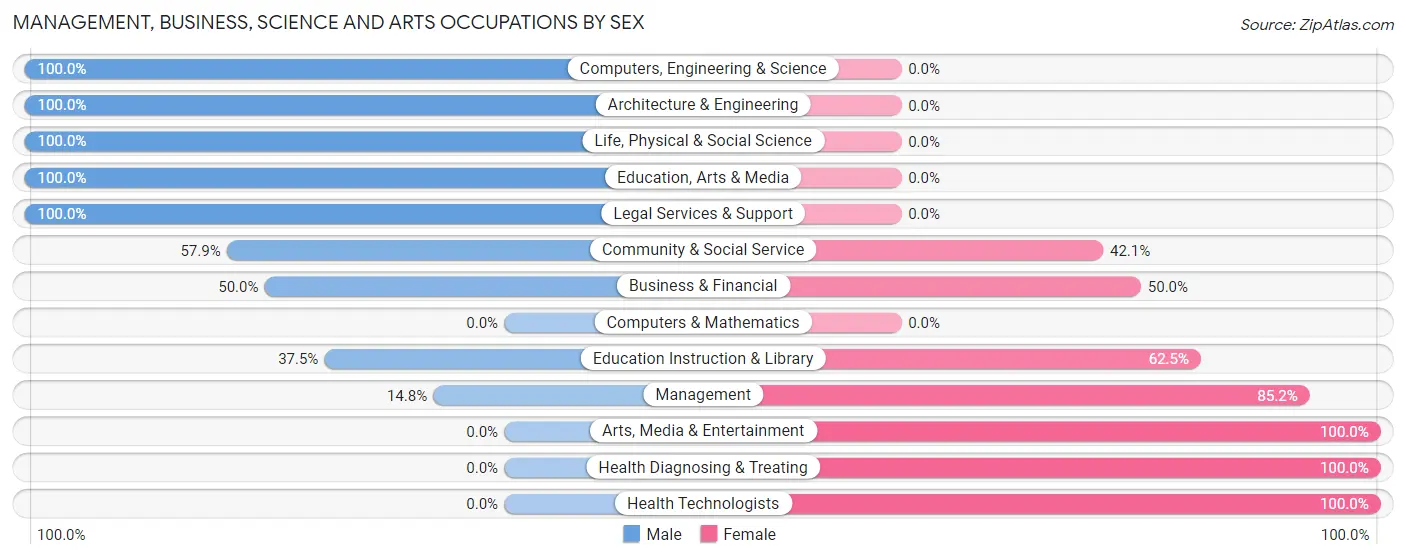
Management, Business, Science and Arts Occupations by Sex
Within the Management, Business, Science and Arts occupations in Gainesboro, the most male-oriented occupations are Computers, Engineering & Science (100.0%), Architecture & Engineering (100.0%), and Life, Physical & Social Science (100.0%), while the most female-oriented occupations are Arts, Media & Entertainment (100.0%), Health Diagnosing & Treating (100.0%), and Health Technologists (100.0%).
| Occupation | Male | Female |
| Management | 4 (14.8%) | 23 (85.2%) |
| Business & Financial | 2 (50.0%) | 2 (50.0%) |
| Computers, Engineering & Science | 13 (100.0%) | 0 (0.0%) |
| Computers & Mathematics | 0 (0.0%) | 0 (0.0%) |
| Architecture & Engineering | 5 (100.0%) | 0 (0.0%) |
| Life, Physical & Social Science | 8 (100.0%) | 0 (0.0%) |
| Community & Social Service | 11 (57.9%) | 8 (42.1%) |
| Education, Arts & Media | 3 (100.0%) | 0 (0.0%) |
| Legal Services & Support | 5 (100.0%) | 0 (0.0%) |
| Education Instruction & Library | 3 (37.5%) | 5 (62.5%) |
| Arts, Media & Entertainment | 0 (0.0%) | 3 (100.0%) |
| Health Diagnosing & Treating | 0 (0.0%) | 32 (100.0%) |
| Health Technologists | 0 (0.0%) | 31 (100.0%) |
| Total (Category) | 30 (31.6%) | 65 (68.4%) |
| Total (Overall) | 174 (51.3%) | 165 (48.7%) |
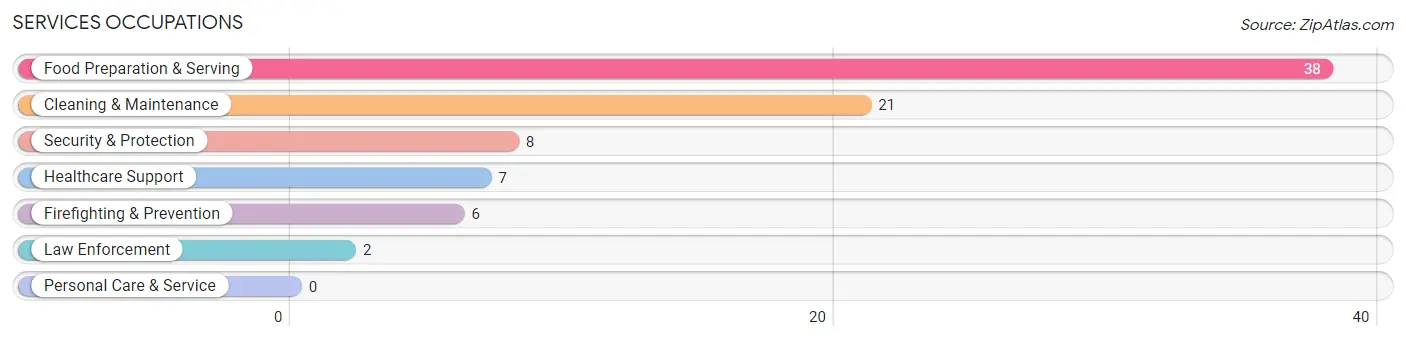
Services Occupations
The most common Services occupations in Gainesboro are Food Preparation & Serving (38 | 11.2%), Cleaning & Maintenance (21 | 6.2%), Security & Protection (8 | 2.4%), Healthcare Support (7 | 2.1%), and Firefighting & Prevention (6 | 1.8%).
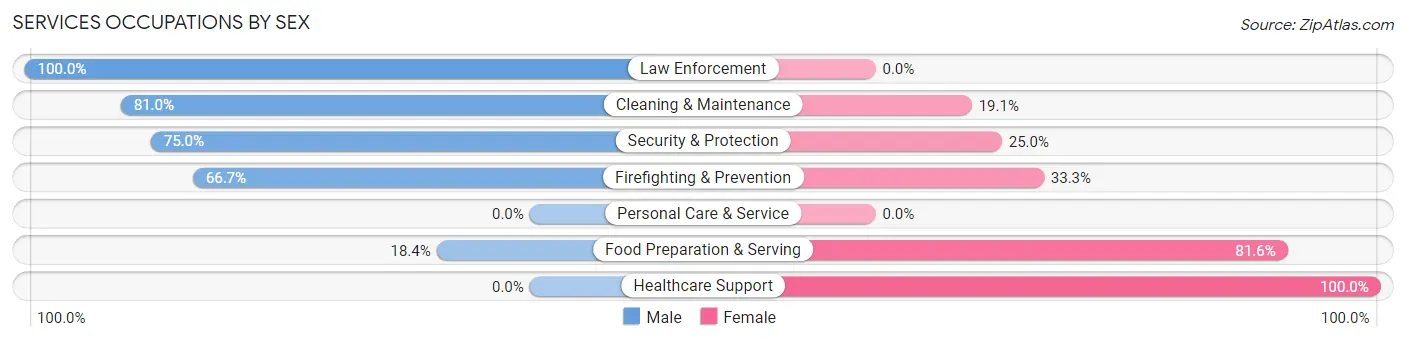
Services Occupations by Sex
Within the Services occupations in Gainesboro, the most male-oriented occupations are Law Enforcement (100.0%), Cleaning & Maintenance (80.9%), and Security & Protection (75.0%), while the most female-oriented occupations are Healthcare Support (100.0%), Food Preparation & Serving (81.6%), and Firefighting & Prevention (33.3%).
| Occupation | Male | Female |
| Healthcare Support | 0 (0.0%) | 7 (100.0%) |
| Security & Protection | 6 (75.0%) | 2 (25.0%) |
| Firefighting & Prevention | 4 (66.7%) | 2 (33.3%) |
| Law Enforcement | 2 (100.0%) | 0 (0.0%) |
| Food Preparation & Serving | 7 (18.4%) | 31 (81.6%) |
| Cleaning & Maintenance | 17 (80.9%) | 4 (19.1%) |
| Personal Care & Service | 0 (0.0%) | 0 (0.0%) |
| Total (Category) | 30 (40.5%) | 44 (59.5%) |
| Total (Overall) | 174 (51.3%) | 165 (48.7%) |
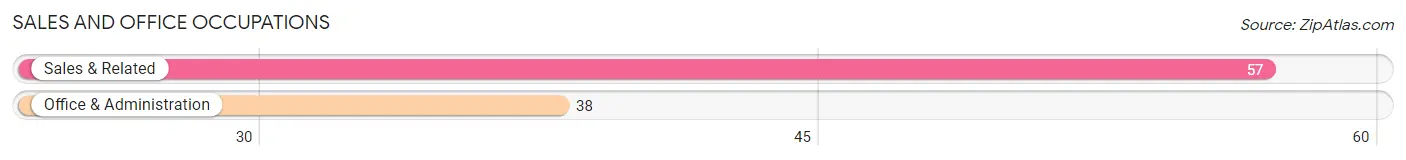
Sales and Office Occupations
The most common Sales and Office occupations in Gainesboro are Sales & Related (57 | 16.8%), and Office & Administration (38 | 11.2%).
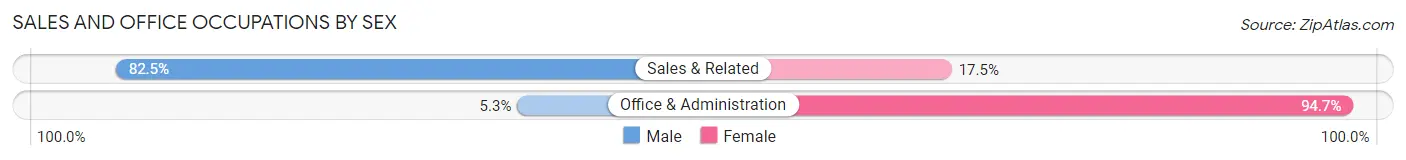
Sales and Office Occupations by Sex
| Occupation | Male | Female |
| Sales & Related | 47 (82.5%) | 10 (17.5%) |
| Office & Administration | 2 (5.3%) | 36 (94.7%) |
| Total (Category) | 49 (51.6%) | 46 (48.4%) |
| Total (Overall) | 174 (51.3%) | 165 (48.7%) |
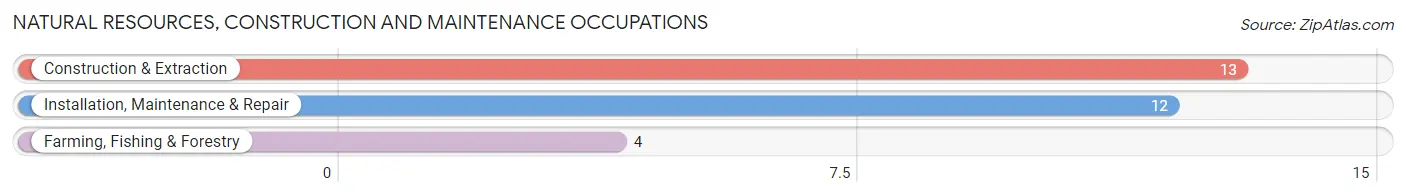
Natural Resources, Construction and Maintenance Occupations
The most common Natural Resources, Construction and Maintenance occupations in Gainesboro are Construction & Extraction (13 | 3.8%), Installation, Maintenance & Repair (12 | 3.5%), and Farming, Fishing & Forestry (4 | 1.2%).
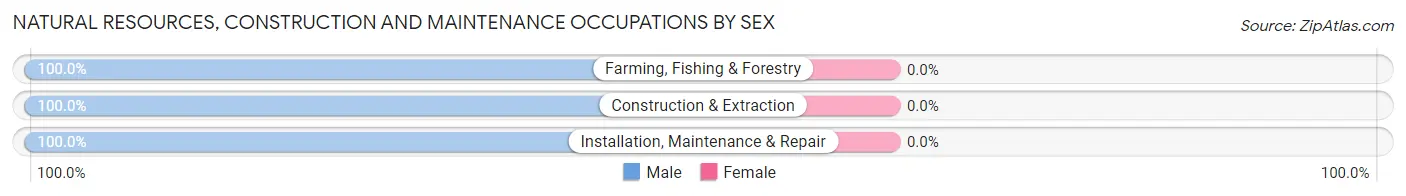
Natural Resources, Construction and Maintenance Occupations by Sex
| Occupation | Male | Female |
| Farming, Fishing & Forestry | 4 (100.0%) | 0 (0.0%) |
| Construction & Extraction | 13 (100.0%) | 0 (0.0%) |
| Installation, Maintenance & Repair | 12 (100.0%) | 0 (0.0%) |
| Total (Category) | 29 (100.0%) | 0 (0.0%) |
| Total (Overall) | 174 (51.3%) | 165 (48.7%) |
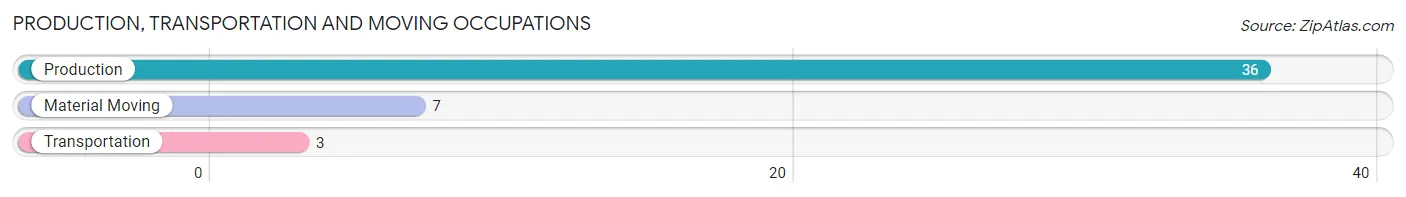
Production, Transportation and Moving Occupations
The most common Production, Transportation and Moving occupations in Gainesboro are Production (36 | 10.6%), Material Moving (7 | 2.1%), and Transportation (3 | 0.9%).
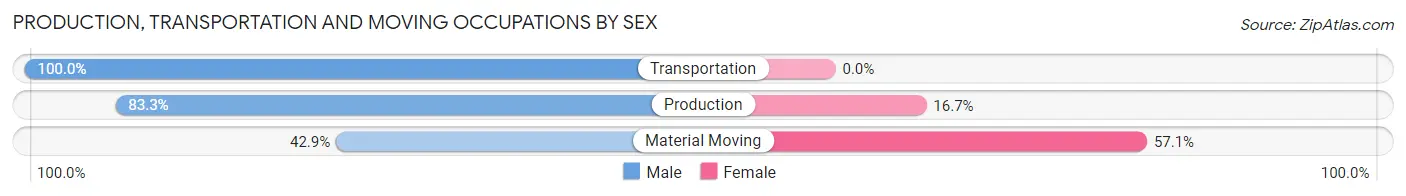
Production, Transportation and Moving Occupations by Sex
| Occupation | Male | Female |
| Production | 30 (83.3%) | 6 (16.7%) |
| Transportation | 3 (100.0%) | 0 (0.0%) |
| Material Moving | 3 (42.9%) | 4 (57.1%) |
| Total (Category) | 36 (78.3%) | 10 (21.7%) |
| Total (Overall) | 174 (51.3%) | 165 (48.7%) |
Employment Industries by Sex in Gainesboro
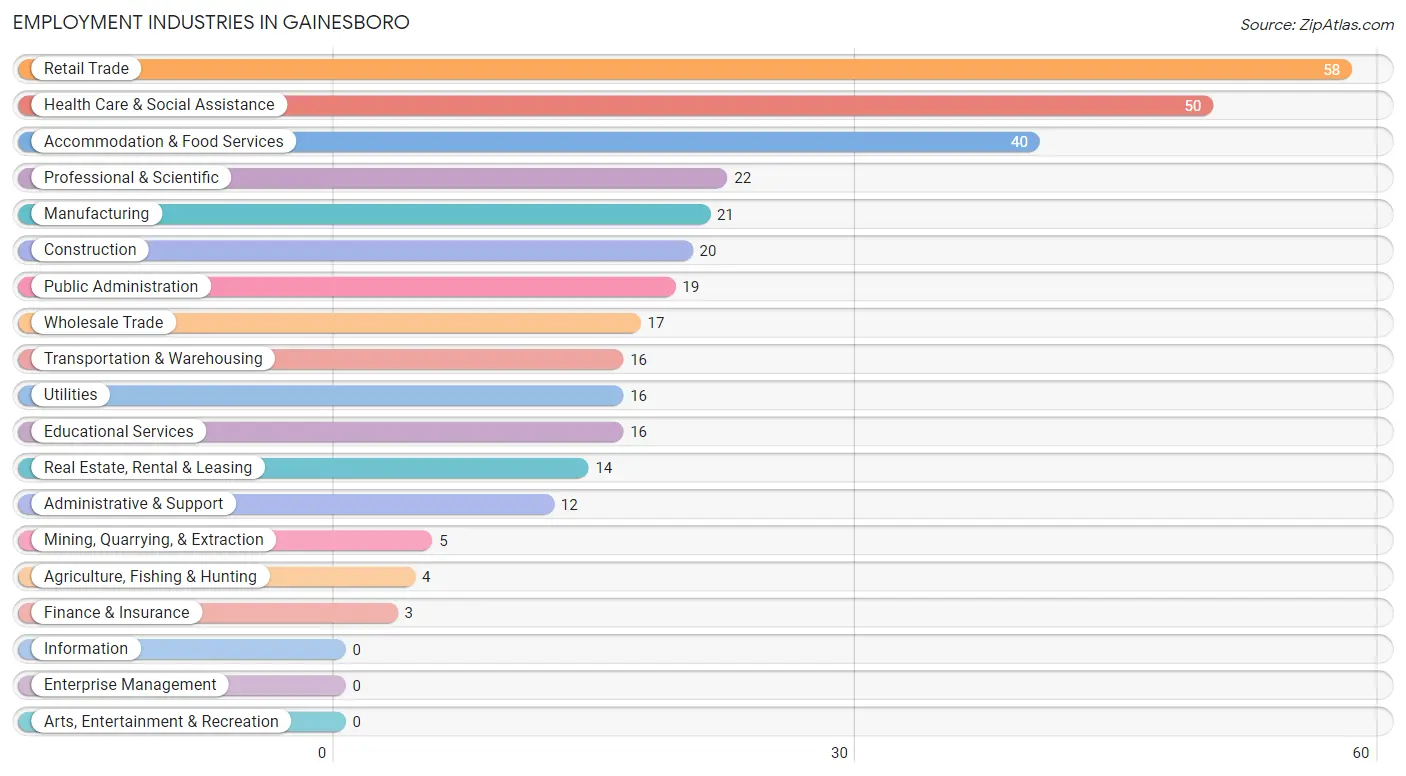
Employment Industries in Gainesboro
The major employment industries in Gainesboro include Retail Trade (58 | 17.1%), Health Care & Social Assistance (50 | 14.7%), Accommodation & Food Services (40 | 11.8%), Professional & Scientific (22 | 6.5%), and Manufacturing (21 | 6.2%).
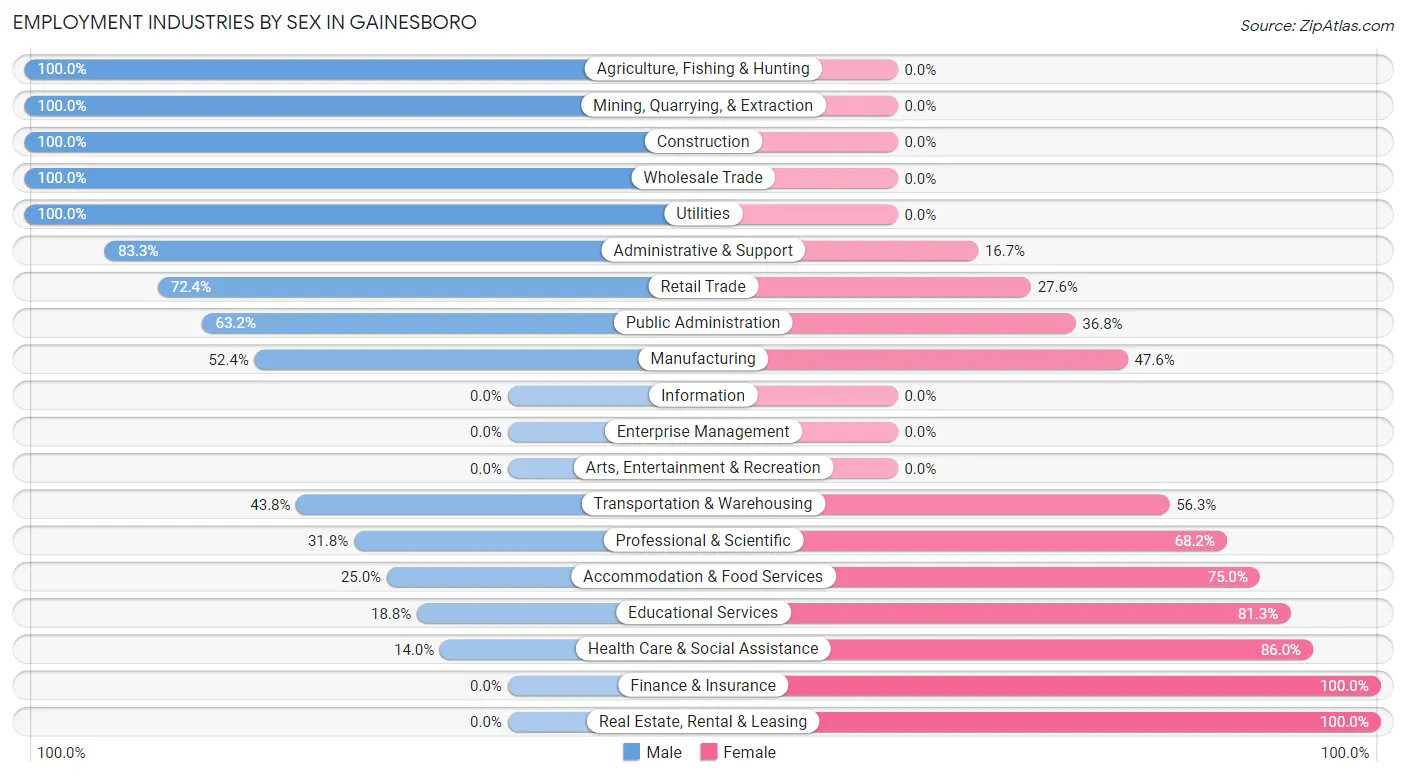
Employment Industries by Sex in Gainesboro
The Gainesboro industries that see more men than women are Agriculture, Fishing & Hunting (100.0%), Mining, Quarrying, & Extraction (100.0%), and Construction (100.0%), whereas the industries that tend to have a higher number of women are Finance & Insurance (100.0%), Real Estate, Rental & Leasing (100.0%), and Health Care & Social Assistance (86.0%).
| Industry | Male | Female |
| Agriculture, Fishing & Hunting | 4 (100.0%) | 0 (0.0%) |
| Mining, Quarrying, & Extraction | 5 (100.0%) | 0 (0.0%) |
| Construction | 20 (100.0%) | 0 (0.0%) |
| Manufacturing | 11 (52.4%) | 10 (47.6%) |
| Wholesale Trade | 17 (100.0%) | 0 (0.0%) |
| Retail Trade | 42 (72.4%) | 16 (27.6%) |
| Transportation & Warehousing | 7 (43.8%) | 9 (56.2%) |
| Utilities | 16 (100.0%) | 0 (0.0%) |
| Information | 0 (0.0%) | 0 (0.0%) |
| Finance & Insurance | 0 (0.0%) | 3 (100.0%) |
| Real Estate, Rental & Leasing | 0 (0.0%) | 14 (100.0%) |
| Professional & Scientific | 7 (31.8%) | 15 (68.2%) |
| Enterprise Management | 0 (0.0%) | 0 (0.0%) |
| Administrative & Support | 10 (83.3%) | 2 (16.7%) |
| Educational Services | 3 (18.8%) | 13 (81.2%) |
| Health Care & Social Assistance | 7 (14.0%) | 43 (86.0%) |
| Arts, Entertainment & Recreation | 0 (0.0%) | 0 (0.0%) |
| Accommodation & Food Services | 10 (25.0%) | 30 (75.0%) |
| Public Administration | 12 (63.2%) | 7 (36.8%) |
| Total | 174 (51.3%) | 165 (48.7%) |
Education in Gainesboro
School Enrollment in Gainesboro
The most common levels of schooling among the 166 students in Gainesboro are middle school (44 | 26.5%), high school (36 | 21.7%), and elementary school (30 | 18.1%).
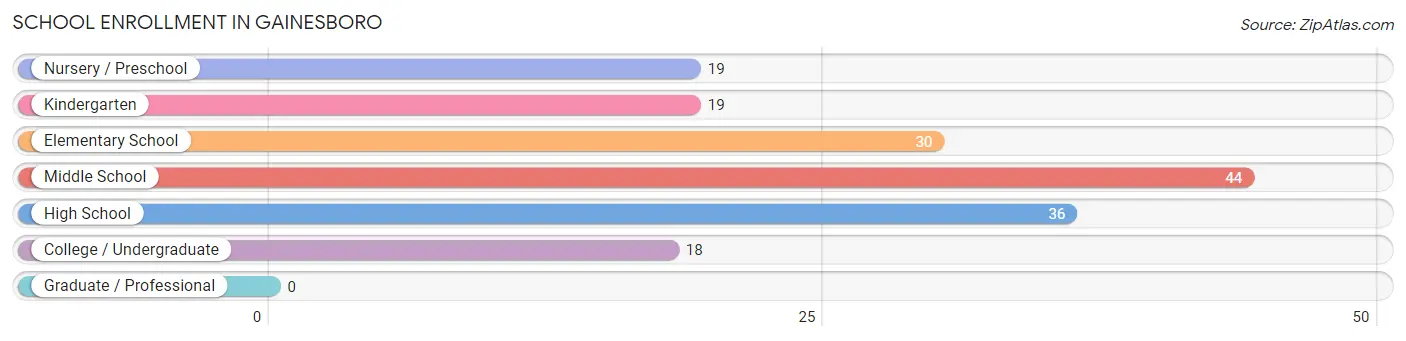
| School Level | # Students | % Students |
| Nursery / Preschool | 19 | 11.5% |
| Kindergarten | 19 | 11.5% |
| Elementary School | 30 | 18.1% |
| Middle School | 44 | 26.5% |
| High School | 36 | 21.7% |
| College / Undergraduate | 18 | 10.8% |
| Graduate / Professional | 0 | 0.0% |
| Total | 166 | 100.0% |
School Enrollment by Age by Funding Source in Gainesboro
Out of a total of 166 students who are enrolled in schools in Gainesboro, 10 (6.0%) attend a private institution, while the remaining 156 (94.0%) are enrolled in public schools. The age group of 20 to 24 year olds has the highest likelihood of being enrolled in private schools, with 10 (40.0% in the age bracket) enrolled. Conversely, the age group of 3 to 4 year olds has the lowest likelihood of being enrolled in a private school, with 17 (100.0% in the age bracket) attending a public institution.
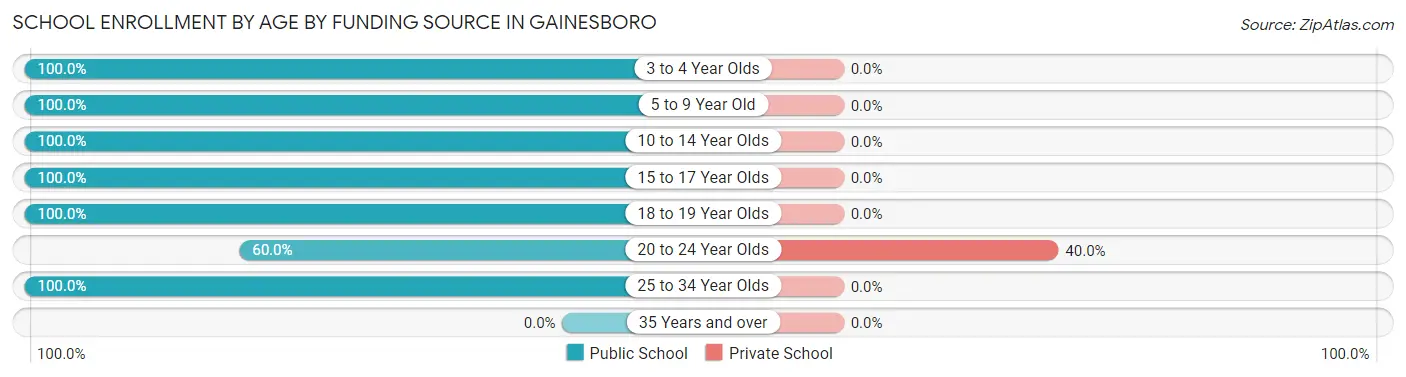
| Age Bracket | Public School | Private School |
| 3 to 4 Year Olds | 17 (100.0%) | 0 (0.0%) |
| 5 to 9 Year Old | 49 (100.0%) | 0 (0.0%) |
| 10 to 14 Year Olds | 56 (100.0%) | 0 (0.0%) |
| 15 to 17 Year Olds | 6 (100.0%) | 0 (0.0%) |
| 18 to 19 Year Olds | 5 (100.0%) | 0 (0.0%) |
| 20 to 24 Year Olds | 15 (60.0%) | 10 (40.0%) |
| 25 to 34 Year Olds | 8 (100.0%) | 0 (0.0%) |
| 35 Years and over | 0 (0.0%) | 0 (0.0%) |
| Total | 156 (94.0%) | 10 (6.0%) |
Educational Attainment by Field of Study in Gainesboro
Bio, nature & agricultural (28 | 25.2%), education (20 | 18.0%), business (19 | 17.1%), literature & languages (13 | 11.7%), and social sciences (10 | 9.0%) are the most common fields of study among 111 individuals in Gainesboro who have obtained a bachelor's degree or higher.
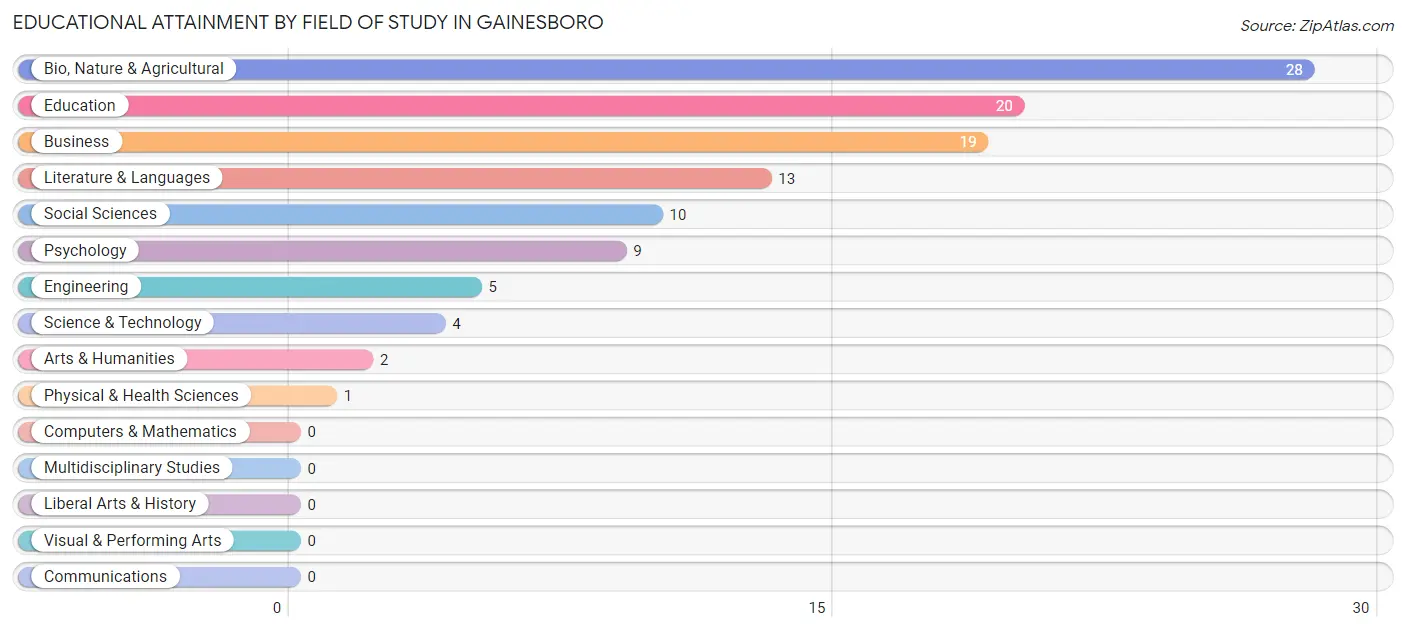
| Field of Study | # Graduates | % Graduates |
| Computers & Mathematics | 0 | 0.0% |
| Bio, Nature & Agricultural | 28 | 25.2% |
| Physical & Health Sciences | 1 | 0.9% |
| Psychology | 9 | 8.1% |
| Social Sciences | 10 | 9.0% |
| Engineering | 5 | 4.5% |
| Multidisciplinary Studies | 0 | 0.0% |
| Science & Technology | 4 | 3.6% |
| Business | 19 | 17.1% |
| Education | 20 | 18.0% |
| Literature & Languages | 13 | 11.7% |
| Liberal Arts & History | 0 | 0.0% |
| Visual & Performing Arts | 0 | 0.0% |
| Communications | 0 | 0.0% |
| Arts & Humanities | 2 | 1.8% |
| Total | 111 | 100.0% |
Transportation & Commute in Gainesboro
Vehicle Availability by Sex in Gainesboro
The most prevalent vehicle ownership categories in Gainesboro are males with 2 vehicles (71, accounting for 40.8%) and females with 2 vehicles (61, making up 44.7%).
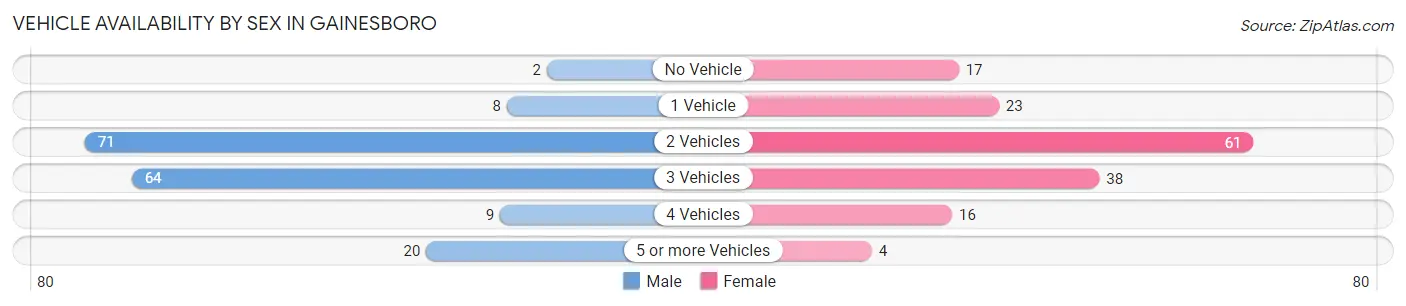
| Vehicles Available | Male | Female |
| No Vehicle | 2 (1.1%) | 17 (10.7%) |
| 1 Vehicle | 8 (4.6%) | 23 (14.5%) |
| 2 Vehicles | 71 (40.8%) | 61 (38.4%) |
| 3 Vehicles | 64 (36.8%) | 38 (23.9%) |
| 4 Vehicles | 9 (5.2%) | 16 (10.1%) |
| 5 or more Vehicles | 20 (11.5%) | 4 (2.5%) |
| Total | 174 (100.0%) | 159 (100.0%) |
Commute Time in Gainesboro
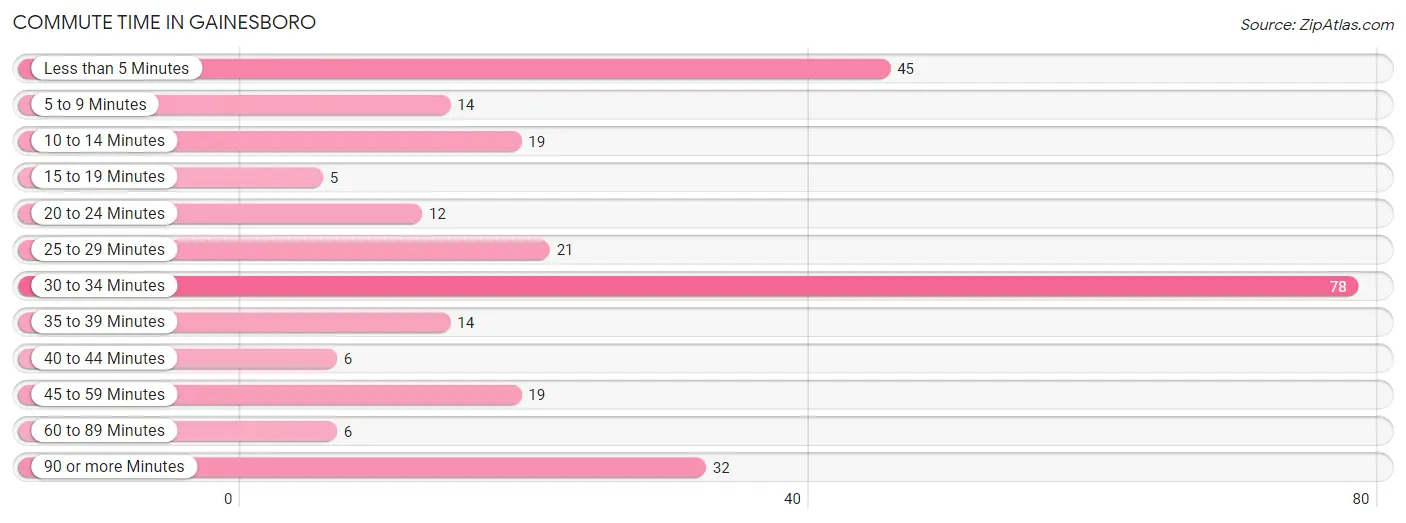
The most frequently occuring commute durations in Gainesboro are 30 to 34 minutes (78 commuters, 28.8%), less than 5 minutes (45 commuters, 16.6%), and 90 or more minutes (32 commuters, 11.8%).
| Commute Time | # Commuters | % Commuters |
| Less than 5 Minutes | 45 | 16.6% |
| 5 to 9 Minutes | 14 | 5.2% |
| 10 to 14 Minutes | 19 | 7.0% |
| 15 to 19 Minutes | 5 | 1.8% |
| 20 to 24 Minutes | 12 | 4.4% |
| 25 to 29 Minutes | 21 | 7.7% |
| 30 to 34 Minutes | 78 | 28.8% |
| 35 to 39 Minutes | 14 | 5.2% |
| 40 to 44 Minutes | 6 | 2.2% |
| 45 to 59 Minutes | 19 | 7.0% |
| 60 to 89 Minutes | 6 | 2.2% |
| 90 or more Minutes | 32 | 11.8% |
Commute Time by Sex in Gainesboro
The most common commute times in Gainesboro are 30 to 34 minutes (44 commuters, 33.3%) for males and 30 to 34 minutes (34 commuters, 24.5%) for females.
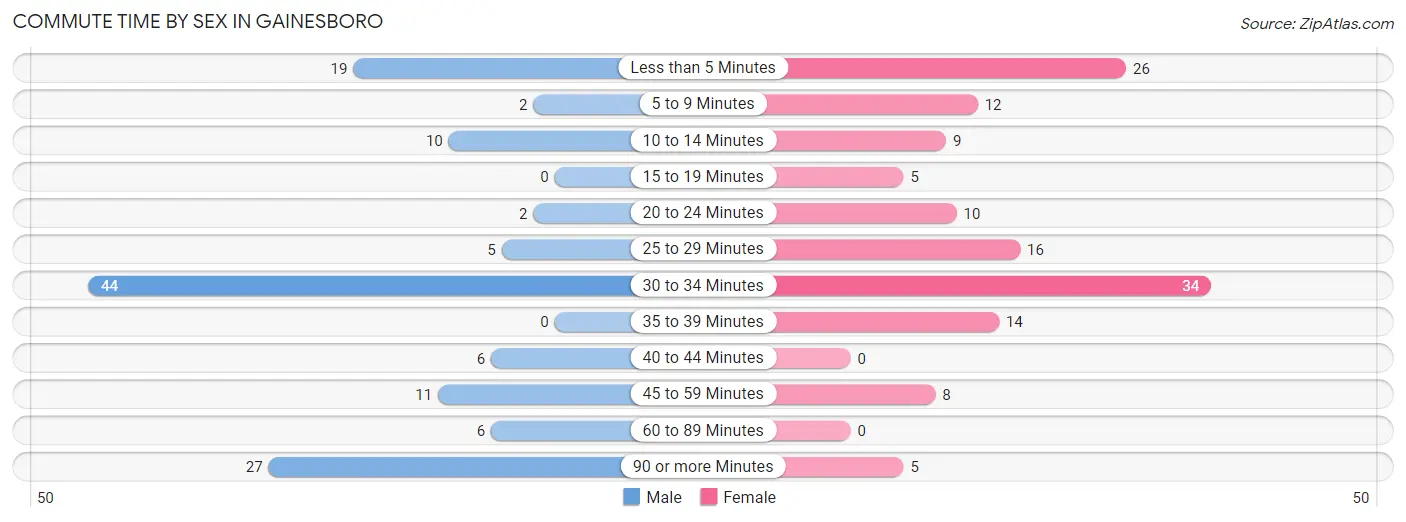
| Commute Time | Male | Female |
| Less than 5 Minutes | 19 (14.4%) | 26 (18.7%) |
| 5 to 9 Minutes | 2 (1.5%) | 12 (8.6%) |
| 10 to 14 Minutes | 10 (7.6%) | 9 (6.5%) |
| 15 to 19 Minutes | 0 (0.0%) | 5 (3.6%) |
| 20 to 24 Minutes | 2 (1.5%) | 10 (7.2%) |
| 25 to 29 Minutes | 5 (3.8%) | 16 (11.5%) |
| 30 to 34 Minutes | 44 (33.3%) | 34 (24.5%) |
| 35 to 39 Minutes | 0 (0.0%) | 14 (10.1%) |
| 40 to 44 Minutes | 6 (4.5%) | 0 (0.0%) |
| 45 to 59 Minutes | 11 (8.3%) | 8 (5.8%) |
| 60 to 89 Minutes | 6 (4.5%) | 0 (0.0%) |
| 90 or more Minutes | 27 (20.4%) | 5 (3.6%) |
Time of Departure to Work by Sex in Gainesboro
The most frequent times of departure to work in Gainesboro are 12:00 AM to 4:59 AM (40, 30.3%) for males and 12:00 PM to 3:59 PM (31, 22.3%) for females.
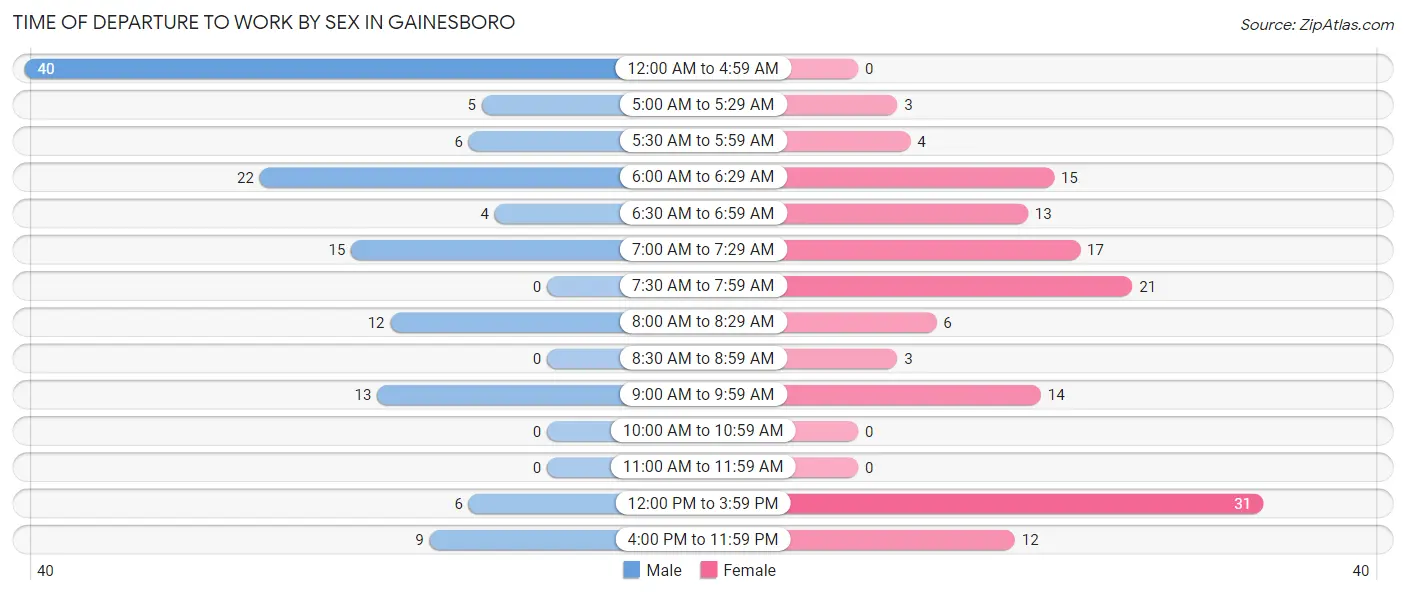
| Time of Departure | Male | Female |
| 12:00 AM to 4:59 AM | 40 (30.3%) | 0 (0.0%) |
| 5:00 AM to 5:29 AM | 5 (3.8%) | 3 (2.2%) |
| 5:30 AM to 5:59 AM | 6 (4.5%) | 4 (2.9%) |
| 6:00 AM to 6:29 AM | 22 (16.7%) | 15 (10.8%) |
| 6:30 AM to 6:59 AM | 4 (3.0%) | 13 (9.3%) |
| 7:00 AM to 7:29 AM | 15 (11.4%) | 17 (12.2%) |
| 7:30 AM to 7:59 AM | 0 (0.0%) | 21 (15.1%) |
| 8:00 AM to 8:29 AM | 12 (9.1%) | 6 (4.3%) |
| 8:30 AM to 8:59 AM | 0 (0.0%) | 3 (2.2%) |
| 9:00 AM to 9:59 AM | 13 (9.9%) | 14 (10.1%) |
| 10:00 AM to 10:59 AM | 0 (0.0%) | 0 (0.0%) |
| 11:00 AM to 11:59 AM | 0 (0.0%) | 0 (0.0%) |
| 12:00 PM to 3:59 PM | 6 (4.5%) | 31 (22.3%) |
| 4:00 PM to 11:59 PM | 9 (6.8%) | 12 (8.6%) |
| Total | 132 (100.0%) | 139 (100.0%) |
Housing Occupancy in Gainesboro
Occupancy by Ownership in Gainesboro
Of the total 341 dwellings in Gainesboro, owner-occupied units account for 228 (66.9%), while renter-occupied units make up 113 (33.1%).
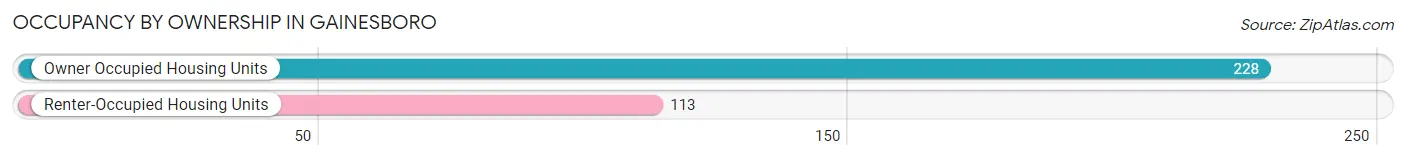
| Occupancy | # Housing Units | % Housing Units |
| Owner Occupied Housing Units | 228 | 66.9% |
| Renter-Occupied Housing Units | 113 | 33.1% |
| Total Occupied Housing Units | 341 | 100.0% |
Occupancy by Household Size in Gainesboro
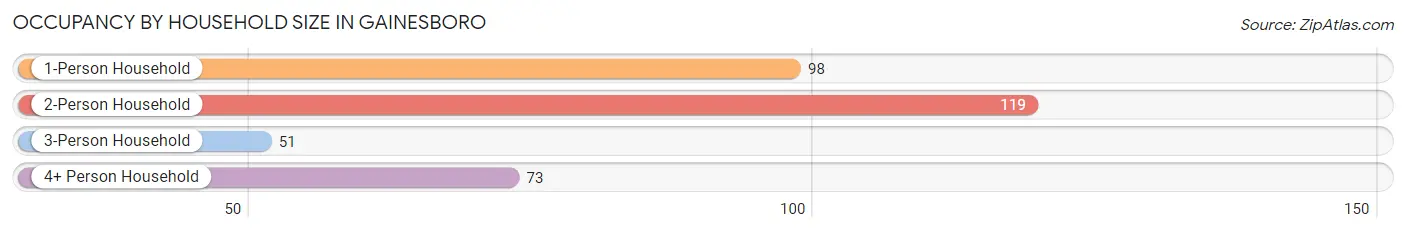
| Household Size | # Housing Units | % Housing Units |
| 1-Person Household | 98 | 28.7% |
| 2-Person Household | 119 | 34.9% |
| 3-Person Household | 51 | 15.0% |
| 4+ Person Household | 73 | 21.4% |
| Total Housing Units | 341 | 100.0% |
Occupancy by Ownership by Household Size in Gainesboro
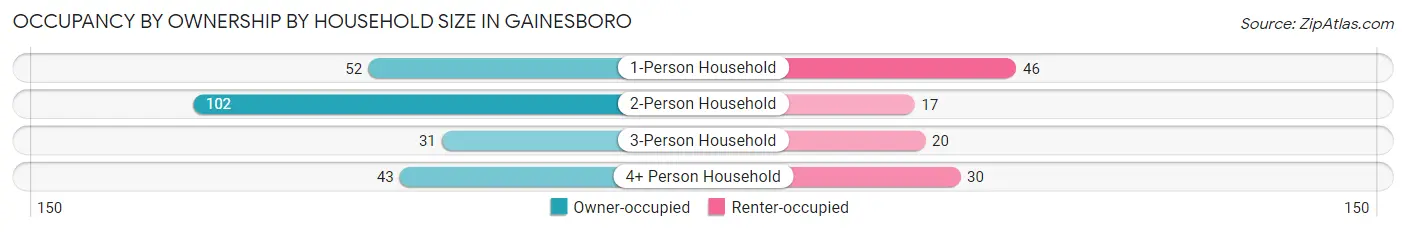
| Household Size | Owner-occupied | Renter-occupied |
| 1-Person Household | 52 (53.1%) | 46 (46.9%) |
| 2-Person Household | 102 (85.7%) | 17 (14.3%) |
| 3-Person Household | 31 (60.8%) | 20 (39.2%) |
| 4+ Person Household | 43 (58.9%) | 30 (41.1%) |
| Total Housing Units | 228 (66.9%) | 113 (33.1%) |
Occupancy by Educational Attainment in Gainesboro
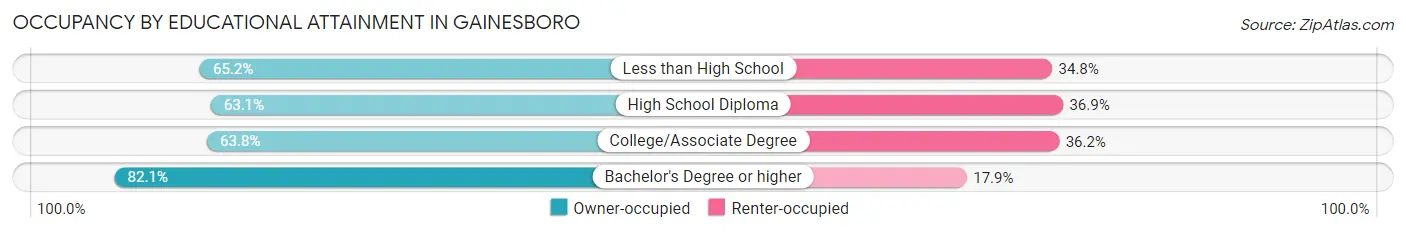
| Household Size | Owner-occupied | Renter-occupied |
| Less than High School | 45 (65.2%) | 24 (34.8%) |
| High School Diploma | 70 (63.1%) | 41 (36.9%) |
| College/Associate Degree | 67 (63.8%) | 38 (36.2%) |
| Bachelor's Degree or higher | 46 (82.1%) | 10 (17.9%) |
Occupancy by Age of Householder in Gainesboro
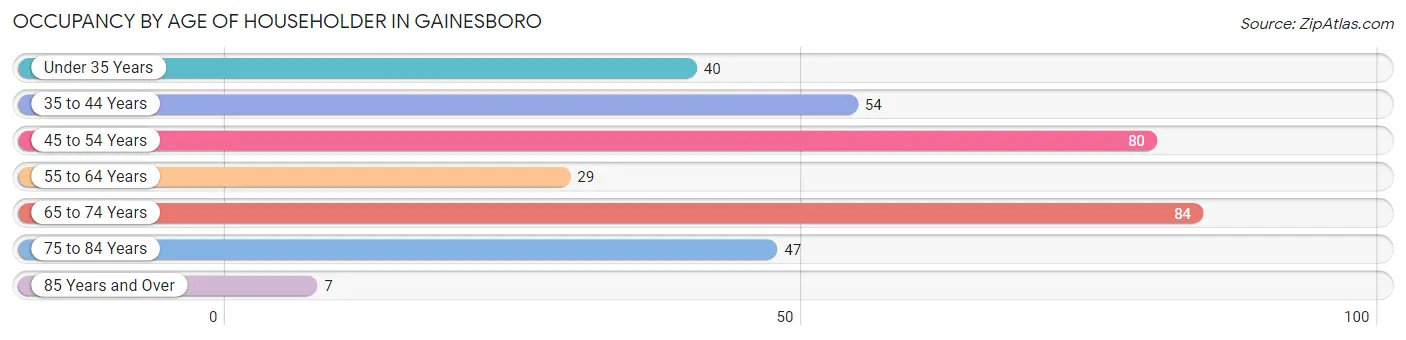
| Age Bracket | # Households | % Households |
| Under 35 Years | 40 | 11.7% |
| 35 to 44 Years | 54 | 15.8% |
| 45 to 54 Years | 80 | 23.5% |
| 55 to 64 Years | 29 | 8.5% |
| 65 to 74 Years | 84 | 24.6% |
| 75 to 84 Years | 47 | 13.8% |
| 85 Years and Over | 7 | 2.1% |
| Total | 341 | 100.0% |
Housing Finances in Gainesboro
Median Income by Occupancy in Gainesboro
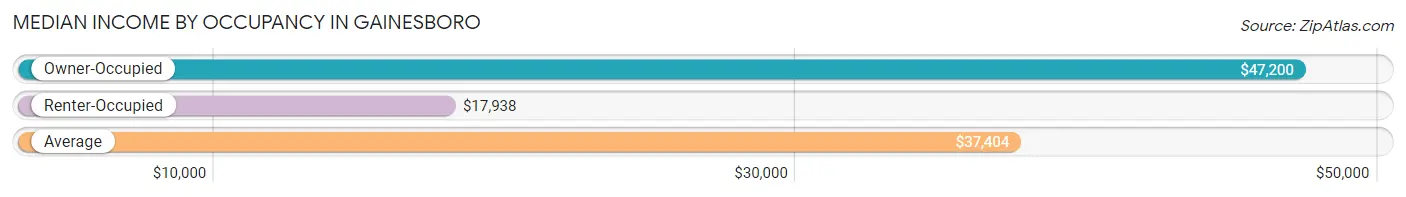
| Occupancy Type | # Households | Median Income |
| Owner-Occupied | 228 (66.9%) | $47,200 |
| Renter-Occupied | 113 (33.1%) | $17,938 |
| Average | 341 (100.0%) | $37,404 |
Occupancy by Householder Income Bracket in Gainesboro
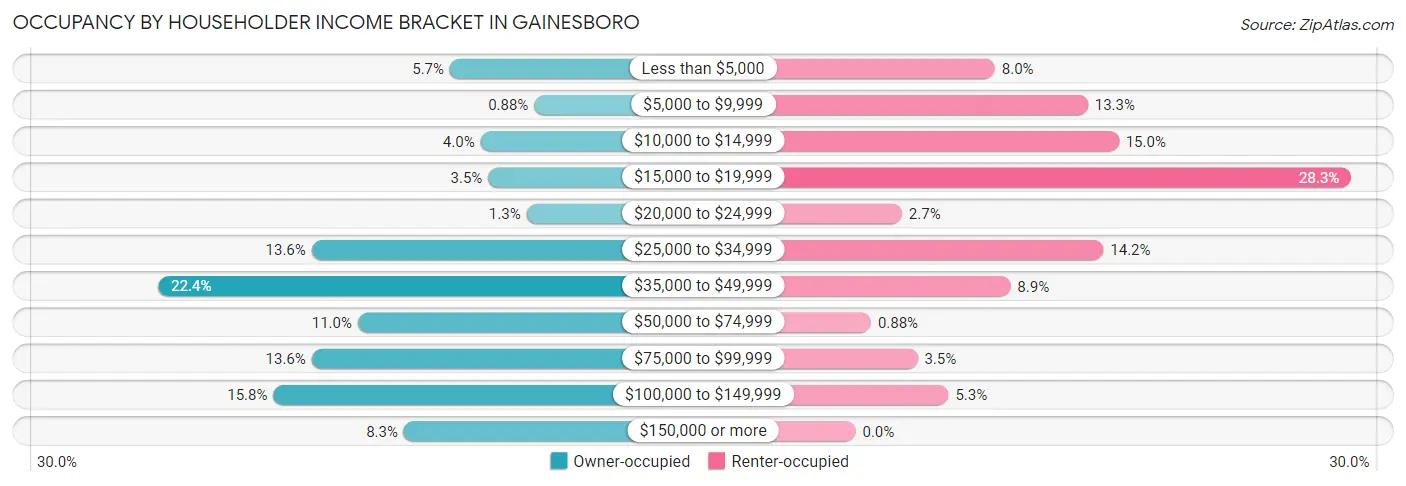
| Income Bracket | Owner-occupied | Renter-occupied |
| Less than $5,000 | 13 (5.7%) | 9 (8.0%) |
| $5,000 to $9,999 | 2 (0.9%) | 15 (13.3%) |
| $10,000 to $14,999 | 9 (4.0%) | 17 (15.0%) |
| $15,000 to $19,999 | 8 (3.5%) | 32 (28.3%) |
| $20,000 to $24,999 | 3 (1.3%) | 3 (2.6%) |
| $25,000 to $34,999 | 31 (13.6%) | 16 (14.2%) |
| $35,000 to $49,999 | 51 (22.4%) | 10 (8.8%) |
| $50,000 to $74,999 | 25 (11.0%) | 1 (0.9%) |
| $75,000 to $99,999 | 31 (13.6%) | 4 (3.5%) |
| $100,000 to $149,999 | 36 (15.8%) | 6 (5.3%) |
| $150,000 or more | 19 (8.3%) | 0 (0.0%) |
| Total | 228 (100.0%) | 113 (100.0%) |
Monthly Housing Cost Tiers in Gainesboro
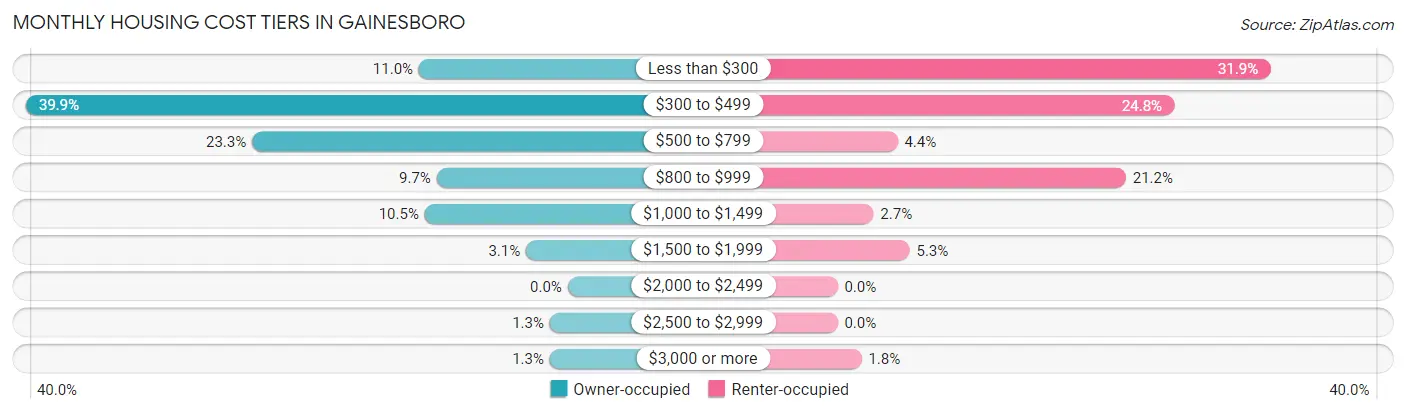
| Monthly Cost | Owner-occupied | Renter-occupied |
| Less than $300 | 25 (11.0%) | 36 (31.9%) |
| $300 to $499 | 91 (39.9%) | 28 (24.8%) |
| $500 to $799 | 53 (23.3%) | 5 (4.4%) |
| $800 to $999 | 22 (9.7%) | 24 (21.2%) |
| $1,000 to $1,499 | 24 (10.5%) | 3 (2.6%) |
| $1,500 to $1,999 | 7 (3.1%) | 6 (5.3%) |
| $2,000 to $2,499 | 0 (0.0%) | 0 (0.0%) |
| $2,500 to $2,999 | 3 (1.3%) | 0 (0.0%) |
| $3,000 or more | 3 (1.3%) | 2 (1.8%) |
| Total | 228 (100.0%) | 113 (100.0%) |
Physical Housing Characteristics in Gainesboro
Housing Structures in Gainesboro
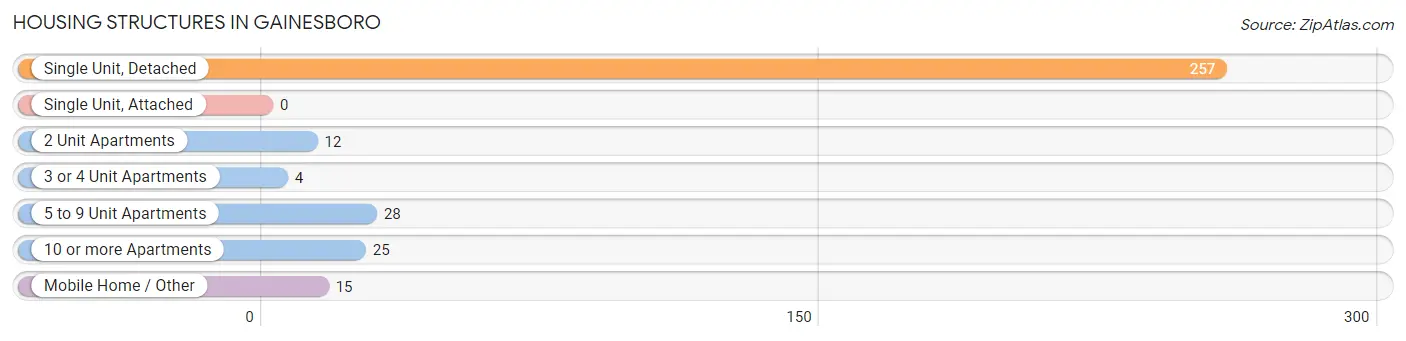
| Structure Type | # Housing Units | % Housing Units |
| Single Unit, Detached | 257 | 75.4% |
| Single Unit, Attached | 0 | 0.0% |
| 2 Unit Apartments | 12 | 3.5% |
| 3 or 4 Unit Apartments | 4 | 1.2% |
| 5 to 9 Unit Apartments | 28 | 8.2% |
| 10 or more Apartments | 25 | 7.3% |
| Mobile Home / Other | 15 | 4.4% |
| Total | 341 | 100.0% |
Housing Structures by Occupancy in Gainesboro
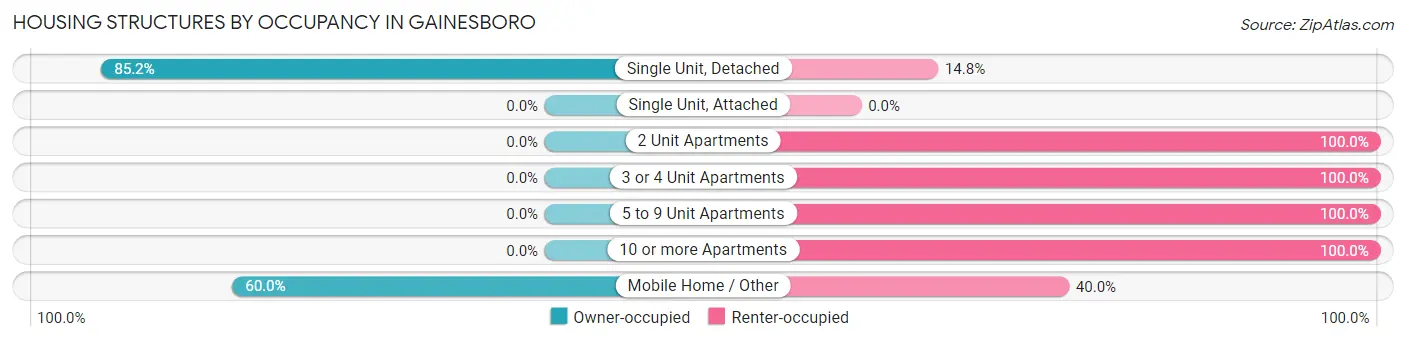
| Structure Type | Owner-occupied | Renter-occupied |
| Single Unit, Detached | 219 (85.2%) | 38 (14.8%) |
| Single Unit, Attached | 0 (0.0%) | 0 (0.0%) |
| 2 Unit Apartments | 0 (0.0%) | 12 (100.0%) |
| 3 or 4 Unit Apartments | 0 (0.0%) | 4 (100.0%) |
| 5 to 9 Unit Apartments | 0 (0.0%) | 28 (100.0%) |
| 10 or more Apartments | 0 (0.0%) | 25 (100.0%) |
| Mobile Home / Other | 9 (60.0%) | 6 (40.0%) |
| Total | 228 (66.9%) | 113 (33.1%) |
Housing Structures by Number of Rooms in Gainesboro
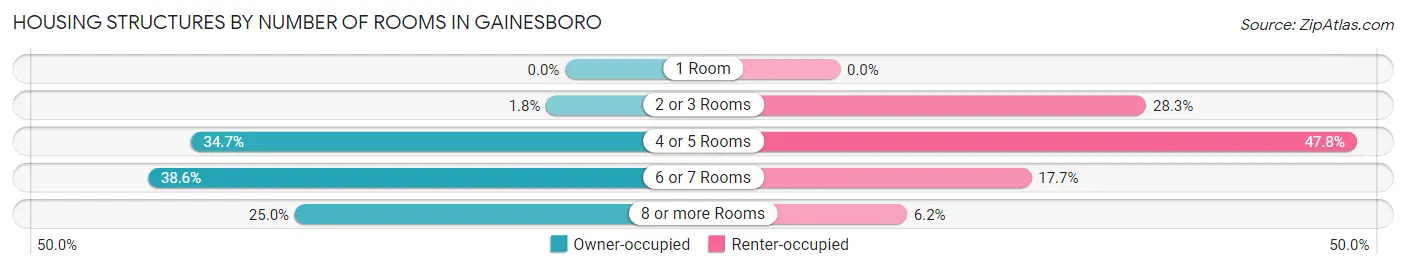
| Number of Rooms | Owner-occupied | Renter-occupied |
| 1 Room | 0 (0.0%) | 0 (0.0%) |
| 2 or 3 Rooms | 4 (1.8%) | 32 (28.3%) |
| 4 or 5 Rooms | 79 (34.6%) | 54 (47.8%) |
| 6 or 7 Rooms | 88 (38.6%) | 20 (17.7%) |
| 8 or more Rooms | 57 (25.0%) | 7 (6.2%) |
| Total | 228 (100.0%) | 113 (100.0%) |
Housing Structure by Heating Type in Gainesboro
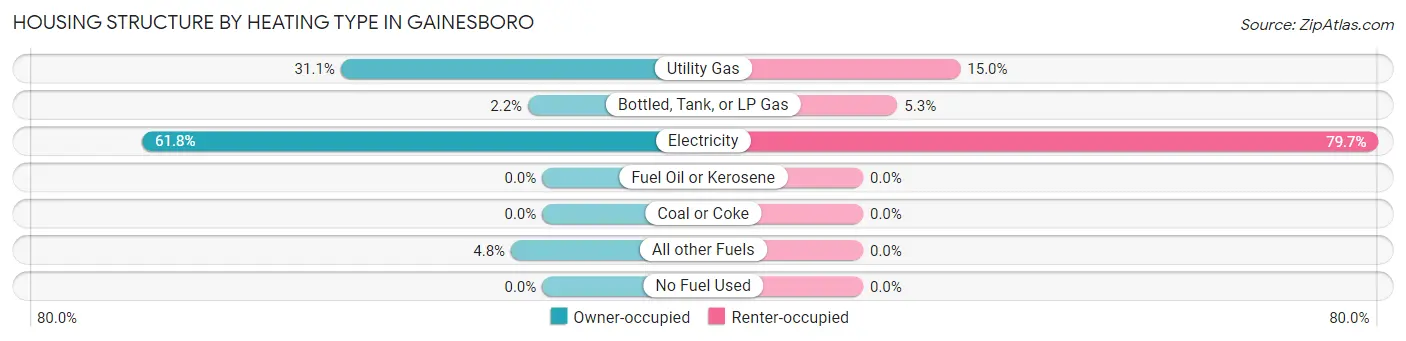
| Heating Type | Owner-occupied | Renter-occupied |
| Utility Gas | 71 (31.1%) | 17 (15.0%) |
| Bottled, Tank, or LP Gas | 5 (2.2%) | 6 (5.3%) |
| Electricity | 141 (61.8%) | 90 (79.6%) |
| Fuel Oil or Kerosene | 0 (0.0%) | 0 (0.0%) |
| Coal or Coke | 0 (0.0%) | 0 (0.0%) |
| All other Fuels | 11 (4.8%) | 0 (0.0%) |
| No Fuel Used | 0 (0.0%) | 0 (0.0%) |
| Total | 228 (100.0%) | 113 (100.0%) |
Household Vehicle Usage in Gainesboro
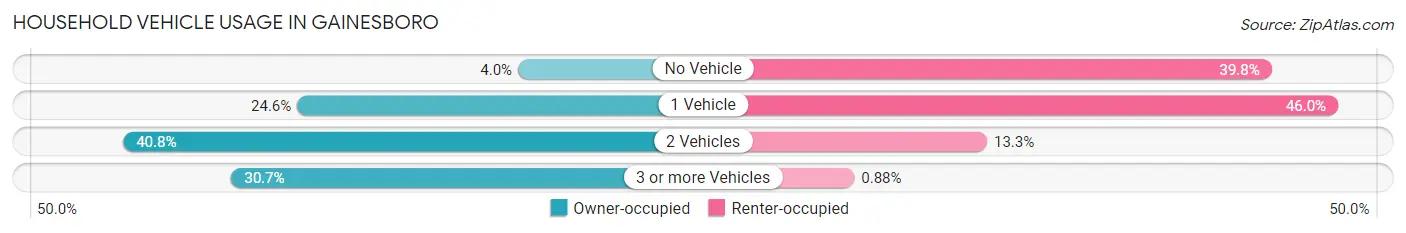
| Vehicles per Household | Owner-occupied | Renter-occupied |
| No Vehicle | 9 (4.0%) | 45 (39.8%) |
| 1 Vehicle | 56 (24.6%) | 52 (46.0%) |
| 2 Vehicles | 93 (40.8%) | 15 (13.3%) |
| 3 or more Vehicles | 70 (30.7%) | 1 (0.9%) |
| Total | 228 (100.0%) | 113 (100.0%) |
Real Estate & Mortgages in Gainesboro
Real Estate and Mortgage Overview in Gainesboro
| Characteristic | Without Mortgage | With Mortgage |
| Housing Units | 126 | 102 |
| Median Property Value | $176,600 | $119,400 |
| Median Household Income | $44,667 | $5 |
| Monthly Housing Costs | $393 | $3 |
| Real Estate Taxes | $1,138 | $13 |
Property Value by Mortgage Status in Gainesboro
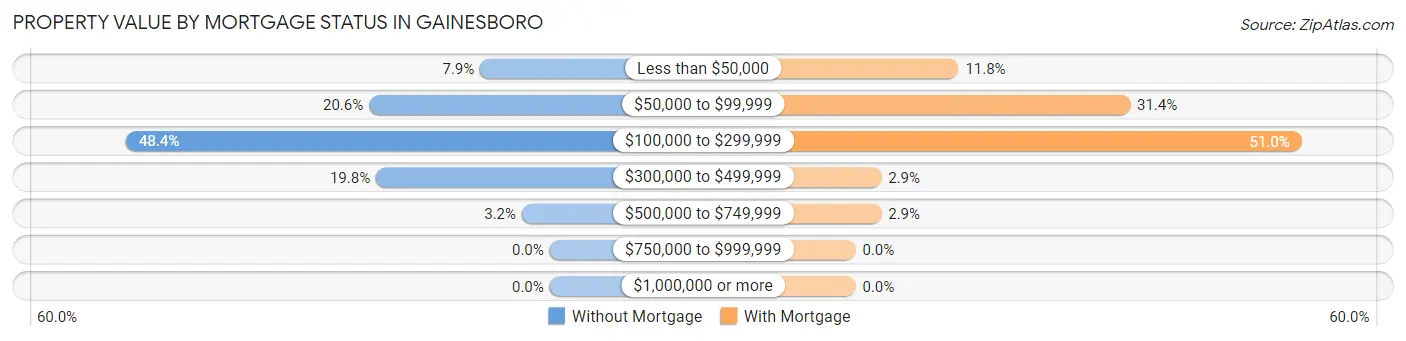
| Property Value | Without Mortgage | With Mortgage |
| Less than $50,000 | 10 (7.9%) | 12 (11.8%) |
| $50,000 to $99,999 | 26 (20.6%) | 32 (31.4%) |
| $100,000 to $299,999 | 61 (48.4%) | 52 (51.0%) |
| $300,000 to $499,999 | 25 (19.8%) | 3 (2.9%) |
| $500,000 to $749,999 | 4 (3.2%) | 3 (2.9%) |
| $750,000 to $999,999 | 0 (0.0%) | 0 (0.0%) |
| $1,000,000 or more | 0 (0.0%) | 0 (0.0%) |
| Total | 126 (100.0%) | 102 (100.0%) |
Household Income by Mortgage Status in Gainesboro
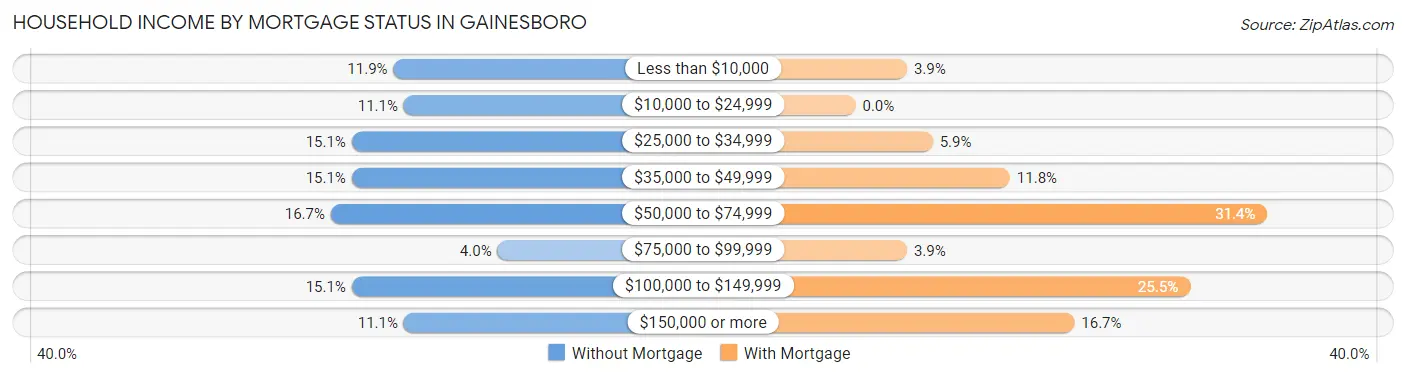
| Household Income | Without Mortgage | With Mortgage |
| Less than $10,000 | 15 (11.9%) | 4 (3.9%) |
| $10,000 to $24,999 | 14 (11.1%) | 0 (0.0%) |
| $25,000 to $34,999 | 19 (15.1%) | 6 (5.9%) |
| $35,000 to $49,999 | 19 (15.1%) | 12 (11.8%) |
| $50,000 to $74,999 | 21 (16.7%) | 32 (31.4%) |
| $75,000 to $99,999 | 5 (4.0%) | 4 (3.9%) |
| $100,000 to $149,999 | 19 (15.1%) | 26 (25.5%) |
| $150,000 or more | 14 (11.1%) | 17 (16.7%) |
| Total | 126 (100.0%) | 102 (100.0%) |
Property Value to Household Income Ratio in Gainesboro
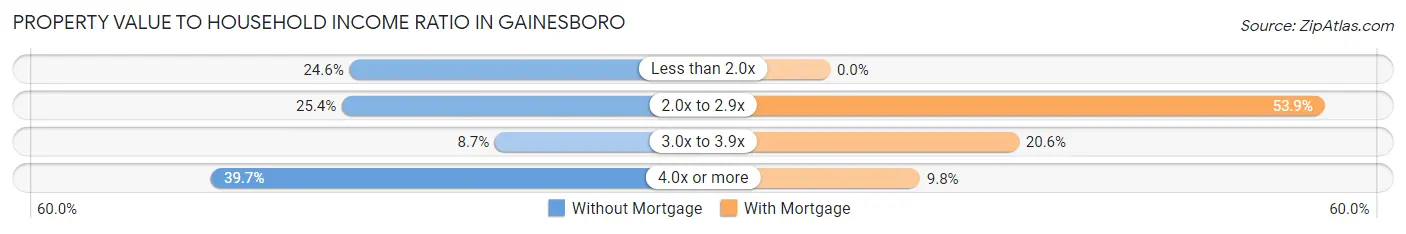
| Value-to-Income Ratio | Without Mortgage | With Mortgage |
| Less than 2.0x | 31 (24.6%) | 0 (0.0%) |
| 2.0x to 2.9x | 32 (25.4%) | 55 (53.9%) |
| 3.0x to 3.9x | 11 (8.7%) | 21 (20.6%) |
| 4.0x or more | 50 (39.7%) | 10 (9.8%) |
| Total | 126 (100.0%) | 102 (100.0%) |
Real Estate Taxes by Mortgage Status in Gainesboro
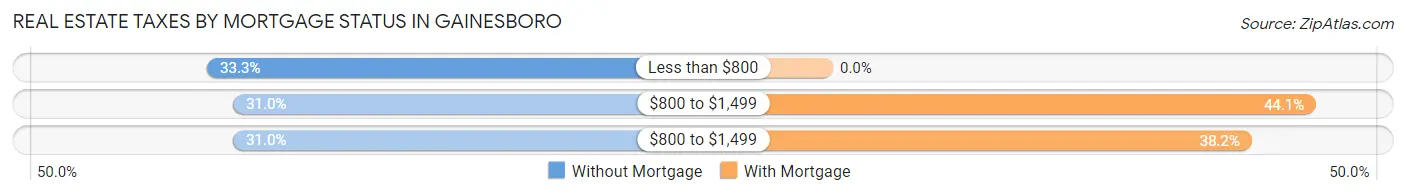
| Property Taxes | Without Mortgage | With Mortgage |
| Less than $800 | 42 (33.3%) | 0 (0.0%) |
| $800 to $1,499 | 39 (30.9%) | 45 (44.1%) |
| $800 to $1,499 | 39 (30.9%) | 39 (38.2%) |
| Total | 126 (100.0%) | 102 (100.0%) |
Health & Disability in Gainesboro
Health Insurance Coverage by Age in Gainesboro
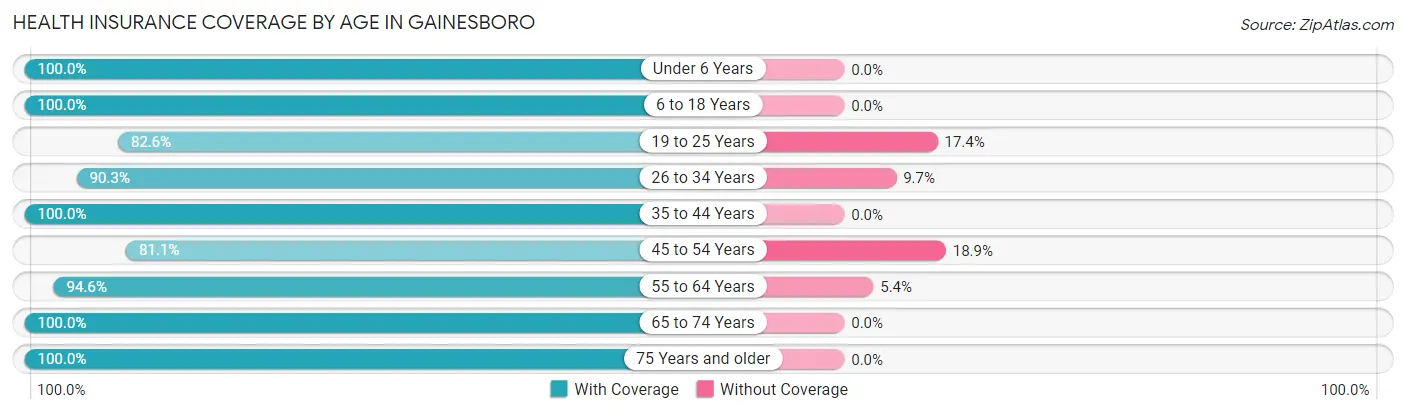
| Age Bracket | With Coverage | Without Coverage |
| Under 6 Years | 41 (100.0%) | 0 (0.0%) |
| 6 to 18 Years | 120 (100.0%) | 0 (0.0%) |
| 19 to 25 Years | 57 (82.6%) | 12 (17.4%) |
| 26 to 34 Years | 56 (90.3%) | 6 (9.7%) |
| 35 to 44 Years | 85 (100.0%) | 0 (0.0%) |
| 45 to 54 Years | 167 (81.1%) | 39 (18.9%) |
| 55 to 64 Years | 105 (94.6%) | 6 (5.4%) |
| 65 to 74 Years | 138 (100.0%) | 0 (0.0%) |
| 75 Years and older | 81 (100.0%) | 0 (0.0%) |
| Total | 850 (93.1%) | 63 (6.9%) |
Health Insurance Coverage by Citizenship Status in Gainesboro
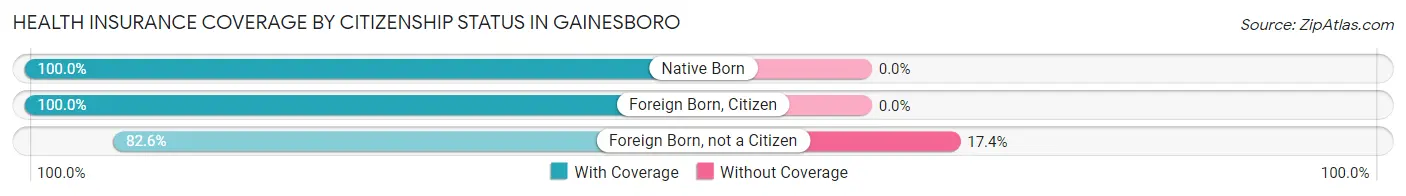
| Citizenship Status | With Coverage | Without Coverage |
| Native Born | 41 (100.0%) | 0 (0.0%) |
| Foreign Born, Citizen | 120 (100.0%) | 0 (0.0%) |
| Foreign Born, not a Citizen | 57 (82.6%) | 12 (17.4%) |
Health Insurance Coverage by Household Income in Gainesboro
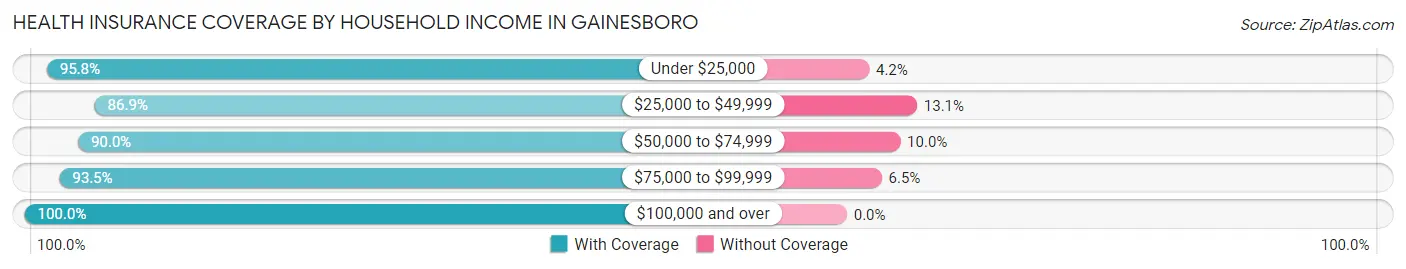
| Household Income | With Coverage | Without Coverage |
| Under $25,000 | 253 (95.8%) | 11 (4.2%) |
| $25,000 to $49,999 | 258 (86.9%) | 39 (13.1%) |
| $50,000 to $74,999 | 63 (90.0%) | 7 (10.0%) |
| $75,000 to $99,999 | 86 (93.5%) | 6 (6.5%) |
| $100,000 and over | 186 (100.0%) | 0 (0.0%) |
Public vs Private Health Insurance Coverage by Age in Gainesboro
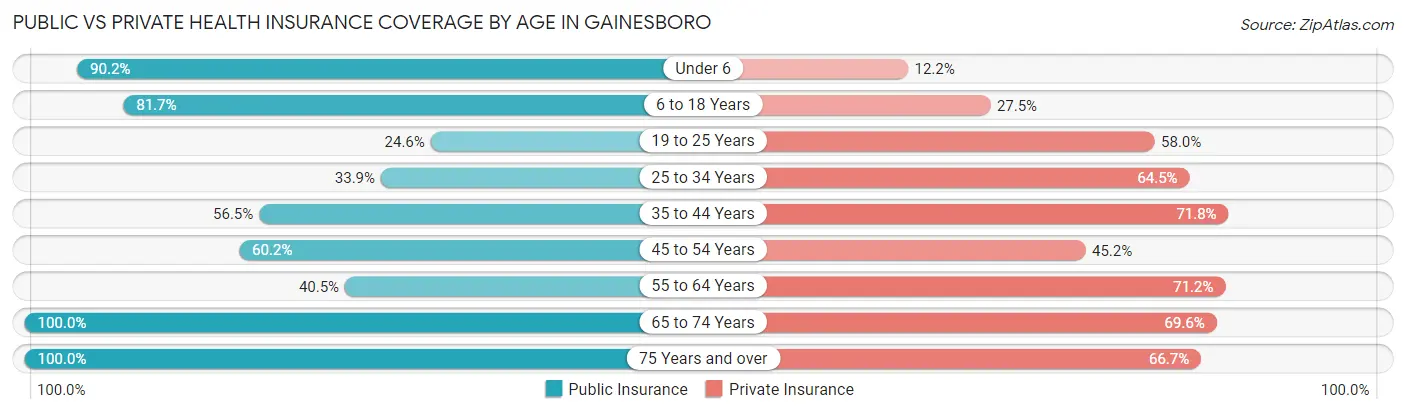
| Age Bracket | Public Insurance | Private Insurance |
| Under 6 | 37 (90.2%) | 5 (12.2%) |
| 6 to 18 Years | 98 (81.7%) | 33 (27.5%) |
| 19 to 25 Years | 17 (24.6%) | 40 (58.0%) |
| 25 to 34 Years | 21 (33.9%) | 40 (64.5%) |
| 35 to 44 Years | 48 (56.5%) | 61 (71.8%) |
| 45 to 54 Years | 124 (60.2%) | 93 (45.2%) |
| 55 to 64 Years | 45 (40.5%) | 79 (71.2%) |
| 65 to 74 Years | 138 (100.0%) | 96 (69.6%) |
| 75 Years and over | 81 (100.0%) | 54 (66.7%) |
| Total | 609 (66.7%) | 501 (54.9%) |
Disability Status by Sex by Age in Gainesboro
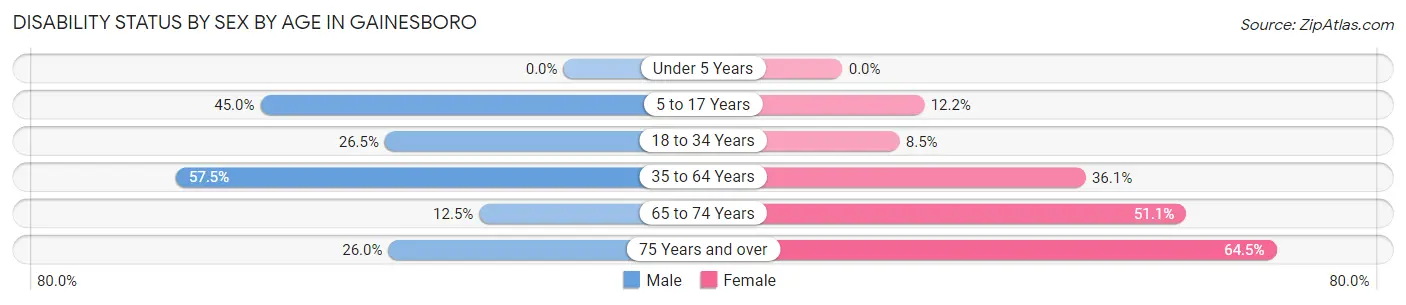
| Age Bracket | Male | Female |
| Under 5 Years | 0 (0.0%) | 0 (0.0%) |
| 5 to 17 Years | 18 (45.0%) | 9 (12.2%) |
| 18 to 34 Years | 22 (26.5%) | 5 (8.5%) |
| 35 to 64 Years | 107 (57.5%) | 78 (36.1%) |
| 65 to 74 Years | 6 (12.5%) | 46 (51.1%) |
| 75 Years and over | 13 (26.0%) | 20 (64.5%) |
Disability Class by Sex by Age in Gainesboro
Disability Class: Hearing Difficulty
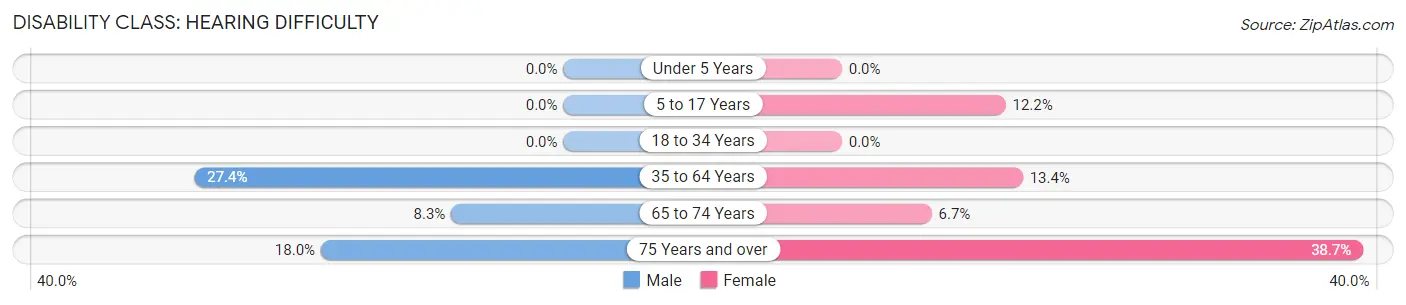
| Age Bracket | Male | Female |
| Under 5 Years | 0 (0.0%) | 0 (0.0%) |
| 5 to 17 Years | 0 (0.0%) | 9 (12.2%) |
| 18 to 34 Years | 0 (0.0%) | 0 (0.0%) |
| 35 to 64 Years | 51 (27.4%) | 29 (13.4%) |
| 65 to 74 Years | 4 (8.3%) | 6 (6.7%) |
| 75 Years and over | 9 (18.0%) | 12 (38.7%) |
Disability Class: Vision Difficulty
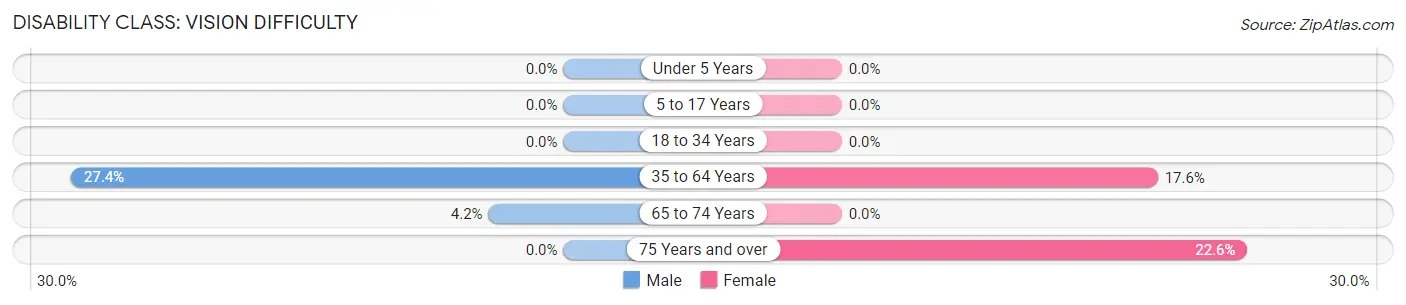
| Age Bracket | Male | Female |
| Under 5 Years | 0 (0.0%) | 0 (0.0%) |
| 5 to 17 Years | 0 (0.0%) | 0 (0.0%) |
| 18 to 34 Years | 0 (0.0%) | 0 (0.0%) |
| 35 to 64 Years | 51 (27.4%) | 38 (17.6%) |
| 65 to 74 Years | 2 (4.2%) | 0 (0.0%) |
| 75 Years and over | 0 (0.0%) | 7 (22.6%) |
Disability Class: Cognitive Difficulty
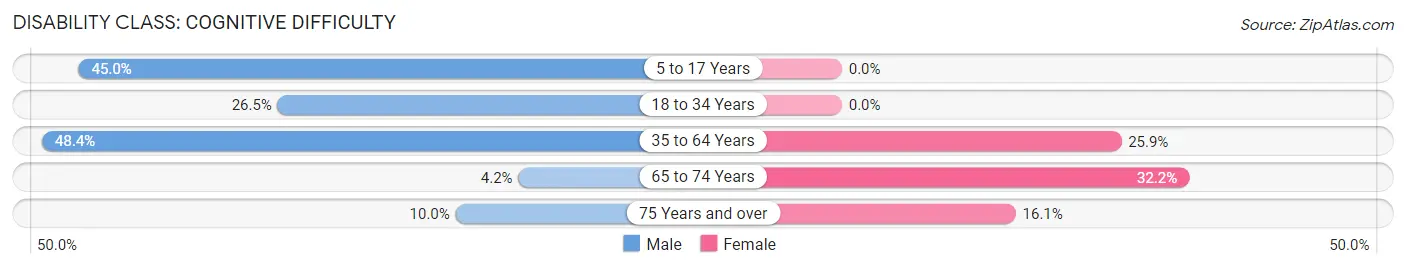
| Age Bracket | Male | Female |
| 5 to 17 Years | 18 (45.0%) | 0 (0.0%) |
| 18 to 34 Years | 22 (26.5%) | 0 (0.0%) |
| 35 to 64 Years | 90 (48.4%) | 56 (25.9%) |
| 65 to 74 Years | 2 (4.2%) | 29 (32.2%) |
| 75 Years and over | 5 (10.0%) | 5 (16.1%) |
Disability Class: Ambulatory Difficulty
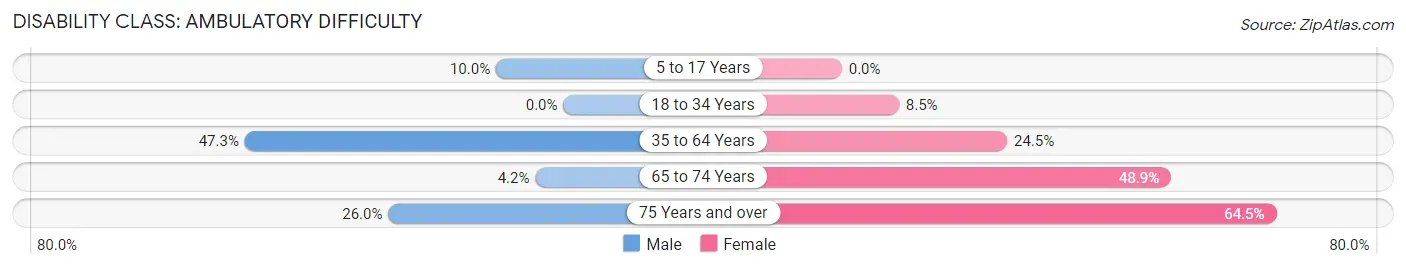
| Age Bracket | Male | Female |
| 5 to 17 Years | 4 (10.0%) | 0 (0.0%) |
| 18 to 34 Years | 0 (0.0%) | 5 (8.5%) |
| 35 to 64 Years | 88 (47.3%) | 53 (24.5%) |
| 65 to 74 Years | 2 (4.2%) | 44 (48.9%) |
| 75 Years and over | 13 (26.0%) | 20 (64.5%) |
Disability Class: Self-Care Difficulty
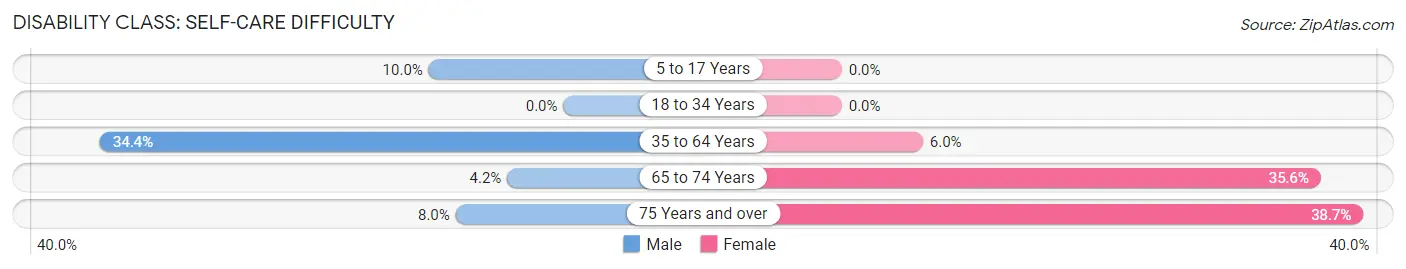
| Age Bracket | Male | Female |
| 5 to 17 Years | 4 (10.0%) | 0 (0.0%) |
| 18 to 34 Years | 0 (0.0%) | 0 (0.0%) |
| 35 to 64 Years | 64 (34.4%) | 13 (6.0%) |
| 65 to 74 Years | 2 (4.2%) | 32 (35.6%) |
| 75 Years and over | 4 (8.0%) | 12 (38.7%) |
Technology Access in Gainesboro
Computing Device Access in Gainesboro
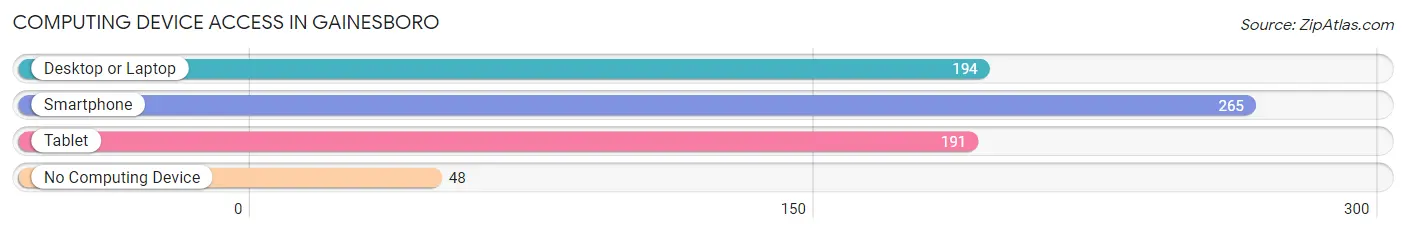
| Device Type | # Households | % Households |
| Desktop or Laptop | 194 | 56.9% |
| Smartphone | 265 | 77.7% |
| Tablet | 191 | 56.0% |
| No Computing Device | 48 | 14.1% |
| Total | 341 | 100.0% |
Internet Access in Gainesboro
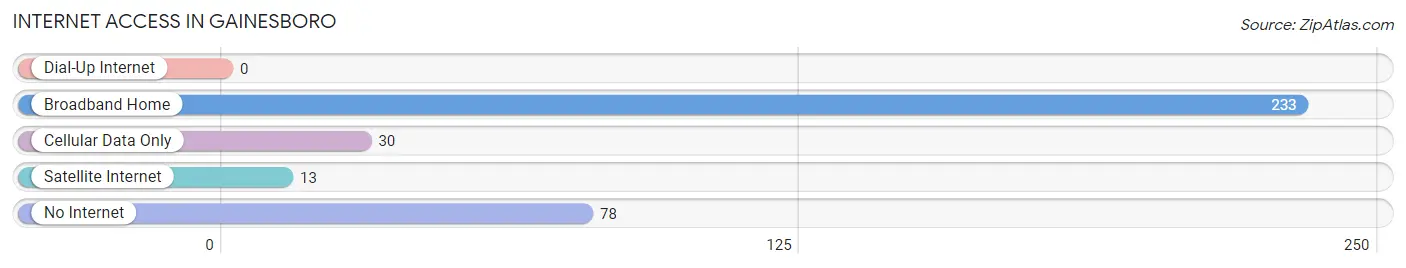
| Internet Type | # Households | % Households |
| Dial-Up Internet | 0 | 0.0% |
| Broadband Home | 233 | 68.3% |
| Cellular Data Only | 30 | 8.8% |
| Satellite Internet | 13 | 3.8% |
| No Internet | 78 | 22.9% |
| Total | 341 | 100.0% |
Gainesboro Summary
Gainesboro is a small town located in Jackson County, Tennessee. It is situated in the foothills of the Cumberland Mountains, approximately 70 miles east of Nashville. The town was founded in 1820 and named after General Edmund Pendleton Gaines, a hero of the War of 1812. The population of Gainesboro was 1,845 at the 2010 census.
Geography
Gainesboro is located at 36°25'25"N 85°37'45"W (36.423, -85.629). The town is situated in the foothills of the Cumberland Mountains, approximately 70 miles east of Nashville. The town is located on the banks of the Cumberland River, which provides a scenic backdrop to the town. The town is surrounded by rolling hills and farmland, and is home to several small lakes and streams.
Climate
Gainesboro has a humid subtropical climate, with hot, humid summers and mild winters. The average annual temperature is around 60°F (15°C). The average annual precipitation is around 45 inches (114 cm).
Demographics
As of the 2010 census, the population of Gainesboro was 1,845. The racial makeup of the town was 95.3% White, 0.7% African American, 0.3% Native American, 0.2% Asian, 0.1% Pacific Islander, 1.2% from other races, and 2.3% from two or more races. Hispanic or Latino of any race were 2.3% of the population.
Economy
Gainesboro is a small, rural town with a largely agricultural economy. The town is home to several small businesses, including a grocery store, a hardware store, and a few restaurants. The town is also home to several manufacturing companies, including a furniture factory and a plastics factory.
The town is also home to several tourist attractions, including the Gainesboro Museum of History, the Gainesboro Historic District, and the Gainesboro State Park. The town is also home to several annual festivals, including the Gainesboro Music Festival and the Gainesboro Arts Festival.
History
Gainesboro was founded in 1820 and named after General Edmund Pendleton Gaines, a hero of the War of 1812. The town was originally a trading post and was a stop on the stagecoach route between Nashville and Knoxville. The town was incorporated in 1845 and was the county seat of Jackson County until 1871, when the county seat was moved to Gainesboro.
The town was an important stop on the Nashville and Knoxville Railroad, which was completed in 1855. The railroad brought increased economic activity to the town, and the population grew rapidly. The town was also home to several Civil War battles, including the Battle of Gainesboro in 1863.
In the late 19th century, the town was home to several large manufacturing companies, including a furniture factory and a cotton mill. The town was also home to several educational institutions, including the Gainesboro Female Academy and the Gainesboro Male Academy.
In the early 20th century, the town was home to several large manufacturing companies, including a furniture factory, a plastics factory, and a paper mill. The town was also home to several educational institutions, including the Gainesboro High School and the Gainesboro Junior College.
In the late 20th century, the town's economy shifted from manufacturing to tourism. The town is now home to several tourist attractions, including the Gainesboro Museum of History, the Gainesboro Historic District, and the Gainesboro State Park. The town is also home to several annual festivals, including the Gainesboro Music Festival and the Gainesboro Arts Festival.
Common Questions
What is Per Capita Income in Gainesboro?
Per Capita income in Gainesboro is $22,192.
What is the Median Family Income in Gainesboro?
Median Family Income in Gainesboro is $46,739.
What is the Median Household income in Gainesboro?
Median Household Income in Gainesboro is $37,404.
What is Income or Wage Gap in Gainesboro?
Income or Wage Gap in Gainesboro is 10.9%.
Women in Gainesboro earn 89.1 cents for every dollar earned by a man.
What is Family Income Deficit in Gainesboro?
Family Income Deficit in Gainesboro is $10,745.
Families that are below poverty line in Gainesboro earn $10,745 less on average than the poverty threshold level.
What is Inequality or Gini Index in Gainesboro?
Inequality or Gini Index in Gainesboro is 0.49.
What is the Total Population of Gainesboro?
Total Population of Gainesboro is 1,086.
What is the Total Male Population of Gainesboro?
Total Male Population of Gainesboro is 542.
What is the Total Female Population of Gainesboro?
Total Female Population of Gainesboro is 544.
What is the Ratio of Males per 100 Females in Gainesboro?
There are 99.63 Males per 100 Females in Gainesboro.
What is the Ratio of Females per 100 Males in Gainesboro?
There are 100.37 Females per 100 Males in Gainesboro.
What is the Median Population Age in Gainesboro?
Median Population Age in Gainesboro is 49.5 Years.
What is the Average Family Size in Gainesboro
Average Family Size in Gainesboro is 3.3 People.
What is the Average Household Size in Gainesboro
Average Household Size in Gainesboro is 2.7 People.
How Large is the Labor Force in Gainesboro?
There are 371 People in the Labor Forcein in Gainesboro.
What is the Percentage of People in the Labor Force in Gainesboro?
39.6% of People are in the Labor Force in Gainesboro.
What is the Unemployment Rate in Gainesboro?
Unemployment Rate in Gainesboro is 8.6%.