Watertown, TN Map & Demographics
Watertown Map
Watertown Overview
$26,207
PER CAPITA INCOME
$66,855
AVG FAMILY INCOME
$56,964
AVG HOUSEHOLD INCOME
37.6%
WAGE / INCOME GAP [ % ]
62.4¢/ $1
WAGE / INCOME GAP [ $ ]
$10,149
FAMILY INCOME DEFICIT
0.39
INEQUALITY / GINI INDEX
1,637
TOTAL POPULATION
759
MALE POPULATION
878
FEMALE POPULATION
86.45
MALES / 100 FEMALES
115.68
FEMALES / 100 MALES
39.7
MEDIAN AGE
3.0
AVG FAMILY SIZE
2.5
AVG HOUSEHOLD SIZE
758
LABOR FORCE [ PEOPLE ]
59.0%
PERCENT IN LABOR FORCE
2.2%
UNEMPLOYMENT RATE
Watertown Zip Codes
Watertown Area Codes
Income in Watertown
Income Overview in Watertown
Per Capita Income in Watertown is $26,207, while median incomes of families and households are $66,855 and $56,964 respectively.
| Characteristic | Number | Measure |
| Per Capita Income | 1,637 | $26,207 |
| Median Family Income | 468 | $66,855 |
| Mean Family Income | 468 | $73,952 |
| Median Household Income | 645 | $56,964 |
| Mean Household Income | 645 | $65,563 |
| Income Deficit | 468 | $10,149 |
| Wage / Income Gap (%) | 1,637 | 37.60% |
| Wage / Income Gap ($) | 1,637 | 62.40¢ per $1 |
| Gini / Inequality Index | 1,637 | 0.39 |
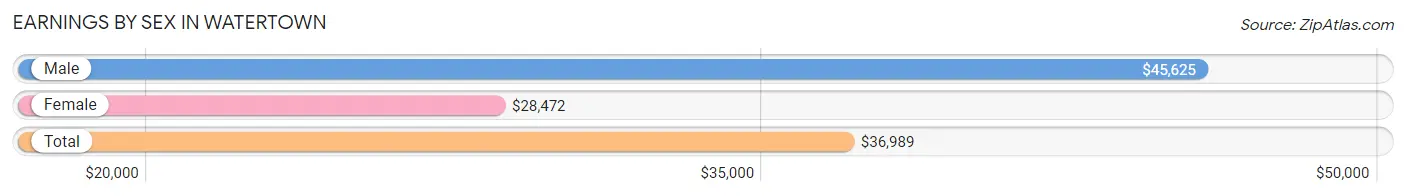
Earnings by Sex in Watertown
Average Earnings in Watertown are $36,989, $45,625 for men and $28,472 for women, a difference of 37.6%.
| Sex | Number | Average Earnings |
| Male | 351 (42.9%) | $45,625 |
| Female | 468 (57.1%) | $28,472 |
| Total | 819 (100.0%) | $36,989 |
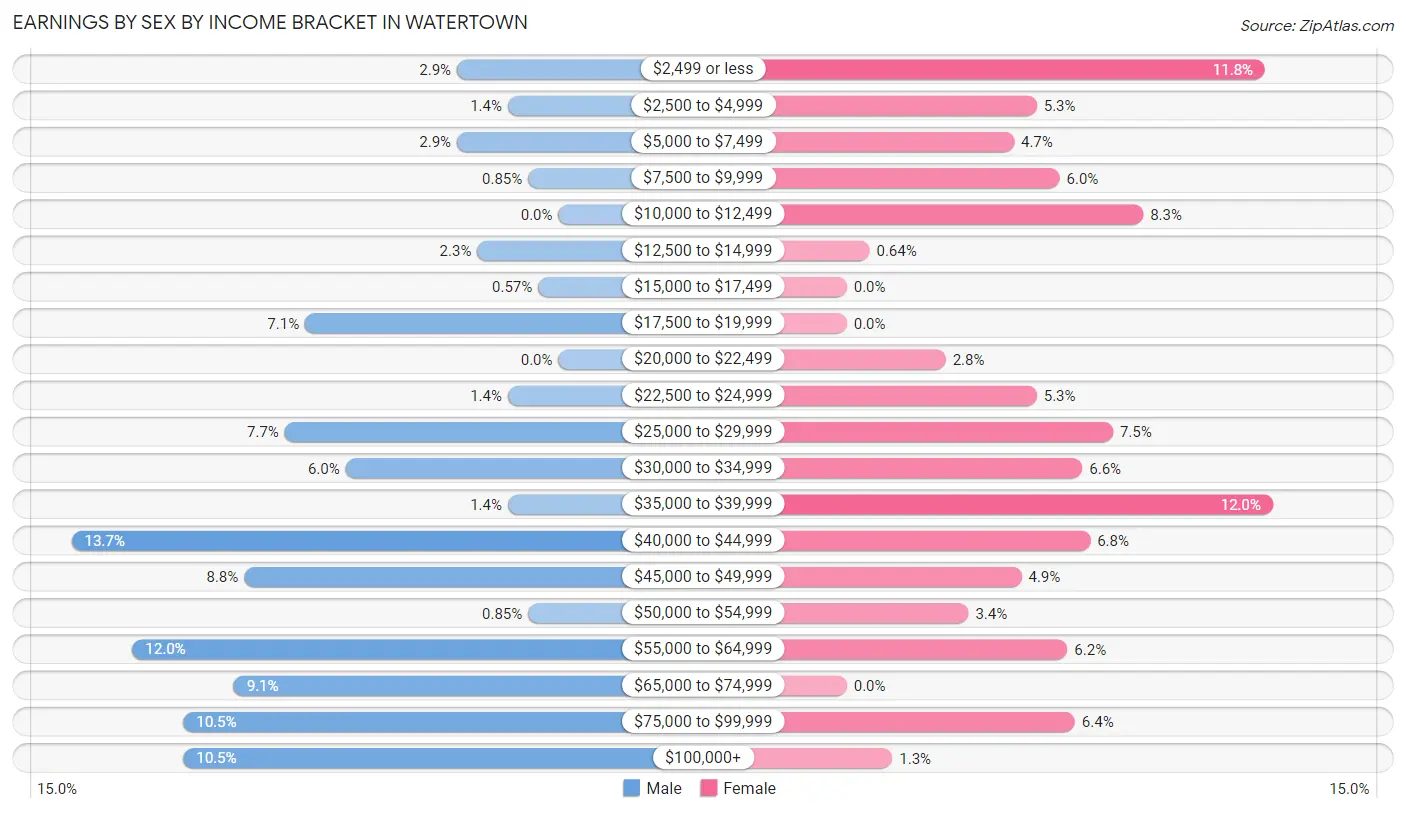
Earnings by Sex by Income Bracket in Watertown
The most common earnings brackets in Watertown are $40,000 to $44,999 for men (48 | 13.7%) and $35,000 to $39,999 for women (56 | 12.0%).
| Income | Male | Female |
| $2,499 or less | 10 (2.9%) | 55 (11.7%) |
| $2,500 to $4,999 | 5 (1.4%) | 25 (5.3%) |
| $5,000 to $7,499 | 10 (2.9%) | 22 (4.7%) |
| $7,500 to $9,999 | 3 (0.9%) | 28 (6.0%) |
| $10,000 to $12,499 | 0 (0.0%) | 39 (8.3%) |
| $12,500 to $14,999 | 8 (2.3%) | 3 (0.6%) |
| $15,000 to $17,499 | 2 (0.6%) | 0 (0.0%) |
| $17,500 to $19,999 | 25 (7.1%) | 0 (0.0%) |
| $20,000 to $22,499 | 0 (0.0%) | 13 (2.8%) |
| $22,500 to $24,999 | 5 (1.4%) | 25 (5.3%) |
| $25,000 to $29,999 | 27 (7.7%) | 35 (7.5%) |
| $30,000 to $34,999 | 21 (6.0%) | 31 (6.6%) |
| $35,000 to $39,999 | 5 (1.4%) | 56 (12.0%) |
| $40,000 to $44,999 | 48 (13.7%) | 32 (6.8%) |
| $45,000 to $49,999 | 31 (8.8%) | 23 (4.9%) |
| $50,000 to $54,999 | 3 (0.9%) | 16 (3.4%) |
| $55,000 to $64,999 | 42 (12.0%) | 29 (6.2%) |
| $65,000 to $74,999 | 32 (9.1%) | 0 (0.0%) |
| $75,000 to $99,999 | 37 (10.5%) | 30 (6.4%) |
| $100,000+ | 37 (10.5%) | 6 (1.3%) |
| Total | 351 (100.0%) | 468 (100.0%) |
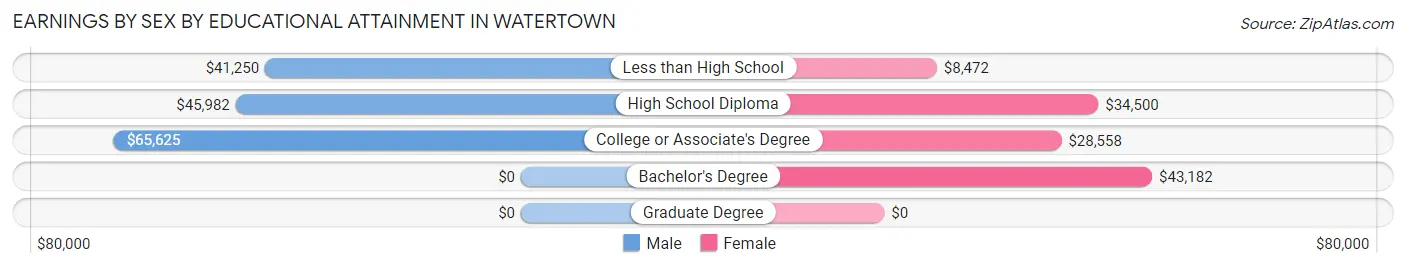
Earnings by Sex by Educational Attainment in Watertown
Average earnings in Watertown are $49,250 for men and $33,587 for women, a difference of 31.8%. Men with an educational attainment of college or associate's degree enjoy the highest average annual earnings of $65,625, while those with less than high school education earn the least with $41,250. Women with an educational attainment of bachelor's degree earn the most with the average annual earnings of $43,182, while those with less than high school education have the smallest earnings of $8,472.
| Educational Attainment | Male Income | Female Income |
| Less than High School | $41,250 | $8,472 |
| High School Diploma | $45,982 | $34,500 |
| College or Associate's Degree | $65,625 | $28,558 |
| Bachelor's Degree | - | - |
| Graduate Degree | - | - |
| Total | $49,250 | $33,587 |
Family Income in Watertown
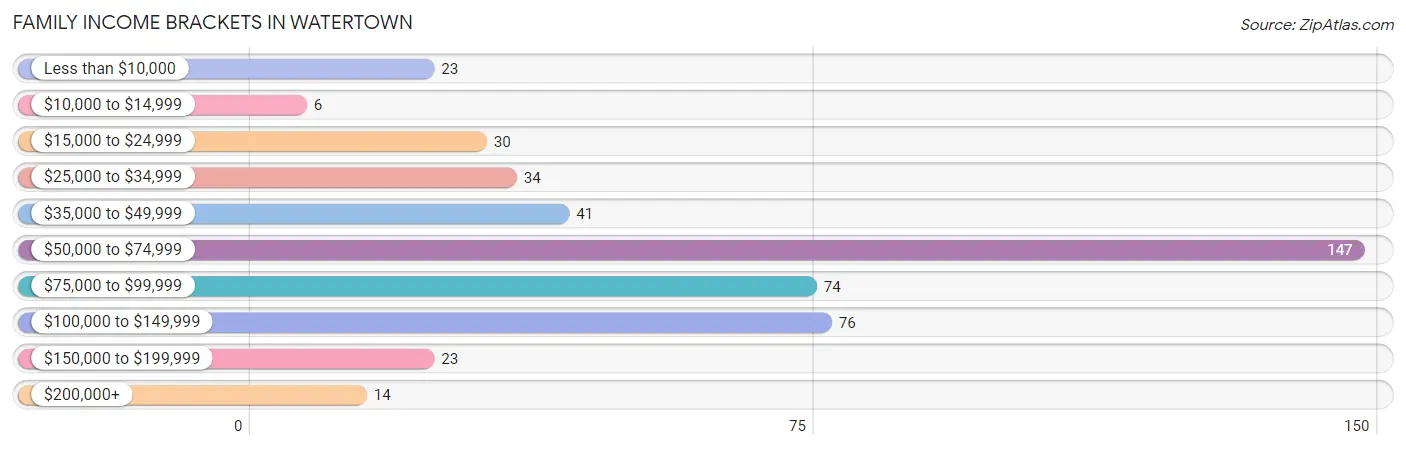
Family Income Brackets in Watertown
According to the Watertown family income data, there are 147 families falling into the $50,000 to $74,999 income range, which is the most common income bracket and makes up 31.4% of all families. Conversely, the $10,000 to $14,999 income bracket is the least frequent group with only 6 families (1.3%) belonging to this category.
| Income Bracket | # Families | % Families |
| Less than $10,000 | 23 | 4.9% |
| $10,000 to $14,999 | 6 | 1.3% |
| $15,000 to $24,999 | 30 | 6.4% |
| $25,000 to $34,999 | 34 | 7.3% |
| $35,000 to $49,999 | 41 | 8.8% |
| $50,000 to $74,999 | 147 | 31.4% |
| $75,000 to $99,999 | 74 | 15.8% |
| $100,000 to $149,999 | 76 | 16.2% |
| $150,000 to $199,999 | 23 | 4.9% |
| $200,000+ | 14 | 3.0% |
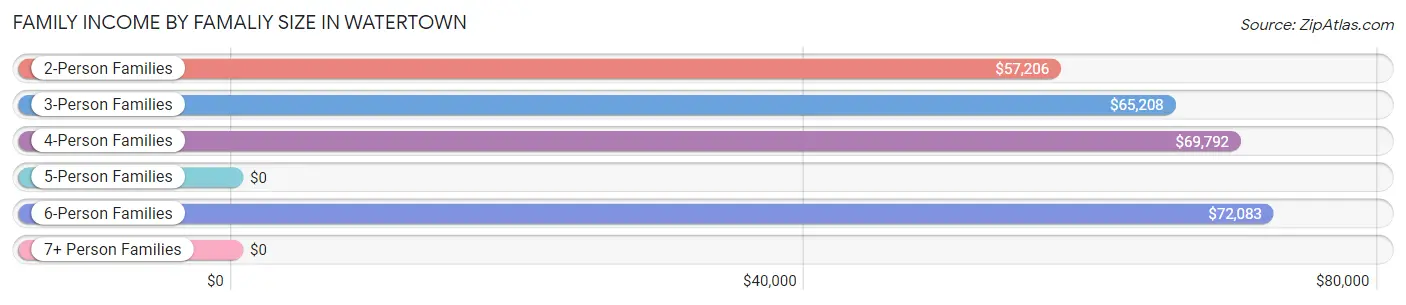
Family Income by Famaliy Size in Watertown
6-person families (18 | 3.8%) account for the highest median family income in Watertown with $72,083 per family, while 2-person families (250 | 53.4%) have the highest median income of $28,603 per family member.
| Income Bracket | # Families | Median Income |
| 2-Person Families | 250 (53.4%) | $57,206 |
| 3-Person Families | 113 (24.1%) | $65,208 |
| 4-Person Families | 64 (13.7%) | $69,792 |
| 5-Person Families | 9 (1.9%) | $0 |
| 6-Person Families | 18 (3.8%) | $72,083 |
| 7+ Person Families | 14 (3.0%) | $0 |
| Total | 468 (100.0%) | $66,855 |
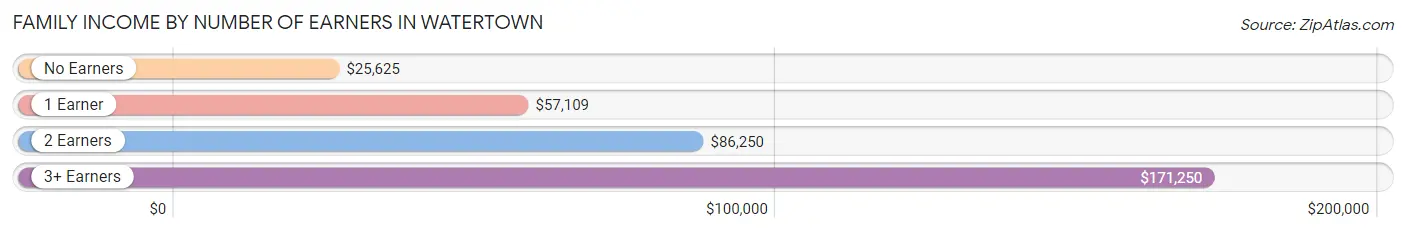
Family Income by Number of Earners in Watertown
The median family income in Watertown is $66,855, with families comprising 3+ earners (30) having the highest median family income of $171,250, while families with no earners (67) have the lowest median family income of $25,625, accounting for 6.4% and 14.3% of families, respectively.
| Number of Earners | # Families | Median Income |
| No Earners | 67 (14.3%) | $25,625 |
| 1 Earner | 161 (34.4%) | $57,109 |
| 2 Earners | 210 (44.9%) | $86,250 |
| 3+ Earners | 30 (6.4%) | $171,250 |
| Total | 468 (100.0%) | $66,855 |
Household Income in Watertown
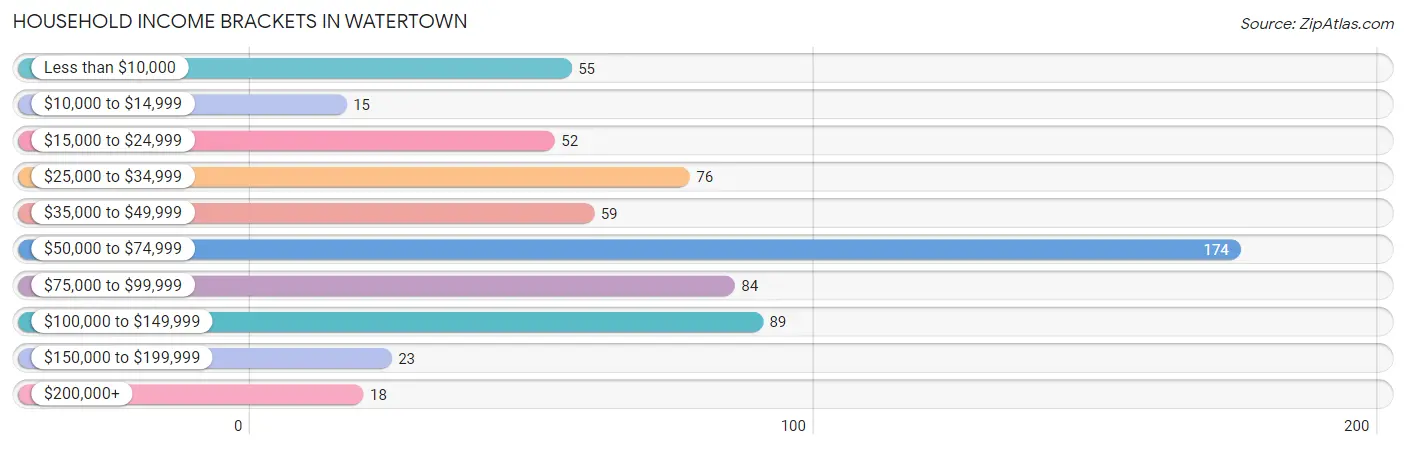
Household Income Brackets in Watertown
With 174 households falling in the category, the $50,000 to $74,999 income range is the most frequent in Watertown, accounting for 27.0% of all households. In contrast, only 15 households (2.3%) fall into the $10,000 to $14,999 income bracket, making it the least populous group.
| Income Bracket | # Households | % Households |
| Less than $10,000 | 55 | 8.5% |
| $10,000 to $14,999 | 15 | 2.3% |
| $15,000 to $24,999 | 52 | 8.1% |
| $25,000 to $34,999 | 76 | 11.8% |
| $35,000 to $49,999 | 59 | 9.1% |
| $50,000 to $74,999 | 174 | 27.0% |
| $75,000 to $99,999 | 84 | 13.0% |
| $100,000 to $149,999 | 89 | 13.8% |
| $150,000 to $199,999 | 23 | 3.6% |
| $200,000+ | 18 | 2.8% |
Household Income by Householder Age in Watertown
The median household income in Watertown is $56,964, with the highest median household income of $69,643 found in the 45 to 64 years age bracket for the primary householder. A total of 204 households (31.6%) fall into this category. Meanwhile, the 15 to 24 years age bracket for the primary householder has the lowest median household income of $0, with 22 households (3.4%) in this group.
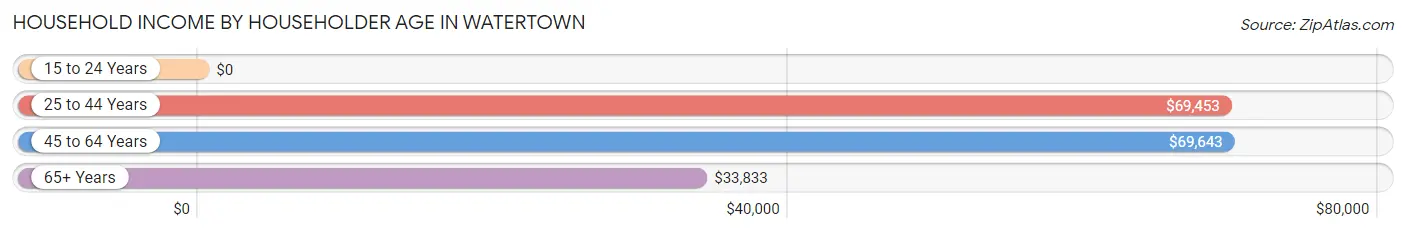
| Income Bracket | # Households | Median Income |
| 15 to 24 Years | 22 (3.4%) | $0 |
| 25 to 44 Years | 217 (33.6%) | $69,453 |
| 45 to 64 Years | 204 (31.6%) | $69,643 |
| 65+ Years | 202 (31.3%) | $33,833 |
| Total | 645 (100.0%) | $56,964 |
Poverty in Watertown
Income Below Poverty by Sex and Age in Watertown
With 9.1% poverty level for males and 17.7% for females among the residents of Watertown, under 5 year old males and 18 to 24 year old females are the most vulnerable to poverty, with 10 males (27.8%) and 23 females (50.0%) in their respective age groups living below the poverty level.
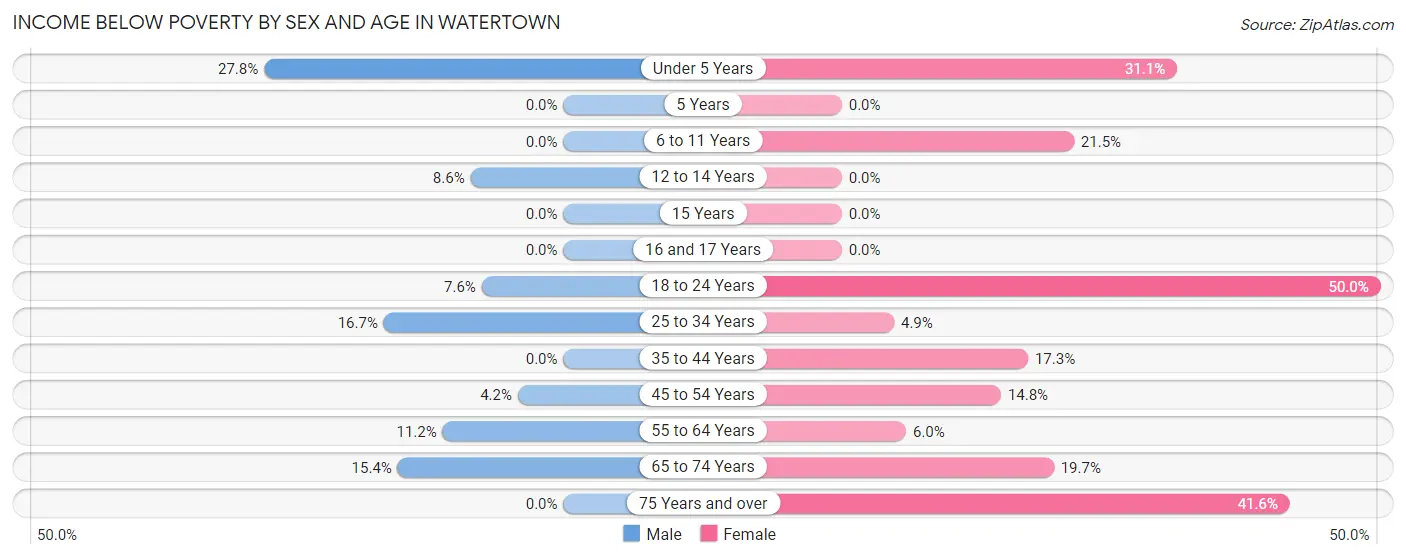
| Age Bracket | Male | Female |
| Under 5 Years | 10 (27.8%) | 14 (31.1%) |
| 5 Years | 0 (0.0%) | 0 (0.0%) |
| 6 to 11 Years | 0 (0.0%) | 14 (21.5%) |
| 12 to 14 Years | 5 (8.6%) | 0 (0.0%) |
| 15 Years | 0 (0.0%) | 0 (0.0%) |
| 16 and 17 Years | 0 (0.0%) | 0 (0.0%) |
| 18 to 24 Years | 5 (7.6%) | 23 (50.0%) |
| 25 to 34 Years | 16 (16.7%) | 5 (4.9%) |
| 35 to 44 Years | 0 (0.0%) | 28 (17.3%) |
| 45 to 54 Years | 3 (4.2%) | 13 (14.8%) |
| 55 to 64 Years | 13 (11.2%) | 9 (6.0%) |
| 65 to 74 Years | 16 (15.4%) | 12 (19.7%) |
| 75 Years and over | 0 (0.0%) | 37 (41.6%) |
| Total | 68 (9.1%) | 155 (17.7%) |
Income Above Poverty by Sex and Age in Watertown
According to the poverty statistics in Watertown, males aged 5 years and females aged 12 to 14 years are the age groups that are most secure financially, with 100.0% of males and 100.0% of females in these age groups living above the poverty line.
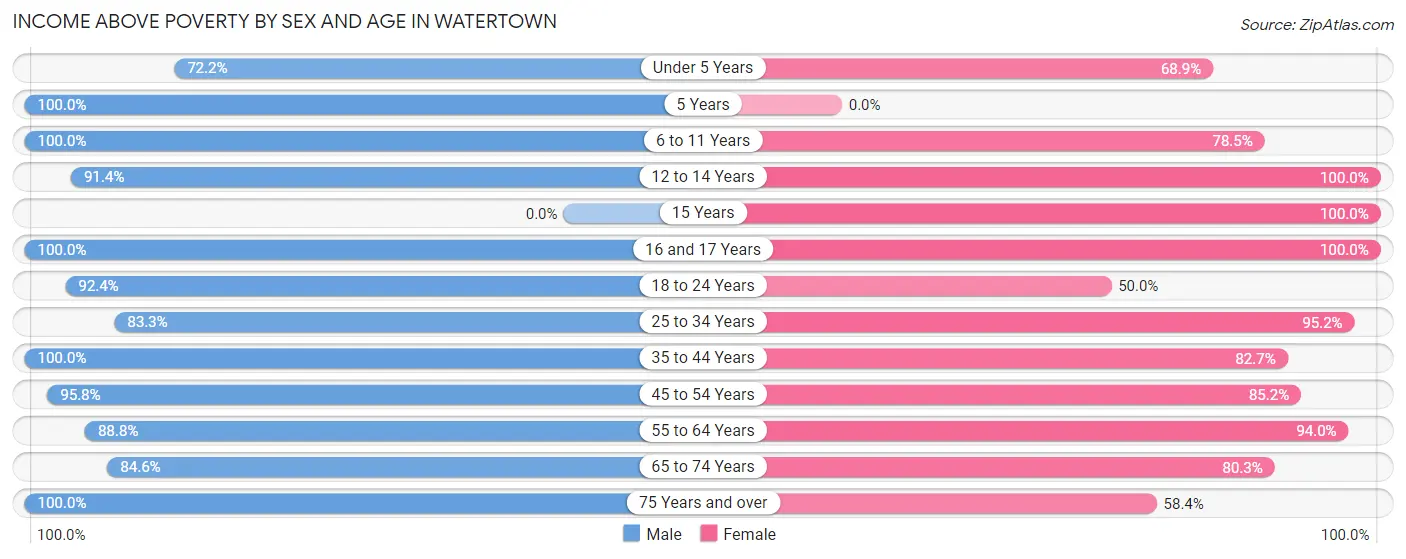
| Age Bracket | Male | Female |
| Under 5 Years | 26 (72.2%) | 31 (68.9%) |
| 5 Years | 14 (100.0%) | 0 (0.0%) |
| 6 to 11 Years | 83 (100.0%) | 51 (78.5%) |
| 12 to 14 Years | 53 (91.4%) | 32 (100.0%) |
| 15 Years | 0 (0.0%) | 1 (100.0%) |
| 16 and 17 Years | 5 (100.0%) | 31 (100.0%) |
| 18 to 24 Years | 61 (92.4%) | 23 (50.0%) |
| 25 to 34 Years | 80 (83.3%) | 98 (95.2%) |
| 35 to 44 Years | 74 (100.0%) | 134 (82.7%) |
| 45 to 54 Years | 68 (95.8%) | 75 (85.2%) |
| 55 to 64 Years | 103 (88.8%) | 142 (94.0%) |
| 65 to 74 Years | 88 (84.6%) | 49 (80.3%) |
| 75 Years and over | 21 (100.0%) | 52 (58.4%) |
| Total | 676 (90.9%) | 719 (82.3%) |
Income Below Poverty Among Married-Couple Families in Watertown
The poverty statistics for married-couple families in Watertown show that 5.4% or 17 of the total 315 families live below the poverty line. Families with no children have the highest poverty rate of 7.0%, comprising of 13 families. On the other hand, families with 3 or 4 children have the lowest poverty rate of 0.0%, which includes 0 families.
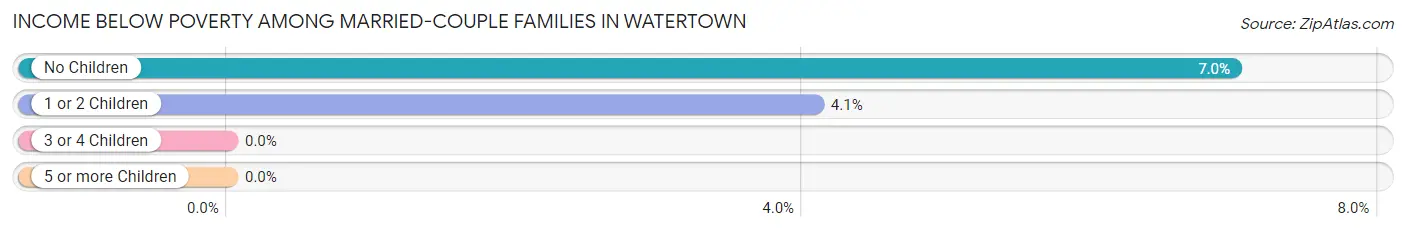
| Children | Above Poverty | Below Poverty |
| No Children | 173 (93.0%) | 13 (7.0%) |
| 1 or 2 Children | 94 (95.9%) | 4 (4.1%) |
| 3 or 4 Children | 31 (100.0%) | 0 (0.0%) |
| 5 or more Children | 0 (0.0%) | 0 (0.0%) |
| Total | 298 (94.6%) | 17 (5.4%) |
Income Below Poverty Among Single-Parent Households in Watertown
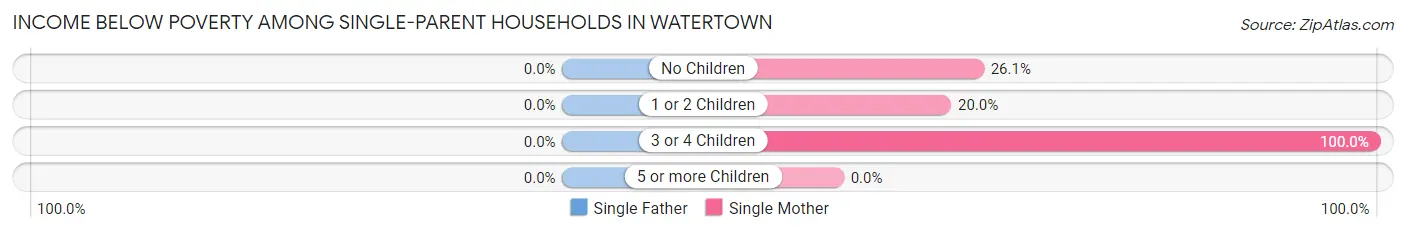
| Children | Single Father | Single Mother |
| No Children | 0 (0.0%) | 12 (26.1%) |
| 1 or 2 Children | 0 (0.0%) | 17 (20.0%) |
| 3 or 4 Children | 0 (0.0%) | 5 (100.0%) |
| 5 or more Children | 0 (0.0%) | 0 (0.0%) |
| Total | 0 (0.0%) | 34 (25.0%) |
Income Below Poverty Among Married-Couple vs Single-Parent Households in Watertown
The poverty data for Watertown shows that 17 of the married-couple family households (5.4%) and 34 of the single-parent households (22.2%) are living below the poverty level. Within the married-couple family households, those with no children have the highest poverty rate, with 13 households (7.0%) falling below the poverty line. Among the single-parent households, those with 3 or 4 children have the highest poverty rate, with 5 household (100.0%) living below poverty.
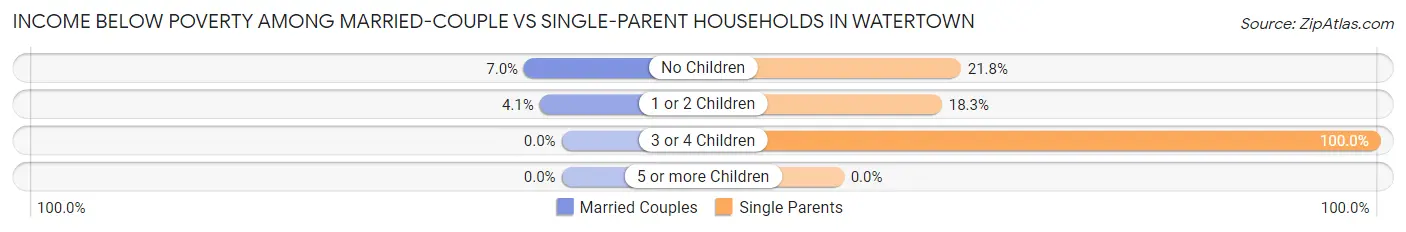
| Children | Married-Couple Families | Single-Parent Households |
| No Children | 13 (7.0%) | 12 (21.8%) |
| 1 or 2 Children | 4 (4.1%) | 17 (18.3%) |
| 3 or 4 Children | 0 (0.0%) | 5 (100.0%) |
| 5 or more Children | 0 (0.0%) | 0 (0.0%) |
| Total | 17 (5.4%) | 34 (22.2%) |
Race in Watertown
The most populous races in Watertown are White / Caucasian (1,339 | 81.8%), Black / African American (131 | 8.0%), and Some other Race (100 | 6.1%).
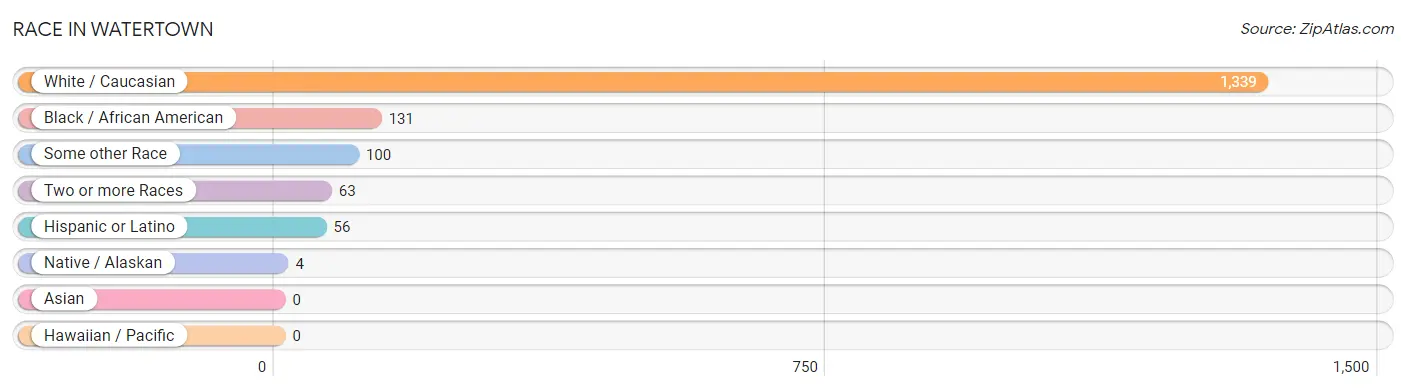
| Race | # Population | % Population |
| Asian | 0 | 0.0% |
| Black / African American | 131 | 8.0% |
| Hawaiian / Pacific | 0 | 0.0% |
| Hispanic or Latino | 56 | 3.4% |
| Native / Alaskan | 4 | 0.2% |
| White / Caucasian | 1,339 | 81.8% |
| Two or more Races | 63 | 3.8% |
| Some other Race | 100 | 6.1% |
| Total | 1,637 | 100.0% |
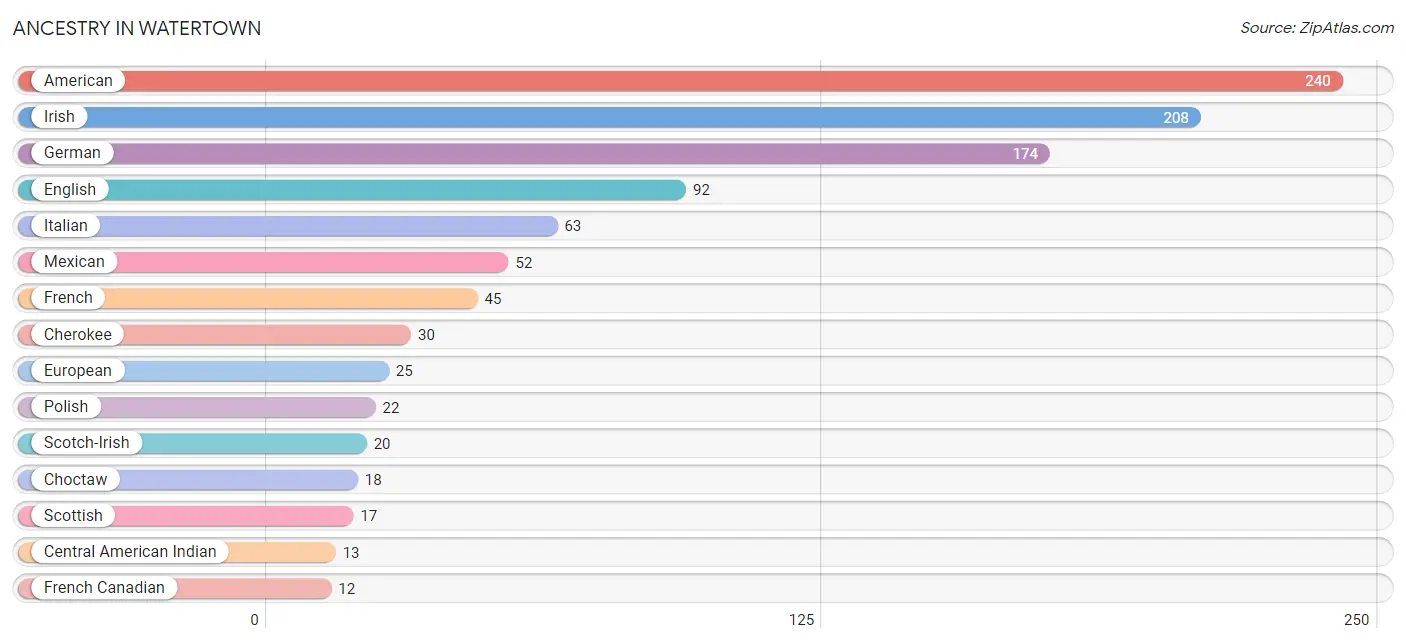
Ancestry in Watertown
The most populous ancestries reported in Watertown are American (240 | 14.7%), Irish (208 | 12.7%), German (174 | 10.6%), English (92 | 5.6%), and Italian (63 | 3.8%), together accounting for 47.5% of all Watertown residents.
| Ancestry | # Population | % Population |
| African | 4 | 0.2% |
| American | 240 | 14.7% |
| Central American Indian | 13 | 0.8% |
| Cherokee | 30 | 1.8% |
| Choctaw | 18 | 1.1% |
| Cuban | 4 | 0.2% |
| Danish | 11 | 0.7% |
| Dutch | 5 | 0.3% |
| English | 92 | 5.6% |
| European | 25 | 1.5% |
| French | 45 | 2.8% |
| French Canadian | 12 | 0.7% |
| German | 174 | 10.6% |
| Irish | 208 | 12.7% |
| Iroquois | 6 | 0.4% |
| Italian | 63 | 3.8% |
| Mexican | 52 | 3.2% |
| Norwegian | 10 | 0.6% |
| Polish | 22 | 1.3% |
| Scandinavian | 5 | 0.3% |
| Scotch-Irish | 20 | 1.2% |
| Scottish | 17 | 1.0% |
| Subsaharan African | 4 | 0.2% |
| Swedish | 3 | 0.2% |
| Welsh | 9 | 0.5% | View All 25 Rows |
Immigrants in Watertown
The most numerous immigrant groups reported in Watertown came from Latin America (26 | 1.6%), Central America (23 | 1.4%), Mexico (23 | 1.4%), Caribbean (3 | 0.2%), and Cuba (3 | 0.2%), together accounting for 4.8% of all Watertown residents.
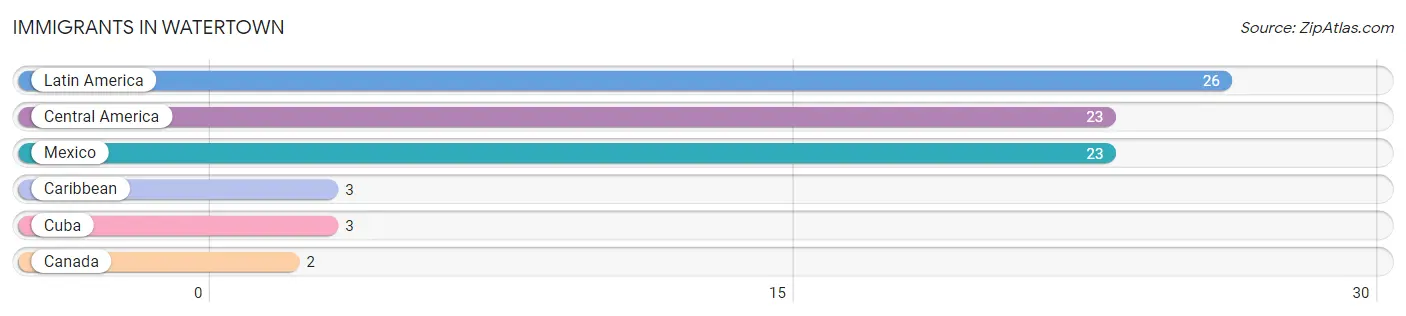
| Immigration Origin | # Population | % Population |
| Canada | 2 | 0.1% |
| Caribbean | 3 | 0.2% |
| Central America | 23 | 1.4% |
| Cuba | 3 | 0.2% |
| Latin America | 26 | 1.6% |
| Mexico | 23 | 1.4% | View All 6 Rows |
Sex and Age in Watertown
Sex and Age in Watertown
The most populous age groups in Watertown are 10 to 14 Years (99 | 13.0%) for men and 60 to 64 Years (102 | 11.6%) for women.
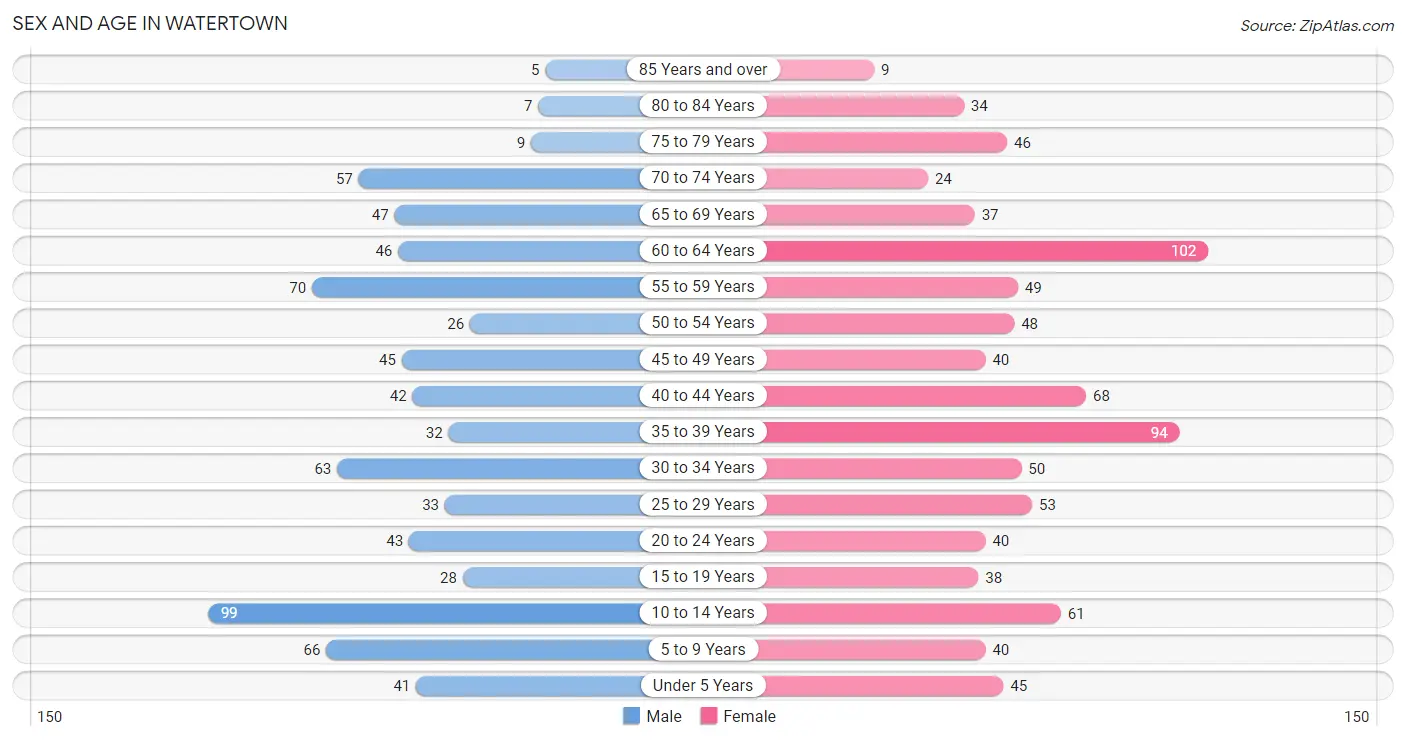
| Age Bracket | Male | Female |
| Under 5 Years | 41 (5.4%) | 45 (5.1%) |
| 5 to 9 Years | 66 (8.7%) | 40 (4.6%) |
| 10 to 14 Years | 99 (13.0%) | 61 (7.0%) |
| 15 to 19 Years | 28 (3.7%) | 38 (4.3%) |
| 20 to 24 Years | 43 (5.7%) | 40 (4.6%) |
| 25 to 29 Years | 33 (4.3%) | 53 (6.0%) |
| 30 to 34 Years | 63 (8.3%) | 50 (5.7%) |
| 35 to 39 Years | 32 (4.2%) | 94 (10.7%) |
| 40 to 44 Years | 42 (5.5%) | 68 (7.7%) |
| 45 to 49 Years | 45 (5.9%) | 40 (4.6%) |
| 50 to 54 Years | 26 (3.4%) | 48 (5.5%) |
| 55 to 59 Years | 70 (9.2%) | 49 (5.6%) |
| 60 to 64 Years | 46 (6.1%) | 102 (11.6%) |
| 65 to 69 Years | 47 (6.2%) | 37 (4.2%) |
| 70 to 74 Years | 57 (7.5%) | 24 (2.7%) |
| 75 to 79 Years | 9 (1.2%) | 46 (5.2%) |
| 80 to 84 Years | 7 (0.9%) | 34 (3.9%) |
| 85 Years and over | 5 (0.7%) | 9 (1.0%) |
| Total | 759 (100.0%) | 878 (100.0%) |
Families and Households in Watertown
Median Family Size in Watertown
The median family size in Watertown is 2.97 persons per family, with married-couple families (315 | 67.3%) accounting for the largest median family size of 3.03 persons per family. On the other hand, single male/father families (17 | 3.6%) represent the smallest median family size with 2.24 persons per family.
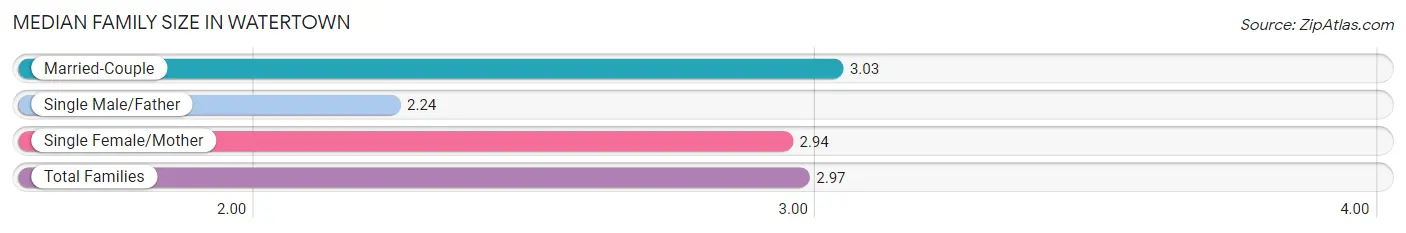
| Family Type | # Families | Family Size |
| Married-Couple | 315 (67.3%) | 3.03 |
| Single Male/Father | 17 (3.6%) | 2.24 |
| Single Female/Mother | 136 (29.1%) | 2.94 |
| Total Families | 468 (100.0%) | 2.97 |
Median Household Size in Watertown
The median household size in Watertown is 2.54 persons per household, with married-couple households (315 | 48.8%) accounting for the largest median household size of 3.07 persons per household. non-family households (177 | 27.4%) represent the smallest median household size with 1.18 persons per household.
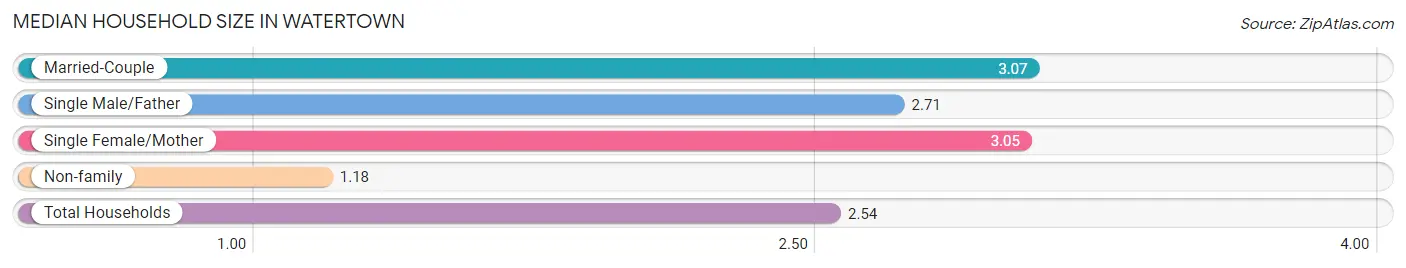
| Household Type | # Households | Household Size |
| Married-Couple | 315 (48.8%) | 3.07 |
| Single Male/Father | 17 (2.6%) | 2.71 |
| Single Female/Mother | 136 (21.1%) | 3.05 |
| Non-family | 177 (27.4%) | 1.18 |
| Total Households | 645 (100.0%) | 2.54 |
Household Size by Marriage Status in Watertown
Out of a total of 645 households in Watertown, 468 (72.6%) are family households, while 177 (27.4%) are nonfamily households. The most numerous type of family households are 2-person households, comprising 247, and the most common type of nonfamily households are 1-person households, comprising 161.
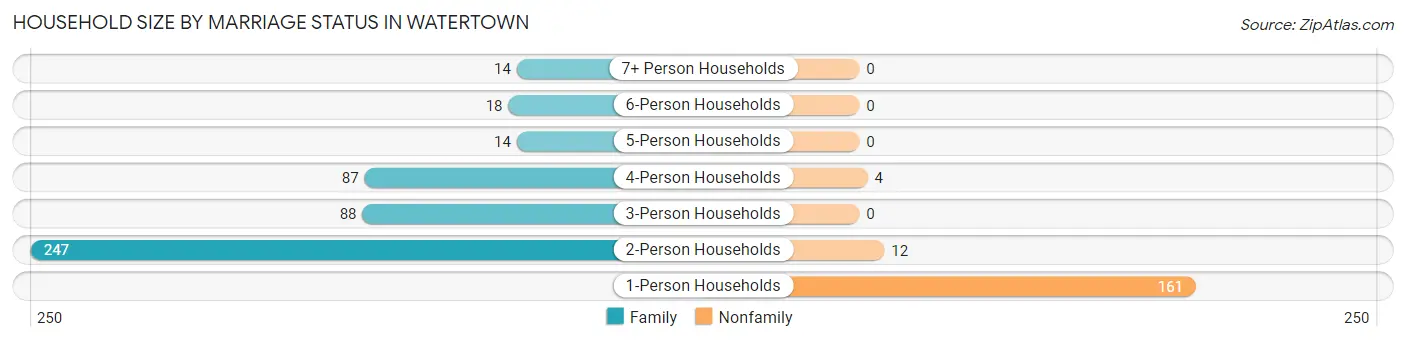
| Household Size | Family Households | Nonfamily Households |
| 1-Person Households | - | 161 (25.0%) |
| 2-Person Households | 247 (38.3%) | 12 (1.9%) |
| 3-Person Households | 88 (13.6%) | 0 (0.0%) |
| 4-Person Households | 87 (13.5%) | 4 (0.6%) |
| 5-Person Households | 14 (2.2%) | 0 (0.0%) |
| 6-Person Households | 18 (2.8%) | 0 (0.0%) |
| 7+ Person Households | 14 (2.2%) | 0 (0.0%) |
| Total | 468 (72.6%) | 177 (27.4%) |
Female Fertility in Watertown
Fertility by Age in Watertown
Average fertility rate in Watertown is 52.0 births per 1,000 women. Women in the age bracket of 20 to 34 years have the highest fertility rate with 140.0 births per 1,000 women. Women in the age bracket of 20 to 34 years acount for 100.0% of all women with births.
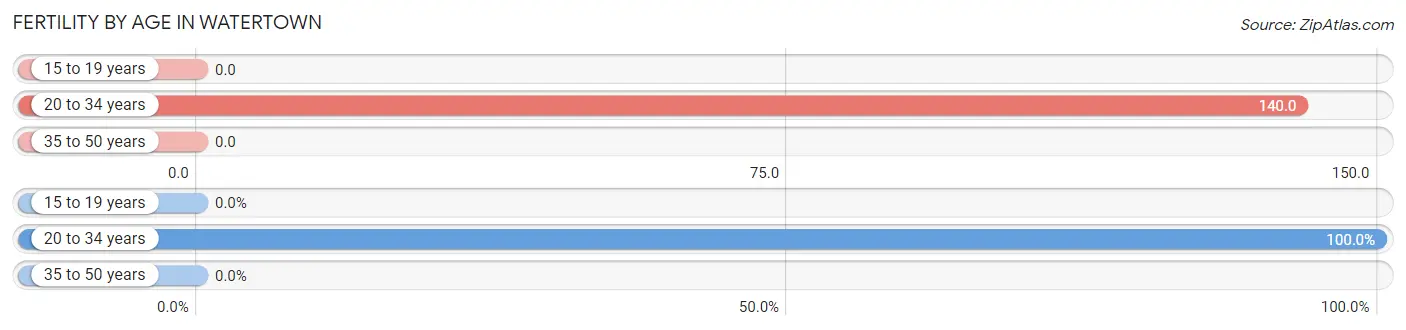
| Age Bracket | Women with Births | Births / 1,000 Women |
| 15 to 19 years | 0 (0.0%) | 0.0 |
| 20 to 34 years | 20 (100.0%) | 140.0 |
| 35 to 50 years | 0 (0.0%) | 0.0 |
| Total | 20 (100.0%) | 52.0 |
Fertility by Age by Marriage Status in Watertown
60.0% of women with births (20) in Watertown are married. The highest percentage of unmarried women with births falls into 20 to 34 years age bracket with 40.0% of them unmarried at the time of birth, while the lowest percentage of unmarried women with births belong to 20 to 34 years age bracket with 40.0% of them unmarried.
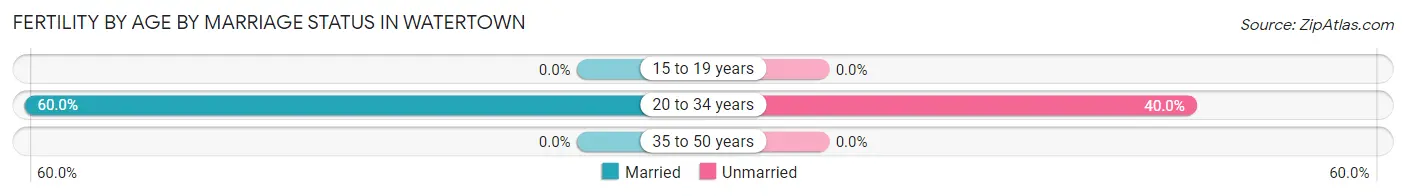
| Age Bracket | Married | Unmarried |
| 15 to 19 years | 0 (0.0%) | 0 (0.0%) |
| 20 to 34 years | 12 (60.0%) | 8 (40.0%) |
| 35 to 50 years | 0 (0.0%) | 0 (0.0%) |
| Total | 12 (60.0%) | 8 (40.0%) |
Fertility by Education in Watertown
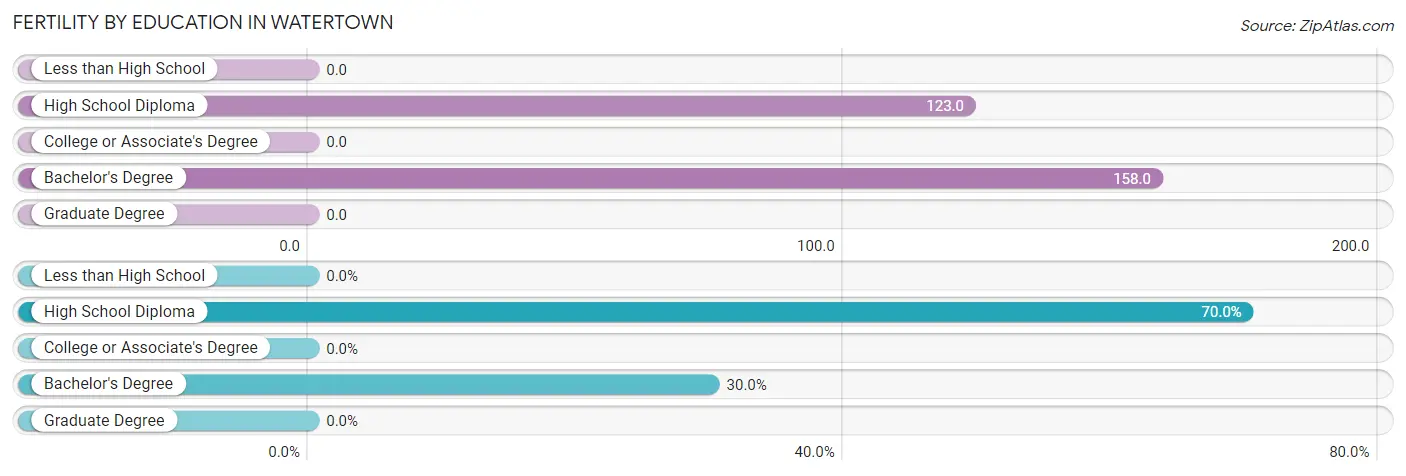
| Educational Attainment | Women with Births | Births / 1,000 Women |
| Less than High School | 0 (0.0%) | 0.0 |
| High School Diploma | 14 (70.0%) | 123.0 |
| College or Associate's Degree | 0 (0.0%) | 0.0 |
| Bachelor's Degree | 6 (30.0%) | 158.0 |
| Graduate Degree | 0 (0.0%) | 0.0 |
| Total | 20 (100.0%) | 52.0 |
Fertility by Education by Marriage Status in Watertown
40.0% of women with births in Watertown are unmarried. Women with the educational attainment of bachelor's degree are most likely to be married with 100.0% of them married at childbirth, while women with the educational attainment of high school diploma are least likely to be married with 57.1% of them unmarried at childbirth.
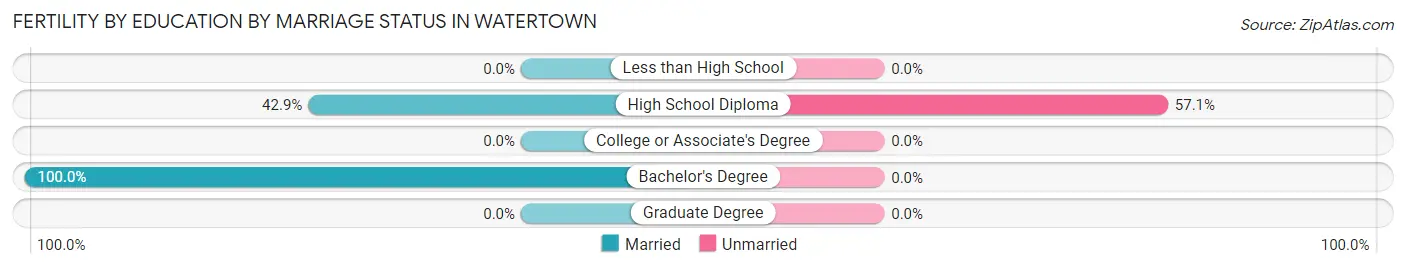
| Educational Attainment | Married | Unmarried |
| Less than High School | 0 (0.0%) | 0 (0.0%) |
| High School Diploma | 6 (42.9%) | 8 (57.1%) |
| College or Associate's Degree | 0 (0.0%) | 0 (0.0%) |
| Bachelor's Degree | 6 (100.0%) | 0 (0.0%) |
| Graduate Degree | 0 (0.0%) | 0 (0.0%) |
| Total | 12 (60.0%) | 8 (40.0%) |
Employment Characteristics in Watertown
Employment by Class of Employer in Watertown
Among the 731 employed individuals in Watertown, private company employees (527 | 72.1%), self-employed (not incorporated) (59 | 8.1%), and not-for-profit organizations (42 | 5.8%) make up the most common classes of employment.
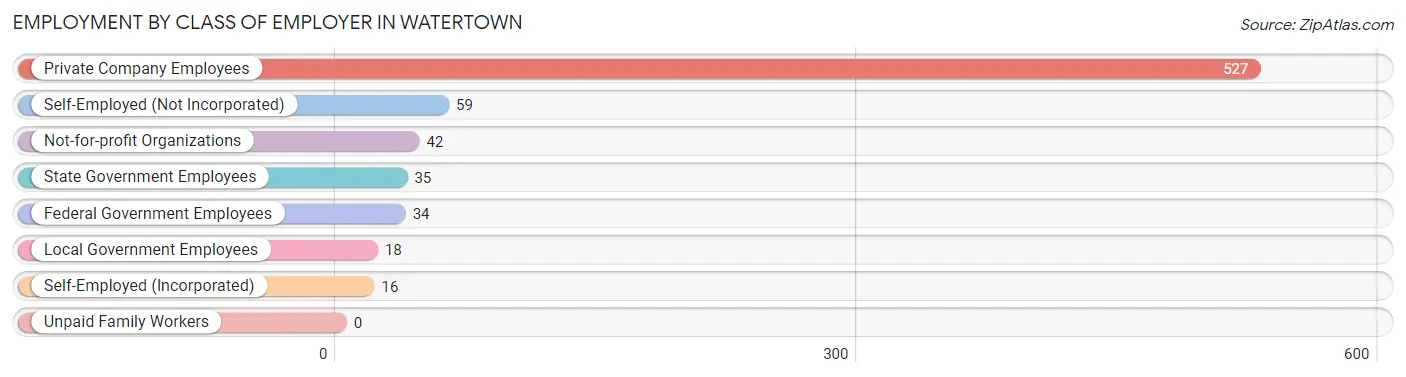
| Employer Class | # Employees | % Employees |
| Private Company Employees | 527 | 72.1% |
| Self-Employed (Incorporated) | 16 | 2.2% |
| Self-Employed (Not Incorporated) | 59 | 8.1% |
| Not-for-profit Organizations | 42 | 5.8% |
| Local Government Employees | 18 | 2.5% |
| State Government Employees | 35 | 4.8% |
| Federal Government Employees | 34 | 4.6% |
| Unpaid Family Workers | 0 | 0.0% |
| Total | 731 | 100.0% |
Employment Status by Age in Watertown
According to the labor force statistics for Watertown, out of the total population over 16 years of age (1,284), 59.0% or 758 individuals are in the labor force, with 2.2% or 17 of them unemployed. The age group with the highest labor force participation rate is 30 to 34 years, with 94.7% or 107 individuals in the labor force. Within the labor force, the 25 to 29 years age range has the highest percentage of unemployed individuals, with 8.2% or 4 of them being unemployed.
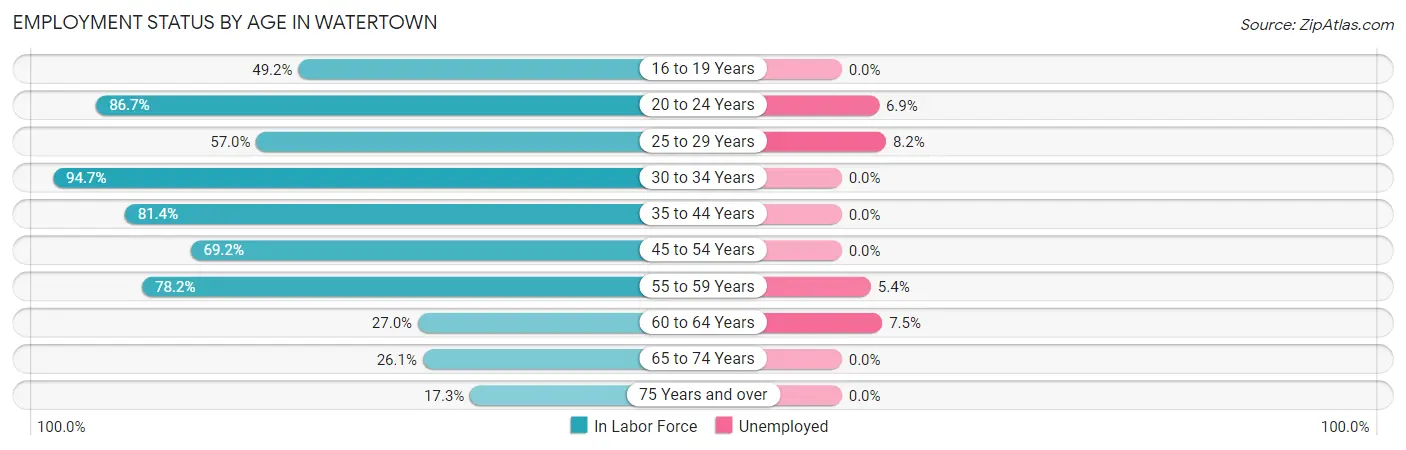
| Age Bracket | In Labor Force | Unemployed |
| 16 to 19 Years | 32 (49.2%) | 0 (0.0%) |
| 20 to 24 Years | 72 (86.7%) | 5 (6.9%) |
| 25 to 29 Years | 49 (57.0%) | 4 (8.2%) |
| 30 to 34 Years | 107 (94.7%) | 0 (0.0%) |
| 35 to 44 Years | 192 (81.4%) | 0 (0.0%) |
| 45 to 54 Years | 110 (69.2%) | 0 (0.0%) |
| 55 to 59 Years | 93 (78.2%) | 5 (5.4%) |
| 60 to 64 Years | 40 (27.0%) | 3 (7.5%) |
| 65 to 74 Years | 43 (26.1%) | 0 (0.0%) |
| 75 Years and over | 19 (17.3%) | 0 (0.0%) |
| Total | 758 (59.0%) | 17 (2.2%) |
Employment Status by Educational Attainment in Watertown
According to labor force statistics for Watertown, 68.6% of individuals (591) out of the total population between 25 and 64 years of age (861) are in the labor force, with 2.0% or 12 of them being unemployed. The group with the highest labor force participation rate are those with the educational attainment of college / associate degree, with 86.5% or 244 individuals in the labor force. Within the labor force, individuals with high school diploma education have the highest percentage of unemployment, with 3.1% or 7 of them being unemployed.
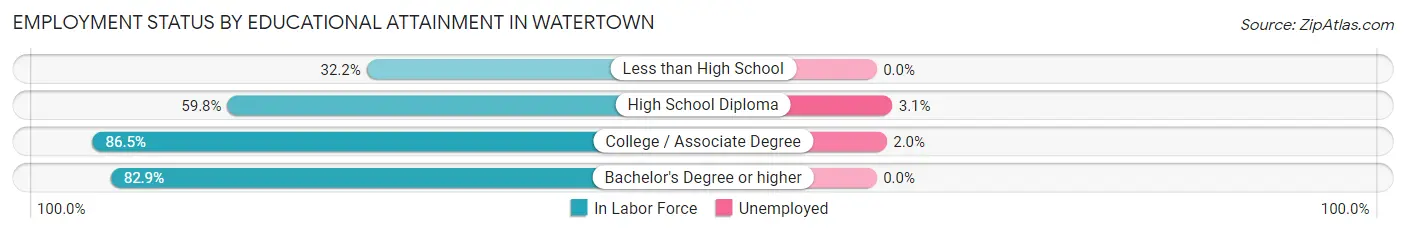
| Educational Attainment | In Labor Force | Unemployed |
| Less than High School | 29 (32.2%) | 0 (0.0%) |
| High School Diploma | 226 (59.8%) | 12 (3.1%) |
| College / Associate Degree | 244 (86.5%) | 6 (2.0%) |
| Bachelor's Degree or higher | 92 (82.9%) | 0 (0.0%) |
| Total | 591 (68.6%) | 17 (2.0%) |
Employment Occupations by Sex in Watertown
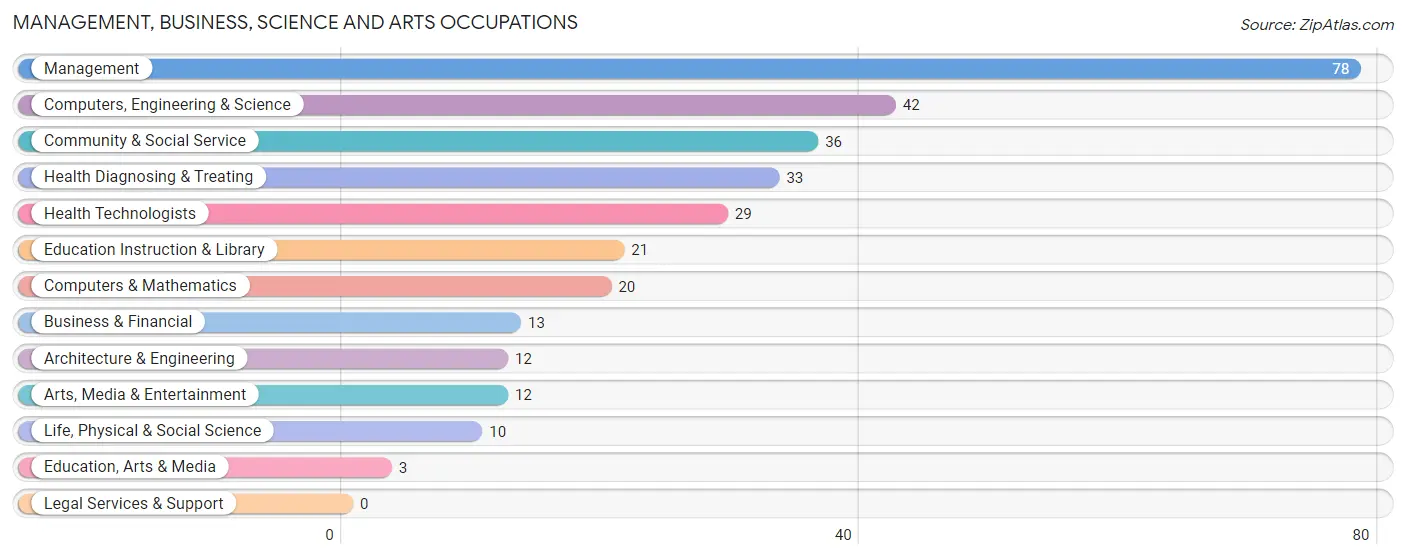
Management, Business, Science and Arts Occupations
The most common Management, Business, Science and Arts occupations in Watertown are Management (78 | 10.5%), Computers, Engineering & Science (42 | 5.7%), Community & Social Service (36 | 4.9%), Health Diagnosing & Treating (33 | 4.5%), and Health Technologists (29 | 3.9%).
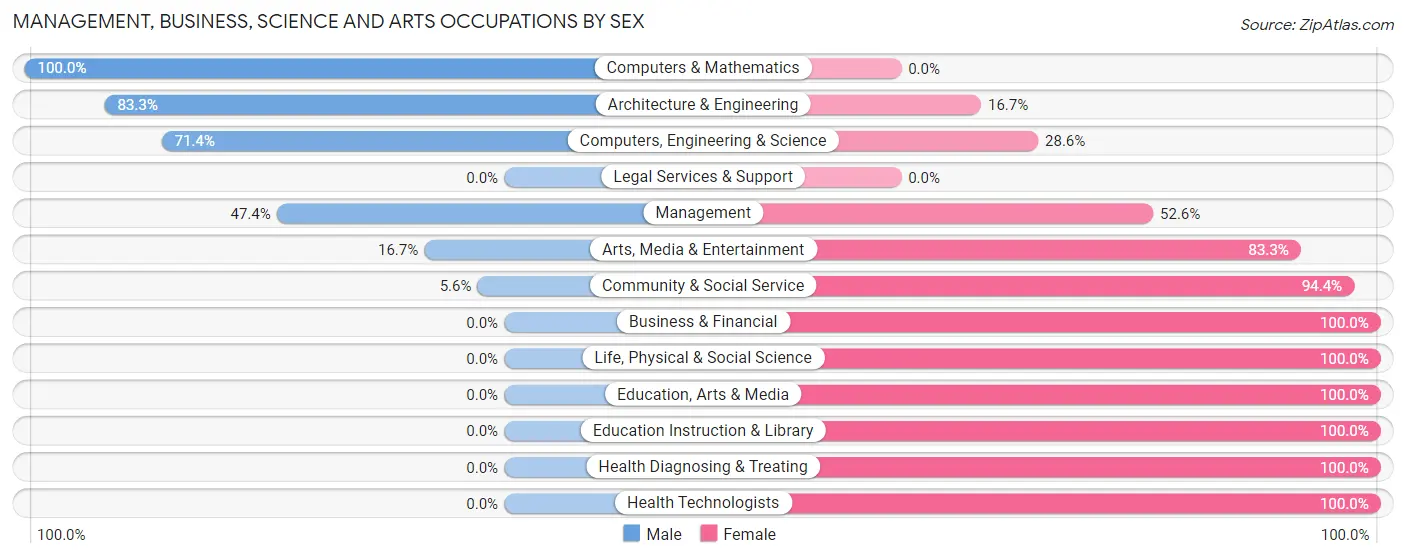
Management, Business, Science and Arts Occupations by Sex
Within the Management, Business, Science and Arts occupations in Watertown, the most male-oriented occupations are Computers & Mathematics (100.0%), Architecture & Engineering (83.3%), and Computers, Engineering & Science (71.4%), while the most female-oriented occupations are Business & Financial (100.0%), Life, Physical & Social Science (100.0%), and Education, Arts & Media (100.0%).
| Occupation | Male | Female |
| Management | 37 (47.4%) | 41 (52.6%) |
| Business & Financial | 0 (0.0%) | 13 (100.0%) |
| Computers, Engineering & Science | 30 (71.4%) | 12 (28.6%) |
| Computers & Mathematics | 20 (100.0%) | 0 (0.0%) |
| Architecture & Engineering | 10 (83.3%) | 2 (16.7%) |
| Life, Physical & Social Science | 0 (0.0%) | 10 (100.0%) |
| Community & Social Service | 2 (5.6%) | 34 (94.4%) |
| Education, Arts & Media | 0 (0.0%) | 3 (100.0%) |
| Legal Services & Support | 0 (0.0%) | 0 (0.0%) |
| Education Instruction & Library | 0 (0.0%) | 21 (100.0%) |
| Arts, Media & Entertainment | 2 (16.7%) | 10 (83.3%) |
| Health Diagnosing & Treating | 0 (0.0%) | 33 (100.0%) |
| Health Technologists | 0 (0.0%) | 29 (100.0%) |
| Total (Category) | 69 (34.2%) | 133 (65.8%) |
| Total (Overall) | 346 (46.8%) | 394 (53.2%) |
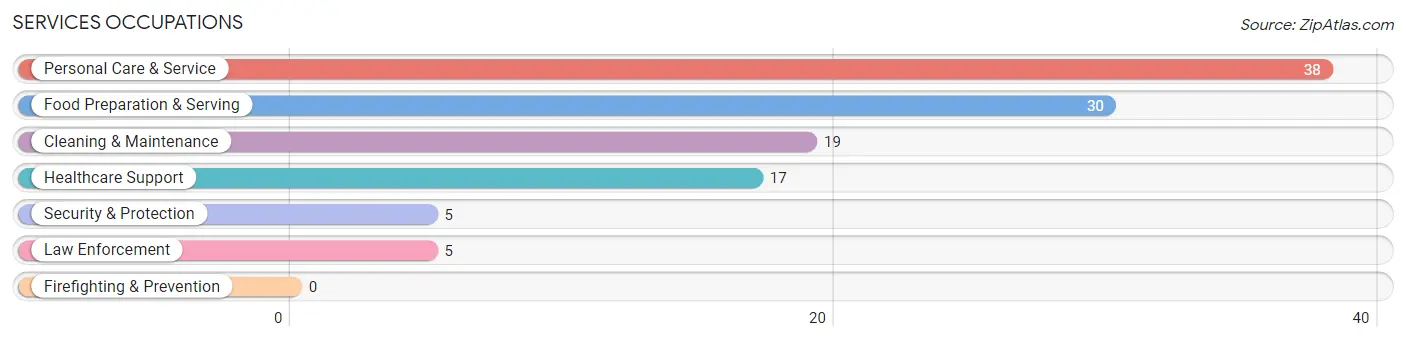
Services Occupations
The most common Services occupations in Watertown are Personal Care & Service (38 | 5.1%), Food Preparation & Serving (30 | 4.1%), Cleaning & Maintenance (19 | 2.6%), Healthcare Support (17 | 2.3%), and Security & Protection (5 | 0.7%).
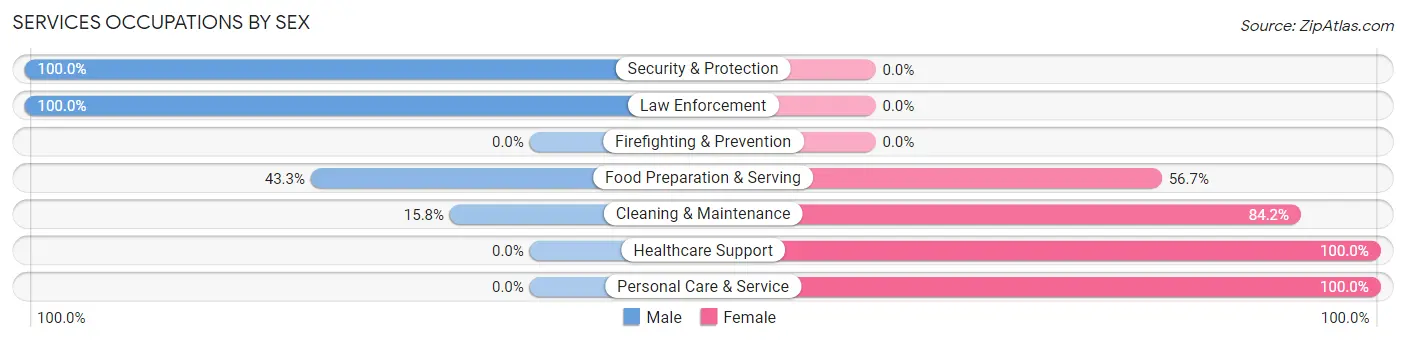
Services Occupations by Sex
Within the Services occupations in Watertown, the most male-oriented occupations are Security & Protection (100.0%), Law Enforcement (100.0%), and Food Preparation & Serving (43.3%), while the most female-oriented occupations are Healthcare Support (100.0%), Personal Care & Service (100.0%), and Cleaning & Maintenance (84.2%).
| Occupation | Male | Female |
| Healthcare Support | 0 (0.0%) | 17 (100.0%) |
| Security & Protection | 5 (100.0%) | 0 (0.0%) |
| Firefighting & Prevention | 0 (0.0%) | 0 (0.0%) |
| Law Enforcement | 5 (100.0%) | 0 (0.0%) |
| Food Preparation & Serving | 13 (43.3%) | 17 (56.7%) |
| Cleaning & Maintenance | 3 (15.8%) | 16 (84.2%) |
| Personal Care & Service | 0 (0.0%) | 38 (100.0%) |
| Total (Category) | 21 (19.3%) | 88 (80.7%) |
| Total (Overall) | 346 (46.8%) | 394 (53.2%) |
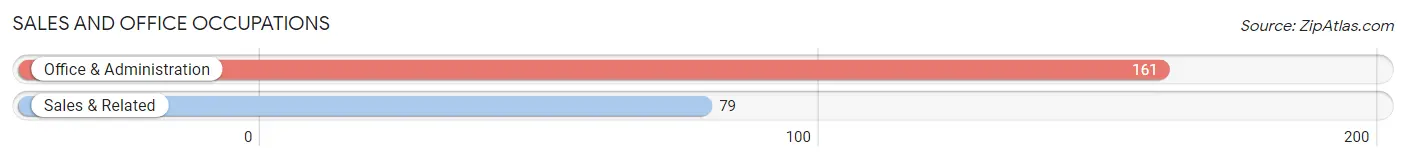
Sales and Office Occupations
The most common Sales and Office occupations in Watertown are Office & Administration (161 | 21.8%), and Sales & Related (79 | 10.7%).
Sales and Office Occupations by Sex
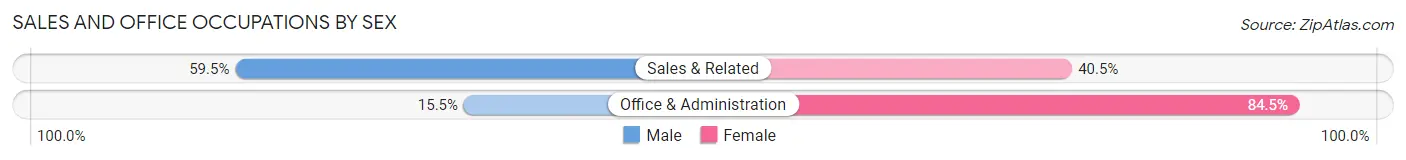
| Occupation | Male | Female |
| Sales & Related | 47 (59.5%) | 32 (40.5%) |
| Office & Administration | 25 (15.5%) | 136 (84.5%) |
| Total (Category) | 72 (30.0%) | 168 (70.0%) |
| Total (Overall) | 346 (46.8%) | 394 (53.2%) |
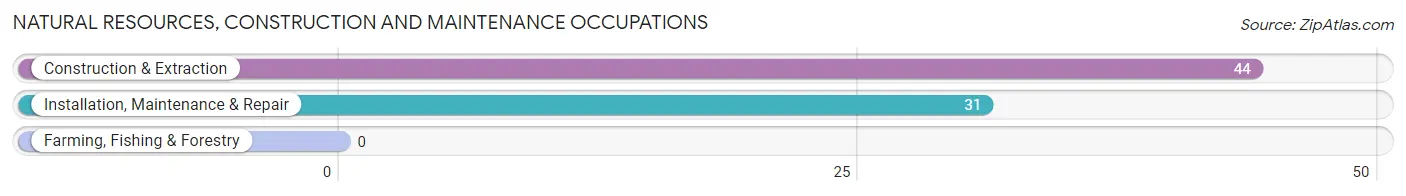
Natural Resources, Construction and Maintenance Occupations
The most common Natural Resources, Construction and Maintenance occupations in Watertown are Construction & Extraction (44 | 5.9%), and Installation, Maintenance & Repair (31 | 4.2%).
Natural Resources, Construction and Maintenance Occupations by Sex
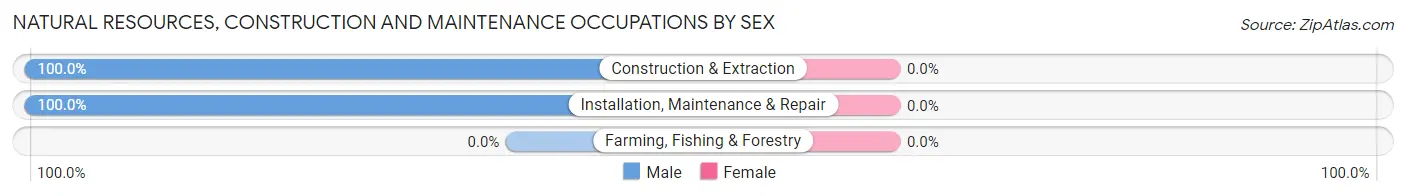
| Occupation | Male | Female |
| Farming, Fishing & Forestry | 0 (0.0%) | 0 (0.0%) |
| Construction & Extraction | 44 (100.0%) | 0 (0.0%) |
| Installation, Maintenance & Repair | 31 (100.0%) | 0 (0.0%) |
| Total (Category) | 75 (100.0%) | 0 (0.0%) |
| Total (Overall) | 346 (46.8%) | 394 (53.2%) |
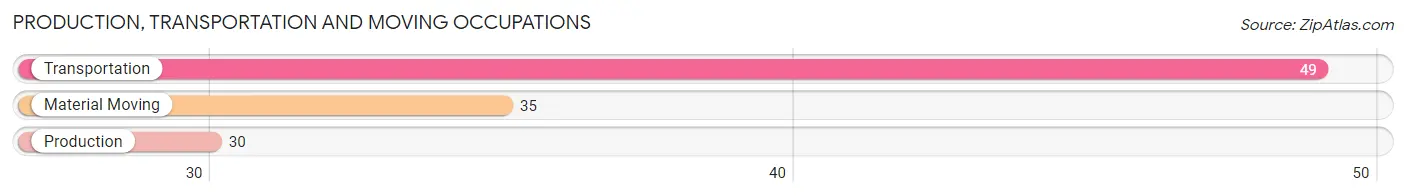
Production, Transportation and Moving Occupations
The most common Production, Transportation and Moving occupations in Watertown are Transportation (49 | 6.6%), Material Moving (35 | 4.7%), and Production (30 | 4.1%).
Production, Transportation and Moving Occupations by Sex
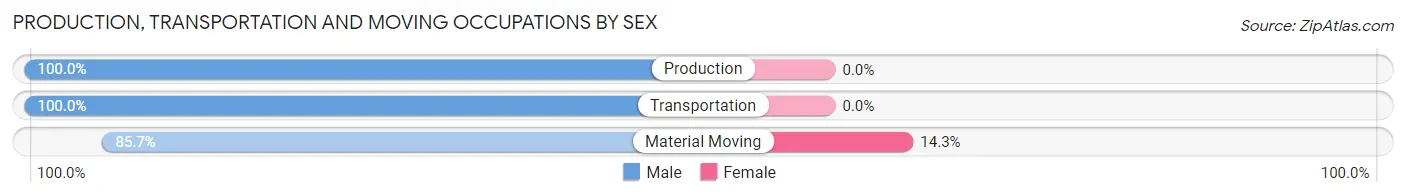
| Occupation | Male | Female |
| Production | 30 (100.0%) | 0 (0.0%) |
| Transportation | 49 (100.0%) | 0 (0.0%) |
| Material Moving | 30 (85.7%) | 5 (14.3%) |
| Total (Category) | 109 (95.6%) | 5 (4.4%) |
| Total (Overall) | 346 (46.8%) | 394 (53.2%) |
Employment Industries by Sex in Watertown
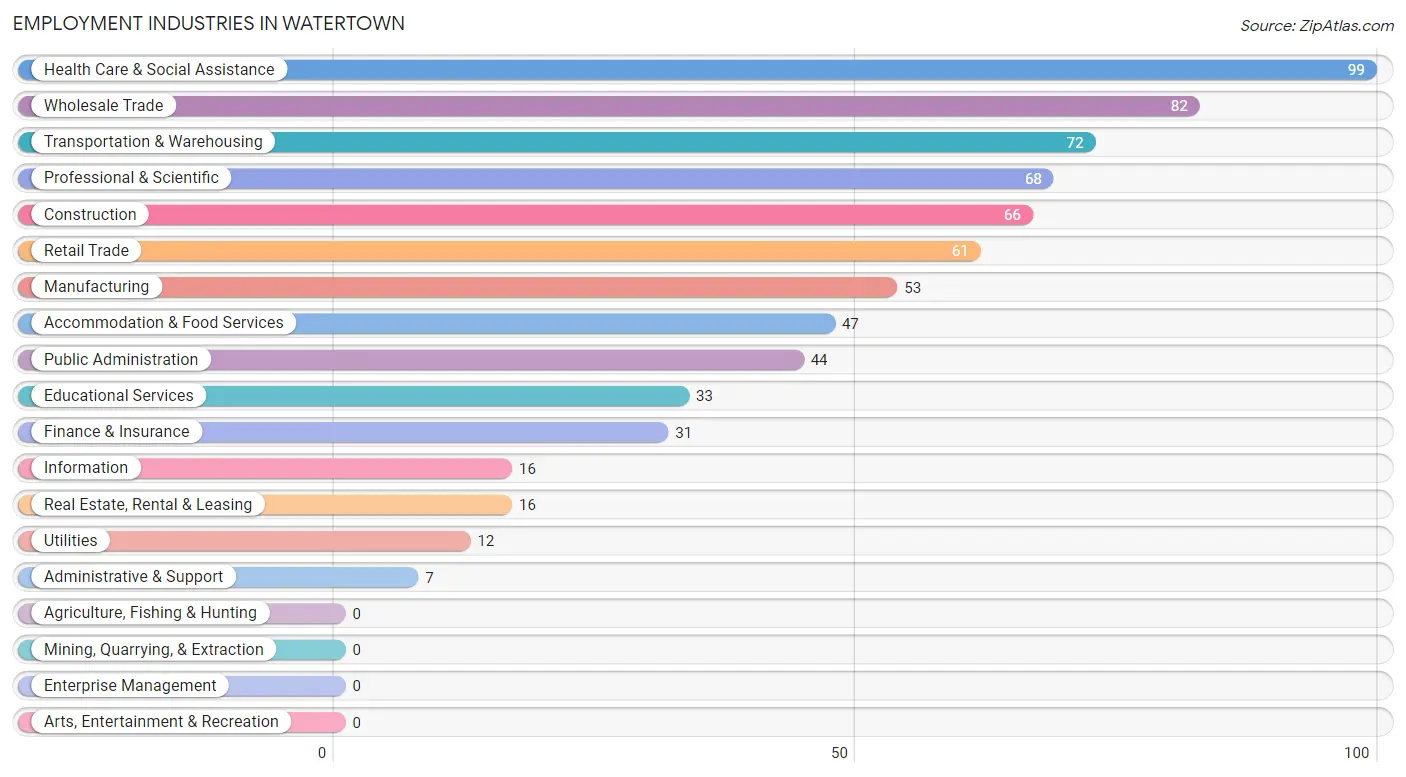
Employment Industries in Watertown
The major employment industries in Watertown include Health Care & Social Assistance (99 | 13.4%), Wholesale Trade (82 | 11.1%), Transportation & Warehousing (72 | 9.7%), Professional & Scientific (68 | 9.2%), and Construction (66 | 8.9%).
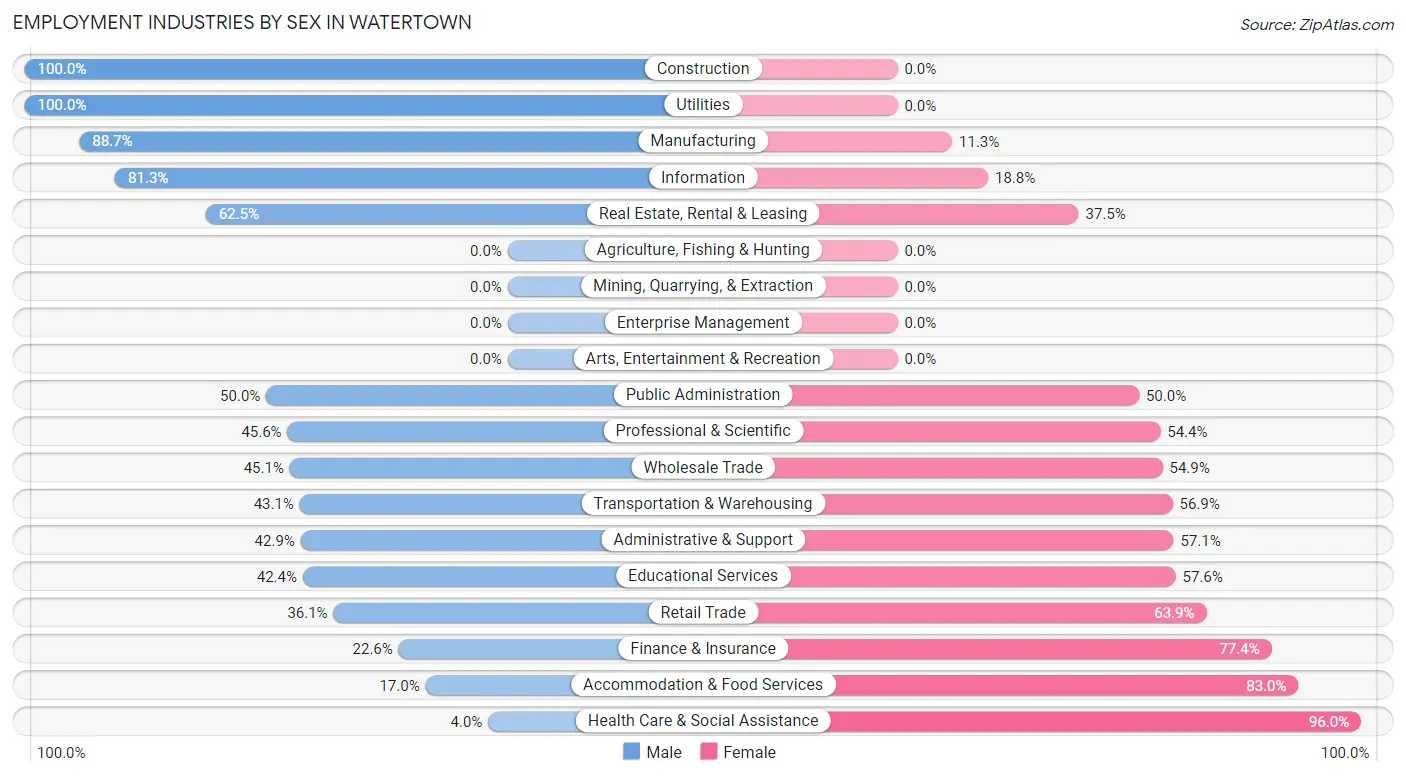
Employment Industries by Sex in Watertown
The Watertown industries that see more men than women are Construction (100.0%), Utilities (100.0%), and Manufacturing (88.7%), whereas the industries that tend to have a higher number of women are Health Care & Social Assistance (96.0%), Accommodation & Food Services (83.0%), and Finance & Insurance (77.4%).
| Industry | Male | Female |
| Agriculture, Fishing & Hunting | 0 (0.0%) | 0 (0.0%) |
| Mining, Quarrying, & Extraction | 0 (0.0%) | 0 (0.0%) |
| Construction | 66 (100.0%) | 0 (0.0%) |
| Manufacturing | 47 (88.7%) | 6 (11.3%) |
| Wholesale Trade | 37 (45.1%) | 45 (54.9%) |
| Retail Trade | 22 (36.1%) | 39 (63.9%) |
| Transportation & Warehousing | 31 (43.1%) | 41 (56.9%) |
| Utilities | 12 (100.0%) | 0 (0.0%) |
| Information | 13 (81.2%) | 3 (18.8%) |
| Finance & Insurance | 7 (22.6%) | 24 (77.4%) |
| Real Estate, Rental & Leasing | 10 (62.5%) | 6 (37.5%) |
| Professional & Scientific | 31 (45.6%) | 37 (54.4%) |
| Enterprise Management | 0 (0.0%) | 0 (0.0%) |
| Administrative & Support | 3 (42.9%) | 4 (57.1%) |
| Educational Services | 14 (42.4%) | 19 (57.6%) |
| Health Care & Social Assistance | 4 (4.0%) | 95 (96.0%) |
| Arts, Entertainment & Recreation | 0 (0.0%) | 0 (0.0%) |
| Accommodation & Food Services | 8 (17.0%) | 39 (83.0%) |
| Public Administration | 22 (50.0%) | 22 (50.0%) |
| Total | 346 (46.8%) | 394 (53.2%) |
Education in Watertown
School Enrollment in Watertown
The most common levels of schooling among the 387 students in Watertown are middle school (131 | 33.9%), elementary school (109 | 28.2%), and college / undergraduate (65 | 16.8%).
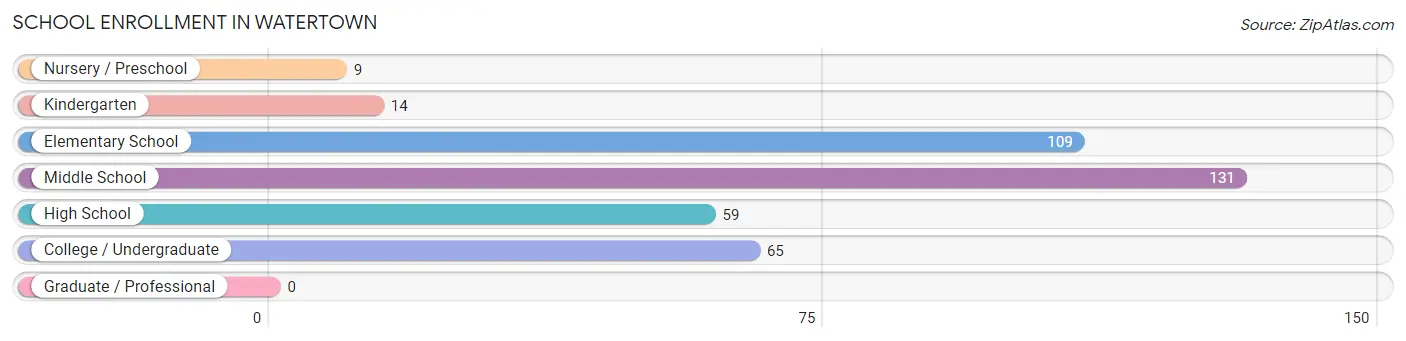
| School Level | # Students | % Students |
| Nursery / Preschool | 9 | 2.3% |
| Kindergarten | 14 | 3.6% |
| Elementary School | 109 | 28.2% |
| Middle School | 131 | 33.9% |
| High School | 59 | 15.2% |
| College / Undergraduate | 65 | 16.8% |
| Graduate / Professional | 0 | 0.0% |
| Total | 387 | 100.0% |
School Enrollment by Age by Funding Source in Watertown
Out of a total of 387 students who are enrolled in schools in Watertown, 36 (9.3%) attend a private institution, while the remaining 351 (90.7%) are enrolled in public schools. The age group of 20 to 24 year olds has the highest likelihood of being enrolled in private schools, with 7 (63.6% in the age bracket) enrolled. Conversely, the age group of 5 to 9 year old has the lowest likelihood of being enrolled in a private school, with 102 (100.0% in the age bracket) attending a public institution.
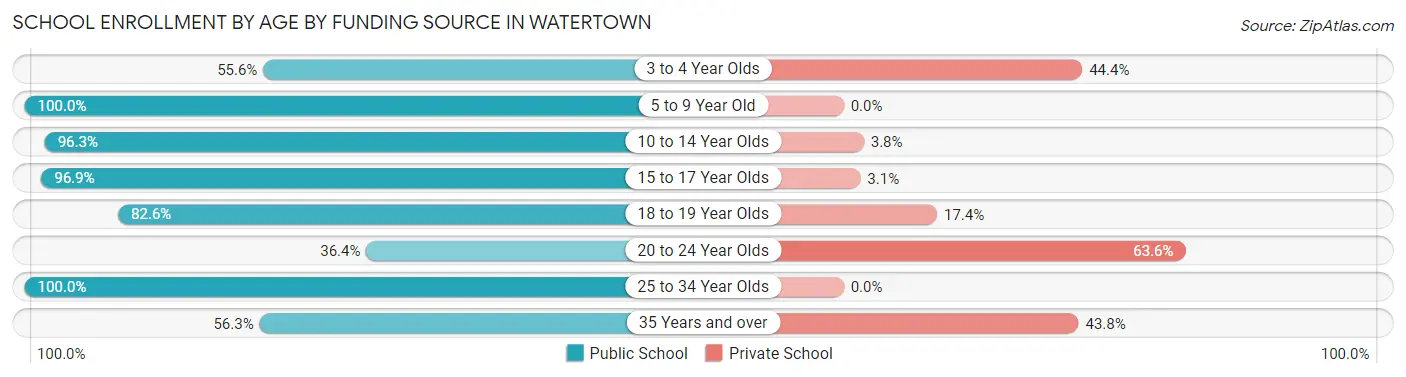
| Age Bracket | Public School | Private School |
| 3 to 4 Year Olds | 5 (55.6%) | 4 (44.4%) |
| 5 to 9 Year Old | 102 (100.0%) | 0 (0.0%) |
| 10 to 14 Year Olds | 154 (96.3%) | 6 (3.7%) |
| 15 to 17 Year Olds | 31 (96.9%) | 1 (3.1%) |
| 18 to 19 Year Olds | 19 (82.6%) | 4 (17.4%) |
| 20 to 24 Year Olds | 4 (36.4%) | 7 (63.6%) |
| 25 to 34 Year Olds | 18 (100.0%) | 0 (0.0%) |
| 35 Years and over | 18 (56.2%) | 14 (43.8%) |
| Total | 351 (90.7%) | 36 (9.3%) |
Educational Attainment by Field of Study in Watertown
Business (40 | 23.3%), education (26 | 15.1%), arts & humanities (26 | 15.1%), science & technology (21 | 12.2%), and bio, nature & agricultural (17 | 9.9%) are the most common fields of study among 172 individuals in Watertown who have obtained a bachelor's degree or higher.
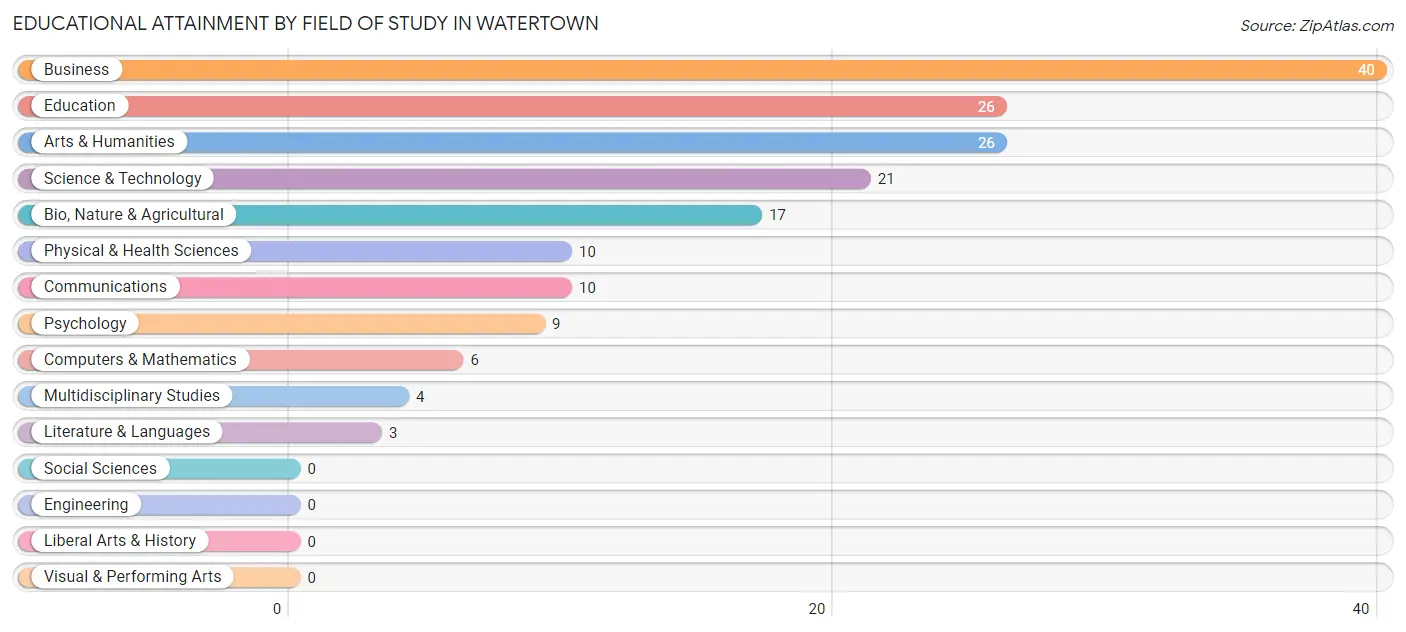
| Field of Study | # Graduates | % Graduates |
| Computers & Mathematics | 6 | 3.5% |
| Bio, Nature & Agricultural | 17 | 9.9% |
| Physical & Health Sciences | 10 | 5.8% |
| Psychology | 9 | 5.2% |
| Social Sciences | 0 | 0.0% |
| Engineering | 0 | 0.0% |
| Multidisciplinary Studies | 4 | 2.3% |
| Science & Technology | 21 | 12.2% |
| Business | 40 | 23.3% |
| Education | 26 | 15.1% |
| Literature & Languages | 3 | 1.7% |
| Liberal Arts & History | 0 | 0.0% |
| Visual & Performing Arts | 0 | 0.0% |
| Communications | 10 | 5.8% |
| Arts & Humanities | 26 | 15.1% |
| Total | 172 | 100.0% |
Transportation & Commute in Watertown
Vehicle Availability by Sex in Watertown
The most prevalent vehicle ownership categories in Watertown are males with 2 vehicles (184, accounting for 53.2%) and females with 2 vehicles (174, making up 47.8%).
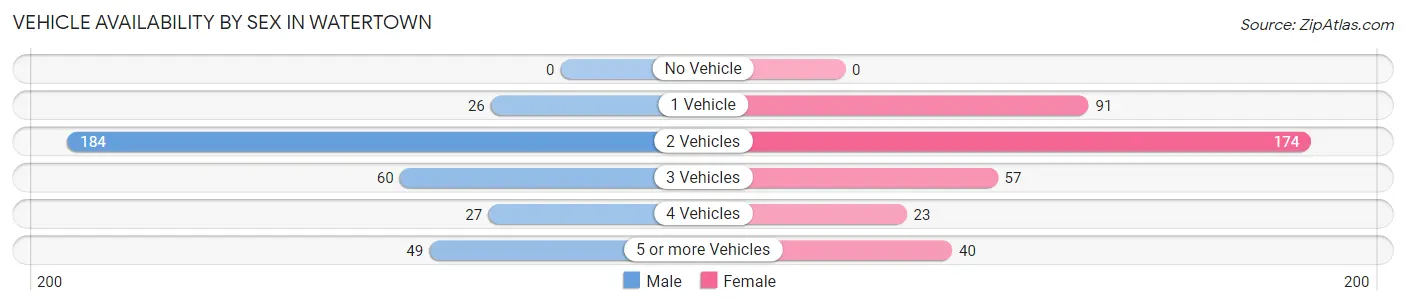
| Vehicles Available | Male | Female |
| No Vehicle | 0 (0.0%) | 0 (0.0%) |
| 1 Vehicle | 26 (7.5%) | 91 (23.6%) |
| 2 Vehicles | 184 (53.2%) | 174 (45.2%) |
| 3 Vehicles | 60 (17.3%) | 57 (14.8%) |
| 4 Vehicles | 27 (7.8%) | 23 (6.0%) |
| 5 or more Vehicles | 49 (14.2%) | 40 (10.4%) |
| Total | 346 (100.0%) | 385 (100.0%) |
Commute Time in Watertown
The most frequently occuring commute durations in Watertown are 30 to 34 minutes (157 commuters, 24.0%), 45 to 59 minutes (105 commuters, 16.0%), and 15 to 19 minutes (86 commuters, 13.1%).
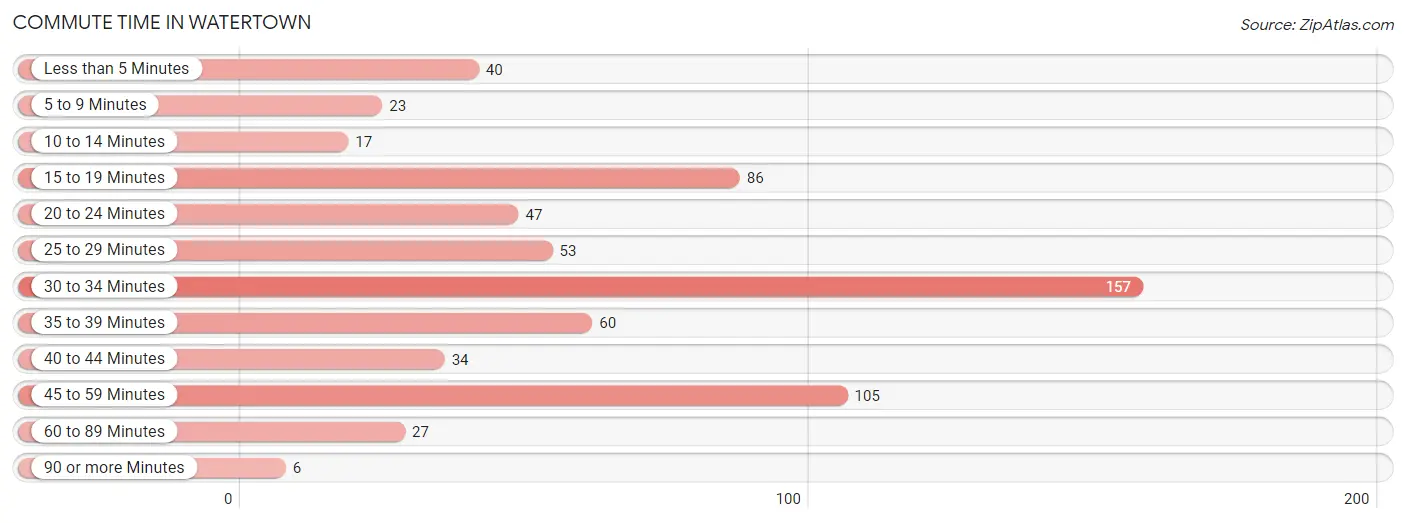
| Commute Time | # Commuters | % Commuters |
| Less than 5 Minutes | 40 | 6.1% |
| 5 to 9 Minutes | 23 | 3.5% |
| 10 to 14 Minutes | 17 | 2.6% |
| 15 to 19 Minutes | 86 | 13.1% |
| 20 to 24 Minutes | 47 | 7.2% |
| 25 to 29 Minutes | 53 | 8.1% |
| 30 to 34 Minutes | 157 | 24.0% |
| 35 to 39 Minutes | 60 | 9.2% |
| 40 to 44 Minutes | 34 | 5.2% |
| 45 to 59 Minutes | 105 | 16.0% |
| 60 to 89 Minutes | 27 | 4.1% |
| 90 or more Minutes | 6 | 0.9% |
Commute Time by Sex in Watertown
The most common commute times in Watertown are 45 to 59 minutes (74 commuters, 23.1%) for males and 30 to 34 minutes (84 commuters, 25.1%) for females.
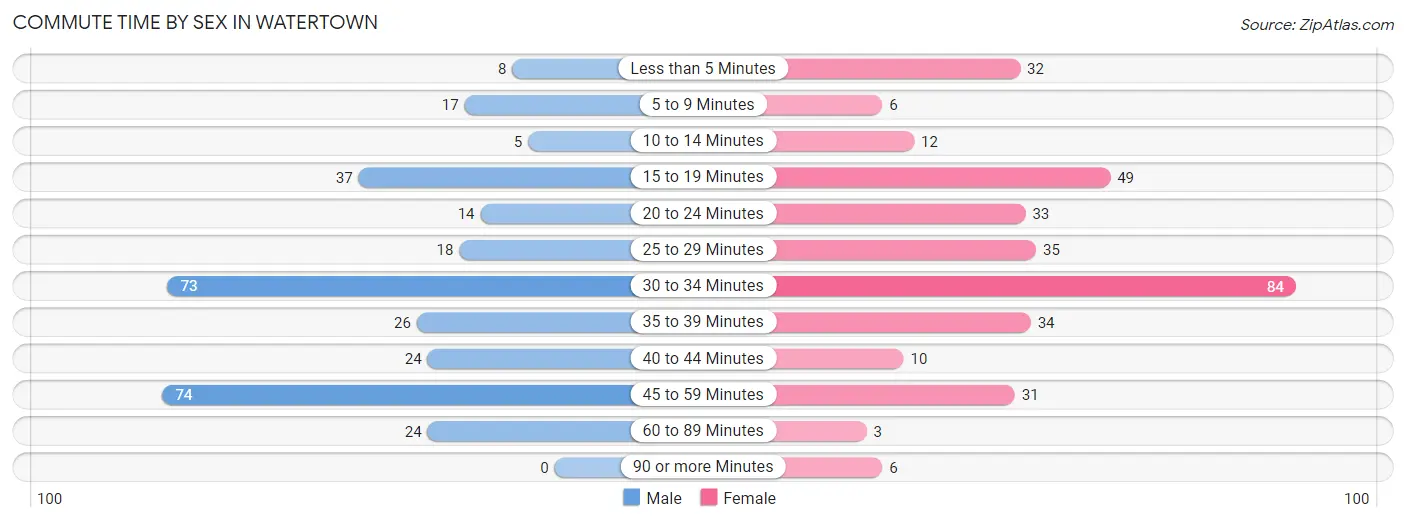
| Commute Time | Male | Female |
| Less than 5 Minutes | 8 (2.5%) | 32 (9.6%) |
| 5 to 9 Minutes | 17 (5.3%) | 6 (1.8%) |
| 10 to 14 Minutes | 5 (1.6%) | 12 (3.6%) |
| 15 to 19 Minutes | 37 (11.6%) | 49 (14.6%) |
| 20 to 24 Minutes | 14 (4.4%) | 33 (9.9%) |
| 25 to 29 Minutes | 18 (5.6%) | 35 (10.4%) |
| 30 to 34 Minutes | 73 (22.8%) | 84 (25.1%) |
| 35 to 39 Minutes | 26 (8.1%) | 34 (10.2%) |
| 40 to 44 Minutes | 24 (7.5%) | 10 (3.0%) |
| 45 to 59 Minutes | 74 (23.1%) | 31 (9.2%) |
| 60 to 89 Minutes | 24 (7.5%) | 3 (0.9%) |
| 90 or more Minutes | 0 (0.0%) | 6 (1.8%) |
Time of Departure to Work by Sex in Watertown
The most frequent times of departure to work in Watertown are 12:00 AM to 4:59 AM (85, 26.6%) for males and 7:00 AM to 7:29 AM (68, 20.3%) for females.
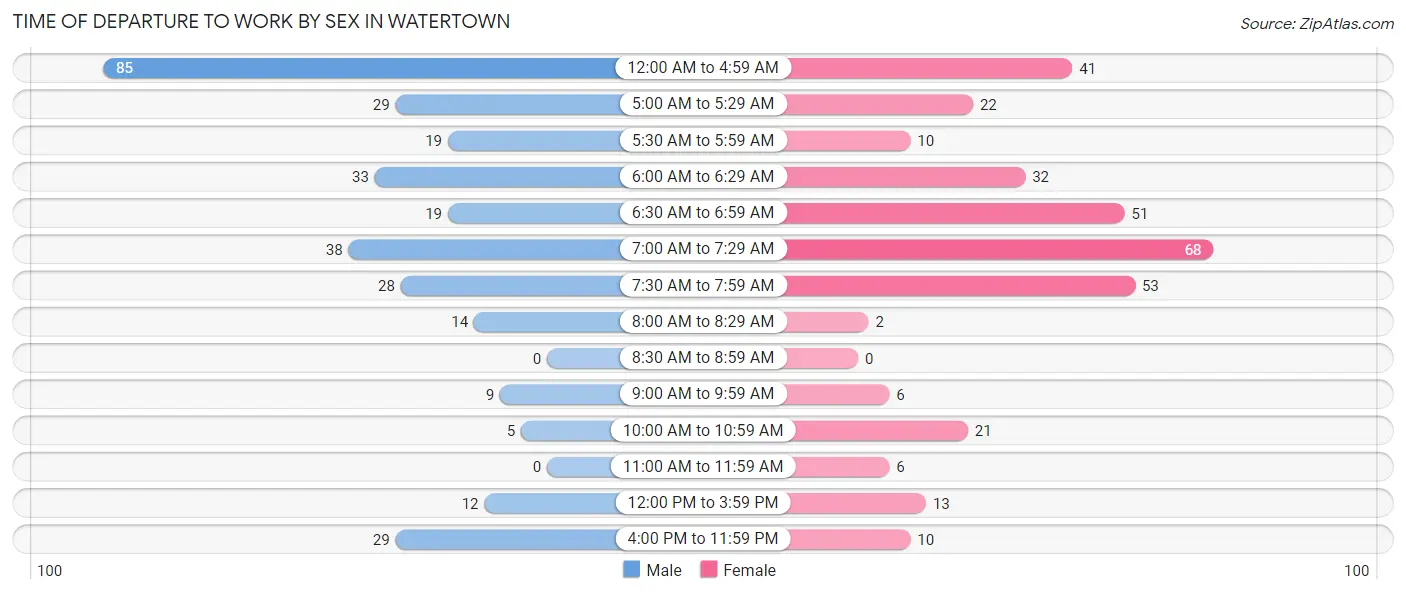
| Time of Departure | Male | Female |
| 12:00 AM to 4:59 AM | 85 (26.6%) | 41 (12.2%) |
| 5:00 AM to 5:29 AM | 29 (9.1%) | 22 (6.6%) |
| 5:30 AM to 5:59 AM | 19 (5.9%) | 10 (3.0%) |
| 6:00 AM to 6:29 AM | 33 (10.3%) | 32 (9.6%) |
| 6:30 AM to 6:59 AM | 19 (5.9%) | 51 (15.2%) |
| 7:00 AM to 7:29 AM | 38 (11.9%) | 68 (20.3%) |
| 7:30 AM to 7:59 AM | 28 (8.7%) | 53 (15.8%) |
| 8:00 AM to 8:29 AM | 14 (4.4%) | 2 (0.6%) |
| 8:30 AM to 8:59 AM | 0 (0.0%) | 0 (0.0%) |
| 9:00 AM to 9:59 AM | 9 (2.8%) | 6 (1.8%) |
| 10:00 AM to 10:59 AM | 5 (1.6%) | 21 (6.3%) |
| 11:00 AM to 11:59 AM | 0 (0.0%) | 6 (1.8%) |
| 12:00 PM to 3:59 PM | 12 (3.7%) | 13 (3.9%) |
| 4:00 PM to 11:59 PM | 29 (9.1%) | 10 (3.0%) |
| Total | 320 (100.0%) | 335 (100.0%) |
Housing Occupancy in Watertown
Occupancy by Ownership in Watertown
Of the total 645 dwellings in Watertown, owner-occupied units account for 457 (70.9%), while renter-occupied units make up 188 (29.1%).
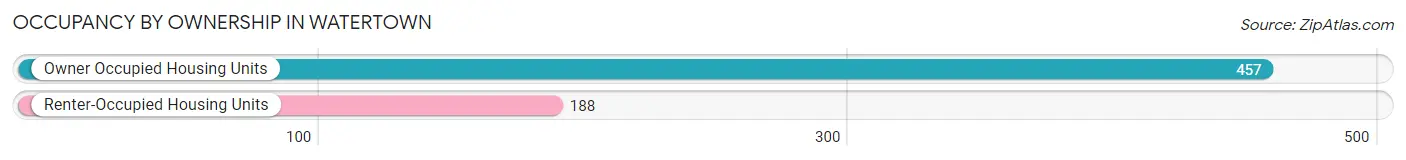
| Occupancy | # Housing Units | % Housing Units |
| Owner Occupied Housing Units | 457 | 70.9% |
| Renter-Occupied Housing Units | 188 | 29.1% |
| Total Occupied Housing Units | 645 | 100.0% |
Occupancy by Household Size in Watertown
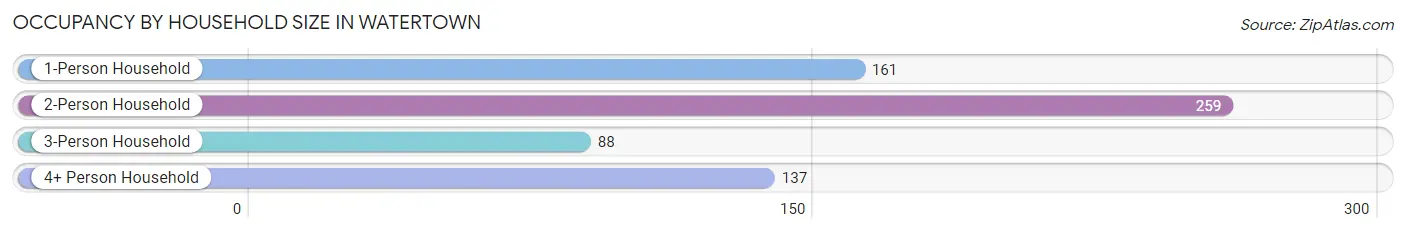
| Household Size | # Housing Units | % Housing Units |
| 1-Person Household | 161 | 25.0% |
| 2-Person Household | 259 | 40.2% |
| 3-Person Household | 88 | 13.6% |
| 4+ Person Household | 137 | 21.2% |
| Total Housing Units | 645 | 100.0% |
Occupancy by Ownership by Household Size in Watertown
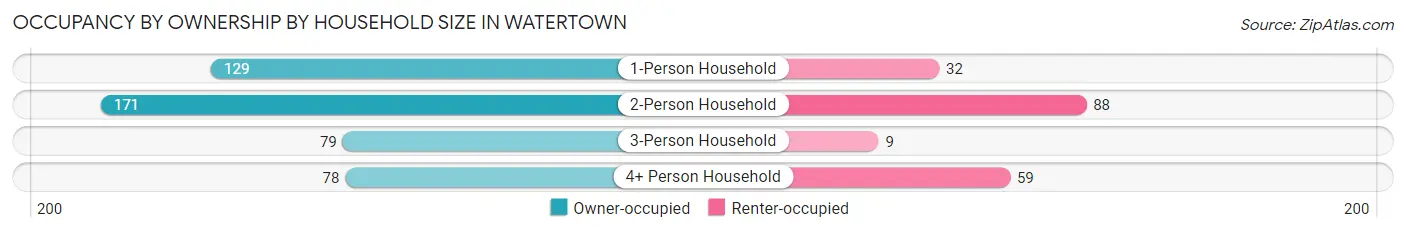
| Household Size | Owner-occupied | Renter-occupied |
| 1-Person Household | 129 (80.1%) | 32 (19.9%) |
| 2-Person Household | 171 (66.0%) | 88 (34.0%) |
| 3-Person Household | 79 (89.8%) | 9 (10.2%) |
| 4+ Person Household | 78 (56.9%) | 59 (43.1%) |
| Total Housing Units | 457 (70.9%) | 188 (29.1%) |
Occupancy by Educational Attainment in Watertown
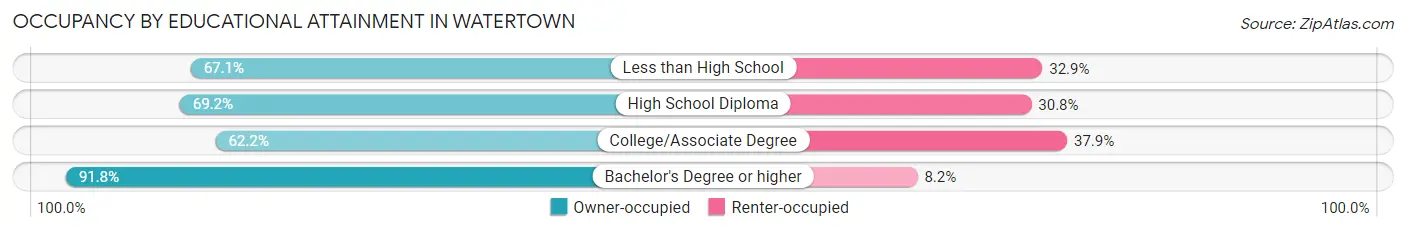
| Household Size | Owner-occupied | Renter-occupied |
| Less than High School | 57 (67.1%) | 28 (32.9%) |
| High School Diploma | 189 (69.2%) | 84 (30.8%) |
| College/Associate Degree | 110 (62.2%) | 67 (37.9%) |
| Bachelor's Degree or higher | 101 (91.8%) | 9 (8.2%) |
Occupancy by Age of Householder in Watertown
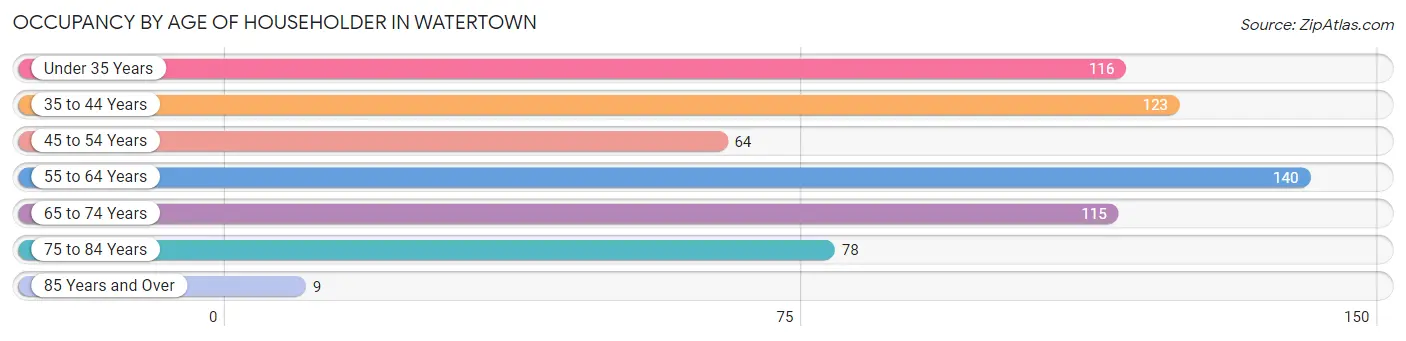
| Age Bracket | # Households | % Households |
| Under 35 Years | 116 | 18.0% |
| 35 to 44 Years | 123 | 19.1% |
| 45 to 54 Years | 64 | 9.9% |
| 55 to 64 Years | 140 | 21.7% |
| 65 to 74 Years | 115 | 17.8% |
| 75 to 84 Years | 78 | 12.1% |
| 85 Years and Over | 9 | 1.4% |
| Total | 645 | 100.0% |
Housing Finances in Watertown
Median Income by Occupancy in Watertown
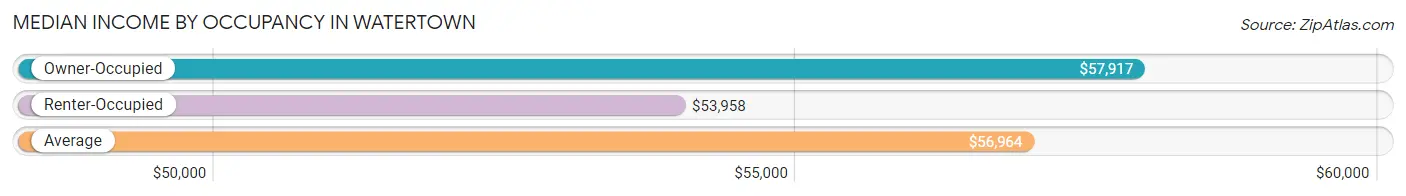
| Occupancy Type | # Households | Median Income |
| Owner-Occupied | 457 (70.9%) | $57,917 |
| Renter-Occupied | 188 (29.1%) | $53,958 |
| Average | 645 (100.0%) | $56,964 |
Occupancy by Householder Income Bracket in Watertown
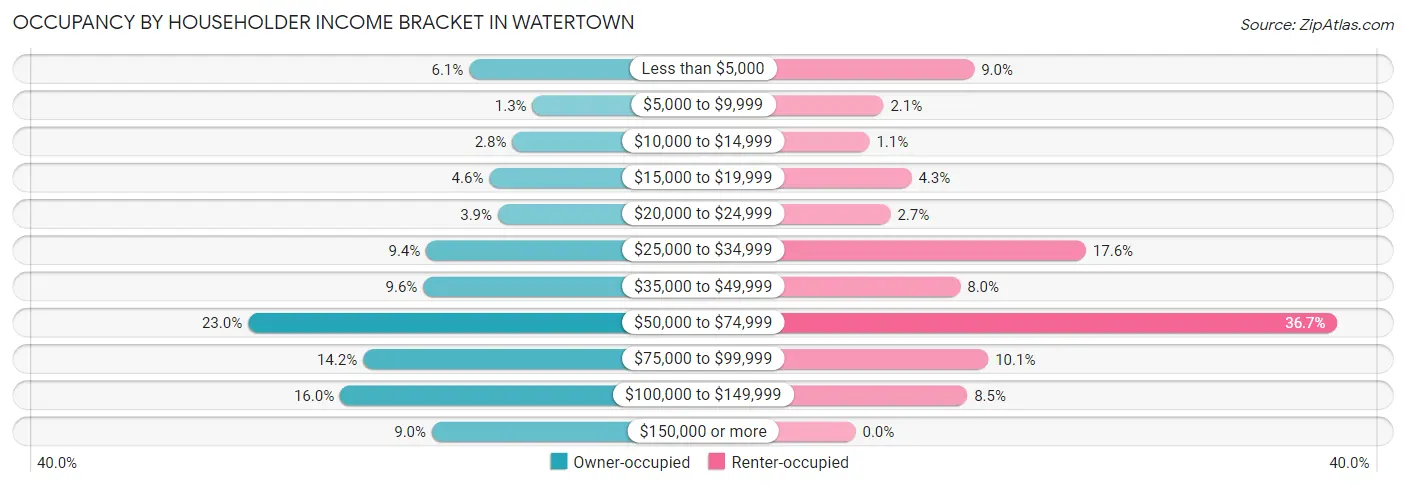
| Income Bracket | Owner-occupied | Renter-occupied |
| Less than $5,000 | 28 (6.1%) | 17 (9.0%) |
| $5,000 to $9,999 | 6 (1.3%) | 4 (2.1%) |
| $10,000 to $14,999 | 13 (2.8%) | 2 (1.1%) |
| $15,000 to $19,999 | 21 (4.6%) | 8 (4.3%) |
| $20,000 to $24,999 | 18 (3.9%) | 5 (2.7%) |
| $25,000 to $34,999 | 43 (9.4%) | 33 (17.5%) |
| $35,000 to $49,999 | 44 (9.6%) | 15 (8.0%) |
| $50,000 to $74,999 | 105 (23.0%) | 69 (36.7%) |
| $75,000 to $99,999 | 65 (14.2%) | 19 (10.1%) |
| $100,000 to $149,999 | 73 (16.0%) | 16 (8.5%) |
| $150,000 or more | 41 (9.0%) | 0 (0.0%) |
| Total | 457 (100.0%) | 188 (100.0%) |
Monthly Housing Cost Tiers in Watertown
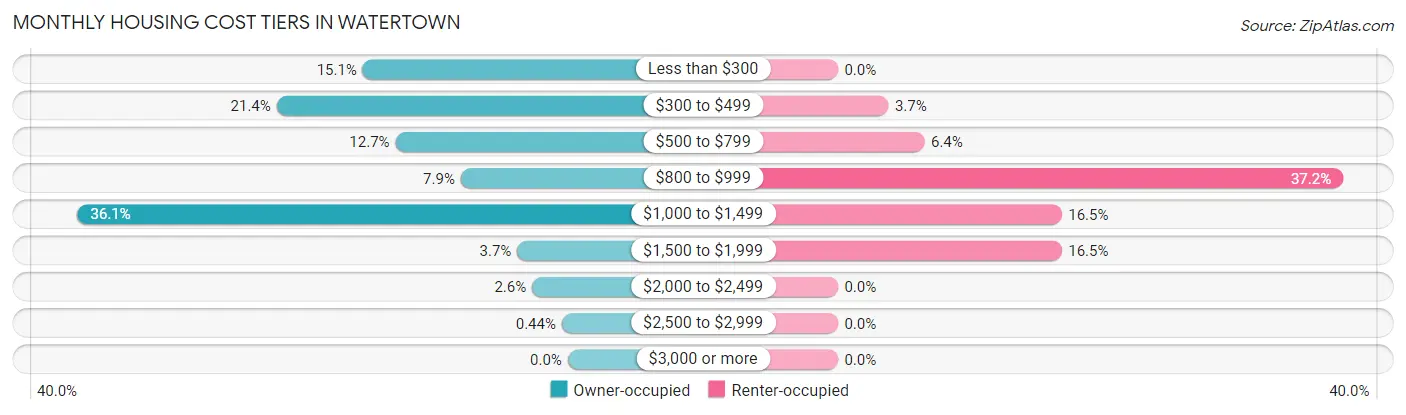
| Monthly Cost | Owner-occupied | Renter-occupied |
| Less than $300 | 69 (15.1%) | 0 (0.0%) |
| $300 to $499 | 98 (21.4%) | 7 (3.7%) |
| $500 to $799 | 58 (12.7%) | 12 (6.4%) |
| $800 to $999 | 36 (7.9%) | 70 (37.2%) |
| $1,000 to $1,499 | 165 (36.1%) | 31 (16.5%) |
| $1,500 to $1,999 | 17 (3.7%) | 31 (16.5%) |
| $2,000 to $2,499 | 12 (2.6%) | 0 (0.0%) |
| $2,500 to $2,999 | 2 (0.4%) | 0 (0.0%) |
| $3,000 or more | 0 (0.0%) | 0 (0.0%) |
| Total | 457 (100.0%) | 188 (100.0%) |
Physical Housing Characteristics in Watertown
Housing Structures in Watertown
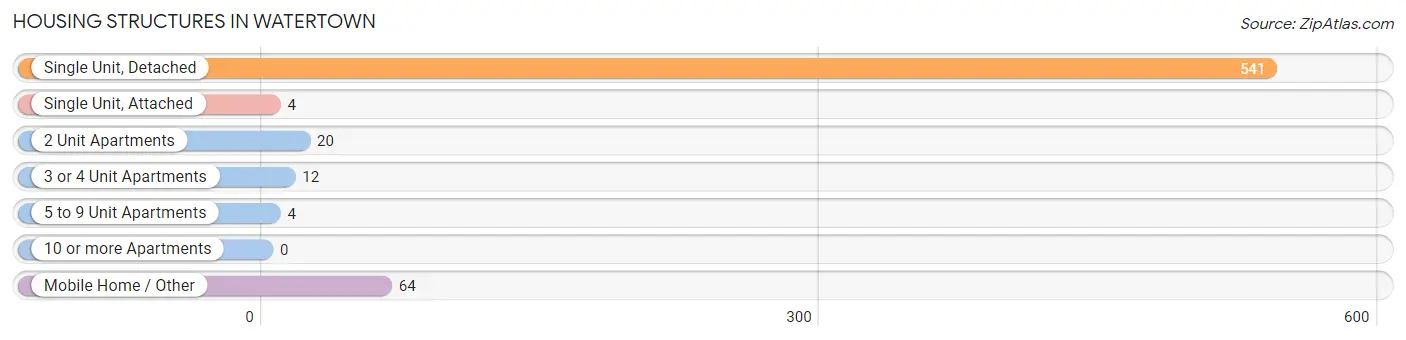
| Structure Type | # Housing Units | % Housing Units |
| Single Unit, Detached | 541 | 83.9% |
| Single Unit, Attached | 4 | 0.6% |
| 2 Unit Apartments | 20 | 3.1% |
| 3 or 4 Unit Apartments | 12 | 1.9% |
| 5 to 9 Unit Apartments | 4 | 0.6% |
| 10 or more Apartments | 0 | 0.0% |
| Mobile Home / Other | 64 | 9.9% |
| Total | 645 | 100.0% |
Housing Structures by Occupancy in Watertown
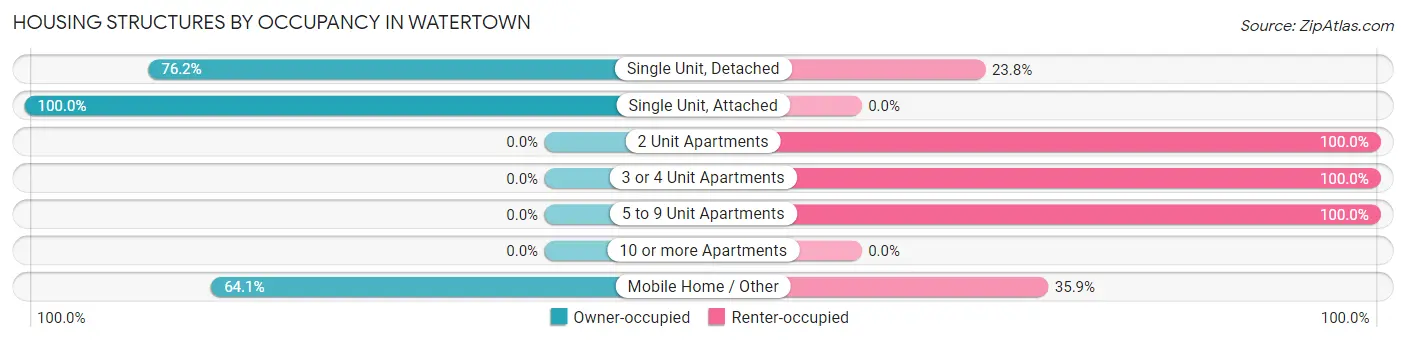
| Structure Type | Owner-occupied | Renter-occupied |
| Single Unit, Detached | 412 (76.2%) | 129 (23.8%) |
| Single Unit, Attached | 4 (100.0%) | 0 (0.0%) |
| 2 Unit Apartments | 0 (0.0%) | 20 (100.0%) |
| 3 or 4 Unit Apartments | 0 (0.0%) | 12 (100.0%) |
| 5 to 9 Unit Apartments | 0 (0.0%) | 4 (100.0%) |
| 10 or more Apartments | 0 (0.0%) | 0 (0.0%) |
| Mobile Home / Other | 41 (64.1%) | 23 (35.9%) |
| Total | 457 (70.9%) | 188 (29.1%) |
Housing Structures by Number of Rooms in Watertown
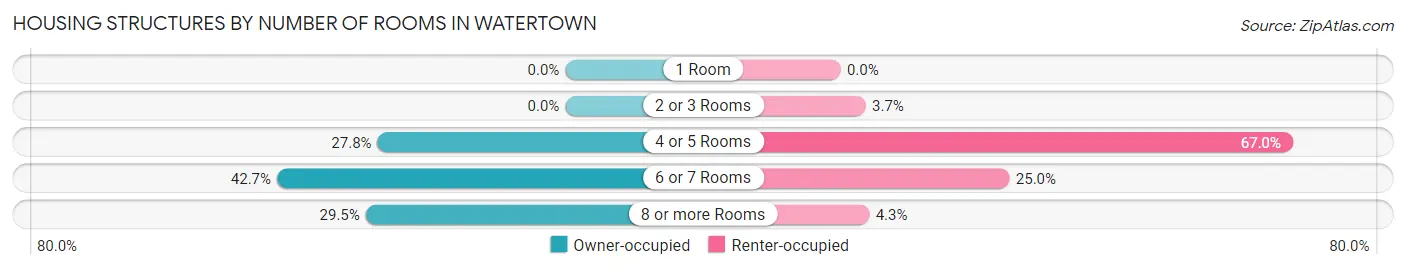
| Number of Rooms | Owner-occupied | Renter-occupied |
| 1 Room | 0 (0.0%) | 0 (0.0%) |
| 2 or 3 Rooms | 0 (0.0%) | 7 (3.7%) |
| 4 or 5 Rooms | 127 (27.8%) | 126 (67.0%) |
| 6 or 7 Rooms | 195 (42.7%) | 47 (25.0%) |
| 8 or more Rooms | 135 (29.5%) | 8 (4.3%) |
| Total | 457 (100.0%) | 188 (100.0%) |
Housing Structure by Heating Type in Watertown
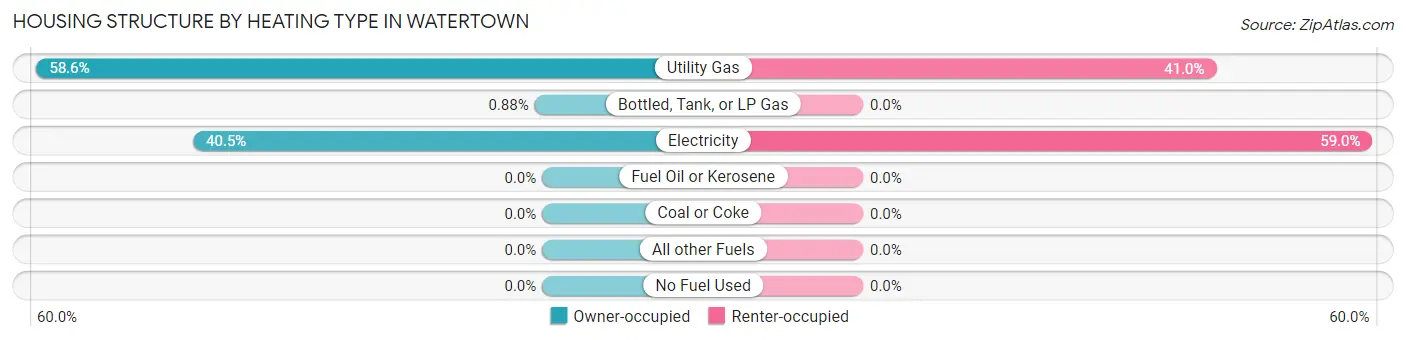
| Heating Type | Owner-occupied | Renter-occupied |
| Utility Gas | 268 (58.6%) | 77 (41.0%) |
| Bottled, Tank, or LP Gas | 4 (0.9%) | 0 (0.0%) |
| Electricity | 185 (40.5%) | 111 (59.0%) |
| Fuel Oil or Kerosene | 0 (0.0%) | 0 (0.0%) |
| Coal or Coke | 0 (0.0%) | 0 (0.0%) |
| All other Fuels | 0 (0.0%) | 0 (0.0%) |
| No Fuel Used | 0 (0.0%) | 0 (0.0%) |
| Total | 457 (100.0%) | 188 (100.0%) |
Household Vehicle Usage in Watertown
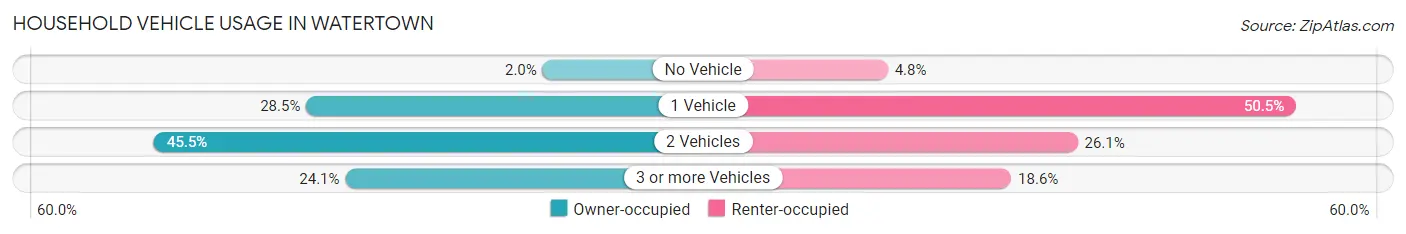
| Vehicles per Household | Owner-occupied | Renter-occupied |
| No Vehicle | 9 (2.0%) | 9 (4.8%) |
| 1 Vehicle | 130 (28.4%) | 95 (50.5%) |
| 2 Vehicles | 208 (45.5%) | 49 (26.1%) |
| 3 or more Vehicles | 110 (24.1%) | 35 (18.6%) |
| Total | 457 (100.0%) | 188 (100.0%) |
Real Estate & Mortgages in Watertown
Real Estate and Mortgage Overview in Watertown
| Characteristic | Without Mortgage | With Mortgage |
| Housing Units | 208 | 249 |
| Median Property Value | $186,100 | $203,900 |
| Median Household Income | $44,167 | $41 |
| Monthly Housing Costs | $378 | $0 |
| Real Estate Taxes | $850 | $0 |
Property Value by Mortgage Status in Watertown
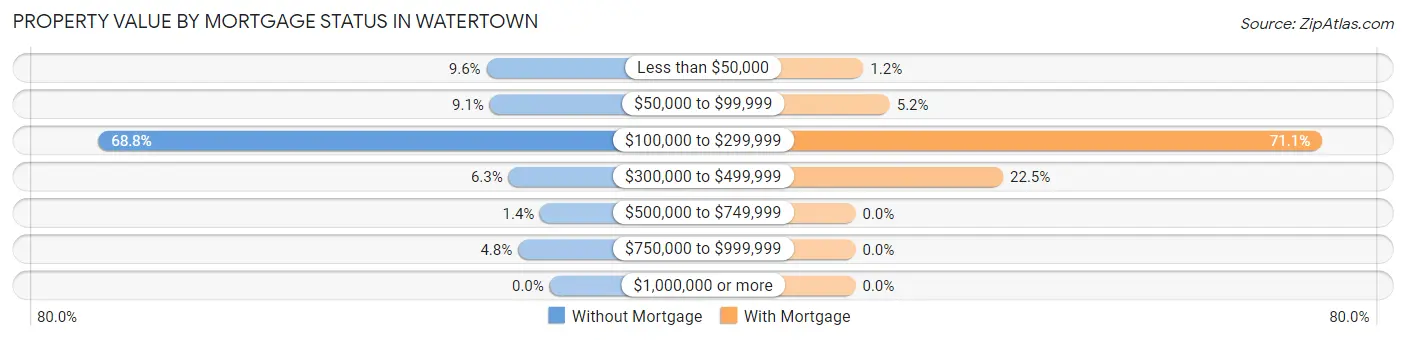
| Property Value | Without Mortgage | With Mortgage |
| Less than $50,000 | 20 (9.6%) | 3 (1.2%) |
| $50,000 to $99,999 | 19 (9.1%) | 13 (5.2%) |
| $100,000 to $299,999 | 143 (68.8%) | 177 (71.1%) |
| $300,000 to $499,999 | 13 (6.2%) | 56 (22.5%) |
| $500,000 to $749,999 | 3 (1.4%) | 0 (0.0%) |
| $750,000 to $999,999 | 10 (4.8%) | 0 (0.0%) |
| $1,000,000 or more | 0 (0.0%) | 0 (0.0%) |
| Total | 208 (100.0%) | 249 (100.0%) |
Household Income by Mortgage Status in Watertown
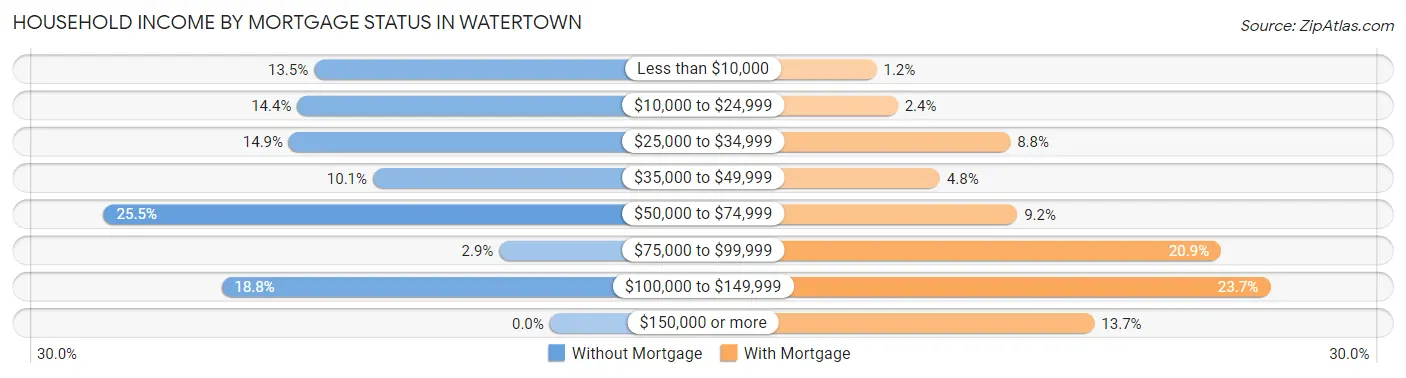
| Household Income | Without Mortgage | With Mortgage |
| Less than $10,000 | 28 (13.5%) | 3 (1.2%) |
| $10,000 to $24,999 | 30 (14.4%) | 6 (2.4%) |
| $25,000 to $34,999 | 31 (14.9%) | 22 (8.8%) |
| $35,000 to $49,999 | 21 (10.1%) | 12 (4.8%) |
| $50,000 to $74,999 | 53 (25.5%) | 23 (9.2%) |
| $75,000 to $99,999 | 6 (2.9%) | 52 (20.9%) |
| $100,000 to $149,999 | 39 (18.8%) | 59 (23.7%) |
| $150,000 or more | 0 (0.0%) | 34 (13.7%) |
| Total | 208 (100.0%) | 249 (100.0%) |
Property Value to Household Income Ratio in Watertown
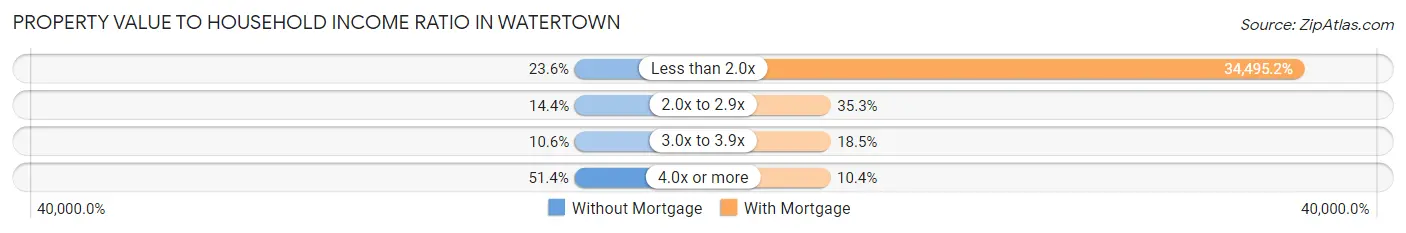
| Value-to-Income Ratio | Without Mortgage | With Mortgage |
| Less than 2.0x | 49 (23.6%) | 85,893 (34,495.2%) |
| 2.0x to 2.9x | 30 (14.4%) | 88 (35.3%) |
| 3.0x to 3.9x | 22 (10.6%) | 46 (18.5%) |
| 4.0x or more | 107 (51.4%) | 26 (10.4%) |
| Total | 208 (100.0%) | 249 (100.0%) |
Real Estate Taxes by Mortgage Status in Watertown
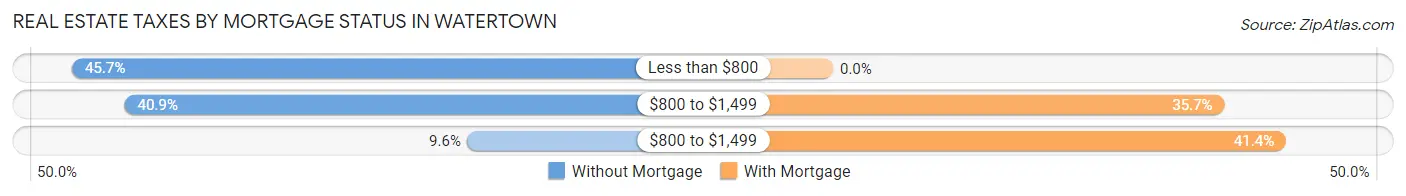
| Property Taxes | Without Mortgage | With Mortgage |
| Less than $800 | 95 (45.7%) | 0 (0.0%) |
| $800 to $1,499 | 85 (40.9%) | 89 (35.7%) |
| $800 to $1,499 | 20 (9.6%) | 103 (41.4%) |
| Total | 208 (100.0%) | 249 (100.0%) |
Health & Disability in Watertown
Health Insurance Coverage by Age in Watertown
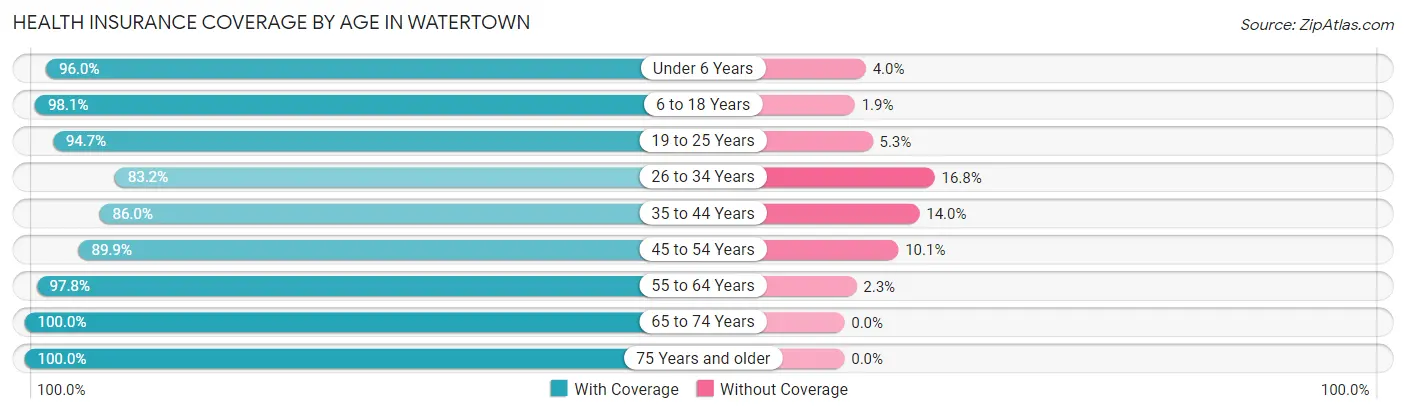
| Age Bracket | With Coverage | Without Coverage |
| Under 6 Years | 96 (96.0%) | 4 (4.0%) |
| 6 to 18 Years | 303 (98.1%) | 6 (1.9%) |
| 19 to 25 Years | 90 (94.7%) | 5 (5.3%) |
| 26 to 34 Years | 163 (83.2%) | 33 (16.8%) |
| 35 to 44 Years | 203 (86.0%) | 33 (14.0%) |
| 45 to 54 Years | 143 (89.9%) | 16 (10.1%) |
| 55 to 64 Years | 261 (97.8%) | 6 (2.2%) |
| 65 to 74 Years | 165 (100.0%) | 0 (0.0%) |
| 75 Years and older | 110 (100.0%) | 0 (0.0%) |
| Total | 1,534 (93.7%) | 103 (6.3%) |
Health Insurance Coverage by Citizenship Status in Watertown
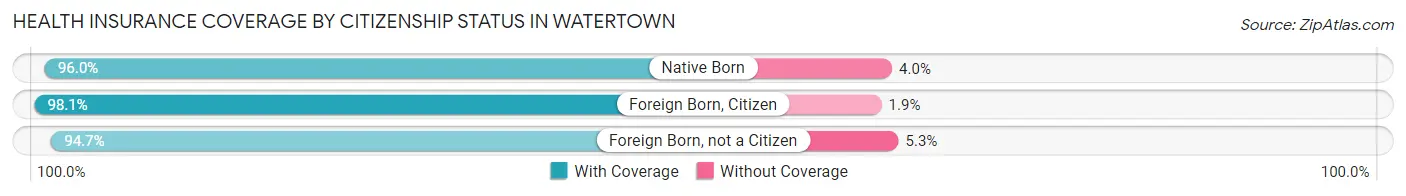
| Citizenship Status | With Coverage | Without Coverage |
| Native Born | 96 (96.0%) | 4 (4.0%) |
| Foreign Born, Citizen | 303 (98.1%) | 6 (1.9%) |
| Foreign Born, not a Citizen | 90 (94.7%) | 5 (5.3%) |
Health Insurance Coverage by Household Income in Watertown
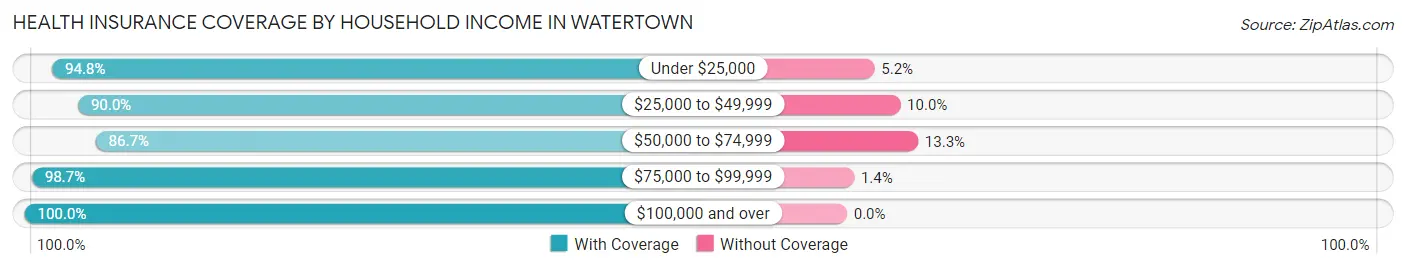
| Household Income | With Coverage | Without Coverage |
| Under $25,000 | 239 (94.8%) | 13 (5.2%) |
| $25,000 to $49,999 | 234 (90.0%) | 26 (10.0%) |
| $50,000 to $74,999 | 397 (86.7%) | 61 (13.3%) |
| $75,000 to $99,999 | 219 (98.7%) | 3 (1.3%) |
| $100,000 and over | 445 (100.0%) | 0 (0.0%) |
Public vs Private Health Insurance Coverage by Age in Watertown
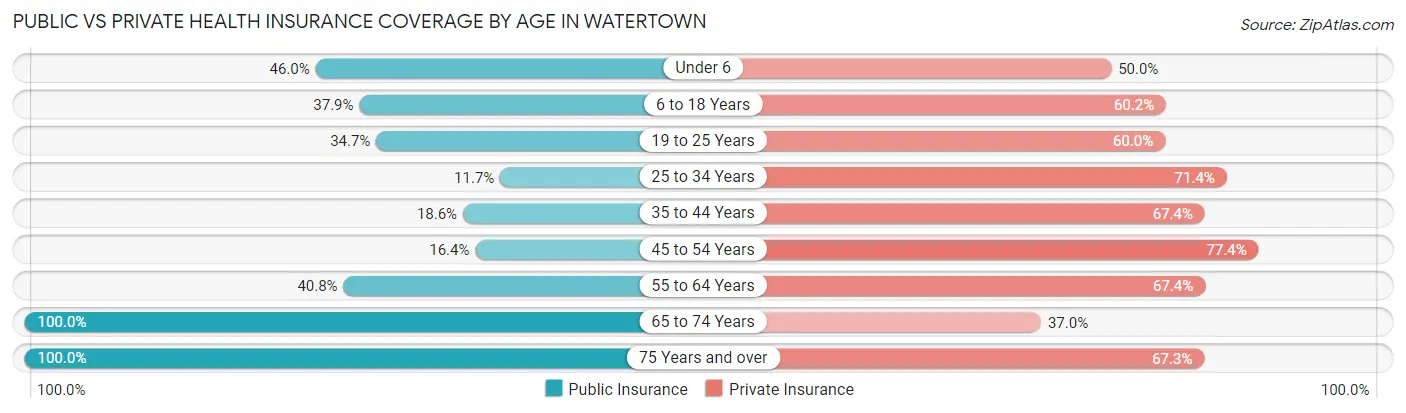
| Age Bracket | Public Insurance | Private Insurance |
| Under 6 | 46 (46.0%) | 50 (50.0%) |
| 6 to 18 Years | 117 (37.9%) | 186 (60.2%) |
| 19 to 25 Years | 33 (34.7%) | 57 (60.0%) |
| 25 to 34 Years | 23 (11.7%) | 140 (71.4%) |
| 35 to 44 Years | 44 (18.6%) | 159 (67.4%) |
| 45 to 54 Years | 26 (16.4%) | 123 (77.4%) |
| 55 to 64 Years | 109 (40.8%) | 180 (67.4%) |
| 65 to 74 Years | 165 (100.0%) | 61 (37.0%) |
| 75 Years and over | 110 (100.0%) | 74 (67.3%) |
| Total | 673 (41.1%) | 1,030 (62.9%) |
Disability Status by Sex by Age in Watertown
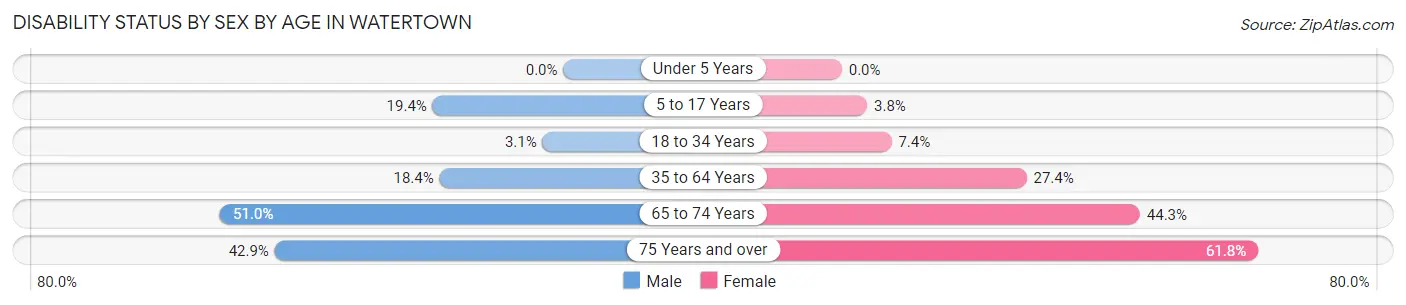
| Age Bracket | Male | Female |
| Under 5 Years | 0 (0.0%) | 0 (0.0%) |
| 5 to 17 Years | 33 (19.4%) | 5 (3.8%) |
| 18 to 34 Years | 5 (3.1%) | 11 (7.4%) |
| 35 to 64 Years | 48 (18.4%) | 110 (27.4%) |
| 65 to 74 Years | 53 (51.0%) | 27 (44.3%) |
| 75 Years and over | 9 (42.9%) | 55 (61.8%) |
Disability Class by Sex by Age in Watertown
Disability Class: Hearing Difficulty

| Age Bracket | Male | Female |
| Under 5 Years | 0 (0.0%) | 0 (0.0%) |
| 5 to 17 Years | 11 (6.5%) | 0 (0.0%) |
| 18 to 34 Years | 0 (0.0%) | 0 (0.0%) |
| 35 to 64 Years | 40 (15.3%) | 21 (5.2%) |
| 65 to 74 Years | 21 (20.2%) | 0 (0.0%) |
| 75 Years and over | 9 (42.9%) | 0 (0.0%) |
Disability Class: Vision Difficulty
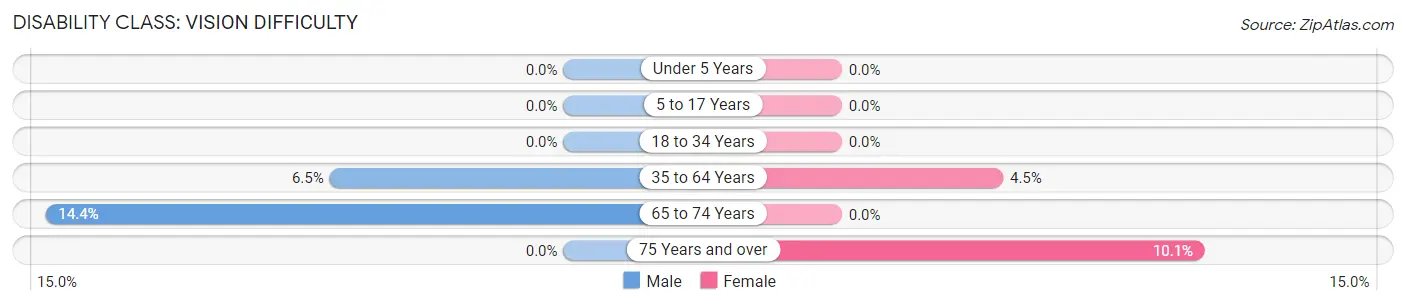
| Age Bracket | Male | Female |
| Under 5 Years | 0 (0.0%) | 0 (0.0%) |
| 5 to 17 Years | 0 (0.0%) | 0 (0.0%) |
| 18 to 34 Years | 0 (0.0%) | 0 (0.0%) |
| 35 to 64 Years | 17 (6.5%) | 18 (4.5%) |
| 65 to 74 Years | 15 (14.4%) | 0 (0.0%) |
| 75 Years and over | 0 (0.0%) | 9 (10.1%) |
Disability Class: Cognitive Difficulty
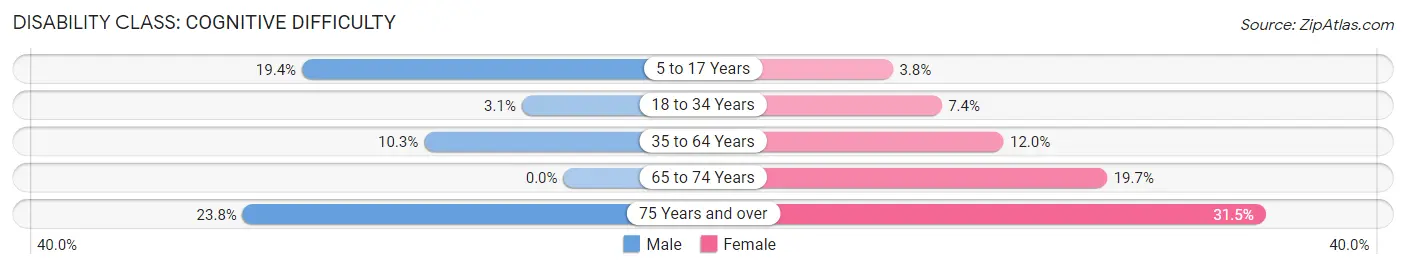
| Age Bracket | Male | Female |
| 5 to 17 Years | 33 (19.4%) | 5 (3.8%) |
| 18 to 34 Years | 5 (3.1%) | 11 (7.4%) |
| 35 to 64 Years | 27 (10.3%) | 48 (12.0%) |
| 65 to 74 Years | 0 (0.0%) | 12 (19.7%) |
| 75 Years and over | 5 (23.8%) | 28 (31.5%) |
Disability Class: Ambulatory Difficulty
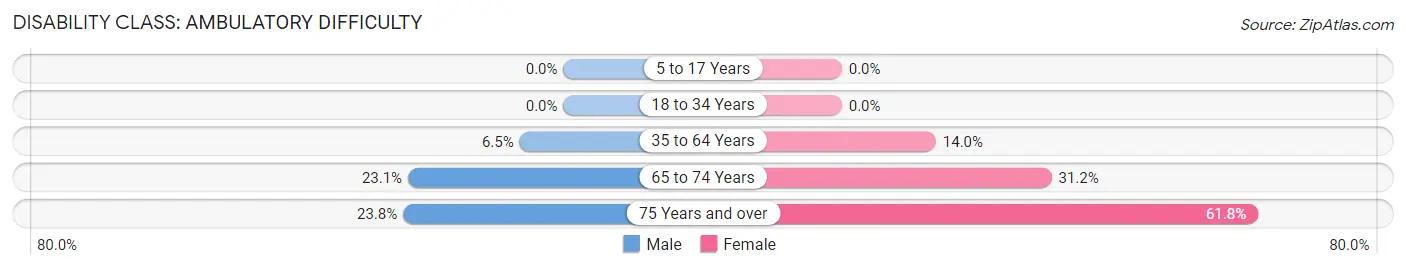
| Age Bracket | Male | Female |
| 5 to 17 Years | 0 (0.0%) | 0 (0.0%) |
| 18 to 34 Years | 0 (0.0%) | 0 (0.0%) |
| 35 to 64 Years | 17 (6.5%) | 56 (14.0%) |
| 65 to 74 Years | 24 (23.1%) | 19 (31.1%) |
| 75 Years and over | 5 (23.8%) | 55 (61.8%) |
Disability Class: Self-Care Difficulty
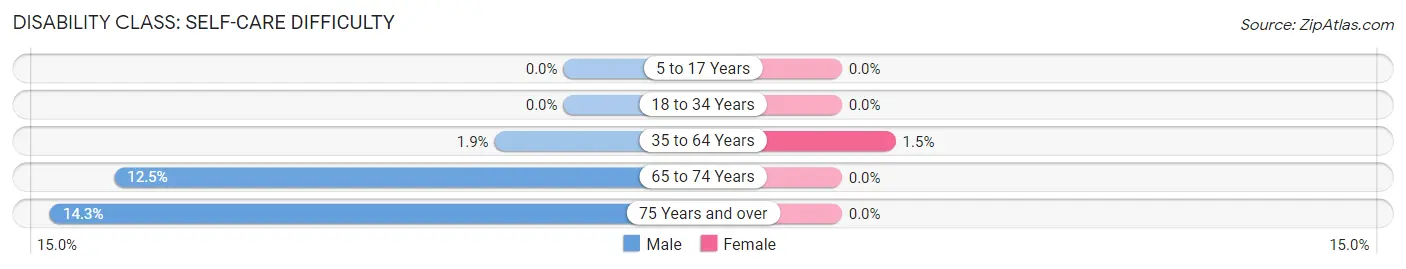
| Age Bracket | Male | Female |
| 5 to 17 Years | 0 (0.0%) | 0 (0.0%) |
| 18 to 34 Years | 0 (0.0%) | 0 (0.0%) |
| 35 to 64 Years | 5 (1.9%) | 6 (1.5%) |
| 65 to 74 Years | 13 (12.5%) | 0 (0.0%) |
| 75 Years and over | 3 (14.3%) | 0 (0.0%) |
Technology Access in Watertown
Computing Device Access in Watertown
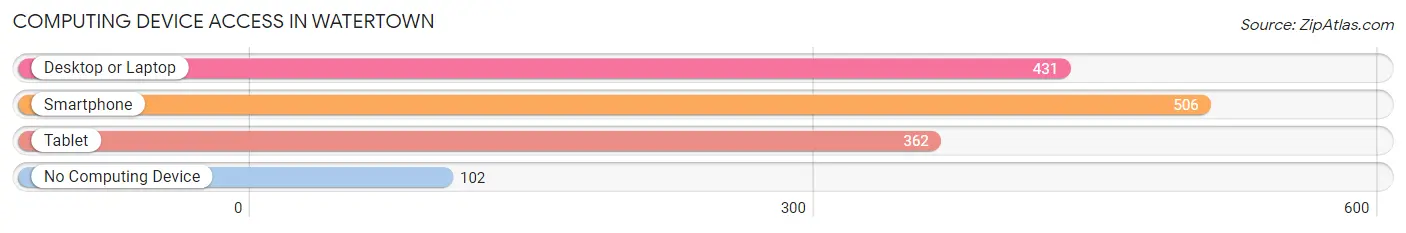
| Device Type | # Households | % Households |
| Desktop or Laptop | 431 | 66.8% |
| Smartphone | 506 | 78.4% |
| Tablet | 362 | 56.1% |
| No Computing Device | 102 | 15.8% |
| Total | 645 | 100.0% |
Internet Access in Watertown
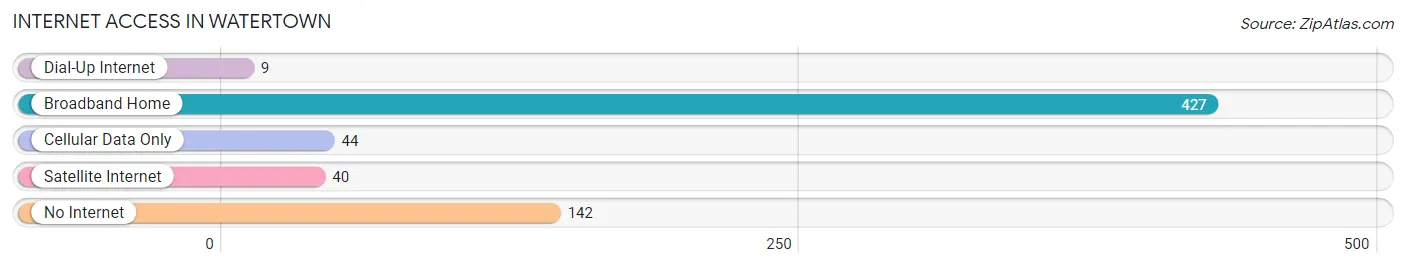
| Internet Type | # Households | % Households |
| Dial-Up Internet | 9 | 1.4% |
| Broadband Home | 427 | 66.2% |
| Cellular Data Only | 44 | 6.8% |
| Satellite Internet | 40 | 6.2% |
| No Internet | 142 | 22.0% |
| Total | 645 | 100.0% |
Watertown Summary
History
The town of Watertown, Tennessee is located in Wilson County, about 25 miles east of Nashville. It was founded in 1807 by a group of settlers from North Carolina, led by William Walton. The town was named after the nearby creek, which was named for the abundance of water in the area.
The town was originally a farming community, but it soon became a center for industry. In 1820, the first cotton mill was built in Watertown, and by the mid-1800s, the town had become a major producer of cotton and other agricultural products.
In the late 1800s, the town began to grow rapidly, and by the early 1900s, it had become a major industrial center. The town was home to several factories, including a cotton mill, a paper mill, a shoe factory, and a furniture factory.
In the early 1900s, the town also became a center for education. The first public school in Watertown was established in 1891, and by the 1920s, the town had several schools, including a high school.
Geography
Watertown is located in Wilson County, Tennessee, about 25 miles east of Nashville. The town is situated on the banks of the Cumberland River, and is surrounded by rolling hills and farmland. The town is located in the Central Basin of Tennessee, and is part of the Nashville Metropolitan Statistical Area.
The climate in Watertown is humid subtropical, with hot summers and mild winters. The average annual temperature is around 65 degrees Fahrenheit, and the average annual precipitation is around 45 inches.
Economy
Watertown’s economy is largely based on agriculture and manufacturing. The town is home to several factories, including a cotton mill, a paper mill, a shoe factory, and a furniture factory. The town is also home to several retail stores, restaurants, and other businesses.
The town is also home to several educational institutions, including a public school system, a community college, and a technical college.
Demographics
As of the 2010 census, the population of Watertown was 5,845. The racial makeup of the town was 87.3% White, 8.2% African American, 0.4% Native American, 0.7% Asian, 0.1% Pacific Islander, and 2.3% from other races. Hispanic or Latino of any race were 2.7% of the population.
The median household income in Watertown was $37,917, and the median family income was $45,938. The per capita income was $19,945. About 15.3% of the population was below the poverty line.
Watertown is served by the Wilson County School System, which includes four elementary schools, one middle school, and one high school. The town is also home to several private schools, including a Catholic school and a Christian school.
Common Questions
What is Per Capita Income in Watertown?
Per Capita income in Watertown is $26,207.
What is the Median Family Income in Watertown?
Median Family Income in Watertown is $66,855.
What is the Median Household income in Watertown?
Median Household Income in Watertown is $56,964.
What is Income or Wage Gap in Watertown?
Income or Wage Gap in Watertown is 37.6%.
Women in Watertown earn 62.4 cents for every dollar earned by a man.
What is Family Income Deficit in Watertown?
Family Income Deficit in Watertown is $10,149.
Families that are below poverty line in Watertown earn $10,149 less on average than the poverty threshold level.
What is Inequality or Gini Index in Watertown?
Inequality or Gini Index in Watertown is 0.39.
What is the Total Population of Watertown?
Total Population of Watertown is 1,637.
What is the Total Male Population of Watertown?
Total Male Population of Watertown is 759.
What is the Total Female Population of Watertown?
Total Female Population of Watertown is 878.
What is the Ratio of Males per 100 Females in Watertown?
There are 86.45 Males per 100 Females in Watertown.
What is the Ratio of Females per 100 Males in Watertown?
There are 115.68 Females per 100 Males in Watertown.
What is the Median Population Age in Watertown?
Median Population Age in Watertown is 39.7 Years.
What is the Average Family Size in Watertown
Average Family Size in Watertown is 3.0 People.
What is the Average Household Size in Watertown
Average Household Size in Watertown is 2.5 People.
How Large is the Labor Force in Watertown?
There are 758 People in the Labor Forcein in Watertown.
What is the Percentage of People in the Labor Force in Watertown?
59.0% of People are in the Labor Force in Watertown.
What is the Unemployment Rate in Watertown?
Unemployment Rate in Watertown is 2.2%.