Bluff City, TN Map & Demographics
Bluff City Map
Bluff City Overview
$28,789
PER CAPITA INCOME
$59,167
AVG FAMILY INCOME
$55,239
AVG HOUSEHOLD INCOME
29.8%
WAGE / INCOME GAP [ % ]
70.2¢/ $1
WAGE / INCOME GAP [ $ ]
$7,340
FAMILY INCOME DEFICIT
0.41
INEQUALITY / GINI INDEX
2,261
TOTAL POPULATION
1,024
MALE POPULATION
1,237
FEMALE POPULATION
82.78
MALES / 100 FEMALES
120.80
FEMALES / 100 MALES
35.6
MEDIAN AGE
3.0
AVG FAMILY SIZE
2.5
AVG HOUSEHOLD SIZE
1,171
LABOR FORCE [ PEOPLE ]
66.6%
PERCENT IN LABOR FORCE
2.4%
UNEMPLOYMENT RATE
Bluff City Zip Codes
Bluff City Area Codes
Income in Bluff City
Income Overview in Bluff City
Per Capita Income in Bluff City is $28,789, while median incomes of families and households are $59,167 and $55,239 respectively.
| Characteristic | Number | Measure |
| Per Capita Income | 2,261 | $28,789 |
| Median Family Income | 624 | $59,167 |
| Mean Family Income | 624 | $79,129 |
| Median Household Income | 913 | $55,239 |
| Mean Household Income | 913 | $71,098 |
| Income Deficit | 624 | $7,340 |
| Wage / Income Gap (%) | 2,261 | 29.85% |
| Wage / Income Gap ($) | 2,261 | 70.15¢ per $1 |
| Gini / Inequality Index | 2,261 | 0.41 |
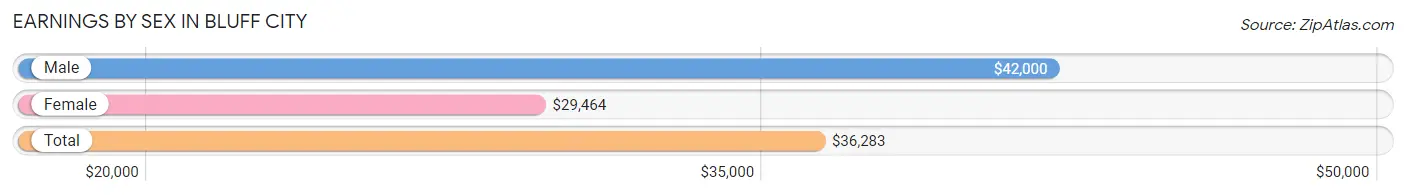
Earnings by Sex in Bluff City
Average Earnings in Bluff City are $36,283, $42,000 for men and $29,464 for women, a difference of 29.8%.
| Sex | Number | Average Earnings |
| Male | 636 (51.5%) | $42,000 |
| Female | 598 (48.5%) | $29,464 |
| Total | 1,234 (100.0%) | $36,283 |
Earnings by Sex by Income Bracket in Bluff City
The most common earnings brackets in Bluff City are $40,000 to $44,999 for men (87 | 13.7%) and $40,000 to $44,999 for women (69 | 11.5%).
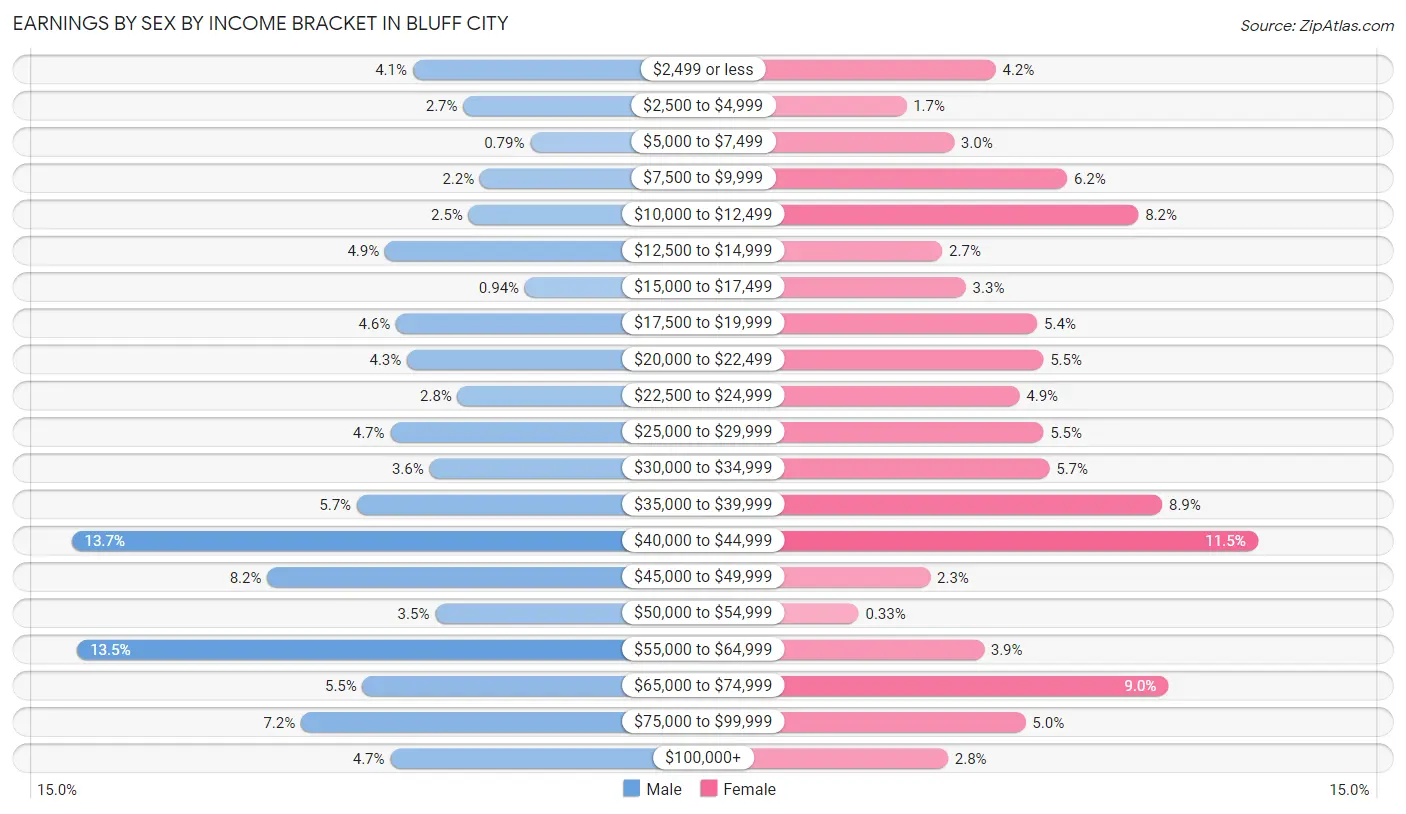
| Income | Male | Female |
| $2,499 or less | 26 (4.1%) | 25 (4.2%) |
| $2,500 to $4,999 | 17 (2.7%) | 10 (1.7%) |
| $5,000 to $7,499 | 5 (0.8%) | 18 (3.0%) |
| $7,500 to $9,999 | 14 (2.2%) | 37 (6.2%) |
| $10,000 to $12,499 | 16 (2.5%) | 49 (8.2%) |
| $12,500 to $14,999 | 31 (4.9%) | 16 (2.7%) |
| $15,000 to $17,499 | 6 (0.9%) | 20 (3.3%) |
| $17,500 to $19,999 | 29 (4.6%) | 32 (5.3%) |
| $20,000 to $22,499 | 27 (4.3%) | 33 (5.5%) |
| $22,500 to $24,999 | 18 (2.8%) | 29 (4.9%) |
| $25,000 to $29,999 | 30 (4.7%) | 33 (5.5%) |
| $30,000 to $34,999 | 23 (3.6%) | 34 (5.7%) |
| $35,000 to $39,999 | 36 (5.7%) | 53 (8.9%) |
| $40,000 to $44,999 | 87 (13.7%) | 69 (11.5%) |
| $45,000 to $49,999 | 52 (8.2%) | 14 (2.3%) |
| $50,000 to $54,999 | 22 (3.5%) | 2 (0.3%) |
| $55,000 to $64,999 | 86 (13.5%) | 23 (3.8%) |
| $65,000 to $74,999 | 35 (5.5%) | 54 (9.0%) |
| $75,000 to $99,999 | 46 (7.2%) | 30 (5.0%) |
| $100,000+ | 30 (4.7%) | 17 (2.8%) |
| Total | 636 (100.0%) | 598 (100.0%) |
Earnings by Sex by Educational Attainment in Bluff City
Average earnings in Bluff City are $44,122 for men and $35,638 for women, a difference of 19.2%. Men with an educational attainment of graduate degree enjoy the highest average annual earnings of $67,679, while those with less than high school education earn the least with $39,375. Women with an educational attainment of graduate degree earn the most with the average annual earnings of $68,071, while those with less than high school education have the smallest earnings of $9,250.
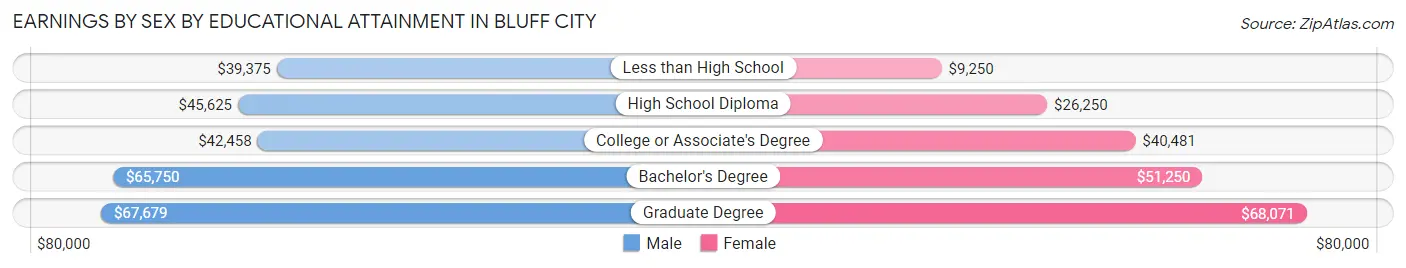
| Educational Attainment | Male Income | Female Income |
| Less than High School | $39,375 | $9,250 |
| High School Diploma | $45,625 | $26,250 |
| College or Associate's Degree | $42,458 | $40,481 |
| Bachelor's Degree | $65,750 | $51,250 |
| Graduate Degree | $67,679 | $68,071 |
| Total | $44,122 | $35,638 |
Family Income in Bluff City
Family Income Brackets in Bluff City
According to the Bluff City family income data, there are 172 families falling into the $100,000 to $149,999 income range, which is the most common income bracket and makes up 27.6% of all families.
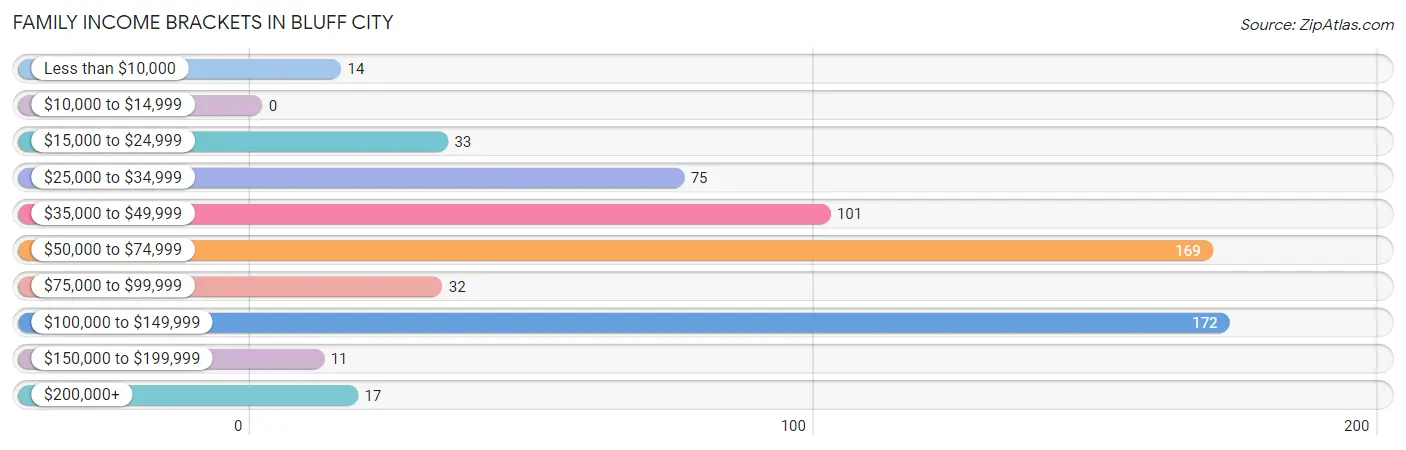
| Income Bracket | # Families | % Families |
| Less than $10,000 | 14 | 2.2% |
| $10,000 to $14,999 | 0 | 0.0% |
| $15,000 to $24,999 | 33 | 5.3% |
| $25,000 to $34,999 | 75 | 12.0% |
| $35,000 to $49,999 | 101 | 16.2% |
| $50,000 to $74,999 | 169 | 27.1% |
| $75,000 to $99,999 | 32 | 5.1% |
| $100,000 to $149,999 | 172 | 27.6% |
| $150,000 to $199,999 | 11 | 1.8% |
| $200,000+ | 17 | 2.7% |
Family Income by Famaliy Size in Bluff City
2-person families (264 | 42.3%) account for the highest median family income in Bluff City with $68,571 per family, while 2-person families (264 | 42.3%) have the highest median income of $34,286 per family member.
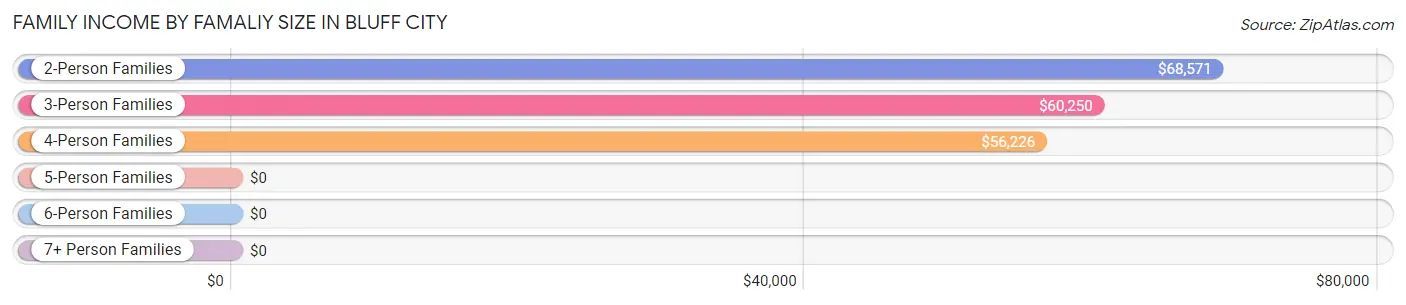
| Income Bracket | # Families | Median Income |
| 2-Person Families | 264 (42.3%) | $68,571 |
| 3-Person Families | 121 (19.4%) | $60,250 |
| 4-Person Families | 209 (33.5%) | $56,226 |
| 5-Person Families | 21 (3.4%) | $0 |
| 6-Person Families | 6 (1.0%) | $0 |
| 7+ Person Families | 3 (0.5%) | $0 |
| Total | 624 (100.0%) | $59,167 |
Family Income by Number of Earners in Bluff City
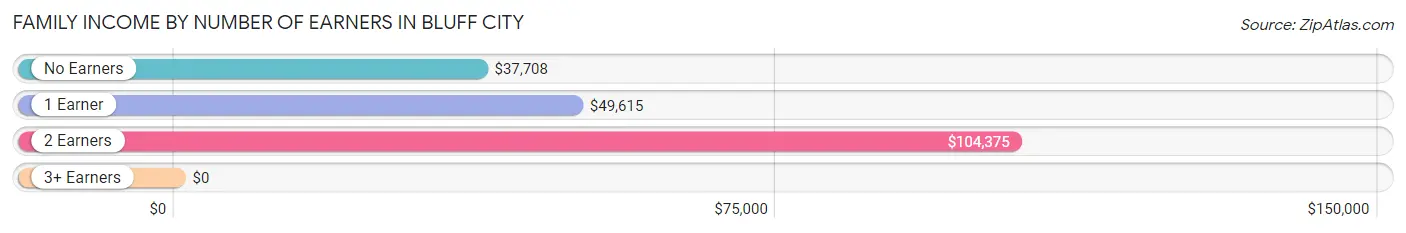
| Number of Earners | # Families | Median Income |
| No Earners | 87 (13.9%) | $37,708 |
| 1 Earner | 184 (29.5%) | $49,615 |
| 2 Earners | 325 (52.1%) | $104,375 |
| 3+ Earners | 28 (4.5%) | $0 |
| Total | 624 (100.0%) | $59,167 |
Household Income in Bluff City
Household Income Brackets in Bluff City
With 219 households falling in the category, the $50,000 to $74,999 income range is the most frequent in Bluff City, accounting for 24.0% of all households. In contrast, only 11 households (1.2%) fall into the $150,000 to $199,999 income bracket, making it the least populous group.
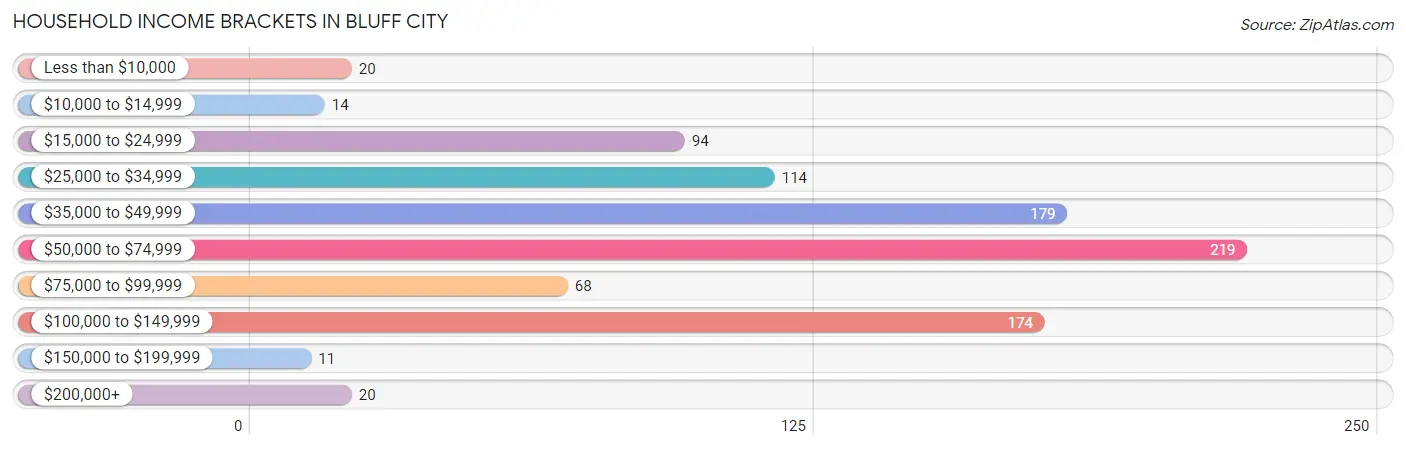
| Income Bracket | # Households | % Households |
| Less than $10,000 | 20 | 2.2% |
| $10,000 to $14,999 | 14 | 1.5% |
| $15,000 to $24,999 | 94 | 10.3% |
| $25,000 to $34,999 | 114 | 12.5% |
| $35,000 to $49,999 | 179 | 19.6% |
| $50,000 to $74,999 | 219 | 24.0% |
| $75,000 to $99,999 | 68 | 7.4% |
| $100,000 to $149,999 | 174 | 19.1% |
| $150,000 to $199,999 | 11 | 1.2% |
| $200,000+ | 20 | 2.2% |
Household Income by Householder Age in Bluff City
The median household income in Bluff City is $55,239, with the highest median household income of $56,937 found in the 25 to 44 years age bracket for the primary householder. A total of 406 households (44.5%) fall into this category. Meanwhile, the 15 to 24 years age bracket for the primary householder has the lowest median household income of $0, with 2 households (0.2%) in this group.
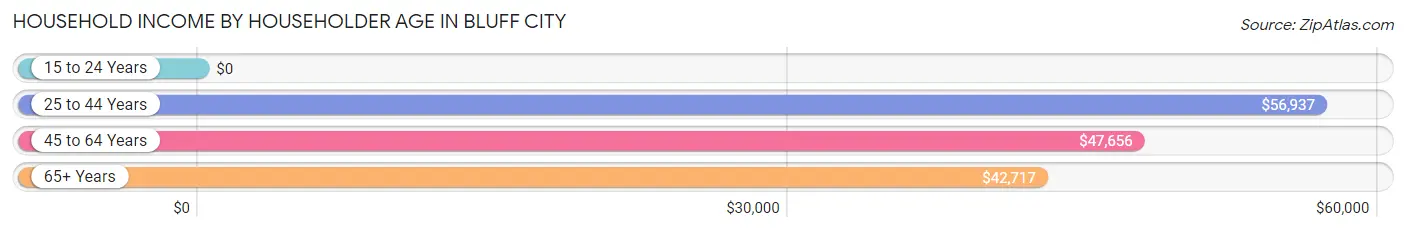
| Income Bracket | # Households | Median Income |
| 15 to 24 Years | 2 (0.2%) | $0 |
| 25 to 44 Years | 406 (44.5%) | $56,937 |
| 45 to 64 Years | 339 (37.1%) | $47,656 |
| 65+ Years | 166 (18.2%) | $42,717 |
| Total | 913 (100.0%) | $55,239 |
Poverty in Bluff City
Income Below Poverty by Sex and Age in Bluff City
With 14.9% poverty level for males and 18.0% for females among the residents of Bluff City, 5 year old males and 6 to 11 year old females are the most vulnerable to poverty, with 17 males (100.0%) and 35 females (41.7%) in their respective age groups living below the poverty level.
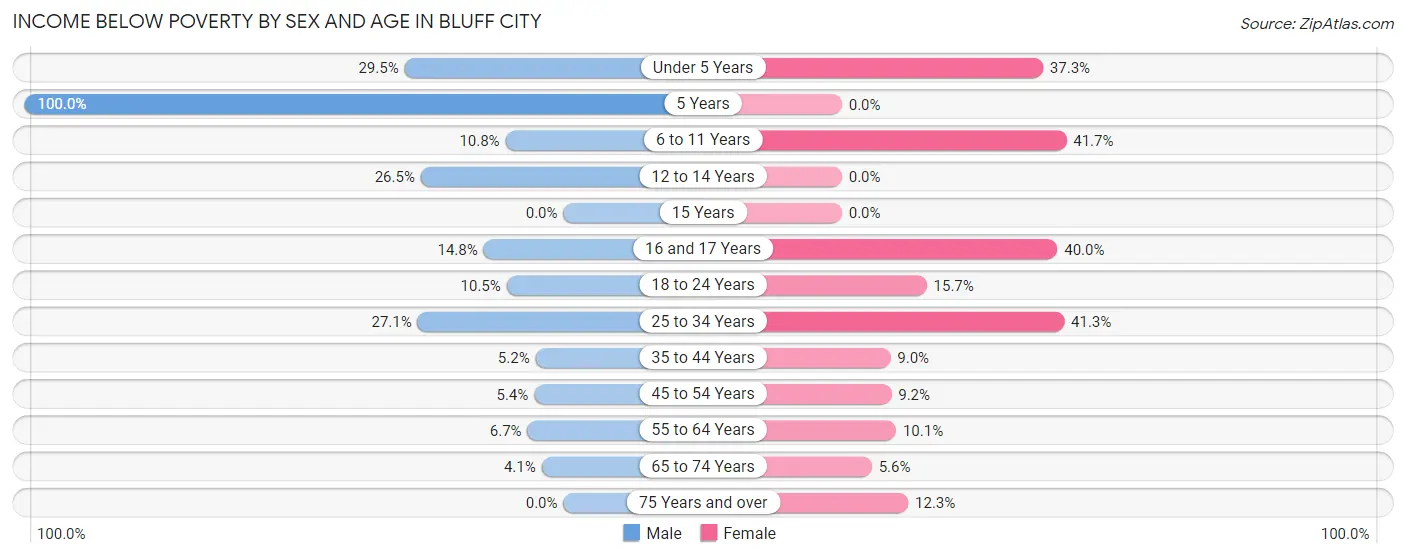
| Age Bracket | Male | Female |
| Under 5 Years | 23 (29.5%) | 28 (37.3%) |
| 5 Years | 17 (100.0%) | 0 (0.0%) |
| 6 to 11 Years | 10 (10.7%) | 35 (41.7%) |
| 12 to 14 Years | 9 (26.5%) | 0 (0.0%) |
| 15 Years | 0 (0.0%) | 0 (0.0%) |
| 16 and 17 Years | 4 (14.8%) | 4 (40.0%) |
| 18 to 24 Years | 6 (10.5%) | 17 (15.7%) |
| 25 to 34 Years | 59 (27.1%) | 78 (41.3%) |
| 35 to 44 Years | 3 (5.2%) | 21 (9.0%) |
| 45 to 54 Years | 10 (5.4%) | 9 (9.2%) |
| 55 to 64 Years | 9 (6.7%) | 18 (10.1%) |
| 65 to 74 Years | 3 (4.1%) | 5 (5.6%) |
| 75 Years and over | 0 (0.0%) | 8 (12.3%) |
| Total | 153 (14.9%) | 223 (18.0%) |
Income Above Poverty by Sex and Age in Bluff City
According to the poverty statistics in Bluff City, males aged 15 years and females aged 5 years are the age groups that are most secure financially, with 100.0% of males and 100.0% of females in these age groups living above the poverty line.
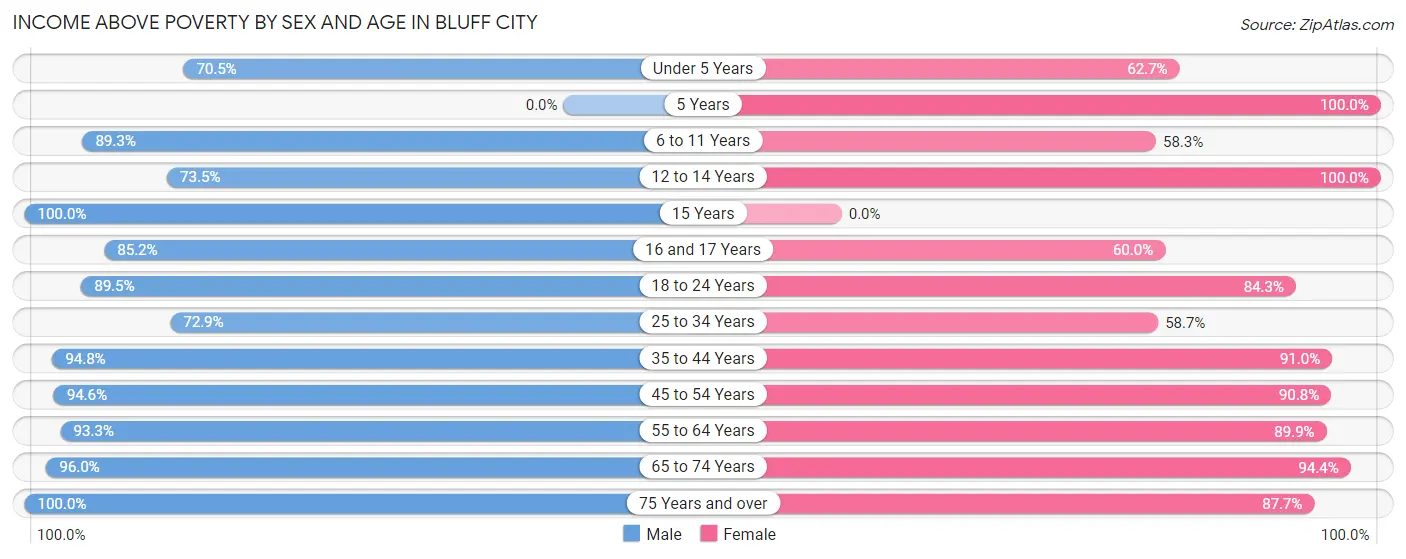
| Age Bracket | Male | Female |
| Under 5 Years | 55 (70.5%) | 47 (62.7%) |
| 5 Years | 0 (0.0%) | 5 (100.0%) |
| 6 to 11 Years | 83 (89.2%) | 49 (58.3%) |
| 12 to 14 Years | 25 (73.5%) | 101 (100.0%) |
| 15 Years | 16 (100.0%) | 0 (0.0%) |
| 16 and 17 Years | 23 (85.2%) | 6 (60.0%) |
| 18 to 24 Years | 51 (89.5%) | 91 (84.3%) |
| 25 to 34 Years | 159 (72.9%) | 111 (58.7%) |
| 35 to 44 Years | 55 (94.8%) | 212 (91.0%) |
| 45 to 54 Years | 174 (94.6%) | 89 (90.8%) |
| 55 to 64 Years | 126 (93.3%) | 161 (89.9%) |
| 65 to 74 Years | 71 (96.0%) | 85 (94.4%) |
| 75 Years and over | 33 (100.0%) | 57 (87.7%) |
| Total | 871 (85.1%) | 1,014 (82.0%) |
Income Below Poverty Among Married-Couple Families in Bluff City
The poverty statistics for married-couple families in Bluff City show that 12.5% or 62 of the total 496 families live below the poverty line. Families with 1 or 2 children have the highest poverty rate of 19.9%, comprising of 53 families. On the other hand, families with no children have the lowest poverty rate of 2.9%, which includes 6 families.
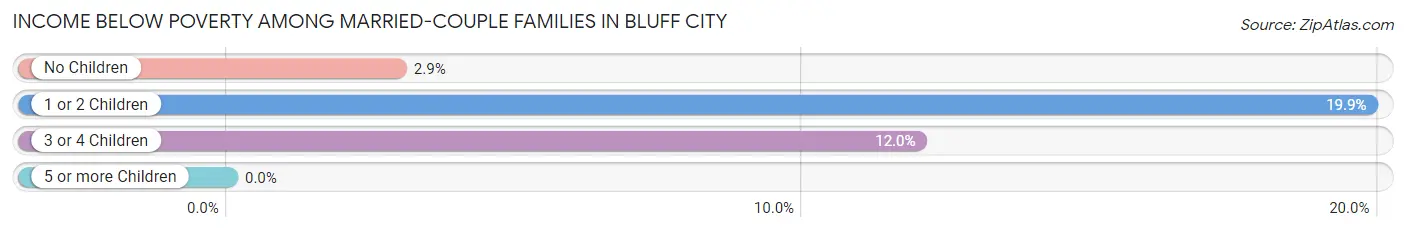
| Children | Above Poverty | Below Poverty |
| No Children | 198 (97.1%) | 6 (2.9%) |
| 1 or 2 Children | 214 (80.1%) | 53 (19.9%) |
| 3 or 4 Children | 22 (88.0%) | 3 (12.0%) |
| 5 or more Children | 0 (0.0%) | 0 (0.0%) |
| Total | 434 (87.5%) | 62 (12.5%) |
Income Below Poverty Among Single-Parent Households in Bluff City
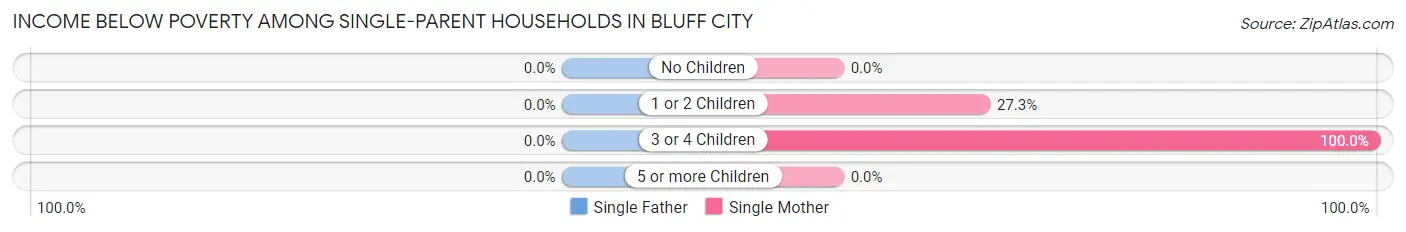
| Children | Single Father | Single Mother |
| No Children | 0 (0.0%) | 0 (0.0%) |
| 1 or 2 Children | 0 (0.0%) | 6 (27.3%) |
| 3 or 4 Children | 0 (0.0%) | 5 (100.0%) |
| 5 or more Children | 0 (0.0%) | 0 (0.0%) |
| Total | 0 (0.0%) | 11 (15.7%) |
Income Below Poverty Among Married-Couple vs Single-Parent Households in Bluff City
The poverty data for Bluff City shows that 62 of the married-couple family households (12.5%) and 11 of the single-parent households (8.6%) are living below the poverty level. Within the married-couple family households, those with 1 or 2 children have the highest poverty rate, with 53 households (19.9%) falling below the poverty line. Among the single-parent households, those with 3 or 4 children have the highest poverty rate, with 5 household (100.0%) living below poverty.
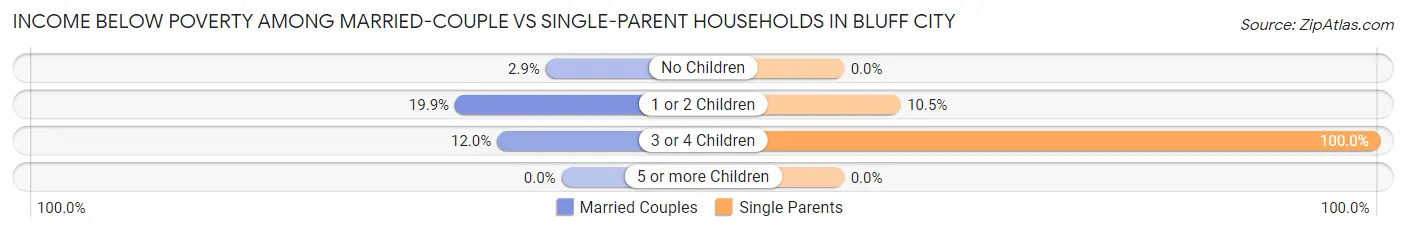
| Children | Married-Couple Families | Single-Parent Households |
| No Children | 6 (2.9%) | 0 (0.0%) |
| 1 or 2 Children | 53 (19.9%) | 6 (10.5%) |
| 3 or 4 Children | 3 (12.0%) | 5 (100.0%) |
| 5 or more Children | 0 (0.0%) | 0 (0.0%) |
| Total | 62 (12.5%) | 11 (8.6%) |
Race in Bluff City
The most populous races in Bluff City are White / Caucasian (2,204 | 97.5%), Two or more Races (48 | 2.1%), and Hispanic or Latino (4 | 0.2%).
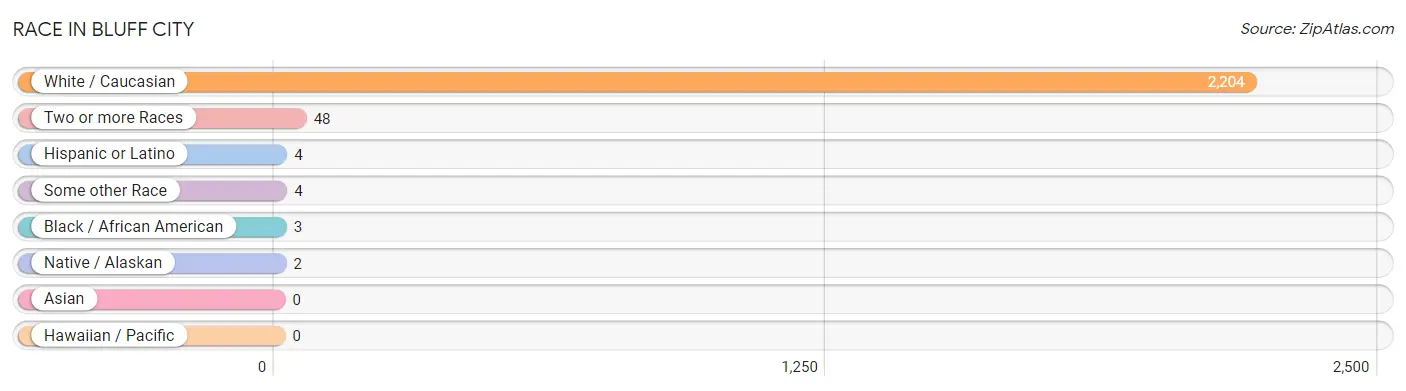
| Race | # Population | % Population |
| Asian | 0 | 0.0% |
| Black / African American | 3 | 0.1% |
| Hawaiian / Pacific | 0 | 0.0% |
| Hispanic or Latino | 4 | 0.2% |
| Native / Alaskan | 2 | 0.1% |
| White / Caucasian | 2,204 | 97.5% |
| Two or more Races | 48 | 2.1% |
| Some other Race | 4 | 0.2% |
| Total | 2,261 | 100.0% |
Ancestry in Bluff City
The most populous ancestries reported in Bluff City are American (557 | 24.6%), German (306 | 13.5%), Irish (211 | 9.3%), English (183 | 8.1%), and Scotch-Irish (107 | 4.7%), together accounting for 60.3% of all Bluff City residents.
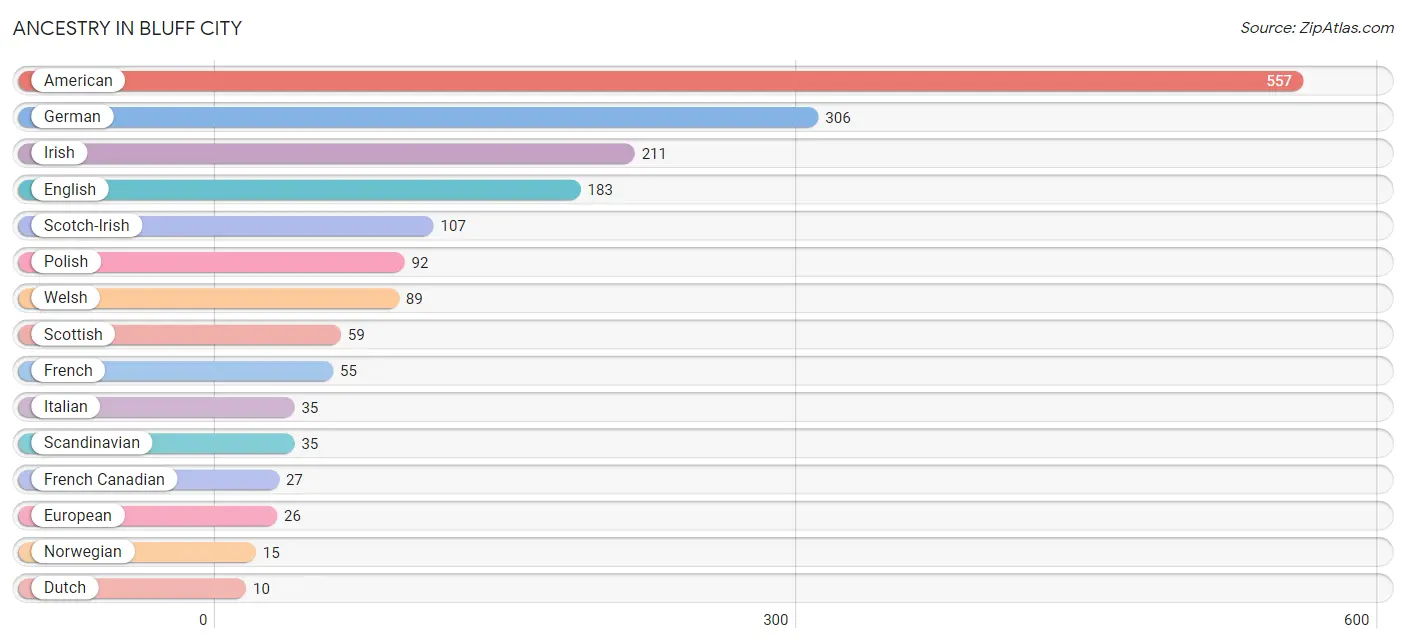
| Ancestry | # Population | % Population |
| African | 3 | 0.1% |
| American | 557 | 24.6% |
| British | 3 | 0.1% |
| Burmese | 2 | 0.1% |
| Cajun | 7 | 0.3% |
| Cherokee | 6 | 0.3% |
| Chippewa | 2 | 0.1% |
| Cuban | 4 | 0.2% |
| Dutch | 10 | 0.4% |
| English | 183 | 8.1% |
| European | 26 | 1.1% |
| Finnish | 3 | 0.1% |
| French | 55 | 2.4% |
| French Canadian | 27 | 1.2% |
| German | 306 | 13.5% |
| Irish | 211 | 9.3% |
| Iroquois | 5 | 0.2% |
| Italian | 35 | 1.5% |
| Norwegian | 15 | 0.7% |
| Polish | 92 | 4.1% |
| Russian | 5 | 0.2% |
| Scandinavian | 35 | 1.5% |
| Scotch-Irish | 107 | 4.7% |
| Scottish | 59 | 2.6% |
| Subsaharan African | 3 | 0.1% |
| Swedish | 3 | 0.1% |
| Welsh | 89 | 3.9% | View All 27 Rows |
Immigrants in Bluff City
The most numerous immigrant groups reported in Bluff City came from Caribbean (4 | 0.2%), Cuba (4 | 0.2%), and Latin America (4 | 0.2%), together accounting for 0.5% of all Bluff City residents.
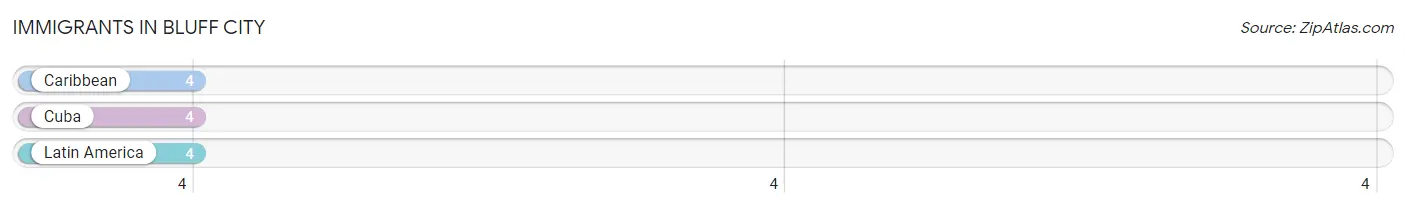
| Immigration Origin | # Population | % Population |
| Caribbean | 4 | 0.2% |
| Cuba | 4 | 0.2% |
| Latin America | 4 | 0.2% | View All 3 Rows |
Sex and Age in Bluff City
Sex and Age in Bluff City
The most populous age groups in Bluff City are 30 to 34 Years (119 | 11.6%) for men and 40 to 44 Years (166 | 13.4%) for women.
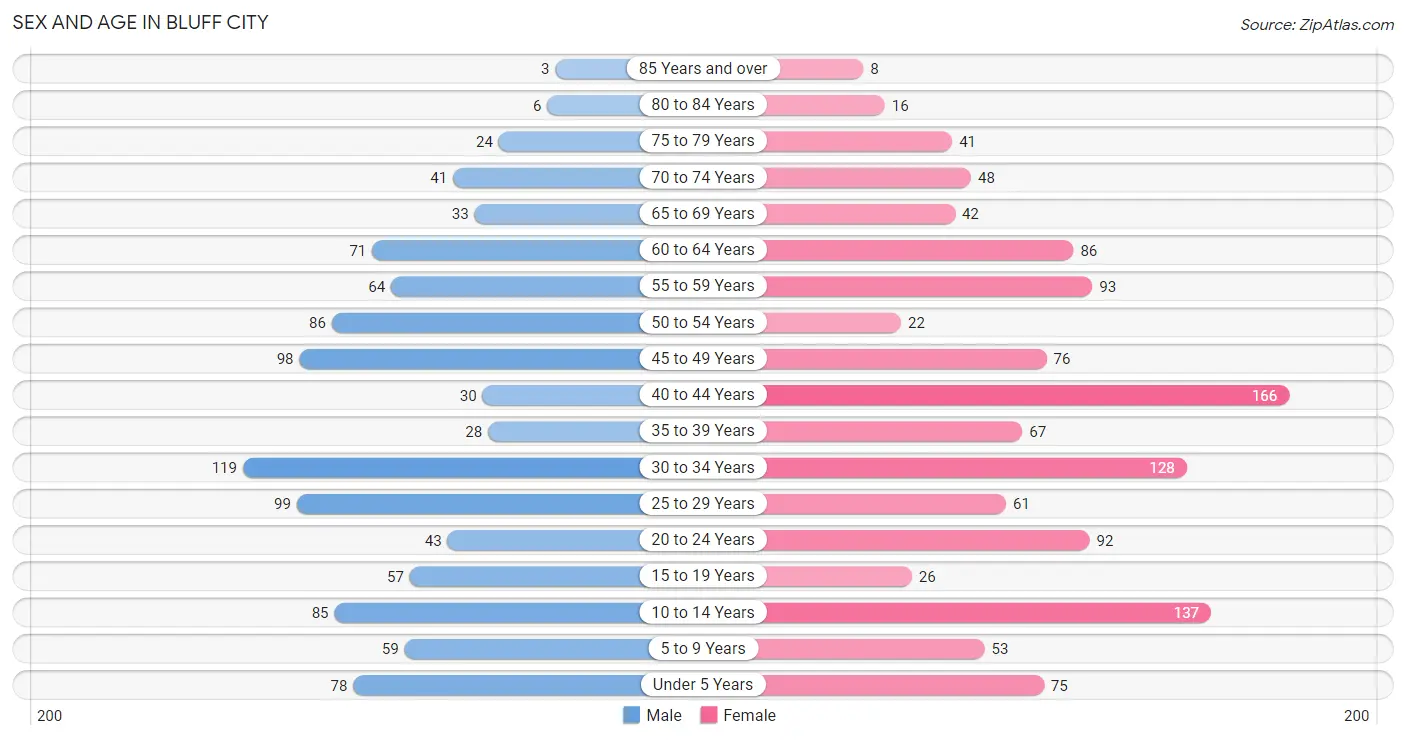
| Age Bracket | Male | Female |
| Under 5 Years | 78 (7.6%) | 75 (6.1%) |
| 5 to 9 Years | 59 (5.8%) | 53 (4.3%) |
| 10 to 14 Years | 85 (8.3%) | 137 (11.1%) |
| 15 to 19 Years | 57 (5.6%) | 26 (2.1%) |
| 20 to 24 Years | 43 (4.2%) | 92 (7.4%) |
| 25 to 29 Years | 99 (9.7%) | 61 (4.9%) |
| 30 to 34 Years | 119 (11.6%) | 128 (10.3%) |
| 35 to 39 Years | 28 (2.7%) | 67 (5.4%) |
| 40 to 44 Years | 30 (2.9%) | 166 (13.4%) |
| 45 to 49 Years | 98 (9.6%) | 76 (6.1%) |
| 50 to 54 Years | 86 (8.4%) | 22 (1.8%) |
| 55 to 59 Years | 64 (6.2%) | 93 (7.5%) |
| 60 to 64 Years | 71 (6.9%) | 86 (7.0%) |
| 65 to 69 Years | 33 (3.2%) | 42 (3.4%) |
| 70 to 74 Years | 41 (4.0%) | 48 (3.9%) |
| 75 to 79 Years | 24 (2.3%) | 41 (3.3%) |
| 80 to 84 Years | 6 (0.6%) | 16 (1.3%) |
| 85 Years and over | 3 (0.3%) | 8 (0.6%) |
| Total | 1,024 (100.0%) | 1,237 (100.0%) |
Families and Households in Bluff City
Median Family Size in Bluff City
The median family size in Bluff City is 2.98 persons per family, with married-couple families (496 | 79.5%) accounting for the largest median family size of 3.04 persons per family. On the other hand, single male/father families (58 | 9.3%) represent the smallest median family size with 2.60 persons per family.
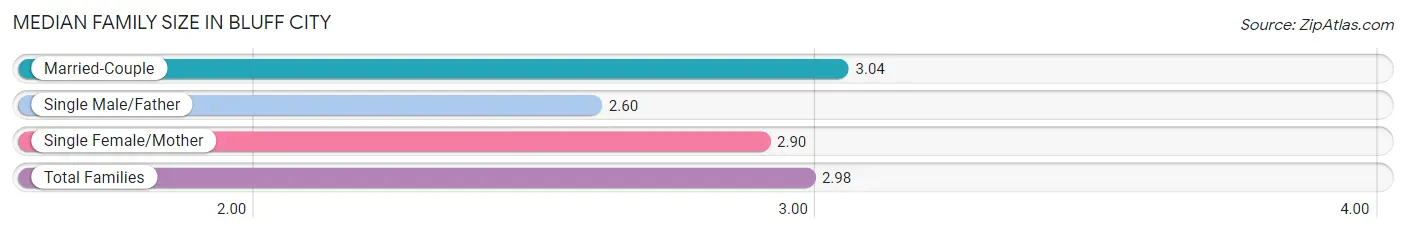
| Family Type | # Families | Family Size |
| Married-Couple | 496 (79.5%) | 3.04 |
| Single Male/Father | 58 (9.3%) | 2.60 |
| Single Female/Mother | 70 (11.2%) | 2.90 |
| Total Families | 624 (100.0%) | 2.98 |
Median Household Size in Bluff City
The median household size in Bluff City is 2.48 persons per household, with single female/mother households (70 | 7.7%) accounting for the largest median household size of 3.26 persons per household. non-family households (289 | 31.7%) represent the smallest median household size with 1.25 persons per household.
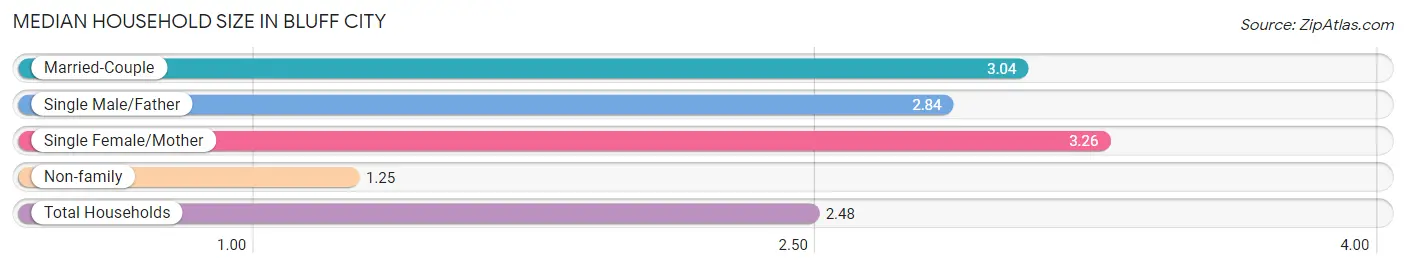
| Household Type | # Households | Household Size |
| Married-Couple | 496 (54.3%) | 3.04 |
| Single Male/Father | 58 (6.4%) | 2.84 |
| Single Female/Mother | 70 (7.7%) | 3.26 |
| Non-family | 289 (31.7%) | 1.25 |
| Total Households | 913 (100.0%) | 2.48 |
Household Size by Marriage Status in Bluff City
Out of a total of 913 households in Bluff City, 624 (68.3%) are family households, while 289 (31.7%) are nonfamily households. The most numerous type of family households are 2-person households, comprising 248, and the most common type of nonfamily households are 1-person households, comprising 221.
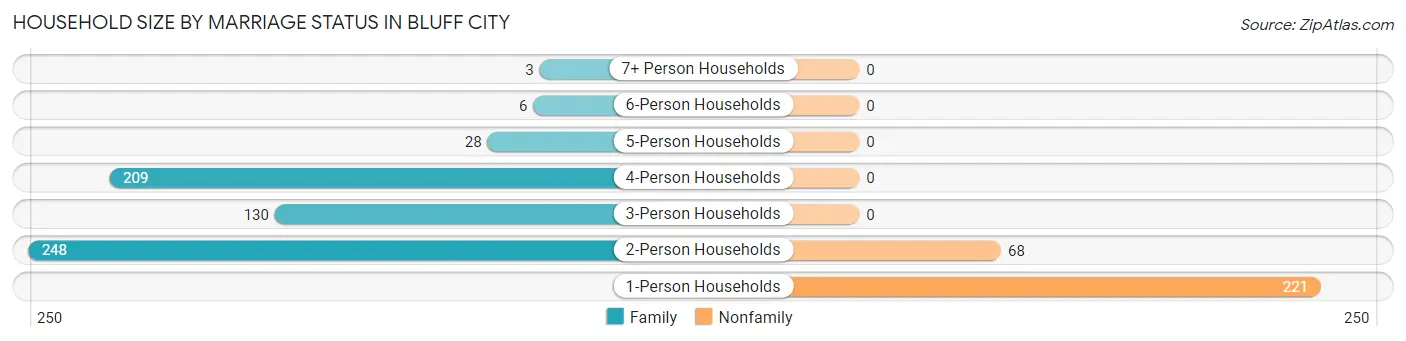
| Household Size | Family Households | Nonfamily Households |
| 1-Person Households | - | 221 (24.2%) |
| 2-Person Households | 248 (27.2%) | 68 (7.4%) |
| 3-Person Households | 130 (14.2%) | 0 (0.0%) |
| 4-Person Households | 209 (22.9%) | 0 (0.0%) |
| 5-Person Households | 28 (3.1%) | 0 (0.0%) |
| 6-Person Households | 6 (0.7%) | 0 (0.0%) |
| 7+ Person Households | 3 (0.3%) | 0 (0.0%) |
| Total | 624 (68.3%) | 289 (31.7%) |
Female Fertility in Bluff City
Fertility by Age in Bluff City
Average fertility rate in Bluff City is 45.0 births per 1,000 women. Women in the age bracket of 20 to 34 years have the highest fertility rate with 71.0 births per 1,000 women. Women in the age bracket of 20 to 34 years acount for 71.4% of all women with births.
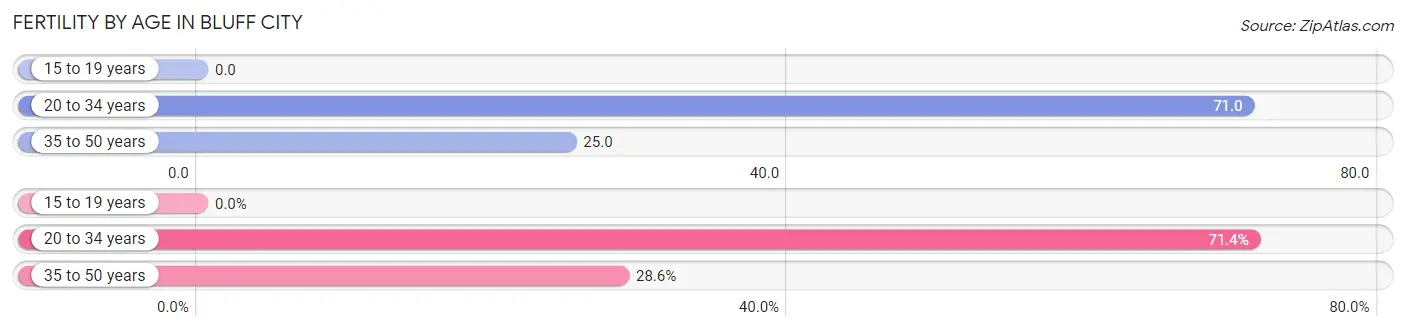
| Age Bracket | Women with Births | Births / 1,000 Women |
| 15 to 19 years | 0 (0.0%) | 0.0 |
| 20 to 34 years | 20 (71.4%) | 71.0 |
| 35 to 50 years | 8 (28.6%) | 25.0 |
| Total | 28 (100.0%) | 45.0 |
Fertility by Age by Marriage Status in Bluff City
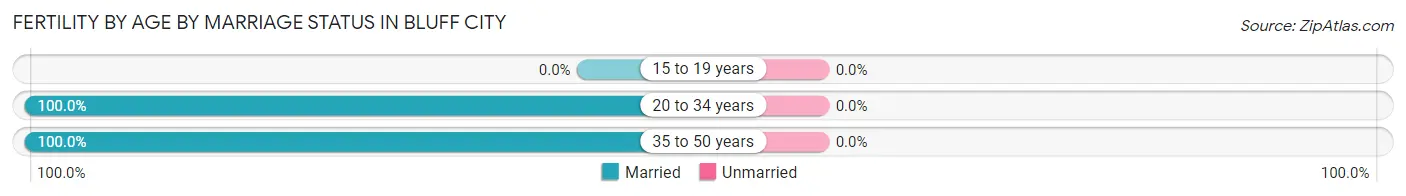
| Age Bracket | Married | Unmarried |
| 15 to 19 years | 0 (0.0%) | 0 (0.0%) |
| 20 to 34 years | 20 (100.0%) | 0 (0.0%) |
| 35 to 50 years | 8 (100.0%) | 0 (0.0%) |
| Total | 28 (100.0%) | 0 (0.0%) |
Fertility by Education in Bluff City
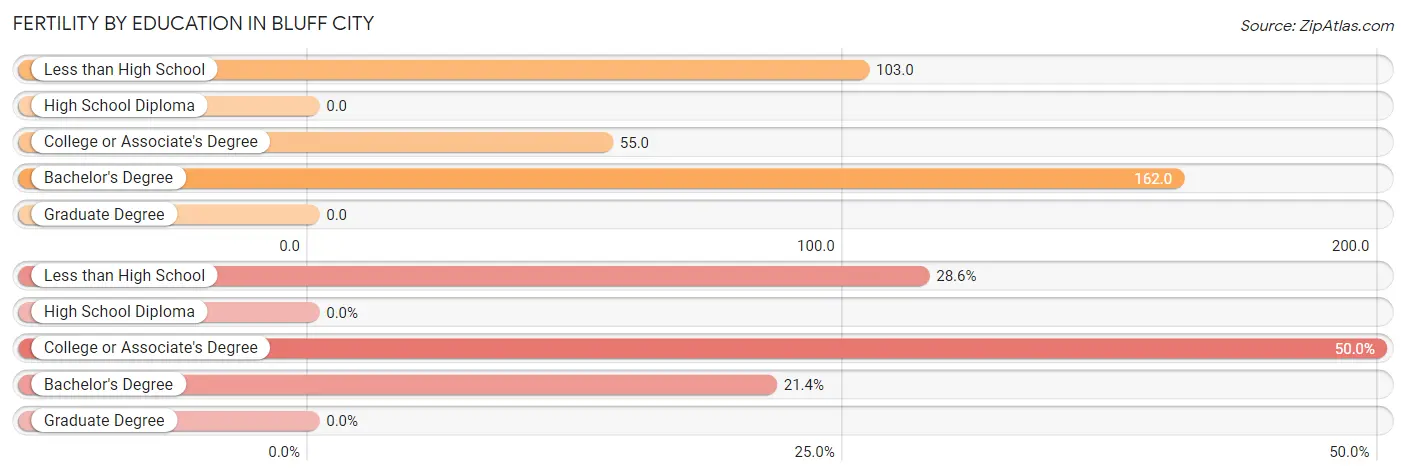
| Educational Attainment | Women with Births | Births / 1,000 Women |
| Less than High School | 8 (28.6%) | 103.0 |
| High School Diploma | 0 (0.0%) | 0.0 |
| College or Associate's Degree | 14 (50.0%) | 55.0 |
| Bachelor's Degree | 6 (21.4%) | 162.0 |
| Graduate Degree | 0 (0.0%) | 0.0 |
| Total | 28 (100.0%) | 45.0 |
Fertility by Education by Marriage Status in Bluff City
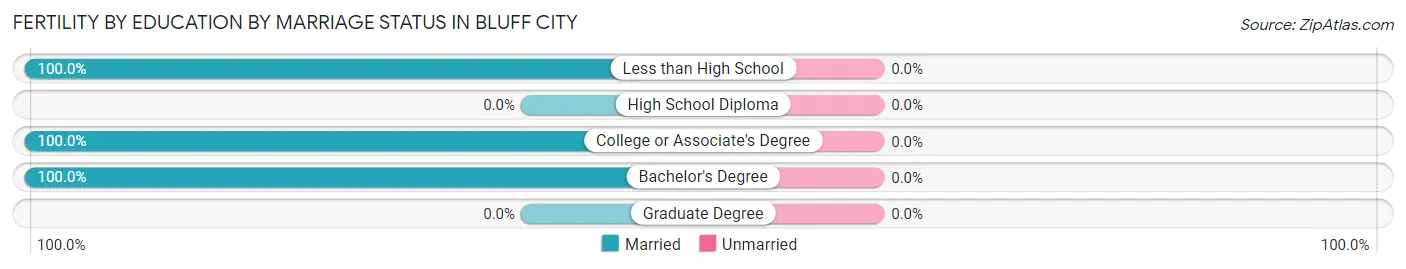
| Educational Attainment | Married | Unmarried |
| Less than High School | 8 (100.0%) | 0 (0.0%) |
| High School Diploma | 0 (0.0%) | 0 (0.0%) |
| College or Associate's Degree | 14 (100.0%) | 0 (0.0%) |
| Bachelor's Degree | 6 (100.0%) | 0 (0.0%) |
| Graduate Degree | 0 (0.0%) | 0 (0.0%) |
| Total | 28 (100.0%) | 0 (0.0%) |
Employment Characteristics in Bluff City
Employment by Class of Employer in Bluff City
Among the 1,113 employed individuals in Bluff City, private company employees (875 | 78.6%), not-for-profit organizations (96 | 8.6%), and self-employed (not incorporated) (58 | 5.2%) make up the most common classes of employment.
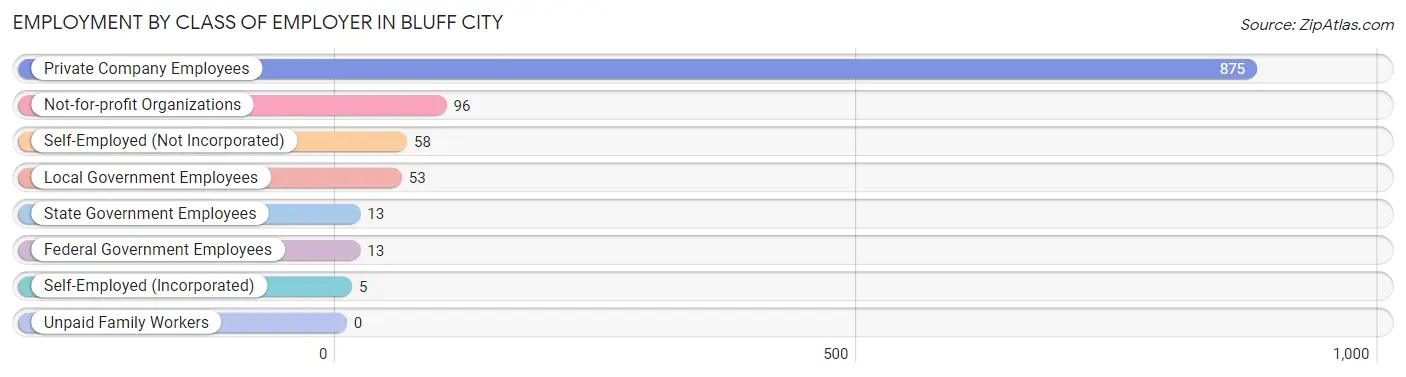
| Employer Class | # Employees | % Employees |
| Private Company Employees | 875 | 78.6% |
| Self-Employed (Incorporated) | 5 | 0.4% |
| Self-Employed (Not Incorporated) | 58 | 5.2% |
| Not-for-profit Organizations | 96 | 8.6% |
| Local Government Employees | 53 | 4.8% |
| State Government Employees | 13 | 1.2% |
| Federal Government Employees | 13 | 1.2% |
| Unpaid Family Workers | 0 | 0.0% |
| Total | 1,113 | 100.0% |
Employment Status by Age in Bluff City
According to the labor force statistics for Bluff City, out of the total population over 16 years of age (1,758), 66.6% or 1,171 individuals are in the labor force, with 2.4% or 28 of them unemployed. The age group with the highest labor force participation rate is 25 to 29 years, with 95.0% or 152 individuals in the labor force. Within the labor force, the 20 to 24 years age range has the highest percentage of unemployed individuals, with 13.3% or 17 of them being unemployed.
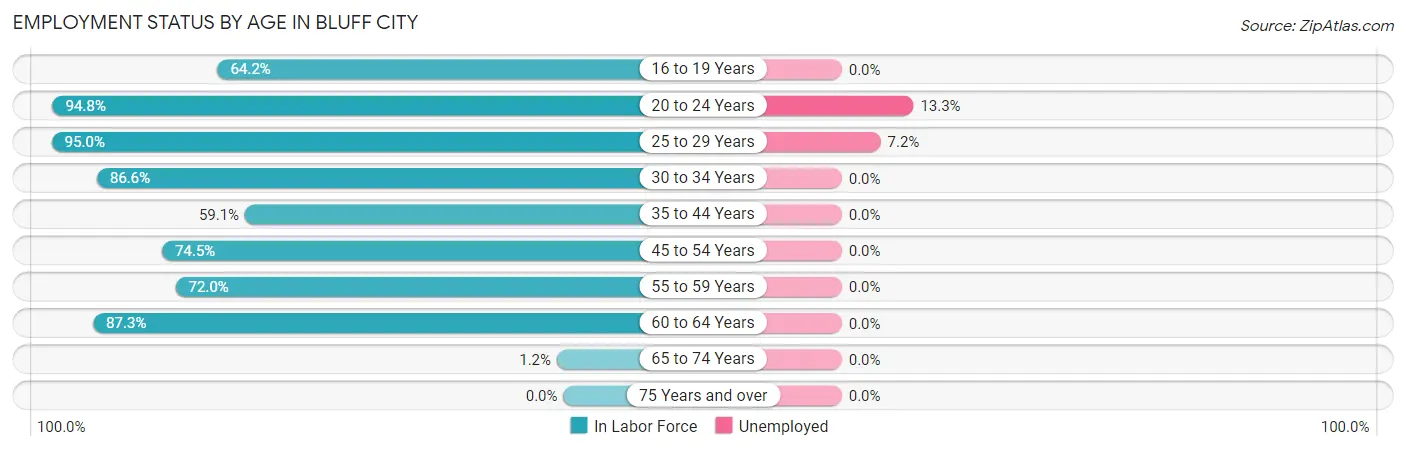
| Age Bracket | In Labor Force | Unemployed |
| 16 to 19 Years | 43 (64.2%) | 0 (0.0%) |
| 20 to 24 Years | 128 (94.8%) | 17 (13.3%) |
| 25 to 29 Years | 152 (95.0%) | 11 (7.2%) |
| 30 to 34 Years | 214 (86.6%) | 0 (0.0%) |
| 35 to 44 Years | 172 (59.1%) | 0 (0.0%) |
| 45 to 54 Years | 210 (74.5%) | 0 (0.0%) |
| 55 to 59 Years | 113 (72.0%) | 0 (0.0%) |
| 60 to 64 Years | 137 (87.3%) | 0 (0.0%) |
| 65 to 74 Years | 2 (1.2%) | 0 (0.0%) |
| 75 Years and over | 0 (0.0%) | 0 (0.0%) |
| Total | 1,171 (66.6%) | 28 (2.4%) |
Employment Status by Educational Attainment in Bluff City
According to labor force statistics for Bluff City, 77.1% of individuals (998) out of the total population between 25 and 64 years of age (1,294) are in the labor force, with 1.1% or 11 of them being unemployed. The group with the highest labor force participation rate are those with the educational attainment of bachelor's degree or higher, with 93.2% or 165 individuals in the labor force. Within the labor force, individuals with college / associate degree education have the highest percentage of unemployment, with 2.8% or 11 of them being unemployed.
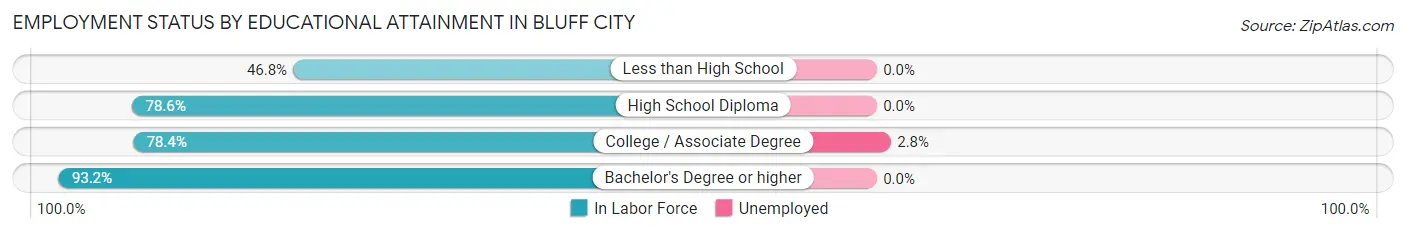
| Educational Attainment | In Labor Force | Unemployed |
| Less than High School | 65 (46.8%) | 0 (0.0%) |
| High School Diploma | 375 (78.6%) | 0 (0.0%) |
| College / Associate Degree | 393 (78.4%) | 14 (2.8%) |
| Bachelor's Degree or higher | 165 (93.2%) | 0 (0.0%) |
| Total | 998 (77.1%) | 14 (1.1%) |
Employment Occupations by Sex in Bluff City
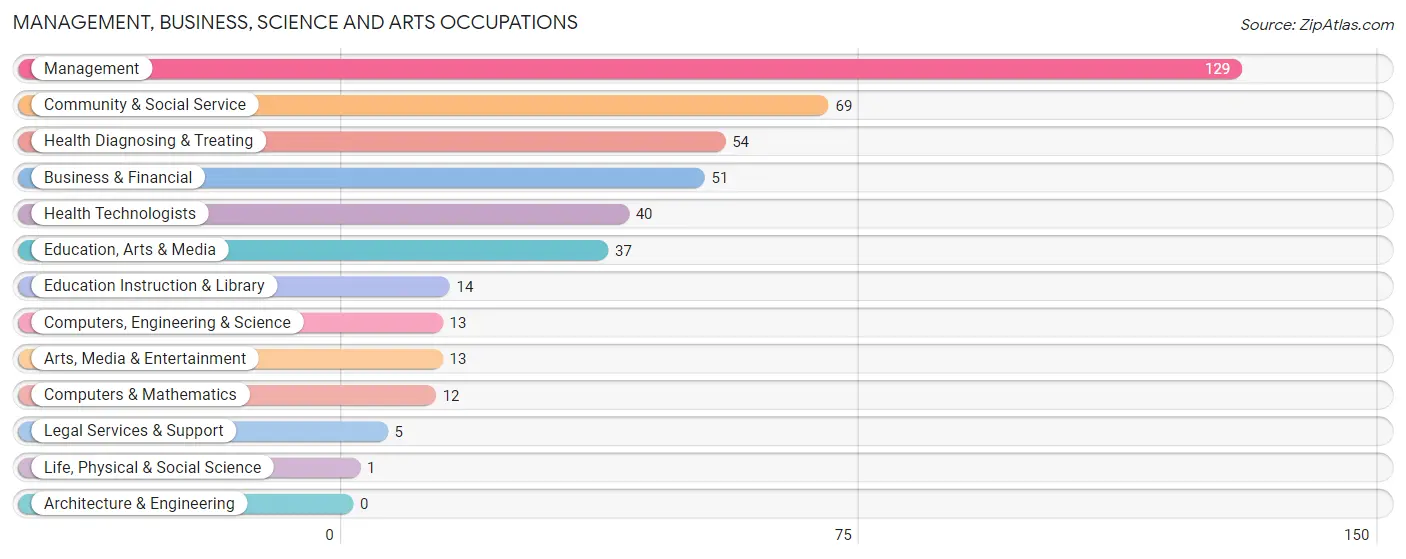
Management, Business, Science and Arts Occupations
The most common Management, Business, Science and Arts occupations in Bluff City are Management (129 | 11.3%), Community & Social Service (69 | 6.0%), Health Diagnosing & Treating (54 | 4.7%), Business & Financial (51 | 4.5%), and Health Technologists (40 | 3.5%).
Management, Business, Science and Arts Occupations by Sex
Within the Management, Business, Science and Arts occupations in Bluff City, the most male-oriented occupations are Life, Physical & Social Science (100.0%), Computers, Engineering & Science (92.3%), and Computers & Mathematics (91.7%), while the most female-oriented occupations are Legal Services & Support (100.0%), Education Instruction & Library (100.0%), and Health Diagnosing & Treating (75.9%).
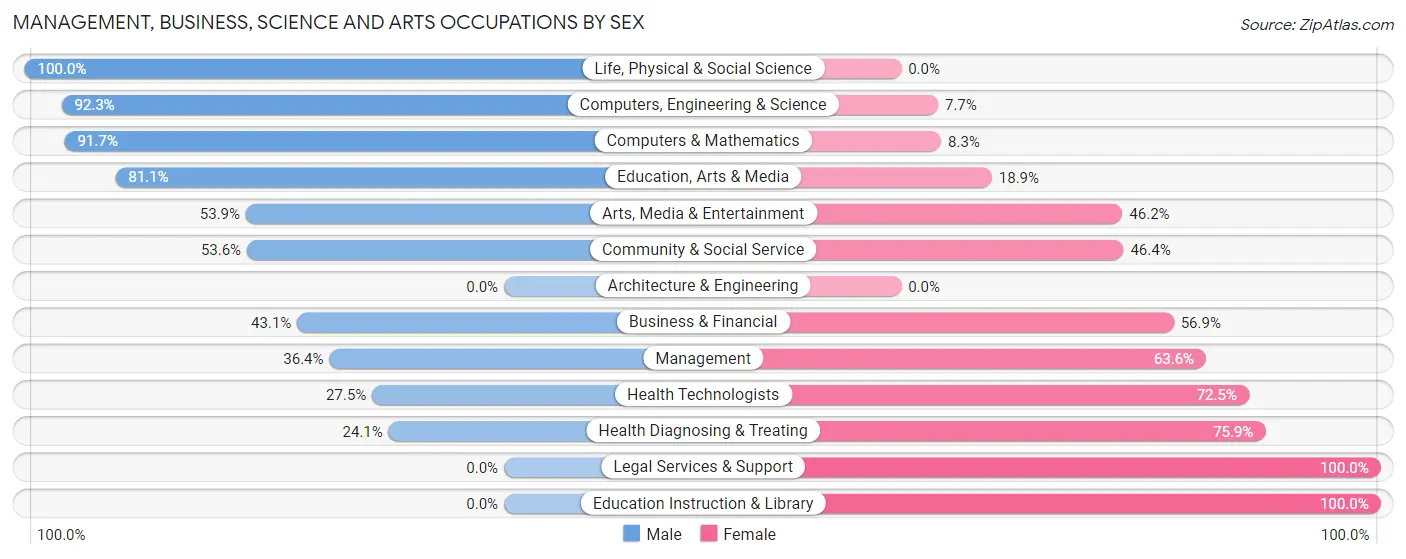
| Occupation | Male | Female |
| Management | 47 (36.4%) | 82 (63.6%) |
| Business & Financial | 22 (43.1%) | 29 (56.9%) |
| Computers, Engineering & Science | 12 (92.3%) | 1 (7.7%) |
| Computers & Mathematics | 11 (91.7%) | 1 (8.3%) |
| Architecture & Engineering | 0 (0.0%) | 0 (0.0%) |
| Life, Physical & Social Science | 1 (100.0%) | 0 (0.0%) |
| Community & Social Service | 37 (53.6%) | 32 (46.4%) |
| Education, Arts & Media | 30 (81.1%) | 7 (18.9%) |
| Legal Services & Support | 0 (0.0%) | 5 (100.0%) |
| Education Instruction & Library | 0 (0.0%) | 14 (100.0%) |
| Arts, Media & Entertainment | 7 (53.8%) | 6 (46.2%) |
| Health Diagnosing & Treating | 13 (24.1%) | 41 (75.9%) |
| Health Technologists | 11 (27.5%) | 29 (72.5%) |
| Total (Category) | 131 (41.5%) | 185 (58.5%) |
| Total (Overall) | 591 (51.7%) | 552 (48.3%) |
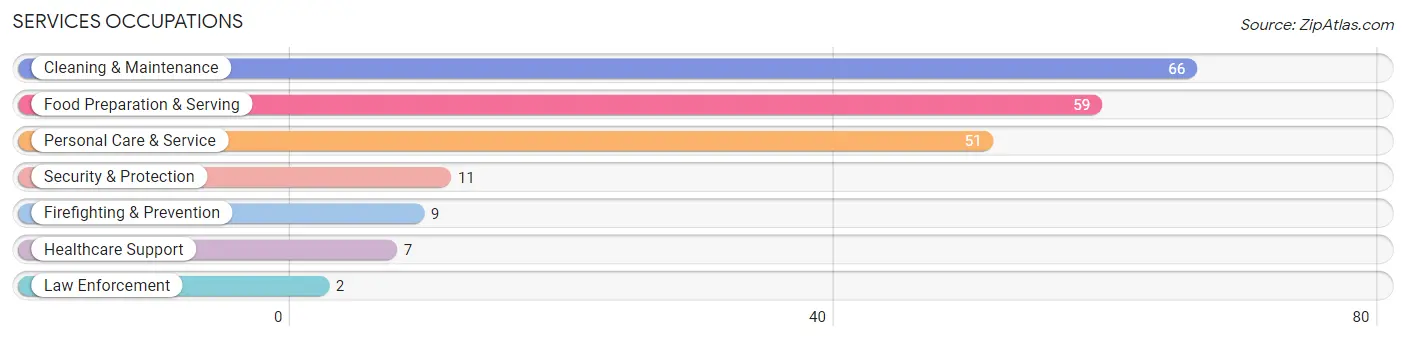
Services Occupations
The most common Services occupations in Bluff City are Cleaning & Maintenance (66 | 5.8%), Food Preparation & Serving (59 | 5.2%), Personal Care & Service (51 | 4.5%), Security & Protection (11 | 1.0%), and Firefighting & Prevention (9 | 0.8%).
Services Occupations by Sex
Within the Services occupations in Bluff City, the most male-oriented occupations are Firefighting & Prevention (100.0%), Cleaning & Maintenance (100.0%), and Security & Protection (81.8%), while the most female-oriented occupations are Law Enforcement (100.0%), Personal Care & Service (100.0%), and Healthcare Support (57.1%).
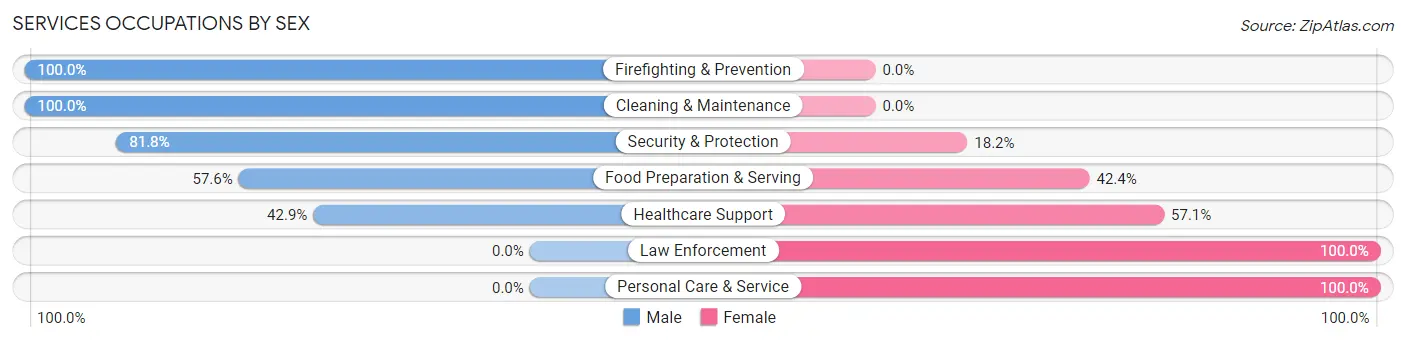
| Occupation | Male | Female |
| Healthcare Support | 3 (42.9%) | 4 (57.1%) |
| Security & Protection | 9 (81.8%) | 2 (18.2%) |
| Firefighting & Prevention | 9 (100.0%) | 0 (0.0%) |
| Law Enforcement | 0 (0.0%) | 2 (100.0%) |
| Food Preparation & Serving | 34 (57.6%) | 25 (42.4%) |
| Cleaning & Maintenance | 66 (100.0%) | 0 (0.0%) |
| Personal Care & Service | 0 (0.0%) | 51 (100.0%) |
| Total (Category) | 112 (57.7%) | 82 (42.3%) |
| Total (Overall) | 591 (51.7%) | 552 (48.3%) |
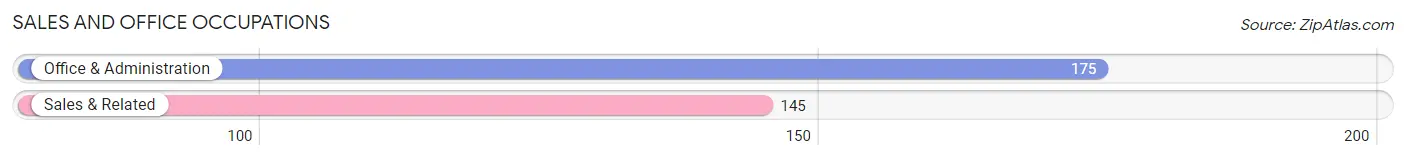
Sales and Office Occupations
The most common Sales and Office occupations in Bluff City are Office & Administration (175 | 15.3%), and Sales & Related (145 | 12.7%).
Sales and Office Occupations by Sex
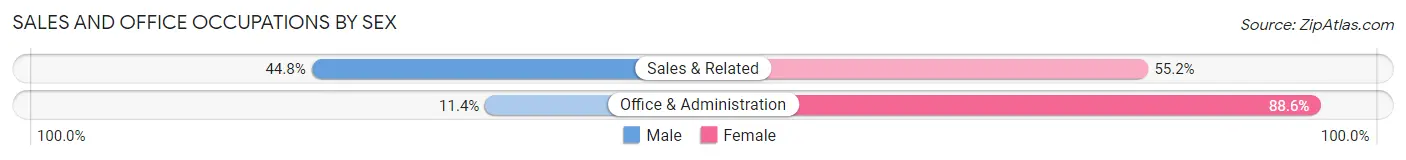
| Occupation | Male | Female |
| Sales & Related | 65 (44.8%) | 80 (55.2%) |
| Office & Administration | 20 (11.4%) | 155 (88.6%) |
| Total (Category) | 85 (26.6%) | 235 (73.4%) |
| Total (Overall) | 591 (51.7%) | 552 (48.3%) |
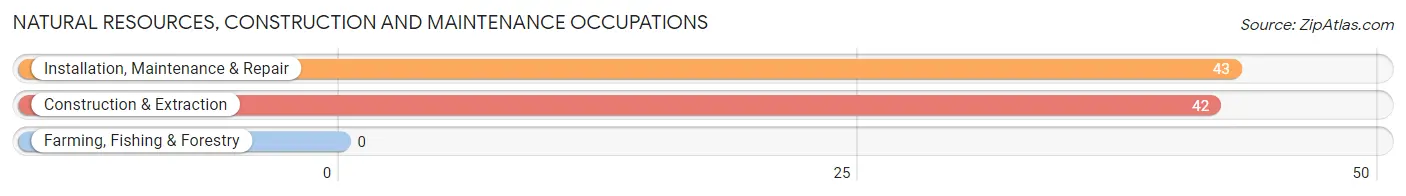
Natural Resources, Construction and Maintenance Occupations
The most common Natural Resources, Construction and Maintenance occupations in Bluff City are Installation, Maintenance & Repair (43 | 3.8%), and Construction & Extraction (42 | 3.7%).
Natural Resources, Construction and Maintenance Occupations by Sex
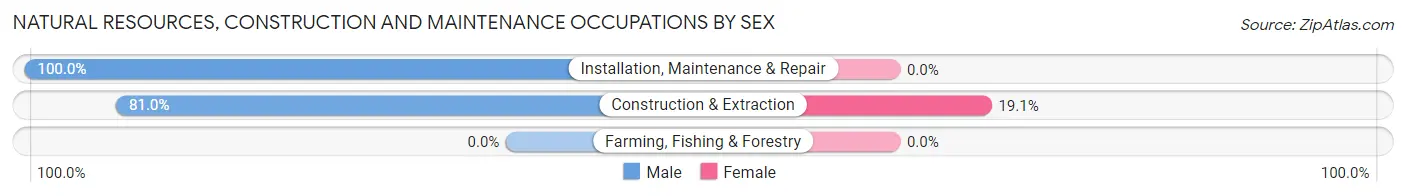
| Occupation | Male | Female |
| Farming, Fishing & Forestry | 0 (0.0%) | 0 (0.0%) |
| Construction & Extraction | 34 (80.9%) | 8 (19.1%) |
| Installation, Maintenance & Repair | 43 (100.0%) | 0 (0.0%) |
| Total (Category) | 77 (90.6%) | 8 (9.4%) |
| Total (Overall) | 591 (51.7%) | 552 (48.3%) |
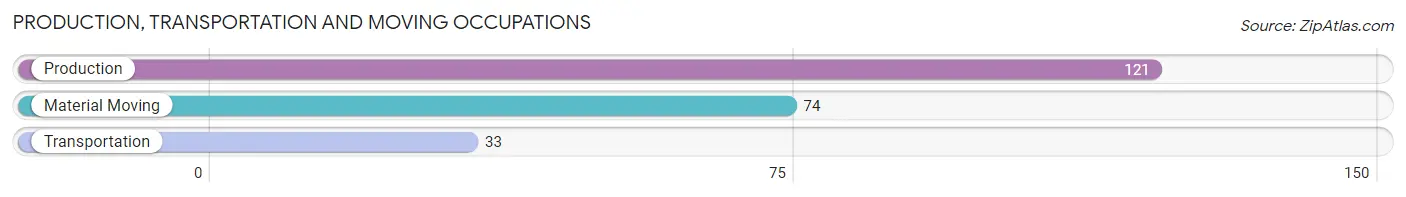
Production, Transportation and Moving Occupations
The most common Production, Transportation and Moving occupations in Bluff City are Production (121 | 10.6%), Material Moving (74 | 6.5%), and Transportation (33 | 2.9%).
Production, Transportation and Moving Occupations by Sex
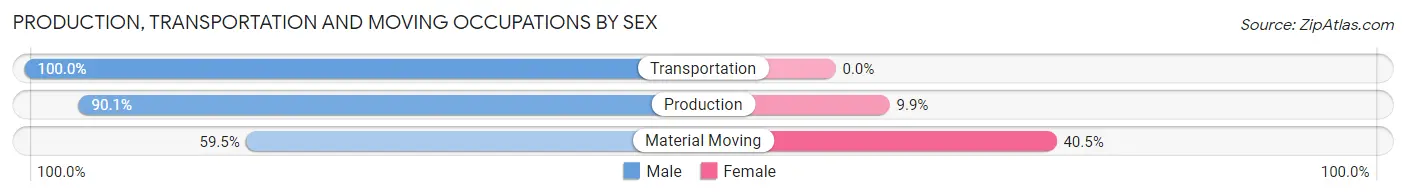
| Occupation | Male | Female |
| Production | 109 (90.1%) | 12 (9.9%) |
| Transportation | 33 (100.0%) | 0 (0.0%) |
| Material Moving | 44 (59.5%) | 30 (40.5%) |
| Total (Category) | 186 (81.6%) | 42 (18.4%) |
| Total (Overall) | 591 (51.7%) | 552 (48.3%) |
Employment Industries by Sex in Bluff City
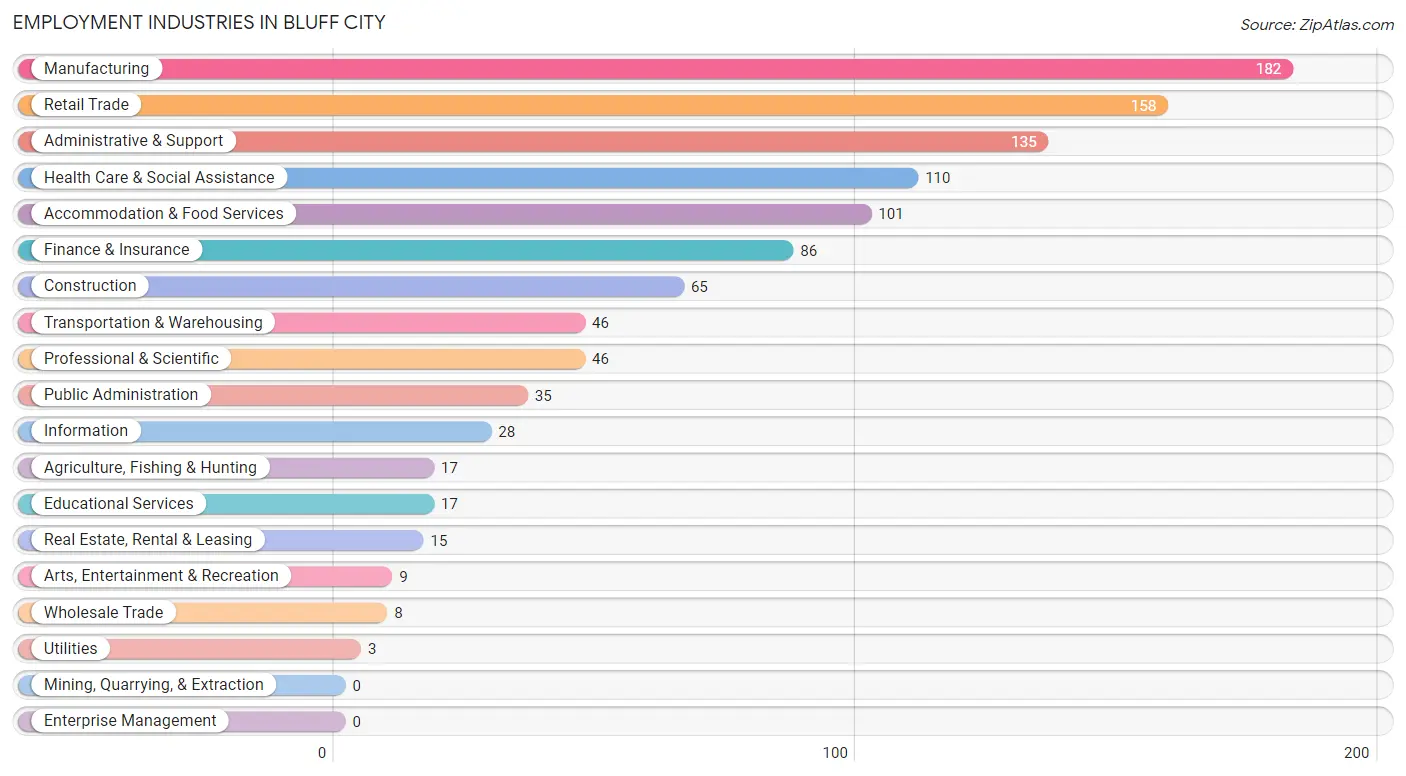
Employment Industries in Bluff City
The major employment industries in Bluff City include Manufacturing (182 | 15.9%), Retail Trade (158 | 13.8%), Administrative & Support (135 | 11.8%), Health Care & Social Assistance (110 | 9.6%), and Accommodation & Food Services (101 | 8.8%).
Employment Industries by Sex in Bluff City
The Bluff City industries that see more men than women are Agriculture, Fishing & Hunting (100.0%), Wholesale Trade (100.0%), and Utilities (100.0%), whereas the industries that tend to have a higher number of women are Educational Services (100.0%), Public Administration (88.6%), and Real Estate, Rental & Leasing (80.0%).
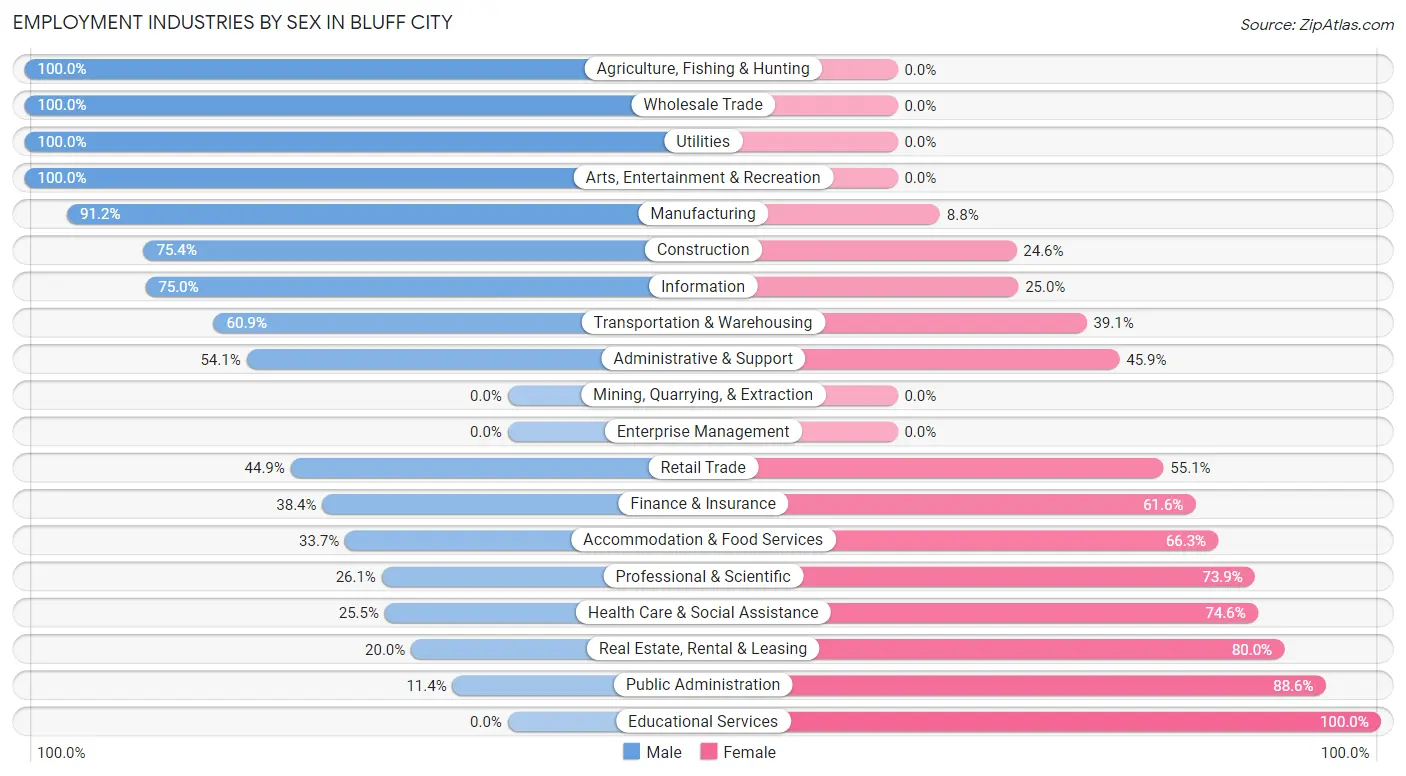
| Industry | Male | Female |
| Agriculture, Fishing & Hunting | 17 (100.0%) | 0 (0.0%) |
| Mining, Quarrying, & Extraction | 0 (0.0%) | 0 (0.0%) |
| Construction | 49 (75.4%) | 16 (24.6%) |
| Manufacturing | 166 (91.2%) | 16 (8.8%) |
| Wholesale Trade | 8 (100.0%) | 0 (0.0%) |
| Retail Trade | 71 (44.9%) | 87 (55.1%) |
| Transportation & Warehousing | 28 (60.9%) | 18 (39.1%) |
| Utilities | 3 (100.0%) | 0 (0.0%) |
| Information | 21 (75.0%) | 7 (25.0%) |
| Finance & Insurance | 33 (38.4%) | 53 (61.6%) |
| Real Estate, Rental & Leasing | 3 (20.0%) | 12 (80.0%) |
| Professional & Scientific | 12 (26.1%) | 34 (73.9%) |
| Enterprise Management | 0 (0.0%) | 0 (0.0%) |
| Administrative & Support | 73 (54.1%) | 62 (45.9%) |
| Educational Services | 0 (0.0%) | 17 (100.0%) |
| Health Care & Social Assistance | 28 (25.5%) | 82 (74.6%) |
| Arts, Entertainment & Recreation | 9 (100.0%) | 0 (0.0%) |
| Accommodation & Food Services | 34 (33.7%) | 67 (66.3%) |
| Public Administration | 4 (11.4%) | 31 (88.6%) |
| Total | 591 (51.7%) | 552 (48.3%) |
Education in Bluff City
School Enrollment in Bluff City
The most common levels of schooling among the 495 students in Bluff City are middle school (177 | 35.8%), elementary school (99 | 20.0%), and high school (91 | 18.4%).
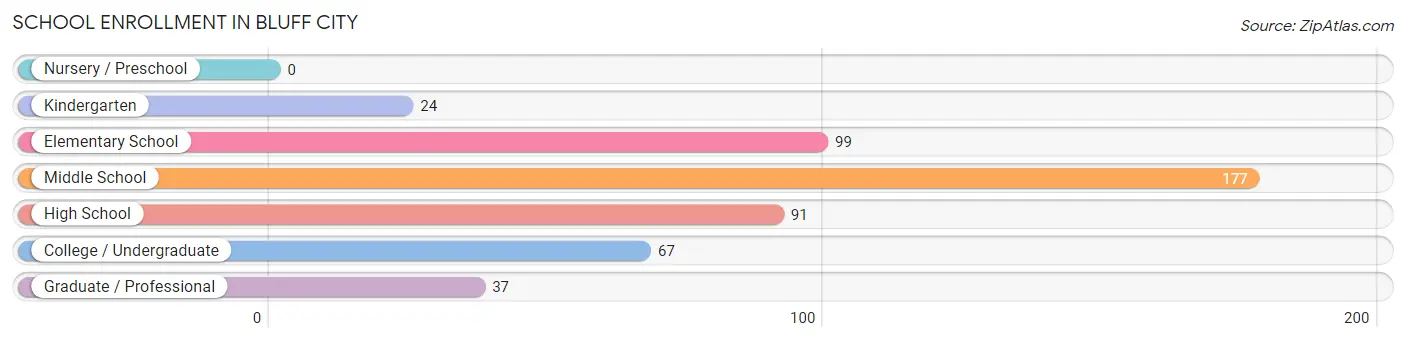
| School Level | # Students | % Students |
| Nursery / Preschool | 0 | 0.0% |
| Kindergarten | 24 | 4.9% |
| Elementary School | 99 | 20.0% |
| Middle School | 177 | 35.8% |
| High School | 91 | 18.4% |
| College / Undergraduate | 67 | 13.5% |
| Graduate / Professional | 37 | 7.5% |
| Total | 495 | 100.0% |
School Enrollment by Age by Funding Source in Bluff City
Out of a total of 495 students who are enrolled in schools in Bluff City, 14 (2.8%) attend a private institution, while the remaining 481 (97.2%) are enrolled in public schools. The age group of 35 years and over has the highest likelihood of being enrolled in private schools, with 2 (14.3% in the age bracket) enrolled. Conversely, the age group of 15 to 17 year olds has the lowest likelihood of being enrolled in a private school, with 51 (100.0% in the age bracket) attending a public institution.
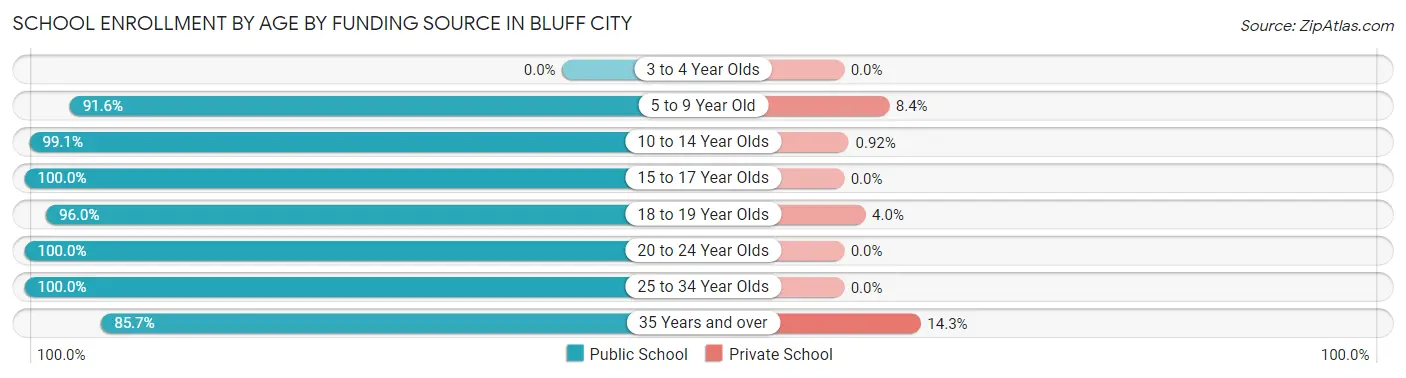
| Age Bracket | Public School | Private School |
| 3 to 4 Year Olds | 0 (0.0%) | 0 (0.0%) |
| 5 to 9 Year Old | 98 (91.6%) | 9 (8.4%) |
| 10 to 14 Year Olds | 216 (99.1%) | 2 (0.9%) |
| 15 to 17 Year Olds | 51 (100.0%) | 0 (0.0%) |
| 18 to 19 Year Olds | 24 (96.0%) | 1 (4.0%) |
| 20 to 24 Year Olds | 30 (100.0%) | 0 (0.0%) |
| 25 to 34 Year Olds | 50 (100.0%) | 0 (0.0%) |
| 35 Years and over | 12 (85.7%) | 2 (14.3%) |
| Total | 481 (97.2%) | 14 (2.8%) |
Educational Attainment by Field of Study in Bluff City
Psychology (49 | 23.9%), business (36 | 17.6%), science & technology (30 | 14.6%), computers & mathematics (17 | 8.3%), and education (14 | 6.8%) are the most common fields of study among 205 individuals in Bluff City who have obtained a bachelor's degree or higher.
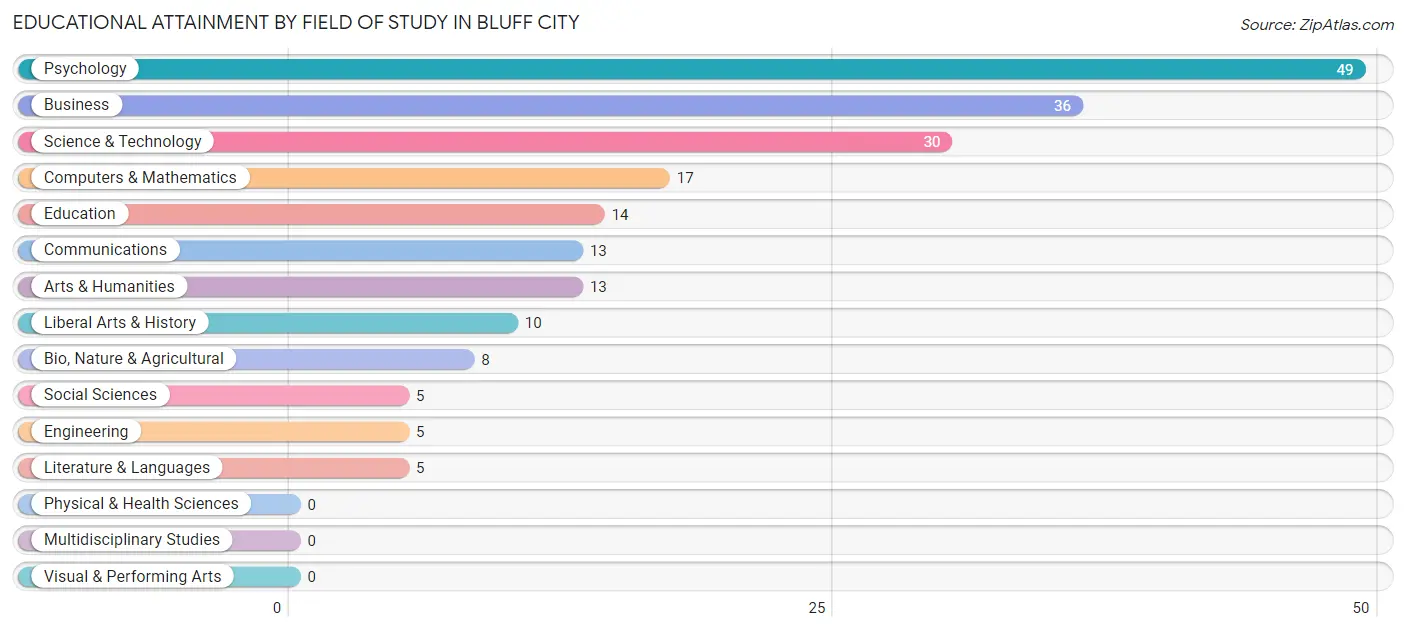
| Field of Study | # Graduates | % Graduates |
| Computers & Mathematics | 17 | 8.3% |
| Bio, Nature & Agricultural | 8 | 3.9% |
| Physical & Health Sciences | 0 | 0.0% |
| Psychology | 49 | 23.9% |
| Social Sciences | 5 | 2.4% |
| Engineering | 5 | 2.4% |
| Multidisciplinary Studies | 0 | 0.0% |
| Science & Technology | 30 | 14.6% |
| Business | 36 | 17.6% |
| Education | 14 | 6.8% |
| Literature & Languages | 5 | 2.4% |
| Liberal Arts & History | 10 | 4.9% |
| Visual & Performing Arts | 0 | 0.0% |
| Communications | 13 | 6.3% |
| Arts & Humanities | 13 | 6.3% |
| Total | 205 | 100.0% |
Transportation & Commute in Bluff City
Vehicle Availability by Sex in Bluff City
The most prevalent vehicle ownership categories in Bluff City are males with 2 vehicles (314, accounting for 53.9%) and females with 2 vehicles (309, making up 59.1%).
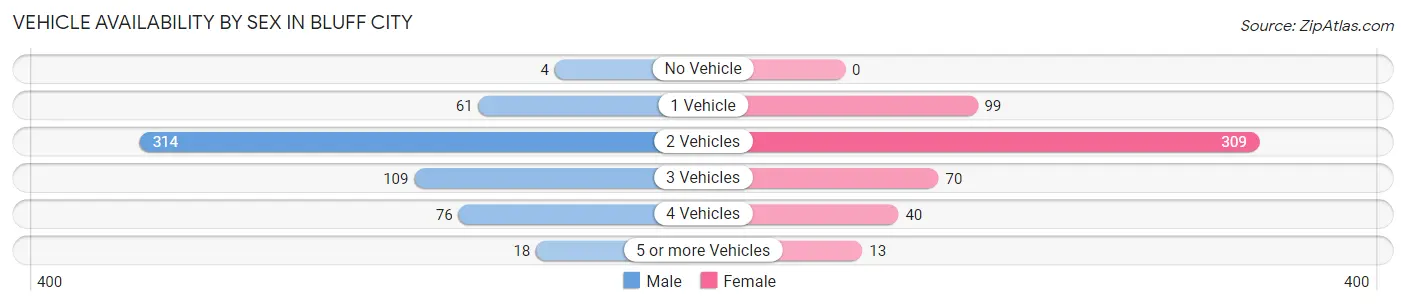
| Vehicles Available | Male | Female |
| No Vehicle | 4 (0.7%) | 0 (0.0%) |
| 1 Vehicle | 61 (10.5%) | 99 (18.6%) |
| 2 Vehicles | 314 (53.9%) | 309 (58.2%) |
| 3 Vehicles | 109 (18.7%) | 70 (13.2%) |
| 4 Vehicles | 76 (13.1%) | 40 (7.5%) |
| 5 or more Vehicles | 18 (3.1%) | 13 (2.5%) |
| Total | 582 (100.0%) | 531 (100.0%) |
Commute Time in Bluff City
The most frequently occuring commute durations in Bluff City are 20 to 24 minutes (187 commuters, 19.0%), 10 to 14 minutes (165 commuters, 16.8%), and 25 to 29 minutes (117 commuters, 11.9%).
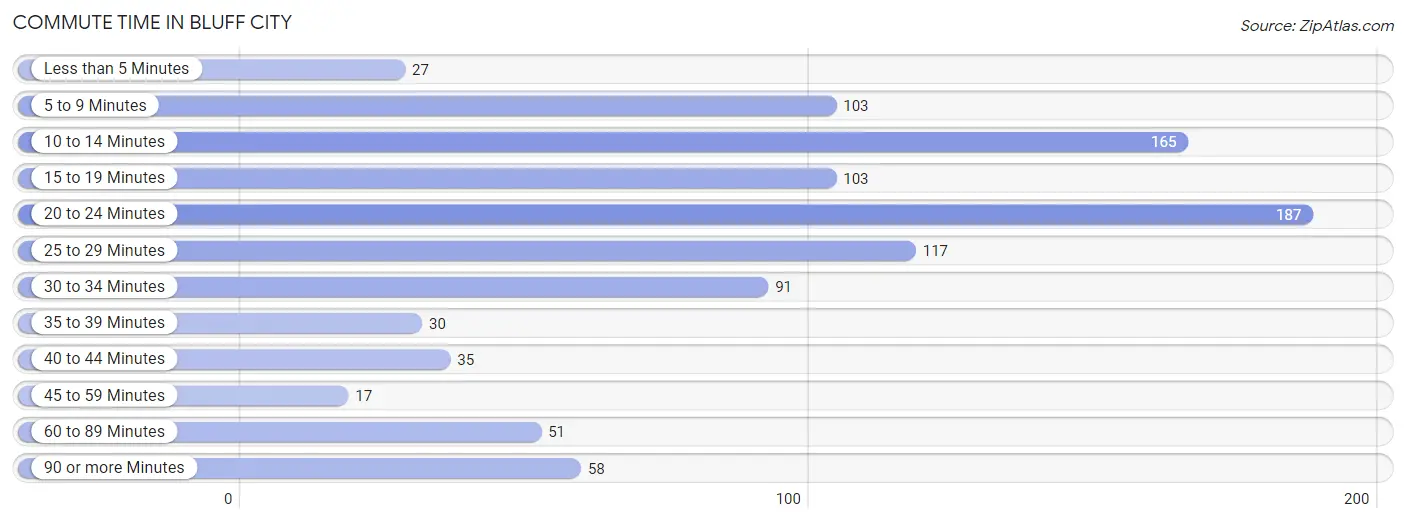
| Commute Time | # Commuters | % Commuters |
| Less than 5 Minutes | 27 | 2.7% |
| 5 to 9 Minutes | 103 | 10.5% |
| 10 to 14 Minutes | 165 | 16.8% |
| 15 to 19 Minutes | 103 | 10.5% |
| 20 to 24 Minutes | 187 | 19.0% |
| 25 to 29 Minutes | 117 | 11.9% |
| 30 to 34 Minutes | 91 | 9.2% |
| 35 to 39 Minutes | 30 | 3.0% |
| 40 to 44 Minutes | 35 | 3.6% |
| 45 to 59 Minutes | 17 | 1.7% |
| 60 to 89 Minutes | 51 | 5.2% |
| 90 or more Minutes | 58 | 5.9% |
Commute Time by Sex in Bluff City
The most common commute times in Bluff City are 20 to 24 minutes (107 commuters, 19.6%) for males and 20 to 24 minutes (80 commuters, 18.3%) for females.
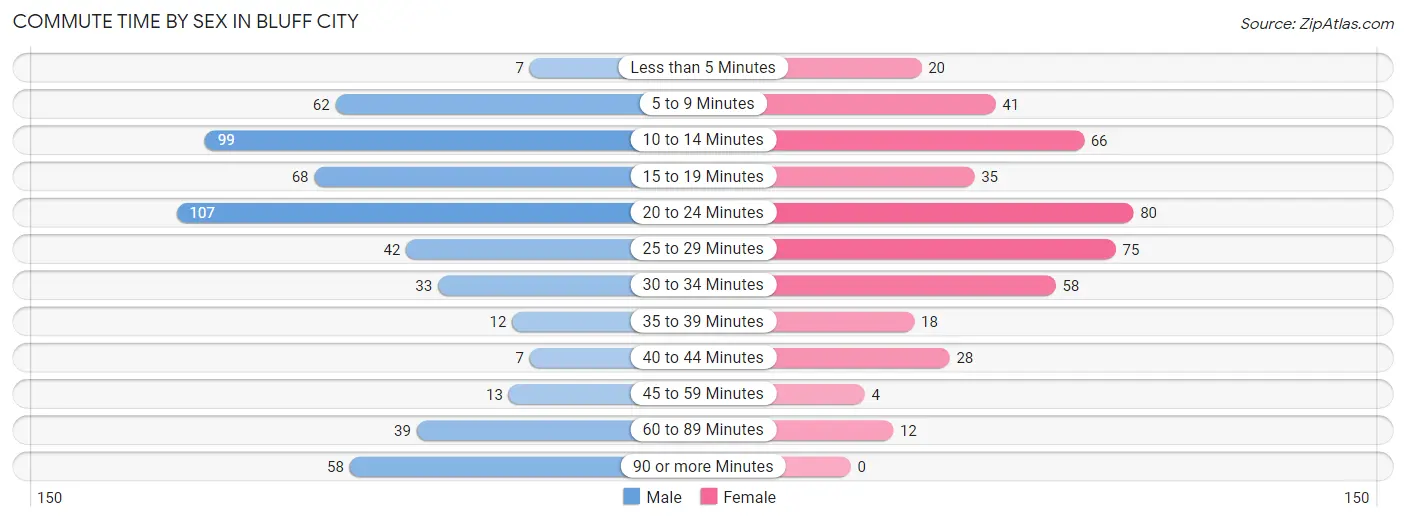
| Commute Time | Male | Female |
| Less than 5 Minutes | 7 (1.3%) | 20 (4.6%) |
| 5 to 9 Minutes | 62 (11.3%) | 41 (9.4%) |
| 10 to 14 Minutes | 99 (18.1%) | 66 (15.1%) |
| 15 to 19 Minutes | 68 (12.4%) | 35 (8.0%) |
| 20 to 24 Minutes | 107 (19.6%) | 80 (18.3%) |
| 25 to 29 Minutes | 42 (7.7%) | 75 (17.2%) |
| 30 to 34 Minutes | 33 (6.0%) | 58 (13.3%) |
| 35 to 39 Minutes | 12 (2.2%) | 18 (4.1%) |
| 40 to 44 Minutes | 7 (1.3%) | 28 (6.4%) |
| 45 to 59 Minutes | 13 (2.4%) | 4 (0.9%) |
| 60 to 89 Minutes | 39 (7.1%) | 12 (2.8%) |
| 90 or more Minutes | 58 (10.6%) | 0 (0.0%) |
Time of Departure to Work by Sex in Bluff City
The most frequent times of departure to work in Bluff City are 7:00 AM to 7:29 AM (78, 14.3%) for males and 8:30 AM to 8:59 AM (93, 21.3%) for females.
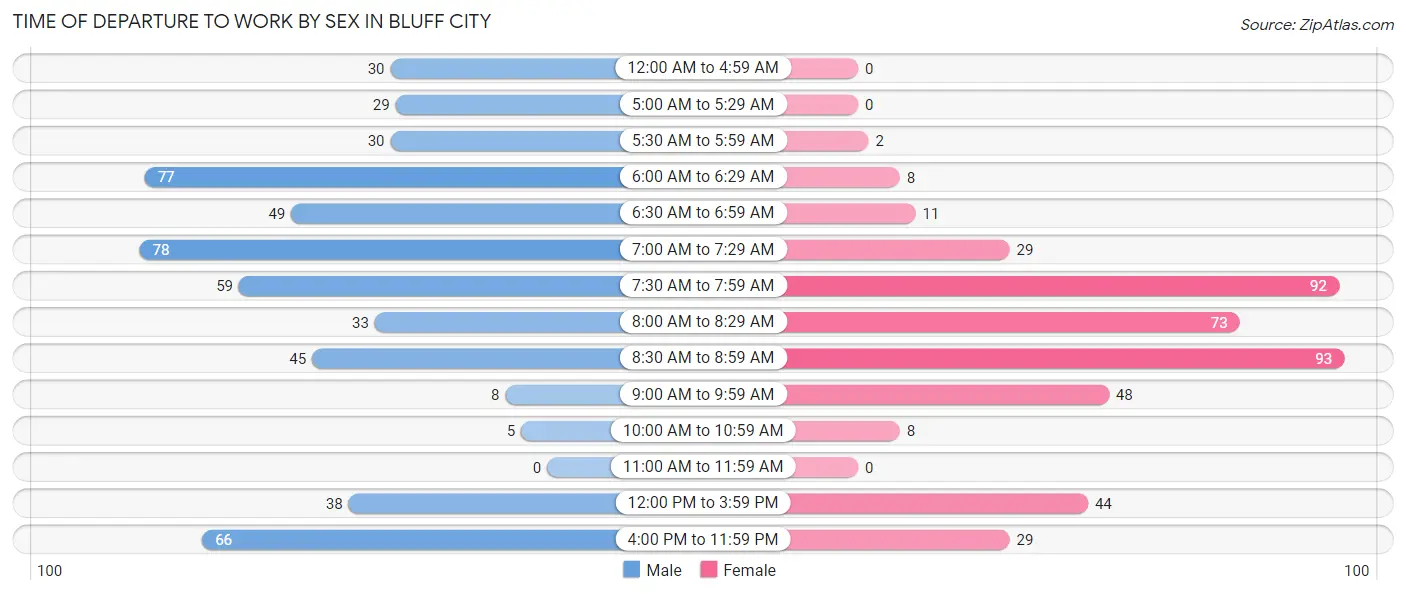
| Time of Departure | Male | Female |
| 12:00 AM to 4:59 AM | 30 (5.5%) | 0 (0.0%) |
| 5:00 AM to 5:29 AM | 29 (5.3%) | 0 (0.0%) |
| 5:30 AM to 5:59 AM | 30 (5.5%) | 2 (0.5%) |
| 6:00 AM to 6:29 AM | 77 (14.1%) | 8 (1.8%) |
| 6:30 AM to 6:59 AM | 49 (9.0%) | 11 (2.5%) |
| 7:00 AM to 7:29 AM | 78 (14.3%) | 29 (6.6%) |
| 7:30 AM to 7:59 AM | 59 (10.8%) | 92 (21.0%) |
| 8:00 AM to 8:29 AM | 33 (6.0%) | 73 (16.7%) |
| 8:30 AM to 8:59 AM | 45 (8.2%) | 93 (21.3%) |
| 9:00 AM to 9:59 AM | 8 (1.5%) | 48 (11.0%) |
| 10:00 AM to 10:59 AM | 5 (0.9%) | 8 (1.8%) |
| 11:00 AM to 11:59 AM | 0 (0.0%) | 0 (0.0%) |
| 12:00 PM to 3:59 PM | 38 (7.0%) | 44 (10.1%) |
| 4:00 PM to 11:59 PM | 66 (12.1%) | 29 (6.6%) |
| Total | 547 (100.0%) | 437 (100.0%) |
Housing Occupancy in Bluff City
Occupancy by Ownership in Bluff City
Of the total 913 dwellings in Bluff City, owner-occupied units account for 528 (57.8%), while renter-occupied units make up 385 (42.2%).
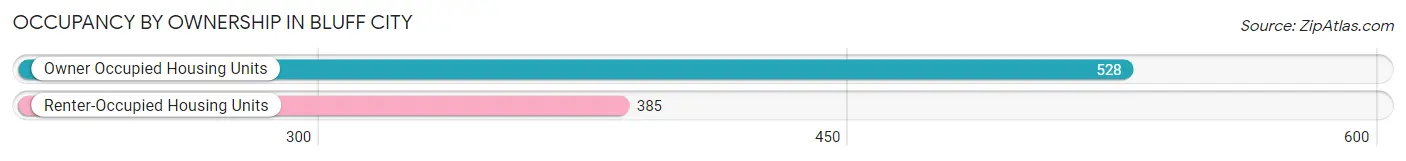
| Occupancy | # Housing Units | % Housing Units |
| Owner Occupied Housing Units | 528 | 57.8% |
| Renter-Occupied Housing Units | 385 | 42.2% |
| Total Occupied Housing Units | 913 | 100.0% |
Occupancy by Household Size in Bluff City
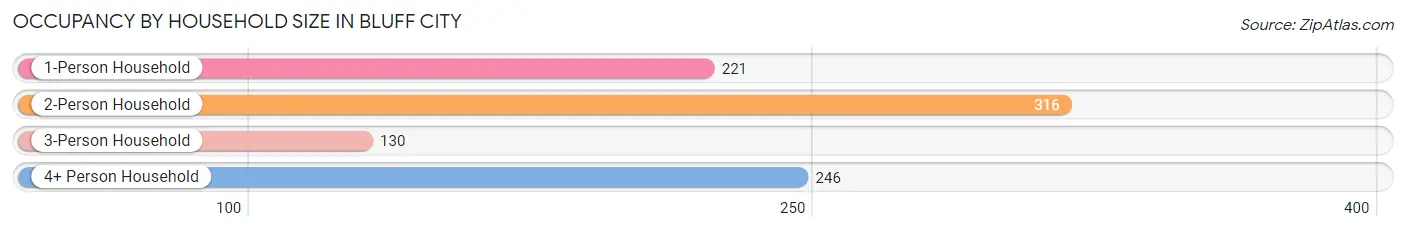
| Household Size | # Housing Units | % Housing Units |
| 1-Person Household | 221 | 24.2% |
| 2-Person Household | 316 | 34.6% |
| 3-Person Household | 130 | 14.2% |
| 4+ Person Household | 246 | 26.9% |
| Total Housing Units | 913 | 100.0% |
Occupancy by Ownership by Household Size in Bluff City
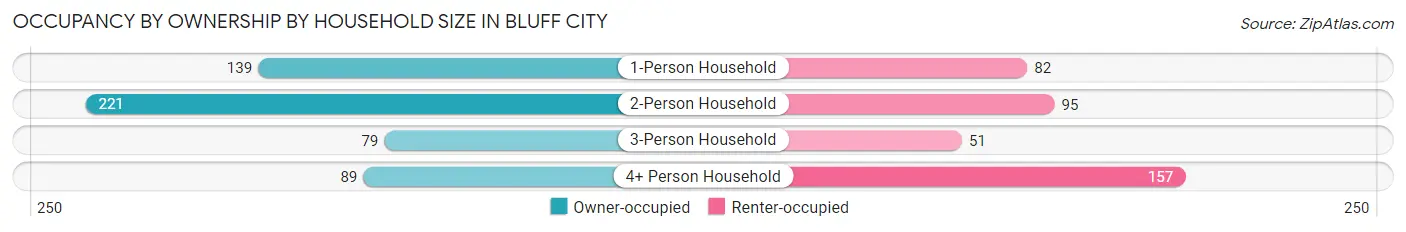
| Household Size | Owner-occupied | Renter-occupied |
| 1-Person Household | 139 (62.9%) | 82 (37.1%) |
| 2-Person Household | 221 (69.9%) | 95 (30.1%) |
| 3-Person Household | 79 (60.8%) | 51 (39.2%) |
| 4+ Person Household | 89 (36.2%) | 157 (63.8%) |
| Total Housing Units | 528 (57.8%) | 385 (42.2%) |
Occupancy by Educational Attainment in Bluff City
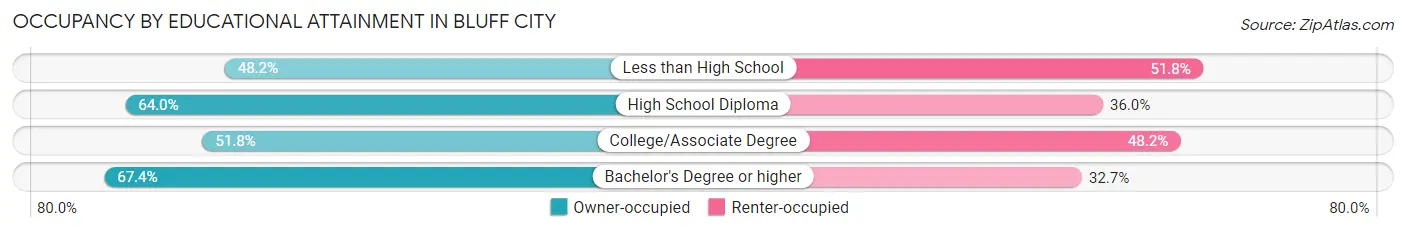
| Household Size | Owner-occupied | Renter-occupied |
| Less than High School | 41 (48.2%) | 44 (51.8%) |
| High School Diploma | 185 (64.0%) | 104 (36.0%) |
| College/Associate Degree | 203 (51.8%) | 189 (48.2%) |
| Bachelor's Degree or higher | 99 (67.3%) | 48 (32.7%) |
Occupancy by Age of Householder in Bluff City
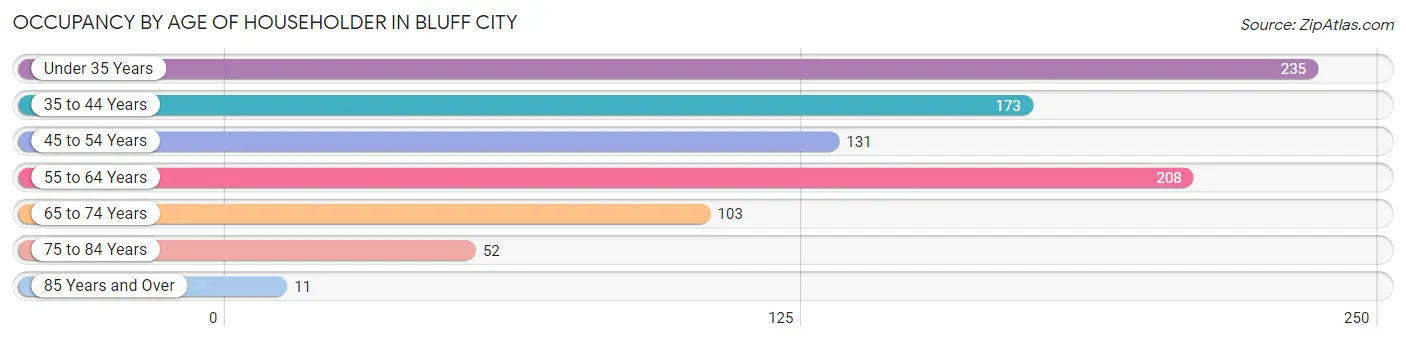
| Age Bracket | # Households | % Households |
| Under 35 Years | 235 | 25.7% |
| 35 to 44 Years | 173 | 19.0% |
| 45 to 54 Years | 131 | 14.3% |
| 55 to 64 Years | 208 | 22.8% |
| 65 to 74 Years | 103 | 11.3% |
| 75 to 84 Years | 52 | 5.7% |
| 85 Years and Over | 11 | 1.2% |
| Total | 913 | 100.0% |
Housing Finances in Bluff City
Median Income by Occupancy in Bluff City
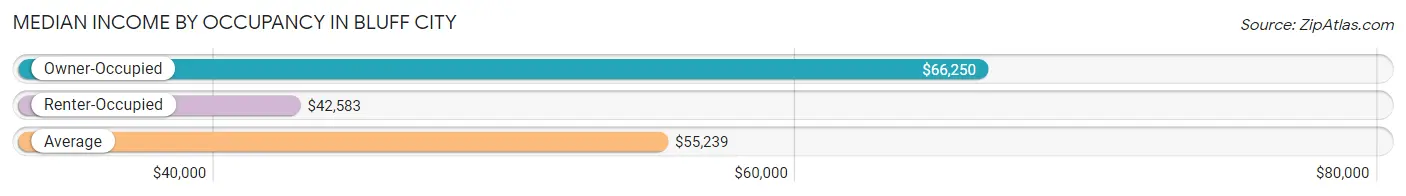
| Occupancy Type | # Households | Median Income |
| Owner-Occupied | 528 (57.8%) | $66,250 |
| Renter-Occupied | 385 (42.2%) | $42,583 |
| Average | 913 (100.0%) | $55,239 |
Occupancy by Householder Income Bracket in Bluff City
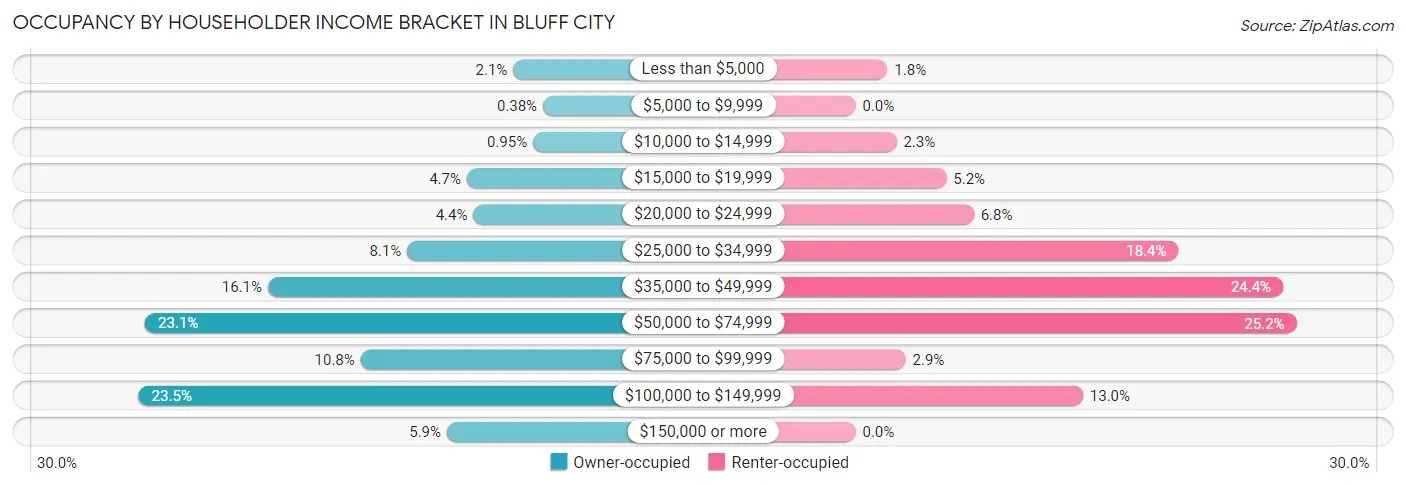
| Income Bracket | Owner-occupied | Renter-occupied |
| Less than $5,000 | 11 (2.1%) | 7 (1.8%) |
| $5,000 to $9,999 | 2 (0.4%) | 0 (0.0%) |
| $10,000 to $14,999 | 5 (0.9%) | 9 (2.3%) |
| $15,000 to $19,999 | 25 (4.7%) | 20 (5.2%) |
| $20,000 to $24,999 | 23 (4.4%) | 26 (6.8%) |
| $25,000 to $34,999 | 43 (8.1%) | 71 (18.4%) |
| $35,000 to $49,999 | 85 (16.1%) | 94 (24.4%) |
| $50,000 to $74,999 | 122 (23.1%) | 97 (25.2%) |
| $75,000 to $99,999 | 57 (10.8%) | 11 (2.9%) |
| $100,000 to $149,999 | 124 (23.5%) | 50 (13.0%) |
| $150,000 or more | 31 (5.9%) | 0 (0.0%) |
| Total | 528 (100.0%) | 385 (100.0%) |
Monthly Housing Cost Tiers in Bluff City
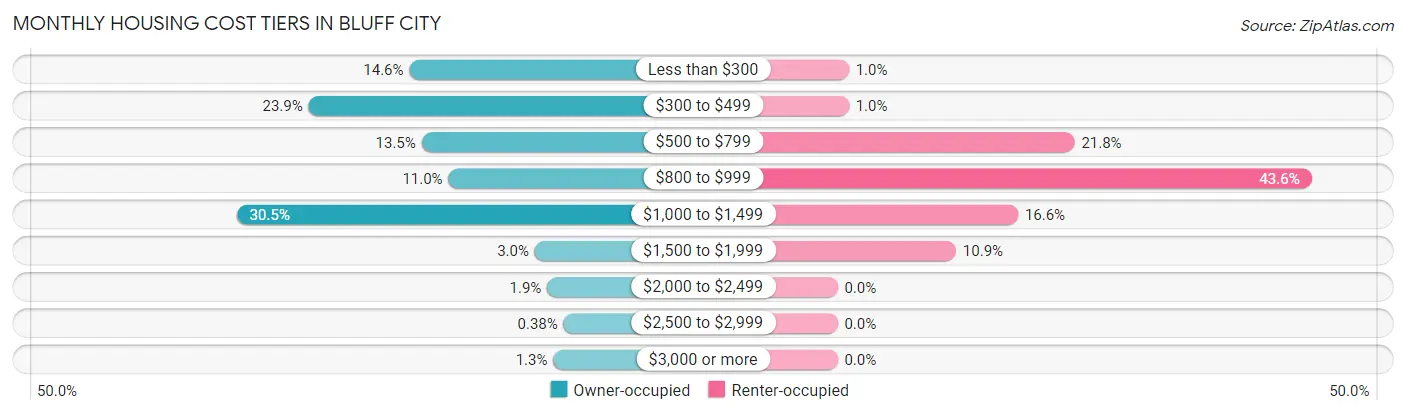
| Monthly Cost | Owner-occupied | Renter-occupied |
| Less than $300 | 77 (14.6%) | 4 (1.0%) |
| $300 to $499 | 126 (23.9%) | 4 (1.0%) |
| $500 to $799 | 71 (13.5%) | 84 (21.8%) |
| $800 to $999 | 58 (11.0%) | 168 (43.6%) |
| $1,000 to $1,499 | 161 (30.5%) | 64 (16.6%) |
| $1,500 to $1,999 | 16 (3.0%) | 42 (10.9%) |
| $2,000 to $2,499 | 10 (1.9%) | 0 (0.0%) |
| $2,500 to $2,999 | 2 (0.4%) | 0 (0.0%) |
| $3,000 or more | 7 (1.3%) | 0 (0.0%) |
| Total | 528 (100.0%) | 385 (100.0%) |
Physical Housing Characteristics in Bluff City
Housing Structures in Bluff City
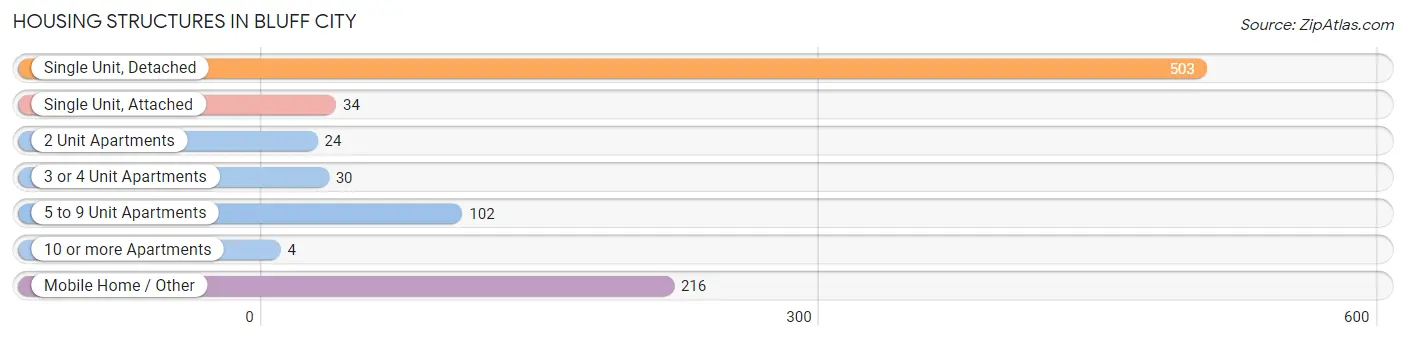
| Structure Type | # Housing Units | % Housing Units |
| Single Unit, Detached | 503 | 55.1% |
| Single Unit, Attached | 34 | 3.7% |
| 2 Unit Apartments | 24 | 2.6% |
| 3 or 4 Unit Apartments | 30 | 3.3% |
| 5 to 9 Unit Apartments | 102 | 11.2% |
| 10 or more Apartments | 4 | 0.4% |
| Mobile Home / Other | 216 | 23.7% |
| Total | 913 | 100.0% |
Housing Structures by Occupancy in Bluff City
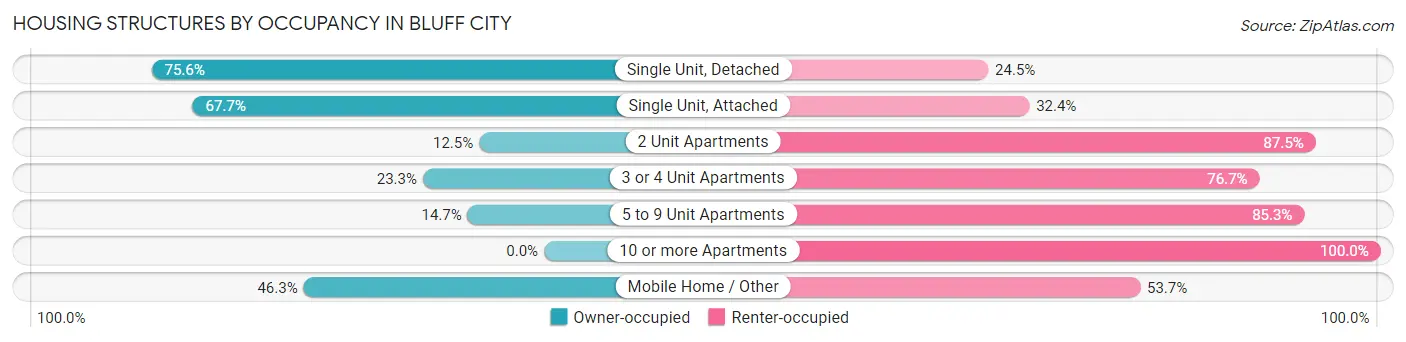
| Structure Type | Owner-occupied | Renter-occupied |
| Single Unit, Detached | 380 (75.5%) | 123 (24.4%) |
| Single Unit, Attached | 23 (67.6%) | 11 (32.4%) |
| 2 Unit Apartments | 3 (12.5%) | 21 (87.5%) |
| 3 or 4 Unit Apartments | 7 (23.3%) | 23 (76.7%) |
| 5 to 9 Unit Apartments | 15 (14.7%) | 87 (85.3%) |
| 10 or more Apartments | 0 (0.0%) | 4 (100.0%) |
| Mobile Home / Other | 100 (46.3%) | 116 (53.7%) |
| Total | 528 (57.8%) | 385 (42.2%) |
Housing Structures by Number of Rooms in Bluff City
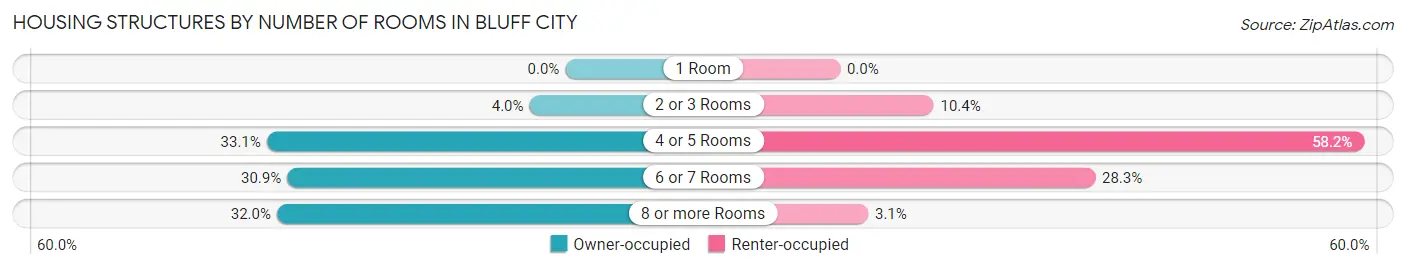
| Number of Rooms | Owner-occupied | Renter-occupied |
| 1 Room | 0 (0.0%) | 0 (0.0%) |
| 2 or 3 Rooms | 21 (4.0%) | 40 (10.4%) |
| 4 or 5 Rooms | 175 (33.1%) | 224 (58.2%) |
| 6 or 7 Rooms | 163 (30.9%) | 109 (28.3%) |
| 8 or more Rooms | 169 (32.0%) | 12 (3.1%) |
| Total | 528 (100.0%) | 385 (100.0%) |
Housing Structure by Heating Type in Bluff City
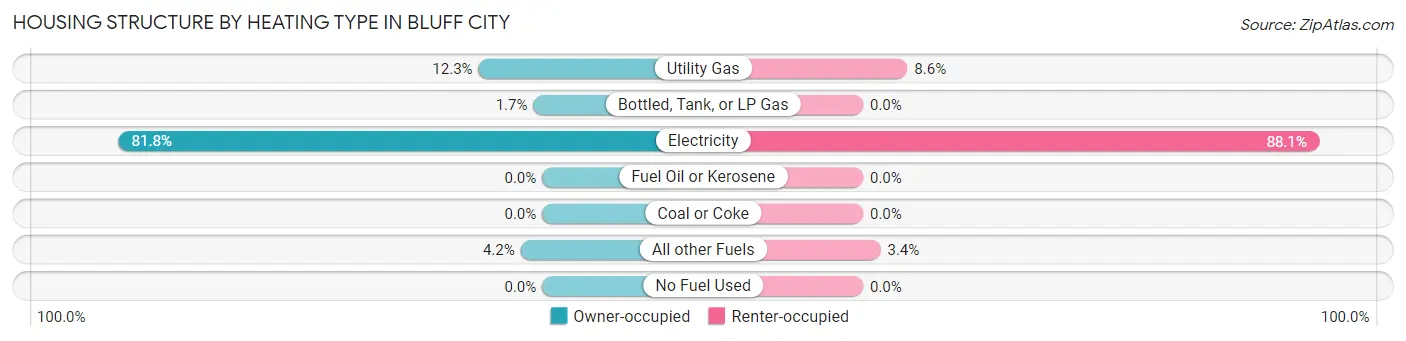
| Heating Type | Owner-occupied | Renter-occupied |
| Utility Gas | 65 (12.3%) | 33 (8.6%) |
| Bottled, Tank, or LP Gas | 9 (1.7%) | 0 (0.0%) |
| Electricity | 432 (81.8%) | 339 (88.0%) |
| Fuel Oil or Kerosene | 0 (0.0%) | 0 (0.0%) |
| Coal or Coke | 0 (0.0%) | 0 (0.0%) |
| All other Fuels | 22 (4.2%) | 13 (3.4%) |
| No Fuel Used | 0 (0.0%) | 0 (0.0%) |
| Total | 528 (100.0%) | 385 (100.0%) |
Household Vehicle Usage in Bluff City
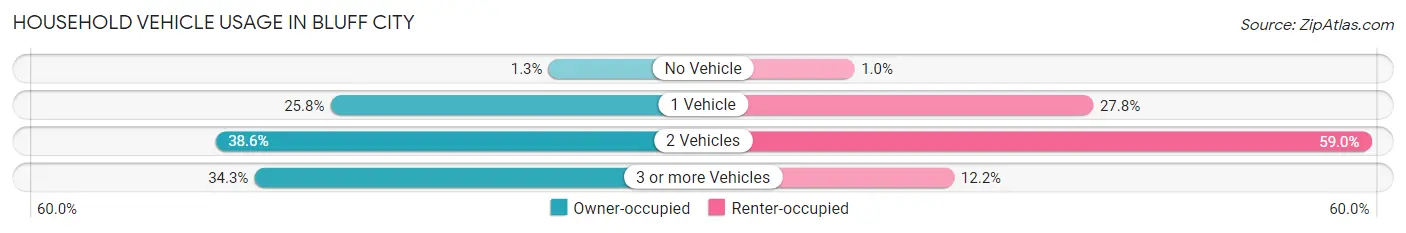
| Vehicles per Household | Owner-occupied | Renter-occupied |
| No Vehicle | 7 (1.3%) | 4 (1.0%) |
| 1 Vehicle | 136 (25.8%) | 107 (27.8%) |
| 2 Vehicles | 204 (38.6%) | 227 (59.0%) |
| 3 or more Vehicles | 181 (34.3%) | 47 (12.2%) |
| Total | 528 (100.0%) | 385 (100.0%) |
Real Estate & Mortgages in Bluff City
Real Estate and Mortgage Overview in Bluff City
| Characteristic | Without Mortgage | With Mortgage |
| Housing Units | 257 | 271 |
| Median Property Value | $106,300 | $153,900 |
| Median Household Income | $46,771 | $25 |
| Monthly Housing Costs | $407 | $7 |
| Real Estate Taxes | $715 | $1 |
Property Value by Mortgage Status in Bluff City
| Property Value | Without Mortgage | With Mortgage |
| Less than $50,000 | 60 (23.4%) | 13 (4.8%) |
| $50,000 to $99,999 | 61 (23.7%) | 36 (13.3%) |
| $100,000 to $299,999 | 123 (47.9%) | 213 (78.6%) |
| $300,000 to $499,999 | 0 (0.0%) | 7 (2.6%) |
| $500,000 to $749,999 | 0 (0.0%) | 2 (0.7%) |
| $750,000 to $999,999 | 0 (0.0%) | 0 (0.0%) |
| $1,000,000 or more | 13 (5.1%) | 0 (0.0%) |
| Total | 257 (100.0%) | 271 (100.0%) |
Household Income by Mortgage Status in Bluff City
| Household Income | Without Mortgage | With Mortgage |
| Less than $10,000 | 6 (2.3%) | 0 (0.0%) |
| $10,000 to $24,999 | 45 (17.5%) | 7 (2.6%) |
| $25,000 to $34,999 | 24 (9.3%) | 8 (2.9%) |
| $35,000 to $49,999 | 64 (24.9%) | 19 (7.0%) |
| $50,000 to $74,999 | 28 (10.9%) | 21 (7.7%) |
| $75,000 to $99,999 | 41 (16.0%) | 94 (34.7%) |
| $100,000 to $149,999 | 43 (16.7%) | 16 (5.9%) |
| $150,000 or more | 6 (2.3%) | 81 (29.9%) |
| Total | 257 (100.0%) | 271 (100.0%) |
Property Value to Household Income Ratio in Bluff City
| Value-to-Income Ratio | Without Mortgage | With Mortgage |
| Less than 2.0x | 127 (49.4%) | 73,466 (27,109.2%) |
| 2.0x to 2.9x | 37 (14.4%) | 151 (55.7%) |
| 3.0x to 3.9x | 28 (10.9%) | 51 (18.8%) |
| 4.0x or more | 61 (23.7%) | 45 (16.6%) |
| Total | 257 (100.0%) | 271 (100.0%) |
Real Estate Taxes by Mortgage Status in Bluff City
| Property Taxes | Without Mortgage | With Mortgage |
| Less than $800 | 140 (54.5%) | 7 (2.6%) |
| $800 to $1,499 | 95 (37.0%) | 74 (27.3%) |
| $800 to $1,499 | 22 (8.6%) | 154 (56.8%) |
| Total | 257 (100.0%) | 271 (100.0%) |
Health & Disability in Bluff City
Health Insurance Coverage by Age in Bluff City
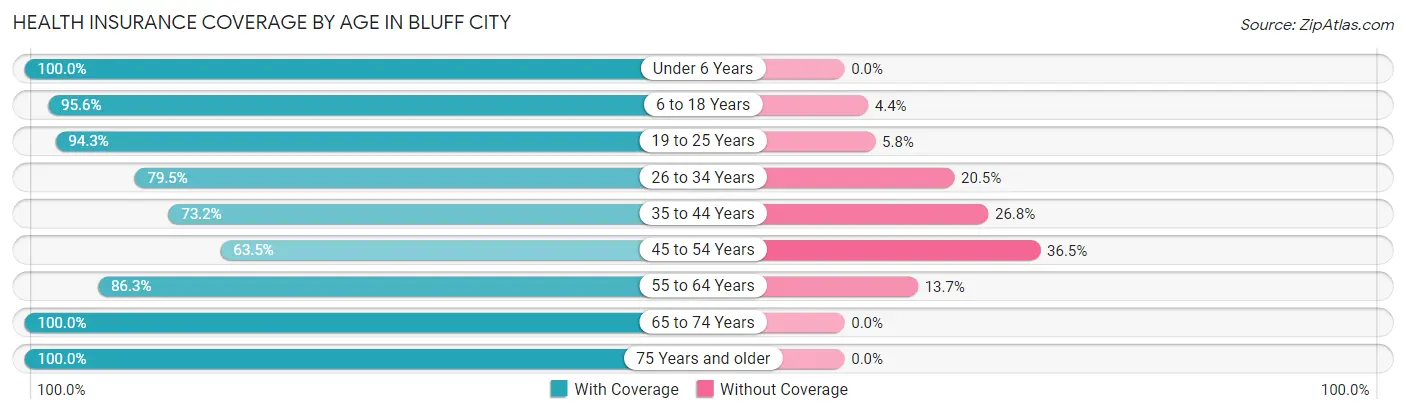
| Age Bracket | With Coverage | Without Coverage |
| Under 6 Years | 175 (100.0%) | 0 (0.0%) |
| 6 to 18 Years | 370 (95.6%) | 17 (4.4%) |
| 19 to 25 Years | 164 (94.3%) | 10 (5.8%) |
| 26 to 34 Years | 299 (79.5%) | 77 (20.5%) |
| 35 to 44 Years | 213 (73.2%) | 78 (26.8%) |
| 45 to 54 Years | 179 (63.5%) | 103 (36.5%) |
| 55 to 64 Years | 271 (86.3%) | 43 (13.7%) |
| 65 to 74 Years | 164 (100.0%) | 0 (0.0%) |
| 75 Years and older | 98 (100.0%) | 0 (0.0%) |
| Total | 1,933 (85.5%) | 328 (14.5%) |
Health Insurance Coverage by Citizenship Status in Bluff City
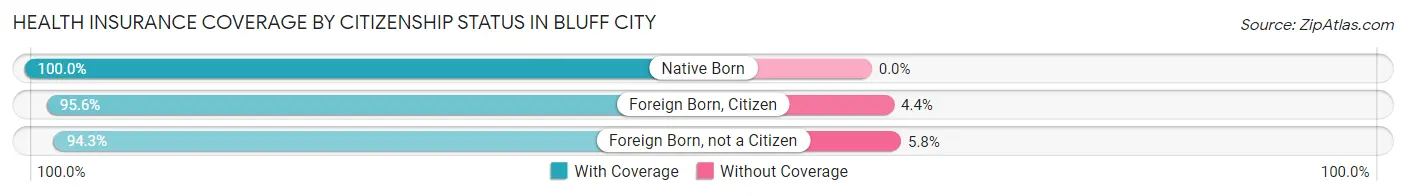
| Citizenship Status | With Coverage | Without Coverage |
| Native Born | 175 (100.0%) | 0 (0.0%) |
| Foreign Born, Citizen | 370 (95.6%) | 17 (4.4%) |
| Foreign Born, not a Citizen | 164 (94.3%) | 10 (5.8%) |
Health Insurance Coverage by Household Income in Bluff City
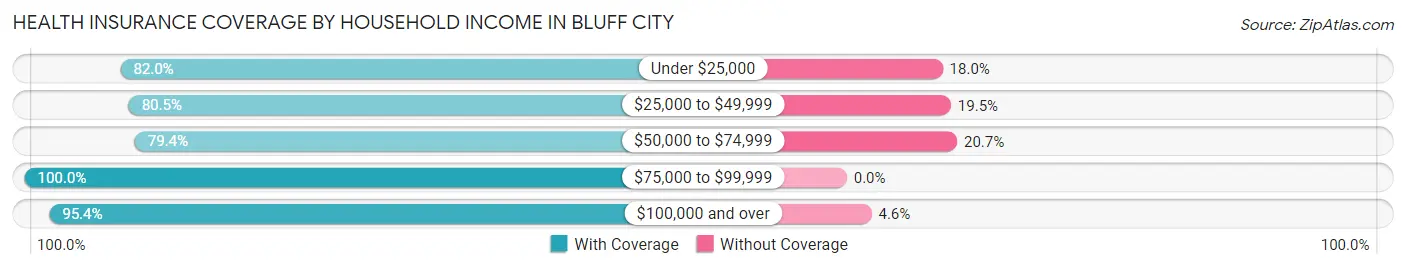
| Household Income | With Coverage | Without Coverage |
| Under $25,000 | 201 (82.0%) | 44 (18.0%) |
| $25,000 to $49,999 | 491 (80.5%) | 119 (19.5%) |
| $50,000 to $74,999 | 534 (79.3%) | 139 (20.6%) |
| $75,000 to $99,999 | 172 (100.0%) | 0 (0.0%) |
| $100,000 and over | 535 (95.4%) | 26 (4.6%) |
Public vs Private Health Insurance Coverage by Age in Bluff City
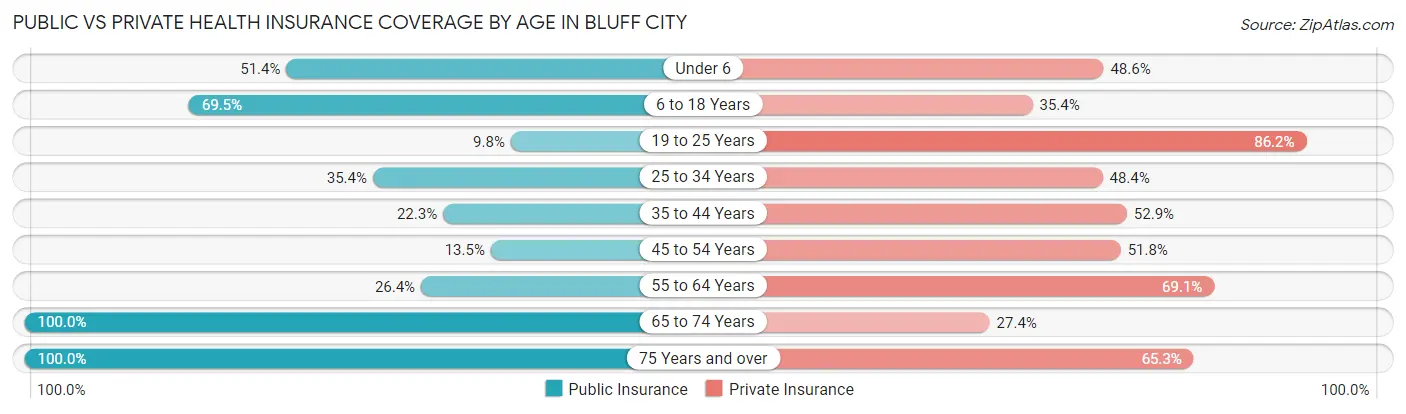
| Age Bracket | Public Insurance | Private Insurance |
| Under 6 | 90 (51.4%) | 85 (48.6%) |
| 6 to 18 Years | 269 (69.5%) | 137 (35.4%) |
| 19 to 25 Years | 17 (9.8%) | 150 (86.2%) |
| 25 to 34 Years | 133 (35.4%) | 182 (48.4%) |
| 35 to 44 Years | 65 (22.3%) | 154 (52.9%) |
| 45 to 54 Years | 38 (13.5%) | 146 (51.8%) |
| 55 to 64 Years | 83 (26.4%) | 217 (69.1%) |
| 65 to 74 Years | 164 (100.0%) | 45 (27.4%) |
| 75 Years and over | 98 (100.0%) | 64 (65.3%) |
| Total | 957 (42.3%) | 1,180 (52.2%) |
Disability Status by Sex by Age in Bluff City
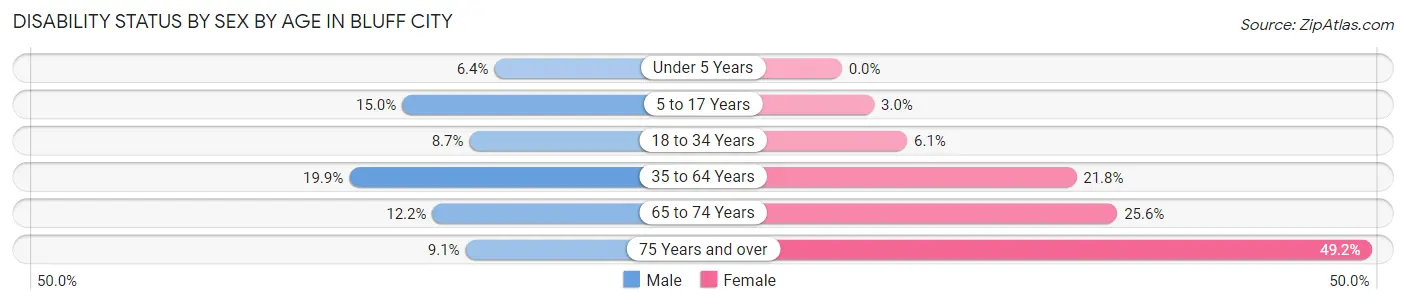
| Age Bracket | Male | Female |
| Under 5 Years | 5 (6.4%) | 0 (0.0%) |
| 5 to 17 Years | 28 (15.0%) | 6 (3.0%) |
| 18 to 34 Years | 24 (8.7%) | 18 (6.1%) |
| 35 to 64 Years | 75 (19.9%) | 111 (21.8%) |
| 65 to 74 Years | 9 (12.2%) | 23 (25.6%) |
| 75 Years and over | 3 (9.1%) | 32 (49.2%) |
Disability Class by Sex by Age in Bluff City
Disability Class: Hearing Difficulty
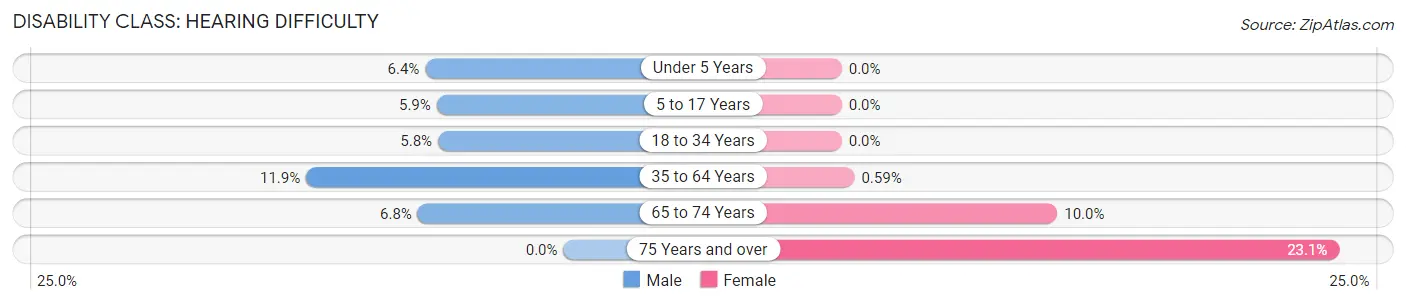
| Age Bracket | Male | Female |
| Under 5 Years | 5 (6.4%) | 0 (0.0%) |
| 5 to 17 Years | 11 (5.9%) | 0 (0.0%) |
| 18 to 34 Years | 16 (5.8%) | 0 (0.0%) |
| 35 to 64 Years | 45 (11.9%) | 3 (0.6%) |
| 65 to 74 Years | 5 (6.8%) | 9 (10.0%) |
| 75 Years and over | 0 (0.0%) | 15 (23.1%) |
Disability Class: Vision Difficulty
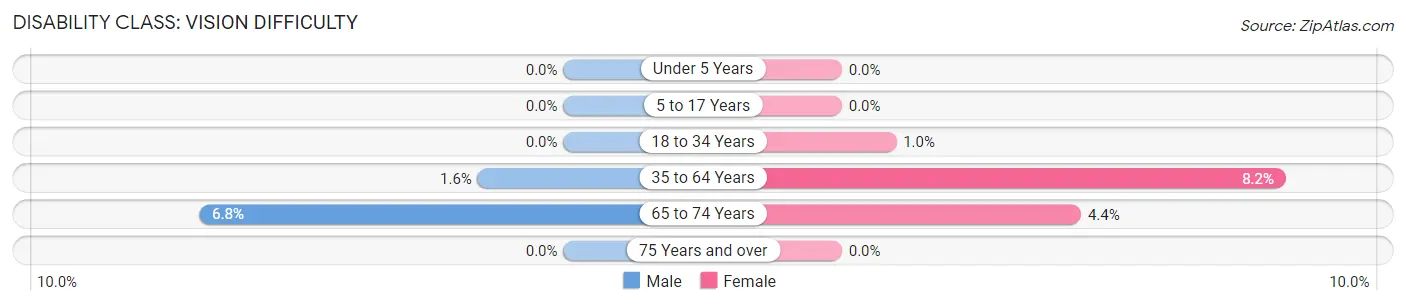
| Age Bracket | Male | Female |
| Under 5 Years | 0 (0.0%) | 0 (0.0%) |
| 5 to 17 Years | 0 (0.0%) | 0 (0.0%) |
| 18 to 34 Years | 0 (0.0%) | 3 (1.0%) |
| 35 to 64 Years | 6 (1.6%) | 42 (8.2%) |
| 65 to 74 Years | 5 (6.8%) | 4 (4.4%) |
| 75 Years and over | 0 (0.0%) | 0 (0.0%) |
Disability Class: Cognitive Difficulty
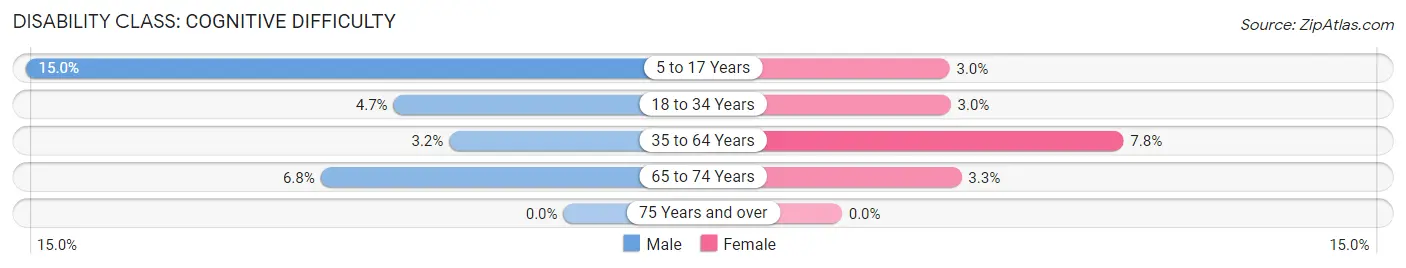
| Age Bracket | Male | Female |
| 5 to 17 Years | 28 (15.0%) | 6 (3.0%) |
| 18 to 34 Years | 13 (4.7%) | 9 (3.0%) |
| 35 to 64 Years | 12 (3.2%) | 40 (7.8%) |
| 65 to 74 Years | 5 (6.8%) | 3 (3.3%) |
| 75 Years and over | 0 (0.0%) | 0 (0.0%) |
Disability Class: Ambulatory Difficulty
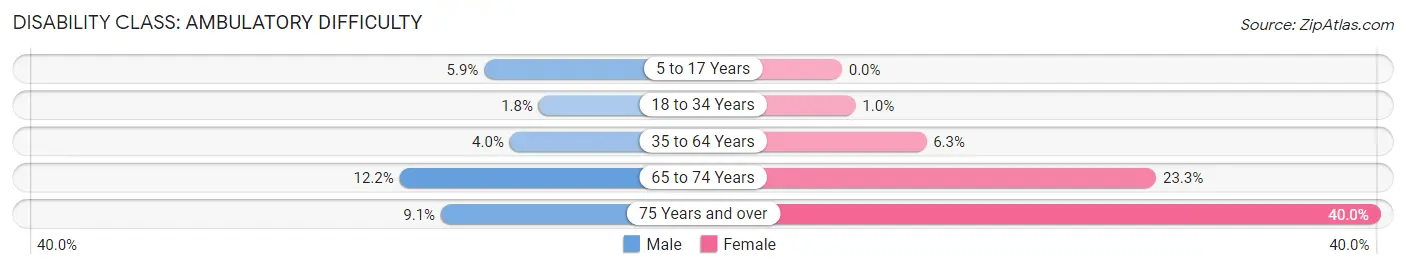
| Age Bracket | Male | Female |
| 5 to 17 Years | 11 (5.9%) | 0 (0.0%) |
| 18 to 34 Years | 5 (1.8%) | 3 (1.0%) |
| 35 to 64 Years | 15 (4.0%) | 32 (6.3%) |
| 65 to 74 Years | 9 (12.2%) | 21 (23.3%) |
| 75 Years and over | 3 (9.1%) | 26 (40.0%) |
Disability Class: Self-Care Difficulty
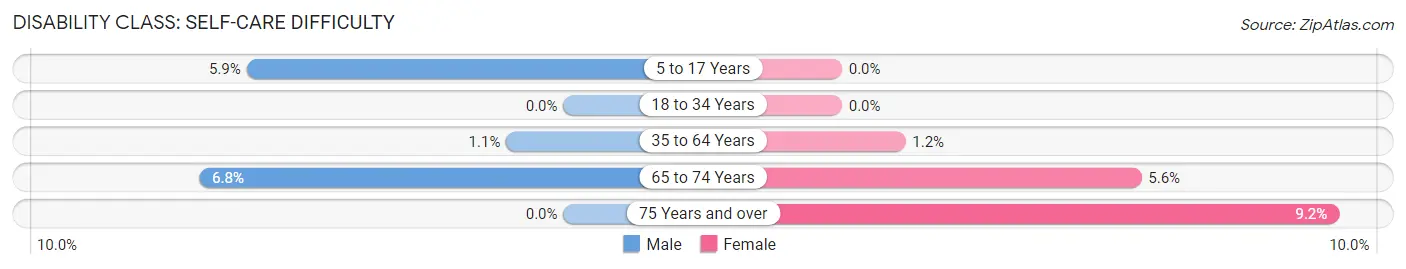
| Age Bracket | Male | Female |
| 5 to 17 Years | 11 (5.9%) | 0 (0.0%) |
| 18 to 34 Years | 0 (0.0%) | 0 (0.0%) |
| 35 to 64 Years | 4 (1.1%) | 6 (1.2%) |
| 65 to 74 Years | 5 (6.8%) | 5 (5.6%) |
| 75 Years and over | 0 (0.0%) | 6 (9.2%) |
Technology Access in Bluff City
Computing Device Access in Bluff City
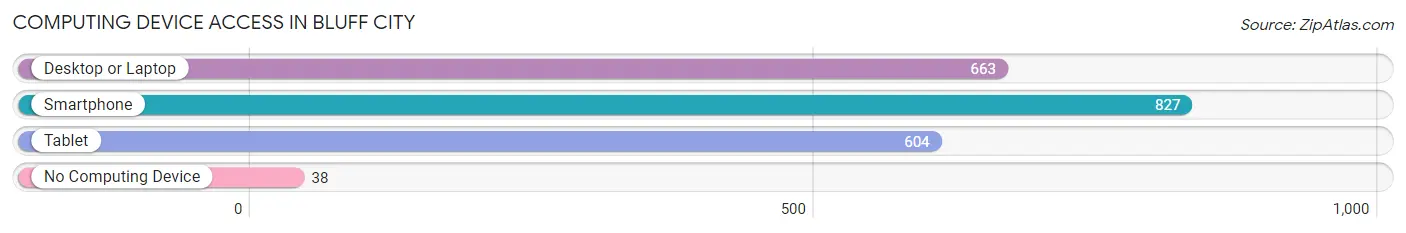
| Device Type | # Households | % Households |
| Desktop or Laptop | 663 | 72.6% |
| Smartphone | 827 | 90.6% |
| Tablet | 604 | 66.2% |
| No Computing Device | 38 | 4.2% |
| Total | 913 | 100.0% |
Internet Access in Bluff City
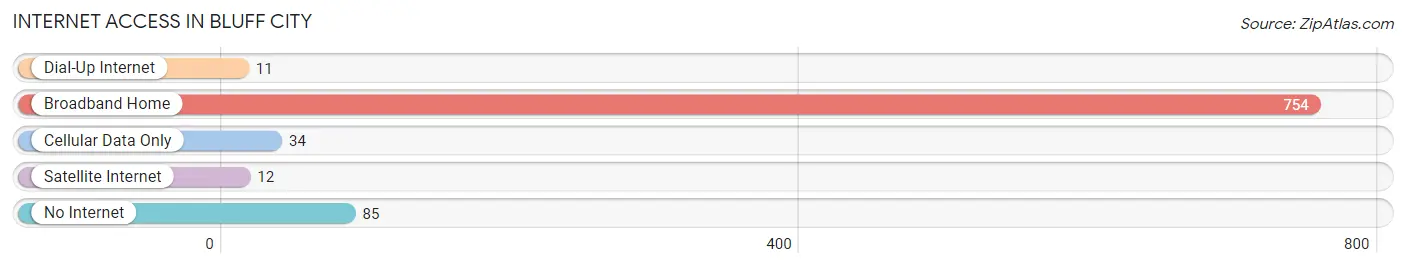
| Internet Type | # Households | % Households |
| Dial-Up Internet | 11 | 1.2% |
| Broadband Home | 754 | 82.6% |
| Cellular Data Only | 34 | 3.7% |
| Satellite Internet | 12 | 1.3% |
| No Internet | 85 | 9.3% |
| Total | 913 | 100.0% |
Bluff City Summary
Bluff City, Tennessee is a small town located in Sullivan County, Tennessee. It is situated along the banks of the Holston River, and is part of the Tri-Cities region of Northeast Tennessee. The town has a population of approximately 1,500 people, and is known for its rich history and culture.
History
Bluff City was founded in 1819 by a group of settlers from North Carolina. The town was originally named “Mud Creek”, but was later changed to Bluff City due to its location on a bluff overlooking the Holston River. The town was an important stop on the stagecoach route between Knoxville and Abingdon, Virginia. In the late 19th century, the town was a major center for the production of tobacco, and was home to several tobacco warehouses.
In the early 20th century, Bluff City was a popular tourist destination, and was home to several resorts and hotels. The town was also home to a number of factories, including a cotton mill, a furniture factory, and a canning factory.
Geography
Bluff City is located in Sullivan County, Tennessee, and is situated along the banks of the Holston River. The town is located approximately 25 miles northeast of Knoxville, and is part of the Tri-Cities region of Northeast Tennessee. The town is surrounded by rolling hills and mountains, and is home to several parks and recreational areas.
Economy
Bluff City’s economy is largely based on tourism and agriculture. The town is home to several resorts and hotels, as well as a number of restaurants and shops. The town is also home to a number of factories, including a cotton mill, a furniture factory, and a canning factory.
Demographics
As of the 2010 census, Bluff City had a population of 1,500 people. The town is predominantly white, with approximately 90% of the population identifying as Caucasian. The median household income in Bluff City is $35,000, and the median age is 40 years old. The town is home to a number of churches, and is served by the Sullivan County School System.
Common Questions
What is Per Capita Income in Bluff City?
Per Capita income in Bluff City is $28,789.
What is the Median Family Income in Bluff City?
Median Family Income in Bluff City is $59,167.
What is the Median Household income in Bluff City?
Median Household Income in Bluff City is $55,239.
What is Income or Wage Gap in Bluff City?
Income or Wage Gap in Bluff City is 29.8%.
Women in Bluff City earn 70.2 cents for every dollar earned by a man.
What is Family Income Deficit in Bluff City?
Family Income Deficit in Bluff City is $7,340.
Families that are below poverty line in Bluff City earn $7,340 less on average than the poverty threshold level.
What is Inequality or Gini Index in Bluff City?
Inequality or Gini Index in Bluff City is 0.41.
What is the Total Population of Bluff City?
Total Population of Bluff City is 2,261.
What is the Total Male Population of Bluff City?
Total Male Population of Bluff City is 1,024.
What is the Total Female Population of Bluff City?
Total Female Population of Bluff City is 1,237.
What is the Ratio of Males per 100 Females in Bluff City?
There are 82.78 Males per 100 Females in Bluff City.
What is the Ratio of Females per 100 Males in Bluff City?
There are 120.80 Females per 100 Males in Bluff City.
What is the Median Population Age in Bluff City?
Median Population Age in Bluff City is 35.6 Years.
What is the Average Family Size in Bluff City
Average Family Size in Bluff City is 3.0 People.
What is the Average Household Size in Bluff City
Average Household Size in Bluff City is 2.5 People.
How Large is the Labor Force in Bluff City?
There are 1,171 People in the Labor Forcein in Bluff City.
What is the Percentage of People in the Labor Force in Bluff City?
66.6% of People are in the Labor Force in Bluff City.
What is the Unemployment Rate in Bluff City?
Unemployment Rate in Bluff City is 2.4%.