Woodbury, TN Map & Demographics
Woodbury Map
Woodbury Overview
$26,783
PER CAPITA INCOME
$48,229
AVG FAMILY INCOME
$51,528
AVG HOUSEHOLD INCOME
8.9%
WAGE / INCOME GAP [ % ]
91.1¢/ $1
WAGE / INCOME GAP [ $ ]
0.44
INEQUALITY / GINI INDEX
2,704
TOTAL POPULATION
1,480
MALE POPULATION
1,224
FEMALE POPULATION
120.92
MALES / 100 FEMALES
82.70
FEMALES / 100 MALES
35.1
MEDIAN AGE
3.5
AVG FAMILY SIZE
2.6
AVG HOUSEHOLD SIZE
1,259
LABOR FORCE [ PEOPLE ]
59.3%
PERCENT IN LABOR FORCE
3.4%
UNEMPLOYMENT RATE
Woodbury Zip Codes
Woodbury Area Codes
Income in Woodbury
Income Overview in Woodbury
Per Capita Income in Woodbury is $26,783, while median incomes of families and households are $48,229 and $51,528 respectively.
| Characteristic | Number | Measure |
| Per Capita Income | 2,704 | $26,783 |
| Median Family Income | 541 | $48,229 |
| Mean Family Income | 541 | $56,662 |
| Median Household Income | 1,007 | $51,528 |
| Mean Household Income | 1,007 | $64,122 |
| Income Deficit | 541 | $0 |
| Wage / Income Gap (%) | 2,704 | 8.86% |
| Wage / Income Gap ($) | 2,704 | 91.14¢ per $1 |
| Gini / Inequality Index | 2,704 | 0.44 |
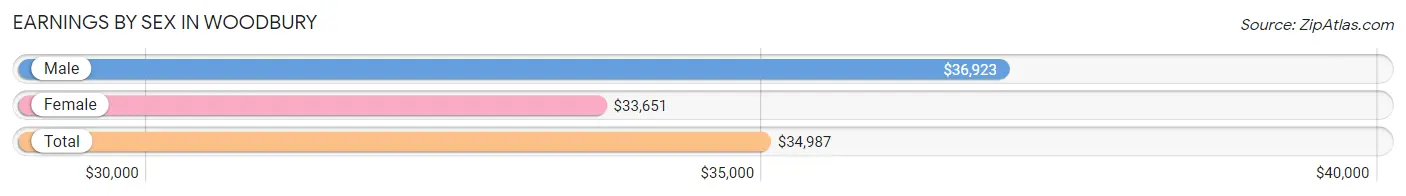
Earnings by Sex in Woodbury
Average Earnings in Woodbury are $34,987, $36,923 for men and $33,651 for women, a difference of 8.9%.
| Sex | Number | Average Earnings |
| Male | 668 (50.1%) | $36,923 |
| Female | 665 (49.9%) | $33,651 |
| Total | 1,333 (100.0%) | $34,987 |
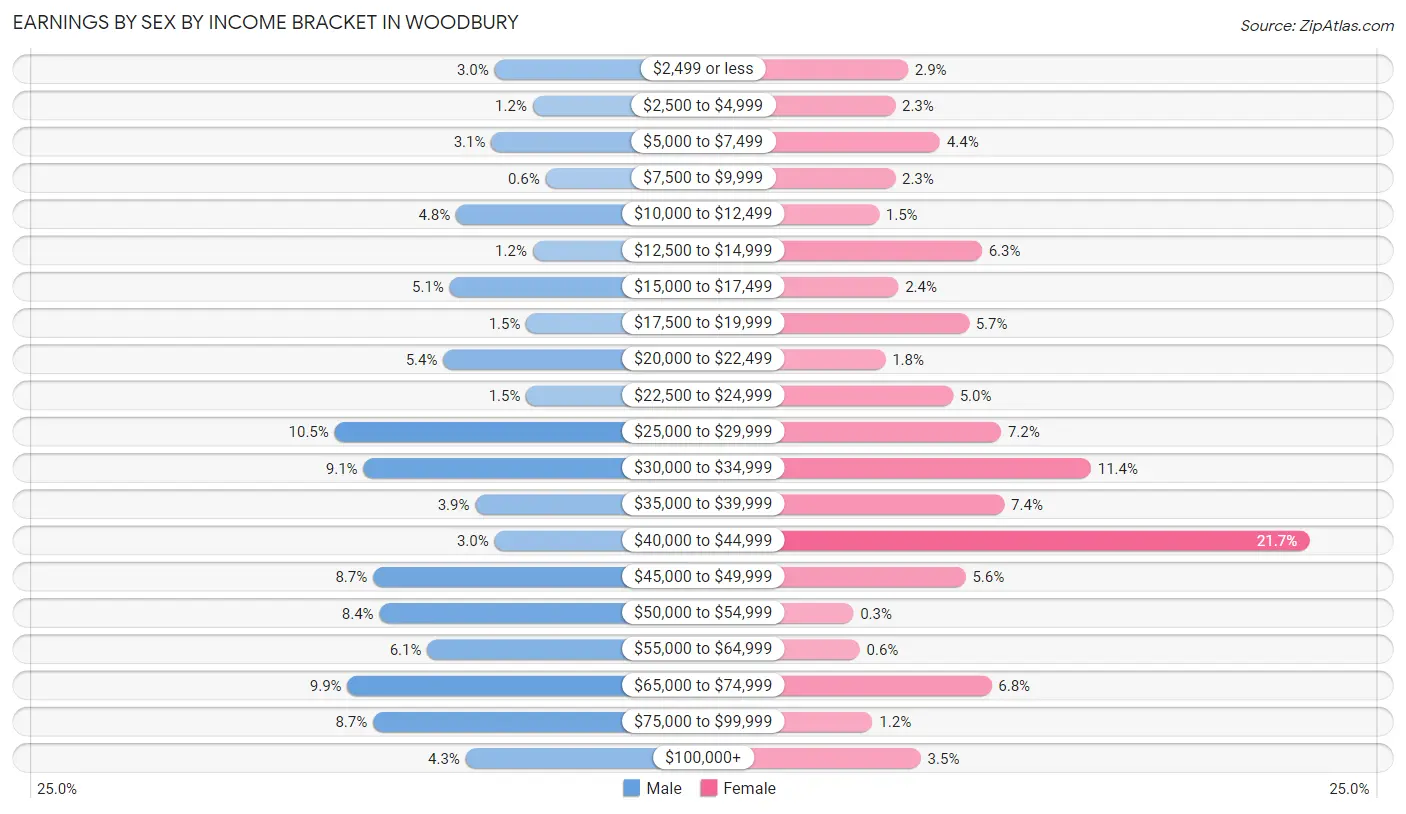
Earnings by Sex by Income Bracket in Woodbury
The most common earnings brackets in Woodbury are $25,000 to $29,999 for men (70 | 10.5%) and $40,000 to $44,999 for women (144 | 21.6%).
| Income | Male | Female |
| $2,499 or less | 20 (3.0%) | 19 (2.9%) |
| $2,500 to $4,999 | 8 (1.2%) | 15 (2.3%) |
| $5,000 to $7,499 | 21 (3.1%) | 29 (4.4%) |
| $7,500 to $9,999 | 4 (0.6%) | 15 (2.3%) |
| $10,000 to $12,499 | 32 (4.8%) | 10 (1.5%) |
| $12,500 to $14,999 | 8 (1.2%) | 42 (6.3%) |
| $15,000 to $17,499 | 34 (5.1%) | 16 (2.4%) |
| $17,500 to $19,999 | 10 (1.5%) | 38 (5.7%) |
| $20,000 to $22,499 | 36 (5.4%) | 12 (1.8%) |
| $22,500 to $24,999 | 10 (1.5%) | 33 (5.0%) |
| $25,000 to $29,999 | 70 (10.5%) | 48 (7.2%) |
| $30,000 to $34,999 | 61 (9.1%) | 76 (11.4%) |
| $35,000 to $39,999 | 26 (3.9%) | 49 (7.4%) |
| $40,000 to $44,999 | 20 (3.0%) | 144 (21.6%) |
| $45,000 to $49,999 | 58 (8.7%) | 37 (5.6%) |
| $50,000 to $54,999 | 56 (8.4%) | 2 (0.3%) |
| $55,000 to $64,999 | 41 (6.1%) | 4 (0.6%) |
| $65,000 to $74,999 | 66 (9.9%) | 45 (6.8%) |
| $75,000 to $99,999 | 58 (8.7%) | 8 (1.2%) |
| $100,000+ | 29 (4.3%) | 23 (3.5%) |
| Total | 668 (100.0%) | 665 (100.0%) |
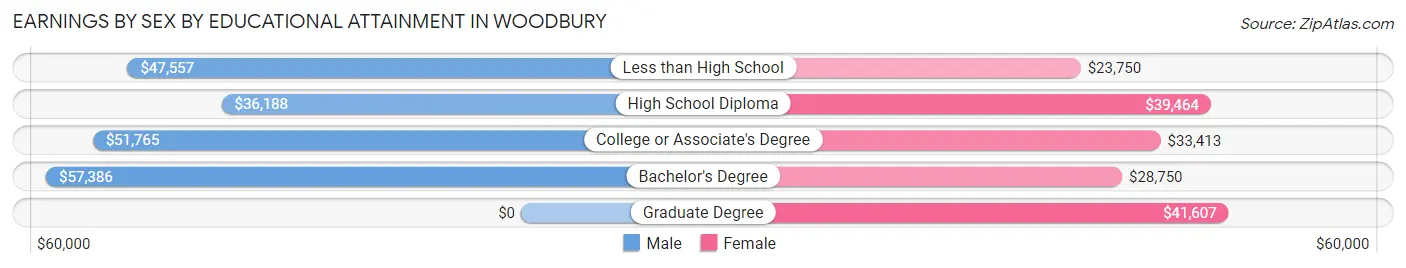
Earnings by Sex by Educational Attainment in Woodbury
Average earnings in Woodbury are $48,500 for men and $35,804 for women, a difference of 26.2%. Men with an educational attainment of bachelor's degree enjoy the highest average annual earnings of $57,386, while those with high school diploma education earn the least with $36,188. Women with an educational attainment of graduate degree earn the most with the average annual earnings of $41,607, while those with less than high school education have the smallest earnings of $23,750.
| Educational Attainment | Male Income | Female Income |
| Less than High School | $47,557 | $23,750 |
| High School Diploma | $36,188 | $39,464 |
| College or Associate's Degree | $51,765 | $33,413 |
| Bachelor's Degree | $57,386 | $28,750 |
| Graduate Degree | - | - |
| Total | $48,500 | $35,804 |
Family Income in Woodbury
Family Income Brackets in Woodbury
According to the Woodbury family income data, there are 111 families falling into the $75,000 to $99,999 income range, which is the most common income bracket and makes up 20.5% of all families.
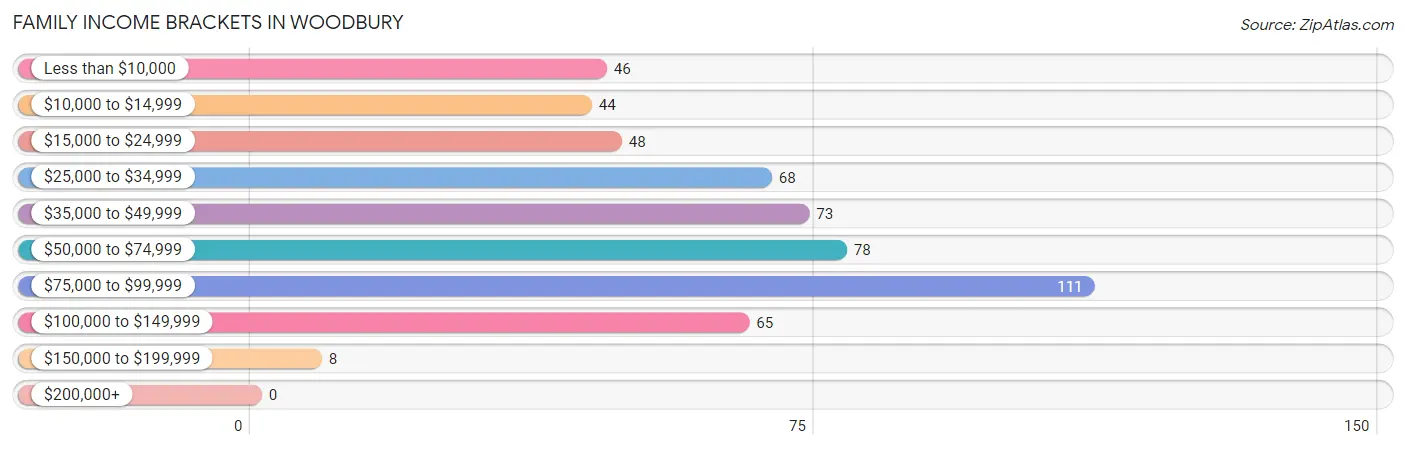
| Income Bracket | # Families | % Families |
| Less than $10,000 | 46 | 8.5% |
| $10,000 to $14,999 | 44 | 8.1% |
| $15,000 to $24,999 | 48 | 8.9% |
| $25,000 to $34,999 | 68 | 12.6% |
| $35,000 to $49,999 | 73 | 13.5% |
| $50,000 to $74,999 | 78 | 14.4% |
| $75,000 to $99,999 | 111 | 20.5% |
| $100,000 to $149,999 | 65 | 12.0% |
| $150,000 to $199,999 | 8 | 1.5% |
| $200,000+ | 0 | 0.0% |
Family Income by Famaliy Size in Woodbury
5-person families (29 | 5.4%) account for the highest median family income in Woodbury with $80,781 per family, while 2-person families (265 | 49.0%) have the highest median income of $20,402 per family member.
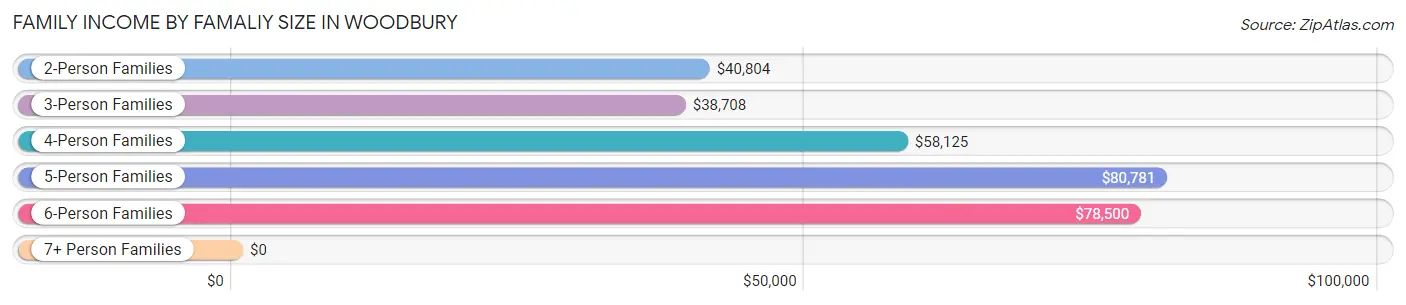
| Income Bracket | # Families | Median Income |
| 2-Person Families | 265 (49.0%) | $40,804 |
| 3-Person Families | 133 (24.6%) | $38,708 |
| 4-Person Families | 102 (18.9%) | $58,125 |
| 5-Person Families | 29 (5.4%) | $80,781 |
| 6-Person Families | 12 (2.2%) | $78,500 |
| 7+ Person Families | 0 (0.0%) | $0 |
| Total | 541 (100.0%) | $48,229 |
Family Income by Number of Earners in Woodbury
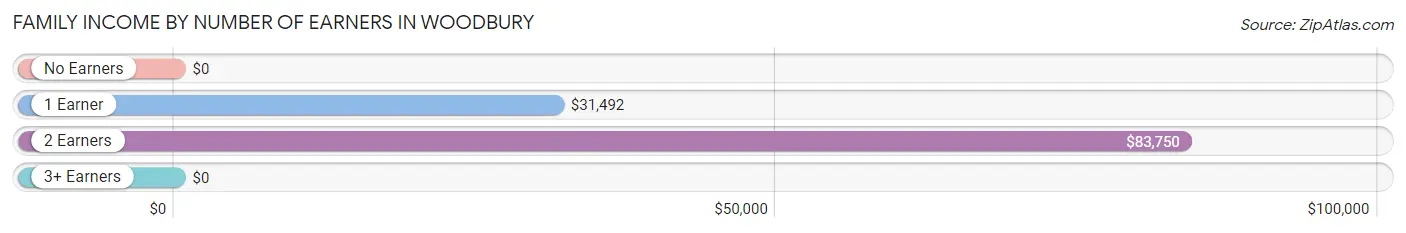
| Number of Earners | # Families | Median Income |
| No Earners | 76 (14.1%) | $0 |
| 1 Earner | 235 (43.4%) | $31,492 |
| 2 Earners | 216 (39.9%) | $83,750 |
| 3+ Earners | 14 (2.6%) | $0 |
| Total | 541 (100.0%) | $48,229 |
Household Income in Woodbury
Household Income Brackets in Woodbury
With 218 households falling in the category, the $50,000 to $74,999 income range is the most frequent in Woodbury, accounting for 21.6% of all households. In contrast, only 7 households (0.7%) fall into the $200,000+ income bracket, making it the least populous group.
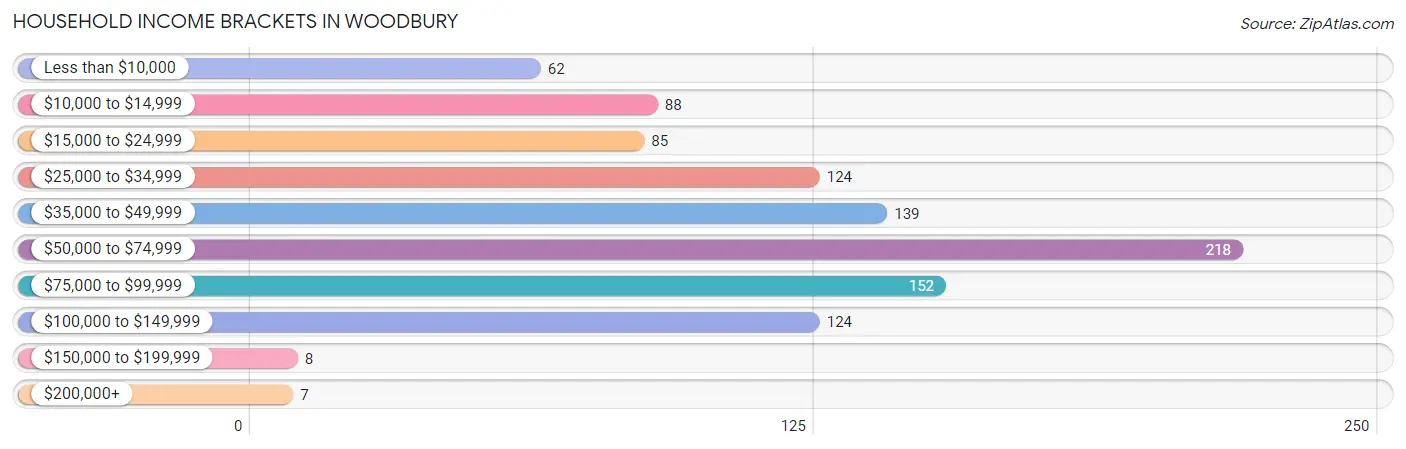
| Income Bracket | # Households | % Households |
| Less than $10,000 | 62 | 6.2% |
| $10,000 to $14,999 | 88 | 8.7% |
| $15,000 to $24,999 | 85 | 8.4% |
| $25,000 to $34,999 | 124 | 12.3% |
| $35,000 to $49,999 | 139 | 13.8% |
| $50,000 to $74,999 | 218 | 21.6% |
| $75,000 to $99,999 | 152 | 15.1% |
| $100,000 to $149,999 | 124 | 12.3% |
| $150,000 to $199,999 | 8 | 0.8% |
| $200,000+ | 7 | 0.7% |
Household Income by Householder Age in Woodbury
The median household income in Woodbury is $51,528, with the highest median household income of $63,472 found in the 25 to 44 years age bracket for the primary householder. A total of 427 households (42.4%) fall into this category. Meanwhile, the 65+ years age bracket for the primary householder has the lowest median household income of $30,667, with 178 households (17.7%) in this group.
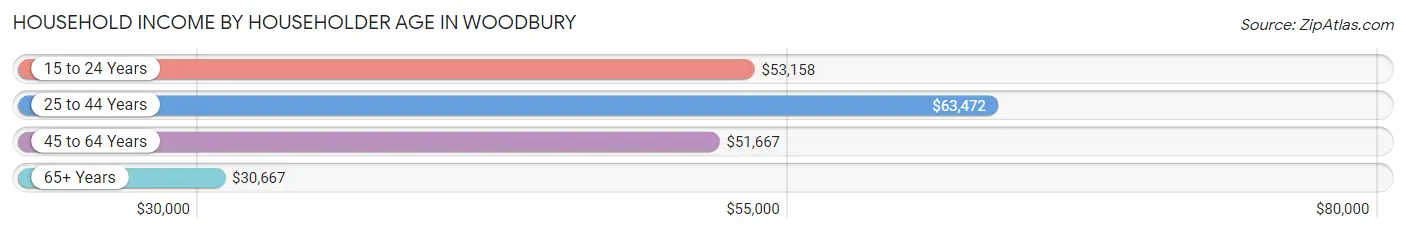
| Income Bracket | # Households | Median Income |
| 15 to 24 Years | 28 (2.8%) | $53,158 |
| 25 to 44 Years | 427 (42.4%) | $63,472 |
| 45 to 64 Years | 374 (37.1%) | $51,667 |
| 65+ Years | 178 (17.7%) | $30,667 |
| Total | 1,007 (100.0%) | $51,528 |
Poverty in Woodbury
Income Below Poverty by Sex and Age in Woodbury
With 18.2% poverty level for males and 18.9% for females among the residents of Woodbury, 15 year old males and 5 year old females are the most vulnerable to poverty, with 22 males (78.6%) and 5 females (50.0%) in their respective age groups living below the poverty level.
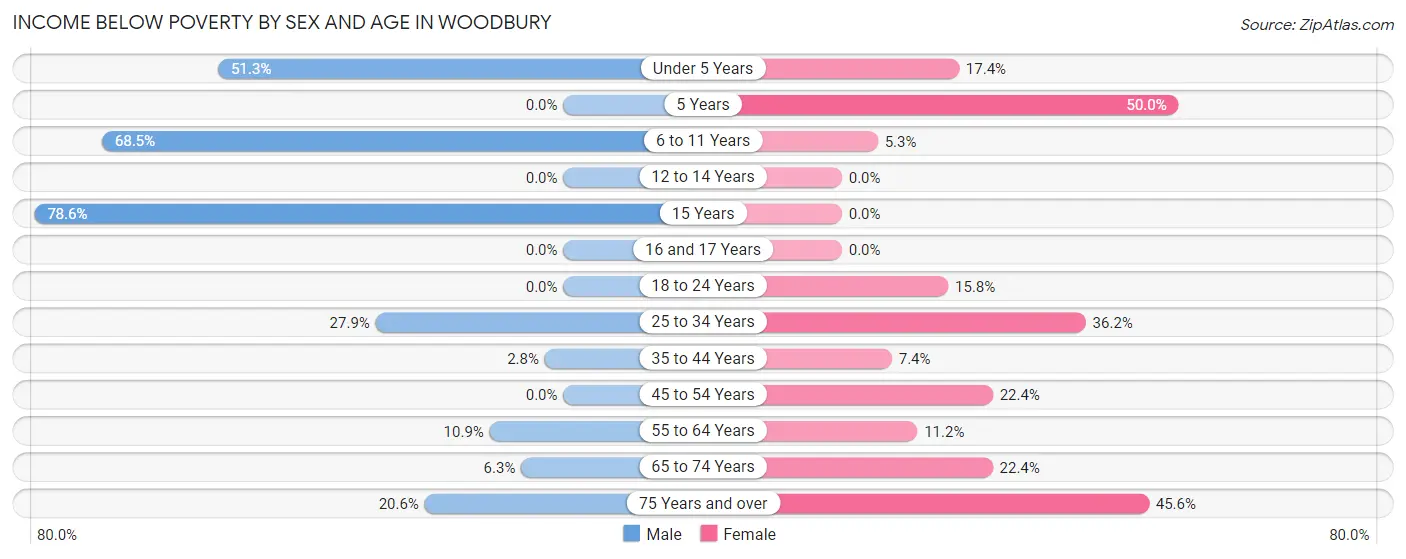
| Age Bracket | Male | Female |
| Under 5 Years | 60 (51.3%) | 12 (17.4%) |
| 5 Years | 0 (0.0%) | 5 (50.0%) |
| 6 to 11 Years | 74 (68.5%) | 4 (5.3%) |
| 12 to 14 Years | 0 (0.0%) | 0 (0.0%) |
| 15 Years | 22 (78.6%) | 0 (0.0%) |
| 16 and 17 Years | 0 (0.0%) | 0 (0.0%) |
| 18 to 24 Years | 0 (0.0%) | 9 (15.8%) |
| 25 to 34 Years | 68 (27.9%) | 84 (36.2%) |
| 35 to 44 Years | 8 (2.8%) | 19 (7.4%) |
| 45 to 54 Years | 0 (0.0%) | 26 (22.4%) |
| 55 to 64 Years | 14 (10.9%) | 14 (11.2%) |
| 65 to 74 Years | 4 (6.2%) | 15 (22.4%) |
| 75 Years and over | 7 (20.6%) | 31 (45.6%) |
| Total | 257 (18.2%) | 219 (18.9%) |
Income Above Poverty by Sex and Age in Woodbury
According to the poverty statistics in Woodbury, males aged 5 years and females aged 12 to 14 years are the age groups that are most secure financially, with 100.0% of males and 100.0% of females in these age groups living above the poverty line.
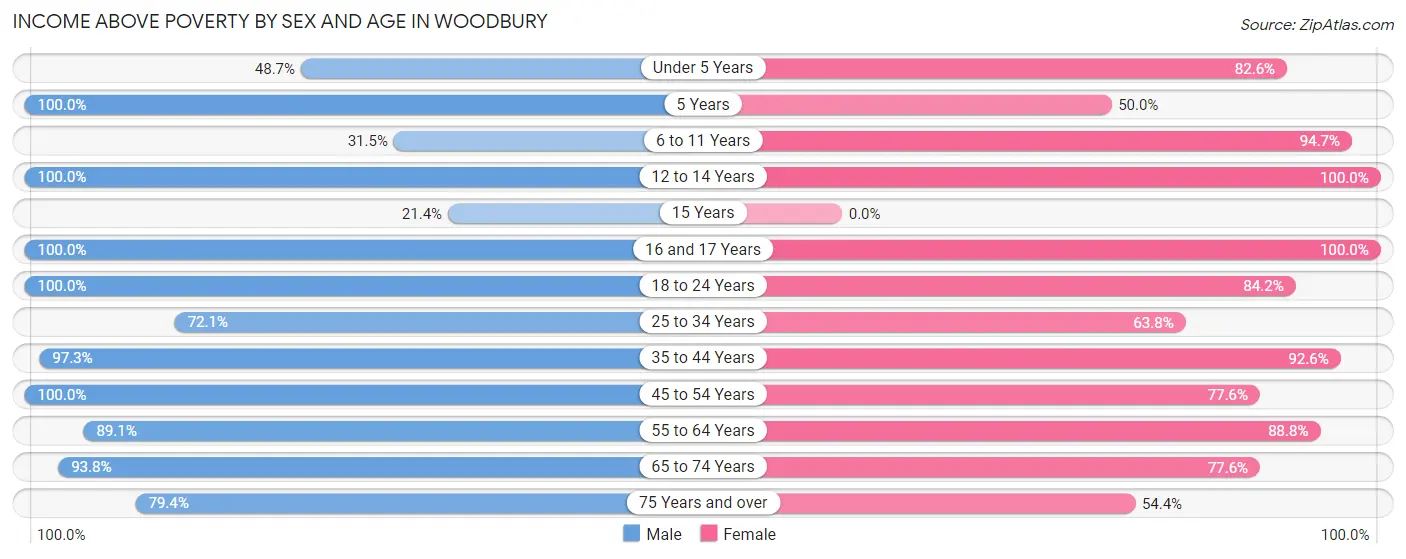
| Age Bracket | Male | Female |
| Under 5 Years | 57 (48.7%) | 57 (82.6%) |
| 5 Years | 13 (100.0%) | 5 (50.0%) |
| 6 to 11 Years | 34 (31.5%) | 71 (94.7%) |
| 12 to 14 Years | 92 (100.0%) | 69 (100.0%) |
| 15 Years | 6 (21.4%) | 0 (0.0%) |
| 16 and 17 Years | 65 (100.0%) | 16 (100.0%) |
| 18 to 24 Years | 120 (100.0%) | 48 (84.2%) |
| 25 to 34 Years | 176 (72.1%) | 148 (63.8%) |
| 35 to 44 Years | 283 (97.3%) | 237 (92.6%) |
| 45 to 54 Years | 109 (100.0%) | 90 (77.6%) |
| 55 to 64 Years | 114 (89.1%) | 111 (88.8%) |
| 65 to 74 Years | 60 (93.8%) | 52 (77.6%) |
| 75 Years and over | 27 (79.4%) | 37 (54.4%) |
| Total | 1,156 (81.8%) | 941 (81.1%) |
Income Below Poverty Among Married-Couple Families in Woodbury
The poverty statistics for married-couple families in Woodbury show that 2.8% or 7 of the total 253 families live below the poverty line. Families with no children have the highest poverty rate of 4.5%, comprising of 7 families. On the other hand, families with 1 or 2 children have the lowest poverty rate of 0.0%, which includes 0 families.
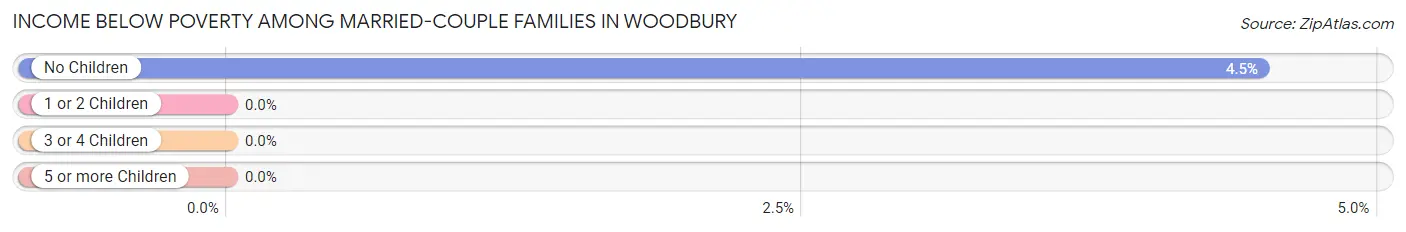
| Children | Above Poverty | Below Poverty |
| No Children | 149 (95.5%) | 7 (4.5%) |
| 1 or 2 Children | 79 (100.0%) | 0 (0.0%) |
| 3 or 4 Children | 18 (100.0%) | 0 (0.0%) |
| 5 or more Children | 0 (0.0%) | 0 (0.0%) |
| Total | 246 (97.2%) | 7 (2.8%) |
Income Below Poverty Among Single-Parent Households in Woodbury
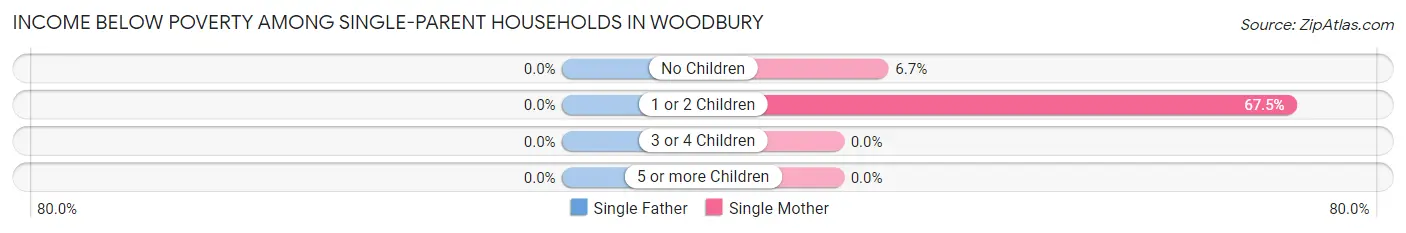
| Children | Single Father | Single Mother |
| No Children | 0 (0.0%) | 4 (6.7%) |
| 1 or 2 Children | 0 (0.0%) | 114 (67.5%) |
| 3 or 4 Children | 0 (0.0%) | 0 (0.0%) |
| 5 or more Children | 0 (0.0%) | 0 (0.0%) |
| Total | 0 (0.0%) | 118 (45.2%) |
Income Below Poverty Among Married-Couple vs Single-Parent Households in Woodbury
The poverty data for Woodbury shows that 7 of the married-couple family households (2.8%) and 118 of the single-parent households (41.0%) are living below the poverty level. Within the married-couple family households, those with no children have the highest poverty rate, with 7 households (4.5%) falling below the poverty line. Among the single-parent households, those with 1 or 2 children have the highest poverty rate, with 114 household (63.3%) living below poverty.
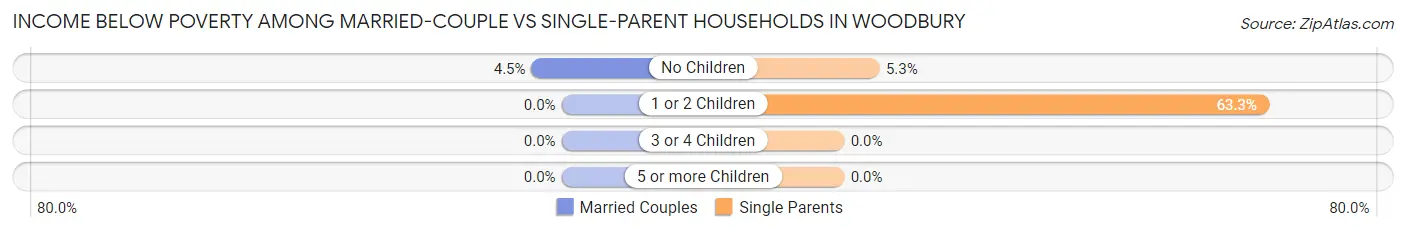
| Children | Married-Couple Families | Single-Parent Households |
| No Children | 7 (4.5%) | 4 (5.3%) |
| 1 or 2 Children | 0 (0.0%) | 114 (63.3%) |
| 3 or 4 Children | 0 (0.0%) | 0 (0.0%) |
| 5 or more Children | 0 (0.0%) | 0 (0.0%) |
| Total | 7 (2.8%) | 118 (41.0%) |
Race in Woodbury
The most populous races in Woodbury are White / Caucasian (2,497 | 92.3%), Hispanic or Latino (120 | 4.4%), and Black / African American (112 | 4.1%).
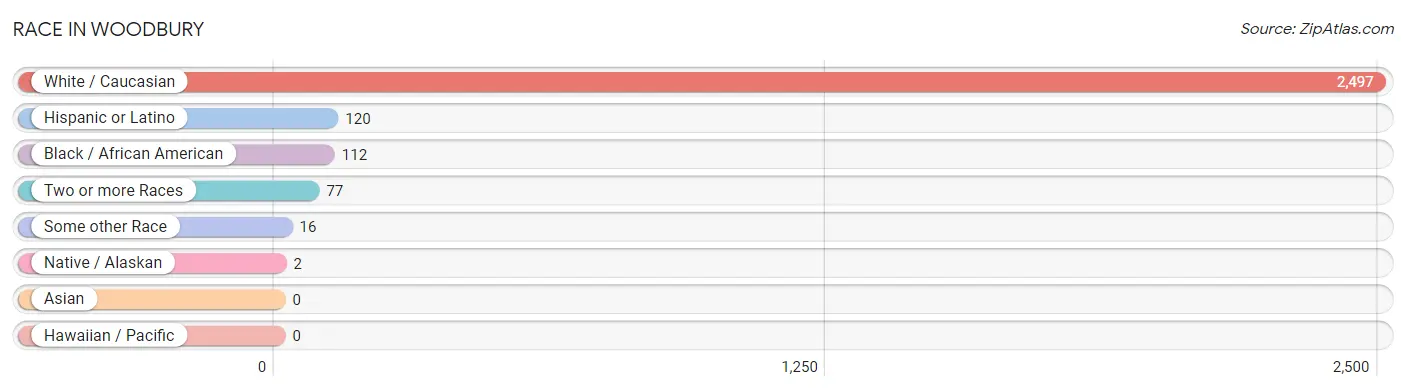
| Race | # Population | % Population |
| Asian | 0 | 0.0% |
| Black / African American | 112 | 4.1% |
| Hawaiian / Pacific | 0 | 0.0% |
| Hispanic or Latino | 120 | 4.4% |
| Native / Alaskan | 2 | 0.1% |
| White / Caucasian | 2,497 | 92.3% |
| Two or more Races | 77 | 2.9% |
| Some other Race | 16 | 0.6% |
| Total | 2,704 | 100.0% |
Ancestry in Woodbury
The most populous ancestries reported in Woodbury are American (370 | 13.7%), Irish (234 | 8.6%), English (193 | 7.1%), German (191 | 7.1%), and Mexican (113 | 4.2%), together accounting for 40.7% of all Woodbury residents.
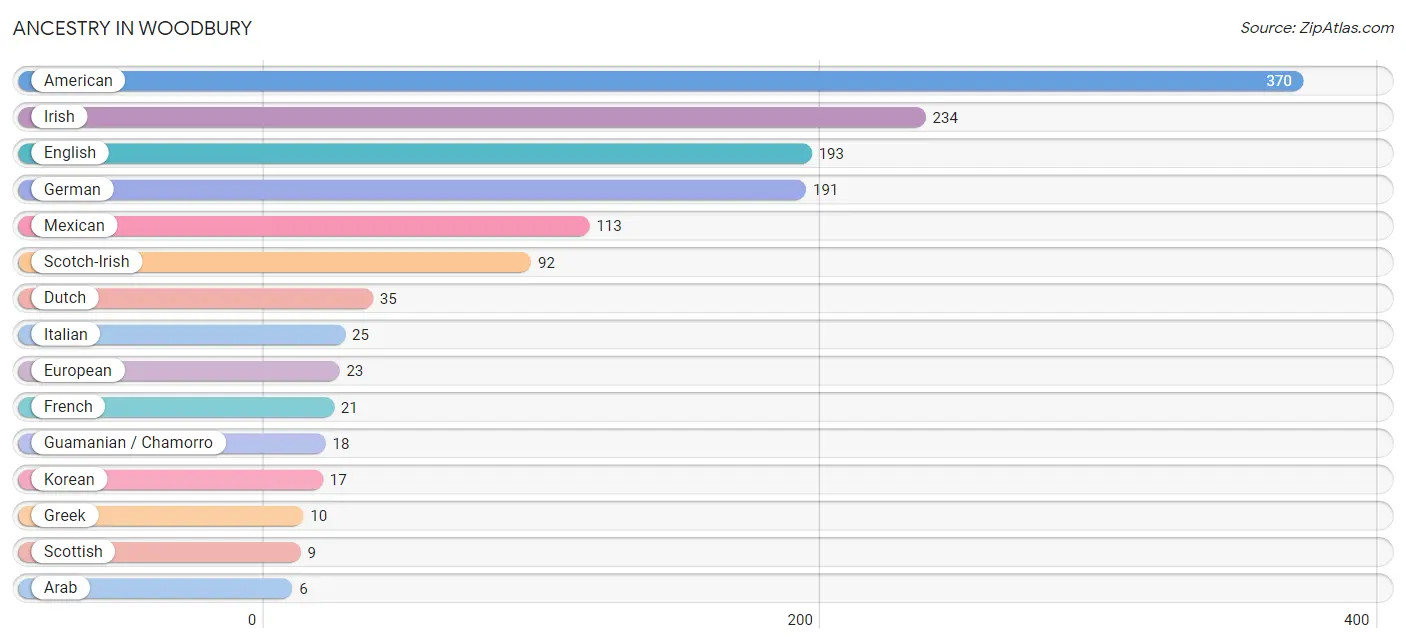
| Ancestry | # Population | % Population |
| American | 370 | 13.7% |
| Arab | 6 | 0.2% |
| British | 5 | 0.2% |
| Cherokee | 3 | 0.1% |
| Creek | 2 | 0.1% |
| Cuban | 4 | 0.2% |
| Dutch | 35 | 1.3% |
| English | 193 | 7.1% |
| European | 23 | 0.9% |
| Finnish | 4 | 0.2% |
| French | 21 | 0.8% |
| French Canadian | 5 | 0.2% |
| German | 191 | 7.1% |
| Greek | 10 | 0.4% |
| Guamanian / Chamorro | 18 | 0.7% |
| Hungarian | 5 | 0.2% |
| Irish | 234 | 8.6% |
| Iroquois | 2 | 0.1% |
| Italian | 25 | 0.9% |
| Korean | 17 | 0.6% |
| Mexican | 113 | 4.2% |
| Norwegian | 3 | 0.1% |
| Polish | 2 | 0.1% |
| Pueblo | 2 | 0.1% |
| Scotch-Irish | 92 | 3.4% |
| Scottish | 9 | 0.3% | View All 26 Rows |
Immigrants in Woodbury
The most numerous immigrant groups reported in Woodbury came from Latin America (24 | 0.9%), Central America (20 | 0.7%), Mexico (20 | 0.7%), Caribbean (4 | 0.2%), and Cuba (4 | 0.2%), together accounting for 2.7% of all Woodbury residents.
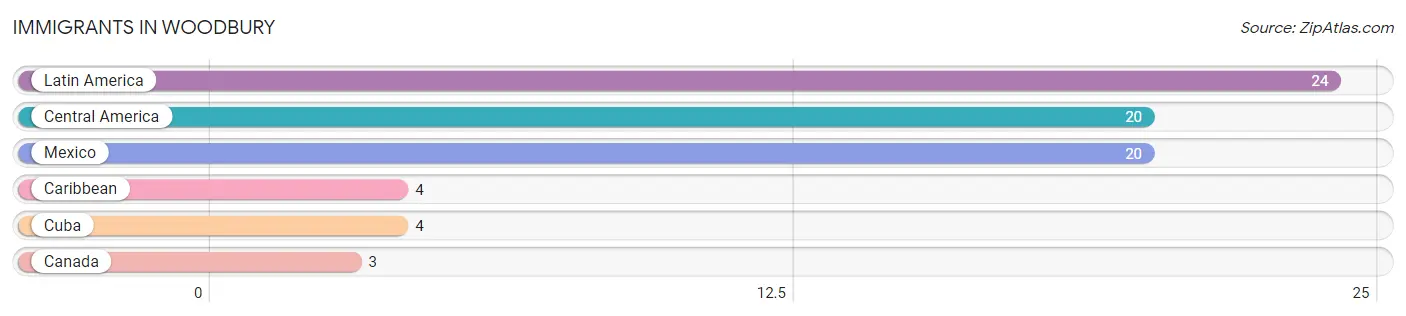
| Immigration Origin | # Population | % Population |
| Canada | 3 | 0.1% |
| Caribbean | 4 | 0.2% |
| Central America | 20 | 0.7% |
| Cuba | 4 | 0.2% |
| Latin America | 24 | 0.9% |
| Mexico | 20 | 0.7% | View All 6 Rows |
Sex and Age in Woodbury
Sex and Age in Woodbury
The most populous age groups in Woodbury are 35 to 39 Years (246 | 16.6%) for men and 35 to 39 Years (188 | 15.4%) for women.
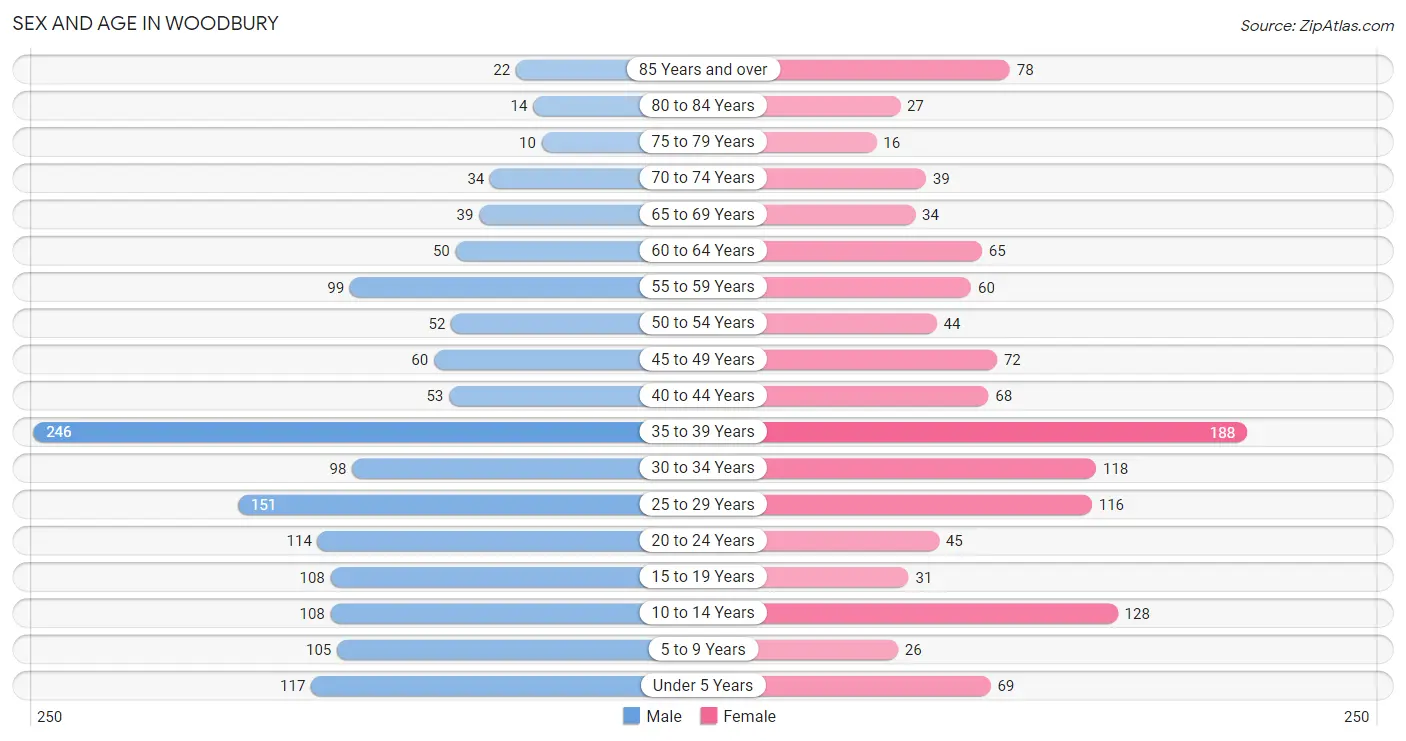
| Age Bracket | Male | Female |
| Under 5 Years | 117 (7.9%) | 69 (5.6%) |
| 5 to 9 Years | 105 (7.1%) | 26 (2.1%) |
| 10 to 14 Years | 108 (7.3%) | 128 (10.5%) |
| 15 to 19 Years | 108 (7.3%) | 31 (2.5%) |
| 20 to 24 Years | 114 (7.7%) | 45 (3.7%) |
| 25 to 29 Years | 151 (10.2%) | 116 (9.5%) |
| 30 to 34 Years | 98 (6.6%) | 118 (9.6%) |
| 35 to 39 Years | 246 (16.6%) | 188 (15.4%) |
| 40 to 44 Years | 53 (3.6%) | 68 (5.6%) |
| 45 to 49 Years | 60 (4.1%) | 72 (5.9%) |
| 50 to 54 Years | 52 (3.5%) | 44 (3.6%) |
| 55 to 59 Years | 99 (6.7%) | 60 (4.9%) |
| 60 to 64 Years | 50 (3.4%) | 65 (5.3%) |
| 65 to 69 Years | 39 (2.6%) | 34 (2.8%) |
| 70 to 74 Years | 34 (2.3%) | 39 (3.2%) |
| 75 to 79 Years | 10 (0.7%) | 16 (1.3%) |
| 80 to 84 Years | 14 (0.9%) | 27 (2.2%) |
| 85 Years and over | 22 (1.5%) | 78 (6.4%) |
| Total | 1,480 (100.0%) | 1,224 (100.0%) |
Families and Households in Woodbury
Median Family Size in Woodbury
The median family size in Woodbury is 3.46 persons per family, with married-couple families (253 | 46.8%) accounting for the largest median family size of 3.99 persons per family. On the other hand, single male/father families (27 | 5.0%) represent the smallest median family size with 2.48 persons per family.
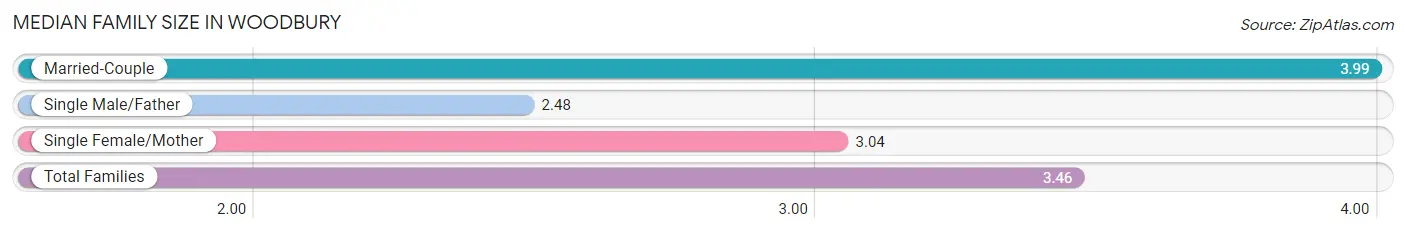
| Family Type | # Families | Family Size |
| Married-Couple | 253 (46.8%) | 3.99 |
| Single Male/Father | 27 (5.0%) | 2.48 |
| Single Female/Mother | 261 (48.2%) | 3.04 |
| Total Families | 541 (100.0%) | 3.46 |
Median Household Size in Woodbury
The median household size in Woodbury is 2.56 persons per household, with married-couple households (253 | 25.1%) accounting for the largest median household size of 4.02 persons per household. non-family households (466 | 46.3%) represent the smallest median household size with 1.25 persons per household.
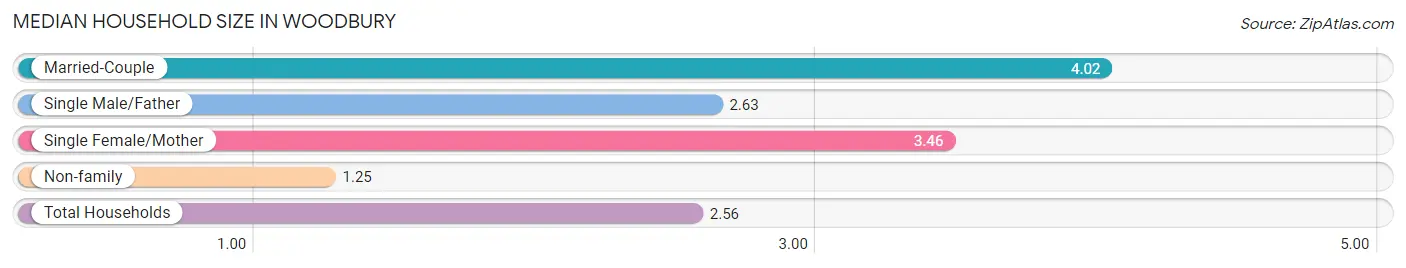
| Household Type | # Households | Household Size |
| Married-Couple | 253 (25.1%) | 4.02 |
| Single Male/Father | 27 (2.7%) | 2.63 |
| Single Female/Mother | 261 (25.9%) | 3.46 |
| Non-family | 466 (46.3%) | 1.25 |
| Total Households | 1,007 (100.0%) | 2.56 |
Household Size by Marriage Status in Woodbury
Out of a total of 1,007 households in Woodbury, 541 (53.7%) are family households, while 466 (46.3%) are nonfamily households. The most numerous type of family households are 2-person households, comprising 252, and the most common type of nonfamily households are 1-person households, comprising 371.
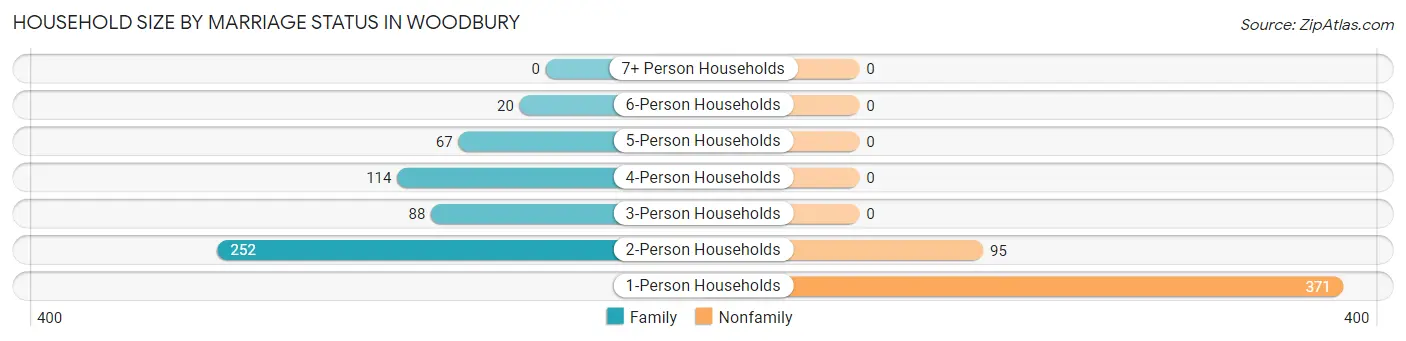
| Household Size | Family Households | Nonfamily Households |
| 1-Person Households | - | 371 (36.8%) |
| 2-Person Households | 252 (25.0%) | 95 (9.4%) |
| 3-Person Households | 88 (8.7%) | 0 (0.0%) |
| 4-Person Households | 114 (11.3%) | 0 (0.0%) |
| 5-Person Households | 67 (6.7%) | 0 (0.0%) |
| 6-Person Households | 20 (2.0%) | 0 (0.0%) |
| 7+ Person Households | 0 (0.0%) | 0 (0.0%) |
| Total | 541 (53.7%) | 466 (46.3%) |
Female Fertility in Woodbury
Fertility by Age in Woodbury
Average fertility rate in Woodbury is 39.0 births per 1,000 women. Women in the age bracket of 20 to 34 years have the highest fertility rate with 43.0 births per 1,000 women. Women in the age bracket of 35 to 50 years acount for 52.0% of all women with births.
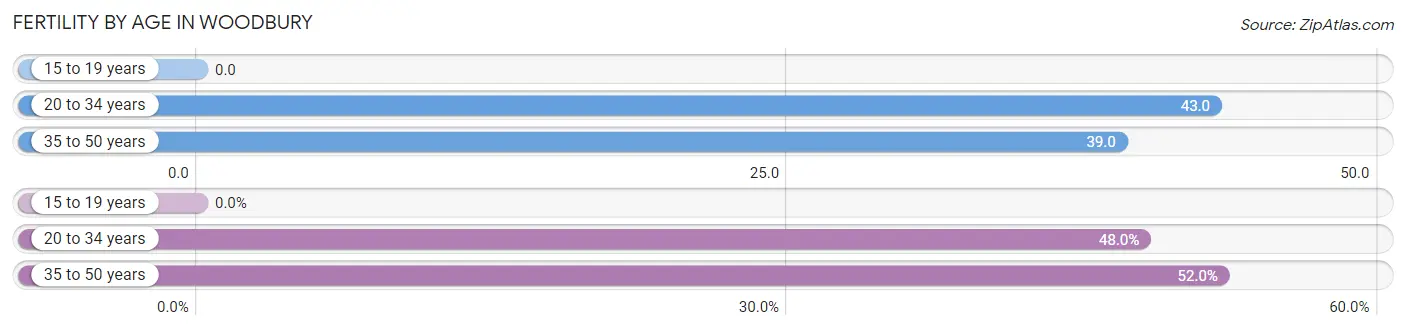
| Age Bracket | Women with Births | Births / 1,000 Women |
| 15 to 19 years | 0 (0.0%) | 0.0 |
| 20 to 34 years | 12 (48.0%) | 43.0 |
| 35 to 50 years | 13 (52.0%) | 39.0 |
| Total | 25 (100.0%) | 39.0 |
Fertility by Age by Marriage Status in Woodbury
48.0% of women with births (25) in Woodbury are married. The highest percentage of unmarried women with births falls into 20 to 34 years age bracket with 58.3% of them unmarried at the time of birth, while the lowest percentage of unmarried women with births belong to 35 to 50 years age bracket with 46.2% of them unmarried.
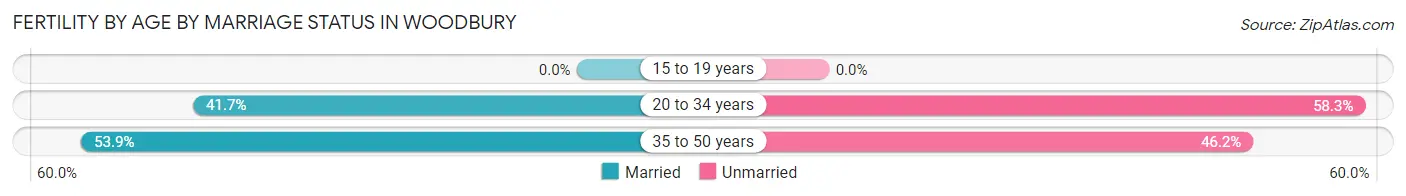
| Age Bracket | Married | Unmarried |
| 15 to 19 years | 0 (0.0%) | 0 (0.0%) |
| 20 to 34 years | 5 (41.7%) | 7 (58.3%) |
| 35 to 50 years | 7 (53.8%) | 6 (46.2%) |
| Total | 12 (48.0%) | 13 (52.0%) |
Fertility by Education in Woodbury
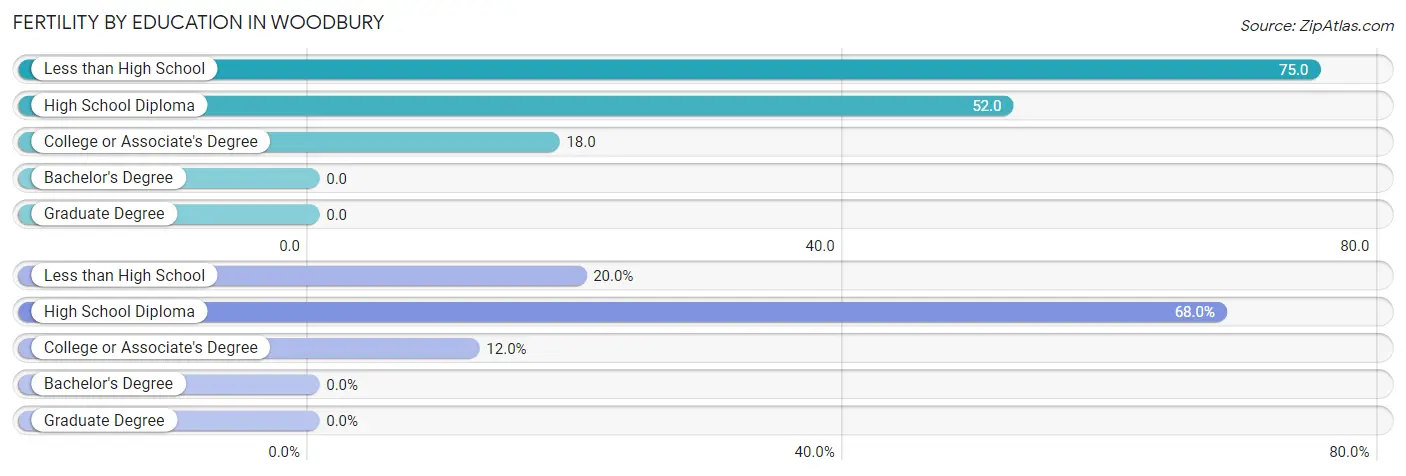
| Educational Attainment | Women with Births | Births / 1,000 Women |
| Less than High School | 5 (20.0%) | 75.0 |
| High School Diploma | 17 (68.0%) | 52.0 |
| College or Associate's Degree | 3 (12.0%) | 18.0 |
| Bachelor's Degree | 0 (0.0%) | 0.0 |
| Graduate Degree | 0 (0.0%) | 0.0 |
| Total | 25 (100.0%) | 39.0 |
Fertility by Education by Marriage Status in Woodbury
52.0% of women with births in Woodbury are unmarried. Women with the educational attainment of less than high school are most likely to be married with 100.0% of them married at childbirth, while women with the educational attainment of college or associate's degree are least likely to be married with 100.0% of them unmarried at childbirth.
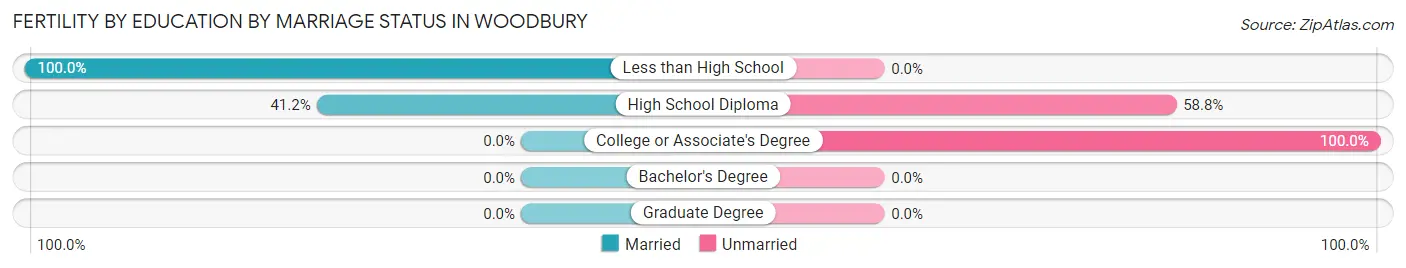
| Educational Attainment | Married | Unmarried |
| Less than High School | 5 (100.0%) | 0 (0.0%) |
| High School Diploma | 7 (41.2%) | 10 (58.8%) |
| College or Associate's Degree | 0 (0.0%) | 3 (100.0%) |
| Bachelor's Degree | 0 (0.0%) | 0 (0.0%) |
| Graduate Degree | 0 (0.0%) | 0 (0.0%) |
| Total | 12 (48.0%) | 13 (52.0%) |
Employment Characteristics in Woodbury
Employment by Class of Employer in Woodbury
Among the 1,193 employed individuals in Woodbury, private company employees (890 | 74.6%), local government employees (152 | 12.7%), and federal government employees (49 | 4.1%) make up the most common classes of employment.
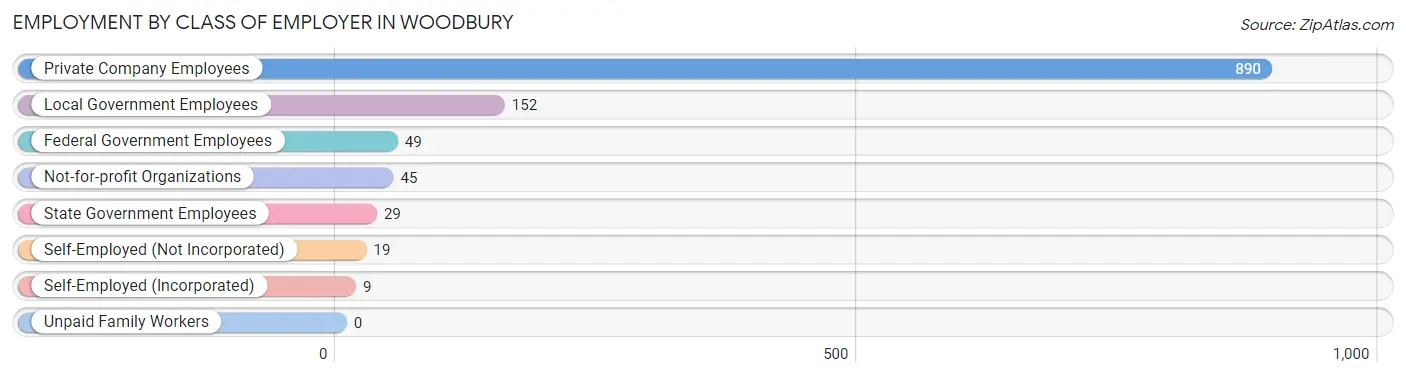
| Employer Class | # Employees | % Employees |
| Private Company Employees | 890 | 74.6% |
| Self-Employed (Incorporated) | 9 | 0.7% |
| Self-Employed (Not Incorporated) | 19 | 1.6% |
| Not-for-profit Organizations | 45 | 3.8% |
| Local Government Employees | 152 | 12.7% |
| State Government Employees | 29 | 2.4% |
| Federal Government Employees | 49 | 4.1% |
| Unpaid Family Workers | 0 | 0.0% |
| Total | 1,193 | 100.0% |
Employment Status by Age in Woodbury
According to the labor force statistics for Woodbury, out of the total population over 16 years of age (2,123), 59.3% or 1,259 individuals are in the labor force, with 3.4% or 43 of them unemployed. The age group with the highest labor force participation rate is 25 to 29 years, with 81.3% or 217 individuals in the labor force. Within the labor force, the 20 to 24 years age range has the highest percentage of unemployed individuals, with 21.8% or 26 of them being unemployed.
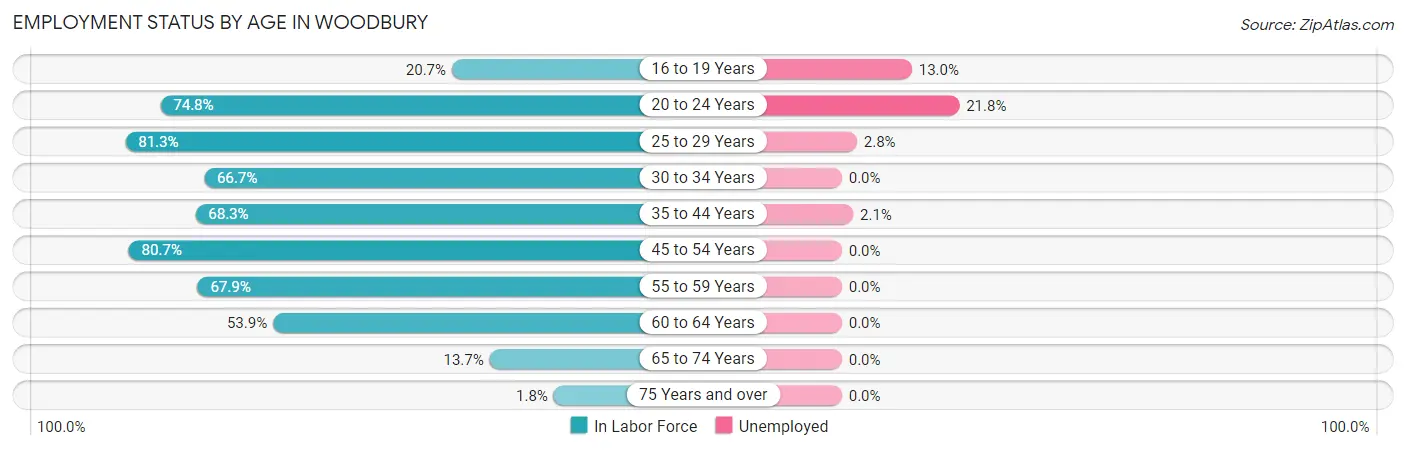
| Age Bracket | In Labor Force | Unemployed |
| 16 to 19 Years | 23 (20.7%) | 3 (13.0%) |
| 20 to 24 Years | 119 (74.8%) | 26 (21.8%) |
| 25 to 29 Years | 217 (81.3%) | 6 (2.8%) |
| 30 to 34 Years | 144 (66.7%) | 0 (0.0%) |
| 35 to 44 Years | 379 (68.3%) | 8 (2.1%) |
| 45 to 54 Years | 184 (80.7%) | 0 (0.0%) |
| 55 to 59 Years | 108 (67.9%) | 0 (0.0%) |
| 60 to 64 Years | 62 (53.9%) | 0 (0.0%) |
| 65 to 74 Years | 20 (13.7%) | 0 (0.0%) |
| 75 Years and over | 3 (1.8%) | 0 (0.0%) |
| Total | 1,259 (59.3%) | 43 (3.4%) |
Employment Status by Educational Attainment in Woodbury
According to labor force statistics for Woodbury, 71.0% of individuals (1,093) out of the total population between 25 and 64 years of age (1,540) are in the labor force, with 1.3% or 14 of them being unemployed. The group with the highest labor force participation rate are those with the educational attainment of bachelor's degree or higher, with 94.3% or 198 individuals in the labor force. Within the labor force, individuals with college / associate degree education have the highest percentage of unemployment, with 2.5% or 8 of them being unemployed.
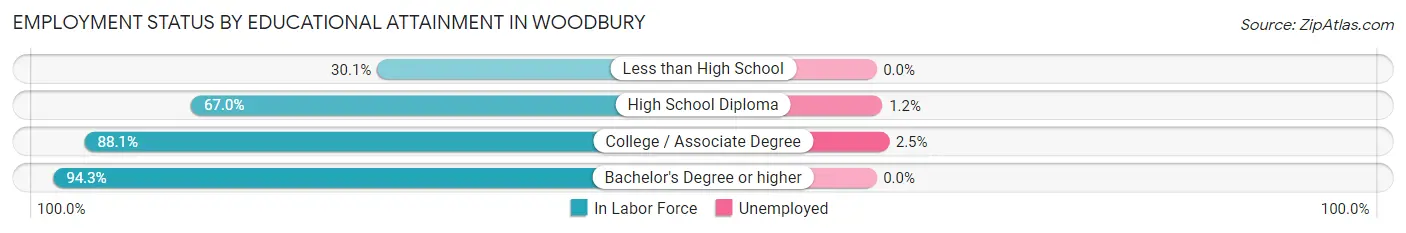
| Educational Attainment | In Labor Force | Unemployed |
| Less than High School | 58 (30.1%) | 0 (0.0%) |
| High School Diploma | 520 (67.0%) | 9 (1.2%) |
| College / Associate Degree | 318 (88.1%) | 9 (2.5%) |
| Bachelor's Degree or higher | 198 (94.3%) | 0 (0.0%) |
| Total | 1,093 (71.0%) | 20 (1.3%) |
Employment Occupations by Sex in Woodbury
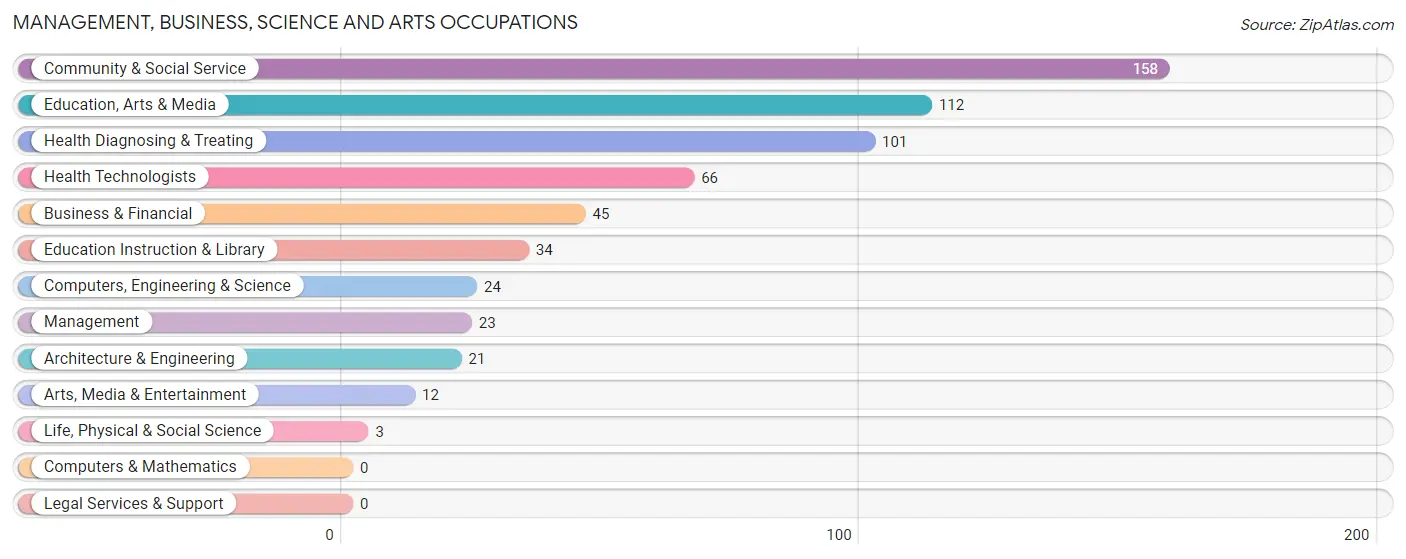
Management, Business, Science and Arts Occupations
The most common Management, Business, Science and Arts occupations in Woodbury are Community & Social Service (158 | 13.0%), Education, Arts & Media (112 | 9.2%), Health Diagnosing & Treating (101 | 8.3%), Health Technologists (66 | 5.4%), and Business & Financial (45 | 3.7%).
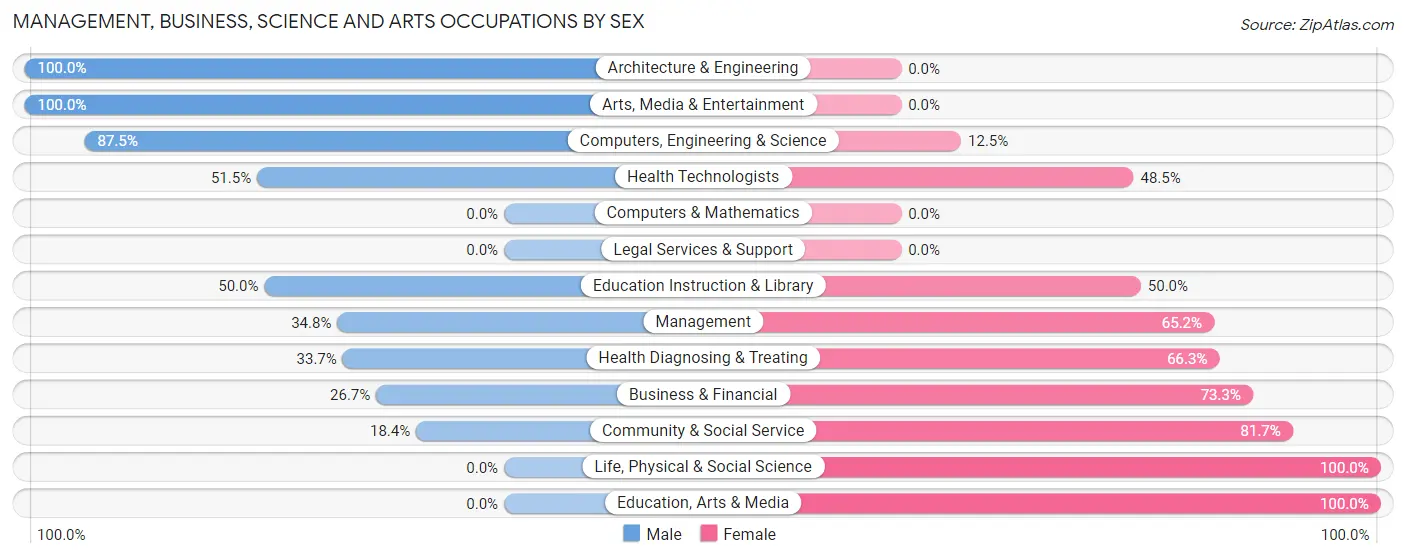
Management, Business, Science and Arts Occupations by Sex
Within the Management, Business, Science and Arts occupations in Woodbury, the most male-oriented occupations are Architecture & Engineering (100.0%), Arts, Media & Entertainment (100.0%), and Computers, Engineering & Science (87.5%), while the most female-oriented occupations are Life, Physical & Social Science (100.0%), Education, Arts & Media (100.0%), and Community & Social Service (81.7%).
| Occupation | Male | Female |
| Management | 8 (34.8%) | 15 (65.2%) |
| Business & Financial | 12 (26.7%) | 33 (73.3%) |
| Computers, Engineering & Science | 21 (87.5%) | 3 (12.5%) |
| Computers & Mathematics | 0 (0.0%) | 0 (0.0%) |
| Architecture & Engineering | 21 (100.0%) | 0 (0.0%) |
| Life, Physical & Social Science | 0 (0.0%) | 3 (100.0%) |
| Community & Social Service | 29 (18.3%) | 129 (81.7%) |
| Education, Arts & Media | 0 (0.0%) | 112 (100.0%) |
| Legal Services & Support | 0 (0.0%) | 0 (0.0%) |
| Education Instruction & Library | 17 (50.0%) | 17 (50.0%) |
| Arts, Media & Entertainment | 12 (100.0%) | 0 (0.0%) |
| Health Diagnosing & Treating | 34 (33.7%) | 67 (66.3%) |
| Health Technologists | 34 (51.5%) | 32 (48.5%) |
| Total (Category) | 104 (29.6%) | 247 (70.4%) |
| Total (Overall) | 586 (48.2%) | 630 (51.8%) |
Services Occupations
The most common Services occupations in Woodbury are Food Preparation & Serving (77 | 6.3%), Cleaning & Maintenance (54 | 4.4%), Healthcare Support (45 | 3.7%), Personal Care & Service (32 | 2.6%), and Security & Protection (4 | 0.3%).

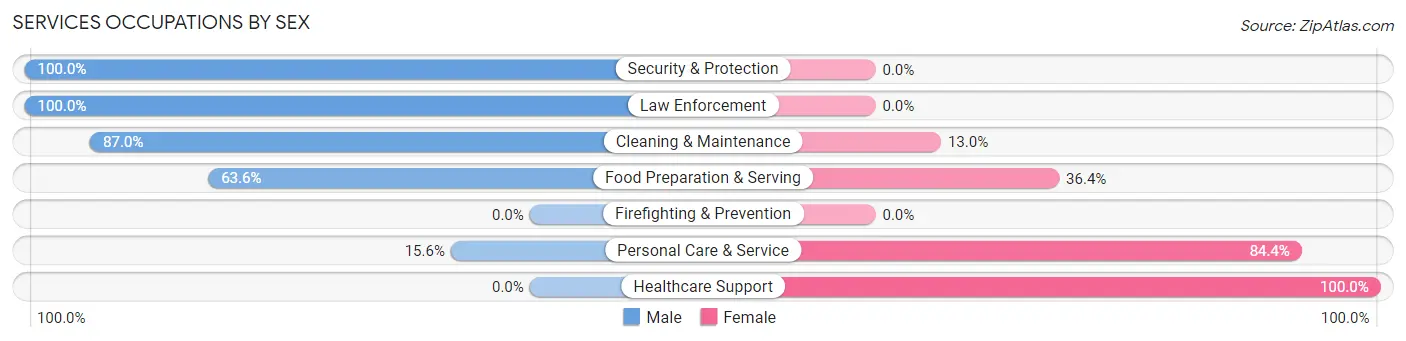
Services Occupations by Sex
Within the Services occupations in Woodbury, the most male-oriented occupations are Security & Protection (100.0%), Law Enforcement (100.0%), and Cleaning & Maintenance (87.0%), while the most female-oriented occupations are Healthcare Support (100.0%), Personal Care & Service (84.4%), and Food Preparation & Serving (36.4%).
| Occupation | Male | Female |
| Healthcare Support | 0 (0.0%) | 45 (100.0%) |
| Security & Protection | 4 (100.0%) | 0 (0.0%) |
| Firefighting & Prevention | 0 (0.0%) | 0 (0.0%) |
| Law Enforcement | 4 (100.0%) | 0 (0.0%) |
| Food Preparation & Serving | 49 (63.6%) | 28 (36.4%) |
| Cleaning & Maintenance | 47 (87.0%) | 7 (13.0%) |
| Personal Care & Service | 5 (15.6%) | 27 (84.4%) |
| Total (Category) | 105 (49.5%) | 107 (50.5%) |
| Total (Overall) | 586 (48.2%) | 630 (51.8%) |
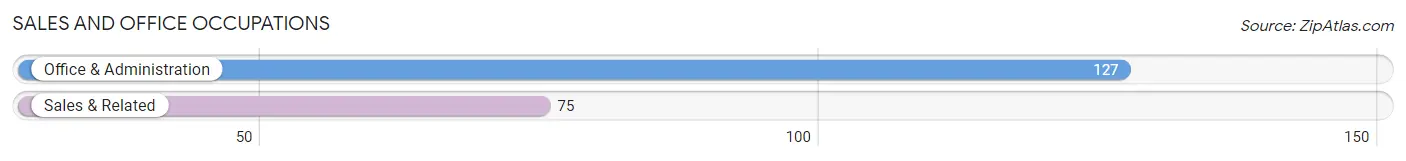
Sales and Office Occupations
The most common Sales and Office occupations in Woodbury are Office & Administration (127 | 10.4%), and Sales & Related (75 | 6.2%).
Sales and Office Occupations by Sex
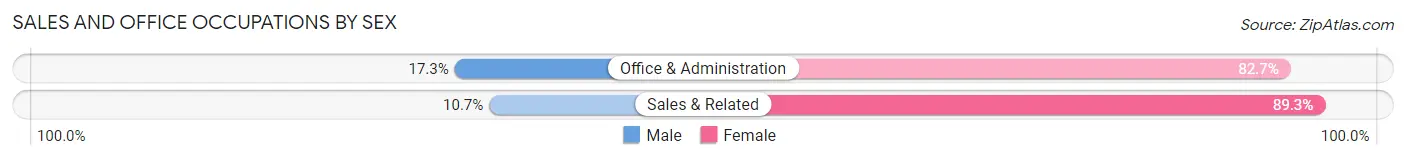
| Occupation | Male | Female |
| Sales & Related | 8 (10.7%) | 67 (89.3%) |
| Office & Administration | 22 (17.3%) | 105 (82.7%) |
| Total (Category) | 30 (14.8%) | 172 (85.2%) |
| Total (Overall) | 586 (48.2%) | 630 (51.8%) |
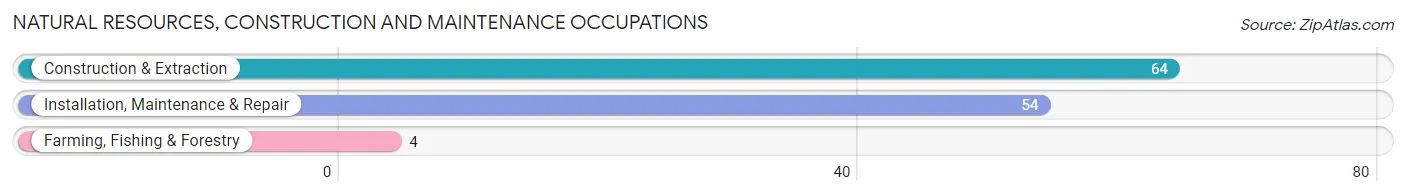
Natural Resources, Construction and Maintenance Occupations
The most common Natural Resources, Construction and Maintenance occupations in Woodbury are Construction & Extraction (64 | 5.3%), Installation, Maintenance & Repair (54 | 4.4%), and Farming, Fishing & Forestry (4 | 0.3%).
Natural Resources, Construction and Maintenance Occupations by Sex
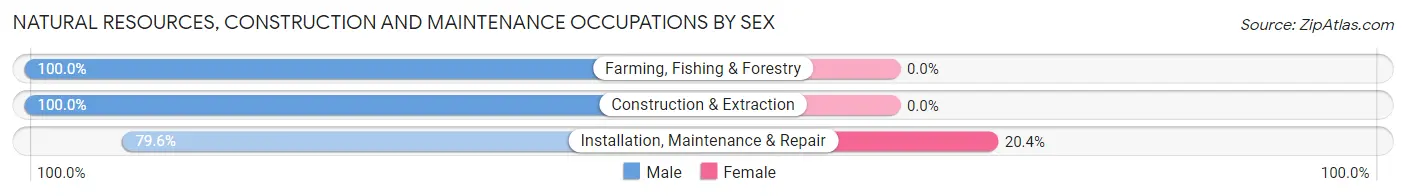
| Occupation | Male | Female |
| Farming, Fishing & Forestry | 4 (100.0%) | 0 (0.0%) |
| Construction & Extraction | 64 (100.0%) | 0 (0.0%) |
| Installation, Maintenance & Repair | 43 (79.6%) | 11 (20.4%) |
| Total (Category) | 111 (91.0%) | 11 (9.0%) |
| Total (Overall) | 586 (48.2%) | 630 (51.8%) |
Production, Transportation and Moving Occupations
The most common Production, Transportation and Moving occupations in Woodbury are Production (201 | 16.5%), Material Moving (93 | 7.6%), and Transportation (35 | 2.9%).
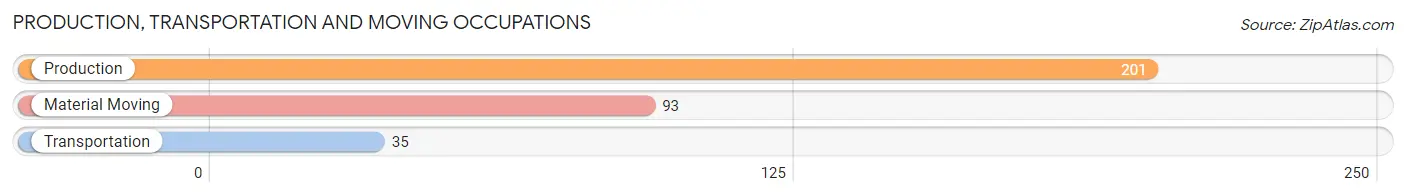
Production, Transportation and Moving Occupations by Sex
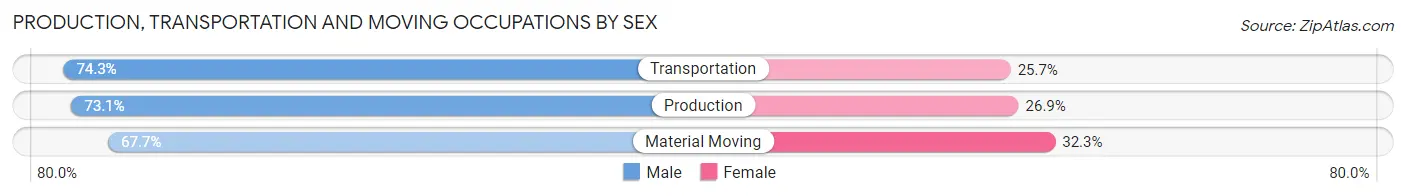
| Occupation | Male | Female |
| Production | 147 (73.1%) | 54 (26.9%) |
| Transportation | 26 (74.3%) | 9 (25.7%) |
| Material Moving | 63 (67.7%) | 30 (32.3%) |
| Total (Category) | 236 (71.7%) | 93 (28.3%) |
| Total (Overall) | 586 (48.2%) | 630 (51.8%) |
Employment Industries by Sex in Woodbury
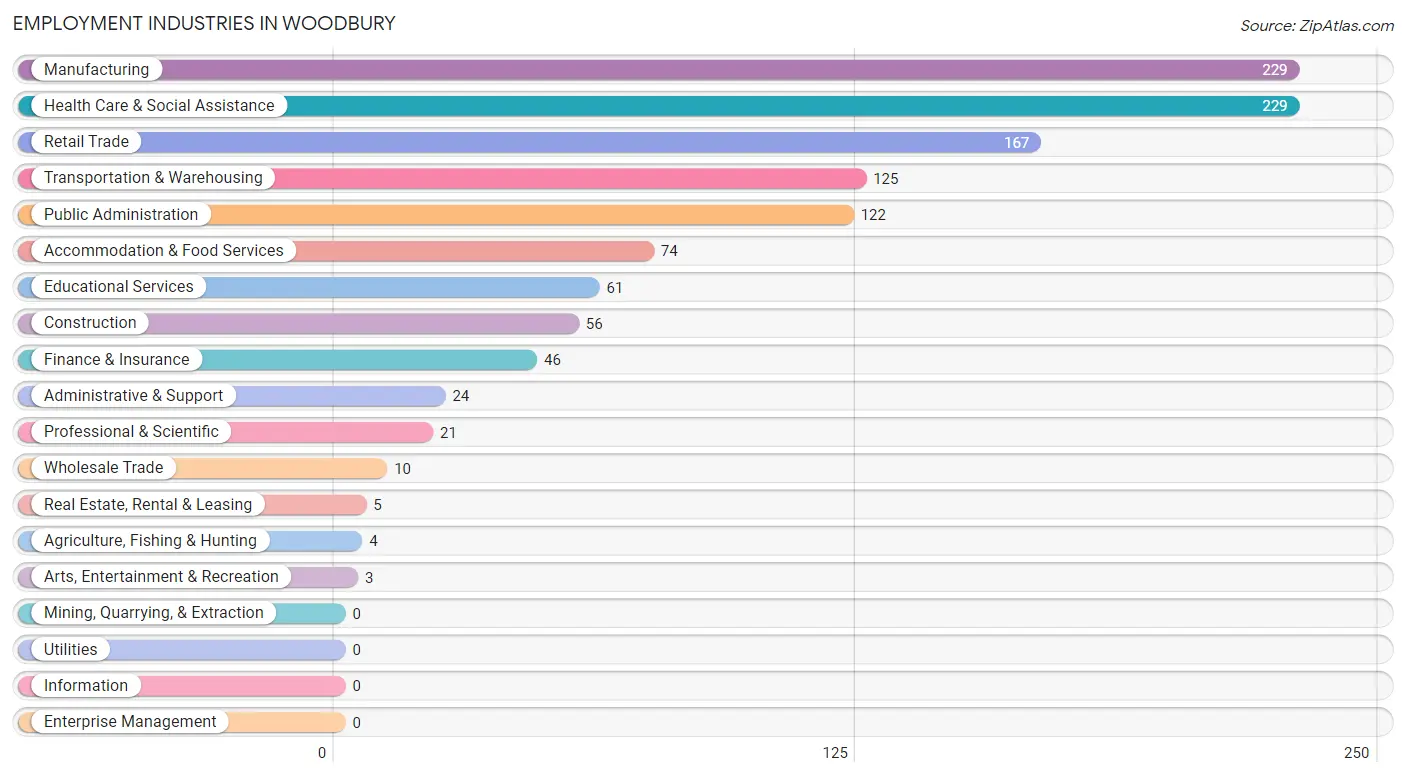
Employment Industries in Woodbury
The major employment industries in Woodbury include Manufacturing (229 | 18.8%), Health Care & Social Assistance (229 | 18.8%), Retail Trade (167 | 13.7%), Transportation & Warehousing (125 | 10.3%), and Public Administration (122 | 10.0%).
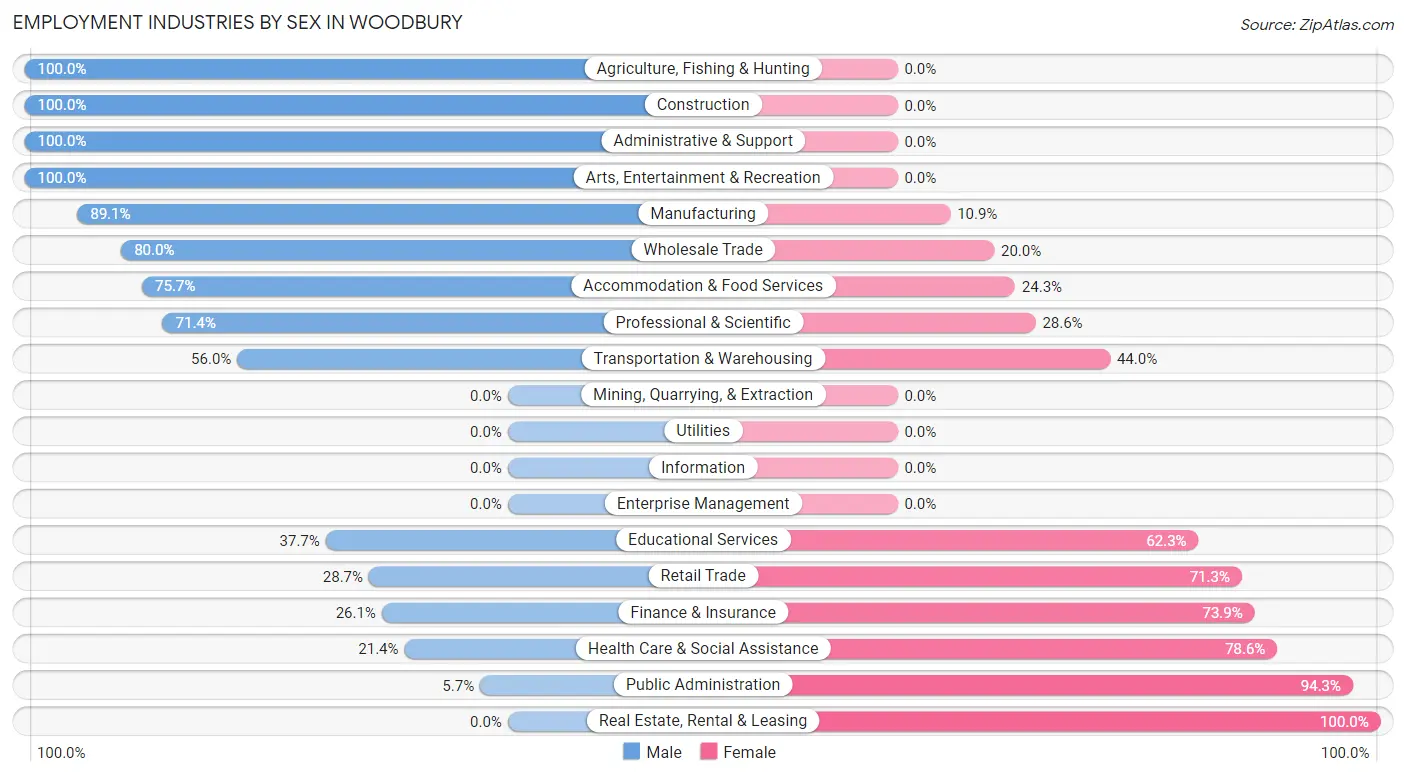
Employment Industries by Sex in Woodbury
The Woodbury industries that see more men than women are Agriculture, Fishing & Hunting (100.0%), Construction (100.0%), and Administrative & Support (100.0%), whereas the industries that tend to have a higher number of women are Real Estate, Rental & Leasing (100.0%), Public Administration (94.3%), and Health Care & Social Assistance (78.6%).
| Industry | Male | Female |
| Agriculture, Fishing & Hunting | 4 (100.0%) | 0 (0.0%) |
| Mining, Quarrying, & Extraction | 0 (0.0%) | 0 (0.0%) |
| Construction | 56 (100.0%) | 0 (0.0%) |
| Manufacturing | 204 (89.1%) | 25 (10.9%) |
| Wholesale Trade | 8 (80.0%) | 2 (20.0%) |
| Retail Trade | 48 (28.7%) | 119 (71.3%) |
| Transportation & Warehousing | 70 (56.0%) | 55 (44.0%) |
| Utilities | 0 (0.0%) | 0 (0.0%) |
| Information | 0 (0.0%) | 0 (0.0%) |
| Finance & Insurance | 12 (26.1%) | 34 (73.9%) |
| Real Estate, Rental & Leasing | 0 (0.0%) | 5 (100.0%) |
| Professional & Scientific | 15 (71.4%) | 6 (28.6%) |
| Enterprise Management | 0 (0.0%) | 0 (0.0%) |
| Administrative & Support | 24 (100.0%) | 0 (0.0%) |
| Educational Services | 23 (37.7%) | 38 (62.3%) |
| Health Care & Social Assistance | 49 (21.4%) | 180 (78.6%) |
| Arts, Entertainment & Recreation | 3 (100.0%) | 0 (0.0%) |
| Accommodation & Food Services | 56 (75.7%) | 18 (24.3%) |
| Public Administration | 7 (5.7%) | 115 (94.3%) |
| Total | 586 (48.2%) | 630 (51.8%) |
Education in Woodbury
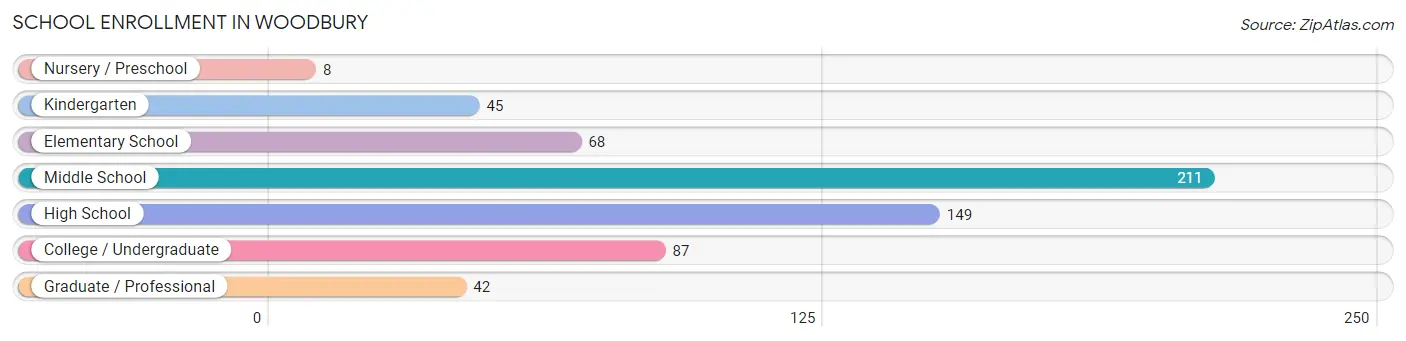
School Enrollment in Woodbury
The most common levels of schooling among the 610 students in Woodbury are middle school (211 | 34.6%), high school (149 | 24.4%), and college / undergraduate (87 | 14.3%).
| School Level | # Students | % Students |
| Nursery / Preschool | 8 | 1.3% |
| Kindergarten | 45 | 7.4% |
| Elementary School | 68 | 11.2% |
| Middle School | 211 | 34.6% |
| High School | 149 | 24.4% |
| College / Undergraduate | 87 | 14.3% |
| Graduate / Professional | 42 | 6.9% |
| Total | 610 | 100.0% |
School Enrollment by Age by Funding Source in Woodbury
Out of a total of 610 students who are enrolled in schools in Woodbury, 52 (8.5%) attend a private institution, while the remaining 558 (91.5%) are enrolled in public schools. The age group of 18 to 19 year olds has the highest likelihood of being enrolled in private schools, with 12 (40.0% in the age bracket) enrolled. Conversely, the age group of 20 to 24 year olds has the lowest likelihood of being enrolled in a private school, with 25 (100.0% in the age bracket) attending a public institution.
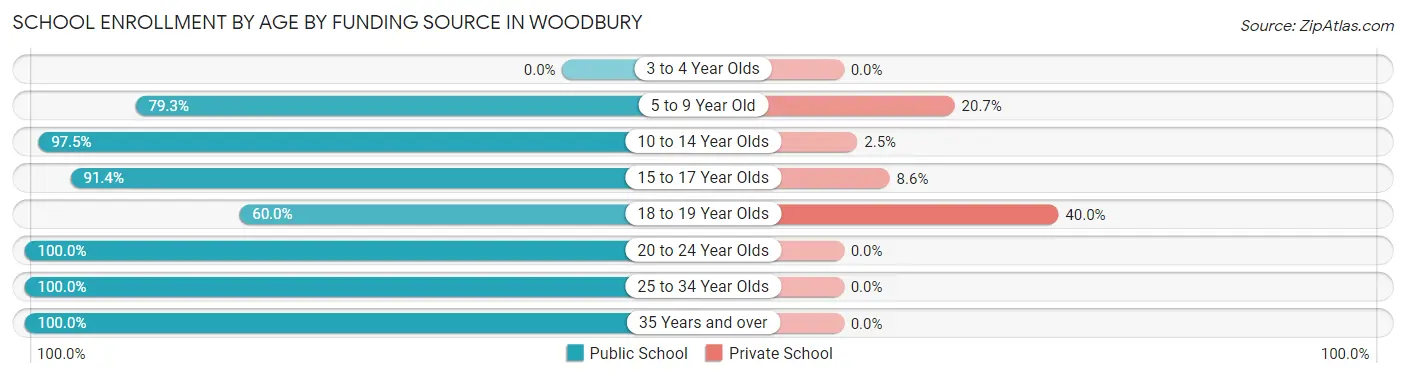
| Age Bracket | Public School | Private School |
| 3 to 4 Year Olds | 0 (0.0%) | 0 (0.0%) |
| 5 to 9 Year Old | 96 (79.3%) | 25 (20.7%) |
| 10 to 14 Year Olds | 230 (97.5%) | 6 (2.5%) |
| 15 to 17 Year Olds | 96 (91.4%) | 9 (8.6%) |
| 18 to 19 Year Olds | 18 (60.0%) | 12 (40.0%) |
| 20 to 24 Year Olds | 25 (100.0%) | 0 (0.0%) |
| 25 to 34 Year Olds | 52 (100.0%) | 0 (0.0%) |
| 35 Years and over | 41 (100.0%) | 0 (0.0%) |
| Total | 558 (91.5%) | 52 (8.5%) |
Educational Attainment by Field of Study in Woodbury
Business (65 | 23.1%), education (58 | 20.6%), science & technology (40 | 14.2%), communications (29 | 10.3%), and bio, nature & agricultural (20 | 7.1%) are the most common fields of study among 282 individuals in Woodbury who have obtained a bachelor's degree or higher.
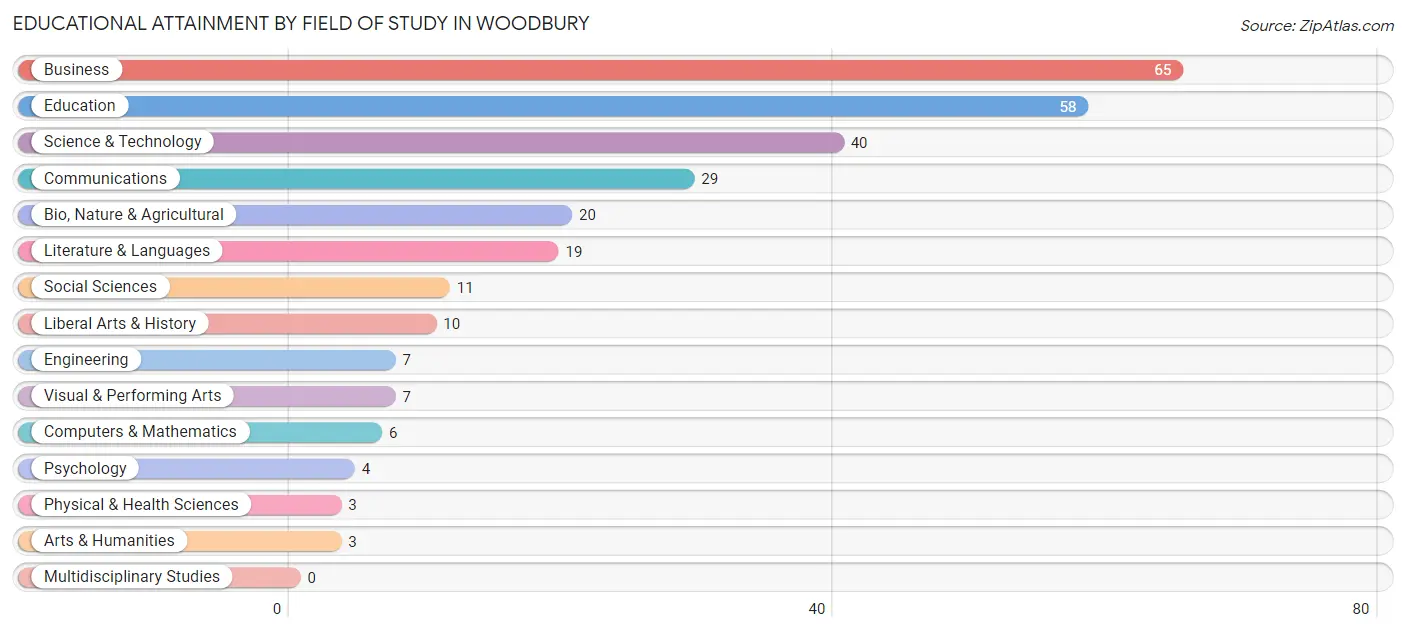
| Field of Study | # Graduates | % Graduates |
| Computers & Mathematics | 6 | 2.1% |
| Bio, Nature & Agricultural | 20 | 7.1% |
| Physical & Health Sciences | 3 | 1.1% |
| Psychology | 4 | 1.4% |
| Social Sciences | 11 | 3.9% |
| Engineering | 7 | 2.5% |
| Multidisciplinary Studies | 0 | 0.0% |
| Science & Technology | 40 | 14.2% |
| Business | 65 | 23.1% |
| Education | 58 | 20.6% |
| Literature & Languages | 19 | 6.7% |
| Liberal Arts & History | 10 | 3.5% |
| Visual & Performing Arts | 7 | 2.5% |
| Communications | 29 | 10.3% |
| Arts & Humanities | 3 | 1.1% |
| Total | 282 | 100.0% |
Transportation & Commute in Woodbury
Vehicle Availability by Sex in Woodbury
The most prevalent vehicle ownership categories in Woodbury are males with 2 vehicles (191, accounting for 32.8%) and females with 2 vehicles (285, making up 31.3%).
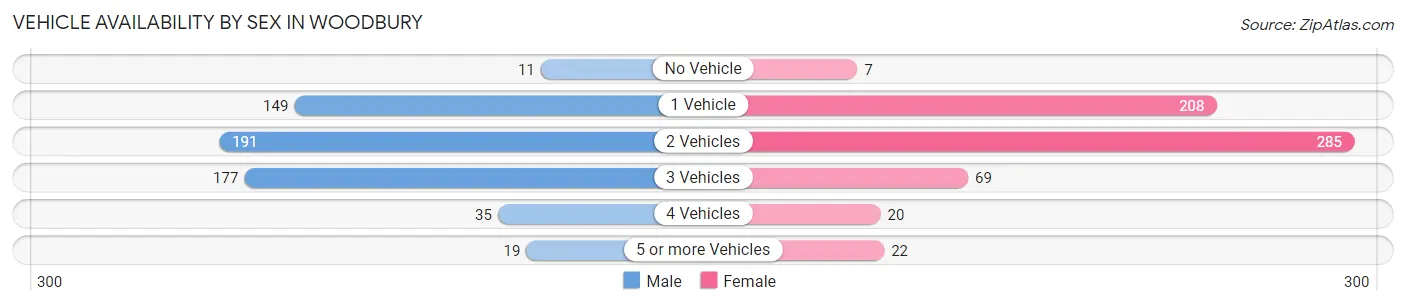
| Vehicles Available | Male | Female |
| No Vehicle | 11 (1.9%) | 7 (1.1%) |
| 1 Vehicle | 149 (25.6%) | 208 (34.0%) |
| 2 Vehicles | 191 (32.8%) | 285 (46.6%) |
| 3 Vehicles | 177 (30.4%) | 69 (11.3%) |
| 4 Vehicles | 35 (6.0%) | 20 (3.3%) |
| 5 or more Vehicles | 19 (3.3%) | 22 (3.6%) |
| Total | 582 (100.0%) | 611 (100.0%) |
Commute Time in Woodbury
The most frequently occuring commute durations in Woodbury are 30 to 34 minutes (205 commuters, 17.8%), less than 5 minutes (189 commuters, 16.4%), and 45 to 59 minutes (160 commuters, 13.9%).
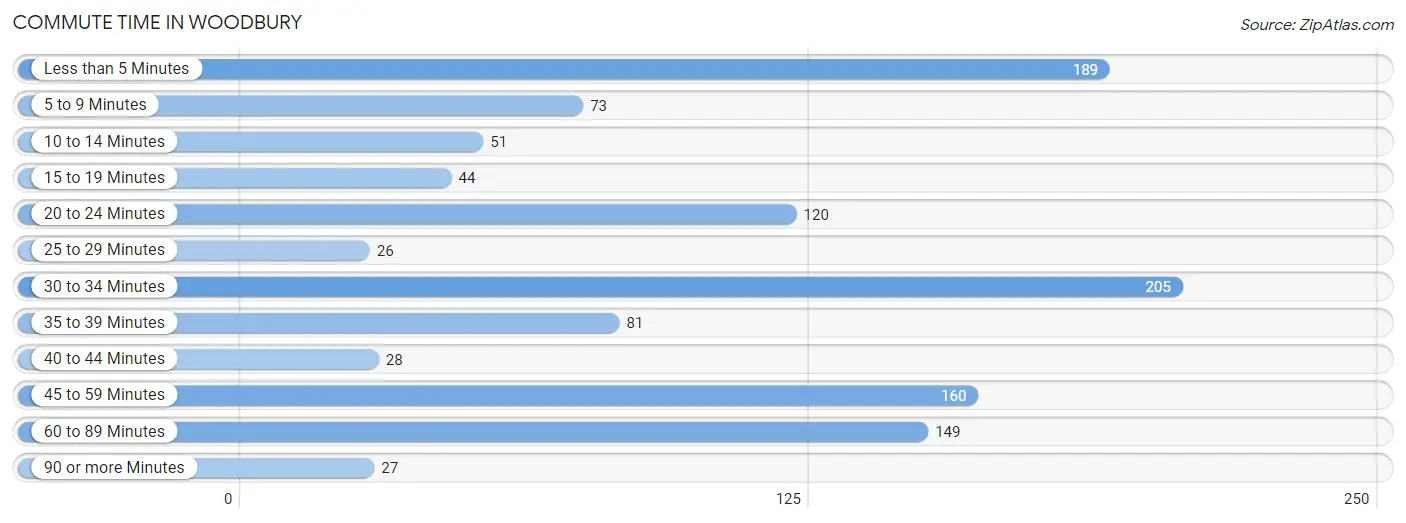
| Commute Time | # Commuters | % Commuters |
| Less than 5 Minutes | 189 | 16.4% |
| 5 to 9 Minutes | 73 | 6.3% |
| 10 to 14 Minutes | 51 | 4.4% |
| 15 to 19 Minutes | 44 | 3.8% |
| 20 to 24 Minutes | 120 | 10.4% |
| 25 to 29 Minutes | 26 | 2.2% |
| 30 to 34 Minutes | 205 | 17.8% |
| 35 to 39 Minutes | 81 | 7.0% |
| 40 to 44 Minutes | 28 | 2.4% |
| 45 to 59 Minutes | 160 | 13.9% |
| 60 to 89 Minutes | 149 | 12.9% |
| 90 or more Minutes | 27 | 2.3% |
Commute Time by Sex in Woodbury
The most common commute times in Woodbury are 30 to 34 minutes (133 commuters, 23.2%) for males and less than 5 minutes (132 commuters, 22.8%) for females.
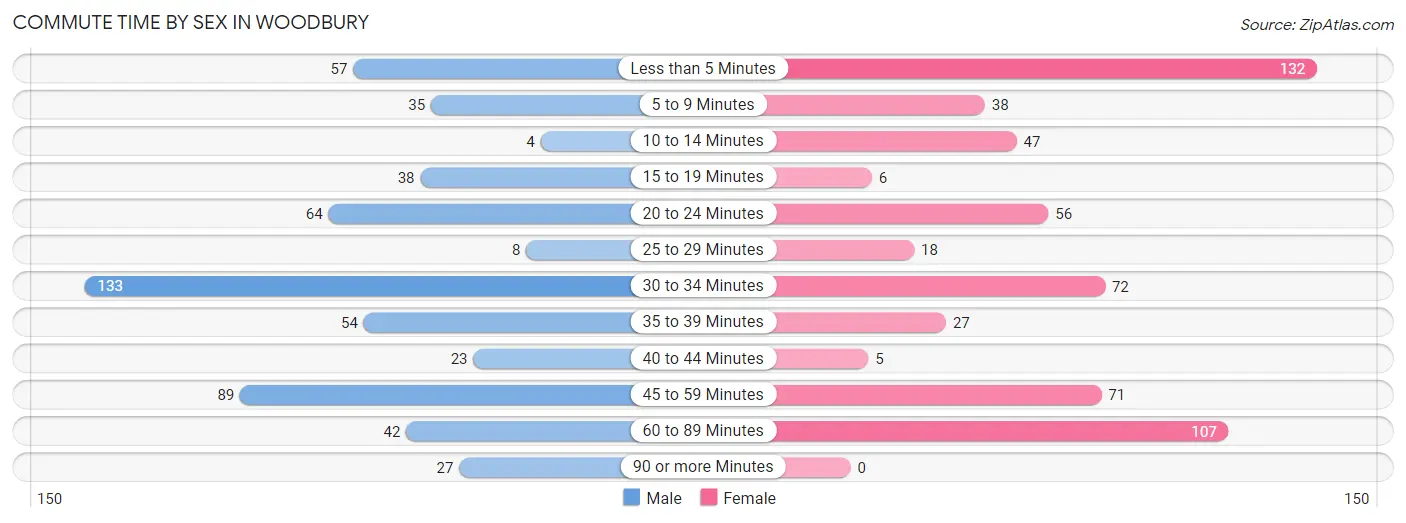
| Commute Time | Male | Female |
| Less than 5 Minutes | 57 (9.9%) | 132 (22.8%) |
| 5 to 9 Minutes | 35 (6.1%) | 38 (6.6%) |
| 10 to 14 Minutes | 4 (0.7%) | 47 (8.1%) |
| 15 to 19 Minutes | 38 (6.6%) | 6 (1.0%) |
| 20 to 24 Minutes | 64 (11.2%) | 56 (9.7%) |
| 25 to 29 Minutes | 8 (1.4%) | 18 (3.1%) |
| 30 to 34 Minutes | 133 (23.2%) | 72 (12.4%) |
| 35 to 39 Minutes | 54 (9.4%) | 27 (4.7%) |
| 40 to 44 Minutes | 23 (4.0%) | 5 (0.9%) |
| 45 to 59 Minutes | 89 (15.5%) | 71 (12.3%) |
| 60 to 89 Minutes | 42 (7.3%) | 107 (18.5%) |
| 90 or more Minutes | 27 (4.7%) | 0 (0.0%) |
Time of Departure to Work by Sex in Woodbury
The most frequent times of departure to work in Woodbury are 4:00 PM to 11:59 PM (118, 20.6%) for males and 6:30 AM to 6:59 AM (176, 30.4%) for females.
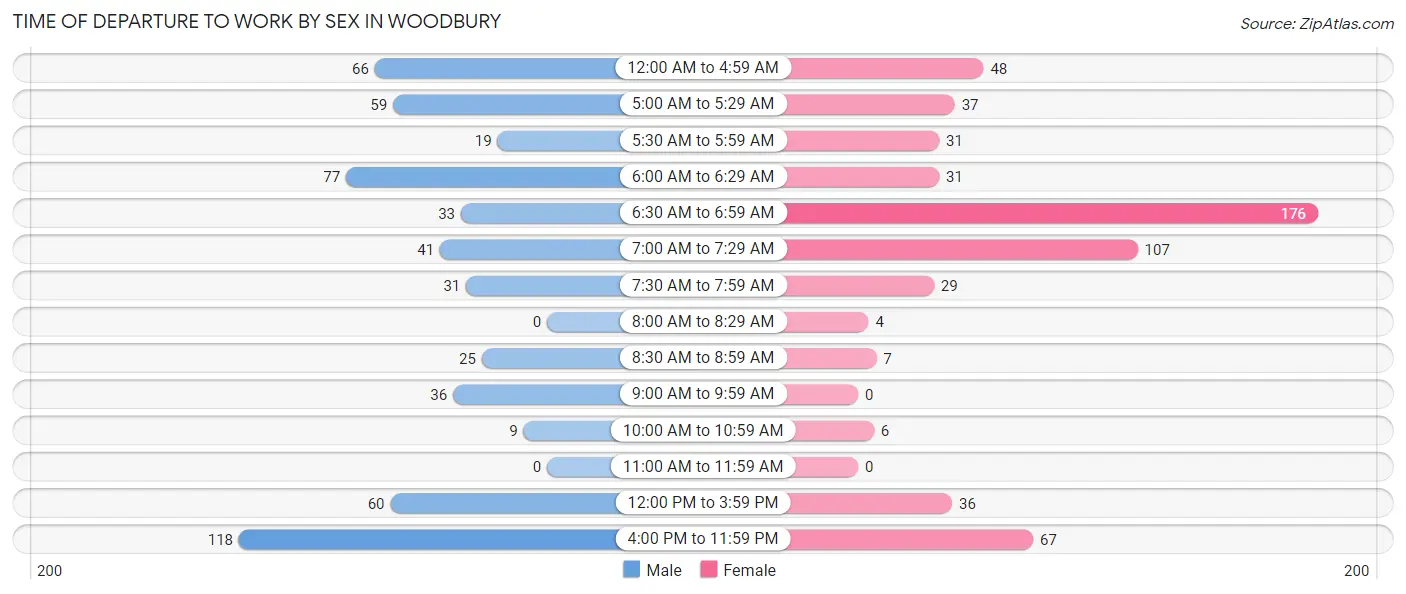
| Time of Departure | Male | Female |
| 12:00 AM to 4:59 AM | 66 (11.5%) | 48 (8.3%) |
| 5:00 AM to 5:29 AM | 59 (10.3%) | 37 (6.4%) |
| 5:30 AM to 5:59 AM | 19 (3.3%) | 31 (5.3%) |
| 6:00 AM to 6:29 AM | 77 (13.4%) | 31 (5.3%) |
| 6:30 AM to 6:59 AM | 33 (5.8%) | 176 (30.4%) |
| 7:00 AM to 7:29 AM | 41 (7.1%) | 107 (18.5%) |
| 7:30 AM to 7:59 AM | 31 (5.4%) | 29 (5.0%) |
| 8:00 AM to 8:29 AM | 0 (0.0%) | 4 (0.7%) |
| 8:30 AM to 8:59 AM | 25 (4.4%) | 7 (1.2%) |
| 9:00 AM to 9:59 AM | 36 (6.3%) | 0 (0.0%) |
| 10:00 AM to 10:59 AM | 9 (1.6%) | 6 (1.0%) |
| 11:00 AM to 11:59 AM | 0 (0.0%) | 0 (0.0%) |
| 12:00 PM to 3:59 PM | 60 (10.4%) | 36 (6.2%) |
| 4:00 PM to 11:59 PM | 118 (20.6%) | 67 (11.6%) |
| Total | 574 (100.0%) | 579 (100.0%) |
Housing Occupancy in Woodbury
Occupancy by Ownership in Woodbury
Of the total 1,007 dwellings in Woodbury, owner-occupied units account for 491 (48.8%), while renter-occupied units make up 516 (51.2%).
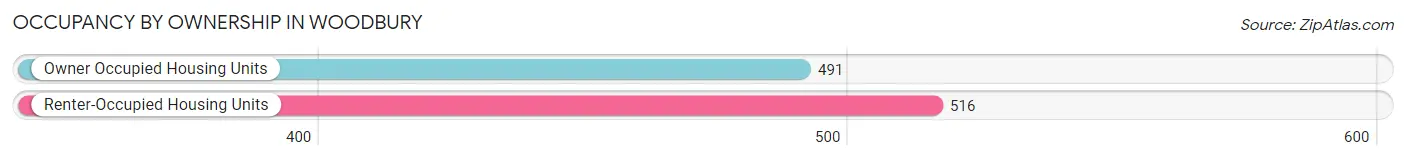
| Occupancy | # Housing Units | % Housing Units |
| Owner Occupied Housing Units | 491 | 48.8% |
| Renter-Occupied Housing Units | 516 | 51.2% |
| Total Occupied Housing Units | 1,007 | 100.0% |
Occupancy by Household Size in Woodbury
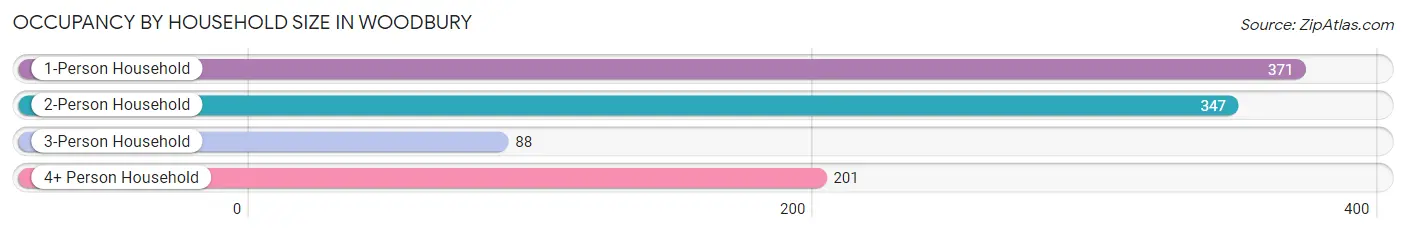
| Household Size | # Housing Units | % Housing Units |
| 1-Person Household | 371 | 36.8% |
| 2-Person Household | 347 | 34.5% |
| 3-Person Household | 88 | 8.7% |
| 4+ Person Household | 201 | 20.0% |
| Total Housing Units | 1,007 | 100.0% |
Occupancy by Ownership by Household Size in Woodbury
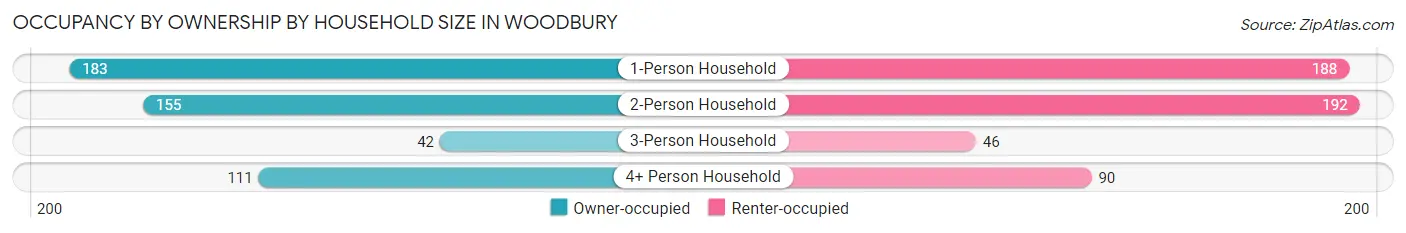
| Household Size | Owner-occupied | Renter-occupied |
| 1-Person Household | 183 (49.3%) | 188 (50.7%) |
| 2-Person Household | 155 (44.7%) | 192 (55.3%) |
| 3-Person Household | 42 (47.7%) | 46 (52.3%) |
| 4+ Person Household | 111 (55.2%) | 90 (44.8%) |
| Total Housing Units | 491 (48.8%) | 516 (51.2%) |
Occupancy by Educational Attainment in Woodbury
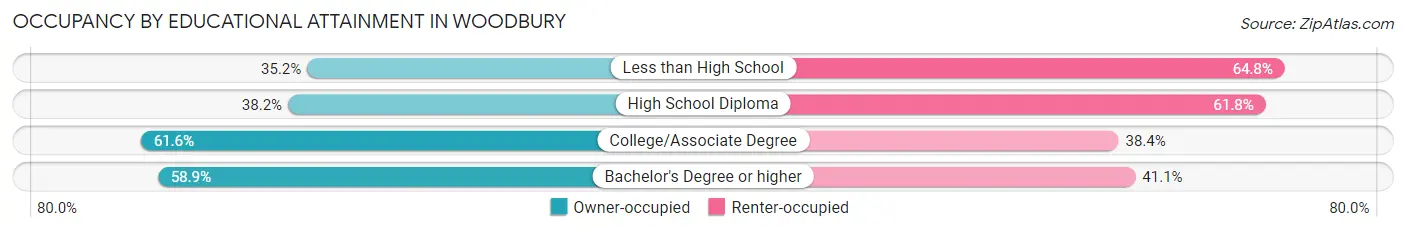
| Household Size | Owner-occupied | Renter-occupied |
| Less than High School | 38 (35.2%) | 70 (64.8%) |
| High School Diploma | 156 (38.2%) | 252 (61.8%) |
| College/Associate Degree | 181 (61.6%) | 113 (38.4%) |
| Bachelor's Degree or higher | 116 (58.9%) | 81 (41.1%) |
Occupancy by Age of Householder in Woodbury
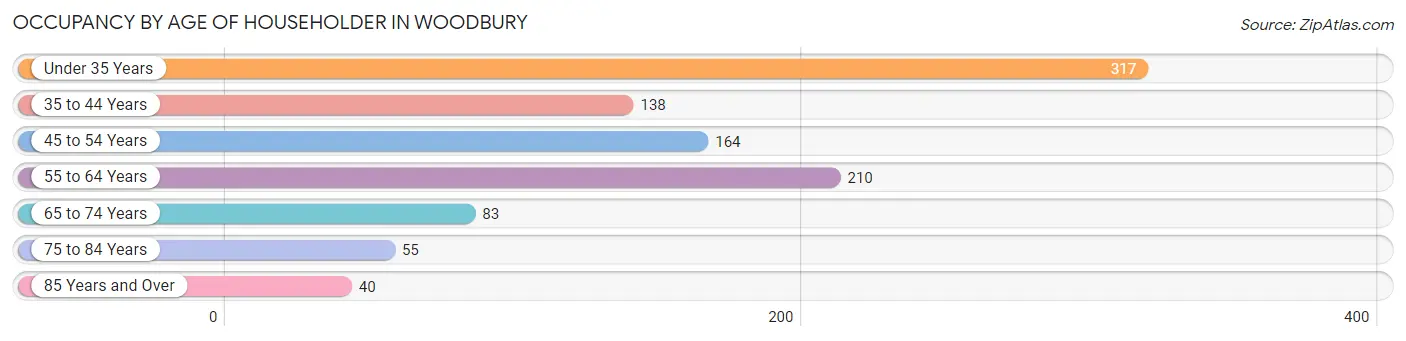
| Age Bracket | # Households | % Households |
| Under 35 Years | 317 | 31.5% |
| 35 to 44 Years | 138 | 13.7% |
| 45 to 54 Years | 164 | 16.3% |
| 55 to 64 Years | 210 | 20.8% |
| 65 to 74 Years | 83 | 8.2% |
| 75 to 84 Years | 55 | 5.5% |
| 85 Years and Over | 40 | 4.0% |
| Total | 1,007 | 100.0% |
Housing Finances in Woodbury
Median Income by Occupancy in Woodbury
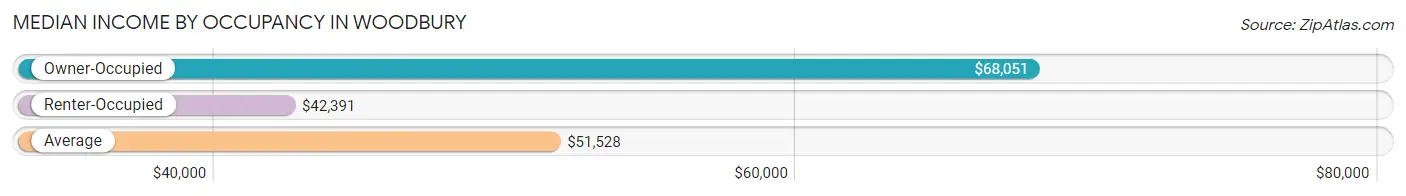
| Occupancy Type | # Households | Median Income |
| Owner-Occupied | 491 (48.8%) | $68,051 |
| Renter-Occupied | 516 (51.2%) | $42,391 |
| Average | 1,007 (100.0%) | $51,528 |
Occupancy by Householder Income Bracket in Woodbury
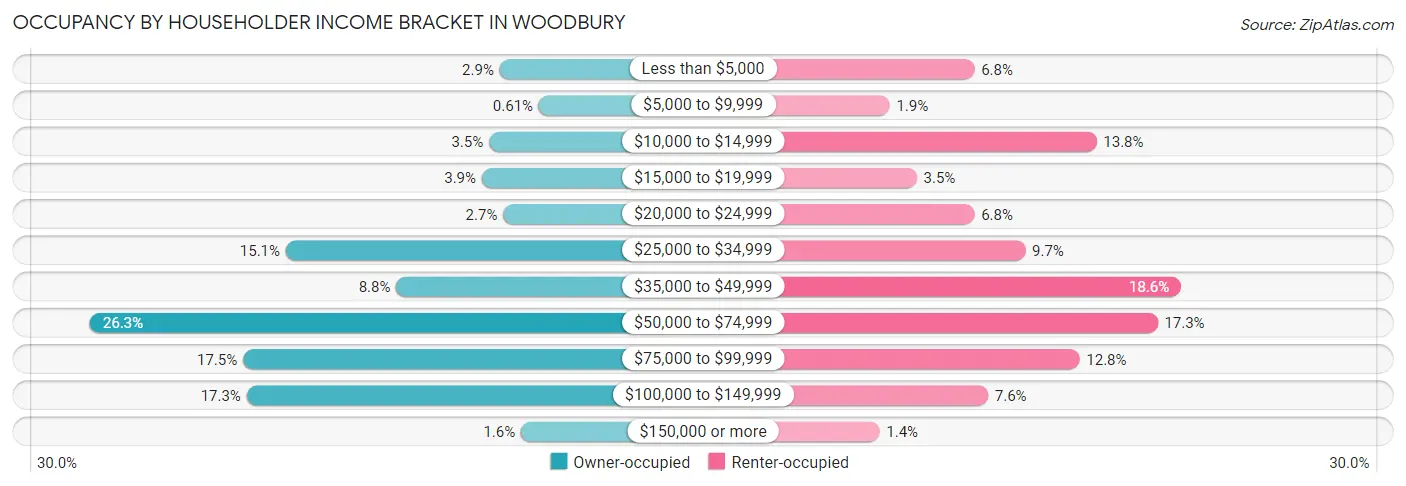
| Income Bracket | Owner-occupied | Renter-occupied |
| Less than $5,000 | 14 (2.9%) | 35 (6.8%) |
| $5,000 to $9,999 | 3 (0.6%) | 10 (1.9%) |
| $10,000 to $14,999 | 17 (3.5%) | 71 (13.8%) |
| $15,000 to $19,999 | 19 (3.9%) | 18 (3.5%) |
| $20,000 to $24,999 | 13 (2.6%) | 35 (6.8%) |
| $25,000 to $34,999 | 74 (15.1%) | 50 (9.7%) |
| $35,000 to $49,999 | 43 (8.8%) | 96 (18.6%) |
| $50,000 to $74,999 | 129 (26.3%) | 89 (17.2%) |
| $75,000 to $99,999 | 86 (17.5%) | 66 (12.8%) |
| $100,000 to $149,999 | 85 (17.3%) | 39 (7.6%) |
| $150,000 or more | 8 (1.6%) | 7 (1.4%) |
| Total | 491 (100.0%) | 516 (100.0%) |
Monthly Housing Cost Tiers in Woodbury
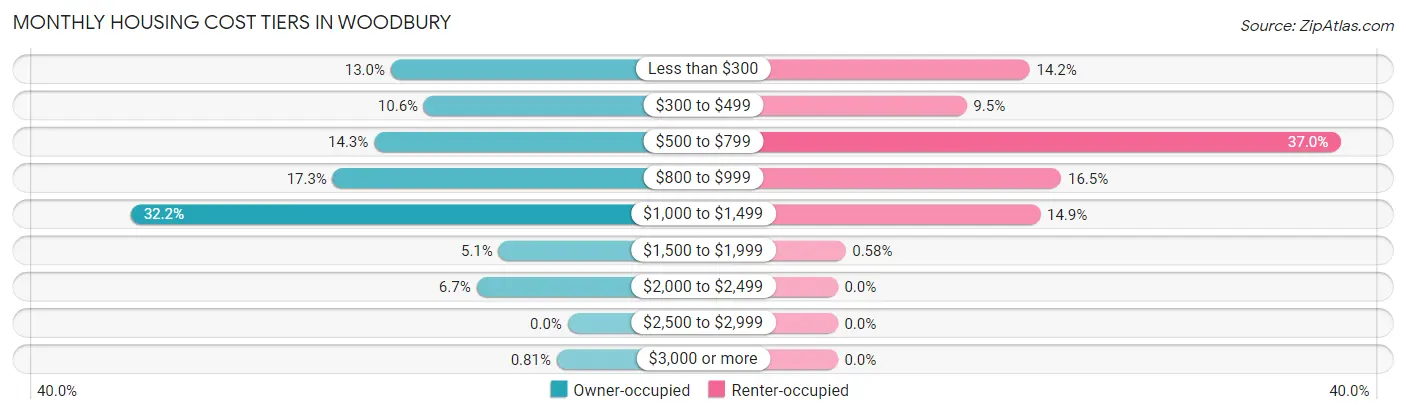
| Monthly Cost | Owner-occupied | Renter-occupied |
| Less than $300 | 64 (13.0%) | 73 (14.1%) |
| $300 to $499 | 52 (10.6%) | 49 (9.5%) |
| $500 to $799 | 70 (14.3%) | 191 (37.0%) |
| $800 to $999 | 85 (17.3%) | 85 (16.5%) |
| $1,000 to $1,499 | 158 (32.2%) | 77 (14.9%) |
| $1,500 to $1,999 | 25 (5.1%) | 3 (0.6%) |
| $2,000 to $2,499 | 33 (6.7%) | 0 (0.0%) |
| $2,500 to $2,999 | 0 (0.0%) | 0 (0.0%) |
| $3,000 or more | 4 (0.8%) | 0 (0.0%) |
| Total | 491 (100.0%) | 516 (100.0%) |
Physical Housing Characteristics in Woodbury
Housing Structures in Woodbury
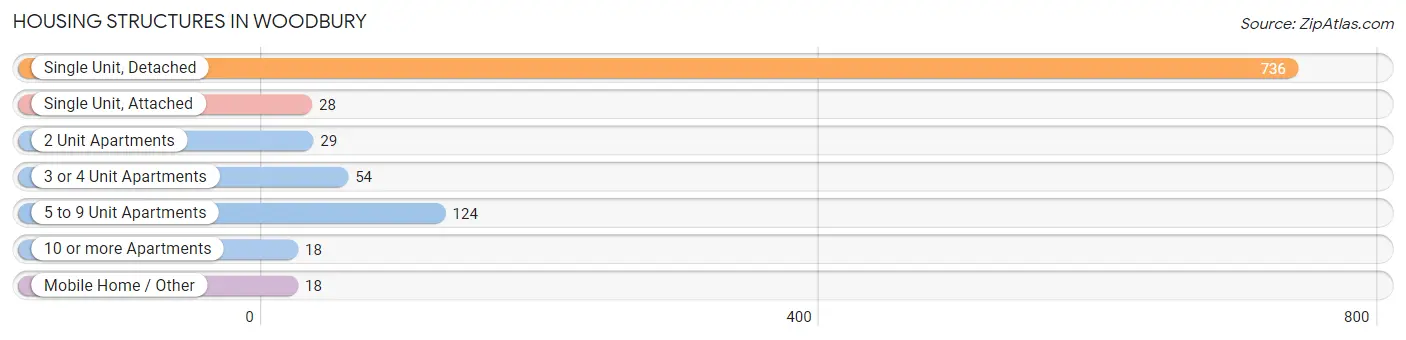
| Structure Type | # Housing Units | % Housing Units |
| Single Unit, Detached | 736 | 73.1% |
| Single Unit, Attached | 28 | 2.8% |
| 2 Unit Apartments | 29 | 2.9% |
| 3 or 4 Unit Apartments | 54 | 5.4% |
| 5 to 9 Unit Apartments | 124 | 12.3% |
| 10 or more Apartments | 18 | 1.8% |
| Mobile Home / Other | 18 | 1.8% |
| Total | 1,007 | 100.0% |
Housing Structures by Occupancy in Woodbury
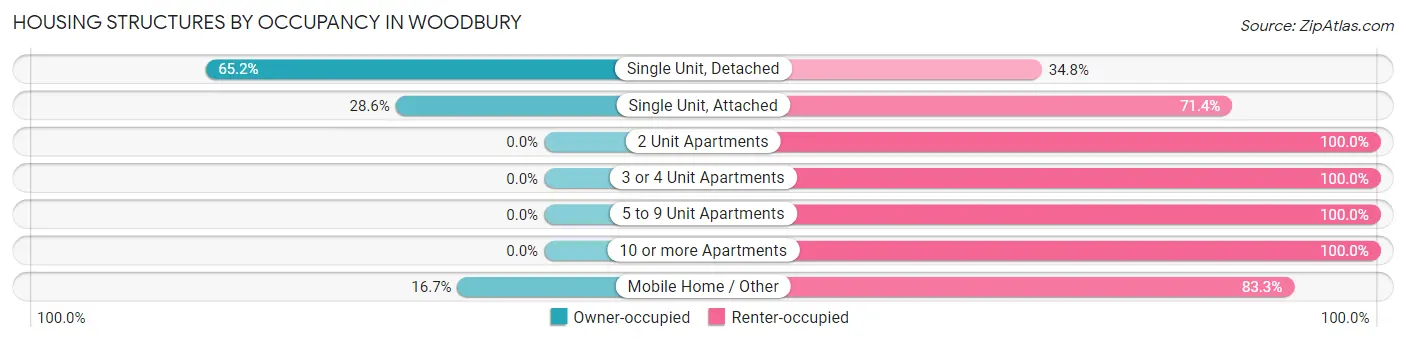
| Structure Type | Owner-occupied | Renter-occupied |
| Single Unit, Detached | 480 (65.2%) | 256 (34.8%) |
| Single Unit, Attached | 8 (28.6%) | 20 (71.4%) |
| 2 Unit Apartments | 0 (0.0%) | 29 (100.0%) |
| 3 or 4 Unit Apartments | 0 (0.0%) | 54 (100.0%) |
| 5 to 9 Unit Apartments | 0 (0.0%) | 124 (100.0%) |
| 10 or more Apartments | 0 (0.0%) | 18 (100.0%) |
| Mobile Home / Other | 3 (16.7%) | 15 (83.3%) |
| Total | 491 (48.8%) | 516 (51.2%) |
Housing Structures by Number of Rooms in Woodbury
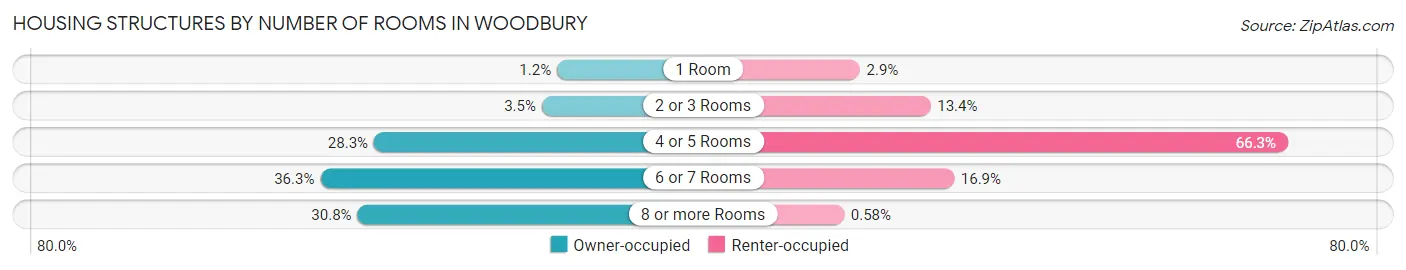
| Number of Rooms | Owner-occupied | Renter-occupied |
| 1 Room | 6 (1.2%) | 15 (2.9%) |
| 2 or 3 Rooms | 17 (3.5%) | 69 (13.4%) |
| 4 or 5 Rooms | 139 (28.3%) | 342 (66.3%) |
| 6 or 7 Rooms | 178 (36.2%) | 87 (16.9%) |
| 8 or more Rooms | 151 (30.7%) | 3 (0.6%) |
| Total | 491 (100.0%) | 516 (100.0%) |
Housing Structure by Heating Type in Woodbury
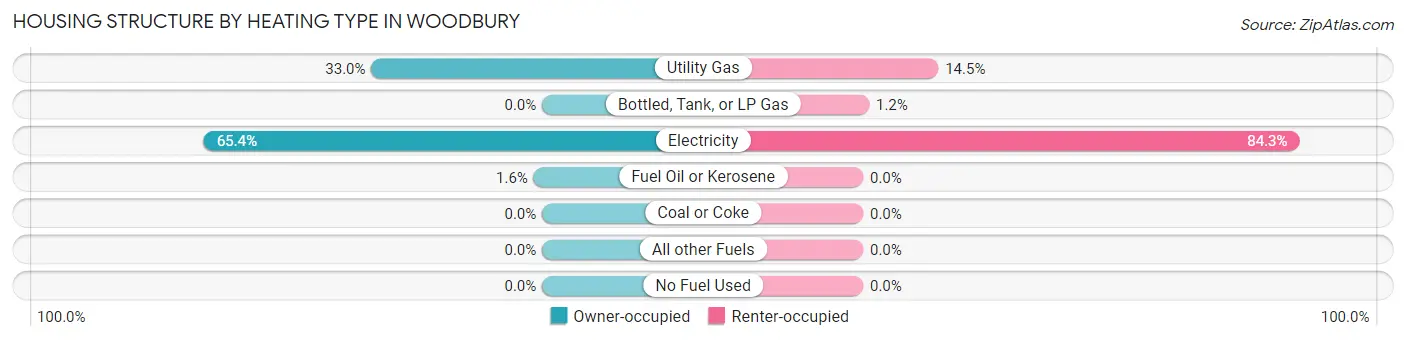
| Heating Type | Owner-occupied | Renter-occupied |
| Utility Gas | 162 (33.0%) | 75 (14.5%) |
| Bottled, Tank, or LP Gas | 0 (0.0%) | 6 (1.2%) |
| Electricity | 321 (65.4%) | 435 (84.3%) |
| Fuel Oil or Kerosene | 8 (1.6%) | 0 (0.0%) |
| Coal or Coke | 0 (0.0%) | 0 (0.0%) |
| All other Fuels | 0 (0.0%) | 0 (0.0%) |
| No Fuel Used | 0 (0.0%) | 0 (0.0%) |
| Total | 491 (100.0%) | 516 (100.0%) |
Household Vehicle Usage in Woodbury
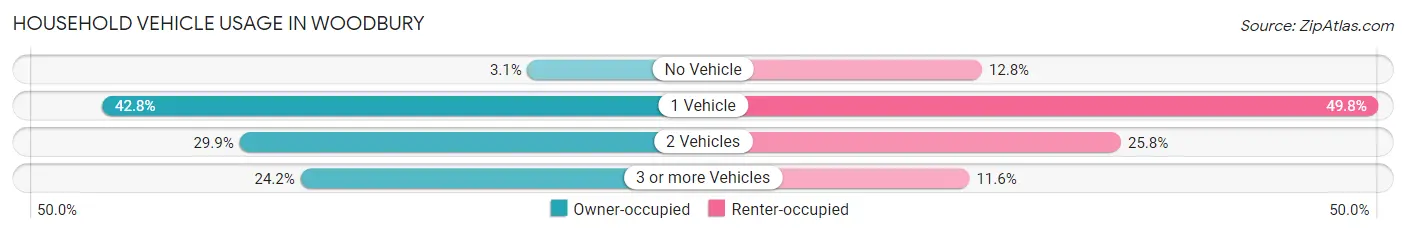
| Vehicles per Household | Owner-occupied | Renter-occupied |
| No Vehicle | 15 (3.0%) | 66 (12.8%) |
| 1 Vehicle | 210 (42.8%) | 257 (49.8%) |
| 2 Vehicles | 147 (29.9%) | 133 (25.8%) |
| 3 or more Vehicles | 119 (24.2%) | 60 (11.6%) |
| Total | 491 (100.0%) | 516 (100.0%) |
Real Estate & Mortgages in Woodbury
Real Estate and Mortgage Overview in Woodbury
| Characteristic | Without Mortgage | With Mortgage |
| Housing Units | 184 | 307 |
| Median Property Value | $123,800 | $179,000 |
| Median Household Income | $36,500 | $4 |
| Monthly Housing Costs | $432 | $0 |
| Real Estate Taxes | $1,153 | $0 |
Property Value by Mortgage Status in Woodbury
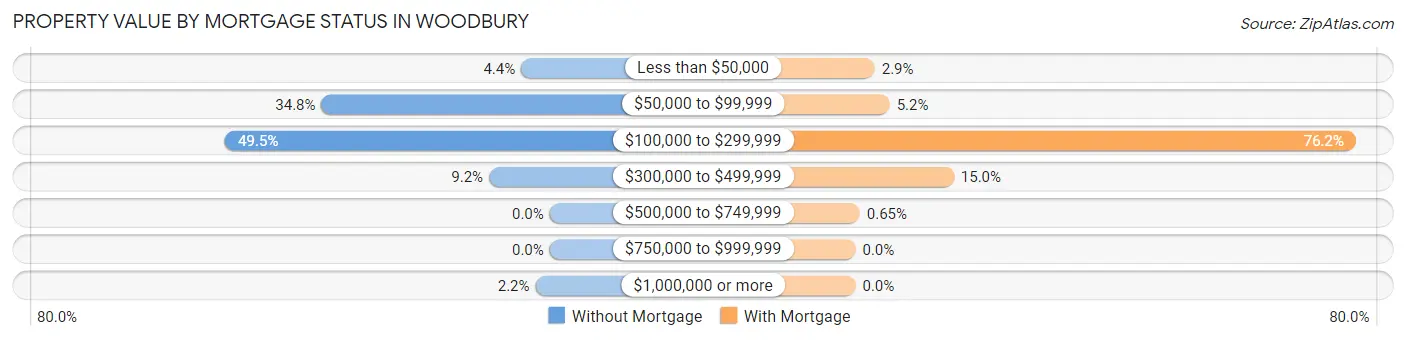
| Property Value | Without Mortgage | With Mortgage |
| Less than $50,000 | 8 (4.3%) | 9 (2.9%) |
| $50,000 to $99,999 | 64 (34.8%) | 16 (5.2%) |
| $100,000 to $299,999 | 91 (49.5%) | 234 (76.2%) |
| $300,000 to $499,999 | 17 (9.2%) | 46 (15.0%) |
| $500,000 to $749,999 | 0 (0.0%) | 2 (0.6%) |
| $750,000 to $999,999 | 0 (0.0%) | 0 (0.0%) |
| $1,000,000 or more | 4 (2.2%) | 0 (0.0%) |
| Total | 184 (100.0%) | 307 (100.0%) |
Household Income by Mortgage Status in Woodbury
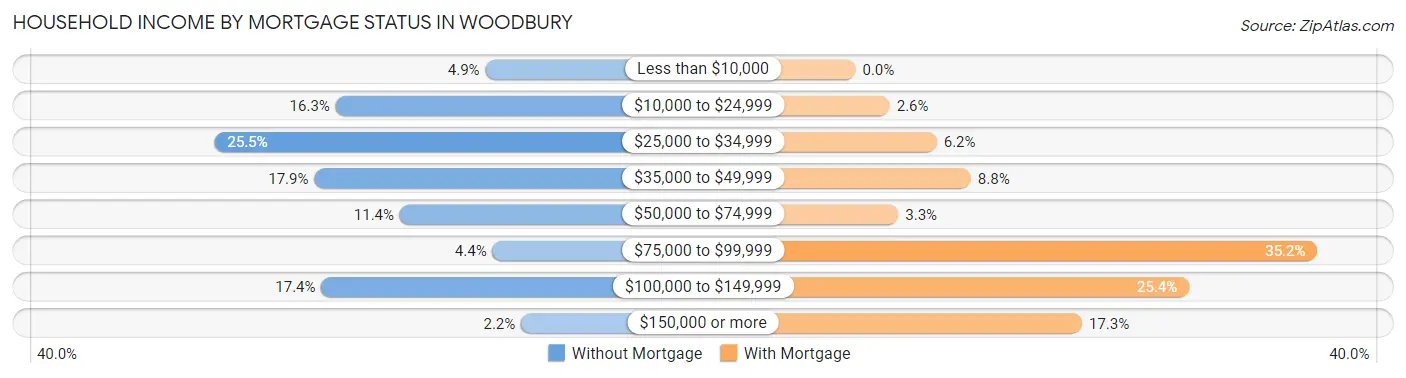
| Household Income | Without Mortgage | With Mortgage |
| Less than $10,000 | 9 (4.9%) | 0 (0.0%) |
| $10,000 to $24,999 | 30 (16.3%) | 8 (2.6%) |
| $25,000 to $34,999 | 47 (25.5%) | 19 (6.2%) |
| $35,000 to $49,999 | 33 (17.9%) | 27 (8.8%) |
| $50,000 to $74,999 | 21 (11.4%) | 10 (3.3%) |
| $75,000 to $99,999 | 8 (4.3%) | 108 (35.2%) |
| $100,000 to $149,999 | 32 (17.4%) | 78 (25.4%) |
| $150,000 or more | 4 (2.2%) | 53 (17.3%) |
| Total | 184 (100.0%) | 307 (100.0%) |
Property Value to Household Income Ratio in Woodbury
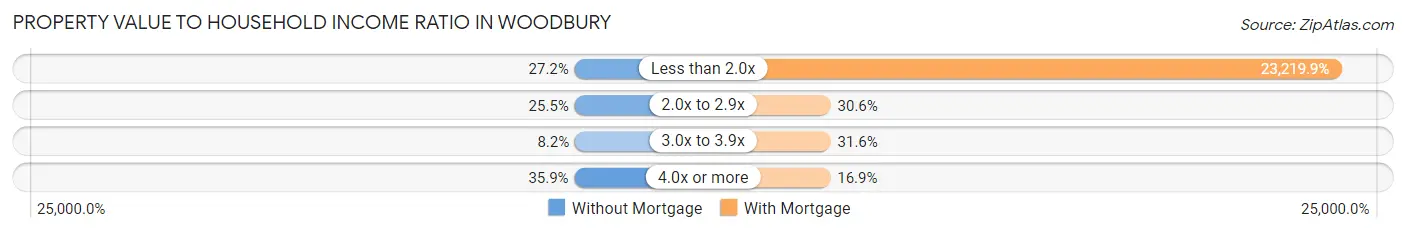
| Value-to-Income Ratio | Without Mortgage | With Mortgage |
| Less than 2.0x | 50 (27.2%) | 71,285 (23,219.9%) |
| 2.0x to 2.9x | 47 (25.5%) | 94 (30.6%) |
| 3.0x to 3.9x | 15 (8.2%) | 97 (31.6%) |
| 4.0x or more | 66 (35.9%) | 52 (16.9%) |
| Total | 184 (100.0%) | 307 (100.0%) |
Real Estate Taxes by Mortgage Status in Woodbury
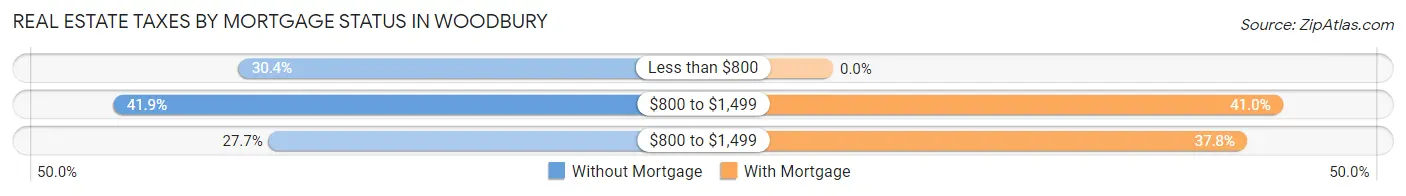
| Property Taxes | Without Mortgage | With Mortgage |
| Less than $800 | 56 (30.4%) | 0 (0.0%) |
| $800 to $1,499 | 77 (41.8%) | 126 (41.0%) |
| $800 to $1,499 | 51 (27.7%) | 116 (37.8%) |
| Total | 184 (100.0%) | 307 (100.0%) |
Health & Disability in Woodbury
Health Insurance Coverage by Age in Woodbury
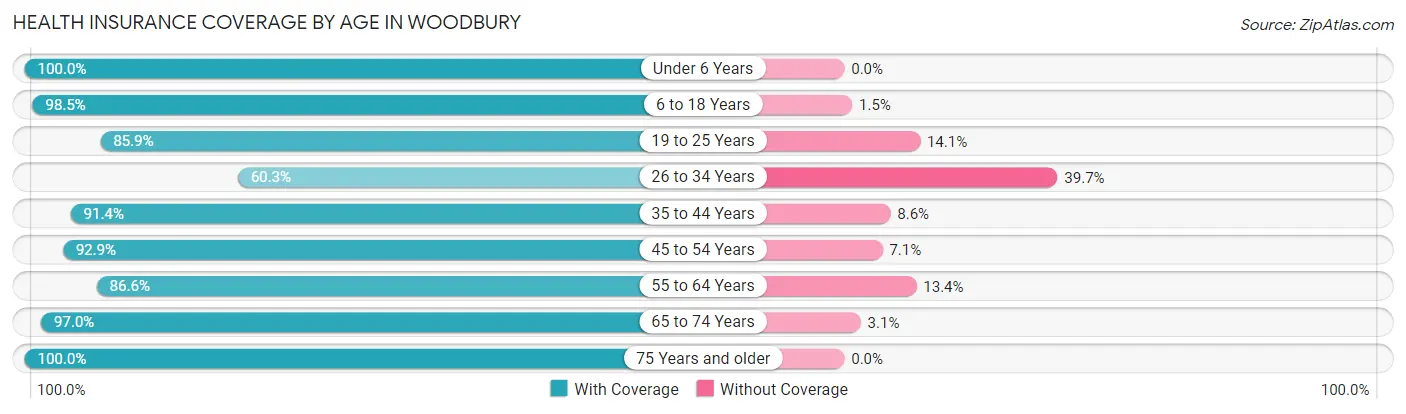
| Age Bracket | With Coverage | Without Coverage |
| Under 6 Years | 209 (100.0%) | 0 (0.0%) |
| 6 to 18 Years | 471 (98.5%) | 7 (1.5%) |
| 19 to 25 Years | 213 (85.9%) | 35 (14.1%) |
| 26 to 34 Years | 229 (60.3%) | 151 (39.7%) |
| 35 to 44 Years | 500 (91.4%) | 47 (8.6%) |
| 45 to 54 Years | 209 (92.9%) | 16 (7.1%) |
| 55 to 64 Years | 219 (86.6%) | 34 (13.4%) |
| 65 to 74 Years | 127 (97.0%) | 4 (3.0%) |
| 75 Years and older | 102 (100.0%) | 0 (0.0%) |
| Total | 2,279 (88.6%) | 294 (11.4%) |
Health Insurance Coverage by Citizenship Status in Woodbury
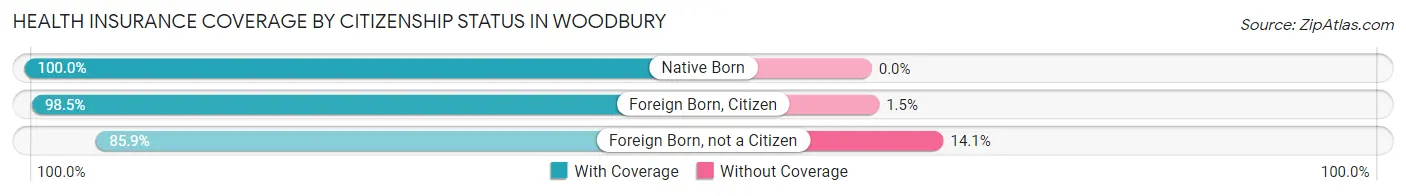
| Citizenship Status | With Coverage | Without Coverage |
| Native Born | 209 (100.0%) | 0 (0.0%) |
| Foreign Born, Citizen | 471 (98.5%) | 7 (1.5%) |
| Foreign Born, not a Citizen | 213 (85.9%) | 35 (14.1%) |
Health Insurance Coverage by Household Income in Woodbury
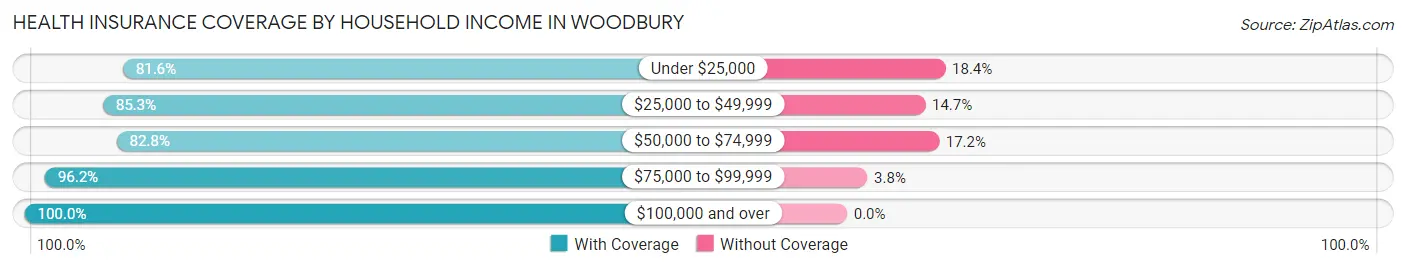
| Household Income | With Coverage | Without Coverage |
| Under $25,000 | 341 (81.6%) | 77 (18.4%) |
| $25,000 to $49,999 | 489 (85.3%) | 84 (14.7%) |
| $50,000 to $74,999 | 514 (82.8%) | 107 (17.2%) |
| $75,000 to $99,999 | 656 (96.2%) | 26 (3.8%) |
| $100,000 and over | 279 (100.0%) | 0 (0.0%) |
Public vs Private Health Insurance Coverage by Age in Woodbury
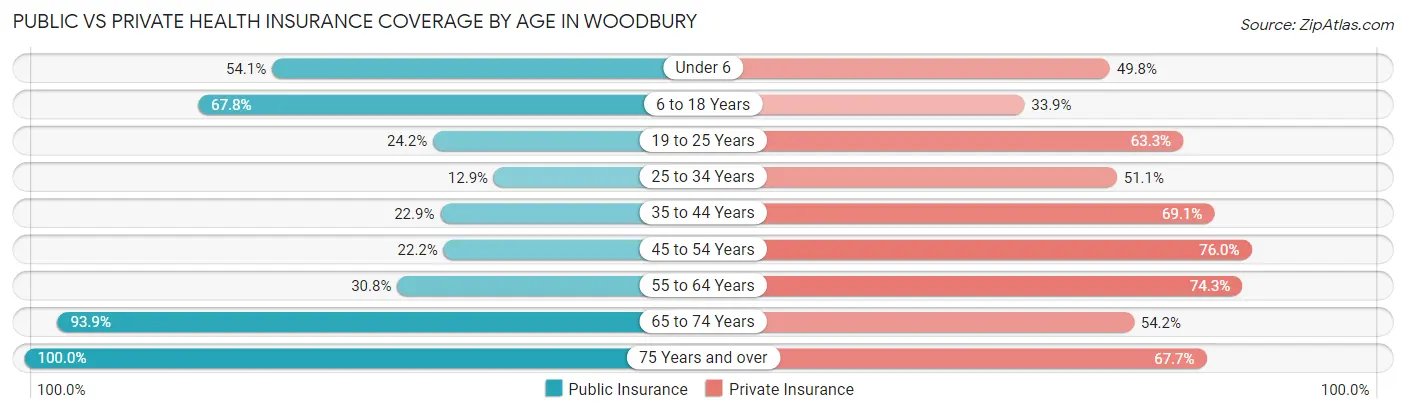
| Age Bracket | Public Insurance | Private Insurance |
| Under 6 | 113 (54.1%) | 104 (49.8%) |
| 6 to 18 Years | 324 (67.8%) | 162 (33.9%) |
| 19 to 25 Years | 60 (24.2%) | 157 (63.3%) |
| 25 to 34 Years | 49 (12.9%) | 194 (51.0%) |
| 35 to 44 Years | 125 (22.9%) | 378 (69.1%) |
| 45 to 54 Years | 50 (22.2%) | 171 (76.0%) |
| 55 to 64 Years | 78 (30.8%) | 188 (74.3%) |
| 65 to 74 Years | 123 (93.9%) | 71 (54.2%) |
| 75 Years and over | 102 (100.0%) | 69 (67.6%) |
| Total | 1,024 (39.8%) | 1,494 (58.1%) |
Disability Status by Sex by Age in Woodbury
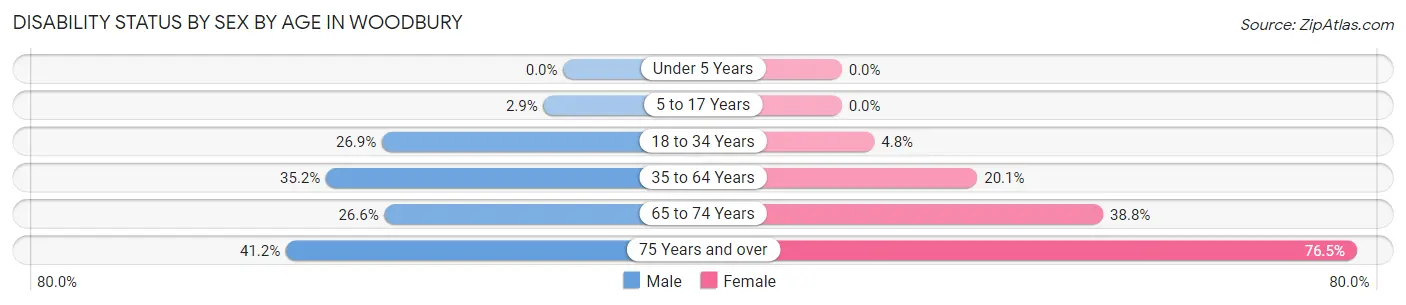
| Age Bracket | Male | Female |
| Under 5 Years | 0 (0.0%) | 0 (0.0%) |
| 5 to 17 Years | 9 (2.9%) | 0 (0.0%) |
| 18 to 34 Years | 98 (26.9%) | 14 (4.8%) |
| 35 to 64 Years | 186 (35.2%) | 100 (20.1%) |
| 65 to 74 Years | 17 (26.6%) | 26 (38.8%) |
| 75 Years and over | 14 (41.2%) | 52 (76.5%) |
Disability Class by Sex by Age in Woodbury
Disability Class: Hearing Difficulty
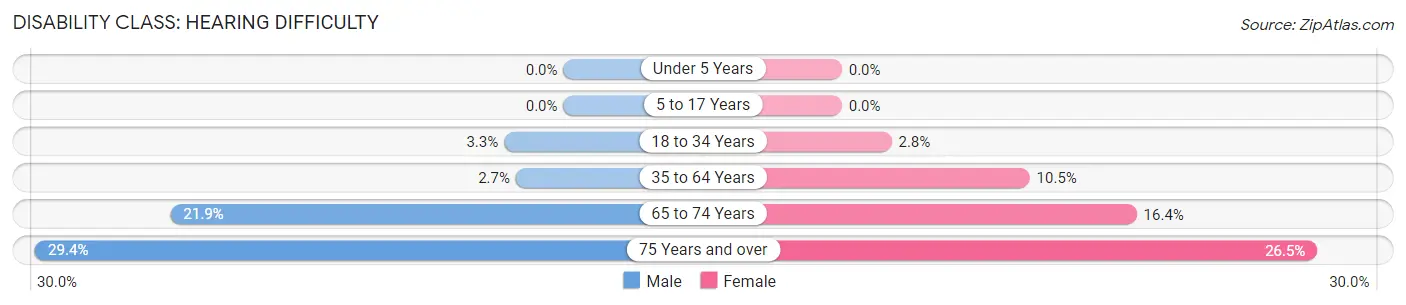
| Age Bracket | Male | Female |
| Under 5 Years | 0 (0.0%) | 0 (0.0%) |
| 5 to 17 Years | 0 (0.0%) | 0 (0.0%) |
| 18 to 34 Years | 12 (3.3%) | 8 (2.8%) |
| 35 to 64 Years | 14 (2.6%) | 52 (10.5%) |
| 65 to 74 Years | 14 (21.9%) | 11 (16.4%) |
| 75 Years and over | 10 (29.4%) | 18 (26.5%) |
Disability Class: Vision Difficulty
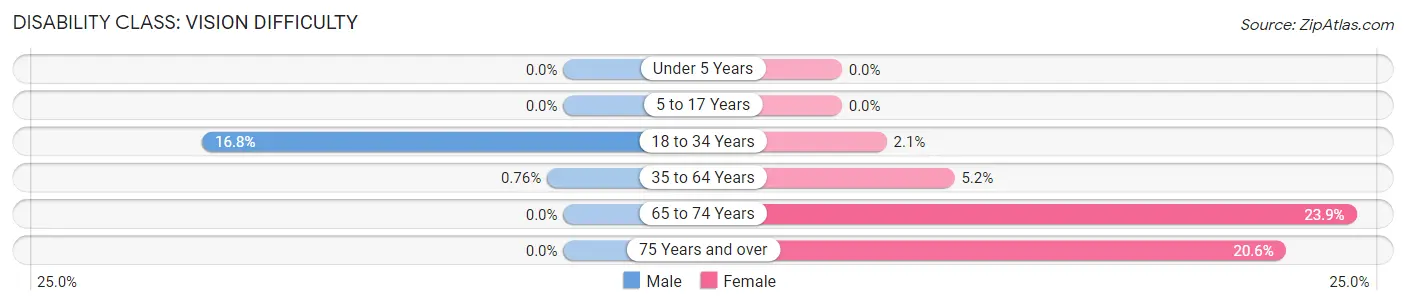
| Age Bracket | Male | Female |
| Under 5 Years | 0 (0.0%) | 0 (0.0%) |
| 5 to 17 Years | 0 (0.0%) | 0 (0.0%) |
| 18 to 34 Years | 61 (16.8%) | 6 (2.1%) |
| 35 to 64 Years | 4 (0.8%) | 26 (5.2%) |
| 65 to 74 Years | 0 (0.0%) | 16 (23.9%) |
| 75 Years and over | 0 (0.0%) | 14 (20.6%) |
Disability Class: Cognitive Difficulty
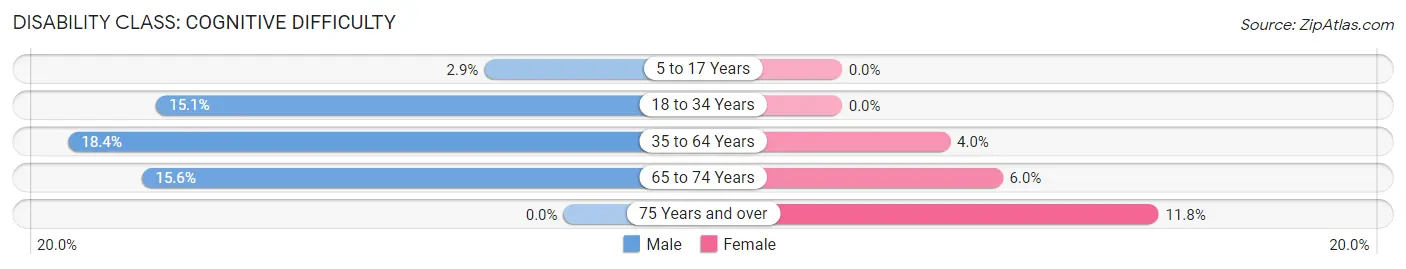
| Age Bracket | Male | Female |
| 5 to 17 Years | 9 (2.9%) | 0 (0.0%) |
| 18 to 34 Years | 55 (15.1%) | 0 (0.0%) |
| 35 to 64 Years | 97 (18.4%) | 20 (4.0%) |
| 65 to 74 Years | 10 (15.6%) | 4 (6.0%) |
| 75 Years and over | 0 (0.0%) | 8 (11.8%) |
Disability Class: Ambulatory Difficulty
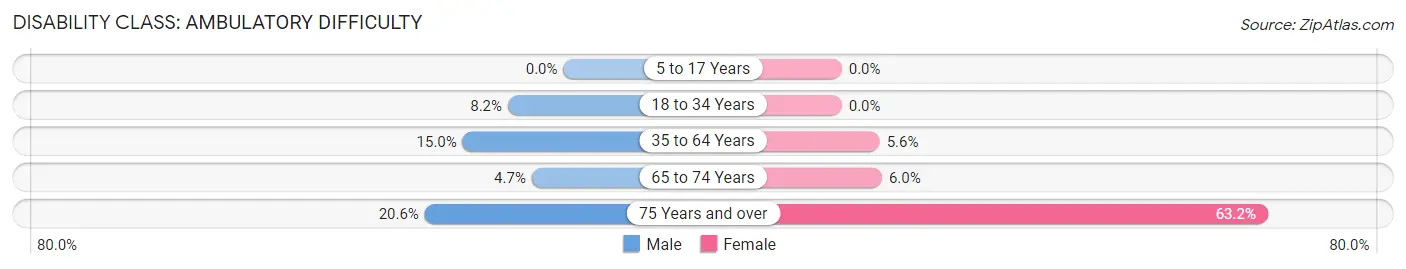
| Age Bracket | Male | Female |
| 5 to 17 Years | 0 (0.0%) | 0 (0.0%) |
| 18 to 34 Years | 30 (8.2%) | 0 (0.0%) |
| 35 to 64 Years | 79 (15.0%) | 28 (5.6%) |
| 65 to 74 Years | 3 (4.7%) | 4 (6.0%) |
| 75 Years and over | 7 (20.6%) | 43 (63.2%) |
Disability Class: Self-Care Difficulty
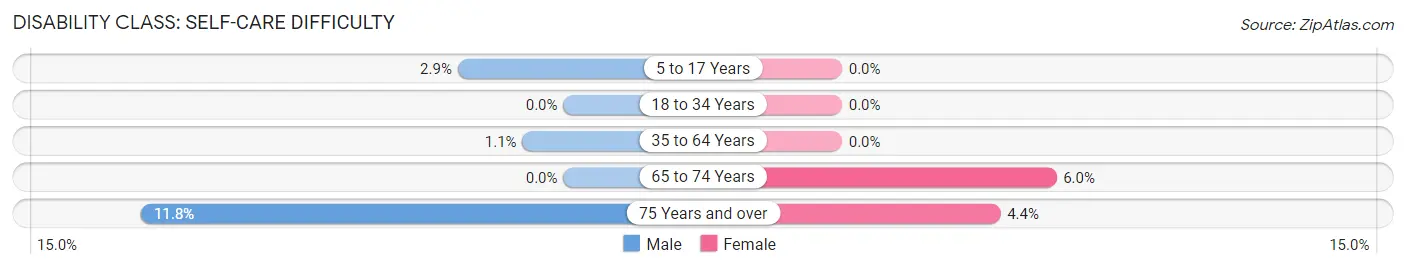
| Age Bracket | Male | Female |
| 5 to 17 Years | 9 (2.9%) | 0 (0.0%) |
| 18 to 34 Years | 0 (0.0%) | 0 (0.0%) |
| 35 to 64 Years | 6 (1.1%) | 0 (0.0%) |
| 65 to 74 Years | 0 (0.0%) | 4 (6.0%) |
| 75 Years and over | 4 (11.8%) | 3 (4.4%) |
Technology Access in Woodbury
Computing Device Access in Woodbury
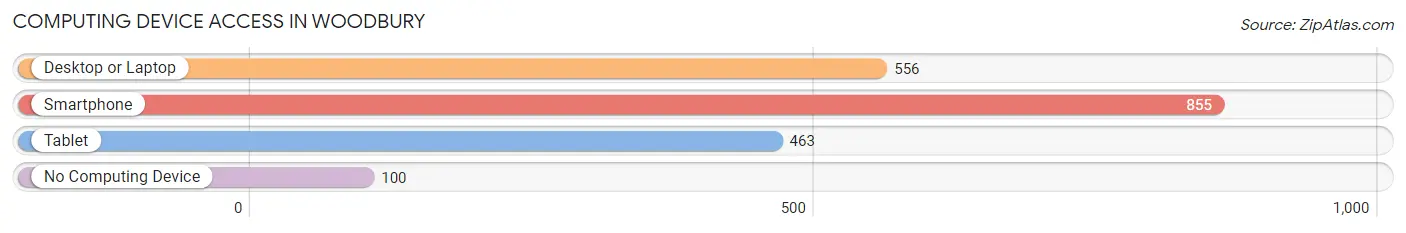
| Device Type | # Households | % Households |
| Desktop or Laptop | 556 | 55.2% |
| Smartphone | 855 | 84.9% |
| Tablet | 463 | 46.0% |
| No Computing Device | 100 | 9.9% |
| Total | 1,007 | 100.0% |
Internet Access in Woodbury
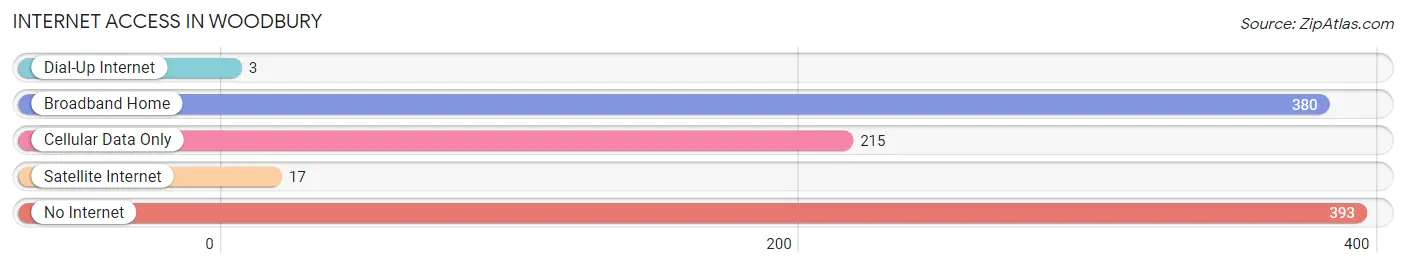
| Internet Type | # Households | % Households |
| Dial-Up Internet | 3 | 0.3% |
| Broadband Home | 380 | 37.7% |
| Cellular Data Only | 215 | 21.3% |
| Satellite Internet | 17 | 1.7% |
| No Internet | 393 | 39.0% |
| Total | 1,007 | 100.0% |
Woodbury Summary
Woodbury, Tennessee is a small town located in Cannon County, Tennessee. It is situated in the foothills of the Cumberland Plateau, approximately 40 miles southeast of Nashville. The town was founded in 1836 and has a population of approximately 2,000 people.
Geography
Woodbury is located in the foothills of the Cumberland Plateau, approximately 40 miles southeast of Nashville. The town is situated in a valley surrounded by hills and mountains. The town is located on the banks of the East Fork of the Stones River. The town is also located near the Stones River National Battlefield, which is a popular tourist destination.
The climate in Woodbury is humid subtropical, with hot summers and mild winters. The average annual temperature is around 60 degrees Fahrenheit. The average annual precipitation is around 45 inches.
Economy
Woodbury’s economy is largely based on agriculture and tourism. The town is home to several farms, which produce a variety of crops, including corn, soybeans, wheat, and hay. The town is also home to several tourist attractions, including the Stones River National Battlefield, the Woodbury Wildlife Management Area, and the Woodbury Wildlife Refuge.
The town is also home to several small businesses, including restaurants, retail stores, and service providers. The town is also home to several manufacturing companies, including a furniture factory and a woodworking shop.
Demographics
As of the 2010 census, the population of Woodbury was 2,037. The racial makeup of the town was 97.3% White, 0.7% African American, 0.3% Native American, 0.2% Asian, 0.1% Pacific Islander, 0.7% from other races, and 0.9% from two or more races. Hispanic or Latino of any race were 1.3% of the population.
The median income for a household in Woodbury was $35,938, and the median income for a family was $41,250. The per capita income for the town was $17,845. About 11.2% of families and 14.2% of the population were below the poverty line, including 18.2% of those under age 18 and 11.2% of those age 65 or over.
Conclusion
Woodbury, Tennessee is a small town located in Cannon County, Tennessee. It is situated in the foothills of the Cumberland Plateau, approximately 40 miles southeast of Nashville. The town was founded in 1836 and has a population of approximately 2,000 people. The town’s economy is largely based on agriculture and tourism, and the town is home to several small businesses, manufacturing companies, and tourist attractions. The population of Woodbury is predominantly white, with a small percentage of African American, Native American, Asian, and Pacific Islander residents. The median income for a household in Woodbury is $35,938, and the per capita income for the town is $17,845.
Common Questions
What is Per Capita Income in Woodbury?
Per Capita income in Woodbury is $26,783.
What is the Median Family Income in Woodbury?
Median Family Income in Woodbury is $48,229.
What is the Median Household income in Woodbury?
Median Household Income in Woodbury is $51,528.
What is Income or Wage Gap in Woodbury?
Income or Wage Gap in Woodbury is 8.9%.
Women in Woodbury earn 91.1 cents for every dollar earned by a man.
What is Inequality or Gini Index in Woodbury?
Inequality or Gini Index in Woodbury is 0.44.
What is the Total Population of Woodbury?
Total Population of Woodbury is 2,704.
What is the Total Male Population of Woodbury?
Total Male Population of Woodbury is 1,480.
What is the Total Female Population of Woodbury?
Total Female Population of Woodbury is 1,224.
What is the Ratio of Males per 100 Females in Woodbury?
There are 120.92 Males per 100 Females in Woodbury.
What is the Ratio of Females per 100 Males in Woodbury?
There are 82.70 Females per 100 Males in Woodbury.
What is the Median Population Age in Woodbury?
Median Population Age in Woodbury is 35.1 Years.
What is the Average Family Size in Woodbury
Average Family Size in Woodbury is 3.5 People.
What is the Average Household Size in Woodbury
Average Household Size in Woodbury is 2.6 People.
How Large is the Labor Force in Woodbury?
There are 1,259 People in the Labor Forcein in Woodbury.
What is the Percentage of People in the Labor Force in Woodbury?
59.3% of People are in the Labor Force in Woodbury.
What is the Unemployment Rate in Woodbury?
Unemployment Rate in Woodbury is 3.4%.