Dowelltown, TN Map & Demographics
Dowelltown Map
Dowelltown Overview
$26,989
PER CAPITA INCOME
$78,750
AVG FAMILY INCOME
$58,125
AVG HOUSEHOLD INCOME
40.7%
WAGE / INCOME GAP [ % ]
59.3¢/ $1
WAGE / INCOME GAP [ $ ]
0.45
INEQUALITY / GINI INDEX
355
TOTAL POPULATION
190
MALE POPULATION
165
FEMALE POPULATION
115.15
MALES / 100 FEMALES
86.84
FEMALES / 100 MALES
36.9
MEDIAN AGE
3.0
AVG FAMILY SIZE
2.6
AVG HOUSEHOLD SIZE
159
LABOR FORCE [ PEOPLE ]
55.4%
PERCENT IN LABOR FORCE
9.4%
UNEMPLOYMENT RATE
Dowelltown Zip Codes
Dowelltown Area Codes
Income in Dowelltown
Income Overview in Dowelltown
Per Capita Income in Dowelltown is $26,989, while median incomes of families and households are $78,750 and $58,125 respectively.
| Characteristic | Number | Measure |
| Per Capita Income | 355 | $26,989 |
| Median Family Income | 75 | $78,750 |
| Mean Family Income | 75 | $93,828 |
| Median Household Income | 137 | $58,125 |
| Mean Household Income | 137 | $72,033 |
| Income Deficit | 75 | $0 |
| Wage / Income Gap (%) | 355 | 40.69% |
| Wage / Income Gap ($) | 355 | 59.31¢ per $1 |
| Gini / Inequality Index | 355 | 0.45 |
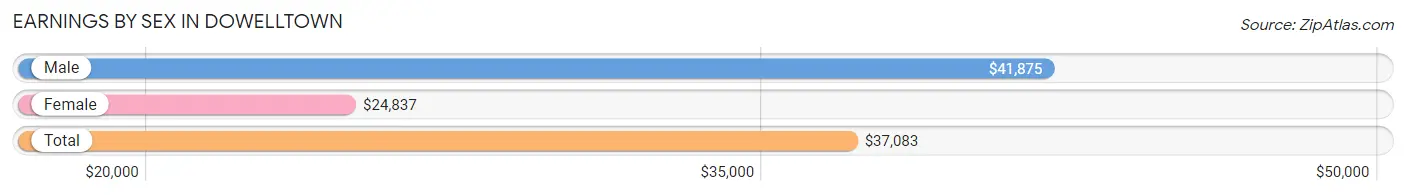
Earnings by Sex in Dowelltown
Average Earnings in Dowelltown are $37,083, $41,875 for men and $24,837 for women, a difference of 40.7%.
| Sex | Number | Average Earnings |
| Male | 95 (55.9%) | $41,875 |
| Female | 75 (44.1%) | $24,837 |
| Total | 170 (100.0%) | $37,083 |
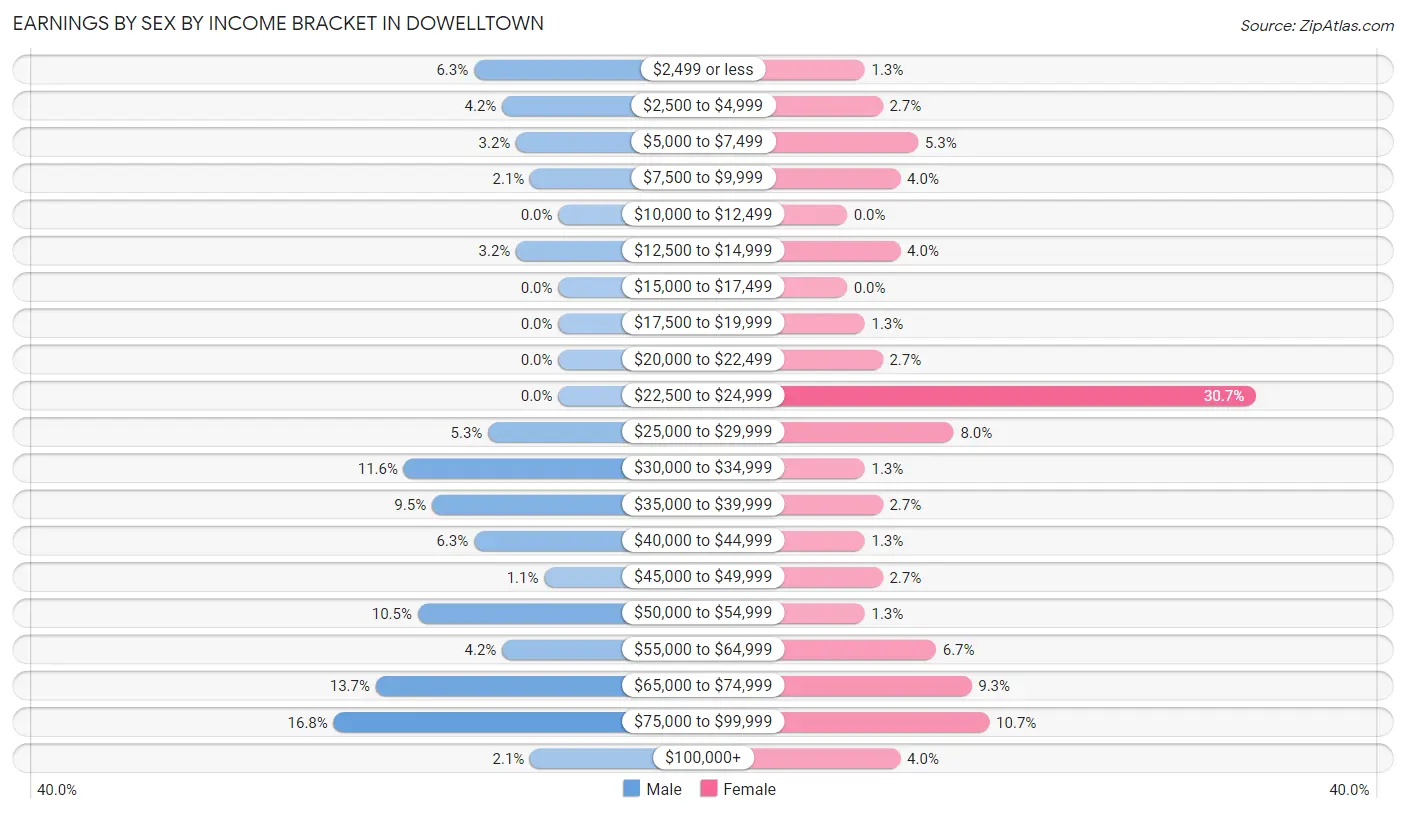
Earnings by Sex by Income Bracket in Dowelltown
The most common earnings brackets in Dowelltown are $75,000 to $99,999 for men (16 | 16.8%) and $22,500 to $24,999 for women (23 | 30.7%).
| Income | Male | Female |
| $2,499 or less | 6 (6.3%) | 1 (1.3%) |
| $2,500 to $4,999 | 4 (4.2%) | 2 (2.7%) |
| $5,000 to $7,499 | 3 (3.2%) | 4 (5.3%) |
| $7,500 to $9,999 | 2 (2.1%) | 3 (4.0%) |
| $10,000 to $12,499 | 0 (0.0%) | 0 (0.0%) |
| $12,500 to $14,999 | 3 (3.2%) | 3 (4.0%) |
| $15,000 to $17,499 | 0 (0.0%) | 0 (0.0%) |
| $17,500 to $19,999 | 0 (0.0%) | 1 (1.3%) |
| $20,000 to $22,499 | 0 (0.0%) | 2 (2.7%) |
| $22,500 to $24,999 | 0 (0.0%) | 23 (30.7%) |
| $25,000 to $29,999 | 5 (5.3%) | 6 (8.0%) |
| $30,000 to $34,999 | 11 (11.6%) | 1 (1.3%) |
| $35,000 to $39,999 | 9 (9.5%) | 2 (2.7%) |
| $40,000 to $44,999 | 6 (6.3%) | 1 (1.3%) |
| $45,000 to $49,999 | 1 (1.1%) | 2 (2.7%) |
| $50,000 to $54,999 | 10 (10.5%) | 1 (1.3%) |
| $55,000 to $64,999 | 4 (4.2%) | 5 (6.7%) |
| $65,000 to $74,999 | 13 (13.7%) | 7 (9.3%) |
| $75,000 to $99,999 | 16 (16.8%) | 8 (10.7%) |
| $100,000+ | 2 (2.1%) | 3 (4.0%) |
| Total | 95 (100.0%) | 75 (100.0%) |
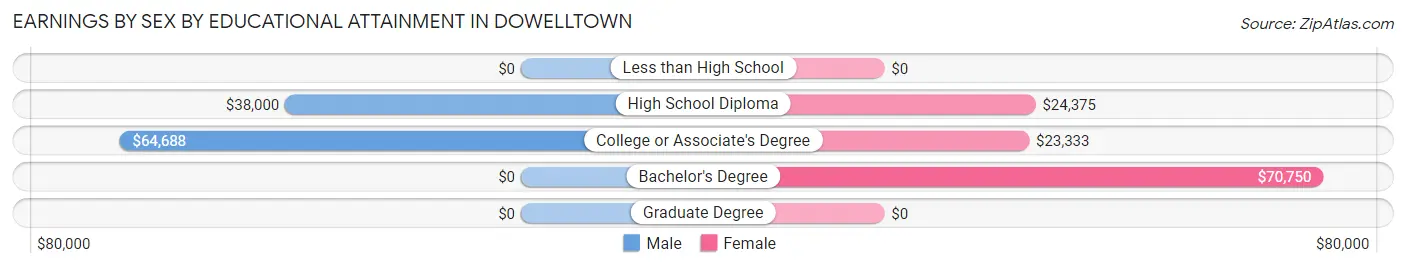
Earnings by Sex by Educational Attainment in Dowelltown
Average earnings in Dowelltown are $51,786 for men and $24,837 for women, a difference of 52.0%. Men with an educational attainment of college or associate's degree enjoy the highest average annual earnings of $64,688, while those with high school diploma education earn the least with $38,000. Women with an educational attainment of bachelor's degree earn the most with the average annual earnings of $70,750, while those with college or associate's degree education have the smallest earnings of $23,333.
| Educational Attainment | Male Income | Female Income |
| Less than High School | - | - |
| High School Diploma | $38,000 | $24,375 |
| College or Associate's Degree | $64,688 | $23,333 |
| Bachelor's Degree | - | - |
| Graduate Degree | - | - |
| Total | $51,786 | $24,837 |
Family Income in Dowelltown
Family Income Brackets in Dowelltown
According to the Dowelltown family income data, there are 14 families falling into the $150,000 to $199,999 income range, which is the most common income bracket and makes up 18.7% of all families.
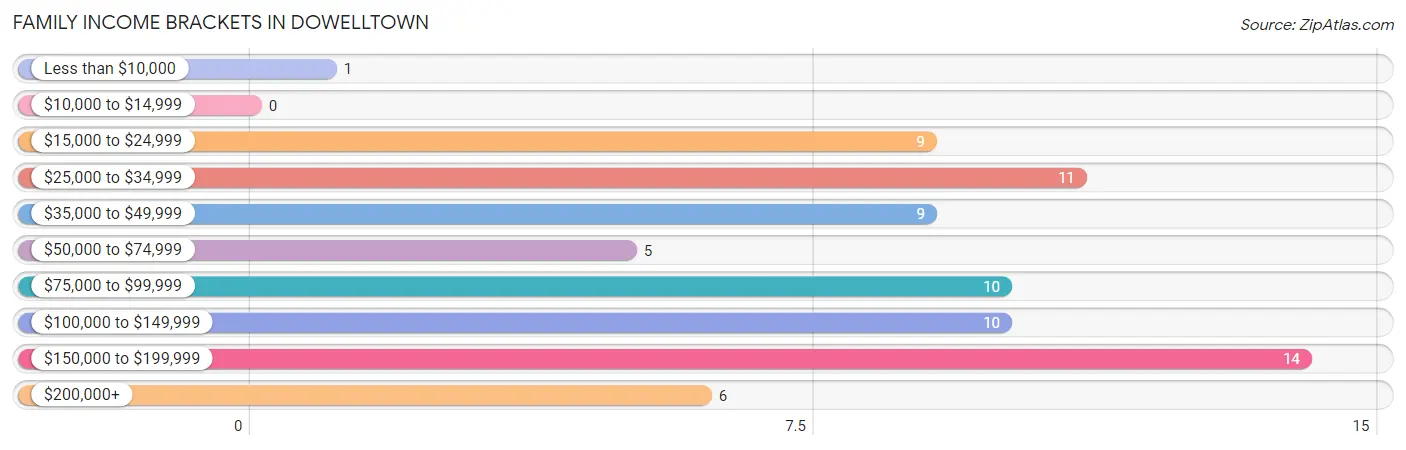
| Income Bracket | # Families | % Families |
| Less than $10,000 | 1 | 1.3% |
| $10,000 to $14,999 | 0 | 0.0% |
| $15,000 to $24,999 | 9 | 12.0% |
| $25,000 to $34,999 | 11 | 14.7% |
| $35,000 to $49,999 | 9 | 12.0% |
| $50,000 to $74,999 | 5 | 6.7% |
| $75,000 to $99,999 | 10 | 13.3% |
| $100,000 to $149,999 | 10 | 13.3% |
| $150,000 to $199,999 | 14 | 18.7% |
| $200,000+ | 6 | 8.0% |
Family Income by Famaliy Size in Dowelltown
2-person families (41 | 54.7%) account for the highest median family income in Dowelltown with $100,417 per family, while 2-person families (41 | 54.7%) have the highest median income of $50,208 per family member.
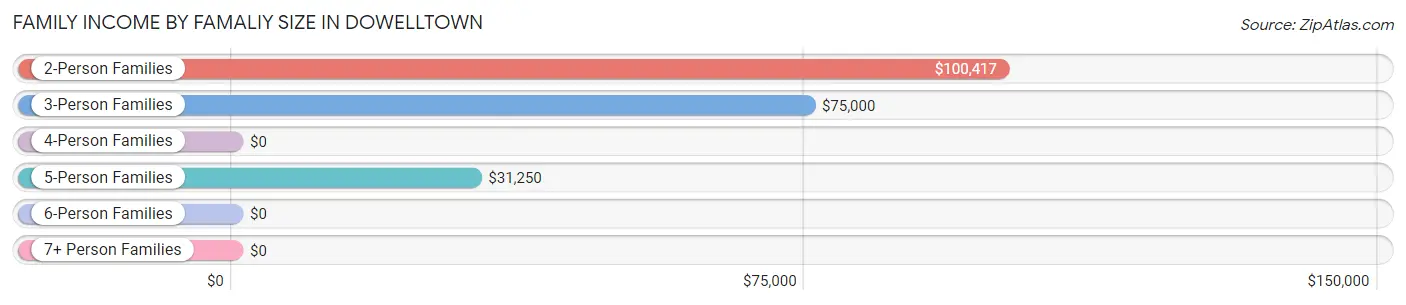
| Income Bracket | # Families | Median Income |
| 2-Person Families | 41 (54.7%) | $100,417 |
| 3-Person Families | 14 (18.7%) | $75,000 |
| 4-Person Families | 6 (8.0%) | $0 |
| 5-Person Families | 12 (16.0%) | $31,250 |
| 6-Person Families | 2 (2.7%) | $0 |
| 7+ Person Families | 0 (0.0%) | $0 |
| Total | 75 (100.0%) | $78,750 |
Family Income by Number of Earners in Dowelltown
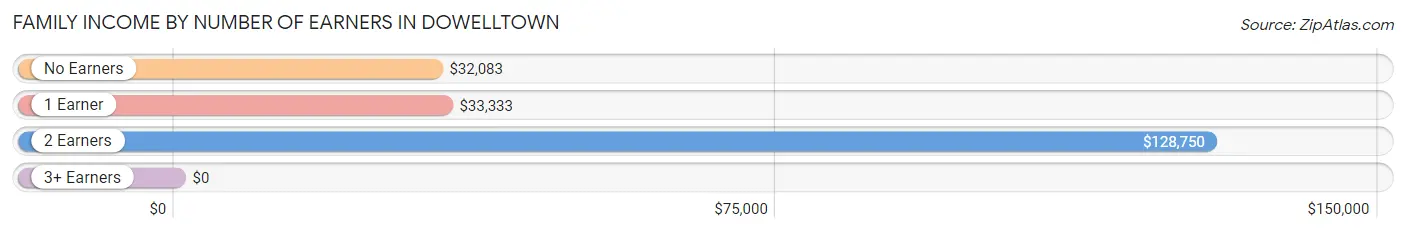
| Number of Earners | # Families | Median Income |
| No Earners | 5 (6.7%) | $32,083 |
| 1 Earner | 24 (32.0%) | $33,333 |
| 2 Earners | 44 (58.7%) | $128,750 |
| 3+ Earners | 2 (2.7%) | $0 |
| Total | 75 (100.0%) | $78,750 |
Household Income in Dowelltown
Household Income Brackets in Dowelltown
With 29 households falling in the category, the $75,000 to $99,999 income range is the most frequent in Dowelltown, accounting for 21.2% of all households. In contrast, only 6 households (4.4%) fall into the $200,000+ income bracket, making it the least populous group.
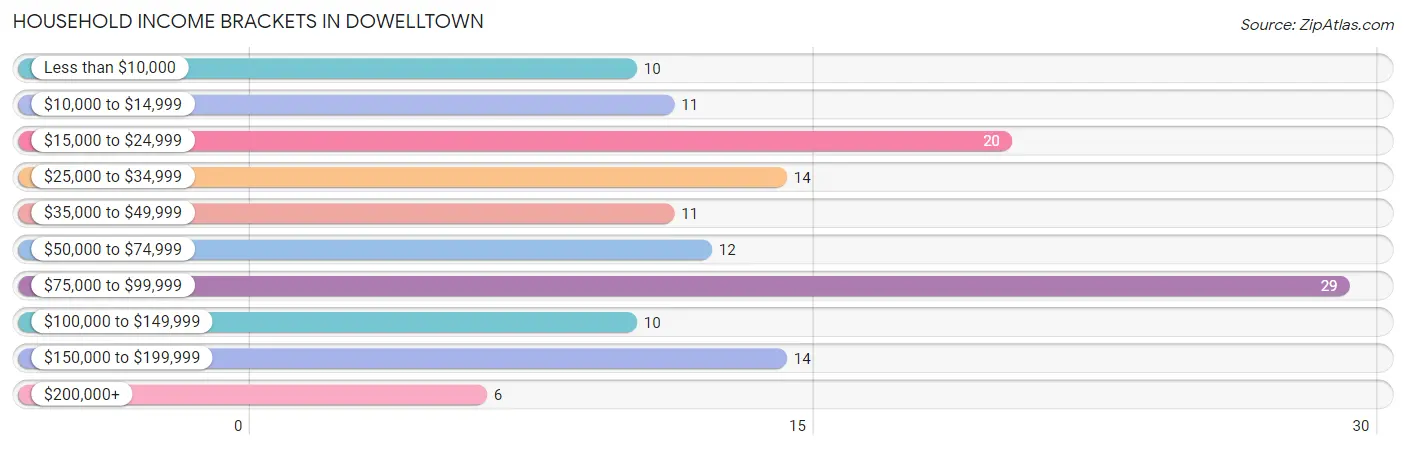
| Income Bracket | # Households | % Households |
| Less than $10,000 | 10 | 7.3% |
| $10,000 to $14,999 | 11 | 8.0% |
| $15,000 to $24,999 | 20 | 14.6% |
| $25,000 to $34,999 | 14 | 10.2% |
| $35,000 to $49,999 | 11 | 8.0% |
| $50,000 to $74,999 | 12 | 8.8% |
| $75,000 to $99,999 | 29 | 21.2% |
| $100,000 to $149,999 | 10 | 7.3% |
| $150,000 to $199,999 | 14 | 10.2% |
| $200,000+ | 6 | 4.4% |
Household Income by Householder Age in Dowelltown
The median household income in Dowelltown is $58,125, with the highest median household income of $95,278 found in the 25 to 44 years age bracket for the primary householder. A total of 38 households (27.7%) fall into this category. Meanwhile, the 15 to 24 years age bracket for the primary householder has the lowest median household income of $0, with 4 households (2.9%) in this group.
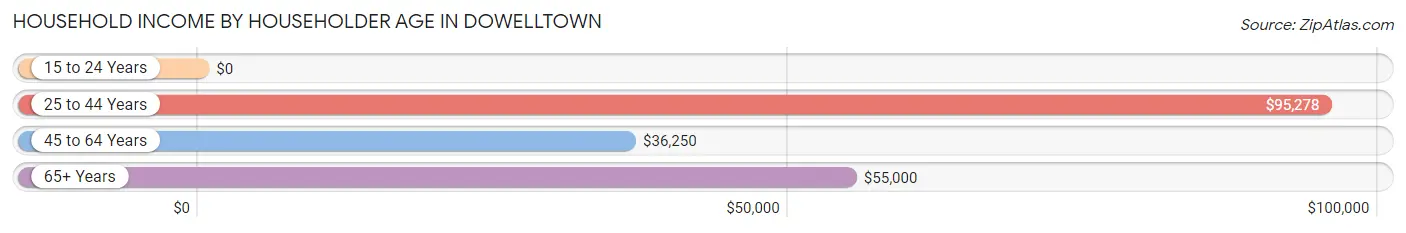
| Income Bracket | # Households | Median Income |
| 15 to 24 Years | 4 (2.9%) | $0 |
| 25 to 44 Years | 38 (27.7%) | $95,278 |
| 45 to 64 Years | 47 (34.3%) | $36,250 |
| 65+ Years | 48 (35.0%) | $55,000 |
| Total | 137 (100.0%) | $58,125 |
Poverty in Dowelltown
Income Below Poverty by Sex and Age in Dowelltown
With 32.1% poverty level for males and 38.2% for females among the residents of Dowelltown, under 5 year old males and 5 year old females are the most vulnerable to poverty, with 8 males (80.0%) and 2 females (100.0%) in their respective age groups living below the poverty level.
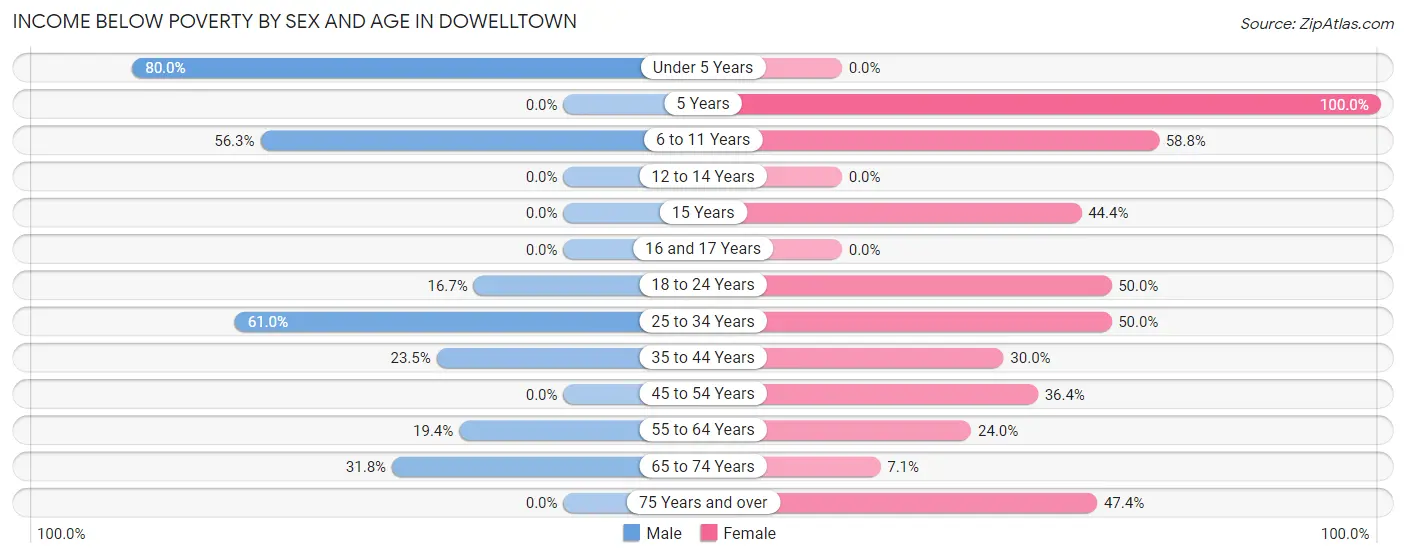
| Age Bracket | Male | Female |
| Under 5 Years | 8 (80.0%) | 0 (0.0%) |
| 5 Years | 0 (0.0%) | 2 (100.0%) |
| 6 to 11 Years | 9 (56.2%) | 10 (58.8%) |
| 12 to 14 Years | 0 (0.0%) | 0 (0.0%) |
| 15 Years | 0 (0.0%) | 4 (44.4%) |
| 16 and 17 Years | 0 (0.0%) | 0 (0.0%) |
| 18 to 24 Years | 2 (16.7%) | 2 (50.0%) |
| 25 to 34 Years | 25 (61.0%) | 19 (50.0%) |
| 35 to 44 Years | 4 (23.5%) | 6 (30.0%) |
| 45 to 54 Years | 0 (0.0%) | 4 (36.4%) |
| 55 to 64 Years | 6 (19.4%) | 6 (24.0%) |
| 65 to 74 Years | 7 (31.8%) | 1 (7.1%) |
| 75 Years and over | 0 (0.0%) | 9 (47.4%) |
| Total | 61 (32.1%) | 63 (38.2%) |
Income Above Poverty by Sex and Age in Dowelltown
According to the poverty statistics in Dowelltown, males aged 5 years and females aged under 5 years are the age groups that are most secure financially, with 100.0% of males and 100.0% of females in these age groups living above the poverty line.
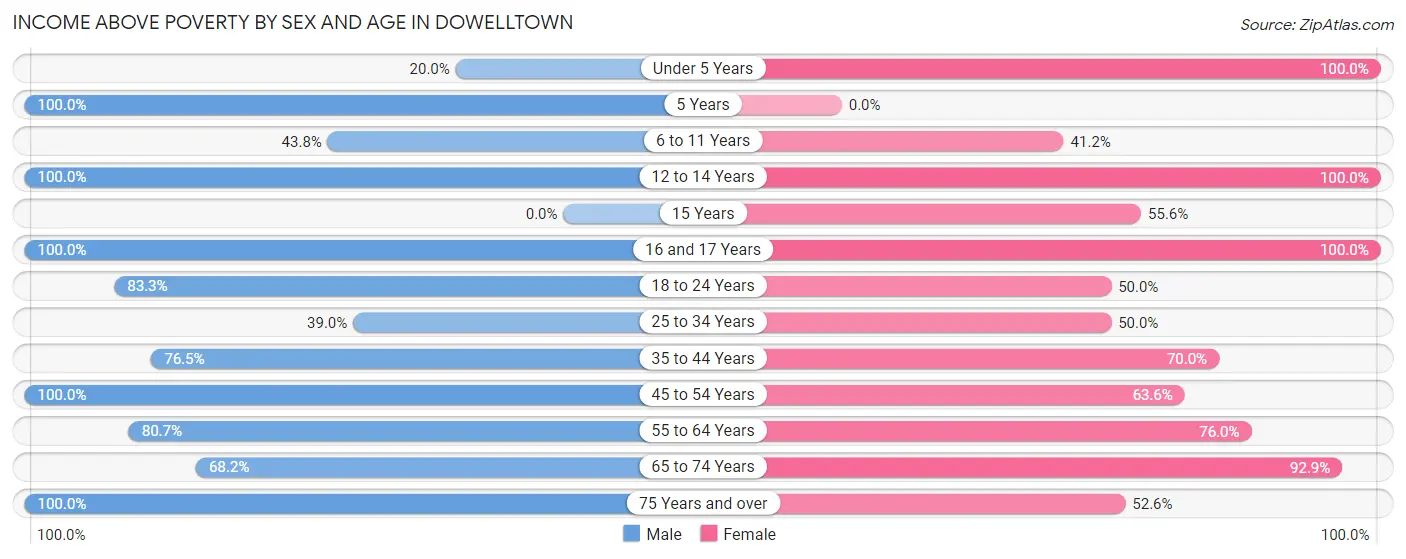
| Age Bracket | Male | Female |
| Under 5 Years | 2 (20.0%) | 3 (100.0%) |
| 5 Years | 3 (100.0%) | 0 (0.0%) |
| 6 to 11 Years | 7 (43.8%) | 7 (41.2%) |
| 12 to 14 Years | 6 (100.0%) | 2 (100.0%) |
| 15 Years | 0 (0.0%) | 5 (55.6%) |
| 16 and 17 Years | 6 (100.0%) | 1 (100.0%) |
| 18 to 24 Years | 10 (83.3%) | 2 (50.0%) |
| 25 to 34 Years | 16 (39.0%) | 19 (50.0%) |
| 35 to 44 Years | 13 (76.5%) | 14 (70.0%) |
| 45 to 54 Years | 19 (100.0%) | 7 (63.6%) |
| 55 to 64 Years | 25 (80.6%) | 19 (76.0%) |
| 65 to 74 Years | 15 (68.2%) | 13 (92.9%) |
| 75 Years and over | 7 (100.0%) | 10 (52.6%) |
| Total | 129 (67.9%) | 102 (61.8%) |
Income Below Poverty Among Married-Couple Families in Dowelltown
The poverty statistics for married-couple families in Dowelltown show that 4.3% or 2 of the total 47 families live below the poverty line. Families with 1 or 2 children have the highest poverty rate of 10.5%, comprising of 2 families. On the other hand, families with no children have the lowest poverty rate of 0.0%, which includes 0 families.
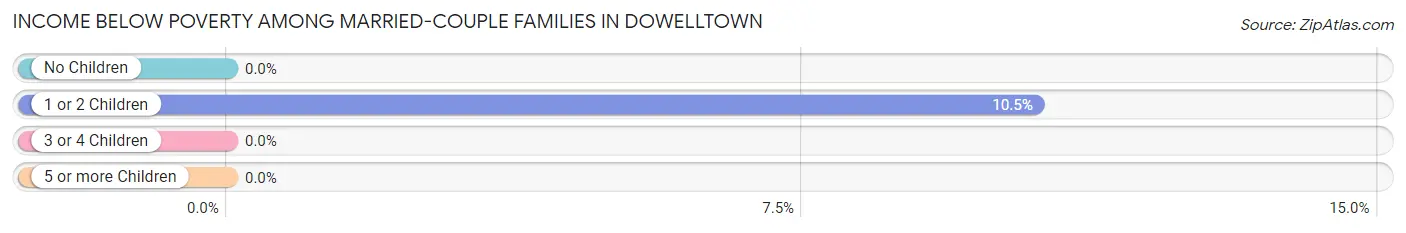
| Children | Above Poverty | Below Poverty |
| No Children | 25 (100.0%) | 0 (0.0%) |
| 1 or 2 Children | 17 (89.5%) | 2 (10.5%) |
| 3 or 4 Children | 3 (100.0%) | 0 (0.0%) |
| 5 or more Children | 0 (0.0%) | 0 (0.0%) |
| Total | 45 (95.7%) | 2 (4.3%) |
Income Below Poverty Among Single-Parent Households in Dowelltown
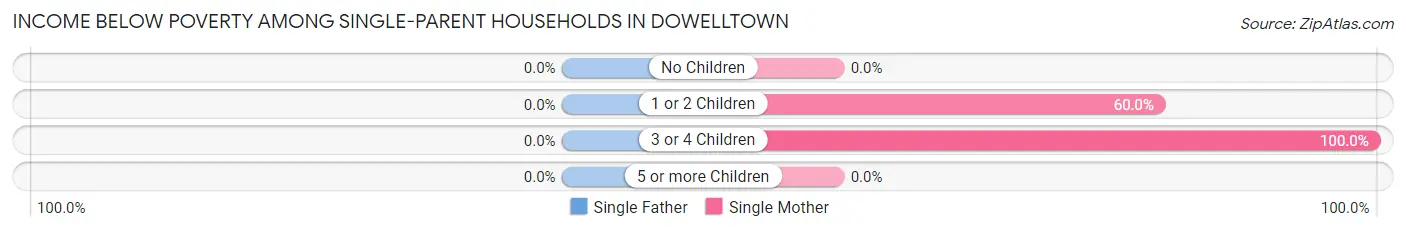
| Children | Single Father | Single Mother |
| No Children | 0 (0.0%) | 0 (0.0%) |
| 1 or 2 Children | 0 (0.0%) | 3 (60.0%) |
| 3 or 4 Children | 0 (0.0%) | 5 (100.0%) |
| 5 or more Children | 0 (0.0%) | 0 (0.0%) |
| Total | 0 (0.0%) | 8 (53.3%) |
Income Below Poverty Among Married-Couple vs Single-Parent Households in Dowelltown
The poverty data for Dowelltown shows that 2 of the married-couple family households (4.3%) and 8 of the single-parent households (28.6%) are living below the poverty level. Within the married-couple family households, those with 1 or 2 children have the highest poverty rate, with 2 households (10.5%) falling below the poverty line. Among the single-parent households, those with 3 or 4 children have the highest poverty rate, with 5 household (100.0%) living below poverty.
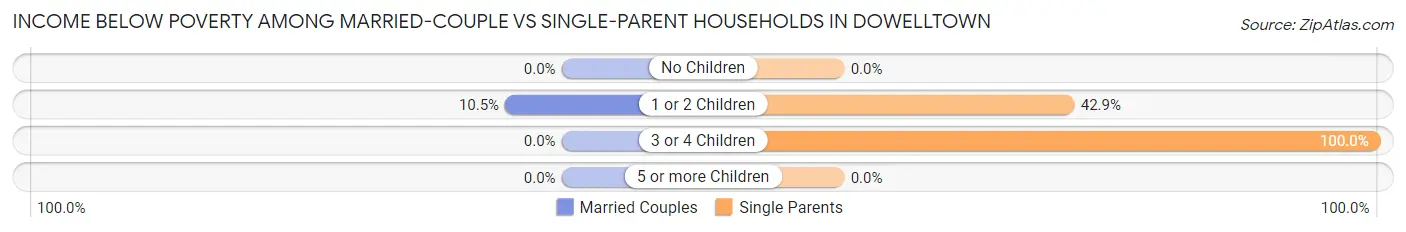
| Children | Married-Couple Families | Single-Parent Households |
| No Children | 0 (0.0%) | 0 (0.0%) |
| 1 or 2 Children | 2 (10.5%) | 3 (42.9%) |
| 3 or 4 Children | 0 (0.0%) | 5 (100.0%) |
| 5 or more Children | 0 (0.0%) | 0 (0.0%) |
| Total | 2 (4.3%) | 8 (28.6%) |
Race in Dowelltown
The most populous races in Dowelltown are White / Caucasian (324 | 91.3%), Black / African American (19 | 5.3%), and Hispanic or Latino (6 | 1.7%).
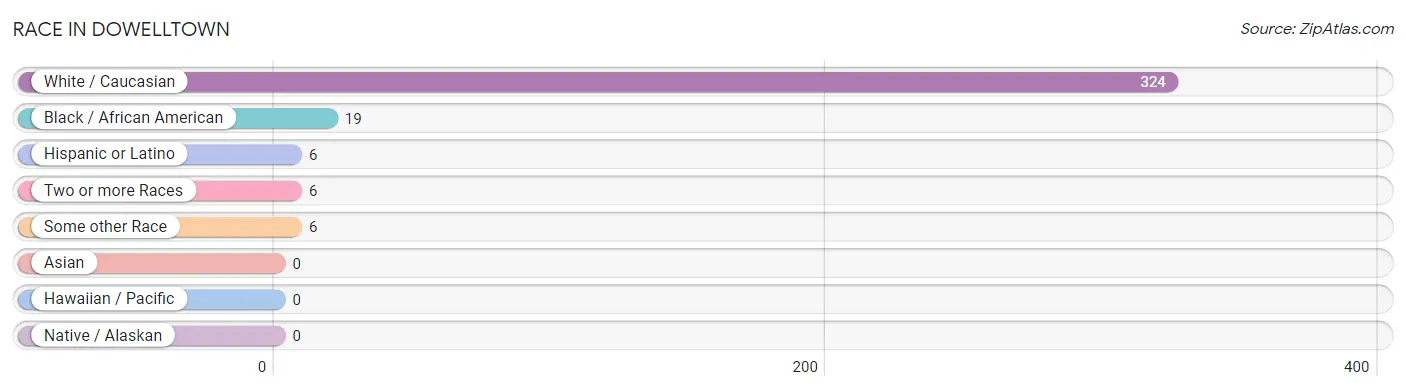
| Race | # Population | % Population |
| Asian | 0 | 0.0% |
| Black / African American | 19 | 5.3% |
| Hawaiian / Pacific | 0 | 0.0% |
| Hispanic or Latino | 6 | 1.7% |
| Native / Alaskan | 0 | 0.0% |
| White / Caucasian | 324 | 91.3% |
| Two or more Races | 6 | 1.7% |
| Some other Race | 6 | 1.7% |
| Total | 355 | 100.0% |
Ancestry in Dowelltown
The most populous ancestries reported in Dowelltown are American (50 | 14.1%), Irish (32 | 9.0%), English (30 | 8.5%), German (15 | 4.2%), and Scotch-Irish (13 | 3.7%), together accounting for 39.4% of all Dowelltown residents.
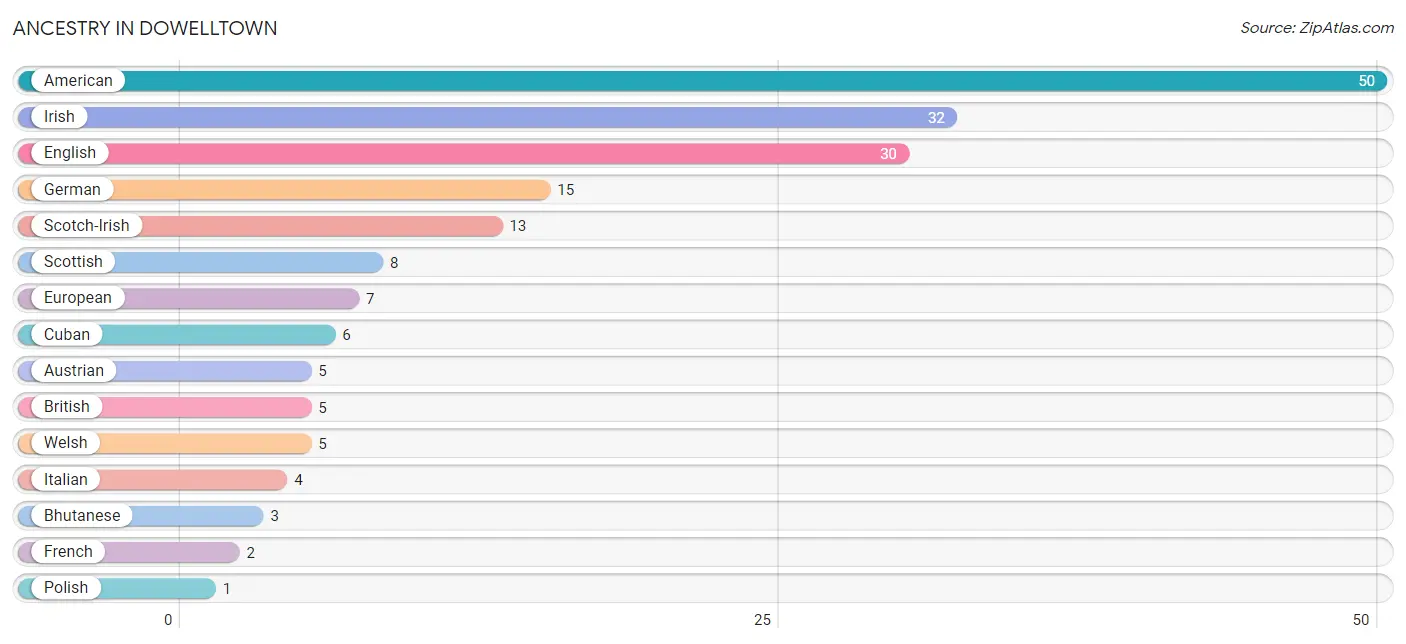
| Ancestry | # Population | % Population |
| American | 50 | 14.1% |
| Austrian | 5 | 1.4% |
| Bhutanese | 3 | 0.9% |
| British | 5 | 1.4% |
| Cuban | 6 | 1.7% |
| English | 30 | 8.5% |
| European | 7 | 2.0% |
| French | 2 | 0.6% |
| German | 15 | 4.2% |
| Irish | 32 | 9.0% |
| Italian | 4 | 1.1% |
| Polish | 1 | 0.3% |
| Scotch-Irish | 13 | 3.7% |
| Scottish | 8 | 2.2% |
| Swedish | 1 | 0.3% |
| Welsh | 5 | 1.4% | View All 16 Rows |
Immigrants in Dowelltown
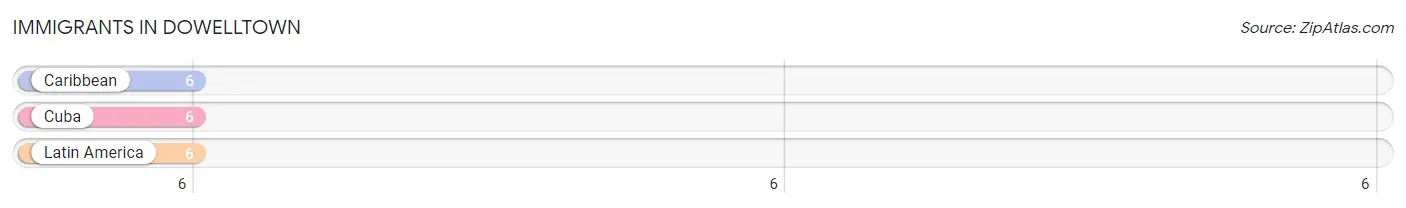
The most numerous immigrant groups reported in Dowelltown came from Caribbean (6 | 1.7%), Cuba (6 | 1.7%), and Latin America (6 | 1.7%), together accounting for 5.1% of all Dowelltown residents.
| Immigration Origin | # Population | % Population |
| Caribbean | 6 | 1.7% |
| Cuba | 6 | 1.7% |
| Latin America | 6 | 1.7% | View All 3 Rows |
Sex and Age in Dowelltown
Sex and Age in Dowelltown
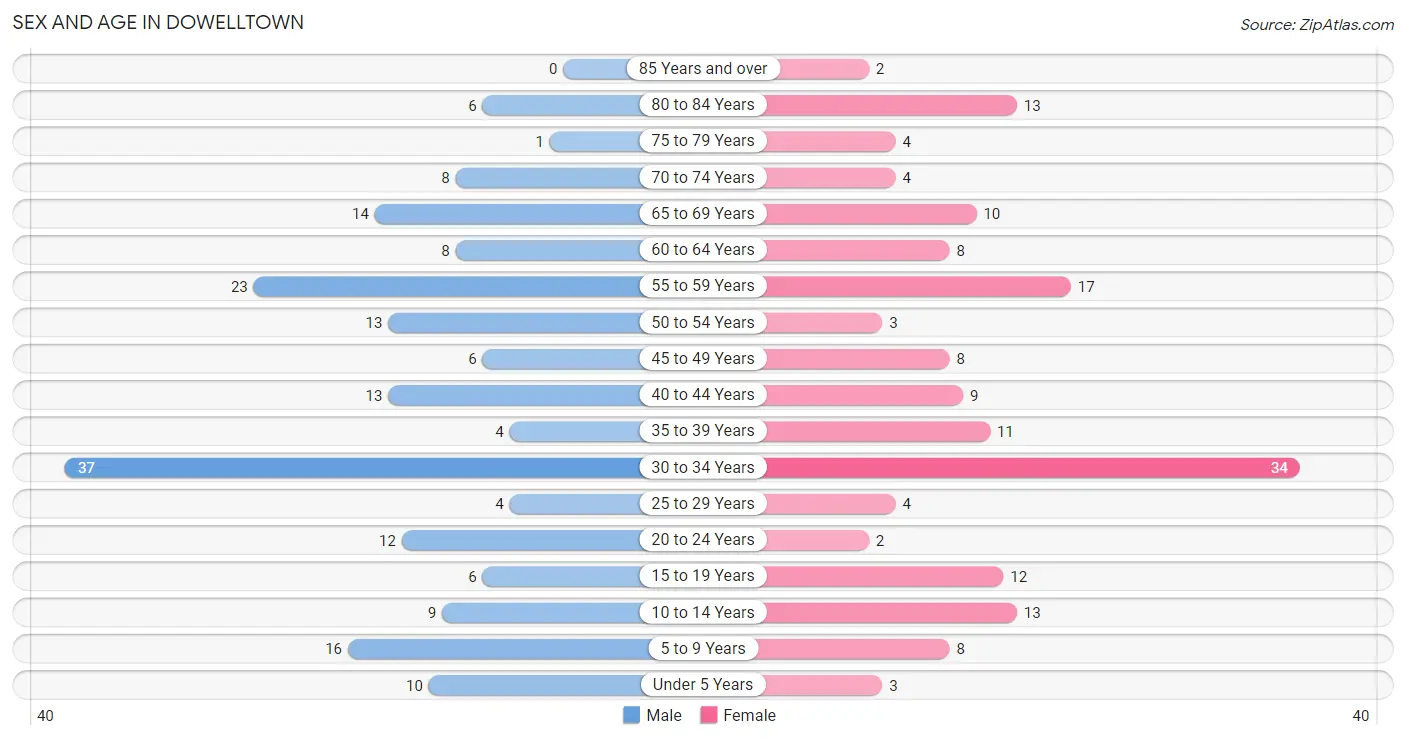
The most populous age groups in Dowelltown are 30 to 34 Years (37 | 19.5%) for men and 30 to 34 Years (34 | 20.6%) for women.
| Age Bracket | Male | Female |
| Under 5 Years | 10 (5.3%) | 3 (1.8%) |
| 5 to 9 Years | 16 (8.4%) | 8 (4.9%) |
| 10 to 14 Years | 9 (4.7%) | 13 (7.9%) |
| 15 to 19 Years | 6 (3.2%) | 12 (7.3%) |
| 20 to 24 Years | 12 (6.3%) | 2 (1.2%) |
| 25 to 29 Years | 4 (2.1%) | 4 (2.4%) |
| 30 to 34 Years | 37 (19.5%) | 34 (20.6%) |
| 35 to 39 Years | 4 (2.1%) | 11 (6.7%) |
| 40 to 44 Years | 13 (6.8%) | 9 (5.4%) |
| 45 to 49 Years | 6 (3.2%) | 8 (4.9%) |
| 50 to 54 Years | 13 (6.8%) | 3 (1.8%) |
| 55 to 59 Years | 23 (12.1%) | 17 (10.3%) |
| 60 to 64 Years | 8 (4.2%) | 8 (4.9%) |
| 65 to 69 Years | 14 (7.4%) | 10 (6.1%) |
| 70 to 74 Years | 8 (4.2%) | 4 (2.4%) |
| 75 to 79 Years | 1 (0.5%) | 4 (2.4%) |
| 80 to 84 Years | 6 (3.2%) | 13 (7.9%) |
| 85 Years and over | 0 (0.0%) | 2 (1.2%) |
| Total | 190 (100.0%) | 165 (100.0%) |
Families and Households in Dowelltown
Median Family Size in Dowelltown
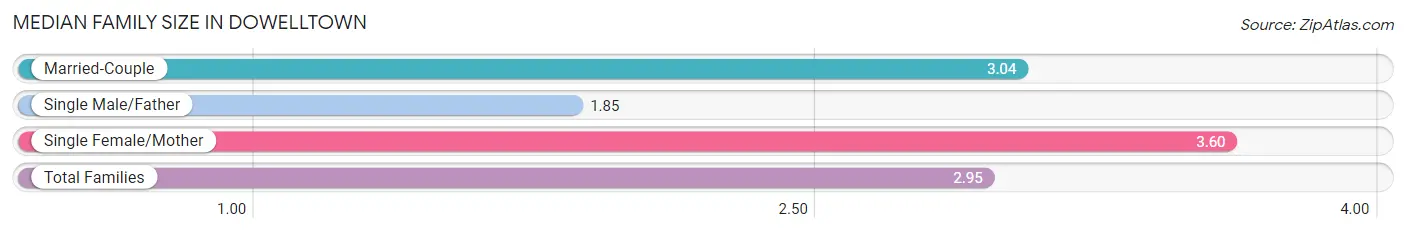
The median family size in Dowelltown is 2.95 persons per family, with single female/mother families (15 | 20.0%) accounting for the largest median family size of 3.6 persons per family. On the other hand, single male/father families (13 | 17.3%) represent the smallest median family size with 1.85 persons per family.
| Family Type | # Families | Family Size |
| Married-Couple | 47 (62.7%) | 3.04 |
| Single Male/Father | 13 (17.3%) | 1.85 |
| Single Female/Mother | 15 (20.0%) | 3.60 |
| Total Families | 75 (100.0%) | 2.95 |
Median Household Size in Dowelltown
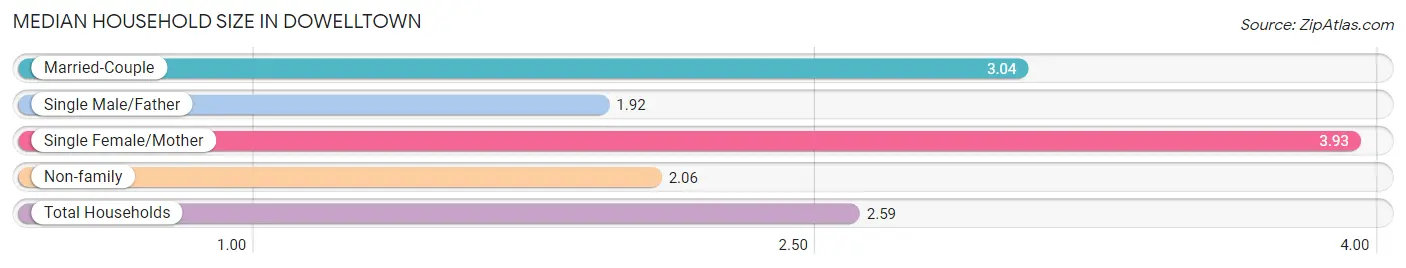
The median household size in Dowelltown is 2.59 persons per household, with single female/mother households (15 | 11.0%) accounting for the largest median household size of 3.93 persons per household. single male/father households (13 | 9.5%) represent the smallest median household size with 1.92 persons per household.
| Household Type | # Households | Household Size |
| Married-Couple | 47 (34.3%) | 3.04 |
| Single Male/Father | 13 (9.5%) | 1.92 |
| Single Female/Mother | 15 (11.0%) | 3.93 |
| Non-family | 62 (45.3%) | 2.06 |
| Total Households | 137 (100.0%) | 2.59 |
Household Size by Marriage Status in Dowelltown
Out of a total of 137 households in Dowelltown, 75 (54.7%) are family households, while 62 (45.3%) are nonfamily households. The most numerous type of family households are 2-person households, comprising 38, and the most common type of nonfamily households are 1-person households, comprising 44.
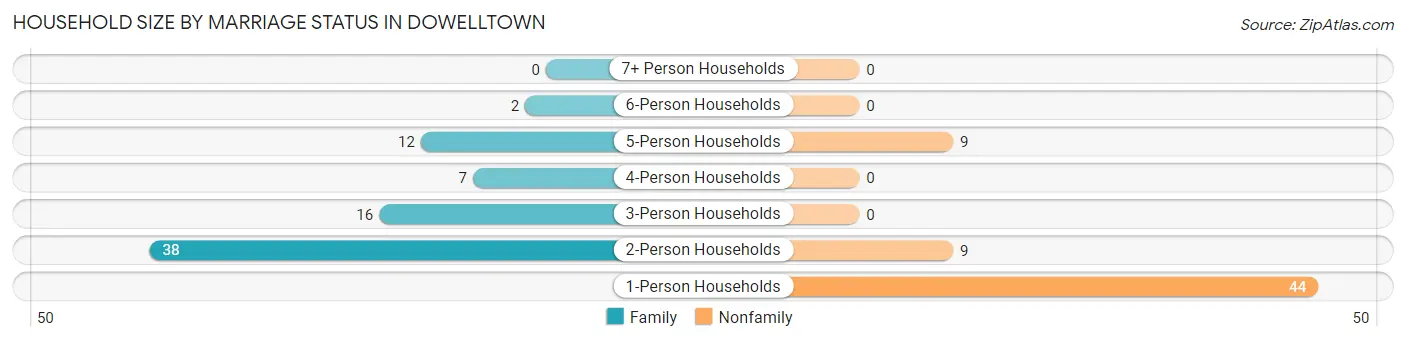
| Household Size | Family Households | Nonfamily Households |
| 1-Person Households | - | 44 (32.1%) |
| 2-Person Households | 38 (27.7%) | 9 (6.6%) |
| 3-Person Households | 16 (11.7%) | 0 (0.0%) |
| 4-Person Households | 7 (5.1%) | 0 (0.0%) |
| 5-Person Households | 12 (8.8%) | 9 (6.6%) |
| 6-Person Households | 2 (1.5%) | 0 (0.0%) |
| 7+ Person Households | 0 (0.0%) | 0 (0.0%) |
| Total | 75 (54.7%) | 62 (45.3%) |
Female Fertility in Dowelltown
Fertility by Age in Dowelltown
Average fertility rate in Dowelltown is 75.0 births per 1,000 women. Women in the age bracket of 20 to 34 years have the highest fertility rate with 150.0 births per 1,000 women. Women in the age bracket of 20 to 34 years acount for 100.0% of all women with births.
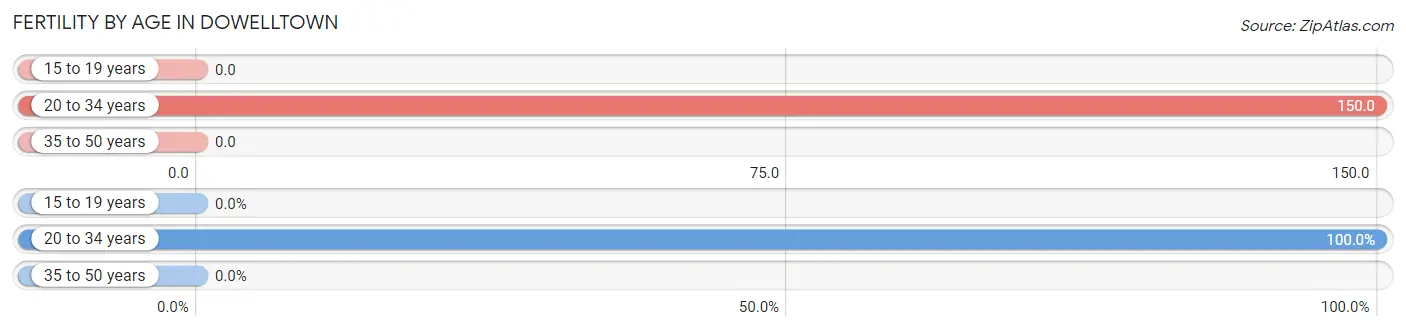
| Age Bracket | Women with Births | Births / 1,000 Women |
| 15 to 19 years | 0 (0.0%) | 0.0 |
| 20 to 34 years | 6 (100.0%) | 150.0 |
| 35 to 50 years | 0 (0.0%) | 0.0 |
| Total | 6 (100.0%) | 75.0 |
Fertility by Age by Marriage Status in Dowelltown
83.3% of women with births (6) in Dowelltown are married. The highest percentage of unmarried women with births falls into 20 to 34 years age bracket with 16.7% of them unmarried at the time of birth, while the lowest percentage of unmarried women with births belong to 20 to 34 years age bracket with 16.7% of them unmarried.
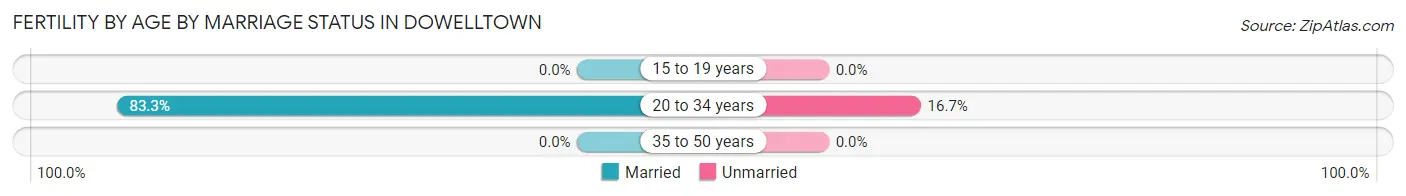
| Age Bracket | Married | Unmarried |
| 15 to 19 years | 0 (0.0%) | 0 (0.0%) |
| 20 to 34 years | 5 (83.3%) | 1 (16.7%) |
| 35 to 50 years | 0 (0.0%) | 0 (0.0%) |
| Total | 5 (83.3%) | 1 (16.7%) |
Fertility by Education in Dowelltown
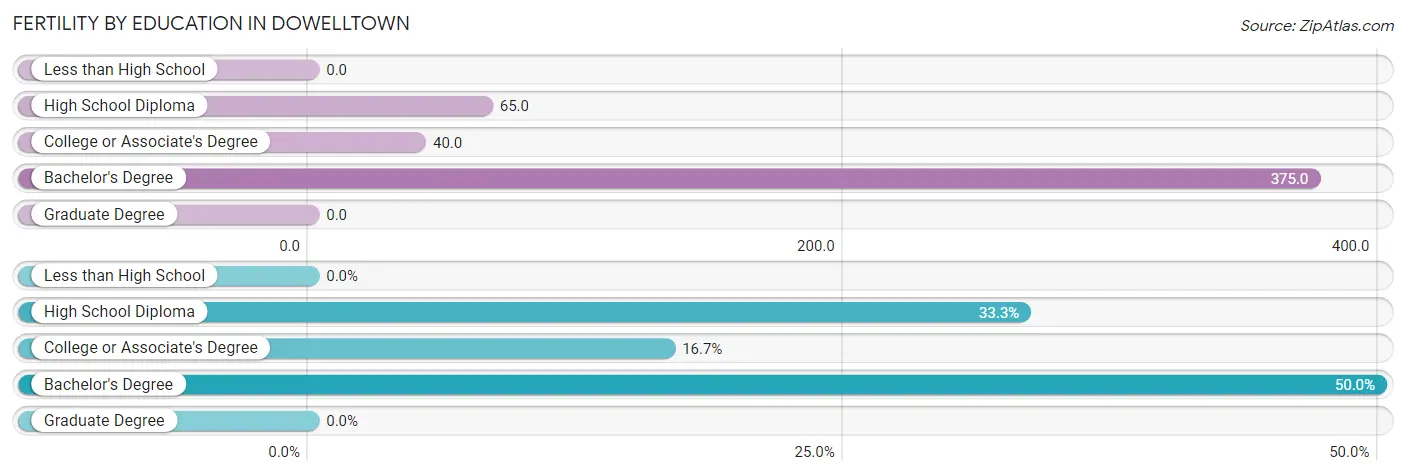
| Educational Attainment | Women with Births | Births / 1,000 Women |
| Less than High School | 0 (0.0%) | 0.0 |
| High School Diploma | 2 (33.3%) | 65.0 |
| College or Associate's Degree | 1 (16.7%) | 40.0 |
| Bachelor's Degree | 3 (50.0%) | 375.0 |
| Graduate Degree | 0 (0.0%) | 0.0 |
| Total | 6 (100.0%) | 75.0 |
Fertility by Education by Marriage Status in Dowelltown
16.7% of women with births in Dowelltown are unmarried. Women with the educational attainment of high school diploma are most likely to be married with 100.0% of them married at childbirth, while women with the educational attainment of college or associate's degree are least likely to be married with 100.0% of them unmarried at childbirth.
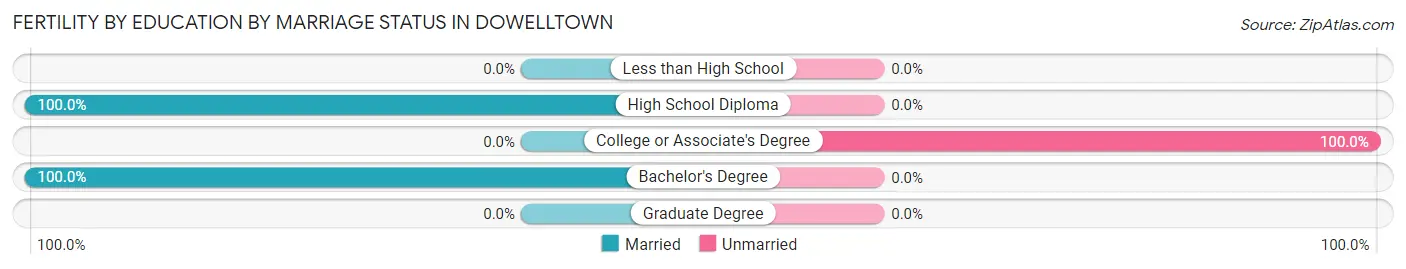
| Educational Attainment | Married | Unmarried |
| Less than High School | 0 (0.0%) | 0 (0.0%) |
| High School Diploma | 2 (100.0%) | 0 (0.0%) |
| College or Associate's Degree | 0 (0.0%) | 1 (100.0%) |
| Bachelor's Degree | 3 (100.0%) | 0 (0.0%) |
| Graduate Degree | 0 (0.0%) | 0 (0.0%) |
| Total | 5 (83.3%) | 1 (16.7%) |
Employment Characteristics in Dowelltown
Employment by Class of Employer in Dowelltown
Among the 139 employed individuals in Dowelltown, private company employees (103 | 74.1%), self-employed (not incorporated) (13 | 9.3%), and state government employees (7 | 5.0%) make up the most common classes of employment.
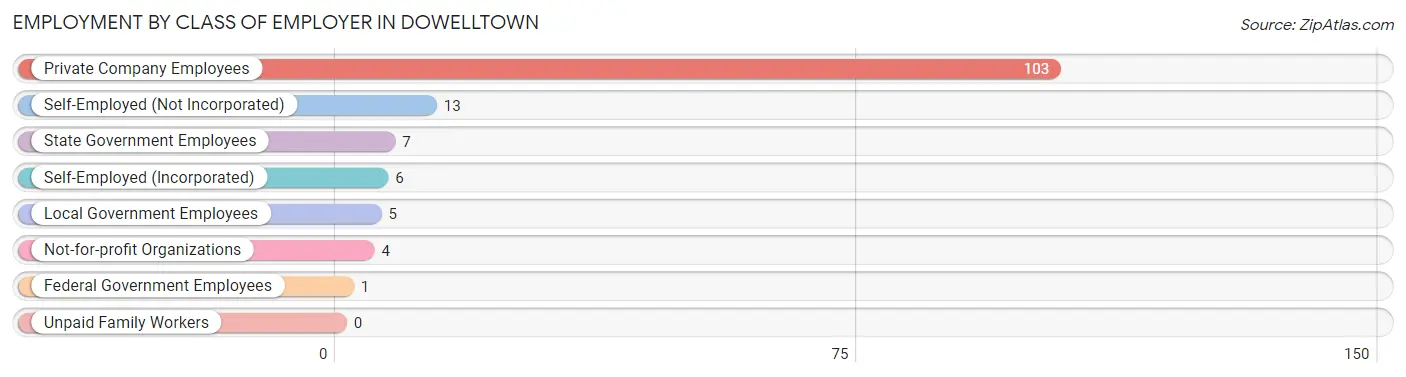
| Employer Class | # Employees | % Employees |
| Private Company Employees | 103 | 74.1% |
| Self-Employed (Incorporated) | 6 | 4.3% |
| Self-Employed (Not Incorporated) | 13 | 9.3% |
| Not-for-profit Organizations | 4 | 2.9% |
| Local Government Employees | 5 | 3.6% |
| State Government Employees | 7 | 5.0% |
| Federal Government Employees | 1 | 0.7% |
| Unpaid Family Workers | 0 | 0.0% |
| Total | 139 | 100.0% |
Employment Status by Age in Dowelltown
According to the labor force statistics for Dowelltown, out of the total population over 16 years of age (287), 55.4% or 159 individuals are in the labor force, with 9.4% or 15 of them unemployed. The age group with the highest labor force participation rate is 20 to 24 years, with 100.0% or 14 individuals in the labor force. Within the labor force, the 30 to 34 years age range has the highest percentage of unemployed individuals, with 50.0% or 15 of them being unemployed.
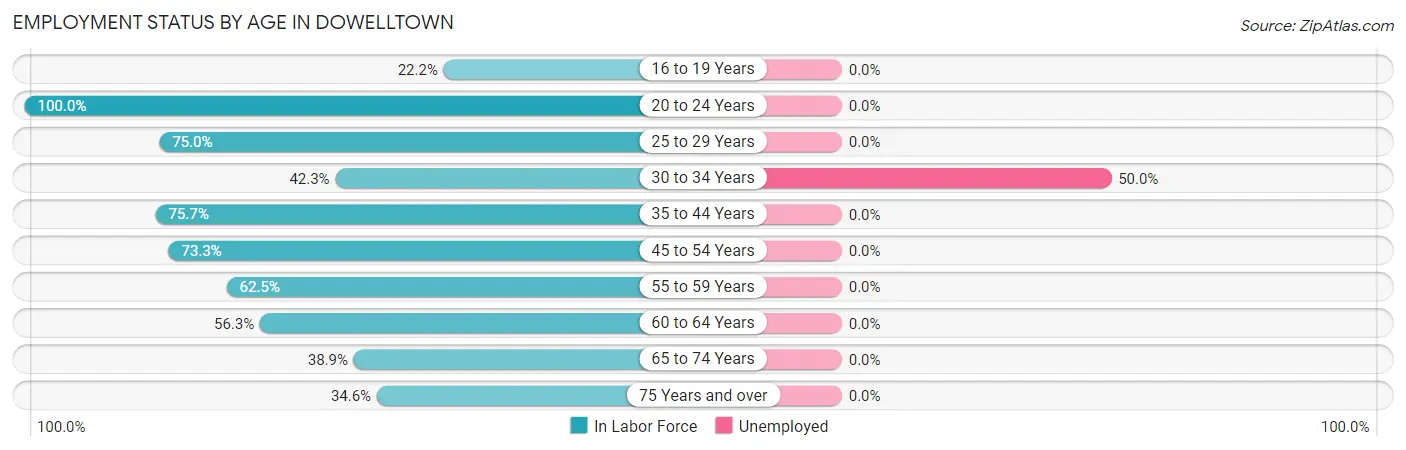
| Age Bracket | In Labor Force | Unemployed |
| 16 to 19 Years | 2 (22.2%) | 0 (0.0%) |
| 20 to 24 Years | 14 (100.0%) | 0 (0.0%) |
| 25 to 29 Years | 6 (75.0%) | 0 (0.0%) |
| 30 to 34 Years | 30 (42.3%) | 15 (50.0%) |
| 35 to 44 Years | 28 (75.7%) | 0 (0.0%) |
| 45 to 54 Years | 22 (73.3%) | 0 (0.0%) |
| 55 to 59 Years | 25 (62.5%) | 0 (0.0%) |
| 60 to 64 Years | 9 (56.3%) | 0 (0.0%) |
| 65 to 74 Years | 14 (38.9%) | 0 (0.0%) |
| 75 Years and over | 9 (34.6%) | 0 (0.0%) |
| Total | 159 (55.4%) | 15 (9.4%) |
Employment Status by Educational Attainment in Dowelltown
According to labor force statistics for Dowelltown, 59.4% of individuals (120) out of the total population between 25 and 64 years of age (202) are in the labor force, with 12.5% or 15 of them being unemployed. The group with the highest labor force participation rate are those with the educational attainment of bachelor's degree or higher, with 92.3% or 24 individuals in the labor force. Within the labor force, individuals with high school diploma education have the highest percentage of unemployment, with 23.7% or 14 of them being unemployed.
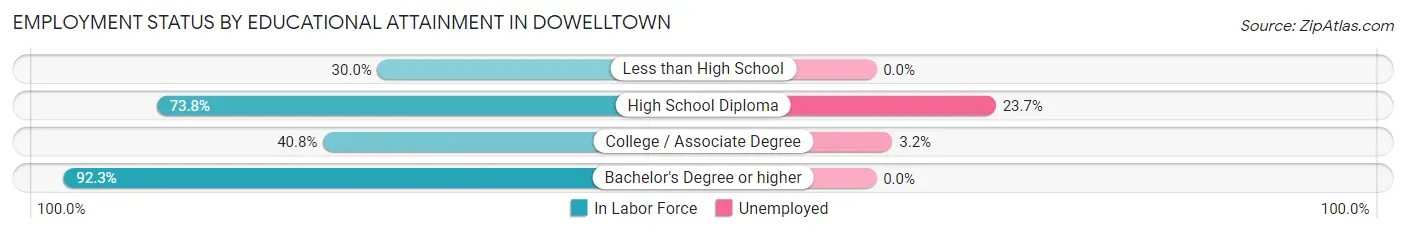
| Educational Attainment | In Labor Force | Unemployed |
| Less than High School | 6 (30.0%) | 0 (0.0%) |
| High School Diploma | 59 (73.8%) | 19 (23.7%) |
| College / Associate Degree | 31 (40.8%) | 2 (3.2%) |
| Bachelor's Degree or higher | 24 (92.3%) | 0 (0.0%) |
| Total | 120 (59.4%) | 25 (12.5%) |
Employment Occupations by Sex in Dowelltown
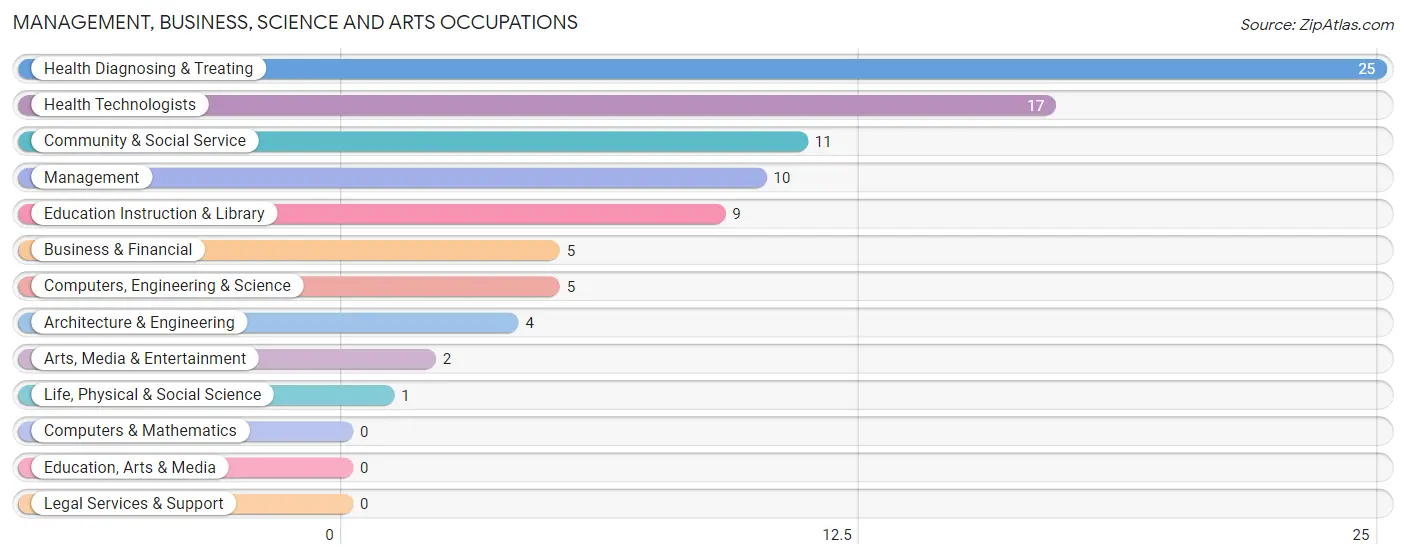
Management, Business, Science and Arts Occupations
The most common Management, Business, Science and Arts occupations in Dowelltown are Health Diagnosing & Treating (25 | 17.4%), Health Technologists (17 | 11.8%), Community & Social Service (11 | 7.6%), Management (10 | 6.9%), and Education Instruction & Library (9 | 6.2%).
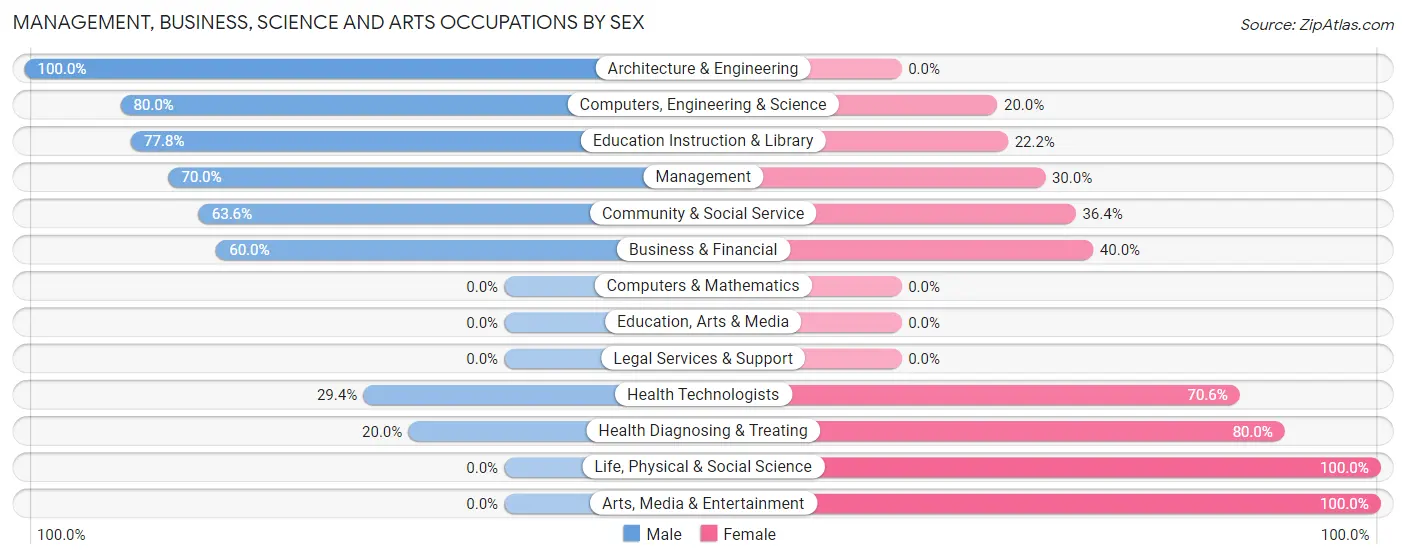
Management, Business, Science and Arts Occupations by Sex
Within the Management, Business, Science and Arts occupations in Dowelltown, the most male-oriented occupations are Architecture & Engineering (100.0%), Computers, Engineering & Science (80.0%), and Education Instruction & Library (77.8%), while the most female-oriented occupations are Life, Physical & Social Science (100.0%), Arts, Media & Entertainment (100.0%), and Health Diagnosing & Treating (80.0%).
| Occupation | Male | Female |
| Management | 7 (70.0%) | 3 (30.0%) |
| Business & Financial | 3 (60.0%) | 2 (40.0%) |
| Computers, Engineering & Science | 4 (80.0%) | 1 (20.0%) |
| Computers & Mathematics | 0 (0.0%) | 0 (0.0%) |
| Architecture & Engineering | 4 (100.0%) | 0 (0.0%) |
| Life, Physical & Social Science | 0 (0.0%) | 1 (100.0%) |
| Community & Social Service | 7 (63.6%) | 4 (36.4%) |
| Education, Arts & Media | 0 (0.0%) | 0 (0.0%) |
| Legal Services & Support | 0 (0.0%) | 0 (0.0%) |
| Education Instruction & Library | 7 (77.8%) | 2 (22.2%) |
| Arts, Media & Entertainment | 0 (0.0%) | 2 (100.0%) |
| Health Diagnosing & Treating | 5 (20.0%) | 20 (80.0%) |
| Health Technologists | 5 (29.4%) | 12 (70.6%) |
| Total (Category) | 26 (46.4%) | 30 (53.6%) |
| Total (Overall) | 92 (63.9%) | 52 (36.1%) |
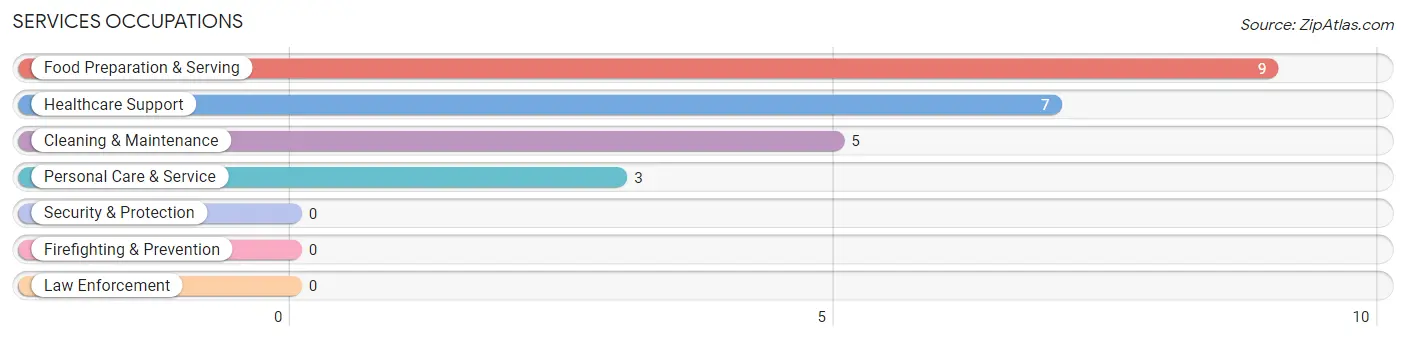
Services Occupations
The most common Services occupations in Dowelltown are Food Preparation & Serving (9 | 6.2%), Healthcare Support (7 | 4.9%), Cleaning & Maintenance (5 | 3.5%), and Personal Care & Service (3 | 2.1%).
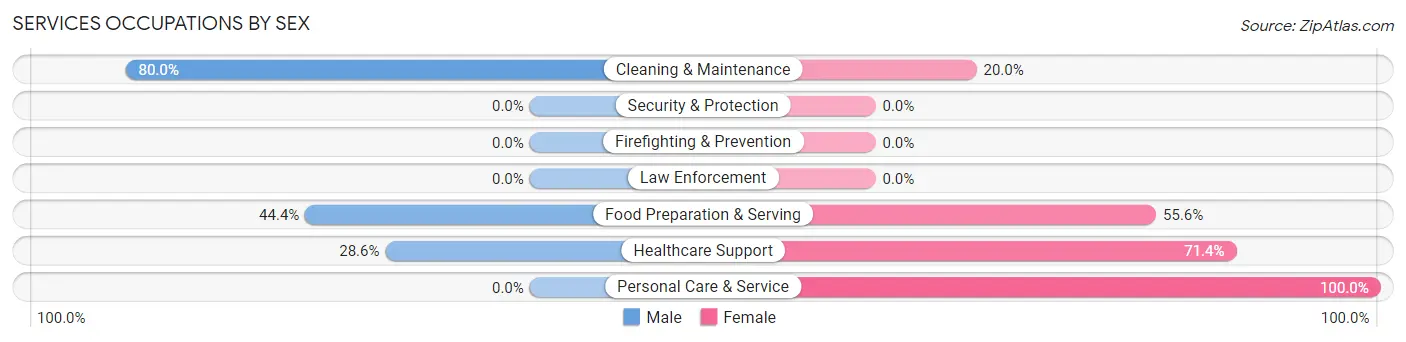
Services Occupations by Sex
Within the Services occupations in Dowelltown, the most male-oriented occupations are Cleaning & Maintenance (80.0%), Food Preparation & Serving (44.4%), and Healthcare Support (28.6%), while the most female-oriented occupations are Personal Care & Service (100.0%), Healthcare Support (71.4%), and Food Preparation & Serving (55.6%).
| Occupation | Male | Female |
| Healthcare Support | 2 (28.6%) | 5 (71.4%) |
| Security & Protection | 0 (0.0%) | 0 (0.0%) |
| Firefighting & Prevention | 0 (0.0%) | 0 (0.0%) |
| Law Enforcement | 0 (0.0%) | 0 (0.0%) |
| Food Preparation & Serving | 4 (44.4%) | 5 (55.6%) |
| Cleaning & Maintenance | 4 (80.0%) | 1 (20.0%) |
| Personal Care & Service | 0 (0.0%) | 3 (100.0%) |
| Total (Category) | 10 (41.7%) | 14 (58.3%) |
| Total (Overall) | 92 (63.9%) | 52 (36.1%) |
Sales and Office Occupations
The most common Sales and Office occupations in Dowelltown are Office & Administration (5 | 3.5%), and Sales & Related (2 | 1.4%).
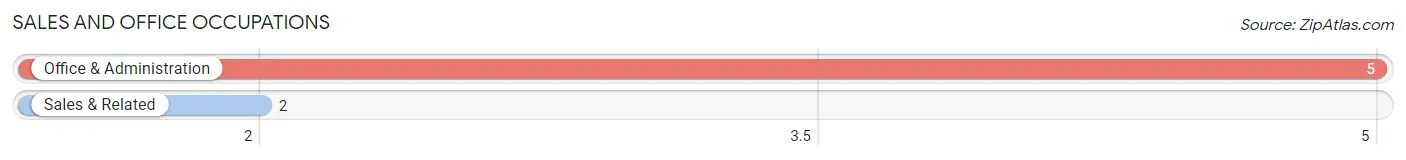
Sales and Office Occupations by Sex
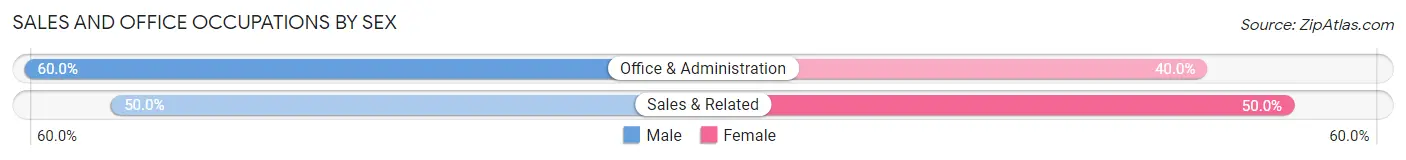
| Occupation | Male | Female |
| Sales & Related | 1 (50.0%) | 1 (50.0%) |
| Office & Administration | 3 (60.0%) | 2 (40.0%) |
| Total (Category) | 4 (57.1%) | 3 (42.9%) |
| Total (Overall) | 92 (63.9%) | 52 (36.1%) |
Natural Resources, Construction and Maintenance Occupations
The most common Natural Resources, Construction and Maintenance occupations in Dowelltown are Construction & Extraction (13 | 9.0%), Installation, Maintenance & Repair (5 | 3.5%), and Farming, Fishing & Forestry (4 | 2.8%).
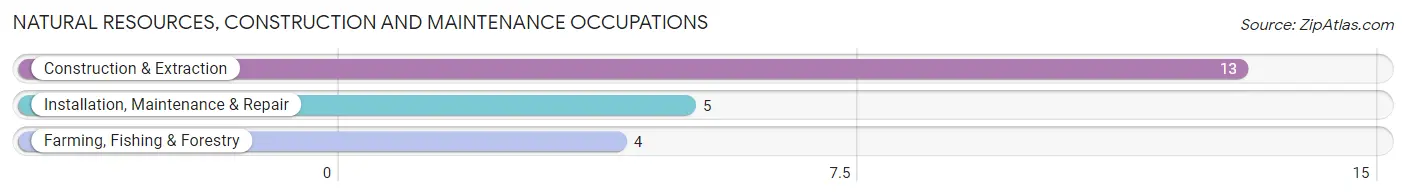
Natural Resources, Construction and Maintenance Occupations by Sex
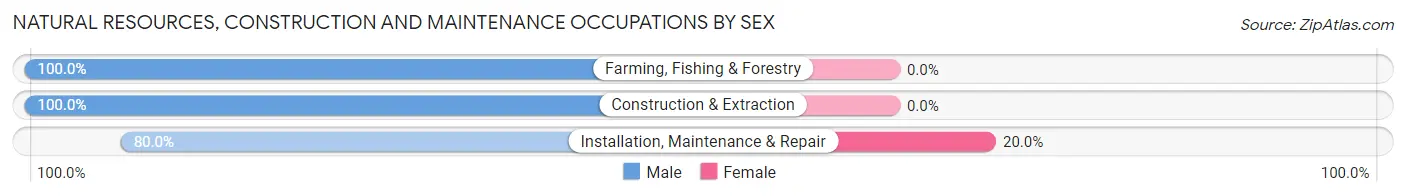
| Occupation | Male | Female |
| Farming, Fishing & Forestry | 4 (100.0%) | 0 (0.0%) |
| Construction & Extraction | 13 (100.0%) | 0 (0.0%) |
| Installation, Maintenance & Repair | 4 (80.0%) | 1 (20.0%) |
| Total (Category) | 21 (95.5%) | 1 (4.5%) |
| Total (Overall) | 92 (63.9%) | 52 (36.1%) |
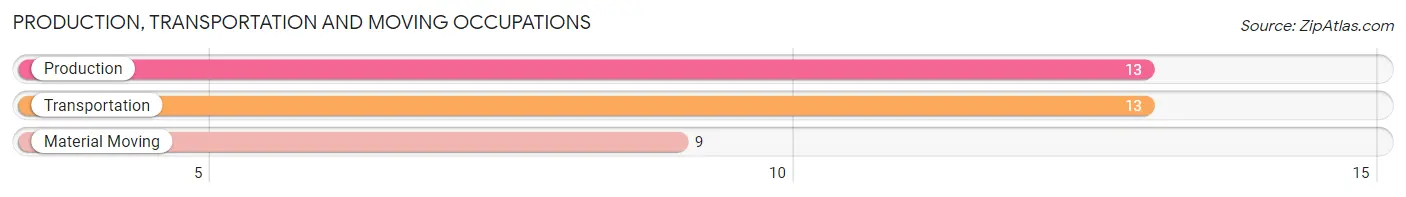
Production, Transportation and Moving Occupations
The most common Production, Transportation and Moving occupations in Dowelltown are Production (13 | 9.0%), Transportation (13 | 9.0%), and Material Moving (9 | 6.2%).
Production, Transportation and Moving Occupations by Sex
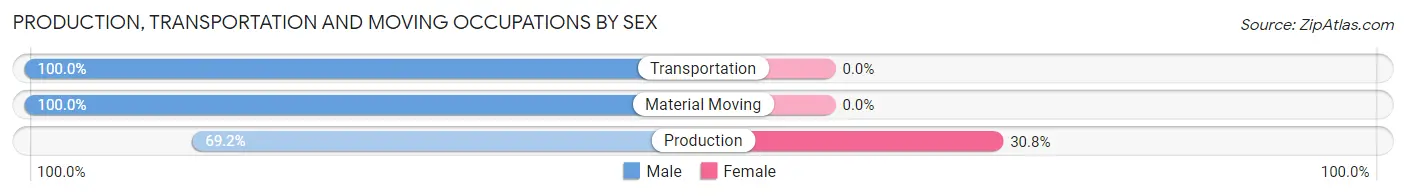
| Occupation | Male | Female |
| Production | 9 (69.2%) | 4 (30.8%) |
| Transportation | 13 (100.0%) | 0 (0.0%) |
| Material Moving | 9 (100.0%) | 0 (0.0%) |
| Total (Category) | 31 (88.6%) | 4 (11.4%) |
| Total (Overall) | 92 (63.9%) | 52 (36.1%) |
Employment Industries by Sex in Dowelltown
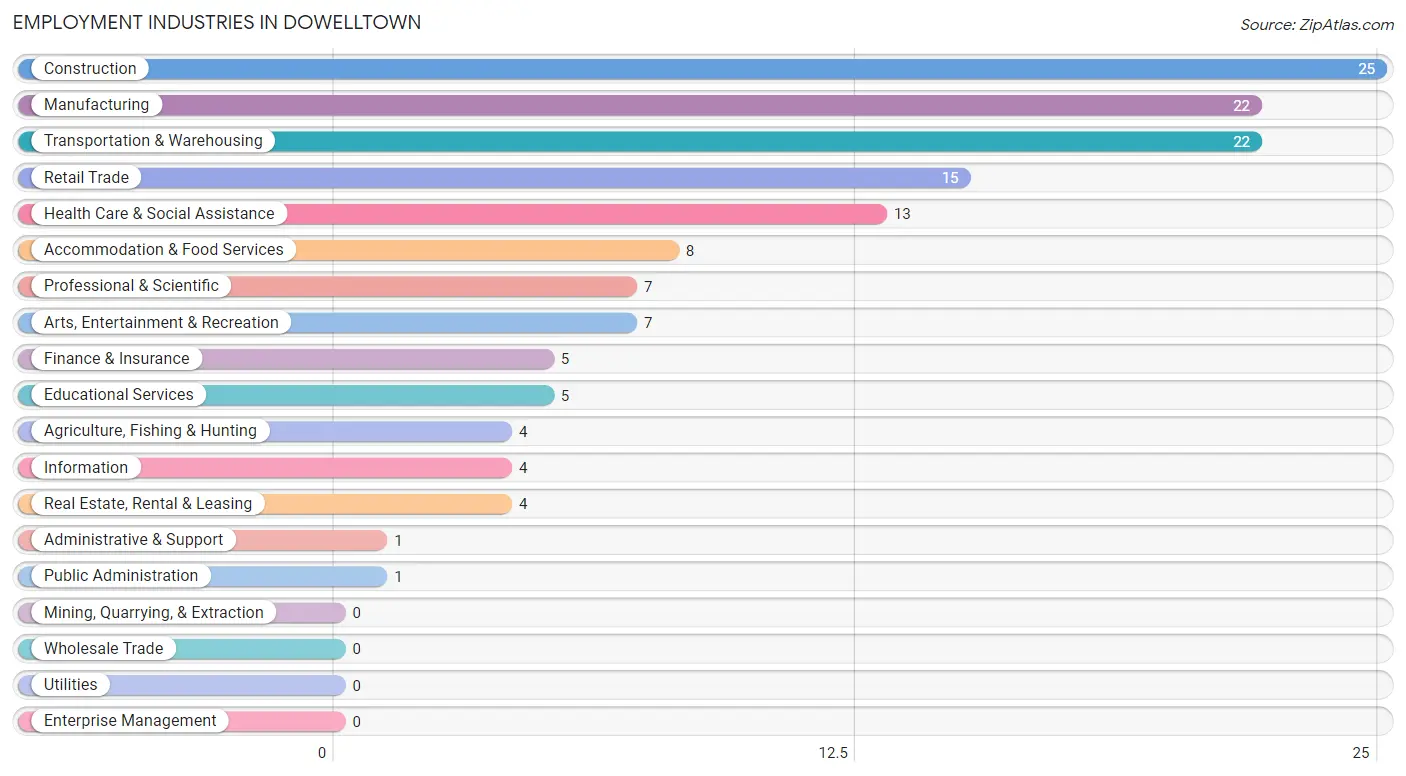
Employment Industries in Dowelltown
The major employment industries in Dowelltown include Construction (25 | 17.4%), Manufacturing (22 | 15.3%), Transportation & Warehousing (22 | 15.3%), Retail Trade (15 | 10.4%), and Health Care & Social Assistance (13 | 9.0%).
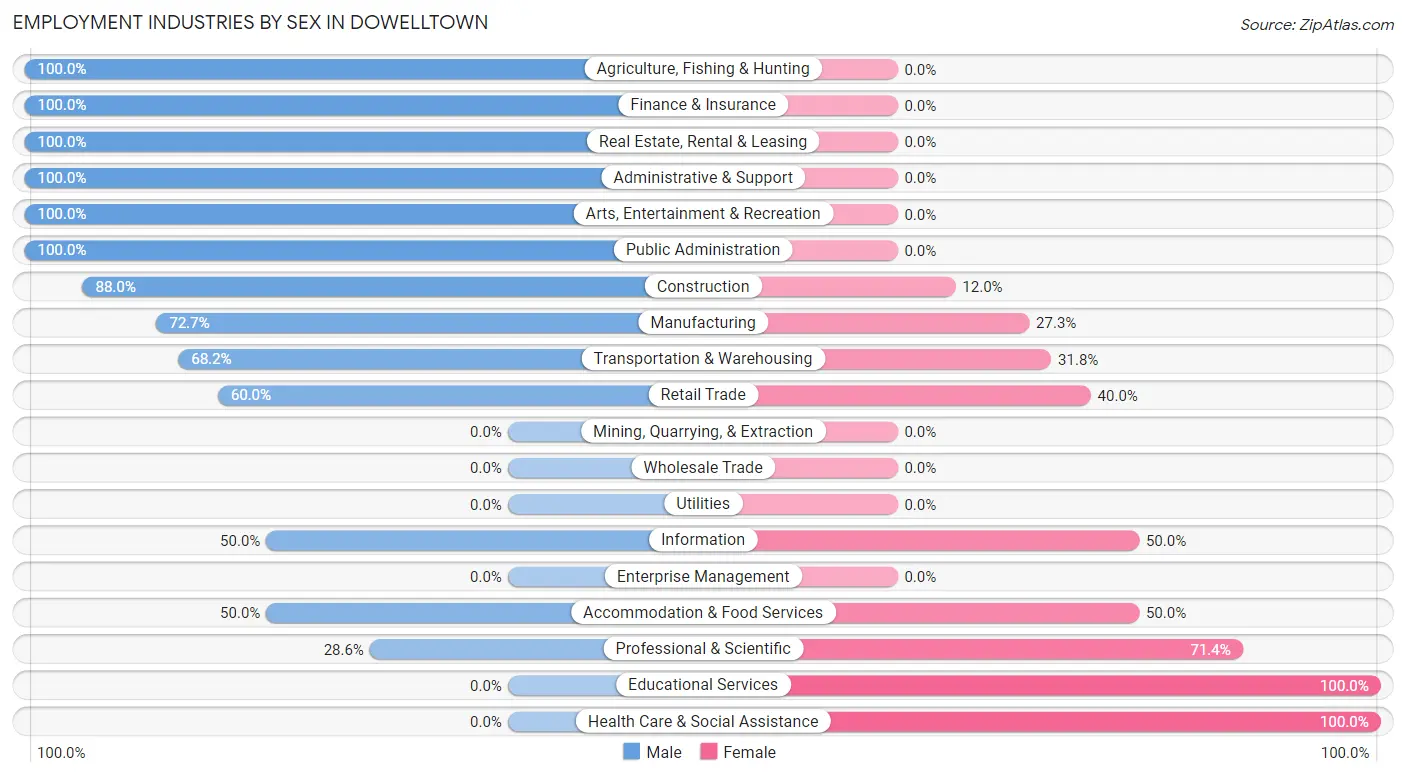
Employment Industries by Sex in Dowelltown
The Dowelltown industries that see more men than women are Agriculture, Fishing & Hunting (100.0%), Finance & Insurance (100.0%), and Real Estate, Rental & Leasing (100.0%), whereas the industries that tend to have a higher number of women are Educational Services (100.0%), Health Care & Social Assistance (100.0%), and Professional & Scientific (71.4%).
| Industry | Male | Female |
| Agriculture, Fishing & Hunting | 4 (100.0%) | 0 (0.0%) |
| Mining, Quarrying, & Extraction | 0 (0.0%) | 0 (0.0%) |
| Construction | 22 (88.0%) | 3 (12.0%) |
| Manufacturing | 16 (72.7%) | 6 (27.3%) |
| Wholesale Trade | 0 (0.0%) | 0 (0.0%) |
| Retail Trade | 9 (60.0%) | 6 (40.0%) |
| Transportation & Warehousing | 15 (68.2%) | 7 (31.8%) |
| Utilities | 0 (0.0%) | 0 (0.0%) |
| Information | 2 (50.0%) | 2 (50.0%) |
| Finance & Insurance | 5 (100.0%) | 0 (0.0%) |
| Real Estate, Rental & Leasing | 4 (100.0%) | 0 (0.0%) |
| Professional & Scientific | 2 (28.6%) | 5 (71.4%) |
| Enterprise Management | 0 (0.0%) | 0 (0.0%) |
| Administrative & Support | 1 (100.0%) | 0 (0.0%) |
| Educational Services | 0 (0.0%) | 5 (100.0%) |
| Health Care & Social Assistance | 0 (0.0%) | 13 (100.0%) |
| Arts, Entertainment & Recreation | 7 (100.0%) | 0 (0.0%) |
| Accommodation & Food Services | 4 (50.0%) | 4 (50.0%) |
| Public Administration | 1 (100.0%) | 0 (0.0%) |
| Total | 92 (63.9%) | 52 (36.1%) |
Education in Dowelltown
School Enrollment in Dowelltown
The most common levels of schooling among the 112 students in Dowelltown are college / undergraduate (50 | 44.6%), high school (20 | 17.9%), and elementary school (19 | 17.0%).
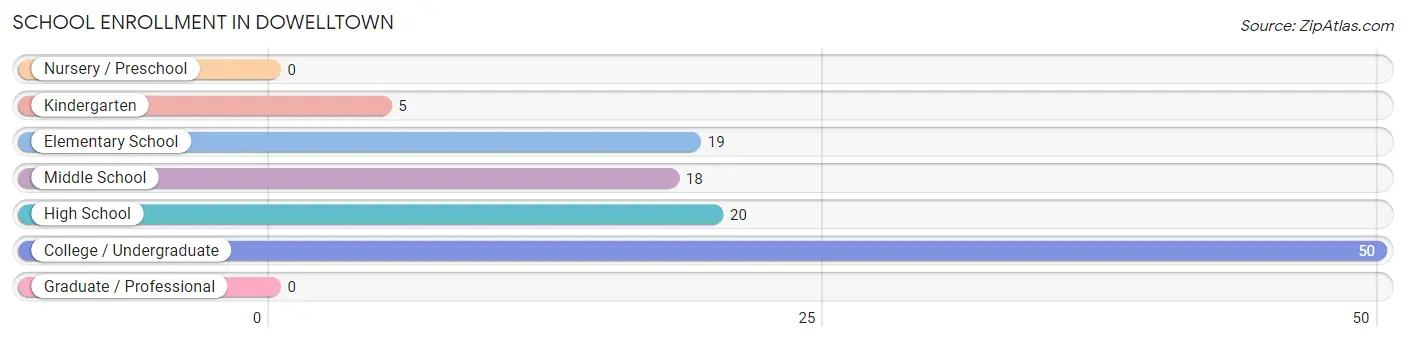
| School Level | # Students | % Students |
| Nursery / Preschool | 0 | 0.0% |
| Kindergarten | 5 | 4.5% |
| Elementary School | 19 | 17.0% |
| Middle School | 18 | 16.1% |
| High School | 20 | 17.9% |
| College / Undergraduate | 50 | 44.6% |
| Graduate / Professional | 0 | 0.0% |
| Total | 112 | 100.0% |
School Enrollment by Age by Funding Source in Dowelltown
Out of a total of 112 students who are enrolled in schools in Dowelltown, 18 (16.1%) attend a private institution, while the remaining 94 (83.9%) are enrolled in public schools. The age group of 35 years and over has the highest likelihood of being enrolled in private schools, with 5 (100.0% in the age bracket) enrolled. Conversely, the age group of 20 to 24 year olds has the lowest likelihood of being enrolled in a private school, with 4 (100.0% in the age bracket) attending a public institution.
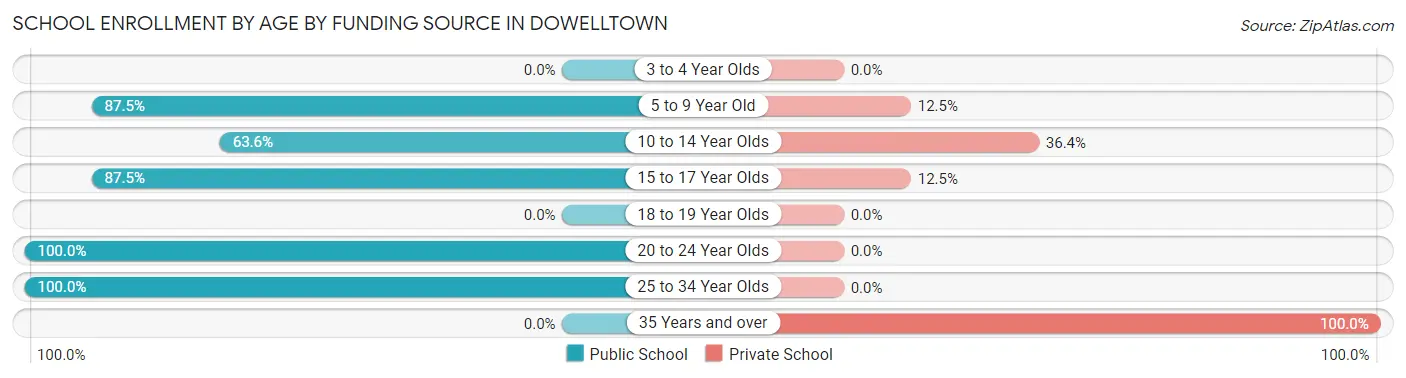
| Age Bracket | Public School | Private School |
| 3 to 4 Year Olds | 0 (0.0%) | 0 (0.0%) |
| 5 to 9 Year Old | 21 (87.5%) | 3 (12.5%) |
| 10 to 14 Year Olds | 14 (63.6%) | 8 (36.4%) |
| 15 to 17 Year Olds | 14 (87.5%) | 2 (12.5%) |
| 18 to 19 Year Olds | 0 (0.0%) | 0 (0.0%) |
| 20 to 24 Year Olds | 4 (100.0%) | 0 (0.0%) |
| 25 to 34 Year Olds | 41 (100.0%) | 0 (0.0%) |
| 35 Years and over | 0 (0.0%) | 5 (100.0%) |
| Total | 94 (83.9%) | 18 (16.1%) |
Educational Attainment by Field of Study in Dowelltown
Science & technology (14 | 42.4%), engineering (4 | 12.1%), business (4 | 12.1%), physical & health sciences (3 | 9.1%), and literature & languages (3 | 9.1%) are the most common fields of study among 33 individuals in Dowelltown who have obtained a bachelor's degree or higher.
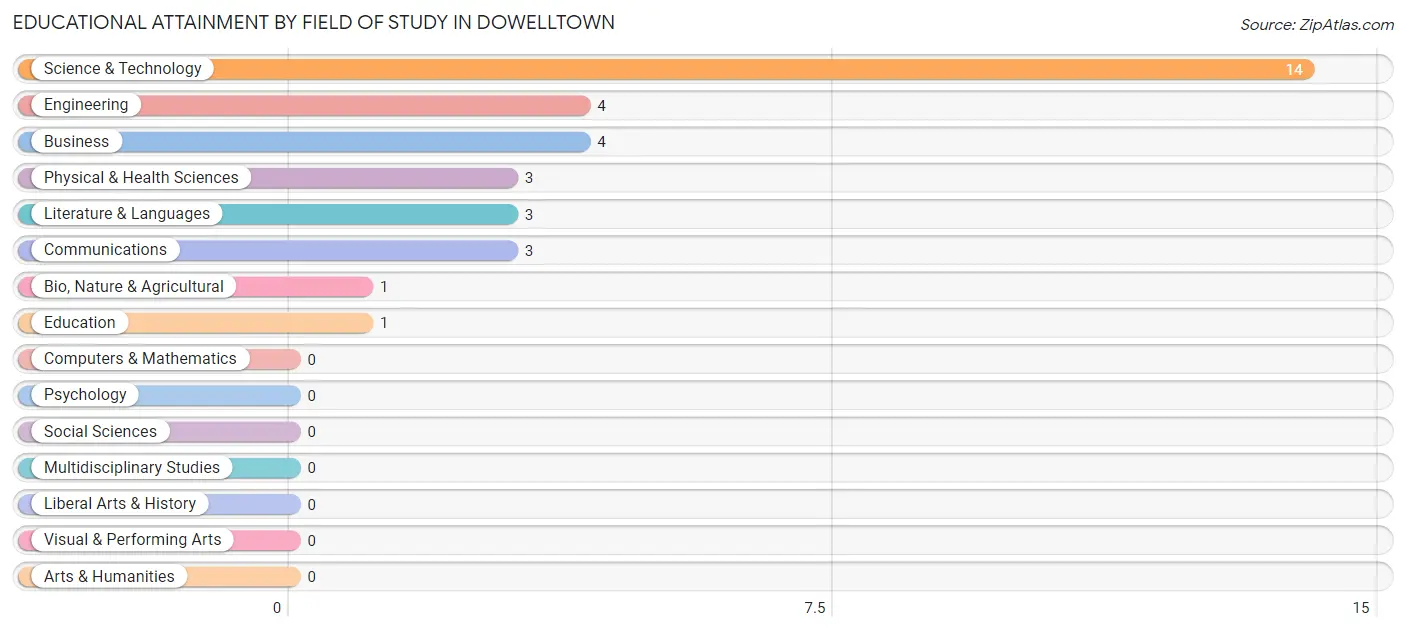
| Field of Study | # Graduates | % Graduates |
| Computers & Mathematics | 0 | 0.0% |
| Bio, Nature & Agricultural | 1 | 3.0% |
| Physical & Health Sciences | 3 | 9.1% |
| Psychology | 0 | 0.0% |
| Social Sciences | 0 | 0.0% |
| Engineering | 4 | 12.1% |
| Multidisciplinary Studies | 0 | 0.0% |
| Science & Technology | 14 | 42.4% |
| Business | 4 | 12.1% |
| Education | 1 | 3.0% |
| Literature & Languages | 3 | 9.1% |
| Liberal Arts & History | 0 | 0.0% |
| Visual & Performing Arts | 0 | 0.0% |
| Communications | 3 | 9.1% |
| Arts & Humanities | 0 | 0.0% |
| Total | 33 | 100.0% |
Transportation & Commute in Dowelltown
Vehicle Availability by Sex in Dowelltown
The most prevalent vehicle ownership categories in Dowelltown are males with 2 vehicles (51, accounting for 55.4%) and females with 2 vehicles (19, making up 108.5%).
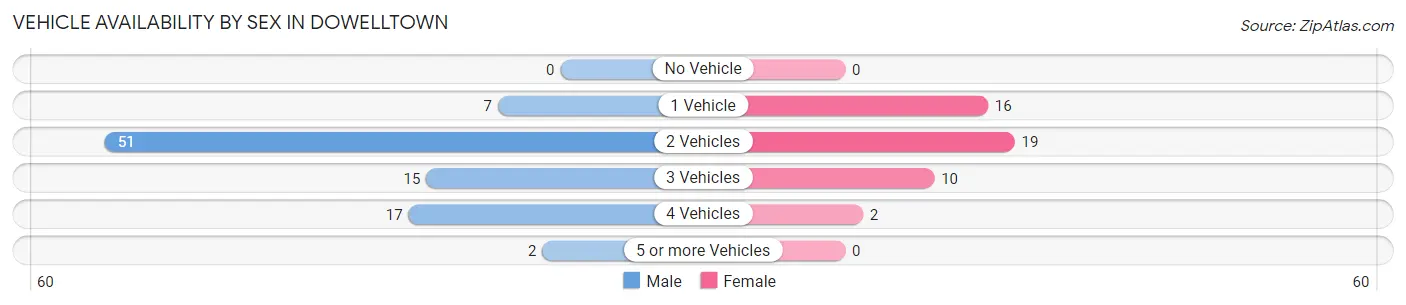
| Vehicles Available | Male | Female |
| No Vehicle | 0 (0.0%) | 0 (0.0%) |
| 1 Vehicle | 7 (7.6%) | 16 (34.0%) |
| 2 Vehicles | 51 (55.4%) | 19 (40.4%) |
| 3 Vehicles | 15 (16.3%) | 10 (21.3%) |
| 4 Vehicles | 17 (18.5%) | 2 (4.3%) |
| 5 or more Vehicles | 2 (2.2%) | 0 (0.0%) |
| Total | 92 (100.0%) | 47 (100.0%) |
Commute Time in Dowelltown
The most frequently occuring commute durations in Dowelltown are 60 to 89 minutes (28 commuters, 21.7%), 15 to 19 minutes (25 commuters, 19.4%), and 90 or more minutes (21 commuters, 16.3%).
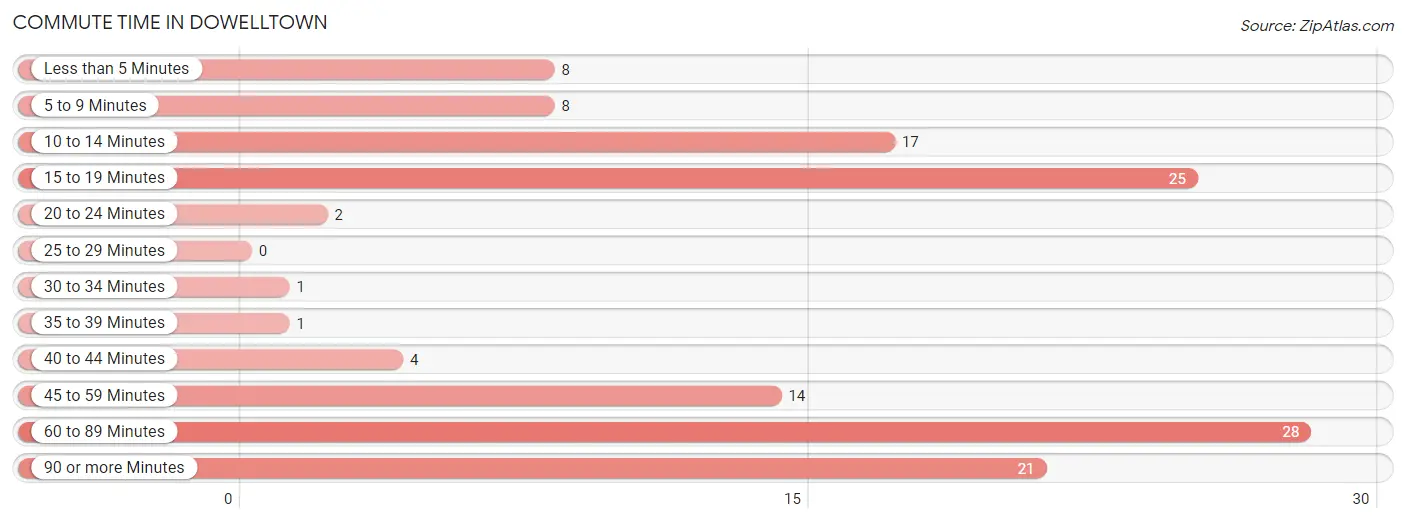
| Commute Time | # Commuters | % Commuters |
| Less than 5 Minutes | 8 | 6.2% |
| 5 to 9 Minutes | 8 | 6.2% |
| 10 to 14 Minutes | 17 | 13.2% |
| 15 to 19 Minutes | 25 | 19.4% |
| 20 to 24 Minutes | 2 | 1.5% |
| 25 to 29 Minutes | 0 | 0.0% |
| 30 to 34 Minutes | 1 | 0.8% |
| 35 to 39 Minutes | 1 | 0.8% |
| 40 to 44 Minutes | 4 | 3.1% |
| 45 to 59 Minutes | 14 | 10.8% |
| 60 to 89 Minutes | 28 | 21.7% |
| 90 or more Minutes | 21 | 16.3% |
Commute Time by Sex in Dowelltown
The most common commute times in Dowelltown are 90 or more minutes (21 commuters, 24.1%) for males and 60 to 89 minutes (14 commuters, 33.3%) for females.
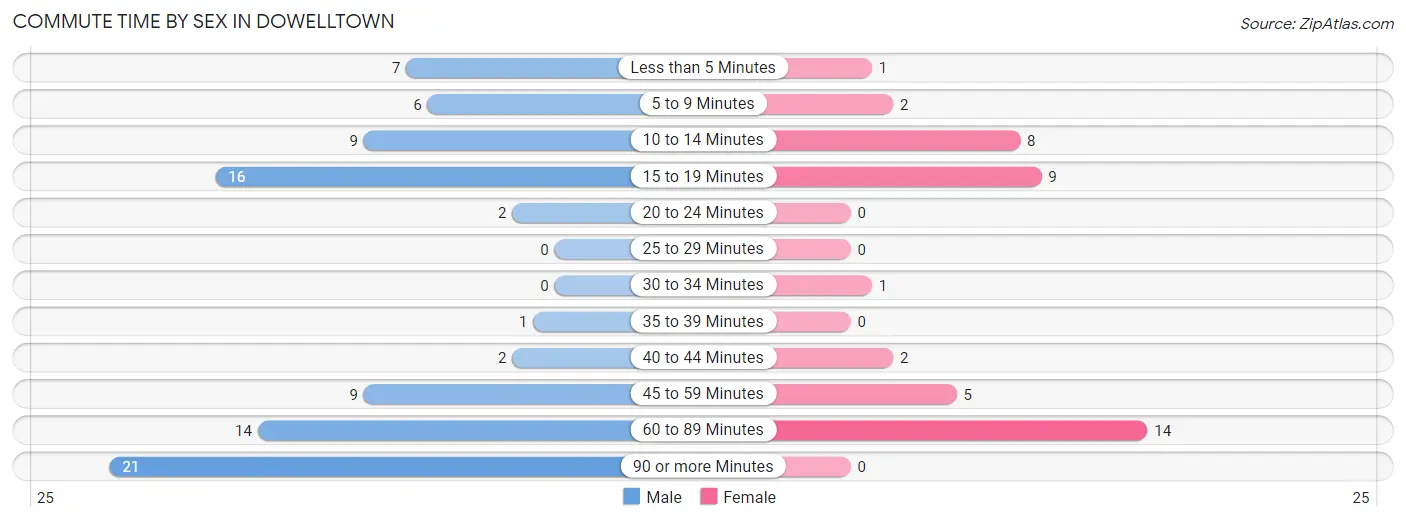
| Commute Time | Male | Female |
| Less than 5 Minutes | 7 (8.1%) | 1 (2.4%) |
| 5 to 9 Minutes | 6 (6.9%) | 2 (4.8%) |
| 10 to 14 Minutes | 9 (10.3%) | 8 (19.1%) |
| 15 to 19 Minutes | 16 (18.4%) | 9 (21.4%) |
| 20 to 24 Minutes | 2 (2.3%) | 0 (0.0%) |
| 25 to 29 Minutes | 0 (0.0%) | 0 (0.0%) |
| 30 to 34 Minutes | 0 (0.0%) | 1 (2.4%) |
| 35 to 39 Minutes | 1 (1.1%) | 0 (0.0%) |
| 40 to 44 Minutes | 2 (2.3%) | 2 (4.8%) |
| 45 to 59 Minutes | 9 (10.3%) | 5 (11.9%) |
| 60 to 89 Minutes | 14 (16.1%) | 14 (33.3%) |
| 90 or more Minutes | 21 (24.1%) | 0 (0.0%) |
Time of Departure to Work by Sex in Dowelltown
The most frequent times of departure to work in Dowelltown are 12:00 AM to 4:59 AM (16, 18.4%) for males and 7:30 AM to 7:59 AM (15, 35.7%) for females.
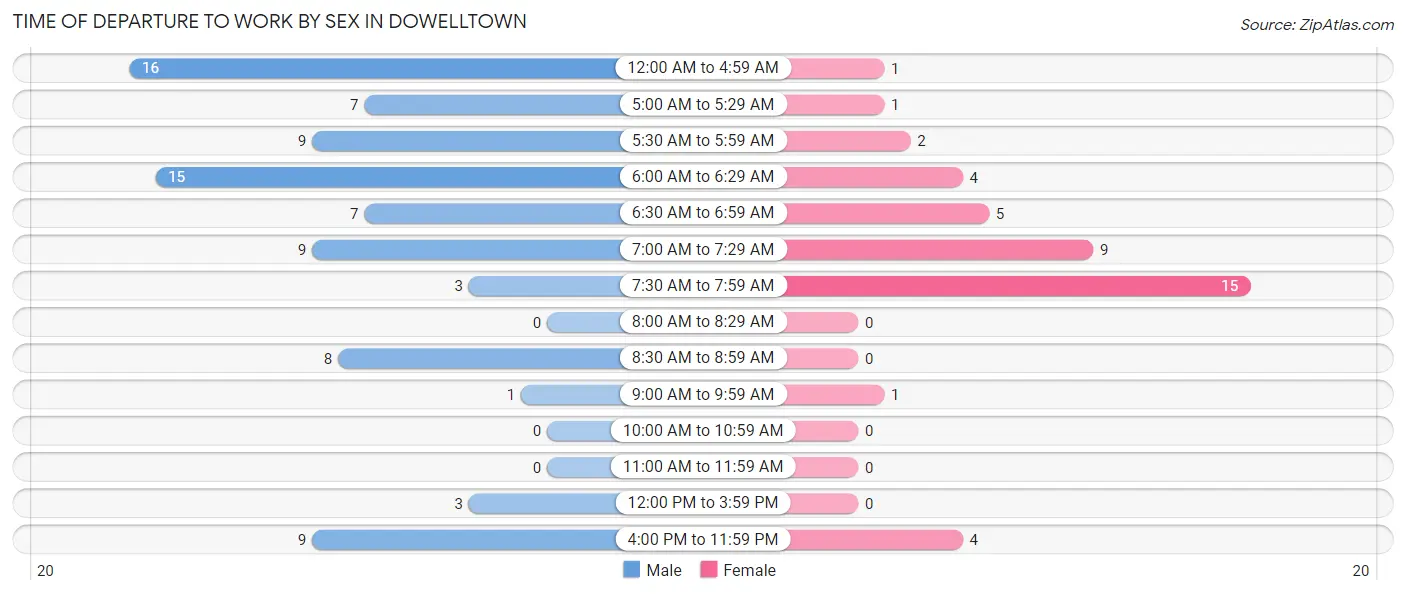
| Time of Departure | Male | Female |
| 12:00 AM to 4:59 AM | 16 (18.4%) | 1 (2.4%) |
| 5:00 AM to 5:29 AM | 7 (8.1%) | 1 (2.4%) |
| 5:30 AM to 5:59 AM | 9 (10.3%) | 2 (4.8%) |
| 6:00 AM to 6:29 AM | 15 (17.2%) | 4 (9.5%) |
| 6:30 AM to 6:59 AM | 7 (8.1%) | 5 (11.9%) |
| 7:00 AM to 7:29 AM | 9 (10.3%) | 9 (21.4%) |
| 7:30 AM to 7:59 AM | 3 (3.5%) | 15 (35.7%) |
| 8:00 AM to 8:29 AM | 0 (0.0%) | 0 (0.0%) |
| 8:30 AM to 8:59 AM | 8 (9.2%) | 0 (0.0%) |
| 9:00 AM to 9:59 AM | 1 (1.1%) | 1 (2.4%) |
| 10:00 AM to 10:59 AM | 0 (0.0%) | 0 (0.0%) |
| 11:00 AM to 11:59 AM | 0 (0.0%) | 0 (0.0%) |
| 12:00 PM to 3:59 PM | 3 (3.5%) | 0 (0.0%) |
| 4:00 PM to 11:59 PM | 9 (10.3%) | 4 (9.5%) |
| Total | 87 (100.0%) | 42 (100.0%) |
Housing Occupancy in Dowelltown
Occupancy by Ownership in Dowelltown
Of the total 137 dwellings in Dowelltown, owner-occupied units account for 103 (75.2%), while renter-occupied units make up 34 (24.8%).
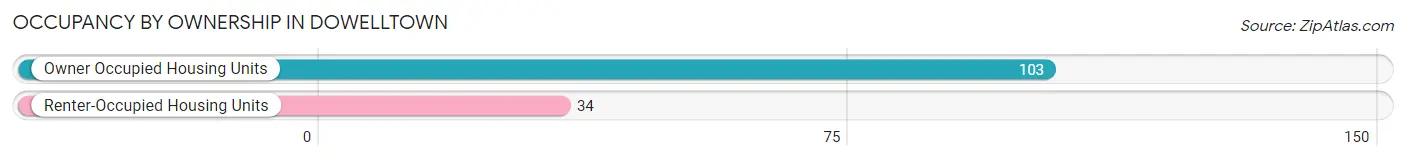
| Occupancy | # Housing Units | % Housing Units |
| Owner Occupied Housing Units | 103 | 75.2% |
| Renter-Occupied Housing Units | 34 | 24.8% |
| Total Occupied Housing Units | 137 | 100.0% |
Occupancy by Household Size in Dowelltown
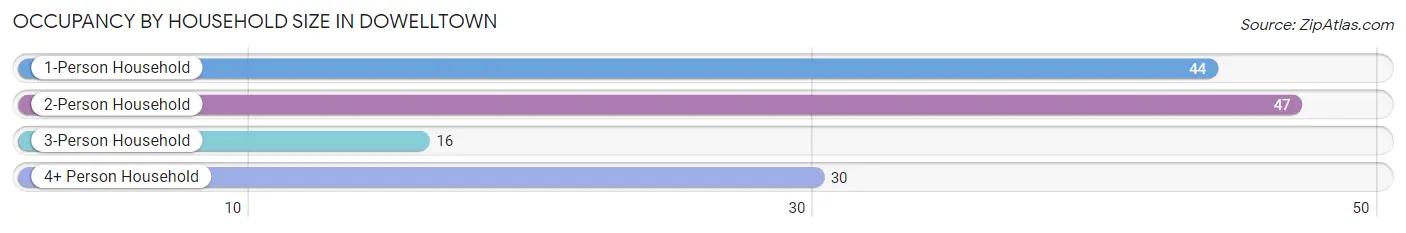
| Household Size | # Housing Units | % Housing Units |
| 1-Person Household | 44 | 32.1% |
| 2-Person Household | 47 | 34.3% |
| 3-Person Household | 16 | 11.7% |
| 4+ Person Household | 30 | 21.9% |
| Total Housing Units | 137 | 100.0% |
Occupancy by Ownership by Household Size in Dowelltown
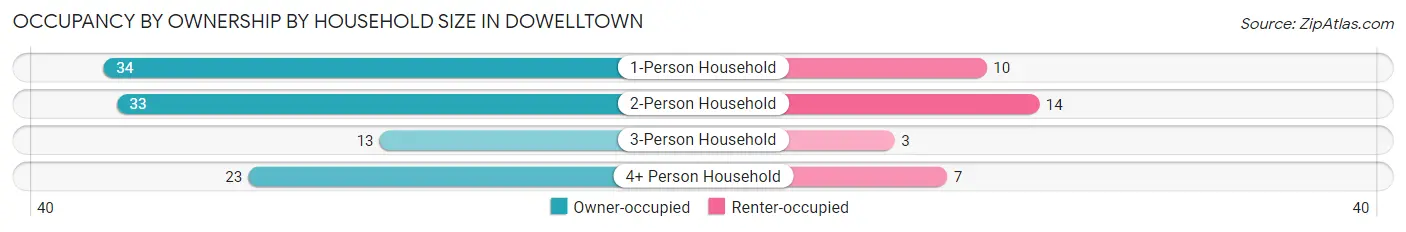
| Household Size | Owner-occupied | Renter-occupied |
| 1-Person Household | 34 (77.3%) | 10 (22.7%) |
| 2-Person Household | 33 (70.2%) | 14 (29.8%) |
| 3-Person Household | 13 (81.2%) | 3 (18.8%) |
| 4+ Person Household | 23 (76.7%) | 7 (23.3%) |
| Total Housing Units | 103 (75.2%) | 34 (24.8%) |
Occupancy by Educational Attainment in Dowelltown
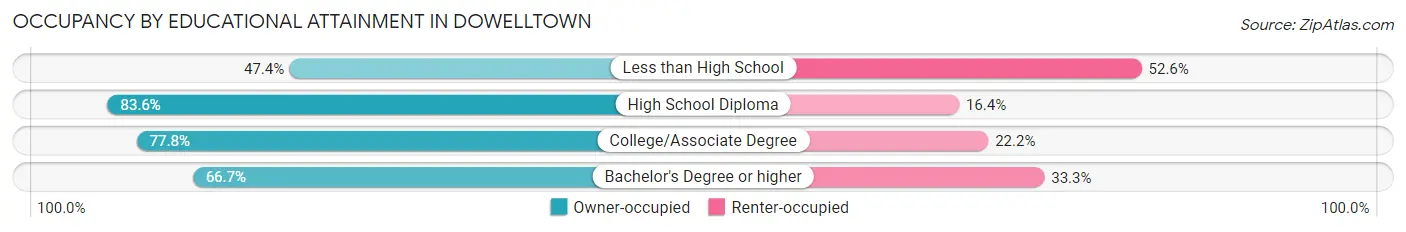
| Household Size | Owner-occupied | Renter-occupied |
| Less than High School | 9 (47.4%) | 10 (52.6%) |
| High School Diploma | 56 (83.6%) | 11 (16.4%) |
| College/Associate Degree | 28 (77.8%) | 8 (22.2%) |
| Bachelor's Degree or higher | 10 (66.7%) | 5 (33.3%) |
Occupancy by Age of Householder in Dowelltown
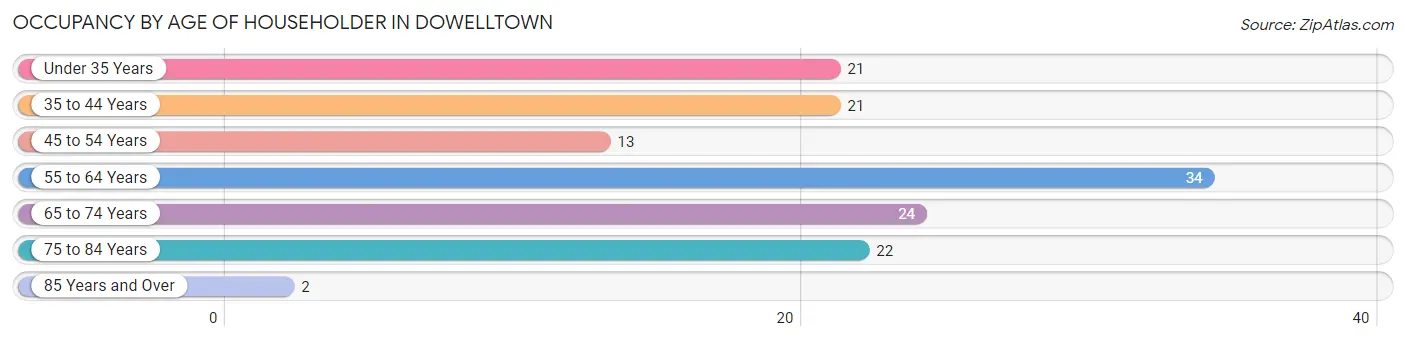
| Age Bracket | # Households | % Households |
| Under 35 Years | 21 | 15.3% |
| 35 to 44 Years | 21 | 15.3% |
| 45 to 54 Years | 13 | 9.5% |
| 55 to 64 Years | 34 | 24.8% |
| 65 to 74 Years | 24 | 17.5% |
| 75 to 84 Years | 22 | 16.1% |
| 85 Years and Over | 2 | 1.5% |
| Total | 137 | 100.0% |
Housing Finances in Dowelltown
Median Income by Occupancy in Dowelltown
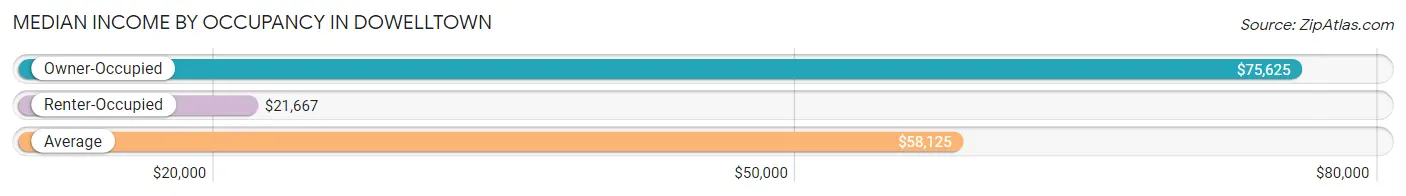
| Occupancy Type | # Households | Median Income |
| Owner-Occupied | 103 (75.2%) | $75,625 |
| Renter-Occupied | 34 (24.8%) | $21,667 |
| Average | 137 (100.0%) | $58,125 |
Occupancy by Householder Income Bracket in Dowelltown
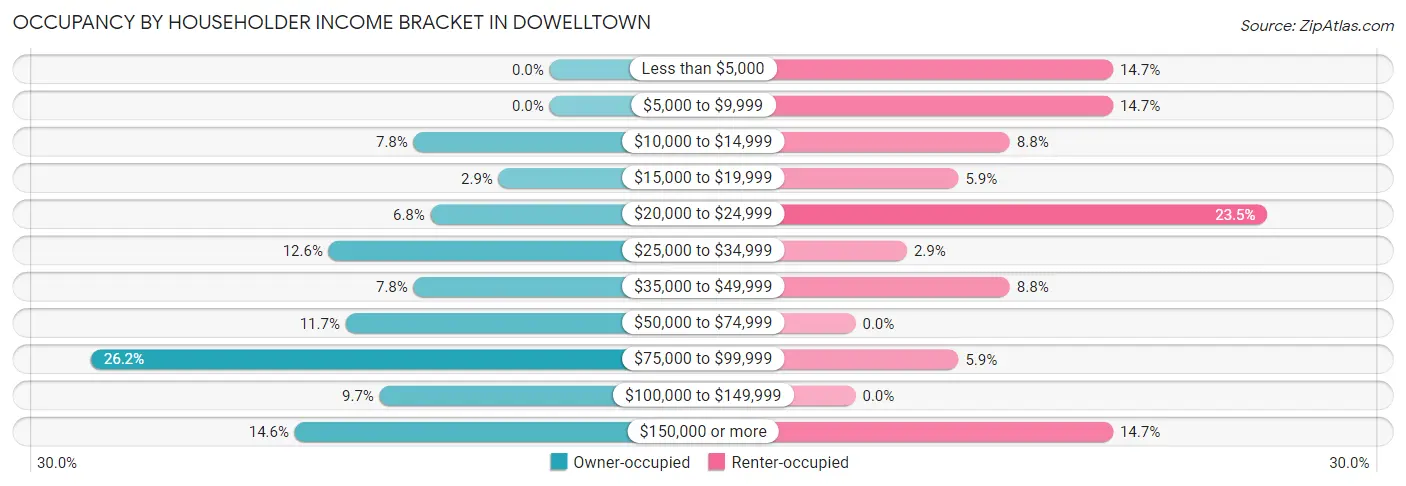
| Income Bracket | Owner-occupied | Renter-occupied |
| Less than $5,000 | 0 (0.0%) | 5 (14.7%) |
| $5,000 to $9,999 | 0 (0.0%) | 5 (14.7%) |
| $10,000 to $14,999 | 8 (7.8%) | 3 (8.8%) |
| $15,000 to $19,999 | 3 (2.9%) | 2 (5.9%) |
| $20,000 to $24,999 | 7 (6.8%) | 8 (23.5%) |
| $25,000 to $34,999 | 13 (12.6%) | 1 (2.9%) |
| $35,000 to $49,999 | 8 (7.8%) | 3 (8.8%) |
| $50,000 to $74,999 | 12 (11.7%) | 0 (0.0%) |
| $75,000 to $99,999 | 27 (26.2%) | 2 (5.9%) |
| $100,000 to $149,999 | 10 (9.7%) | 0 (0.0%) |
| $150,000 or more | 15 (14.6%) | 5 (14.7%) |
| Total | 103 (100.0%) | 34 (100.0%) |
Monthly Housing Cost Tiers in Dowelltown
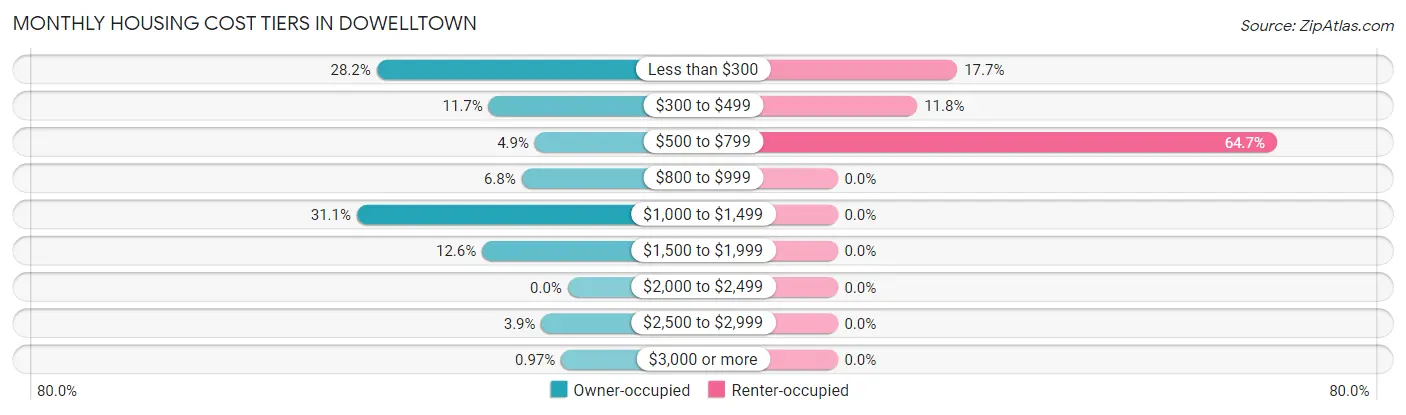
| Monthly Cost | Owner-occupied | Renter-occupied |
| Less than $300 | 29 (28.2%) | 6 (17.6%) |
| $300 to $499 | 12 (11.7%) | 4 (11.8%) |
| $500 to $799 | 5 (4.9%) | 22 (64.7%) |
| $800 to $999 | 7 (6.8%) | 0 (0.0%) |
| $1,000 to $1,499 | 32 (31.1%) | 0 (0.0%) |
| $1,500 to $1,999 | 13 (12.6%) | 0 (0.0%) |
| $2,000 to $2,499 | 0 (0.0%) | 0 (0.0%) |
| $2,500 to $2,999 | 4 (3.9%) | 0 (0.0%) |
| $3,000 or more | 1 (1.0%) | 0 (0.0%) |
| Total | 103 (100.0%) | 34 (100.0%) |
Physical Housing Characteristics in Dowelltown
Housing Structures in Dowelltown
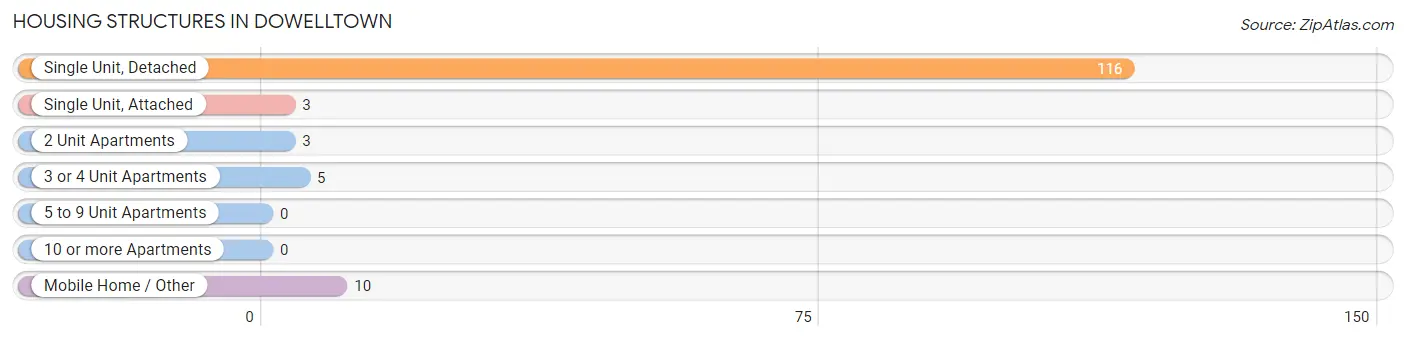
| Structure Type | # Housing Units | % Housing Units |
| Single Unit, Detached | 116 | 84.7% |
| Single Unit, Attached | 3 | 2.2% |
| 2 Unit Apartments | 3 | 2.2% |
| 3 or 4 Unit Apartments | 5 | 3.6% |
| 5 to 9 Unit Apartments | 0 | 0.0% |
| 10 or more Apartments | 0 | 0.0% |
| Mobile Home / Other | 10 | 7.3% |
| Total | 137 | 100.0% |
Housing Structures by Occupancy in Dowelltown
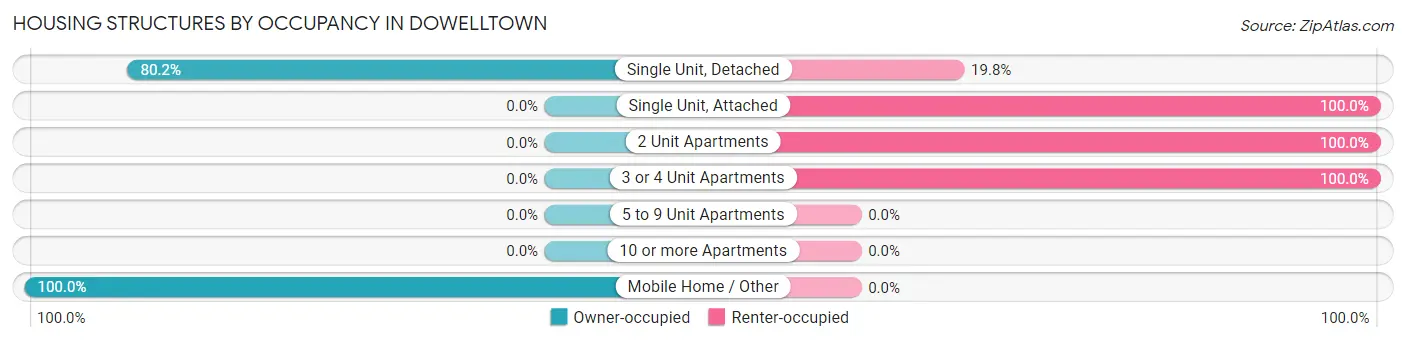
| Structure Type | Owner-occupied | Renter-occupied |
| Single Unit, Detached | 93 (80.2%) | 23 (19.8%) |
| Single Unit, Attached | 0 (0.0%) | 3 (100.0%) |
| 2 Unit Apartments | 0 (0.0%) | 3 (100.0%) |
| 3 or 4 Unit Apartments | 0 (0.0%) | 5 (100.0%) |
| 5 to 9 Unit Apartments | 0 (0.0%) | 0 (0.0%) |
| 10 or more Apartments | 0 (0.0%) | 0 (0.0%) |
| Mobile Home / Other | 10 (100.0%) | 0 (0.0%) |
| Total | 103 (75.2%) | 34 (24.8%) |
Housing Structures by Number of Rooms in Dowelltown
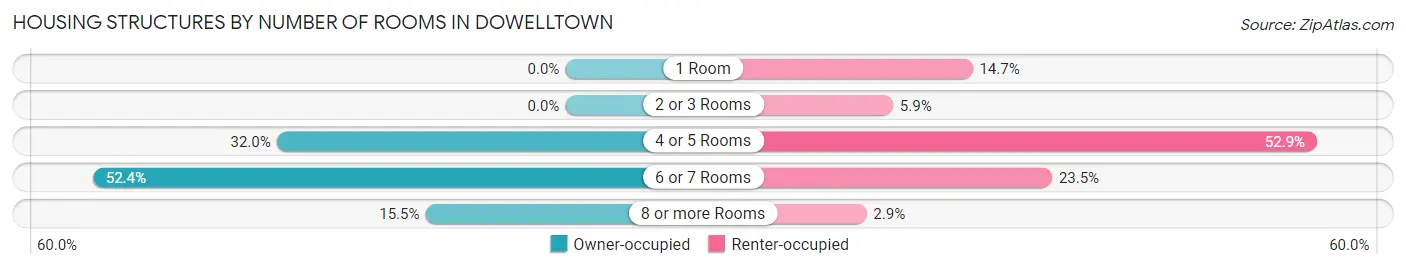
| Number of Rooms | Owner-occupied | Renter-occupied |
| 1 Room | 0 (0.0%) | 5 (14.7%) |
| 2 or 3 Rooms | 0 (0.0%) | 2 (5.9%) |
| 4 or 5 Rooms | 33 (32.0%) | 18 (52.9%) |
| 6 or 7 Rooms | 54 (52.4%) | 8 (23.5%) |
| 8 or more Rooms | 16 (15.5%) | 1 (2.9%) |
| Total | 103 (100.0%) | 34 (100.0%) |
Housing Structure by Heating Type in Dowelltown
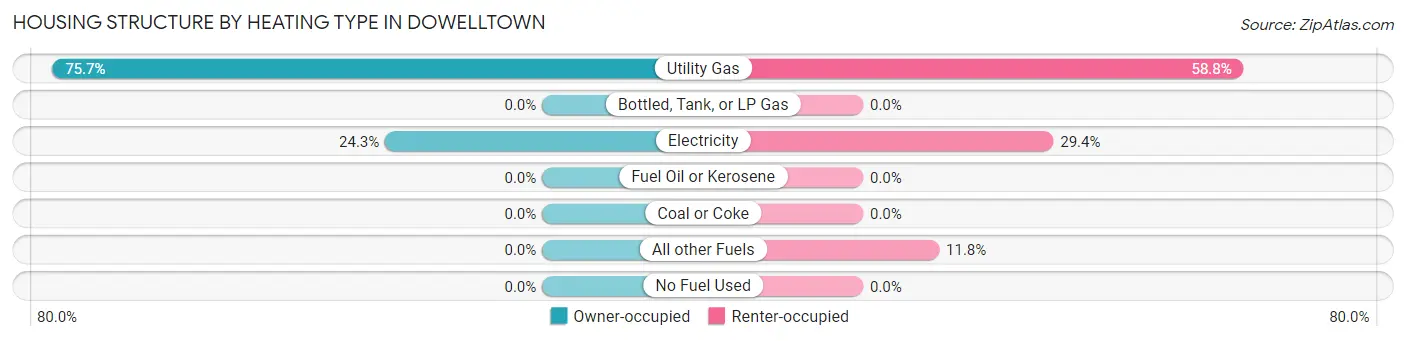
| Heating Type | Owner-occupied | Renter-occupied |
| Utility Gas | 78 (75.7%) | 20 (58.8%) |
| Bottled, Tank, or LP Gas | 0 (0.0%) | 0 (0.0%) |
| Electricity | 25 (24.3%) | 10 (29.4%) |
| Fuel Oil or Kerosene | 0 (0.0%) | 0 (0.0%) |
| Coal or Coke | 0 (0.0%) | 0 (0.0%) |
| All other Fuels | 0 (0.0%) | 4 (11.8%) |
| No Fuel Used | 0 (0.0%) | 0 (0.0%) |
| Total | 103 (100.0%) | 34 (100.0%) |
Household Vehicle Usage in Dowelltown
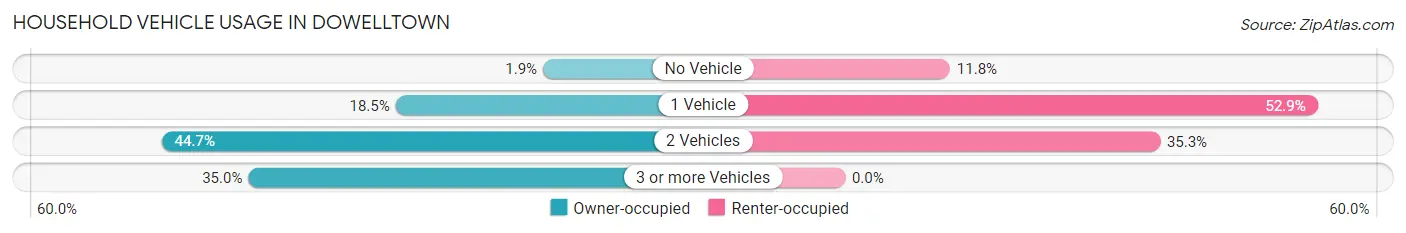
| Vehicles per Household | Owner-occupied | Renter-occupied |
| No Vehicle | 2 (1.9%) | 4 (11.8%) |
| 1 Vehicle | 19 (18.4%) | 18 (52.9%) |
| 2 Vehicles | 46 (44.7%) | 12 (35.3%) |
| 3 or more Vehicles | 36 (34.9%) | 0 (0.0%) |
| Total | 103 (100.0%) | 34 (100.0%) |
Real Estate & Mortgages in Dowelltown
Real Estate and Mortgage Overview in Dowelltown
| Characteristic | Without Mortgage | With Mortgage |
| Housing Units | 45 | 58 |
| Median Property Value | $109,400 | $168,100 |
| Median Household Income | - | - |
| Monthly Housing Costs | $273 | $0 |
| Real Estate Taxes | $392 | $4 |
Property Value by Mortgage Status in Dowelltown
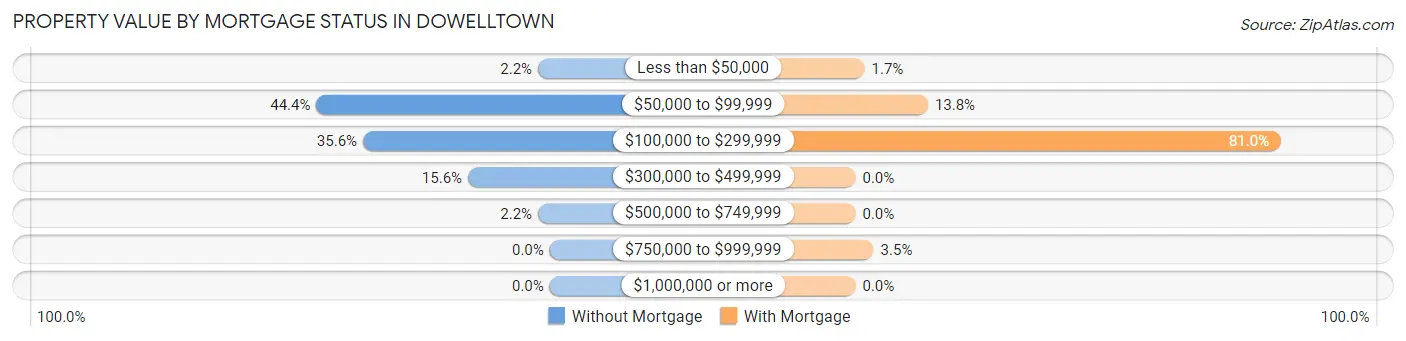
| Property Value | Without Mortgage | With Mortgage |
| Less than $50,000 | 1 (2.2%) | 1 (1.7%) |
| $50,000 to $99,999 | 20 (44.4%) | 8 (13.8%) |
| $100,000 to $299,999 | 16 (35.6%) | 47 (81.0%) |
| $300,000 to $499,999 | 7 (15.6%) | 0 (0.0%) |
| $500,000 to $749,999 | 1 (2.2%) | 0 (0.0%) |
| $750,000 to $999,999 | 0 (0.0%) | 2 (3.5%) |
| $1,000,000 or more | 0 (0.0%) | 0 (0.0%) |
| Total | 45 (100.0%) | 58 (100.0%) |
Household Income by Mortgage Status in Dowelltown
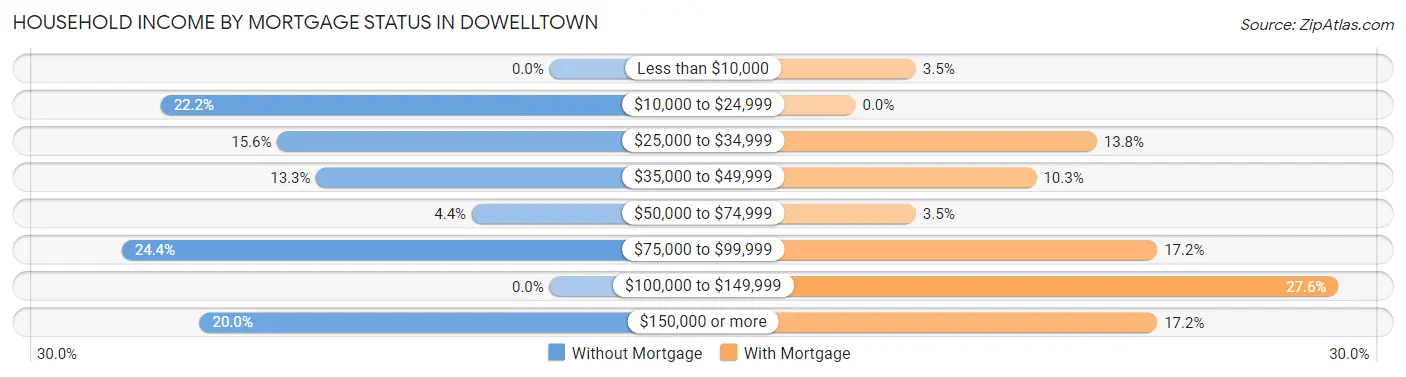
| Household Income | Without Mortgage | With Mortgage |
| Less than $10,000 | 0 (0.0%) | 2 (3.5%) |
| $10,000 to $24,999 | 10 (22.2%) | 0 (0.0%) |
| $25,000 to $34,999 | 7 (15.6%) | 8 (13.8%) |
| $35,000 to $49,999 | 6 (13.3%) | 6 (10.3%) |
| $50,000 to $74,999 | 2 (4.4%) | 2 (3.5%) |
| $75,000 to $99,999 | 11 (24.4%) | 10 (17.2%) |
| $100,000 to $149,999 | 0 (0.0%) | 16 (27.6%) |
| $150,000 or more | 9 (20.0%) | 10 (17.2%) |
| Total | 45 (100.0%) | 58 (100.0%) |
Property Value to Household Income Ratio in Dowelltown
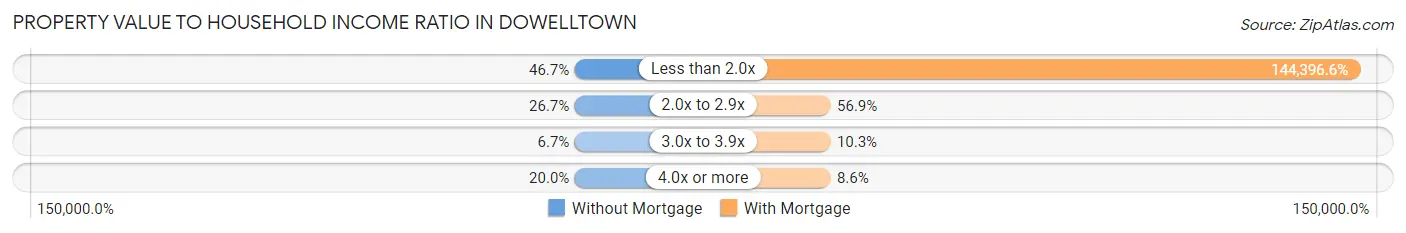
| Value-to-Income Ratio | Without Mortgage | With Mortgage |
| Less than 2.0x | 21 (46.7%) | 83,750 (144,396.6%) |
| 2.0x to 2.9x | 12 (26.7%) | 33 (56.9%) |
| 3.0x to 3.9x | 3 (6.7%) | 6 (10.3%) |
| 4.0x or more | 9 (20.0%) | 5 (8.6%) |
| Total | 45 (100.0%) | 58 (100.0%) |
Real Estate Taxes by Mortgage Status in Dowelltown
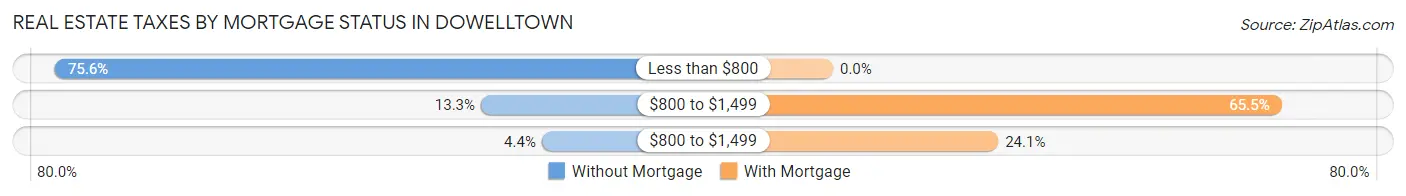
| Property Taxes | Without Mortgage | With Mortgage |
| Less than $800 | 34 (75.6%) | 0 (0.0%) |
| $800 to $1,499 | 6 (13.3%) | 38 (65.5%) |
| $800 to $1,499 | 2 (4.4%) | 14 (24.1%) |
| Total | 45 (100.0%) | 58 (100.0%) |
Health & Disability in Dowelltown
Health Insurance Coverage by Age in Dowelltown
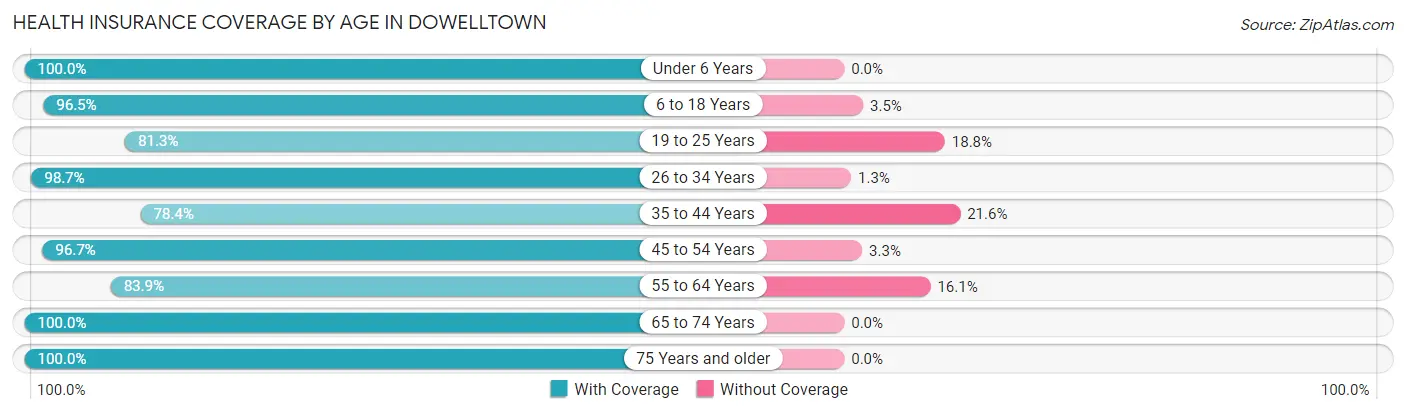
| Age Bracket | With Coverage | Without Coverage |
| Under 6 Years | 18 (100.0%) | 0 (0.0%) |
| 6 to 18 Years | 55 (96.5%) | 2 (3.5%) |
| 19 to 25 Years | 13 (81.2%) | 3 (18.8%) |
| 26 to 34 Years | 78 (98.7%) | 1 (1.3%) |
| 35 to 44 Years | 29 (78.4%) | 8 (21.6%) |
| 45 to 54 Years | 29 (96.7%) | 1 (3.3%) |
| 55 to 64 Years | 47 (83.9%) | 9 (16.1%) |
| 65 to 74 Years | 36 (100.0%) | 0 (0.0%) |
| 75 Years and older | 26 (100.0%) | 0 (0.0%) |
| Total | 331 (93.2%) | 24 (6.8%) |
Health Insurance Coverage by Citizenship Status in Dowelltown
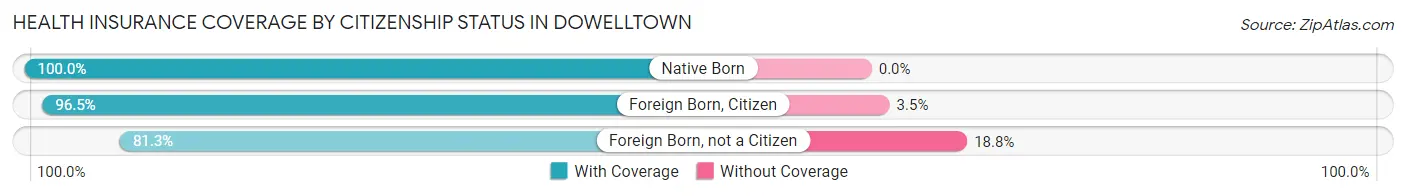
| Citizenship Status | With Coverage | Without Coverage |
| Native Born | 18 (100.0%) | 0 (0.0%) |
| Foreign Born, Citizen | 55 (96.5%) | 2 (3.5%) |
| Foreign Born, not a Citizen | 13 (81.2%) | 3 (18.8%) |
Health Insurance Coverage by Household Income in Dowelltown
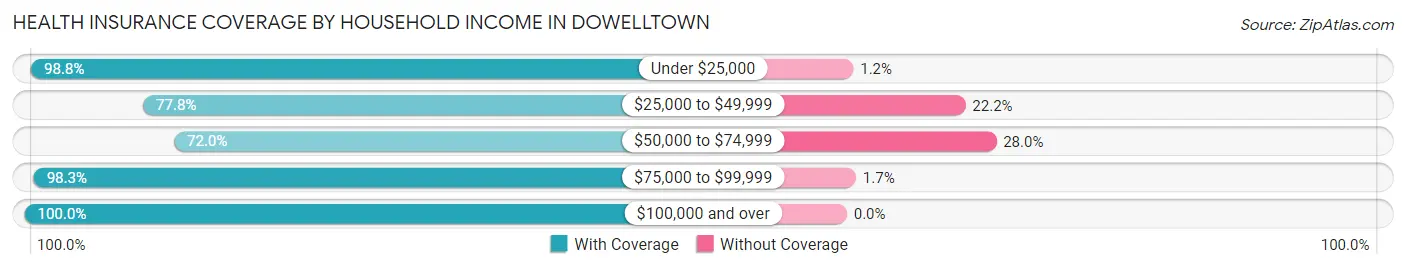
| Household Income | With Coverage | Without Coverage |
| Under $25,000 | 81 (98.8%) | 1 (1.2%) |
| $25,000 to $49,999 | 49 (77.8%) | 14 (22.2%) |
| $50,000 to $74,999 | 18 (72.0%) | 7 (28.0%) |
| $75,000 to $99,999 | 115 (98.3%) | 2 (1.7%) |
| $100,000 and over | 68 (100.0%) | 0 (0.0%) |
Public vs Private Health Insurance Coverage by Age in Dowelltown
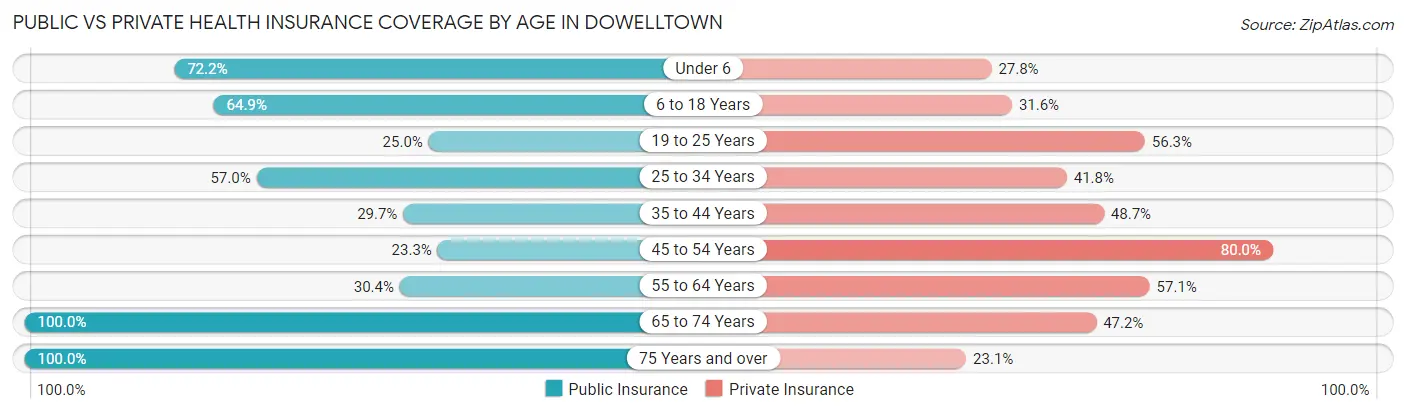
| Age Bracket | Public Insurance | Private Insurance |
| Under 6 | 13 (72.2%) | 5 (27.8%) |
| 6 to 18 Years | 37 (64.9%) | 18 (31.6%) |
| 19 to 25 Years | 4 (25.0%) | 9 (56.2%) |
| 25 to 34 Years | 45 (57.0%) | 33 (41.8%) |
| 35 to 44 Years | 11 (29.7%) | 18 (48.6%) |
| 45 to 54 Years | 7 (23.3%) | 24 (80.0%) |
| 55 to 64 Years | 17 (30.4%) | 32 (57.1%) |
| 65 to 74 Years | 36 (100.0%) | 17 (47.2%) |
| 75 Years and over | 26 (100.0%) | 6 (23.1%) |
| Total | 196 (55.2%) | 162 (45.6%) |
Disability Status by Sex by Age in Dowelltown
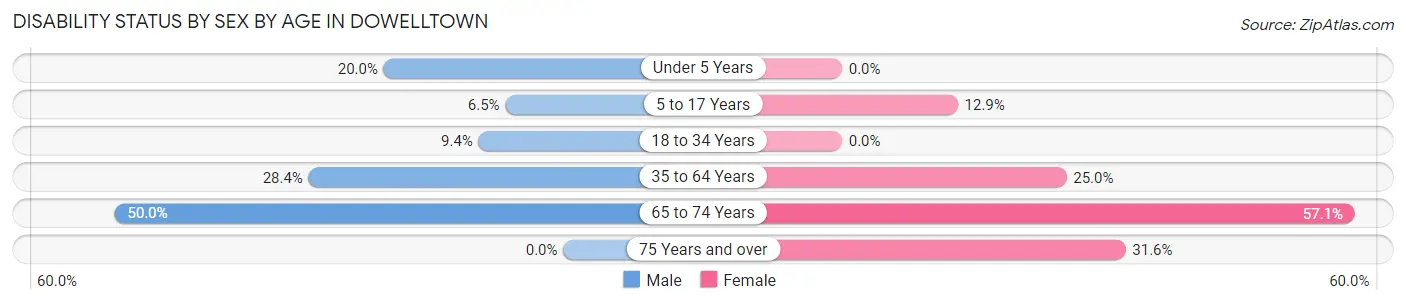
| Age Bracket | Male | Female |
| Under 5 Years | 2 (20.0%) | 0 (0.0%) |
| 5 to 17 Years | 2 (6.5%) | 4 (12.9%) |
| 18 to 34 Years | 5 (9.4%) | 0 (0.0%) |
| 35 to 64 Years | 19 (28.4%) | 14 (25.0%) |
| 65 to 74 Years | 11 (50.0%) | 8 (57.1%) |
| 75 Years and over | 0 (0.0%) | 6 (31.6%) |
Disability Class by Sex by Age in Dowelltown
Disability Class: Hearing Difficulty
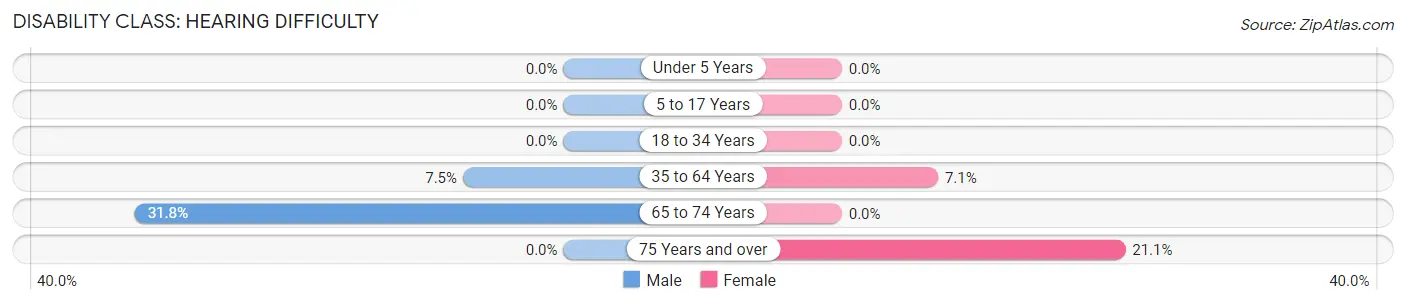
| Age Bracket | Male | Female |
| Under 5 Years | 0 (0.0%) | 0 (0.0%) |
| 5 to 17 Years | 0 (0.0%) | 0 (0.0%) |
| 18 to 34 Years | 0 (0.0%) | 0 (0.0%) |
| 35 to 64 Years | 5 (7.5%) | 4 (7.1%) |
| 65 to 74 Years | 7 (31.8%) | 0 (0.0%) |
| 75 Years and over | 0 (0.0%) | 4 (21.0%) |
Disability Class: Vision Difficulty
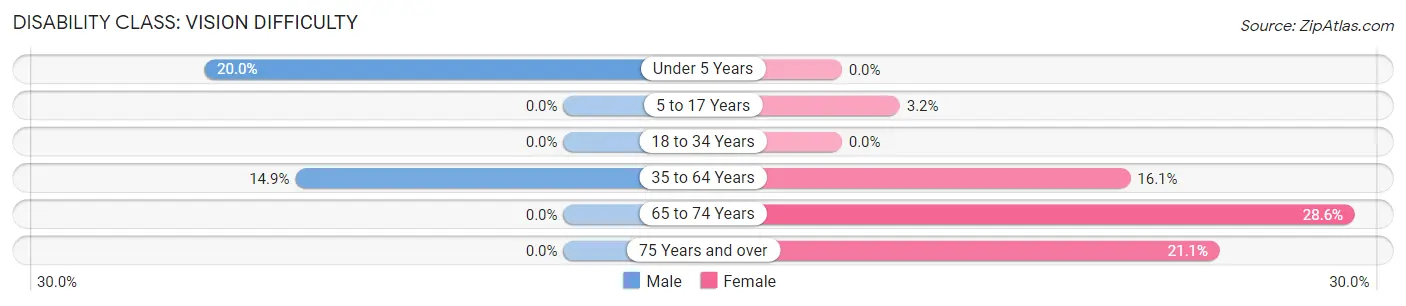
| Age Bracket | Male | Female |
| Under 5 Years | 2 (20.0%) | 0 (0.0%) |
| 5 to 17 Years | 0 (0.0%) | 1 (3.2%) |
| 18 to 34 Years | 0 (0.0%) | 0 (0.0%) |
| 35 to 64 Years | 10 (14.9%) | 9 (16.1%) |
| 65 to 74 Years | 0 (0.0%) | 4 (28.6%) |
| 75 Years and over | 0 (0.0%) | 4 (21.0%) |
Disability Class: Cognitive Difficulty
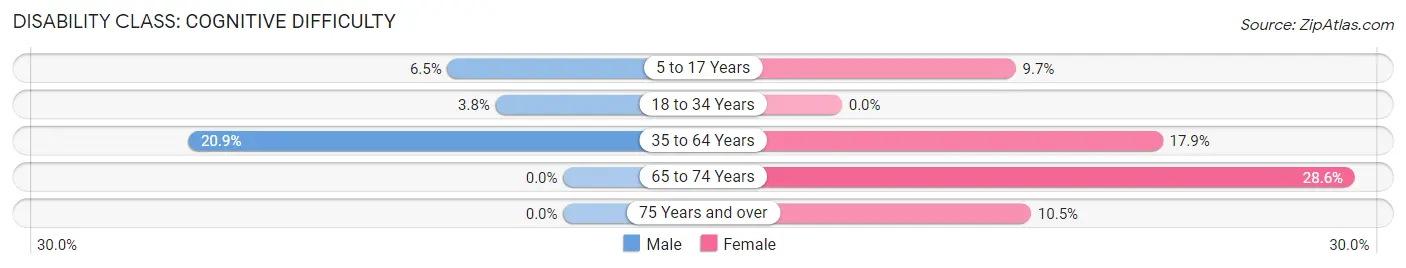
| Age Bracket | Male | Female |
| 5 to 17 Years | 2 (6.5%) | 3 (9.7%) |
| 18 to 34 Years | 2 (3.8%) | 0 (0.0%) |
| 35 to 64 Years | 14 (20.9%) | 10 (17.9%) |
| 65 to 74 Years | 0 (0.0%) | 4 (28.6%) |
| 75 Years and over | 0 (0.0%) | 2 (10.5%) |
Disability Class: Ambulatory Difficulty
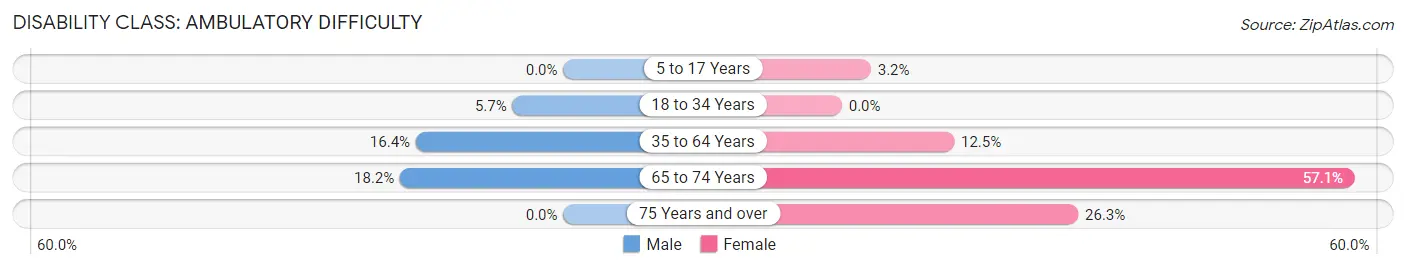
| Age Bracket | Male | Female |
| 5 to 17 Years | 0 (0.0%) | 1 (3.2%) |
| 18 to 34 Years | 3 (5.7%) | 0 (0.0%) |
| 35 to 64 Years | 11 (16.4%) | 7 (12.5%) |
| 65 to 74 Years | 4 (18.2%) | 8 (57.1%) |
| 75 Years and over | 0 (0.0%) | 5 (26.3%) |
Disability Class: Self-Care Difficulty
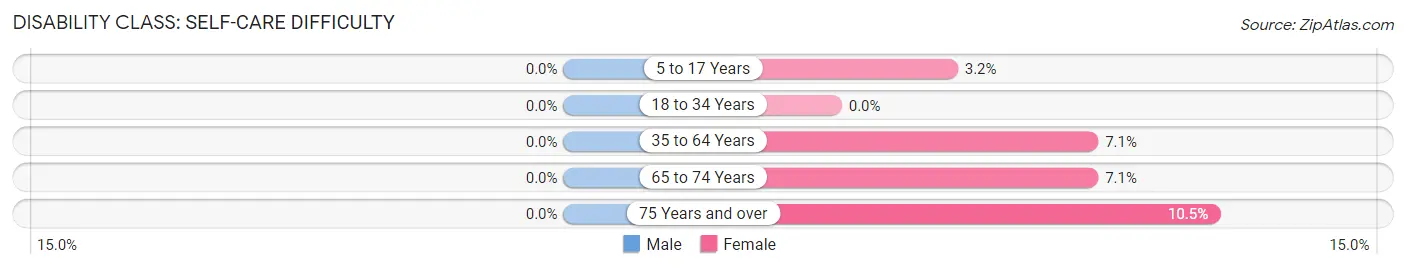
| Age Bracket | Male | Female |
| 5 to 17 Years | 0 (0.0%) | 1 (3.2%) |
| 18 to 34 Years | 0 (0.0%) | 0 (0.0%) |
| 35 to 64 Years | 0 (0.0%) | 4 (7.1%) |
| 65 to 74 Years | 0 (0.0%) | 1 (7.1%) |
| 75 Years and over | 0 (0.0%) | 2 (10.5%) |
Technology Access in Dowelltown
Computing Device Access in Dowelltown
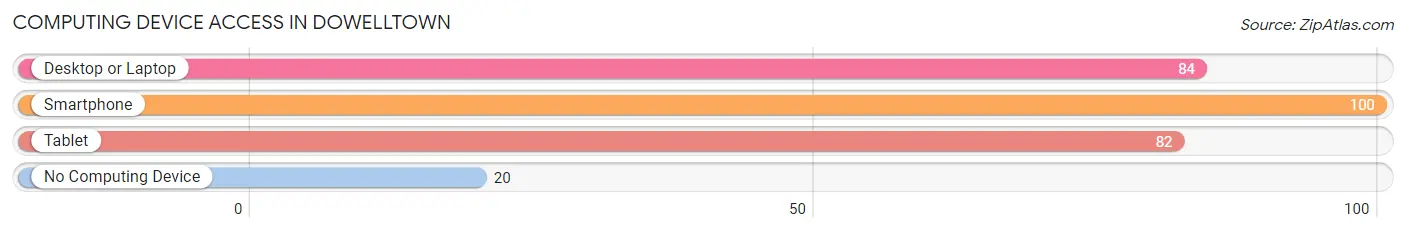
| Device Type | # Households | % Households |
| Desktop or Laptop | 84 | 61.3% |
| Smartphone | 100 | 73.0% |
| Tablet | 82 | 59.9% |
| No Computing Device | 20 | 14.6% |
| Total | 137 | 100.0% |
Internet Access in Dowelltown
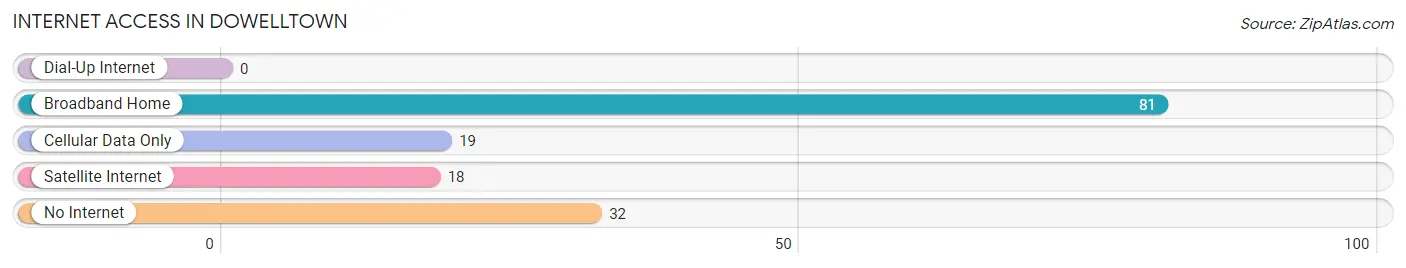
| Internet Type | # Households | % Households |
| Dial-Up Internet | 0 | 0.0% |
| Broadband Home | 81 | 59.1% |
| Cellular Data Only | 19 | 13.9% |
| Satellite Internet | 18 | 13.1% |
| No Internet | 32 | 23.4% |
| Total | 137 | 100.0% |
Dowelltown Summary
Dowelltown is a small unincorporated community located in DeKalb County, Tennessee. It is situated in the foothills of the Cumberland Plateau, approximately 20 miles east of Cookeville and 40 miles west of Chattanooga. The population of Dowelltown was estimated to be around 500 in 2020.
History
Dowelltown was first settled in the early 1800s by the Dowell family, who were among the first settlers in the area. The town was named after the family and was officially incorporated in 1845. The town was a small farming community until the late 19th century, when the railroad came through and the town began to grow. The railroad brought new businesses and industries to the area, and the town began to thrive.
In the early 20th century, Dowelltown was a bustling community with a variety of businesses, including a bank, a hotel, a general store, a blacksmith shop, and a sawmill. The town also had a school, a post office, and a church.
Geography
Dowelltown is located in the foothills of the Cumberland Plateau, approximately 20 miles east of Cookeville and 40 miles west of Chattanooga. The town is situated in a valley surrounded by hills and mountains. The terrain is mostly hilly and forested, with some open fields and pastures. The climate is temperate, with mild winters and hot, humid summers.
Economy
Dowelltown’s economy is largely based on agriculture and forestry. The town is home to several farms, which produce a variety of crops, including corn, soybeans, wheat, and hay. The town also has several sawmills and lumber yards, which provide employment for many of the town’s residents.
In addition to agriculture and forestry, Dowelltown also has a few small businesses, including a gas station, a convenience store, and a few restaurants. The town also has a few small manufacturing businesses, which produce a variety of products, including furniture, clothing, and tools.
Demographics
As of the 2010 census, the population of Dowelltown was estimated to be around 500. The town is predominantly white, with a small African American population. The median household income is around $30,000, and the median home value is around $90,000. The town has a low unemployment rate and a high rate of homeownership.
Conclusion
Dowelltown is a small unincorporated community located in DeKalb County, Tennessee. It is situated in the foothills of the Cumberland Plateau, approximately 20 miles east of Cookeville and 40 miles west of Chattanooga. The population of Dowelltown was estimated to be around 500 in 2020. The town’s economy is largely based on agriculture and forestry, and it has a few small businesses. The town is predominantly white, with a small African American population. The median household income is around $30,000, and the median home value is around $90,000.
Common Questions
What is Per Capita Income in Dowelltown?
Per Capita income in Dowelltown is $26,989.
What is the Median Family Income in Dowelltown?
Median Family Income in Dowelltown is $78,750.
What is the Median Household income in Dowelltown?
Median Household Income in Dowelltown is $58,125.
What is Income or Wage Gap in Dowelltown?
Income or Wage Gap in Dowelltown is 40.7%.
Women in Dowelltown earn 59.3 cents for every dollar earned by a man.
What is Inequality or Gini Index in Dowelltown?
Inequality or Gini Index in Dowelltown is 0.45.
What is the Total Population of Dowelltown?
Total Population of Dowelltown is 355.
What is the Total Male Population of Dowelltown?
Total Male Population of Dowelltown is 190.
What is the Total Female Population of Dowelltown?
Total Female Population of Dowelltown is 165.
What is the Ratio of Males per 100 Females in Dowelltown?
There are 115.15 Males per 100 Females in Dowelltown.
What is the Ratio of Females per 100 Males in Dowelltown?
There are 86.84 Females per 100 Males in Dowelltown.
What is the Median Population Age in Dowelltown?
Median Population Age in Dowelltown is 36.9 Years.
What is the Average Family Size in Dowelltown
Average Family Size in Dowelltown is 3.0 People.
What is the Average Household Size in Dowelltown
Average Household Size in Dowelltown is 2.6 People.
How Large is the Labor Force in Dowelltown?
There are 159 People in the Labor Forcein in Dowelltown.
What is the Percentage of People in the Labor Force in Dowelltown?
55.4% of People are in the Labor Force in Dowelltown.
What is the Unemployment Rate in Dowelltown?
Unemployment Rate in Dowelltown is 9.4%.