Rio Grande, PR Map & Demographics
Rio Grande Overview
$12,828
PER CAPITA INCOME
$29,024
AVG FAMILY INCOME
$22,465
AVG HOUSEHOLD INCOME
4.3%
WAGE / INCOME GAP [ % ]
95.7¢/ $1
WAGE / INCOME GAP [ $ ]
$13,723
FAMILY INCOME DEFICIT
0.47
INEQUALITY / GINI INDEX
12,311
TOTAL POPULATION
5,795
MALE POPULATION
6,516
FEMALE POPULATION
88.93
MALES / 100 FEMALES
112.44
FEMALES / 100 MALES
40.7
MEDIAN AGE
3.6
AVG FAMILY SIZE
2.8
AVG HOUSEHOLD SIZE
5,430
LABOR FORCE [ PEOPLE ]
51.7%
PERCENT IN LABOR FORCE
14.1%
UNEMPLOYMENT RATE
Rio Grande Zip Codes
Rio Grande Area Codes
Income in Rio Grande
Income Overview in Rio Grande
Per Capita Income in Rio Grande is $12,828, while median incomes of families and households are $29,024 and $22,465 respectively.
| Characteristic | Number | Measure |
| Per Capita Income | 12,311 | $12,828 |
| Median Family Income | 2,876 | $29,024 |
| Mean Family Income | 2,876 | $34,695 |
| Median Household Income | 4,385 | $22,465 |
| Mean Household Income | 4,385 | $29,438 |
| Income Deficit | 2,876 | $13,723 |
| Wage / Income Gap (%) | 12,311 | 4.27% |
| Wage / Income Gap ($) | 12,311 | 95.73¢ per $1 |
| Gini / Inequality Index | 12,311 | 0.47 |
Earnings by Sex in Rio Grande
Average Earnings in Rio Grande are $18,992, $18,521 for men and $19,347 for women, a difference of 4.3%.
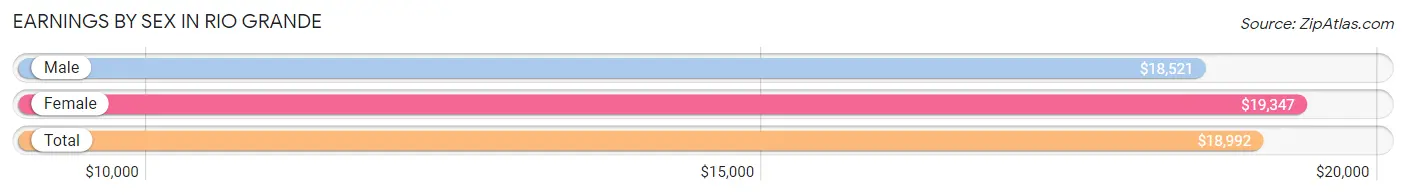
| Sex | Number | Average Earnings |
| Male | 2,684 (55.8%) | $18,521 |
| Female | 2,129 (44.2%) | $19,347 |
| Total | 4,813 (100.0%) | $18,992 |
Earnings by Sex by Income Bracket in Rio Grande
The most common earnings brackets in Rio Grande are $15,000 to $17,499 for men (375 | 14.0%) and $17,500 to $19,999 for women (224 | 10.5%).
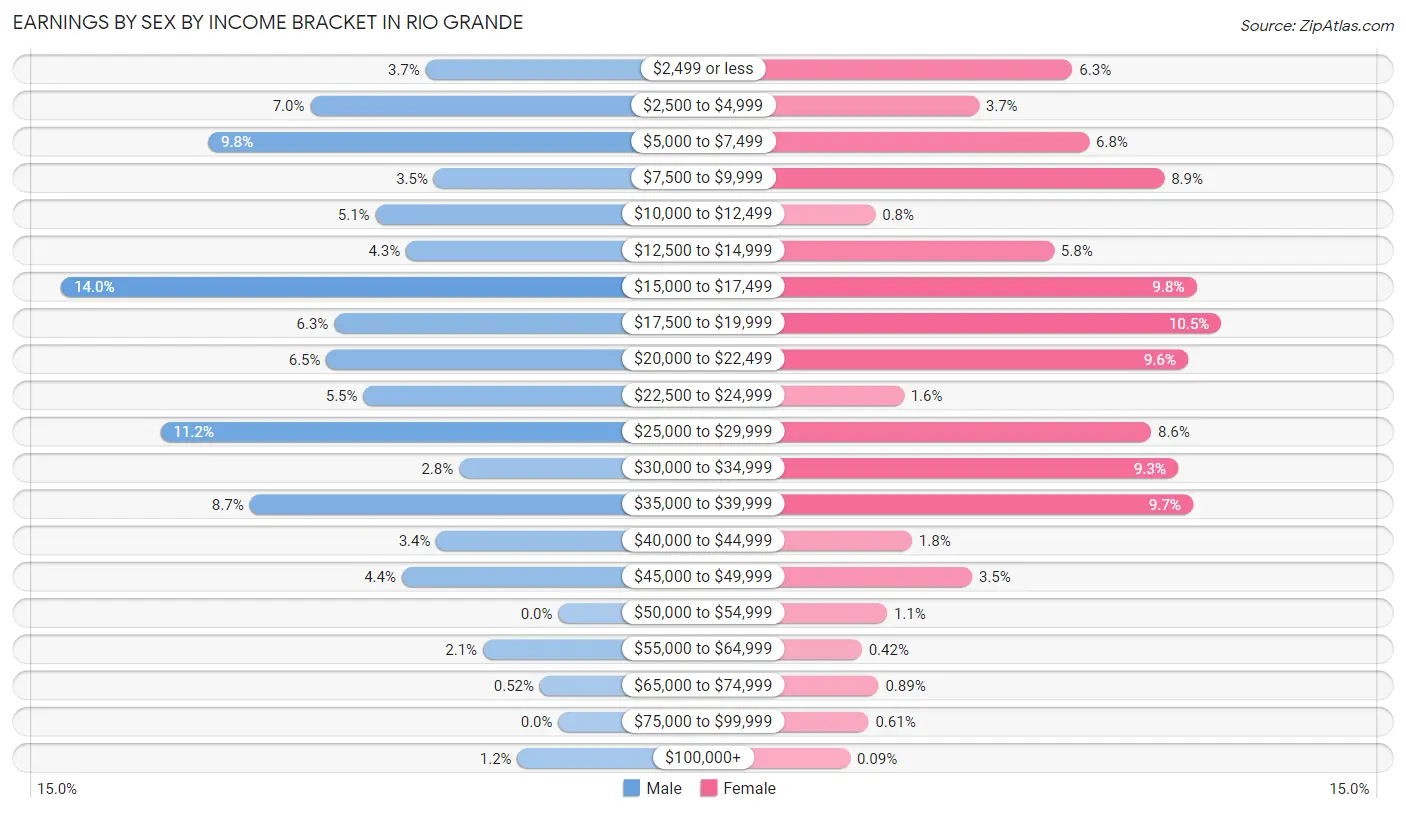
| Income | Male | Female |
| $2,499 or less | 100 (3.7%) | 135 (6.3%) |
| $2,500 to $4,999 | 187 (7.0%) | 79 (3.7%) |
| $5,000 to $7,499 | 264 (9.8%) | 145 (6.8%) |
| $7,500 to $9,999 | 94 (3.5%) | 190 (8.9%) |
| $10,000 to $12,499 | 138 (5.1%) | 17 (0.8%) |
| $12,500 to $14,999 | 115 (4.3%) | 124 (5.8%) |
| $15,000 to $17,499 | 375 (14.0%) | 209 (9.8%) |
| $17,500 to $19,999 | 169 (6.3%) | 224 (10.5%) |
| $20,000 to $22,499 | 175 (6.5%) | 204 (9.6%) |
| $22,500 to $24,999 | 147 (5.5%) | 34 (1.6%) |
| $25,000 to $29,999 | 300 (11.2%) | 182 (8.6%) |
| $30,000 to $34,999 | 75 (2.8%) | 198 (9.3%) |
| $35,000 to $39,999 | 233 (8.7%) | 207 (9.7%) |
| $40,000 to $44,999 | 92 (3.4%) | 39 (1.8%) |
| $45,000 to $49,999 | 118 (4.4%) | 75 (3.5%) |
| $50,000 to $54,999 | 0 (0.0%) | 24 (1.1%) |
| $55,000 to $64,999 | 57 (2.1%) | 9 (0.4%) |
| $65,000 to $74,999 | 14 (0.5%) | 19 (0.9%) |
| $75,000 to $99,999 | 0 (0.0%) | 13 (0.6%) |
| $100,000+ | 31 (1.1%) | 2 (0.1%) |
| Total | 2,684 (100.0%) | 2,129 (100.0%) |
Earnings by Sex by Educational Attainment in Rio Grande
Average earnings in Rio Grande are $20,421 for men and $20,907 for women, a difference of 2.3%. Men with an educational attainment of graduate degree enjoy the highest average annual earnings of $39,375, while those with college or associate's degree education earn the least with $17,485. Women with an educational attainment of bachelor's degree earn the most with the average annual earnings of $22,346, while those with high school diploma education have the smallest earnings of $16,321.
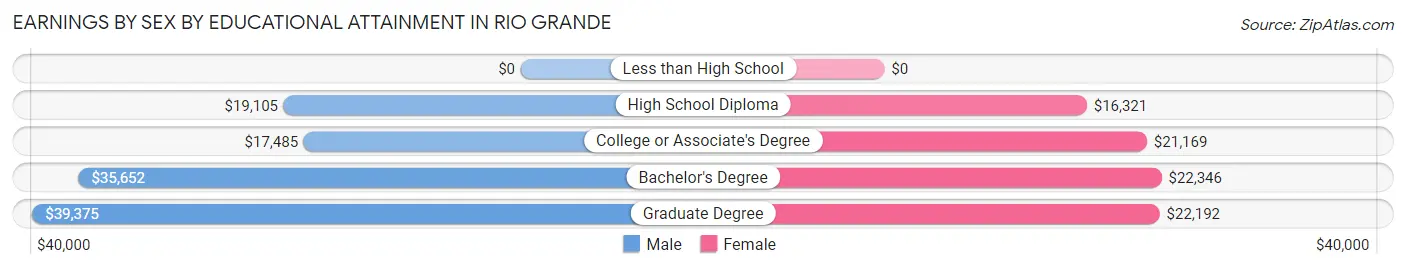
| Educational Attainment | Male Income | Female Income |
| Less than High School | - | - |
| High School Diploma | $19,105 | $16,321 |
| College or Associate's Degree | $17,485 | $21,169 |
| Bachelor's Degree | $35,652 | $22,346 |
| Graduate Degree | $39,375 | $22,192 |
| Total | $20,421 | $20,907 |
Family Income in Rio Grande
Family Income Brackets in Rio Grande
According to the Rio Grande family income data, there are 595 families falling into the less than $10,000 income range, which is the most common income bracket and makes up 20.7% of all families.
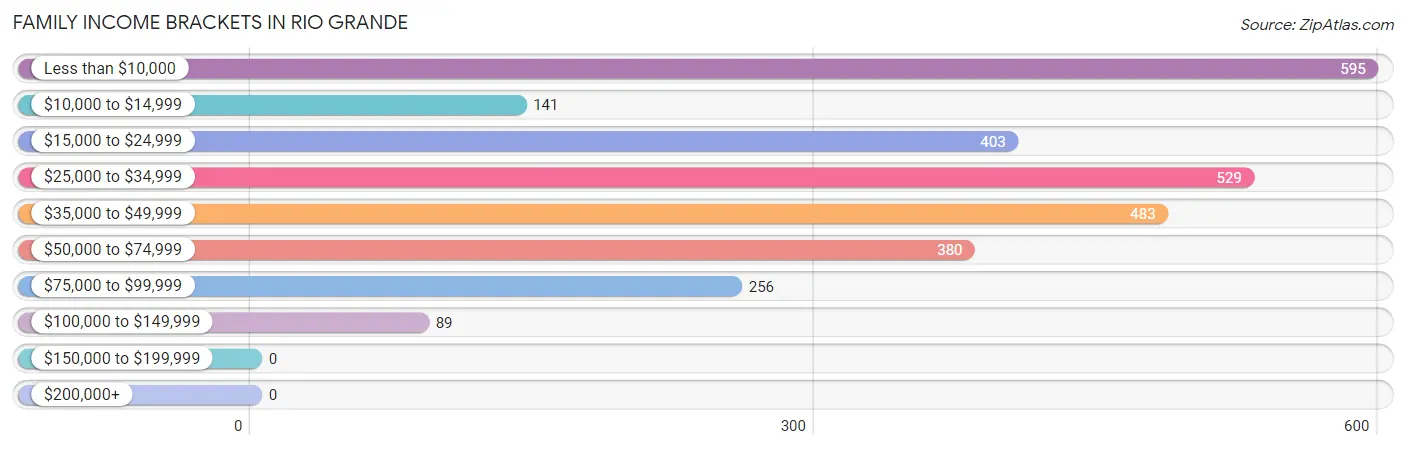
| Income Bracket | # Families | % Families |
| Less than $10,000 | 595 | 20.7% |
| $10,000 to $14,999 | 141 | 4.9% |
| $15,000 to $24,999 | 403 | 14.0% |
| $25,000 to $34,999 | 529 | 18.4% |
| $35,000 to $49,999 | 483 | 16.8% |
| $50,000 to $74,999 | 380 | 13.2% |
| $75,000 to $99,999 | 256 | 8.9% |
| $100,000 to $149,999 | 89 | 3.1% |
| $150,000 to $199,999 | 0 | 0.0% |
| $200,000+ | 0 | 0.0% |
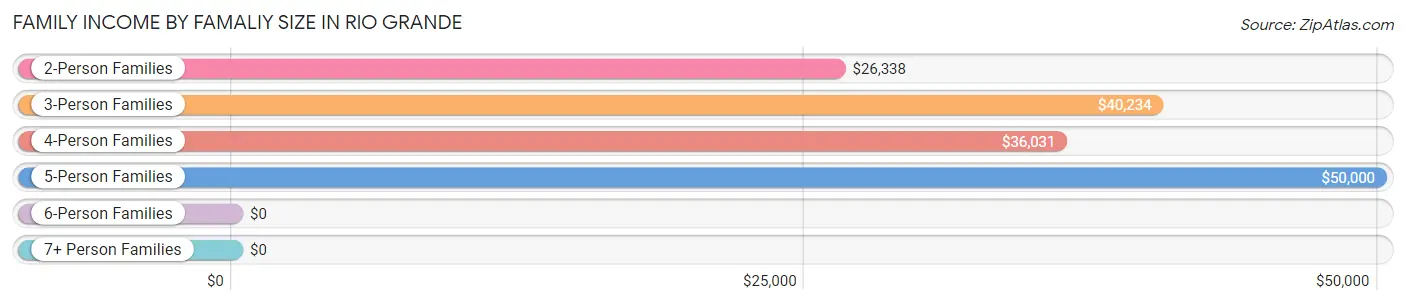
Family Income by Famaliy Size in Rio Grande
5-person families (162 | 5.6%) account for the highest median family income in Rio Grande with $50,000 per family, while 3-person families (657 | 22.8%) have the highest median income of $13,411 per family member.
| Income Bracket | # Families | Median Income |
| 2-Person Families | 1,472 (51.2%) | $26,338 |
| 3-Person Families | 657 (22.8%) | $40,234 |
| 4-Person Families | 567 (19.7%) | $36,031 |
| 5-Person Families | 162 (5.6%) | $50,000 |
| 6-Person Families | 13 (0.4%) | $0 |
| 7+ Person Families | 5 (0.2%) | $0 |
| Total | 2,876 (100.0%) | $29,024 |
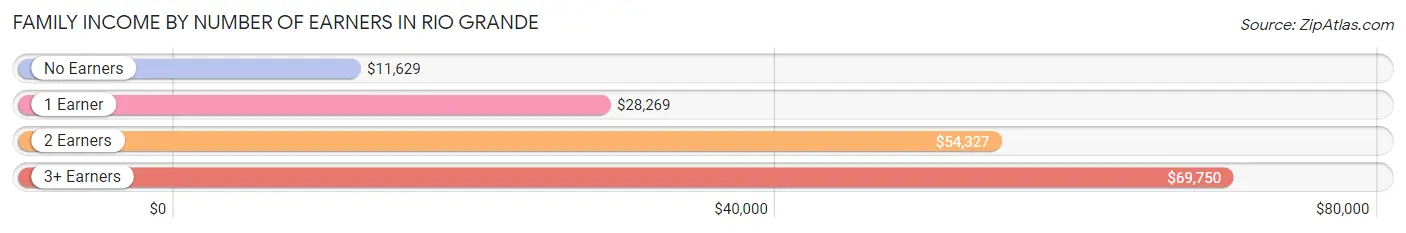
Family Income by Number of Earners in Rio Grande
The median family income in Rio Grande is $29,024, with families comprising 3+ earners (252) having the highest median family income of $69,750, while families with no earners (1,074) have the lowest median family income of $11,629, accounting for 8.8% and 37.3% of families, respectively.
| Number of Earners | # Families | Median Income |
| No Earners | 1,074 (37.3%) | $11,629 |
| 1 Earner | 966 (33.6%) | $28,269 |
| 2 Earners | 584 (20.3%) | $54,327 |
| 3+ Earners | 252 (8.8%) | $69,750 |
| Total | 2,876 (100.0%) | $29,024 |
Household Income in Rio Grande
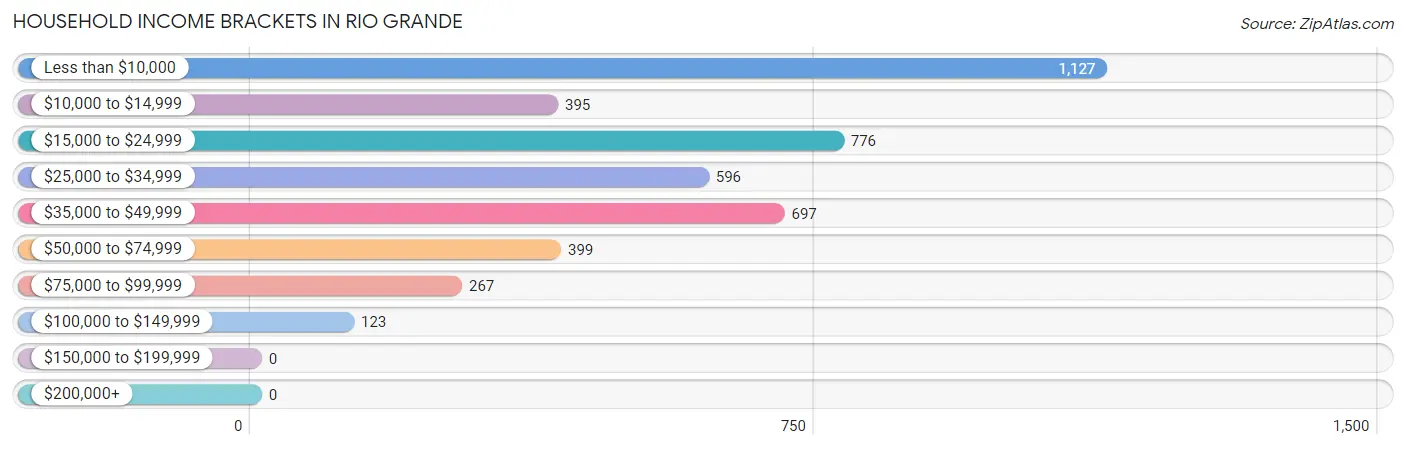
Household Income Brackets in Rio Grande
With 1,127 households falling in the category, the less than $10,000 income range is the most frequent in Rio Grande, accounting for 25.7% of all households.
| Income Bracket | # Households | % Households |
| Less than $10,000 | 1,127 | 25.7% |
| $10,000 to $14,999 | 395 | 9.0% |
| $15,000 to $24,999 | 776 | 17.7% |
| $25,000 to $34,999 | 596 | 13.6% |
| $35,000 to $49,999 | 697 | 15.9% |
| $50,000 to $74,999 | 399 | 9.1% |
| $75,000 to $99,999 | 267 | 6.1% |
| $100,000 to $149,999 | 123 | 2.8% |
| $150,000 to $199,999 | 0 | 0.0% |
| $200,000+ | 0 | 0.0% |
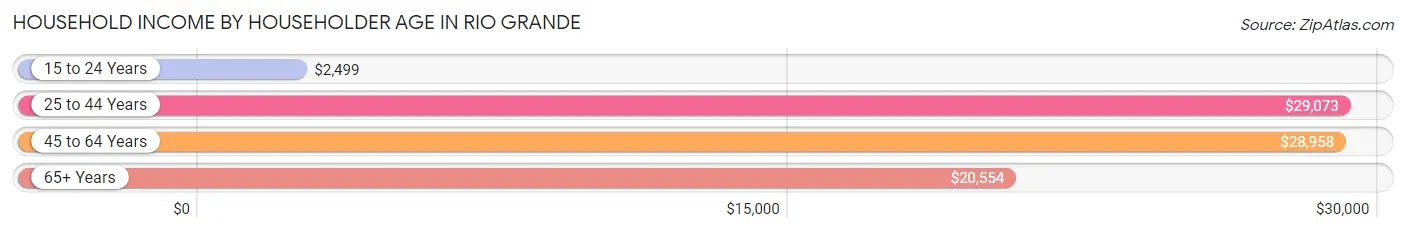
Household Income by Householder Age in Rio Grande
The median household income in Rio Grande is $22,465, with the highest median household income of $29,073 found in the 25 to 44 years age bracket for the primary householder. A total of 1,139 households (26.0%) fall into this category. Meanwhile, the 15 to 24 years age bracket for the primary householder has the lowest median household income of $2,499, with 58 households (1.3%) in this group.
| Income Bracket | # Households | Median Income |
| 15 to 24 Years | 58 (1.3%) | $2,499 |
| 25 to 44 Years | 1,139 (26.0%) | $29,073 |
| 45 to 64 Years | 1,142 (26.0%) | $28,958 |
| 65+ Years | 2,046 (46.7%) | $20,554 |
| Total | 4,385 (100.0%) | $22,465 |
Poverty in Rio Grande
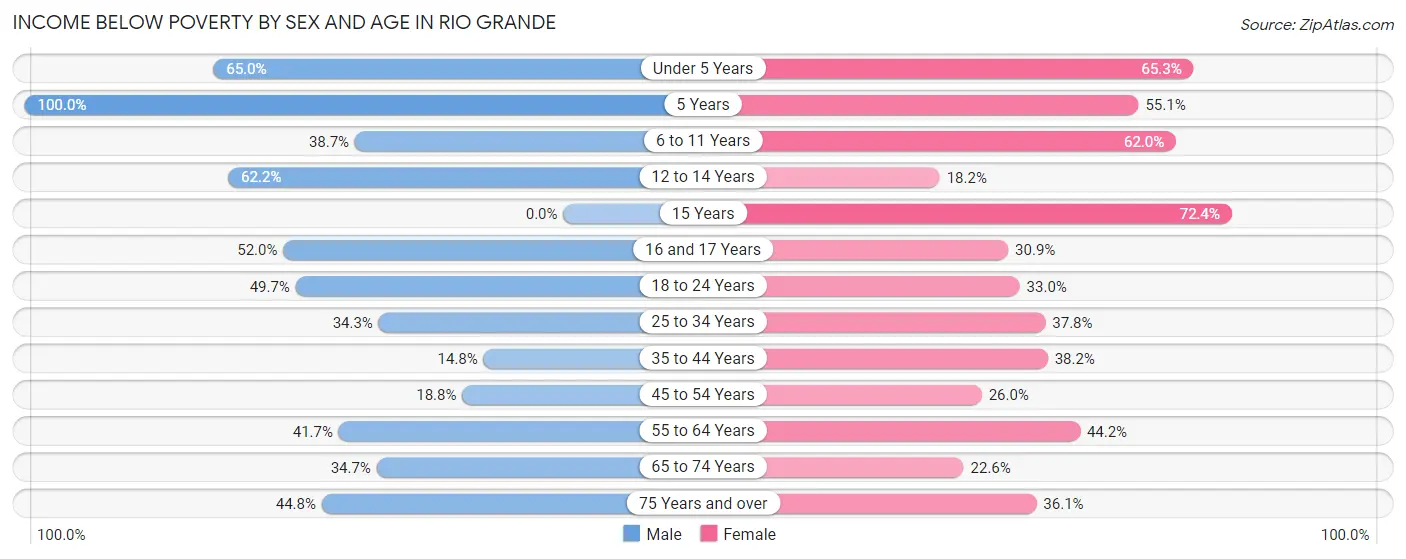
Income Below Poverty by Sex and Age in Rio Grande
With 37.2% poverty level for males and 37.2% for females among the residents of Rio Grande, 5 year old males and 15 year old females are the most vulnerable to poverty, with 146 males (100.0%) and 76 females (72.4%) in their respective age groups living below the poverty level.
| Age Bracket | Male | Female |
| Under 5 Years | 128 (65.0%) | 205 (65.3%) |
| 5 Years | 146 (100.0%) | 38 (55.1%) |
| 6 to 11 Years | 135 (38.7%) | 196 (62.0%) |
| 12 to 14 Years | 117 (62.2%) | 20 (18.2%) |
| 15 Years | 0 (0.0%) | 76 (72.4%) |
| 16 and 17 Years | 131 (52.0%) | 21 (30.9%) |
| 18 to 24 Years | 231 (49.7%) | 206 (33.0%) |
| 25 to 34 Years | 343 (34.3%) | 328 (37.8%) |
| 35 to 44 Years | 131 (14.8%) | 326 (38.2%) |
| 45 to 54 Years | 105 (18.8%) | 187 (26.0%) |
| 55 to 64 Years | 218 (41.7%) | 263 (44.2%) |
| 65 to 74 Years | 246 (34.6%) | 199 (22.6%) |
| 75 Years and over | 226 (44.8%) | 359 (36.1%) |
| Total | 2,157 (37.2%) | 2,424 (37.2%) |
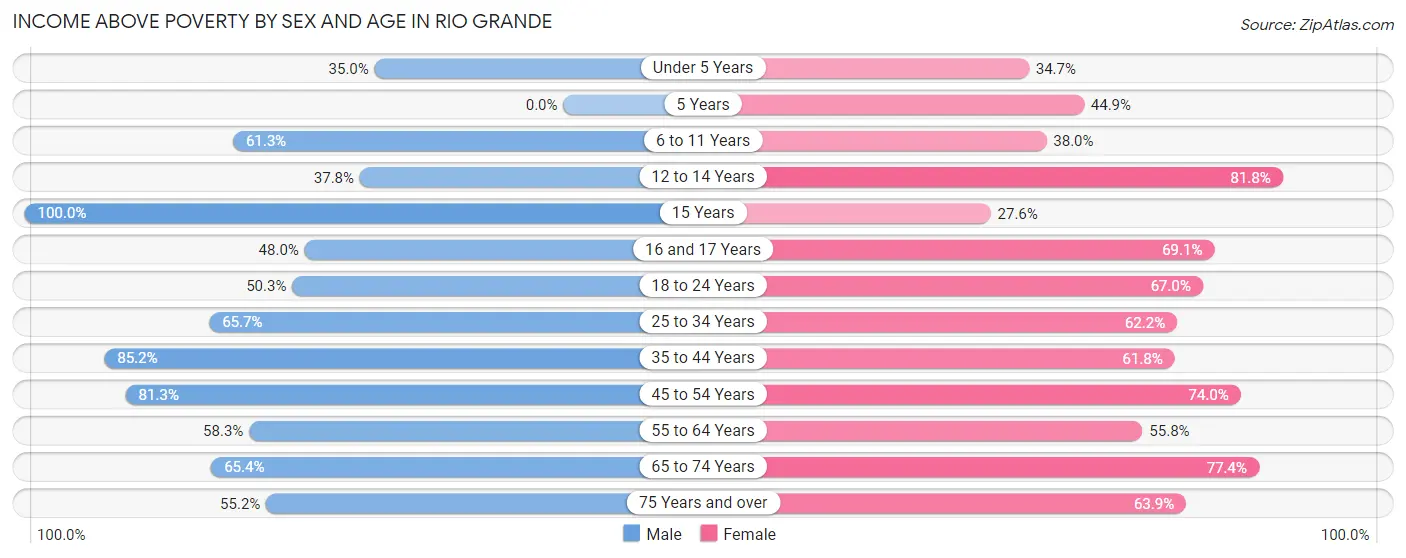
Income Above Poverty by Sex and Age in Rio Grande
According to the poverty statistics in Rio Grande, males aged 15 years and females aged 12 to 14 years are the age groups that are most secure financially, with 100.0% of males and 81.8% of females in these age groups living above the poverty line.
| Age Bracket | Male | Female |
| Under 5 Years | 69 (35.0%) | 109 (34.7%) |
| 5 Years | 0 (0.0%) | 31 (44.9%) |
| 6 to 11 Years | 214 (61.3%) | 120 (38.0%) |
| 12 to 14 Years | 71 (37.8%) | 90 (81.8%) |
| 15 Years | 15 (100.0%) | 29 (27.6%) |
| 16 and 17 Years | 121 (48.0%) | 47 (69.1%) |
| 18 to 24 Years | 234 (50.3%) | 418 (67.0%) |
| 25 to 34 Years | 658 (65.7%) | 540 (62.2%) |
| 35 to 44 Years | 754 (85.2%) | 527 (61.8%) |
| 45 to 54 Years | 455 (81.2%) | 533 (74.0%) |
| 55 to 64 Years | 305 (58.3%) | 332 (55.8%) |
| 65 to 74 Years | 464 (65.3%) | 681 (77.4%) |
| 75 Years and over | 278 (55.2%) | 635 (63.9%) |
| Total | 3,638 (62.8%) | 4,092 (62.8%) |
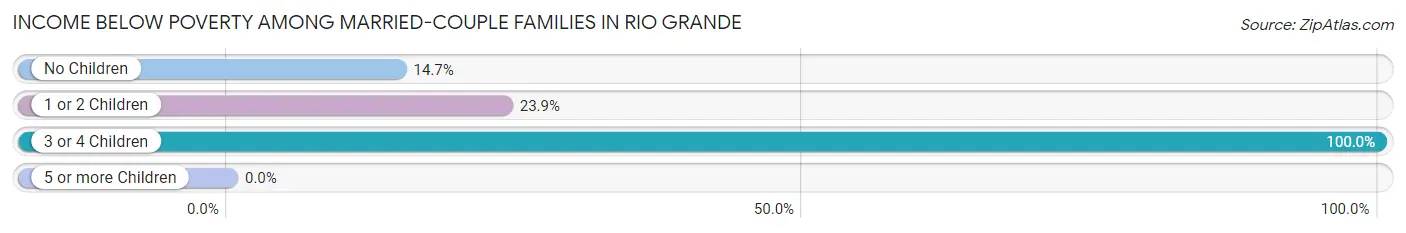
Income Below Poverty Among Married-Couple Families in Rio Grande
The poverty statistics for married-couple families in Rio Grande show that 17.8% or 231 of the total 1,298 families live below the poverty line. Families with 3 or 4 children have the highest poverty rate of 100.0%, comprising of 5 families. On the other hand, families with no children have the lowest poverty rate of 14.7%, which includes 132 families.
| Children | Above Poverty | Below Poverty |
| No Children | 768 (85.3%) | 132 (14.7%) |
| 1 or 2 Children | 299 (76.1%) | 94 (23.9%) |
| 3 or 4 Children | 0 (0.0%) | 5 (100.0%) |
| 5 or more Children | 0 (0.0%) | 0 (0.0%) |
| Total | 1,067 (82.2%) | 231 (17.8%) |
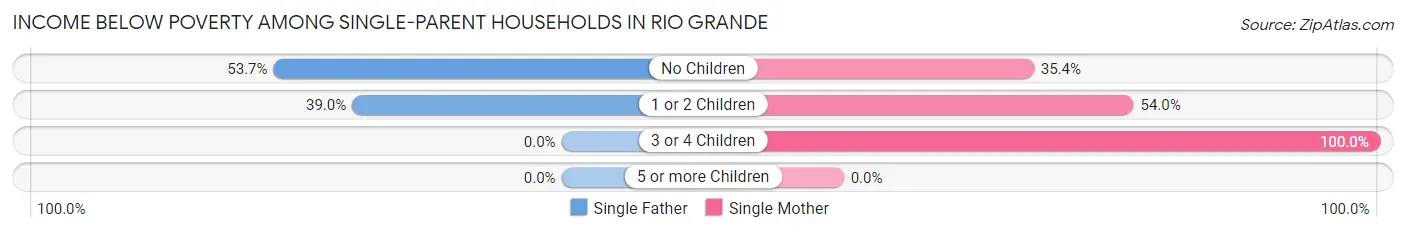
Income Below Poverty Among Single-Parent Households in Rio Grande
According to the poverty data in Rio Grande, 47.2% or 150 single-father households and 48.2% or 607 single-mother households are living below the poverty line. Among single-father households, those with no children have the highest poverty rate, with 95 households (53.7%) experiencing poverty. Likewise, among single-mother households, those with 3 or 4 children have the highest poverty rate, with 123 households (100.0%) falling below the poverty line.
| Children | Single Father | Single Mother |
| No Children | 95 (53.7%) | 248 (35.4%) |
| 1 or 2 Children | 55 (39.0%) | 236 (54.0%) |
| 3 or 4 Children | 0 (0.0%) | 123 (100.0%) |
| 5 or more Children | 0 (0.0%) | 0 (0.0%) |
| Total | 150 (47.2%) | 607 (48.2%) |
Income Below Poverty Among Married-Couple vs Single-Parent Households in Rio Grande
The poverty data for Rio Grande shows that 231 of the married-couple family households (17.8%) and 757 of the single-parent households (48.0%) are living below the poverty level. Within the married-couple family households, those with 3 or 4 children have the highest poverty rate, with 5 households (100.0%) falling below the poverty line. Among the single-parent households, those with 3 or 4 children have the highest poverty rate, with 123 household (100.0%) living below poverty.
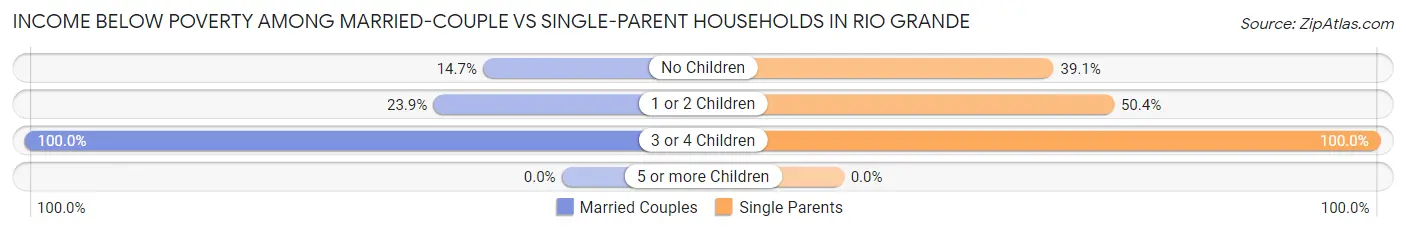
| Children | Married-Couple Families | Single-Parent Households |
| No Children | 132 (14.7%) | 343 (39.1%) |
| 1 or 2 Children | 94 (23.9%) | 291 (50.3%) |
| 3 or 4 Children | 5 (100.0%) | 123 (100.0%) |
| 5 or more Children | 0 (0.0%) | 0 (0.0%) |
| Total | 231 (17.8%) | 757 (48.0%) |
Race in Rio Grande
The most populous races in Rio Grande are Hispanic or Latino (12,254 | 99.5%), Some other Race (4,171 | 33.9%), and Two or more Races (3,310 | 26.9%).
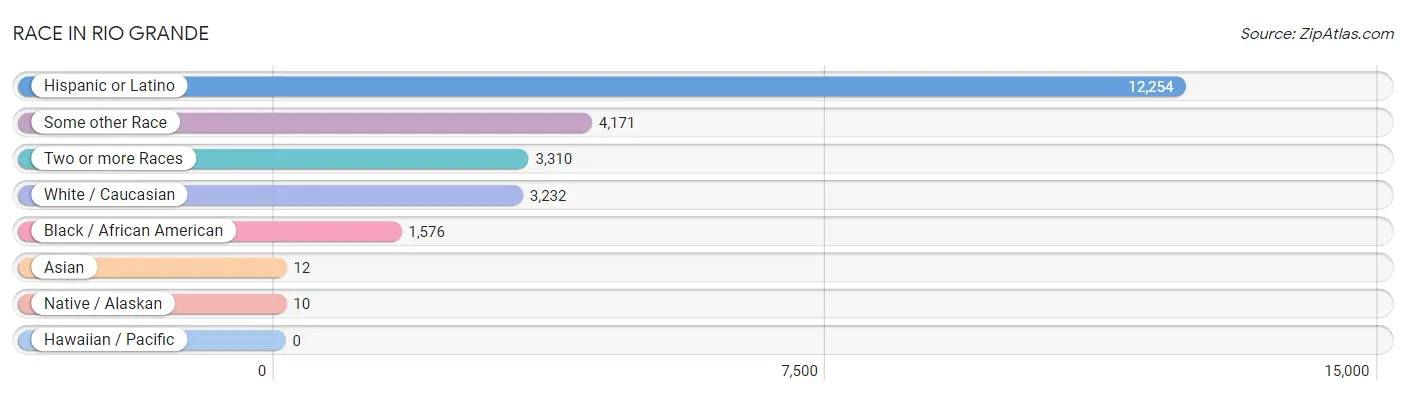
| Race | # Population | % Population |
| Asian | 12 | 0.1% |
| Black / African American | 1,576 | 12.8% |
| Hawaiian / Pacific | 0 | 0.0% |
| Hispanic or Latino | 12,254 | 99.5% |
| Native / Alaskan | 10 | 0.1% |
| White / Caucasian | 3,232 | 26.3% |
| Two or more Races | 3,310 | 26.9% |
| Some other Race | 4,171 | 33.9% |
| Total | 12,311 | 100.0% |
Ancestry in Rio Grande
The most populous ancestries reported in Rio Grande are Puerto Rican (11,673 | 94.8%), Dominican (411 | 3.3%), Mexican (97 | 0.8%), American (95 | 0.8%), and Central American (46 | 0.4%), together accounting for 100.1% of all Rio Grande residents.
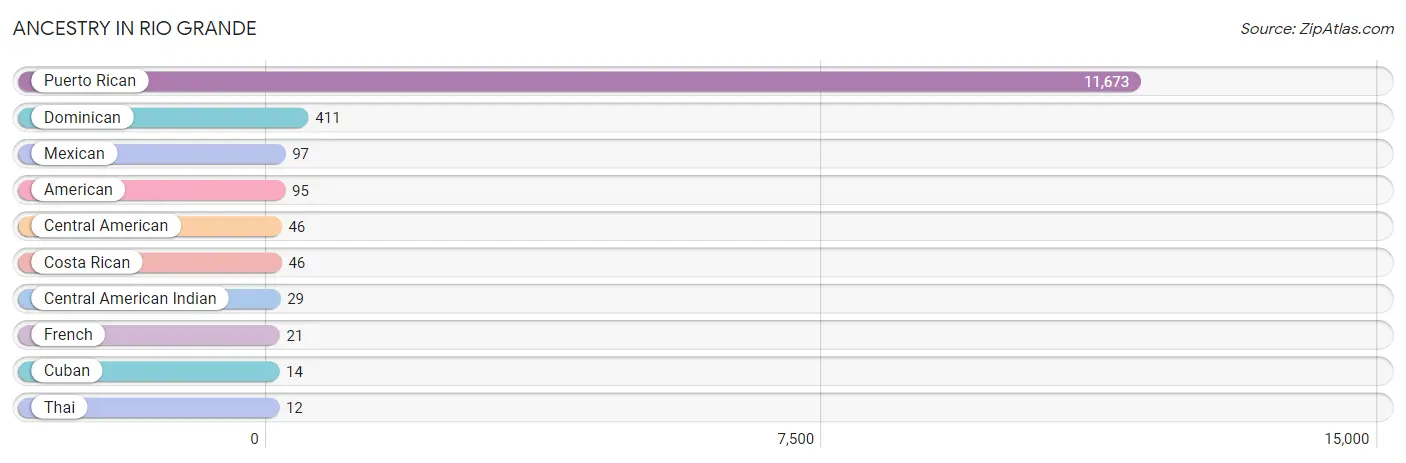
| Ancestry | # Population | % Population |
| American | 95 | 0.8% |
| Central American | 46 | 0.4% |
| Central American Indian | 29 | 0.2% |
| Costa Rican | 46 | 0.4% |
| Cuban | 14 | 0.1% |
| Dominican | 411 | 3.3% |
| French | 21 | 0.2% |
| Mexican | 97 | 0.8% |
| Puerto Rican | 11,673 | 94.8% |
| Thai | 12 | 0.1% | View All 10 Rows |
Immigrants in Rio Grande

| Immigration Origin | # Population | % Population | View All 0 Rows |
Sex and Age in Rio Grande
Sex and Age in Rio Grande
The most populous age groups in Rio Grande are 30 to 34 Years (561 | 9.7%) for men and 25 to 29 Years (594 | 9.1%) for women.
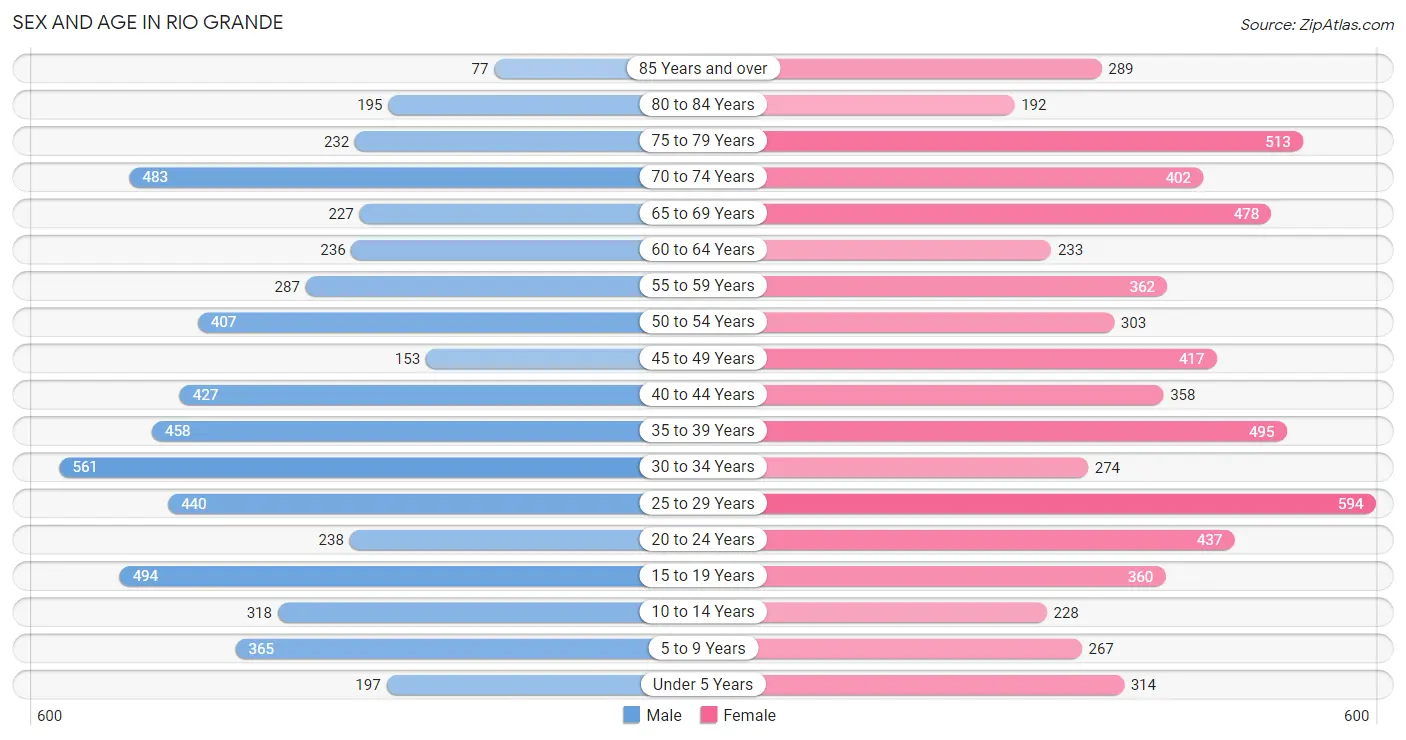
| Age Bracket | Male | Female |
| Under 5 Years | 197 (3.4%) | 314 (4.8%) |
| 5 to 9 Years | 365 (6.3%) | 267 (4.1%) |
| 10 to 14 Years | 318 (5.5%) | 228 (3.5%) |
| 15 to 19 Years | 494 (8.5%) | 360 (5.5%) |
| 20 to 24 Years | 238 (4.1%) | 437 (6.7%) |
| 25 to 29 Years | 440 (7.6%) | 594 (9.1%) |
| 30 to 34 Years | 561 (9.7%) | 274 (4.2%) |
| 35 to 39 Years | 458 (7.9%) | 495 (7.6%) |
| 40 to 44 Years | 427 (7.4%) | 358 (5.5%) |
| 45 to 49 Years | 153 (2.6%) | 417 (6.4%) |
| 50 to 54 Years | 407 (7.0%) | 303 (4.6%) |
| 55 to 59 Years | 287 (5.0%) | 362 (5.6%) |
| 60 to 64 Years | 236 (4.1%) | 233 (3.6%) |
| 65 to 69 Years | 227 (3.9%) | 478 (7.3%) |
| 70 to 74 Years | 483 (8.3%) | 402 (6.2%) |
| 75 to 79 Years | 232 (4.0%) | 513 (7.9%) |
| 80 to 84 Years | 195 (3.4%) | 192 (2.9%) |
| 85 Years and over | 77 (1.3%) | 289 (4.4%) |
| Total | 5,795 (100.0%) | 6,516 (100.0%) |
Families and Households in Rio Grande
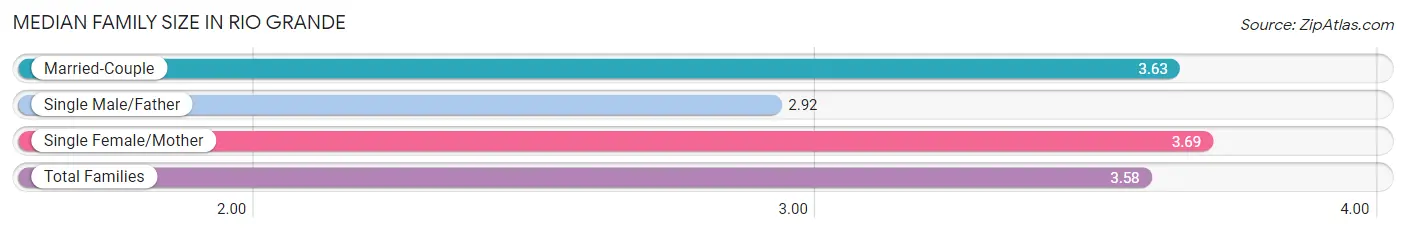
Median Family Size in Rio Grande
The median family size in Rio Grande is 3.58 persons per family, with single female/mother families (1,260 | 43.8%) accounting for the largest median family size of 3.69 persons per family. On the other hand, single male/father families (318 | 11.1%) represent the smallest median family size with 2.92 persons per family.
| Family Type | # Families | Family Size |
| Married-Couple | 1,298 (45.1%) | 3.63 |
| Single Male/Father | 318 (11.1%) | 2.92 |
| Single Female/Mother | 1,260 (43.8%) | 3.69 |
| Total Families | 2,876 (100.0%) | 3.58 |
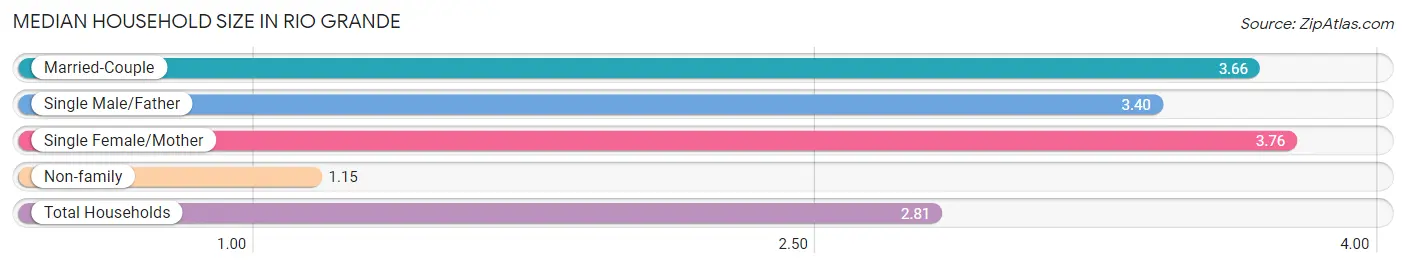
Median Household Size in Rio Grande
The median household size in Rio Grande is 2.81 persons per household, with single female/mother households (1,260 | 28.7%) accounting for the largest median household size of 3.76 persons per household. non-family households (1,509 | 34.4%) represent the smallest median household size with 1.15 persons per household.
| Household Type | # Households | Household Size |
| Married-Couple | 1,298 (29.6%) | 3.66 |
| Single Male/Father | 318 (7.2%) | 3.40 |
| Single Female/Mother | 1,260 (28.7%) | 3.76 |
| Non-family | 1,509 (34.4%) | 1.15 |
| Total Households | 4,385 (100.0%) | 2.81 |
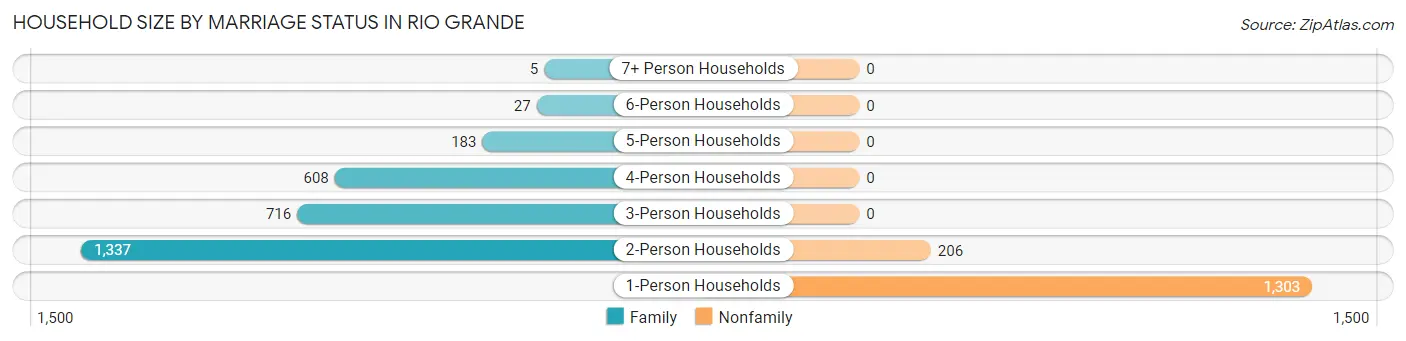
Household Size by Marriage Status in Rio Grande
Out of a total of 4,385 households in Rio Grande, 2,876 (65.6%) are family households, while 1,509 (34.4%) are nonfamily households. The most numerous type of family households are 2-person households, comprising 1,337, and the most common type of nonfamily households are 1-person households, comprising 1,303.
| Household Size | Family Households | Nonfamily Households |
| 1-Person Households | - | 1,303 (29.7%) |
| 2-Person Households | 1,337 (30.5%) | 206 (4.7%) |
| 3-Person Households | 716 (16.3%) | 0 (0.0%) |
| 4-Person Households | 608 (13.9%) | 0 (0.0%) |
| 5-Person Households | 183 (4.2%) | 0 (0.0%) |
| 6-Person Households | 27 (0.6%) | 0 (0.0%) |
| 7+ Person Households | 5 (0.1%) | 0 (0.0%) |
| Total | 2,876 (65.6%) | 1,509 (34.4%) |
Female Fertility in Rio Grande
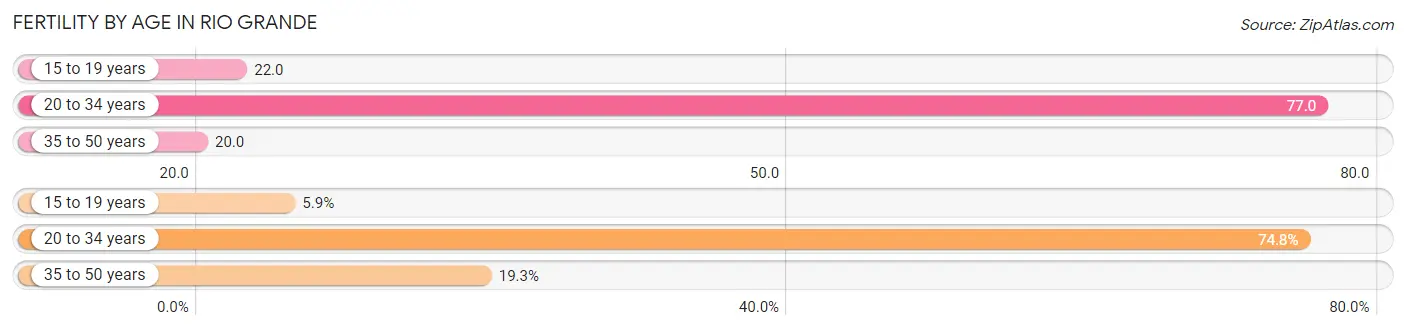
Fertility by Age in Rio Grande
Average fertility rate in Rio Grande is 46.0 births per 1,000 women. Women in the age bracket of 20 to 34 years have the highest fertility rate with 77.0 births per 1,000 women. Women in the age bracket of 20 to 34 years acount for 74.8% of all women with births.
| Age Bracket | Women with Births | Births / 1,000 Women |
| 15 to 19 years | 8 (5.9%) | 22.0 |
| 20 to 34 years | 101 (74.8%) | 77.0 |
| 35 to 50 years | 26 (19.3%) | 20.0 |
| Total | 135 (100.0%) | 46.0 |
Fertility by Age by Marriage Status in Rio Grande
45.9% of women with births (135) in Rio Grande are married. The highest percentage of unmarried women with births falls into 15 to 19 years age bracket with 100.0% of them unmarried at the time of birth, while the lowest percentage of unmarried women with births belong to 35 to 50 years age bracket with 0.0% of them unmarried.
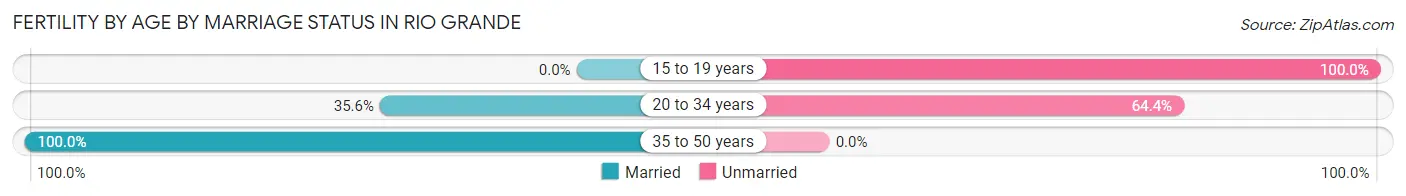
| Age Bracket | Married | Unmarried |
| 15 to 19 years | 0 (0.0%) | 8 (100.0%) |
| 20 to 34 years | 36 (35.6%) | 65 (64.4%) |
| 35 to 50 years | 26 (100.0%) | 0 (0.0%) |
| Total | 62 (45.9%) | 73 (54.1%) |
Fertility by Education in Rio Grande
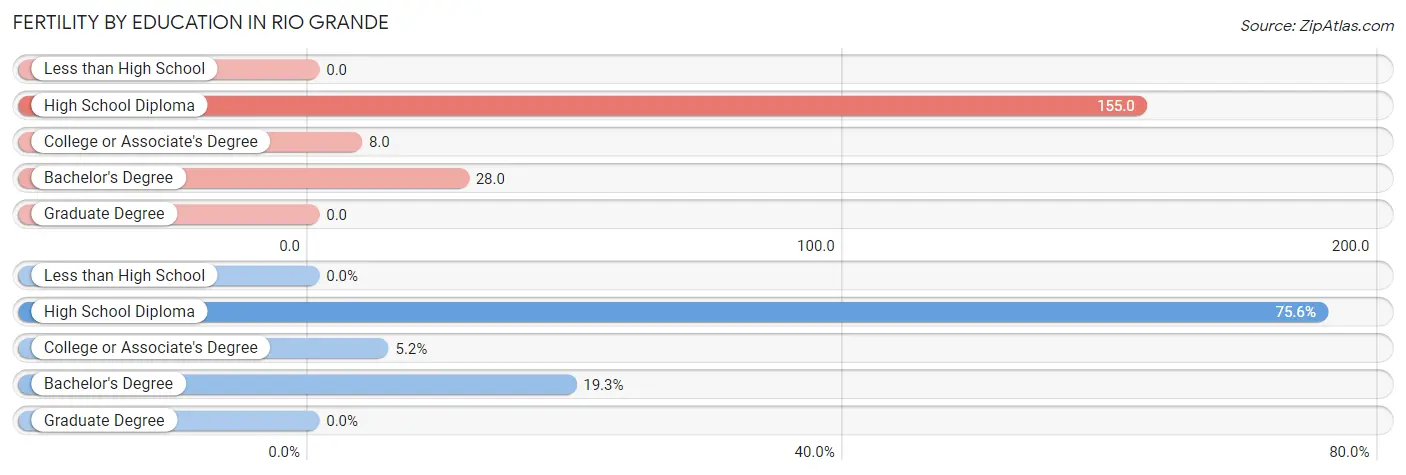
| Educational Attainment | Women with Births | Births / 1,000 Women |
| Less than High School | 0 (0.0%) | 0.0 |
| High School Diploma | 102 (75.6%) | 155.0 |
| College or Associate's Degree | 7 (5.2%) | 8.0 |
| Bachelor's Degree | 26 (19.3%) | 28.0 |
| Graduate Degree | 0 (0.0%) | 0.0 |
| Total | 135 (100.0%) | 46.0 |
Fertility by Education by Marriage Status in Rio Grande
54.1% of women with births in Rio Grande are unmarried. Women with the educational attainment of bachelor's degree are most likely to be married with 100.0% of them married at childbirth, while women with the educational attainment of college or associate's degree are least likely to be married with 100.0% of them unmarried at childbirth.
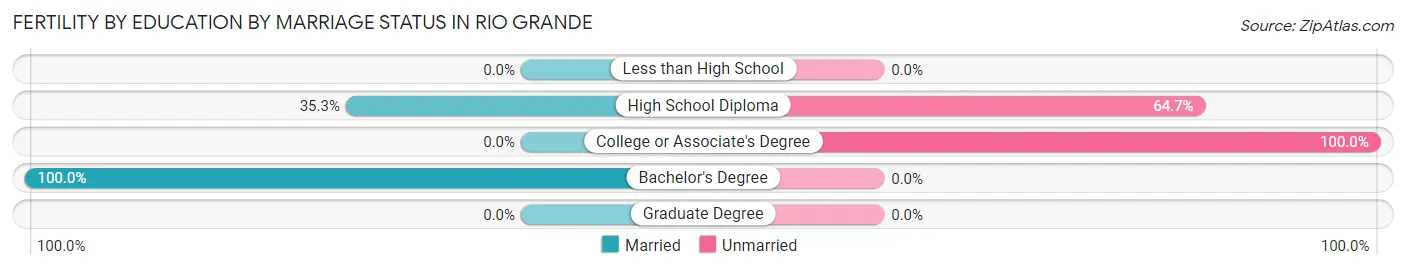
| Educational Attainment | Married | Unmarried |
| Less than High School | 0 (0.0%) | 0 (0.0%) |
| High School Diploma | 36 (35.3%) | 66 (64.7%) |
| College or Associate's Degree | 0 (0.0%) | 7 (100.0%) |
| Bachelor's Degree | 26 (100.0%) | 0 (0.0%) |
| Graduate Degree | 0 (0.0%) | 0 (0.0%) |
| Total | 62 (45.9%) | 73 (54.1%) |
Employment Characteristics in Rio Grande
Employment by Class of Employer in Rio Grande
Among the 4,269 employed individuals in Rio Grande, private company employees (2,916 | 68.3%), self-employed (not incorporated) (552 | 12.9%), and state government employees (381 | 8.9%) make up the most common classes of employment.
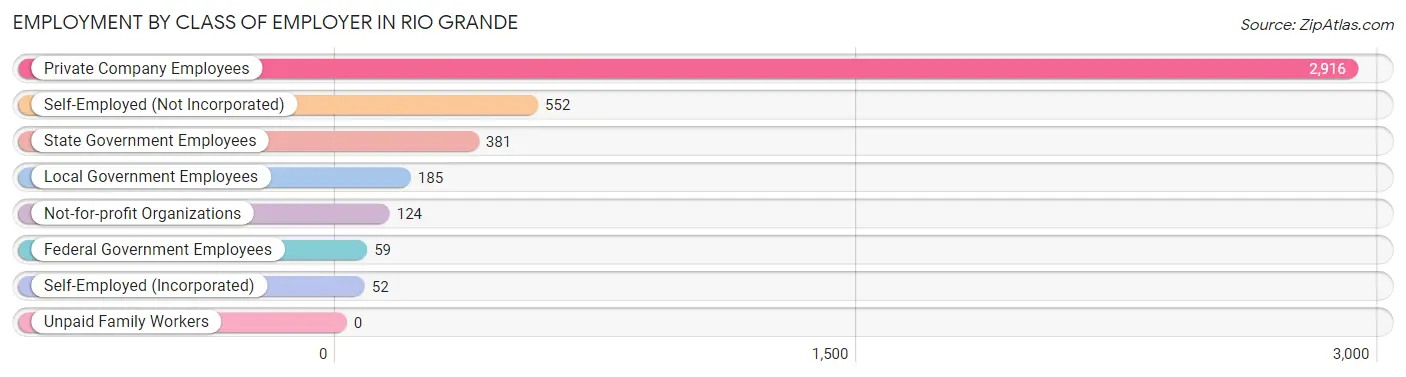
| Employer Class | # Employees | % Employees |
| Private Company Employees | 2,916 | 68.3% |
| Self-Employed (Incorporated) | 52 | 1.2% |
| Self-Employed (Not Incorporated) | 552 | 12.9% |
| Not-for-profit Organizations | 124 | 2.9% |
| Local Government Employees | 185 | 4.3% |
| State Government Employees | 381 | 8.9% |
| Federal Government Employees | 59 | 1.4% |
| Unpaid Family Workers | 0 | 0.0% |
| Total | 4,269 | 100.0% |
Employment Status by Age in Rio Grande
According to the labor force statistics for Rio Grande, out of the total population over 16 years of age (10,502), 51.7% or 5,430 individuals are in the labor force, with 14.1% or 766 of them unemployed. The age group with the highest labor force participation rate is 25 to 29 years, with 85.4% or 883 individuals in the labor force. Within the labor force, the 16 to 19 years age range has the highest percentage of unemployed individuals, with 32.7% or 80 of them being unemployed.
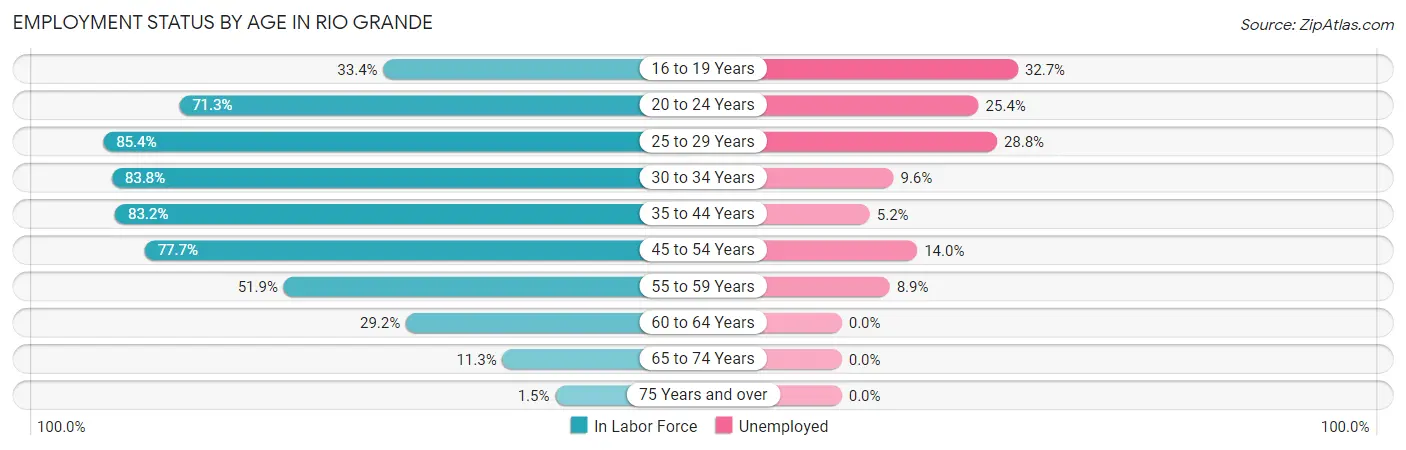
| Age Bracket | In Labor Force | Unemployed |
| 16 to 19 Years | 245 (33.4%) | 80 (32.7%) |
| 20 to 24 Years | 481 (71.3%) | 122 (25.4%) |
| 25 to 29 Years | 883 (85.4%) | 254 (28.8%) |
| 30 to 34 Years | 700 (83.8%) | 67 (9.6%) |
| 35 to 44 Years | 1,446 (83.2%) | 75 (5.2%) |
| 45 to 54 Years | 995 (77.7%) | 139 (14.0%) |
| 55 to 59 Years | 337 (51.9%) | 30 (8.9%) |
| 60 to 64 Years | 137 (29.2%) | 0 (0.0%) |
| 65 to 74 Years | 180 (11.3%) | 0 (0.0%) |
| 75 Years and over | 22 (1.5%) | 0 (0.0%) |
| Total | 5,430 (51.7%) | 766 (14.1%) |
Employment Status by Educational Attainment in Rio Grande
According to labor force statistics for Rio Grande, 74.9% of individuals (4,498) out of the total population between 25 and 64 years of age (6,005) are in the labor force, with 12.6% or 567 of them being unemployed. The group with the highest labor force participation rate are those with the educational attainment of bachelor's degree or higher, with 91.2% or 1,753 individuals in the labor force. Within the labor force, individuals with less than high school education have the highest percentage of unemployment, with 56.1% or 160 of them being unemployed.
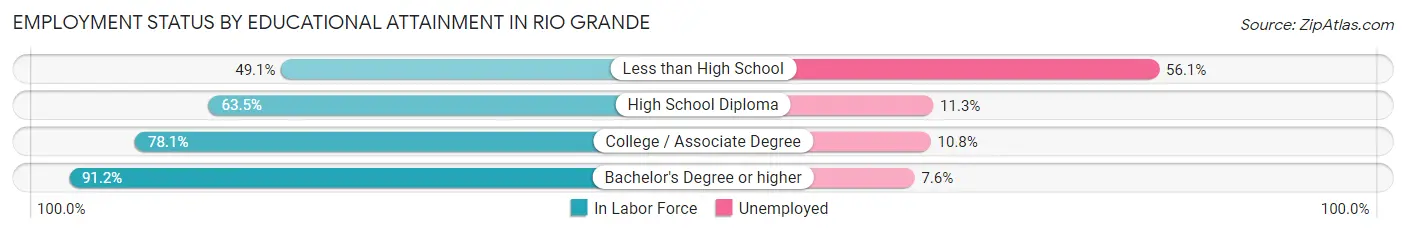
| Educational Attainment | In Labor Force | Unemployed |
| Less than High School | 285 (49.1%) | 326 (56.1%) |
| High School Diploma | 1,192 (63.5%) | 212 (11.3%) |
| College / Associate Degree | 1,269 (78.1%) | 176 (10.8%) |
| Bachelor's Degree or higher | 1,753 (91.2%) | 146 (7.6%) |
| Total | 4,498 (74.9%) | 757 (12.6%) |
Employment Occupations by Sex in Rio Grande
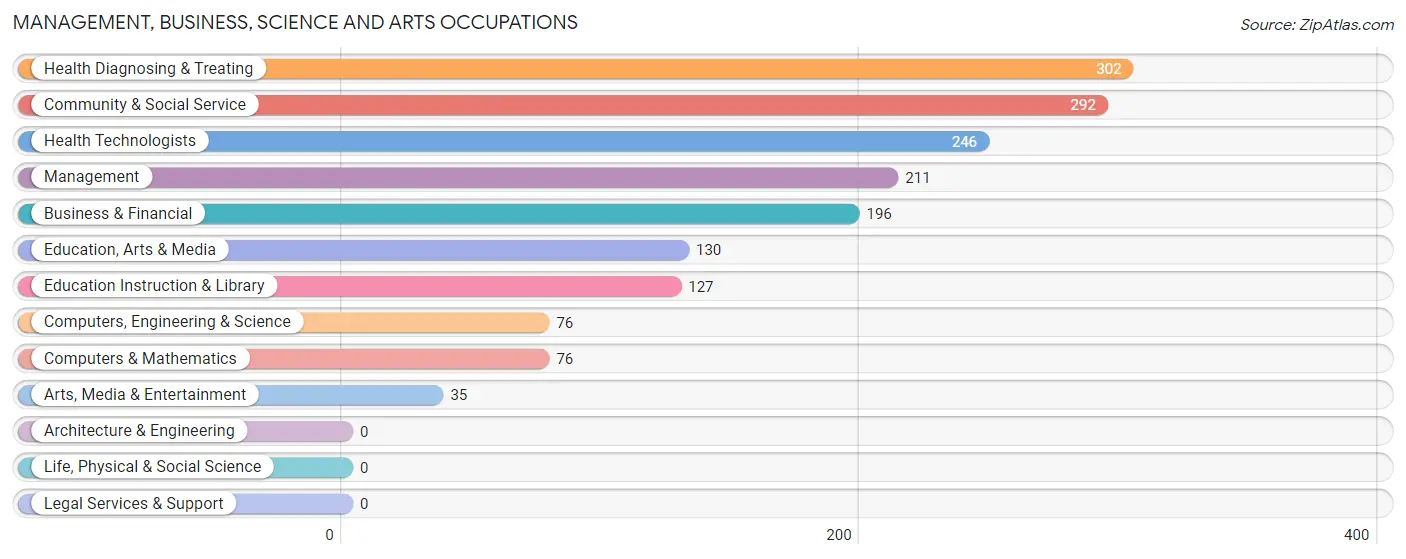
Management, Business, Science and Arts Occupations
The most common Management, Business, Science and Arts occupations in Rio Grande are Health Diagnosing & Treating (302 | 6.5%), Community & Social Service (292 | 6.3%), Health Technologists (246 | 5.3%), Management (211 | 4.5%), and Business & Financial (196 | 4.2%).
Management, Business, Science and Arts Occupations by Sex
Within the Management, Business, Science and Arts occupations in Rio Grande, the most male-oriented occupations are Computers, Engineering & Science (100.0%), Computers & Mathematics (100.0%), and Health Technologists (74.4%), while the most female-oriented occupations are Arts, Media & Entertainment (100.0%), Education, Arts & Media (90.8%), and Community & Social Service (89.4%).
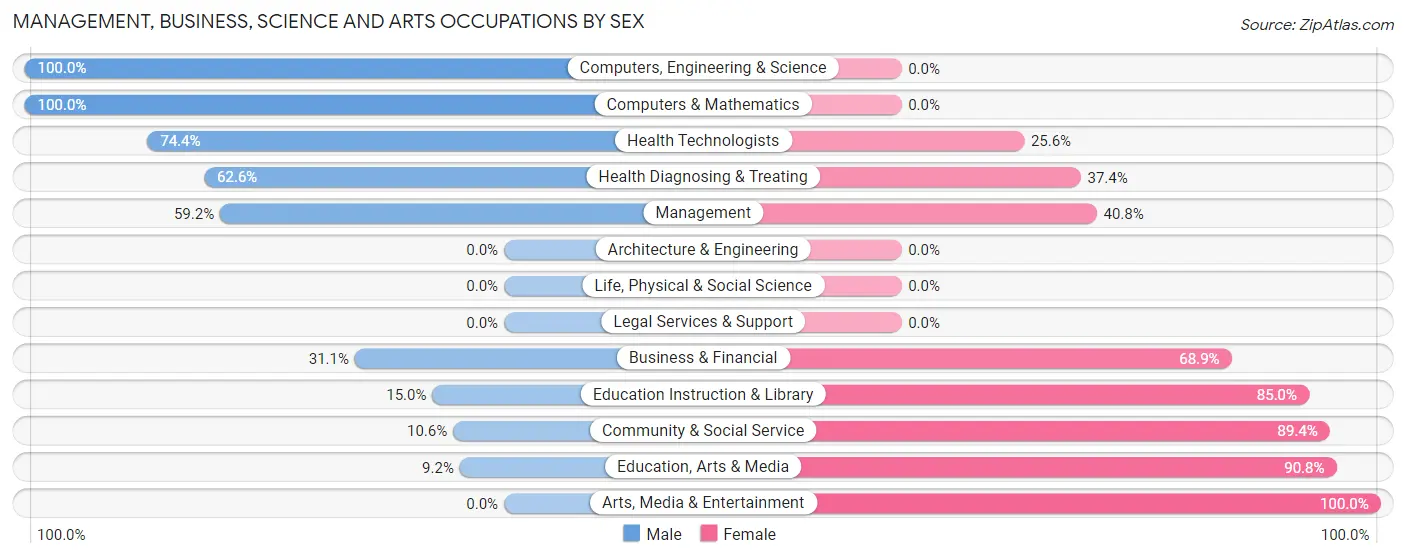
| Occupation | Male | Female |
| Management | 125 (59.2%) | 86 (40.8%) |
| Business & Financial | 61 (31.1%) | 135 (68.9%) |
| Computers, Engineering & Science | 76 (100.0%) | 0 (0.0%) |
| Computers & Mathematics | 76 (100.0%) | 0 (0.0%) |
| Architecture & Engineering | 0 (0.0%) | 0 (0.0%) |
| Life, Physical & Social Science | 0 (0.0%) | 0 (0.0%) |
| Community & Social Service | 31 (10.6%) | 261 (89.4%) |
| Education, Arts & Media | 12 (9.2%) | 118 (90.8%) |
| Legal Services & Support | 0 (0.0%) | 0 (0.0%) |
| Education Instruction & Library | 19 (15.0%) | 108 (85.0%) |
| Arts, Media & Entertainment | 0 (0.0%) | 35 (100.0%) |
| Health Diagnosing & Treating | 189 (62.6%) | 113 (37.4%) |
| Health Technologists | 183 (74.4%) | 63 (25.6%) |
| Total (Category) | 482 (44.8%) | 595 (55.2%) |
| Total (Overall) | 2,587 (55.5%) | 2,072 (44.5%) |
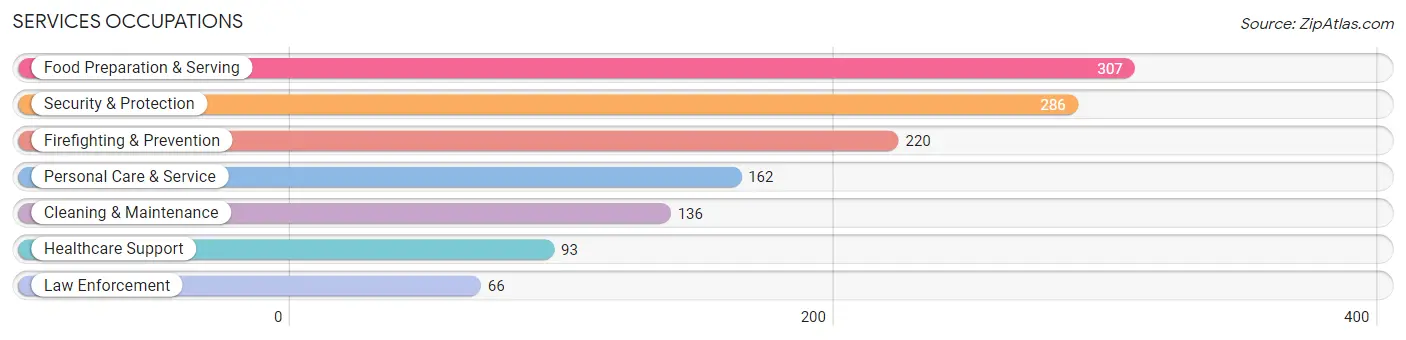
Services Occupations
The most common Services occupations in Rio Grande are Food Preparation & Serving (307 | 6.6%), Security & Protection (286 | 6.1%), Firefighting & Prevention (220 | 4.7%), Personal Care & Service (162 | 3.5%), and Cleaning & Maintenance (136 | 2.9%).
Services Occupations by Sex
Within the Services occupations in Rio Grande, the most male-oriented occupations are Law Enforcement (100.0%), Personal Care & Service (72.2%), and Security & Protection (64.7%), while the most female-oriented occupations are Healthcare Support (100.0%), Firefighting & Prevention (45.9%), and Cleaning & Maintenance (44.9%).
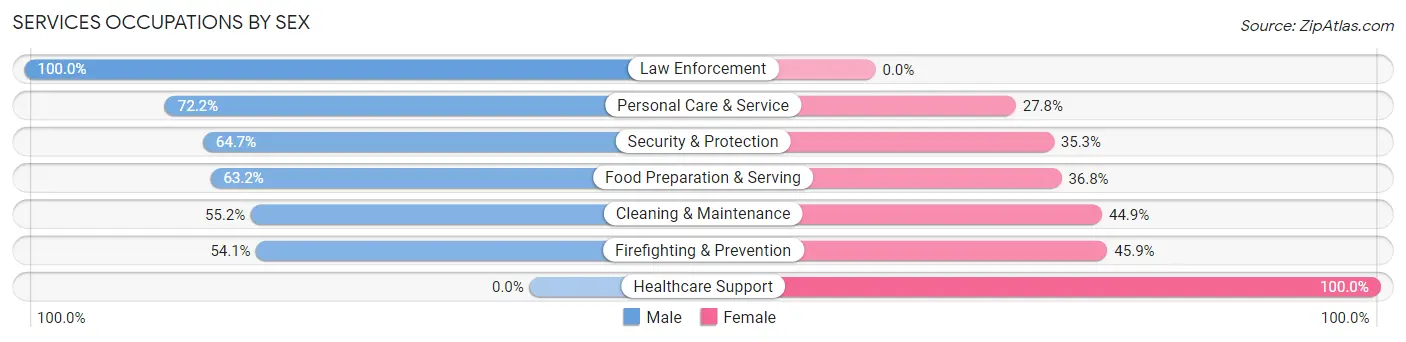
| Occupation | Male | Female |
| Healthcare Support | 0 (0.0%) | 93 (100.0%) |
| Security & Protection | 185 (64.7%) | 101 (35.3%) |
| Firefighting & Prevention | 119 (54.1%) | 101 (45.9%) |
| Law Enforcement | 66 (100.0%) | 0 (0.0%) |
| Food Preparation & Serving | 194 (63.2%) | 113 (36.8%) |
| Cleaning & Maintenance | 75 (55.1%) | 61 (44.9%) |
| Personal Care & Service | 117 (72.2%) | 45 (27.8%) |
| Total (Category) | 571 (58.0%) | 413 (42.0%) |
| Total (Overall) | 2,587 (55.5%) | 2,072 (44.5%) |
Sales and Office Occupations
The most common Sales and Office occupations in Rio Grande are Sales & Related (812 | 17.4%), and Office & Administration (616 | 13.2%).

Sales and Office Occupations by Sex

| Occupation | Male | Female |
| Sales & Related | 336 (41.4%) | 476 (58.6%) |
| Office & Administration | 232 (37.7%) | 384 (62.3%) |
| Total (Category) | 568 (39.8%) | 860 (60.2%) |
| Total (Overall) | 2,587 (55.5%) | 2,072 (44.5%) |
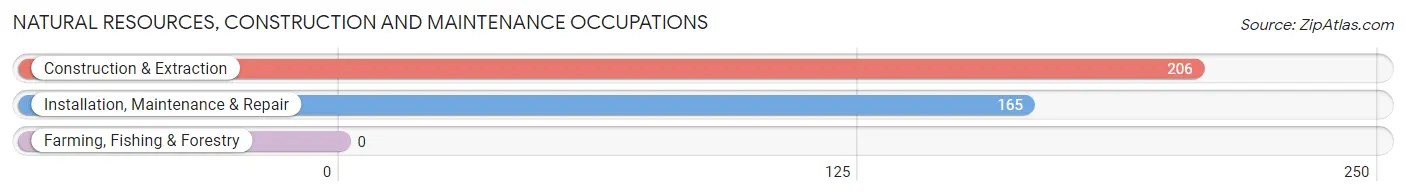
Natural Resources, Construction and Maintenance Occupations
The most common Natural Resources, Construction and Maintenance occupations in Rio Grande are Construction & Extraction (206 | 4.4%), and Installation, Maintenance & Repair (165 | 3.5%).
Natural Resources, Construction and Maintenance Occupations by Sex
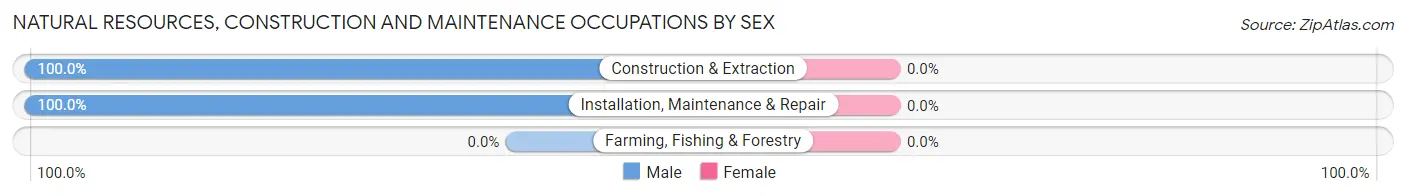
| Occupation | Male | Female |
| Farming, Fishing & Forestry | 0 (0.0%) | 0 (0.0%) |
| Construction & Extraction | 206 (100.0%) | 0 (0.0%) |
| Installation, Maintenance & Repair | 165 (100.0%) | 0 (0.0%) |
| Total (Category) | 371 (100.0%) | 0 (0.0%) |
| Total (Overall) | 2,587 (55.5%) | 2,072 (44.5%) |
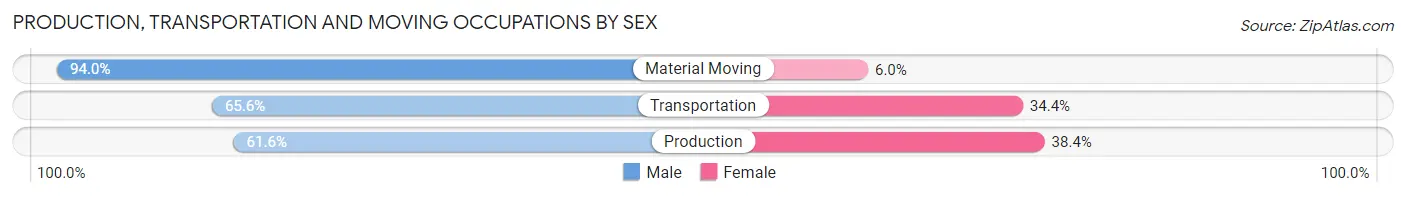
Production, Transportation and Moving Occupations
The most common Production, Transportation and Moving occupations in Rio Grande are Material Moving (285 | 6.1%), Production (258 | 5.5%), and Transportation (256 | 5.5%).

Production, Transportation and Moving Occupations by Sex
| Occupation | Male | Female |
| Production | 159 (61.6%) | 99 (38.4%) |
| Transportation | 168 (65.6%) | 88 (34.4%) |
| Material Moving | 268 (94.0%) | 17 (6.0%) |
| Total (Category) | 595 (74.5%) | 204 (25.5%) |
| Total (Overall) | 2,587 (55.5%) | 2,072 (44.5%) |
Employment Industries by Sex in Rio Grande
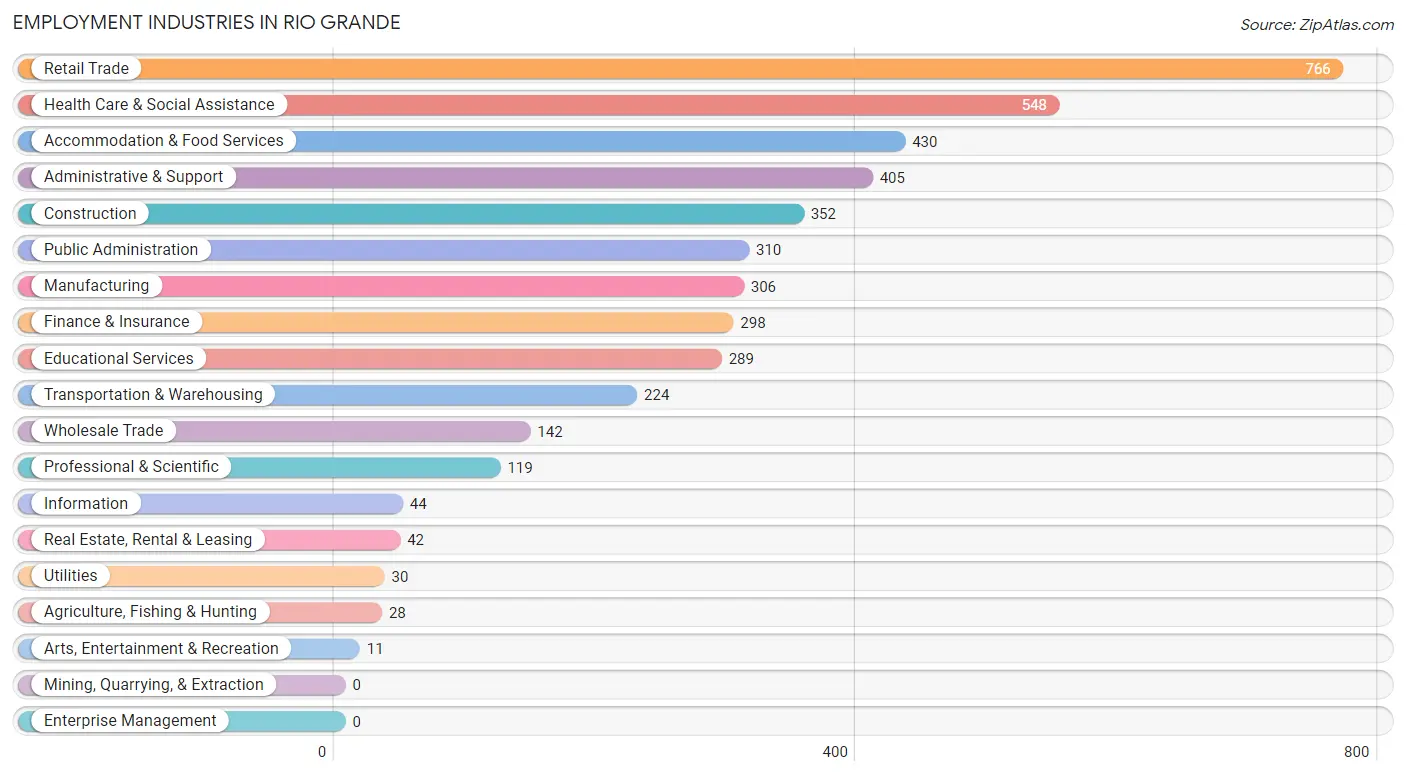
Employment Industries in Rio Grande
The major employment industries in Rio Grande include Retail Trade (766 | 16.4%), Health Care & Social Assistance (548 | 11.8%), Accommodation & Food Services (430 | 9.2%), Administrative & Support (405 | 8.7%), and Construction (352 | 7.6%).
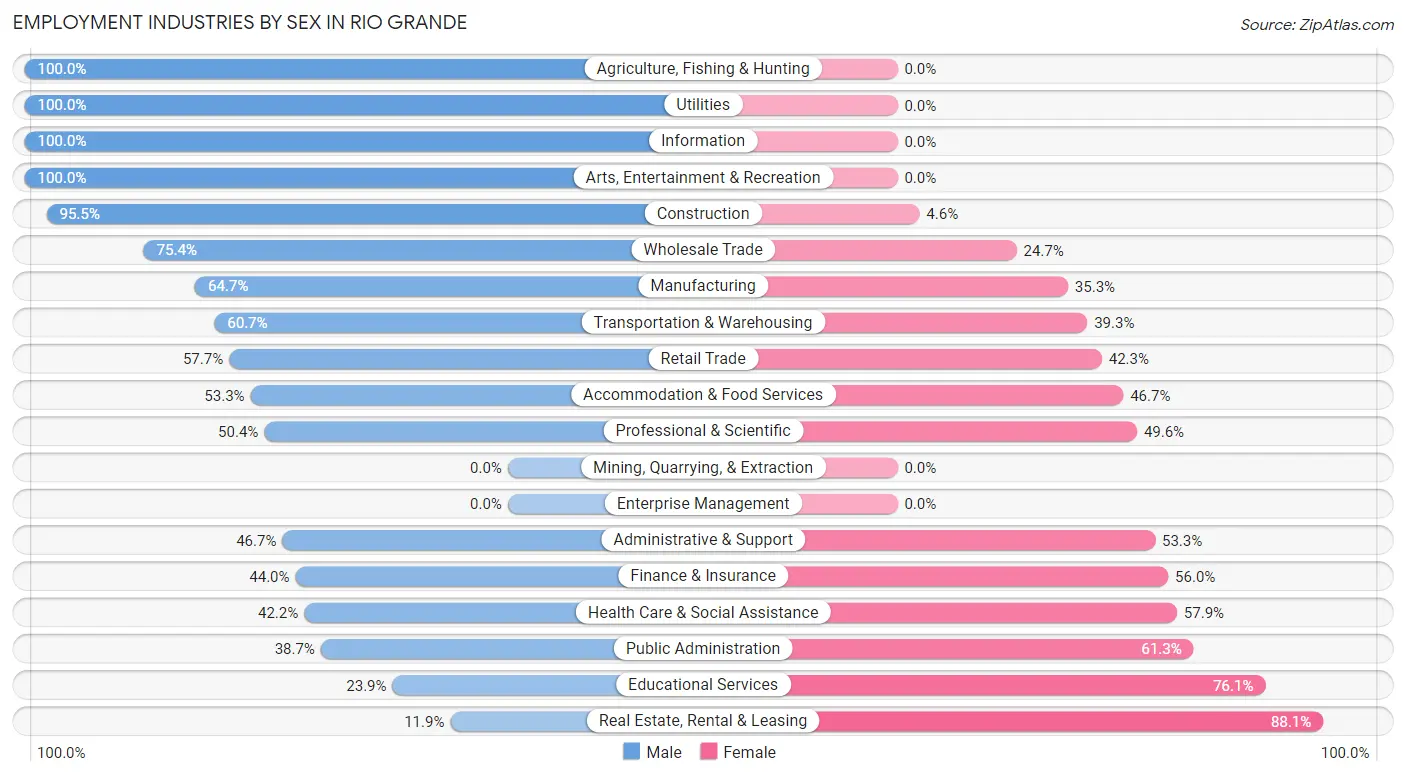
Employment Industries by Sex in Rio Grande
The Rio Grande industries that see more men than women are Agriculture, Fishing & Hunting (100.0%), Utilities (100.0%), and Information (100.0%), whereas the industries that tend to have a higher number of women are Real Estate, Rental & Leasing (88.1%), Educational Services (76.1%), and Public Administration (61.3%).
| Industry | Male | Female |
| Agriculture, Fishing & Hunting | 28 (100.0%) | 0 (0.0%) |
| Mining, Quarrying, & Extraction | 0 (0.0%) | 0 (0.0%) |
| Construction | 336 (95.5%) | 16 (4.5%) |
| Manufacturing | 198 (64.7%) | 108 (35.3%) |
| Wholesale Trade | 107 (75.3%) | 35 (24.6%) |
| Retail Trade | 442 (57.7%) | 324 (42.3%) |
| Transportation & Warehousing | 136 (60.7%) | 88 (39.3%) |
| Utilities | 30 (100.0%) | 0 (0.0%) |
| Information | 44 (100.0%) | 0 (0.0%) |
| Finance & Insurance | 131 (44.0%) | 167 (56.0%) |
| Real Estate, Rental & Leasing | 5 (11.9%) | 37 (88.1%) |
| Professional & Scientific | 60 (50.4%) | 59 (49.6%) |
| Enterprise Management | 0 (0.0%) | 0 (0.0%) |
| Administrative & Support | 189 (46.7%) | 216 (53.3%) |
| Educational Services | 69 (23.9%) | 220 (76.1%) |
| Health Care & Social Assistance | 231 (42.1%) | 317 (57.9%) |
| Arts, Entertainment & Recreation | 11 (100.0%) | 0 (0.0%) |
| Accommodation & Food Services | 229 (53.3%) | 201 (46.7%) |
| Public Administration | 120 (38.7%) | 190 (61.3%) |
| Total | 2,587 (55.5%) | 2,072 (44.5%) |
Education in Rio Grande
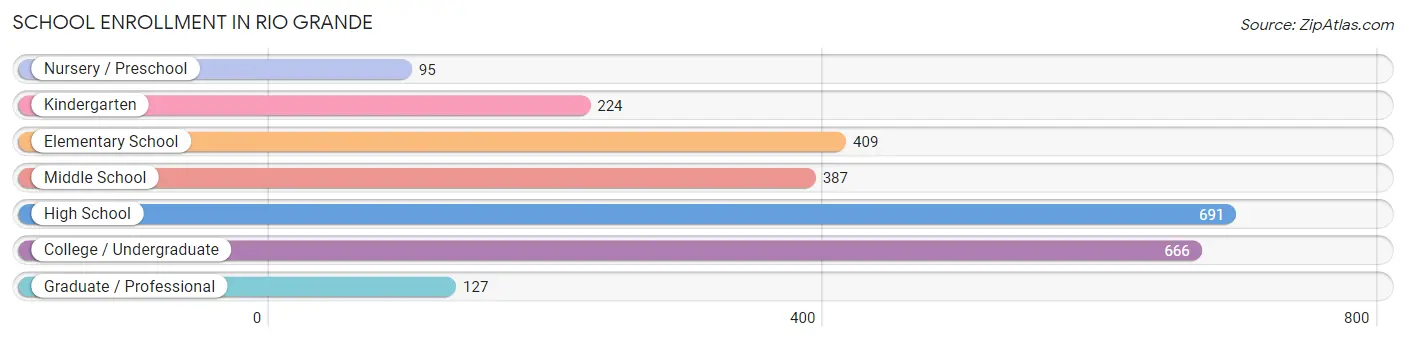
School Enrollment in Rio Grande
The most common levels of schooling among the 2,599 students in Rio Grande are high school (691 | 26.6%), college / undergraduate (666 | 25.6%), and elementary school (409 | 15.7%).
| School Level | # Students | % Students |
| Nursery / Preschool | 95 | 3.7% |
| Kindergarten | 224 | 8.6% |
| Elementary School | 409 | 15.7% |
| Middle School | 387 | 14.9% |
| High School | 691 | 26.6% |
| College / Undergraduate | 666 | 25.6% |
| Graduate / Professional | 127 | 4.9% |
| Total | 2,599 | 100.0% |
School Enrollment by Age by Funding Source in Rio Grande
Out of a total of 2,599 students who are enrolled in schools in Rio Grande, 1,089 (41.9%) attend a private institution, while the remaining 1,510 (58.1%) are enrolled in public schools. The age group of 35 years and over has the highest likelihood of being enrolled in private schools, with 31 (67.4% in the age bracket) enrolled. Conversely, the age group of 3 to 4 year olds has the lowest likelihood of being enrolled in a private school, with 61 (80.3% in the age bracket) attending a public institution.
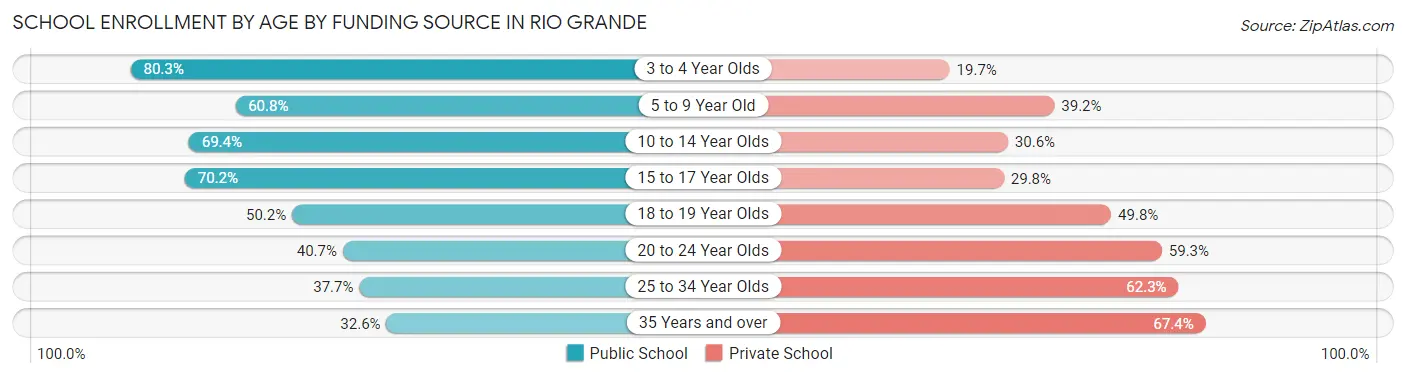
| Age Bracket | Public School | Private School |
| 3 to 4 Year Olds | 61 (80.3%) | 15 (19.7%) |
| 5 to 9 Year Old | 384 (60.8%) | 248 (39.2%) |
| 10 to 14 Year Olds | 379 (69.4%) | 167 (30.6%) |
| 15 to 17 Year Olds | 301 (70.2%) | 128 (29.8%) |
| 18 to 19 Year Olds | 140 (50.2%) | 139 (49.8%) |
| 20 to 24 Year Olds | 112 (40.7%) | 163 (59.3%) |
| 25 to 34 Year Olds | 119 (37.7%) | 197 (62.3%) |
| 35 Years and over | 15 (32.6%) | 31 (67.4%) |
| Total | 1,510 (58.1%) | 1,089 (41.9%) |
Educational Attainment by Field of Study in Rio Grande
Business (706 | 28.8%), science & technology (532 | 21.7%), education (487 | 19.9%), arts & humanities (240 | 9.8%), and computers & mathematics (129 | 5.3%) are the most common fields of study among 2,453 individuals in Rio Grande who have obtained a bachelor's degree or higher.
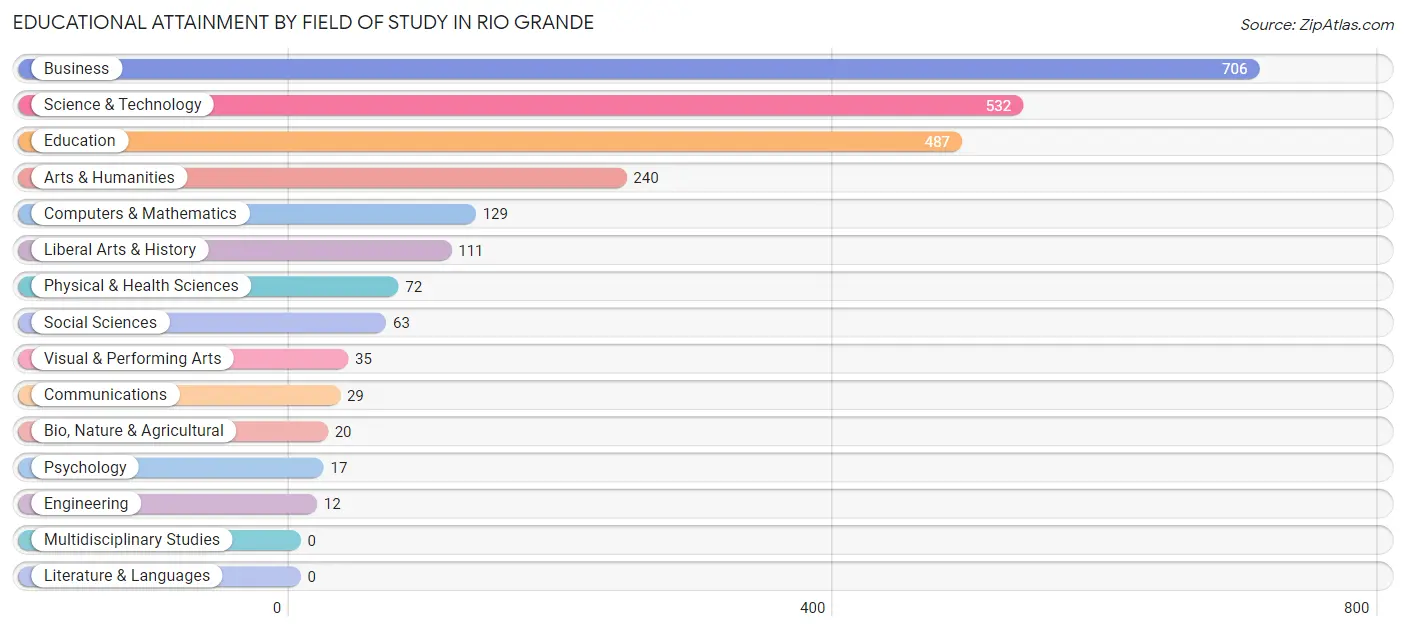
| Field of Study | # Graduates | % Graduates |
| Computers & Mathematics | 129 | 5.3% |
| Bio, Nature & Agricultural | 20 | 0.8% |
| Physical & Health Sciences | 72 | 2.9% |
| Psychology | 17 | 0.7% |
| Social Sciences | 63 | 2.6% |
| Engineering | 12 | 0.5% |
| Multidisciplinary Studies | 0 | 0.0% |
| Science & Technology | 532 | 21.7% |
| Business | 706 | 28.8% |
| Education | 487 | 19.9% |
| Literature & Languages | 0 | 0.0% |
| Liberal Arts & History | 111 | 4.5% |
| Visual & Performing Arts | 35 | 1.4% |
| Communications | 29 | 1.2% |
| Arts & Humanities | 240 | 9.8% |
| Total | 2,453 | 100.0% |
Transportation & Commute in Rio Grande
Vehicle Availability by Sex in Rio Grande
The most prevalent vehicle ownership categories in Rio Grande are males with 2 vehicles (1,025, accounting for 42.6%) and females with 2 vehicles (543, making up 55.1%).
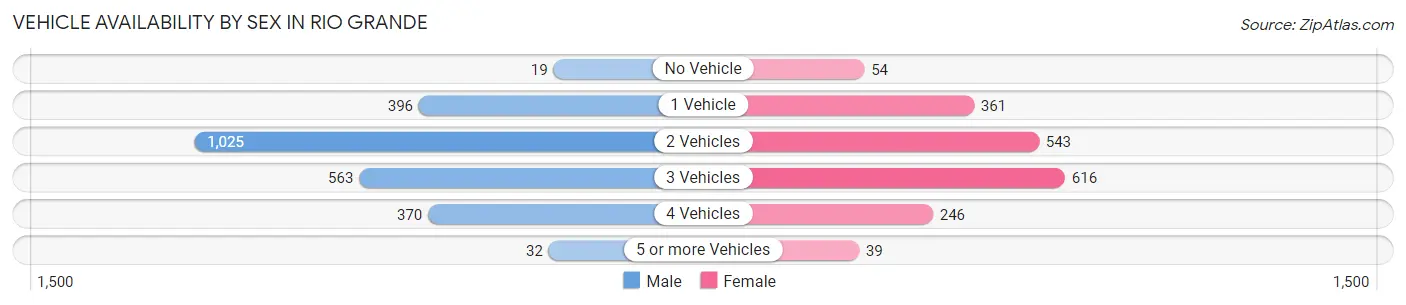
| Vehicles Available | Male | Female |
| No Vehicle | 19 (0.8%) | 54 (2.9%) |
| 1 Vehicle | 396 (16.5%) | 361 (19.4%) |
| 2 Vehicles | 1,025 (42.6%) | 543 (29.2%) |
| 3 Vehicles | 563 (23.4%) | 616 (33.1%) |
| 4 Vehicles | 370 (15.4%) | 246 (13.2%) |
| 5 or more Vehicles | 32 (1.3%) | 39 (2.1%) |
| Total | 2,405 (100.0%) | 1,859 (100.0%) |
Commute Time in Rio Grande
The most frequently occuring commute durations in Rio Grande are 60 to 89 minutes (967 commuters, 23.9%), 30 to 34 minutes (618 commuters, 15.2%), and 45 to 59 minutes (513 commuters, 12.7%).
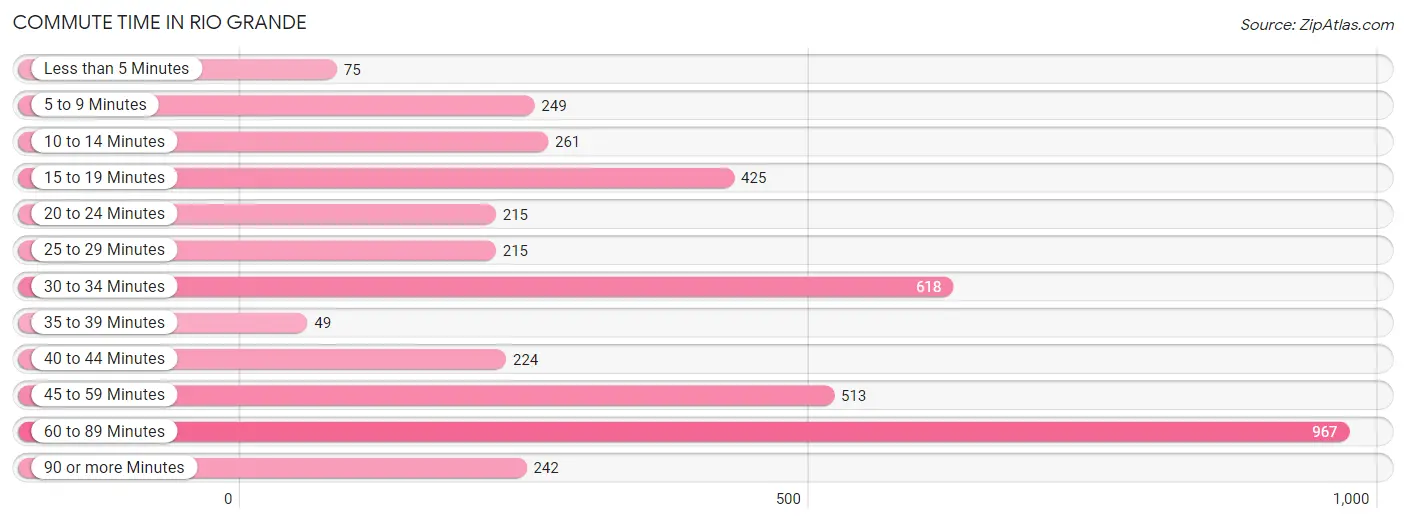
| Commute Time | # Commuters | % Commuters |
| Less than 5 Minutes | 75 | 1.8% |
| 5 to 9 Minutes | 249 | 6.1% |
| 10 to 14 Minutes | 261 | 6.4% |
| 15 to 19 Minutes | 425 | 10.5% |
| 20 to 24 Minutes | 215 | 5.3% |
| 25 to 29 Minutes | 215 | 5.3% |
| 30 to 34 Minutes | 618 | 15.2% |
| 35 to 39 Minutes | 49 | 1.2% |
| 40 to 44 Minutes | 224 | 5.5% |
| 45 to 59 Minutes | 513 | 12.7% |
| 60 to 89 Minutes | 967 | 23.9% |
| 90 or more Minutes | 242 | 6.0% |
Commute Time by Sex in Rio Grande
The most common commute times in Rio Grande are 60 to 89 minutes (510 commuters, 22.5%) for males and 60 to 89 minutes (457 commuters, 25.6%) for females.
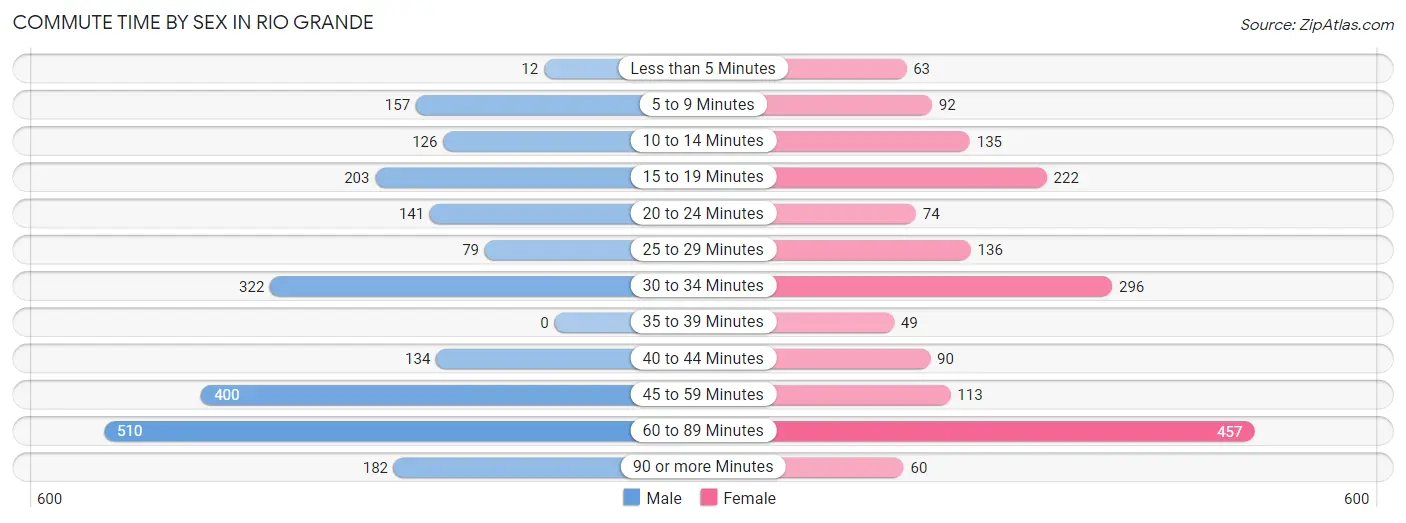
| Commute Time | Male | Female |
| Less than 5 Minutes | 12 (0.5%) | 63 (3.5%) |
| 5 to 9 Minutes | 157 (6.9%) | 92 (5.1%) |
| 10 to 14 Minutes | 126 (5.6%) | 135 (7.5%) |
| 15 to 19 Minutes | 203 (9.0%) | 222 (12.4%) |
| 20 to 24 Minutes | 141 (6.2%) | 74 (4.1%) |
| 25 to 29 Minutes | 79 (3.5%) | 136 (7.6%) |
| 30 to 34 Minutes | 322 (14.2%) | 296 (16.6%) |
| 35 to 39 Minutes | 0 (0.0%) | 49 (2.7%) |
| 40 to 44 Minutes | 134 (5.9%) | 90 (5.0%) |
| 45 to 59 Minutes | 400 (17.6%) | 113 (6.3%) |
| 60 to 89 Minutes | 510 (22.5%) | 457 (25.6%) |
| 90 or more Minutes | 182 (8.0%) | 60 (3.4%) |
Time of Departure to Work by Sex in Rio Grande
The most frequent times of departure to work in Rio Grande are 6:00 AM to 6:29 AM (379, 16.7%) for males and 7:00 AM to 7:29 AM (447, 25.0%) for females.
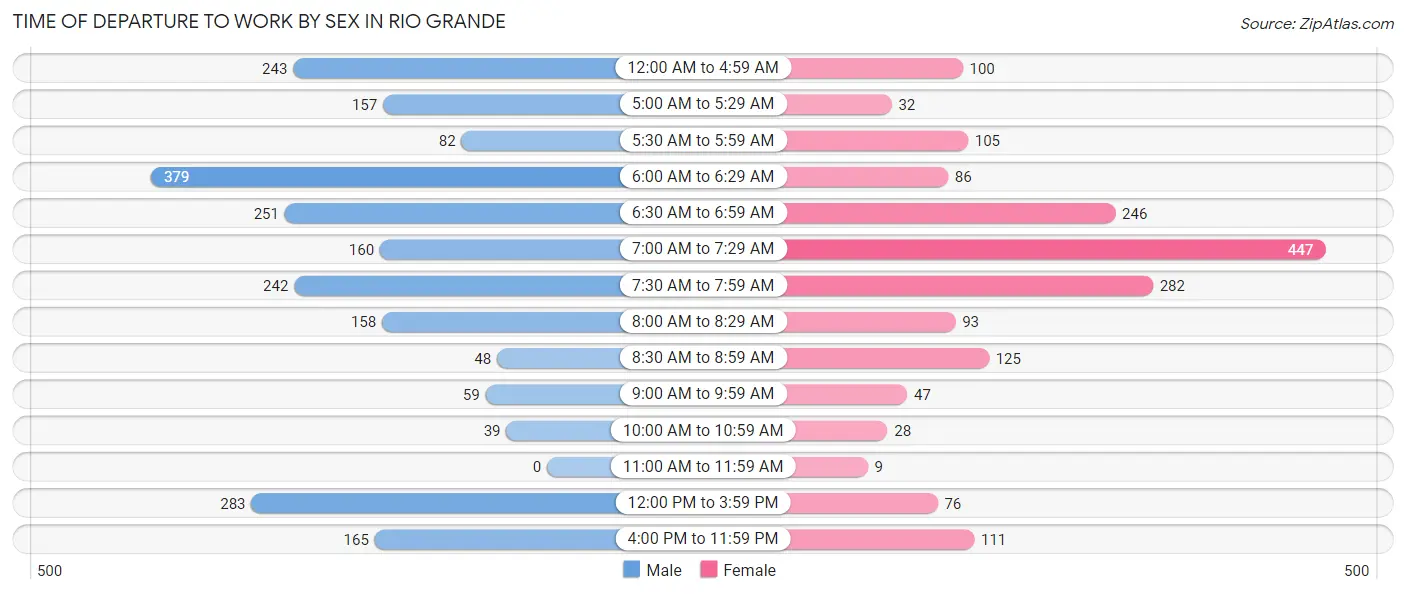
| Time of Departure | Male | Female |
| 12:00 AM to 4:59 AM | 243 (10.7%) | 100 (5.6%) |
| 5:00 AM to 5:29 AM | 157 (6.9%) | 32 (1.8%) |
| 5:30 AM to 5:59 AM | 82 (3.6%) | 105 (5.9%) |
| 6:00 AM to 6:29 AM | 379 (16.7%) | 86 (4.8%) |
| 6:30 AM to 6:59 AM | 251 (11.1%) | 246 (13.8%) |
| 7:00 AM to 7:29 AM | 160 (7.1%) | 447 (25.0%) |
| 7:30 AM to 7:59 AM | 242 (10.7%) | 282 (15.8%) |
| 8:00 AM to 8:29 AM | 158 (7.0%) | 93 (5.2%) |
| 8:30 AM to 8:59 AM | 48 (2.1%) | 125 (7.0%) |
| 9:00 AM to 9:59 AM | 59 (2.6%) | 47 (2.6%) |
| 10:00 AM to 10:59 AM | 39 (1.7%) | 28 (1.6%) |
| 11:00 AM to 11:59 AM | 0 (0.0%) | 9 (0.5%) |
| 12:00 PM to 3:59 PM | 283 (12.5%) | 76 (4.3%) |
| 4:00 PM to 11:59 PM | 165 (7.3%) | 111 (6.2%) |
| Total | 2,266 (100.0%) | 1,787 (100.0%) |
Housing Occupancy in Rio Grande
Occupancy by Ownership in Rio Grande
Of the total 4,385 dwellings in Rio Grande, owner-occupied units account for 2,818 (64.3%), while renter-occupied units make up 1,567 (35.7%).
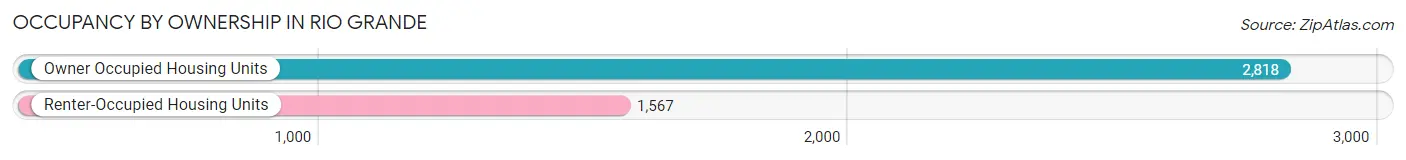
| Occupancy | # Housing Units | % Housing Units |
| Owner Occupied Housing Units | 2,818 | 64.3% |
| Renter-Occupied Housing Units | 1,567 | 35.7% |
| Total Occupied Housing Units | 4,385 | 100.0% |
Occupancy by Household Size in Rio Grande
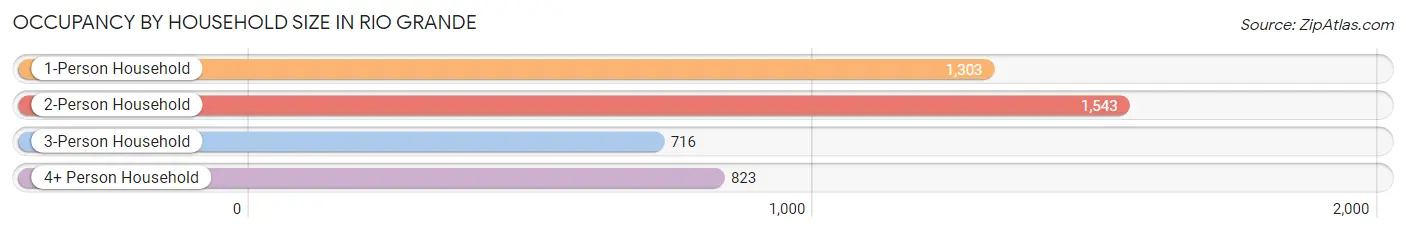
| Household Size | # Housing Units | % Housing Units |
| 1-Person Household | 1,303 | 29.7% |
| 2-Person Household | 1,543 | 35.2% |
| 3-Person Household | 716 | 16.3% |
| 4+ Person Household | 823 | 18.8% |
| Total Housing Units | 4,385 | 100.0% |
Occupancy by Ownership by Household Size in Rio Grande
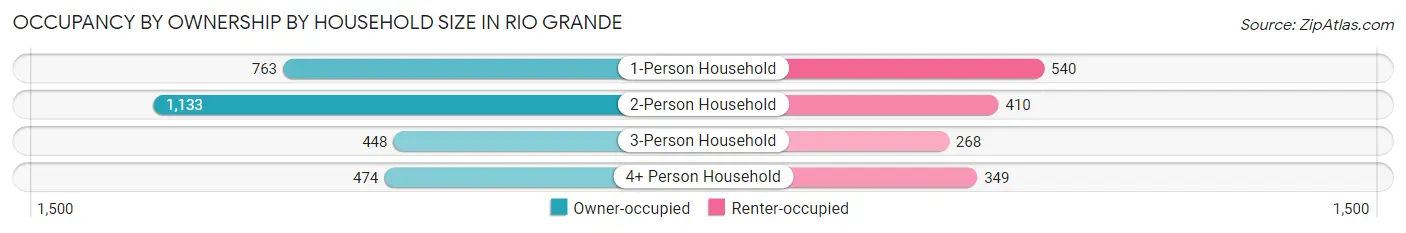
| Household Size | Owner-occupied | Renter-occupied |
| 1-Person Household | 763 (58.6%) | 540 (41.4%) |
| 2-Person Household | 1,133 (73.4%) | 410 (26.6%) |
| 3-Person Household | 448 (62.6%) | 268 (37.4%) |
| 4+ Person Household | 474 (57.6%) | 349 (42.4%) |
| Total Housing Units | 2,818 (64.3%) | 1,567 (35.7%) |
Occupancy by Educational Attainment in Rio Grande
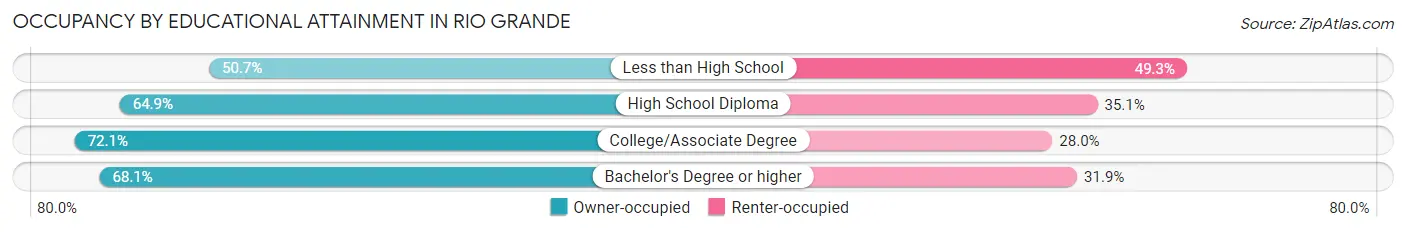
| Household Size | Owner-occupied | Renter-occupied |
| Less than High School | 483 (50.7%) | 469 (49.3%) |
| High School Diploma | 889 (64.9%) | 481 (35.1%) |
| College/Associate Degree | 745 (72.1%) | 289 (28.0%) |
| Bachelor's Degree or higher | 701 (68.1%) | 328 (31.9%) |
Occupancy by Age of Householder in Rio Grande
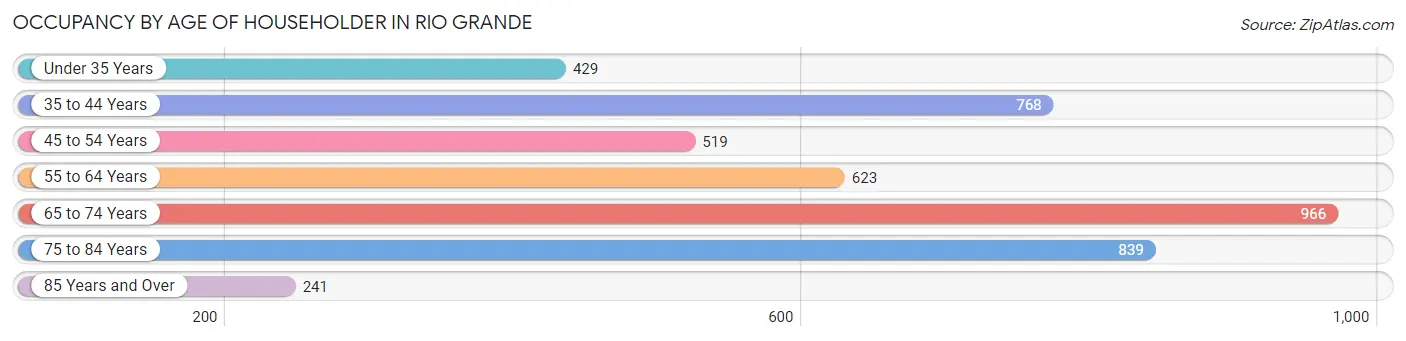
| Age Bracket | # Households | % Households |
| Under 35 Years | 429 | 9.8% |
| 35 to 44 Years | 768 | 17.5% |
| 45 to 54 Years | 519 | 11.8% |
| 55 to 64 Years | 623 | 14.2% |
| 65 to 74 Years | 966 | 22.0% |
| 75 to 84 Years | 839 | 19.1% |
| 85 Years and Over | 241 | 5.5% |
| Total | 4,385 | 100.0% |
Housing Finances in Rio Grande
Median Income by Occupancy in Rio Grande
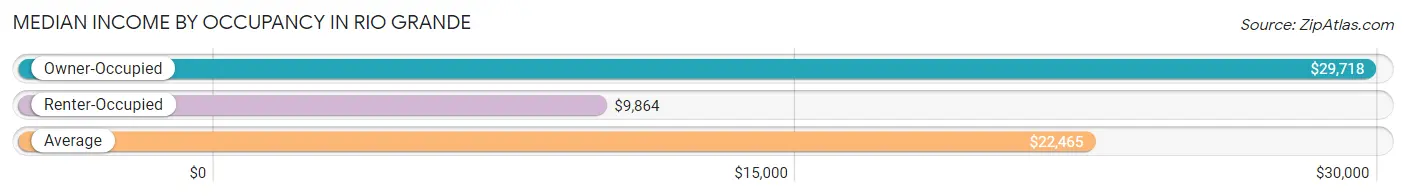
| Occupancy Type | # Households | Median Income |
| Owner-Occupied | 2,818 (64.3%) | $29,718 |
| Renter-Occupied | 1,567 (35.7%) | $9,864 |
| Average | 4,385 (100.0%) | $22,465 |
Occupancy by Householder Income Bracket in Rio Grande
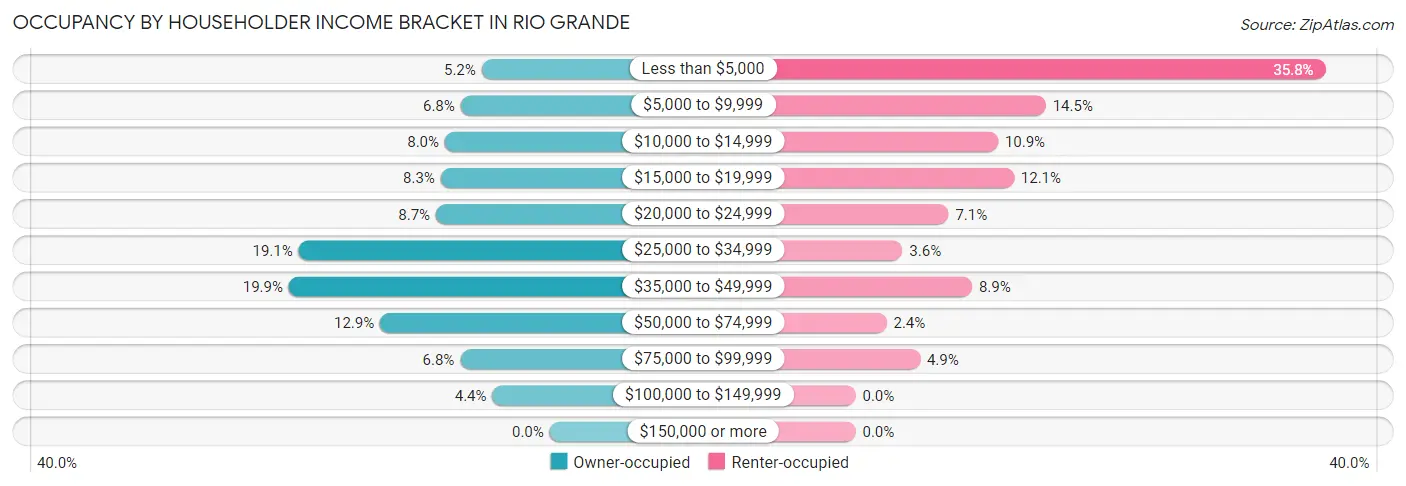
| Income Bracket | Owner-occupied | Renter-occupied |
| Less than $5,000 | 146 (5.2%) | 561 (35.8%) |
| $5,000 to $9,999 | 191 (6.8%) | 227 (14.5%) |
| $10,000 to $14,999 | 225 (8.0%) | 170 (10.8%) |
| $15,000 to $19,999 | 234 (8.3%) | 189 (12.1%) |
| $20,000 to $24,999 | 244 (8.7%) | 111 (7.1%) |
| $25,000 to $34,999 | 539 (19.1%) | 56 (3.6%) |
| $35,000 to $49,999 | 560 (19.9%) | 139 (8.9%) |
| $50,000 to $74,999 | 364 (12.9%) | 37 (2.4%) |
| $75,000 to $99,999 | 192 (6.8%) | 77 (4.9%) |
| $100,000 to $149,999 | 123 (4.4%) | 0 (0.0%) |
| $150,000 or more | 0 (0.0%) | 0 (0.0%) |
| Total | 2,818 (100.0%) | 1,567 (100.0%) |
Monthly Housing Cost Tiers in Rio Grande
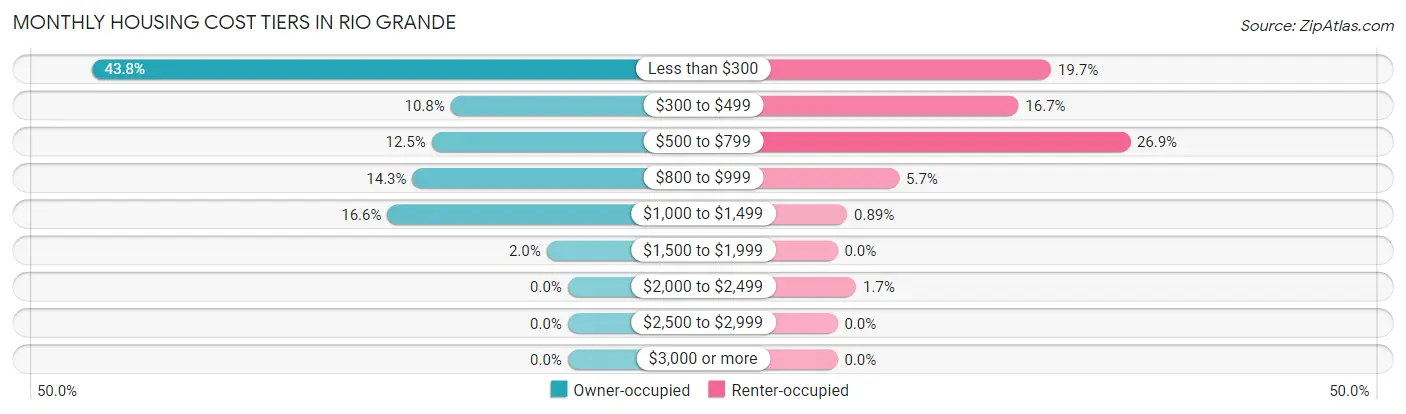
| Monthly Cost | Owner-occupied | Renter-occupied |
| Less than $300 | 1,235 (43.8%) | 308 (19.7%) |
| $300 to $499 | 304 (10.8%) | 261 (16.7%) |
| $500 to $799 | 353 (12.5%) | 422 (26.9%) |
| $800 to $999 | 403 (14.3%) | 89 (5.7%) |
| $1,000 to $1,499 | 468 (16.6%) | 14 (0.9%) |
| $1,500 to $1,999 | 55 (1.9%) | 0 (0.0%) |
| $2,000 to $2,499 | 0 (0.0%) | 27 (1.7%) |
| $2,500 to $2,999 | 0 (0.0%) | 0 (0.0%) |
| $3,000 or more | 0 (0.0%) | 0 (0.0%) |
| Total | 2,818 (100.0%) | 1,567 (100.0%) |
Physical Housing Characteristics in Rio Grande
Housing Structures in Rio Grande
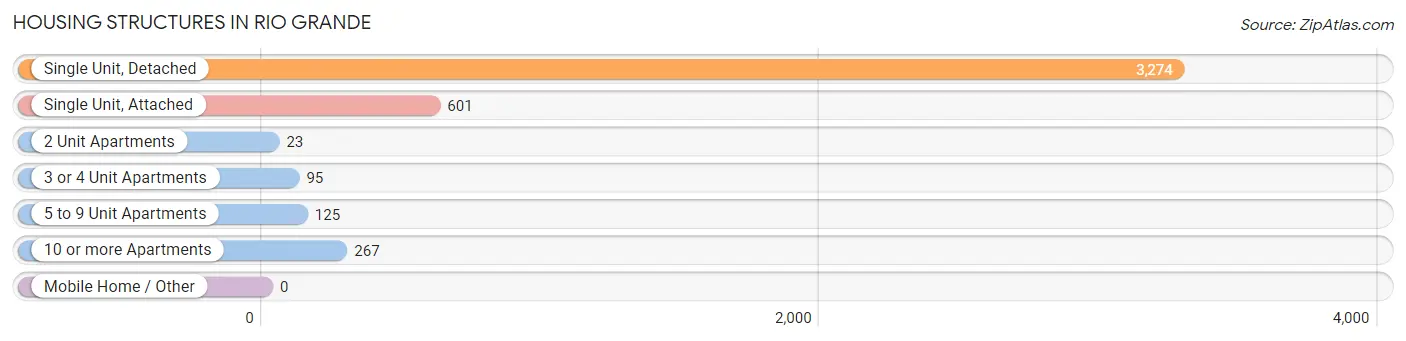
| Structure Type | # Housing Units | % Housing Units |
| Single Unit, Detached | 3,274 | 74.7% |
| Single Unit, Attached | 601 | 13.7% |
| 2 Unit Apartments | 23 | 0.5% |
| 3 or 4 Unit Apartments | 95 | 2.2% |
| 5 to 9 Unit Apartments | 125 | 2.9% |
| 10 or more Apartments | 267 | 6.1% |
| Mobile Home / Other | 0 | 0.0% |
| Total | 4,385 | 100.0% |
Housing Structures by Occupancy in Rio Grande
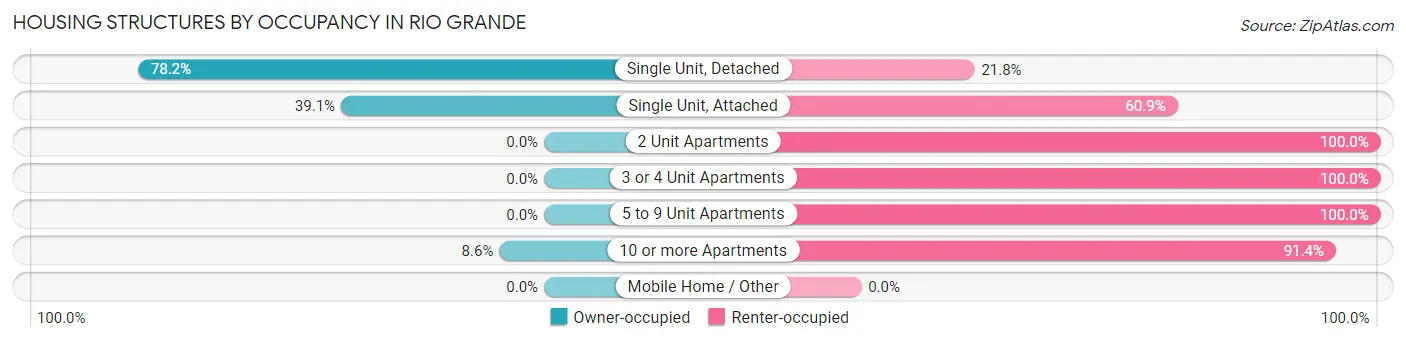
| Structure Type | Owner-occupied | Renter-occupied |
| Single Unit, Detached | 2,560 (78.2%) | 714 (21.8%) |
| Single Unit, Attached | 235 (39.1%) | 366 (60.9%) |
| 2 Unit Apartments | 0 (0.0%) | 23 (100.0%) |
| 3 or 4 Unit Apartments | 0 (0.0%) | 95 (100.0%) |
| 5 to 9 Unit Apartments | 0 (0.0%) | 125 (100.0%) |
| 10 or more Apartments | 23 (8.6%) | 244 (91.4%) |
| Mobile Home / Other | 0 (0.0%) | 0 (0.0%) |
| Total | 2,818 (64.3%) | 1,567 (35.7%) |
Housing Structures by Number of Rooms in Rio Grande
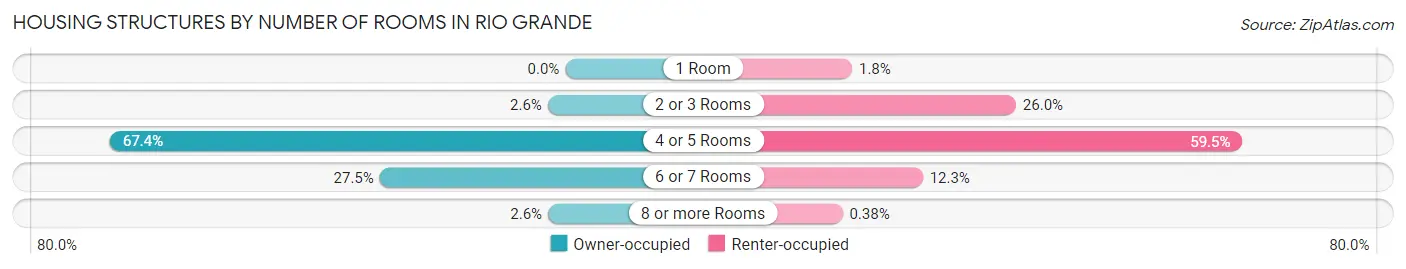
| Number of Rooms | Owner-occupied | Renter-occupied |
| 1 Room | 0 (0.0%) | 28 (1.8%) |
| 2 or 3 Rooms | 73 (2.6%) | 408 (26.0%) |
| 4 or 5 Rooms | 1,899 (67.4%) | 933 (59.5%) |
| 6 or 7 Rooms | 774 (27.5%) | 192 (12.2%) |
| 8 or more Rooms | 72 (2.6%) | 6 (0.4%) |
| Total | 2,818 (100.0%) | 1,567 (100.0%) |
Housing Structure by Heating Type in Rio Grande
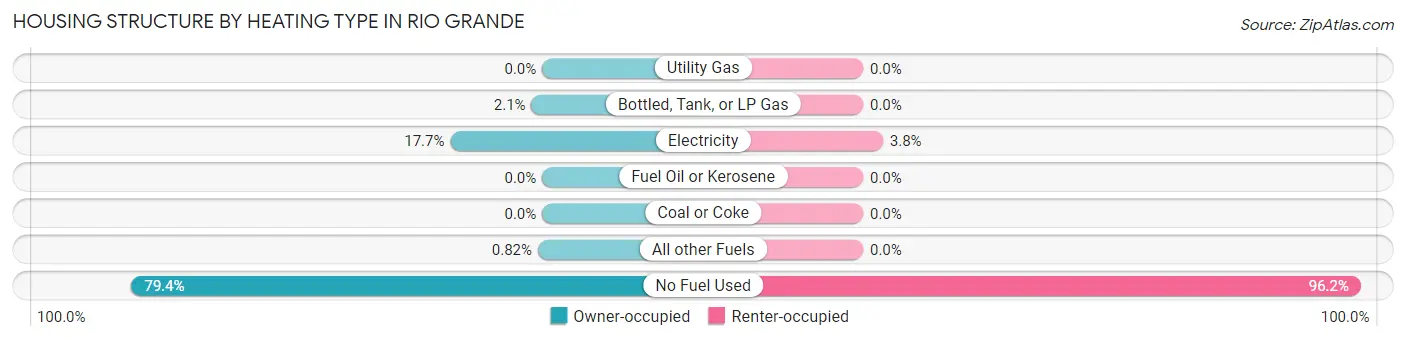
| Heating Type | Owner-occupied | Renter-occupied |
| Utility Gas | 0 (0.0%) | 0 (0.0%) |
| Bottled, Tank, or LP Gas | 58 (2.1%) | 0 (0.0%) |
| Electricity | 500 (17.7%) | 60 (3.8%) |
| Fuel Oil or Kerosene | 0 (0.0%) | 0 (0.0%) |
| Coal or Coke | 0 (0.0%) | 0 (0.0%) |
| All other Fuels | 23 (0.8%) | 0 (0.0%) |
| No Fuel Used | 2,237 (79.4%) | 1,507 (96.2%) |
| Total | 2,818 (100.0%) | 1,567 (100.0%) |
Household Vehicle Usage in Rio Grande
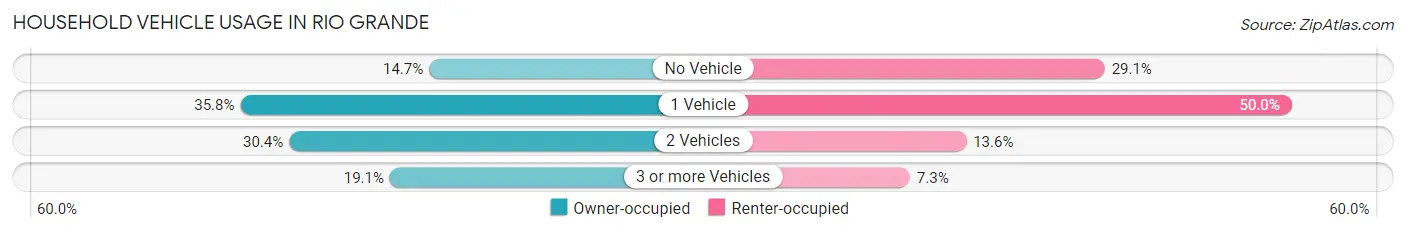
| Vehicles per Household | Owner-occupied | Renter-occupied |
| No Vehicle | 414 (14.7%) | 456 (29.1%) |
| 1 Vehicle | 1,010 (35.8%) | 784 (50.0%) |
| 2 Vehicles | 856 (30.4%) | 213 (13.6%) |
| 3 or more Vehicles | 538 (19.1%) | 114 (7.3%) |
| Total | 2,818 (100.0%) | 1,567 (100.0%) |
Real Estate & Mortgages in Rio Grande
Real Estate and Mortgage Overview in Rio Grande
| Characteristic | Without Mortgage | With Mortgage |
| Housing Units | 1,522 | 1,296 |
| Median Property Value | $128,000 | $129,400 |
| Median Household Income | $26,111 | $0 |
| Monthly Housing Costs | $164 | $0 |
| Real Estate Taxes | $371 | $1,131 |
Property Value by Mortgage Status in Rio Grande
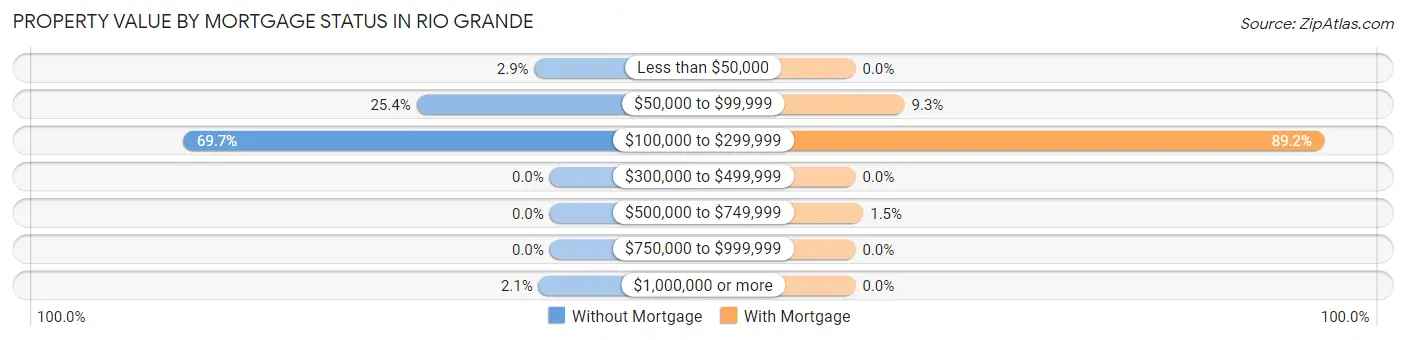
| Property Value | Without Mortgage | With Mortgage |
| Less than $50,000 | 44 (2.9%) | 0 (0.0%) |
| $50,000 to $99,999 | 386 (25.4%) | 121 (9.3%) |
| $100,000 to $299,999 | 1,060 (69.7%) | 1,156 (89.2%) |
| $300,000 to $499,999 | 0 (0.0%) | 0 (0.0%) |
| $500,000 to $749,999 | 0 (0.0%) | 19 (1.5%) |
| $750,000 to $999,999 | 0 (0.0%) | 0 (0.0%) |
| $1,000,000 or more | 32 (2.1%) | 0 (0.0%) |
| Total | 1,522 (100.0%) | 1,296 (100.0%) |
Household Income by Mortgage Status in Rio Grande
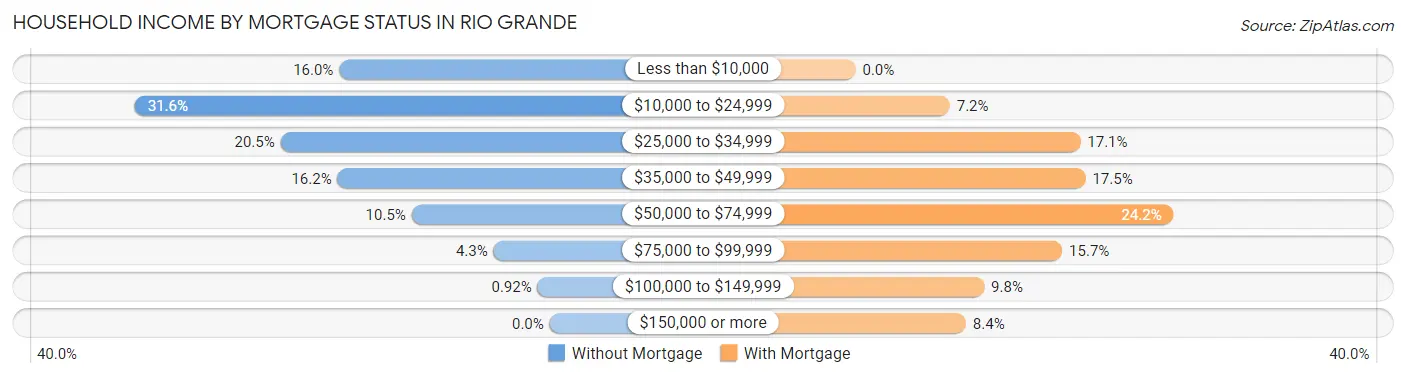
| Household Income | Without Mortgage | With Mortgage |
| Less than $10,000 | 244 (16.0%) | 0 (0.0%) |
| $10,000 to $24,999 | 481 (31.6%) | 93 (7.2%) |
| $25,000 to $34,999 | 312 (20.5%) | 222 (17.1%) |
| $35,000 to $49,999 | 246 (16.2%) | 227 (17.5%) |
| $50,000 to $74,999 | 160 (10.5%) | 314 (24.2%) |
| $75,000 to $99,999 | 65 (4.3%) | 204 (15.7%) |
| $100,000 to $149,999 | 14 (0.9%) | 127 (9.8%) |
| $150,000 or more | 0 (0.0%) | 109 (8.4%) |
| Total | 1,522 (100.0%) | 1,296 (100.0%) |
Property Value to Household Income Ratio in Rio Grande
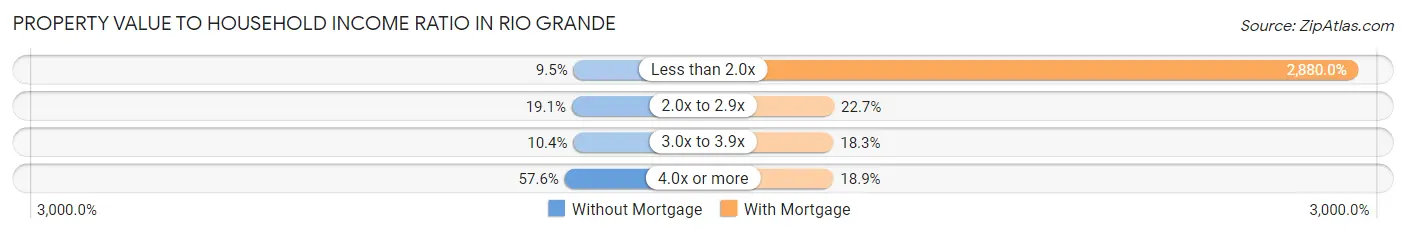
| Value-to-Income Ratio | Without Mortgage | With Mortgage |
| Less than 2.0x | 144 (9.5%) | 37,325 (2,880.0%) |
| 2.0x to 2.9x | 291 (19.1%) | 294 (22.7%) |
| 3.0x to 3.9x | 158 (10.4%) | 237 (18.3%) |
| 4.0x or more | 877 (57.6%) | 245 (18.9%) |
| Total | 1,522 (100.0%) | 1,296 (100.0%) |
Real Estate Taxes by Mortgage Status in Rio Grande
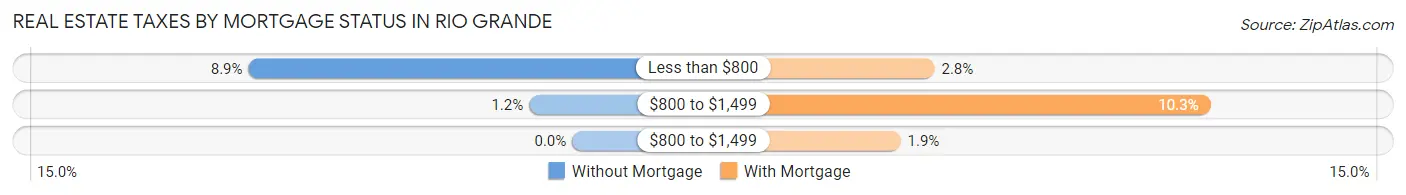
| Property Taxes | Without Mortgage | With Mortgage |
| Less than $800 | 135 (8.9%) | 36 (2.8%) |
| $800 to $1,499 | 18 (1.2%) | 134 (10.3%) |
| $800 to $1,499 | 0 (0.0%) | 24 (1.8%) |
| Total | 1,522 (100.0%) | 1,296 (100.0%) |
Health & Disability in Rio Grande
Health Insurance Coverage by Age in Rio Grande
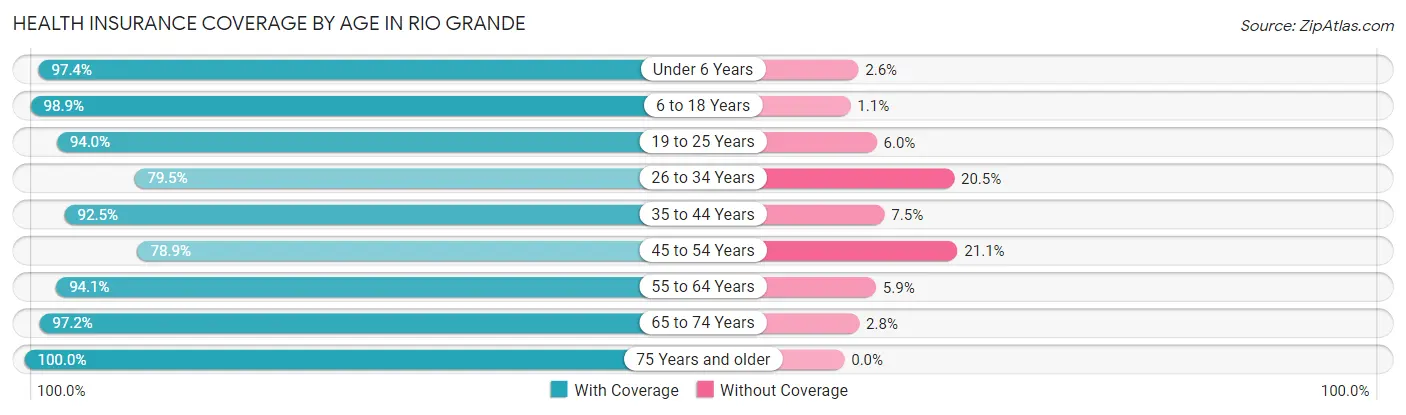
| Age Bracket | With Coverage | Without Coverage |
| Under 6 Years | 707 (97.4%) | 19 (2.6%) |
| 6 to 18 Years | 1,562 (98.9%) | 18 (1.1%) |
| 19 to 25 Years | 1,015 (94.0%) | 65 (6.0%) |
| 26 to 34 Years | 1,353 (79.5%) | 348 (20.5%) |
| 35 to 44 Years | 1,608 (92.5%) | 130 (7.5%) |
| 45 to 54 Years | 1,010 (78.9%) | 270 (21.1%) |
| 55 to 64 Years | 1,052 (94.1%) | 66 (5.9%) |
| 65 to 74 Years | 1,546 (97.2%) | 44 (2.8%) |
| 75 Years and older | 1,498 (100.0%) | 0 (0.0%) |
| Total | 11,351 (92.2%) | 960 (7.8%) |
Health Insurance Coverage by Citizenship Status in Rio Grande
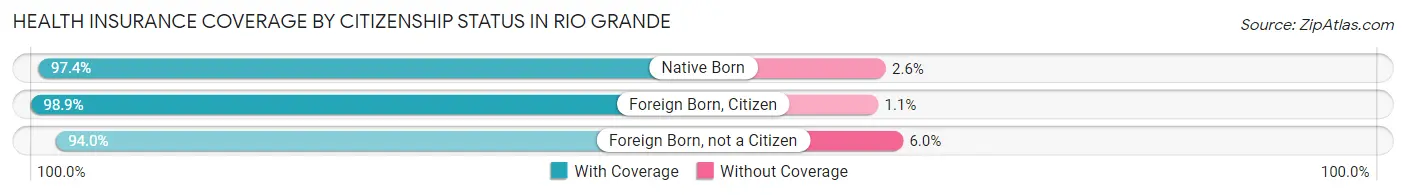
| Citizenship Status | With Coverage | Without Coverage |
| Native Born | 707 (97.4%) | 19 (2.6%) |
| Foreign Born, Citizen | 1,562 (98.9%) | 18 (1.1%) |
| Foreign Born, not a Citizen | 1,015 (94.0%) | 65 (6.0%) |
Health Insurance Coverage by Household Income in Rio Grande
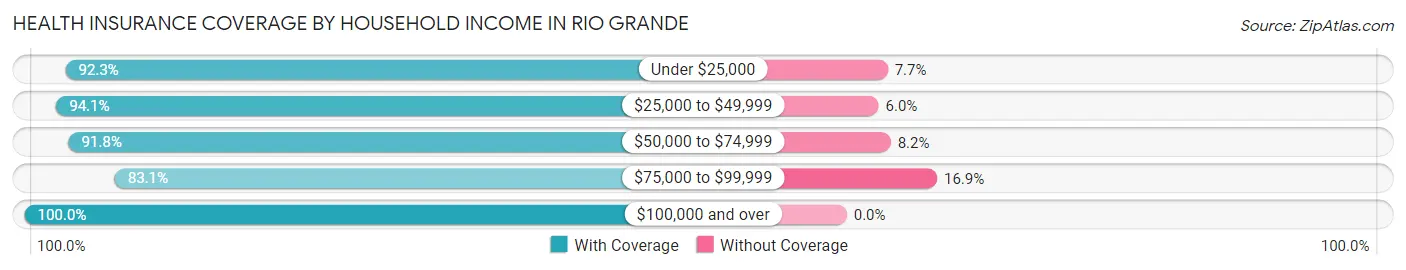
| Household Income | With Coverage | Without Coverage |
| Under $25,000 | 4,665 (92.3%) | 387 (7.7%) |
| $25,000 to $49,999 | 3,684 (94.1%) | 233 (5.9%) |
| $50,000 to $74,999 | 1,561 (91.8%) | 140 (8.2%) |
| $75,000 to $99,999 | 978 (83.1%) | 199 (16.9%) |
| $100,000 and over | 455 (100.0%) | 0 (0.0%) |
Public vs Private Health Insurance Coverage by Age in Rio Grande
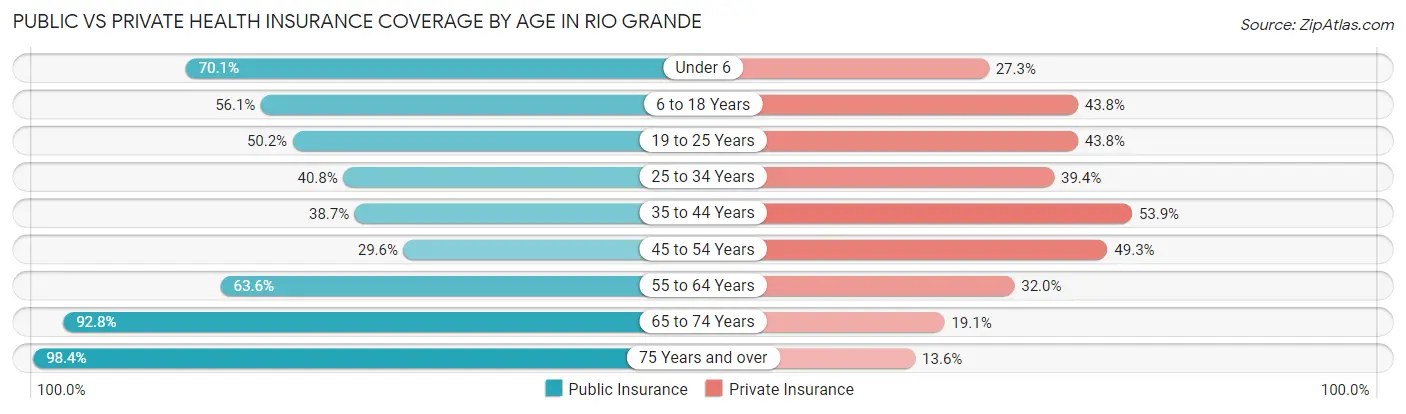
| Age Bracket | Public Insurance | Private Insurance |
| Under 6 | 509 (70.1%) | 198 (27.3%) |
| 6 to 18 Years | 886 (56.1%) | 692 (43.8%) |
| 19 to 25 Years | 542 (50.2%) | 473 (43.8%) |
| 25 to 34 Years | 694 (40.8%) | 670 (39.4%) |
| 35 to 44 Years | 672 (38.7%) | 936 (53.9%) |
| 45 to 54 Years | 379 (29.6%) | 631 (49.3%) |
| 55 to 64 Years | 711 (63.6%) | 358 (32.0%) |
| 65 to 74 Years | 1,476 (92.8%) | 303 (19.1%) |
| 75 Years and over | 1,474 (98.4%) | 204 (13.6%) |
| Total | 7,343 (59.7%) | 4,465 (36.3%) |
Disability Status by Sex by Age in Rio Grande
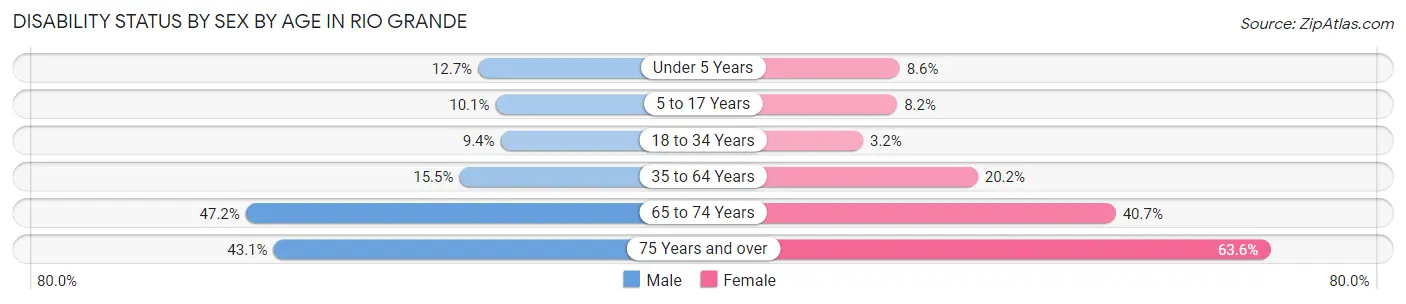
| Age Bracket | Male | Female |
| Under 5 Years | 25 (12.7%) | 27 (8.6%) |
| 5 to 17 Years | 96 (10.1%) | 55 (8.2%) |
| 18 to 34 Years | 137 (9.3%) | 47 (3.2%) |
| 35 to 64 Years | 304 (15.4%) | 438 (20.2%) |
| 65 to 74 Years | 335 (47.2%) | 358 (40.7%) |
| 75 Years and over | 217 (43.1%) | 632 (63.6%) |
Disability Class by Sex by Age in Rio Grande
Disability Class: Hearing Difficulty
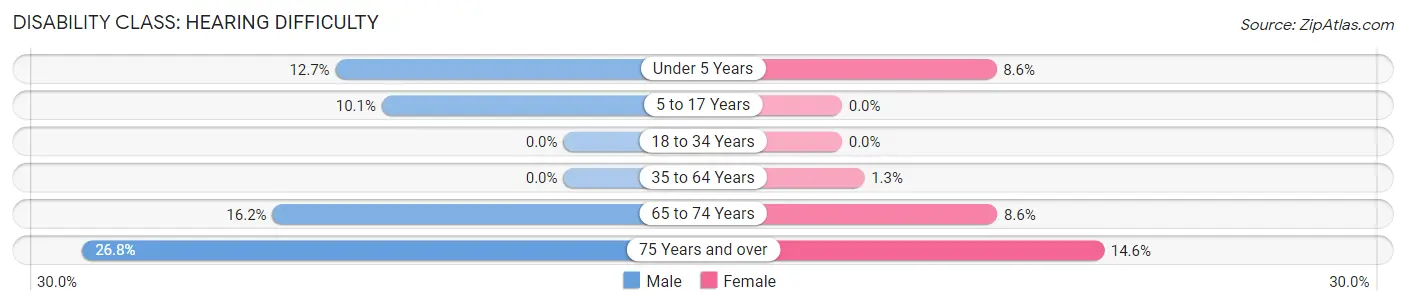
| Age Bracket | Male | Female |
| Under 5 Years | 25 (12.7%) | 27 (8.6%) |
| 5 to 17 Years | 96 (10.1%) | 0 (0.0%) |
| 18 to 34 Years | 0 (0.0%) | 0 (0.0%) |
| 35 to 64 Years | 0 (0.0%) | 27 (1.3%) |
| 65 to 74 Years | 115 (16.2%) | 76 (8.6%) |
| 75 Years and over | 135 (26.8%) | 145 (14.6%) |
Disability Class: Vision Difficulty
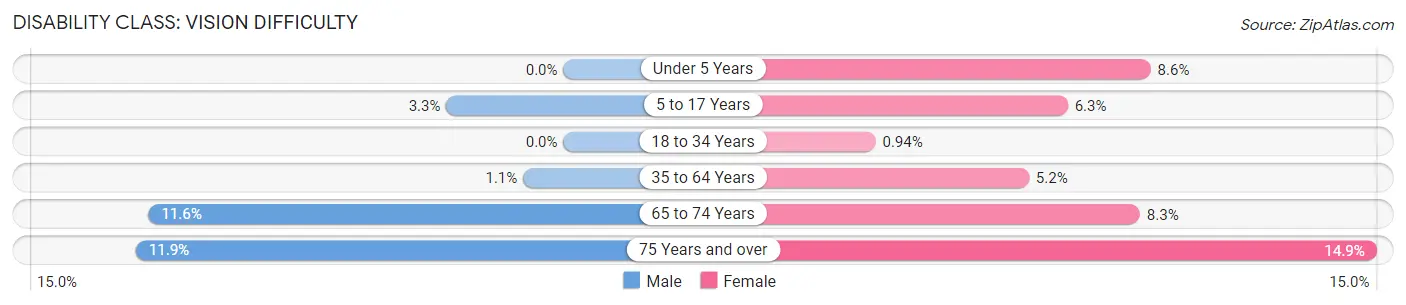
| Age Bracket | Male | Female |
| Under 5 Years | 0 (0.0%) | 27 (8.6%) |
| 5 to 17 Years | 31 (3.3%) | 42 (6.3%) |
| 18 to 34 Years | 0 (0.0%) | 14 (0.9%) |
| 35 to 64 Years | 22 (1.1%) | 113 (5.2%) |
| 65 to 74 Years | 82 (11.6%) | 73 (8.3%) |
| 75 Years and over | 60 (11.9%) | 148 (14.9%) |
Disability Class: Cognitive Difficulty
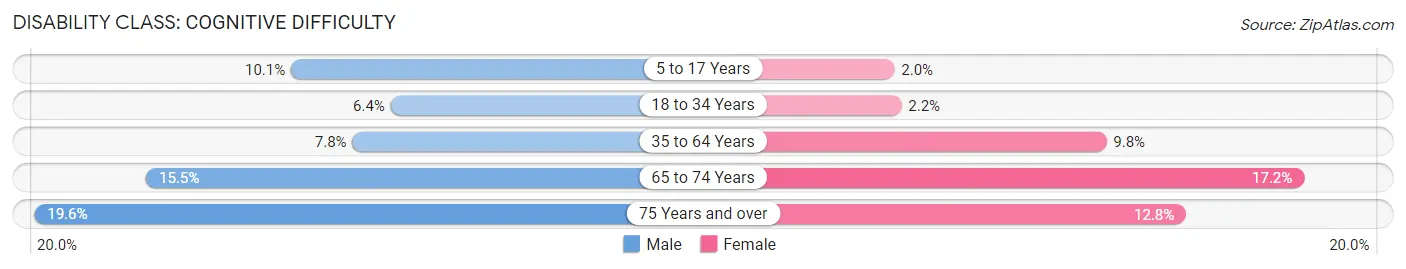
| Age Bracket | Male | Female |
| 5 to 17 Years | 96 (10.1%) | 13 (1.9%) |
| 18 to 34 Years | 94 (6.4%) | 33 (2.2%) |
| 35 to 64 Years | 154 (7.8%) | 213 (9.8%) |
| 65 to 74 Years | 110 (15.5%) | 151 (17.2%) |
| 75 Years and over | 99 (19.6%) | 127 (12.8%) |
Disability Class: Ambulatory Difficulty
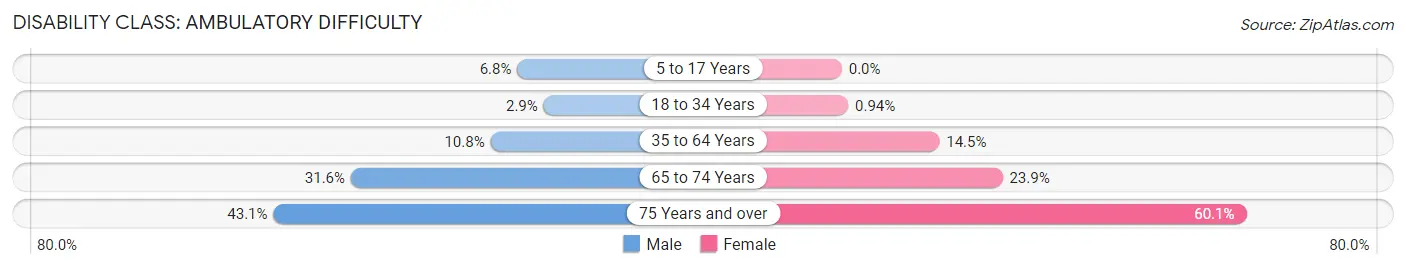
| Age Bracket | Male | Female |
| 5 to 17 Years | 65 (6.8%) | 0 (0.0%) |
| 18 to 34 Years | 43 (2.9%) | 14 (0.9%) |
| 35 to 64 Years | 213 (10.8%) | 314 (14.5%) |
| 65 to 74 Years | 224 (31.6%) | 210 (23.9%) |
| 75 Years and over | 217 (43.1%) | 597 (60.1%) |
Disability Class: Self-Care Difficulty
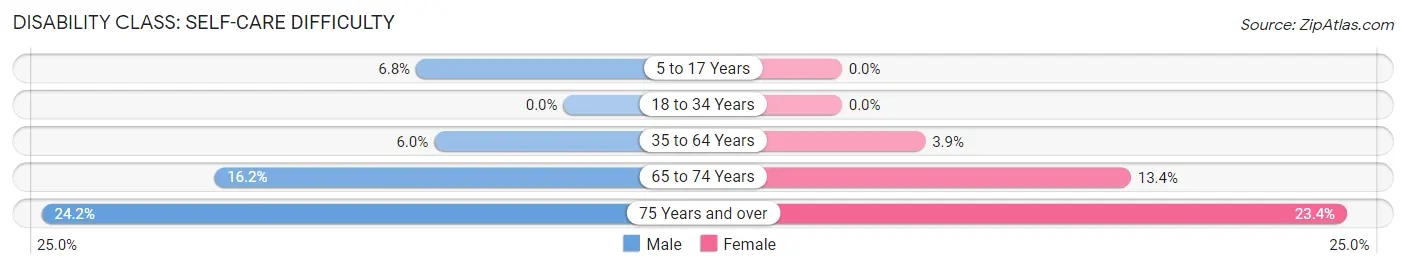
| Age Bracket | Male | Female |
| 5 to 17 Years | 65 (6.8%) | 0 (0.0%) |
| 18 to 34 Years | 0 (0.0%) | 0 (0.0%) |
| 35 to 64 Years | 118 (6.0%) | 84 (3.9%) |
| 65 to 74 Years | 115 (16.2%) | 118 (13.4%) |
| 75 Years and over | 122 (24.2%) | 233 (23.4%) |
Technology Access in Rio Grande
Computing Device Access in Rio Grande
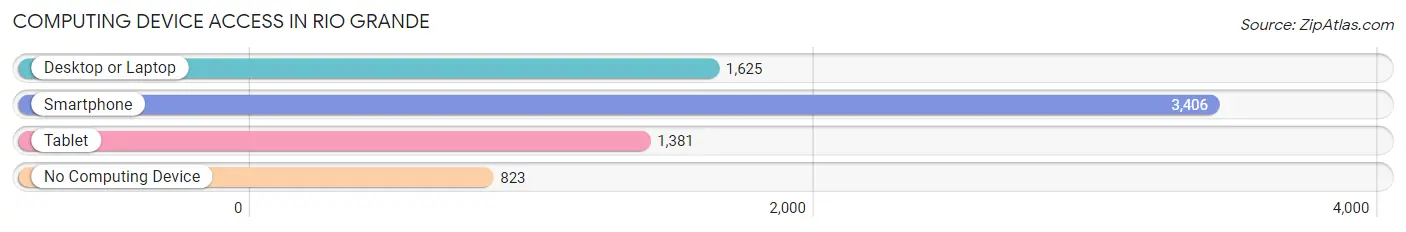
| Device Type | # Households | % Households |
| Desktop or Laptop | 1,625 | 37.1% |
| Smartphone | 3,406 | 77.7% |
| Tablet | 1,381 | 31.5% |
| No Computing Device | 823 | 18.8% |
| Total | 4,385 | 100.0% |
Internet Access in Rio Grande
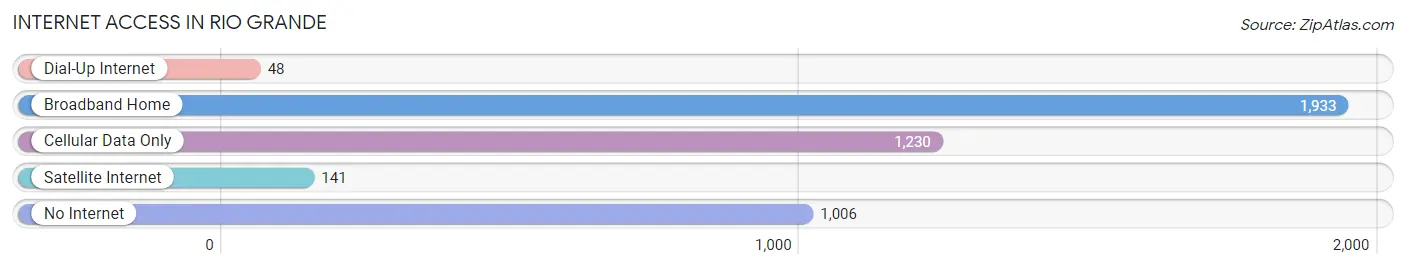
| Internet Type | # Households | % Households |
| Dial-Up Internet | 48 | 1.1% |
| Broadband Home | 1,933 | 44.1% |
| Cellular Data Only | 1,230 | 28.1% |
| Satellite Internet | 141 | 3.2% |
| No Internet | 1,006 | 22.9% |
| Total | 4,385 | 100.0% |
Rio Grande Summary
Rio Grande is a municipality located in the northeastern region of Puerto Rico. It is part of the metropolitan area of San Juan-Caguas-Guaynabo. The municipality is located on the northern coast of the island, bordered by the Atlantic Ocean to the north, the municipality of Loíza to the east, the municipality of Canóvanas to the south, and the municipality of Las Piedras to the west. As of the 2010 census, the population of Rio Grande was 45,216.
History
The area of Rio Grande was originally inhabited by the Taíno Indians. The first European settlement in the area was established in 1745 by the Spanish. The settlement was named San Miguel de la Barrera, after the local Taíno chief. The settlement was later renamed Rio Grande, after the nearby river.
In 1815, the municipality of Rio Grande was officially established. During the 19th century, the economy of the municipality was based on the production of sugar cane and coffee. In the early 20th century, the economy shifted to the production of tobacco and other agricultural products.
Geography
Rio Grande is located in the northern coast of Puerto Rico, bordered by the Atlantic Ocean to the north, the municipality of Loíza to the east, the municipality of Canóvanas to the south, and the municipality of Las Piedras to the west. The municipality covers an area of 39.9 square miles (103.2 km2).
The terrain of Rio Grande is mostly flat, with some hills in the western part of the municipality. The highest point in the municipality is Cerro La Palma, which has an elevation of 1,067 feet (325 m). The municipality is home to several rivers, including the Rio Grande de Loíza, which is the longest river in Puerto Rico.
Economy
The economy of Rio Grande is largely based on tourism and manufacturing. The municipality is home to several resorts and hotels, as well as several industrial parks. The industrial parks are home to a variety of manufacturing companies, including pharmaceutical, electronics, and food processing companies.
The municipality is also home to several agricultural operations, including the production of sugar cane, coffee, and tobacco. In addition, the municipality is home to several fishing operations, which provide a variety of seafood products.
Demographics
As of the 2010 census, the population of Rio Grande was 45,216. The population is mostly of mixed European and African descent. The majority of the population (90.2%) is Hispanic or Latino. The median household income in the municipality is $20,845.
The majority of the population (90.2%) is Roman Catholic. Other religious denominations represented in the municipality include Protestantism (4.2%), Jehovah's Witnesses (2.2%), and other religions (3.4%).
Conclusion
Rio Grande is a municipality located in the northeastern region of Puerto Rico. It is part of the metropolitan area of San Juan-Caguas-Guaynabo. The municipality is located on the northern coast of the island, bordered by the Atlantic Ocean to the north, the municipality of Loíza to the east, the municipality of Canóvanas to the south, and the municipality of Las Piedras to the west. As of the 2010 census, the population of Rio Grande was 45,216. The economy of Rio Grande is largely based on tourism and manufacturing, and the population is mostly of mixed European and African descent. The majority of the population (90.2%) is Roman Catholic.
Common Questions
What is Per Capita Income in Rio Grande?
Per Capita income in Rio Grande is $12,828.
What is the Median Family Income in Rio Grande?
Median Family Income in Rio Grande is $29,024.
What is the Median Household income in Rio Grande?
Median Household Income in Rio Grande is $22,465.
What is Income or Wage Gap in Rio Grande?
Income or Wage Gap in Rio Grande is 4.3%.
Women in Rio Grande earn 95.7 cents for every dollar earned by a man.
What is Family Income Deficit in Rio Grande?
Family Income Deficit in Rio Grande is $13,723.
Families that are below poverty line in Rio Grande earn $13,723 less on average than the poverty threshold level.
What is Inequality or Gini Index in Rio Grande?
Inequality or Gini Index in Rio Grande is 0.47.
What is the Total Population of Rio Grande?
Total Population of Rio Grande is 12,311.
What is the Total Male Population of Rio Grande?
Total Male Population of Rio Grande is 5,795.
What is the Total Female Population of Rio Grande?
Total Female Population of Rio Grande is 6,516.
What is the Ratio of Males per 100 Females in Rio Grande?
There are 88.93 Males per 100 Females in Rio Grande.
What is the Ratio of Females per 100 Males in Rio Grande?
There are 112.44 Females per 100 Males in Rio Grande.
What is the Median Population Age in Rio Grande?
Median Population Age in Rio Grande is 40.7 Years.
What is the Average Family Size in Rio Grande
Average Family Size in Rio Grande is 3.6 People.
What is the Average Household Size in Rio Grande
Average Household Size in Rio Grande is 2.8 People.
How Large is the Labor Force in Rio Grande?
There are 5,430 People in the Labor Forcein in Rio Grande.
What is the Percentage of People in the Labor Force in Rio Grande?
51.7% of People are in the Labor Force in Rio Grande.
What is the Unemployment Rate in Rio Grande?
Unemployment Rate in Rio Grande is 14.1%.