Aguadilla, PR Map & Demographics
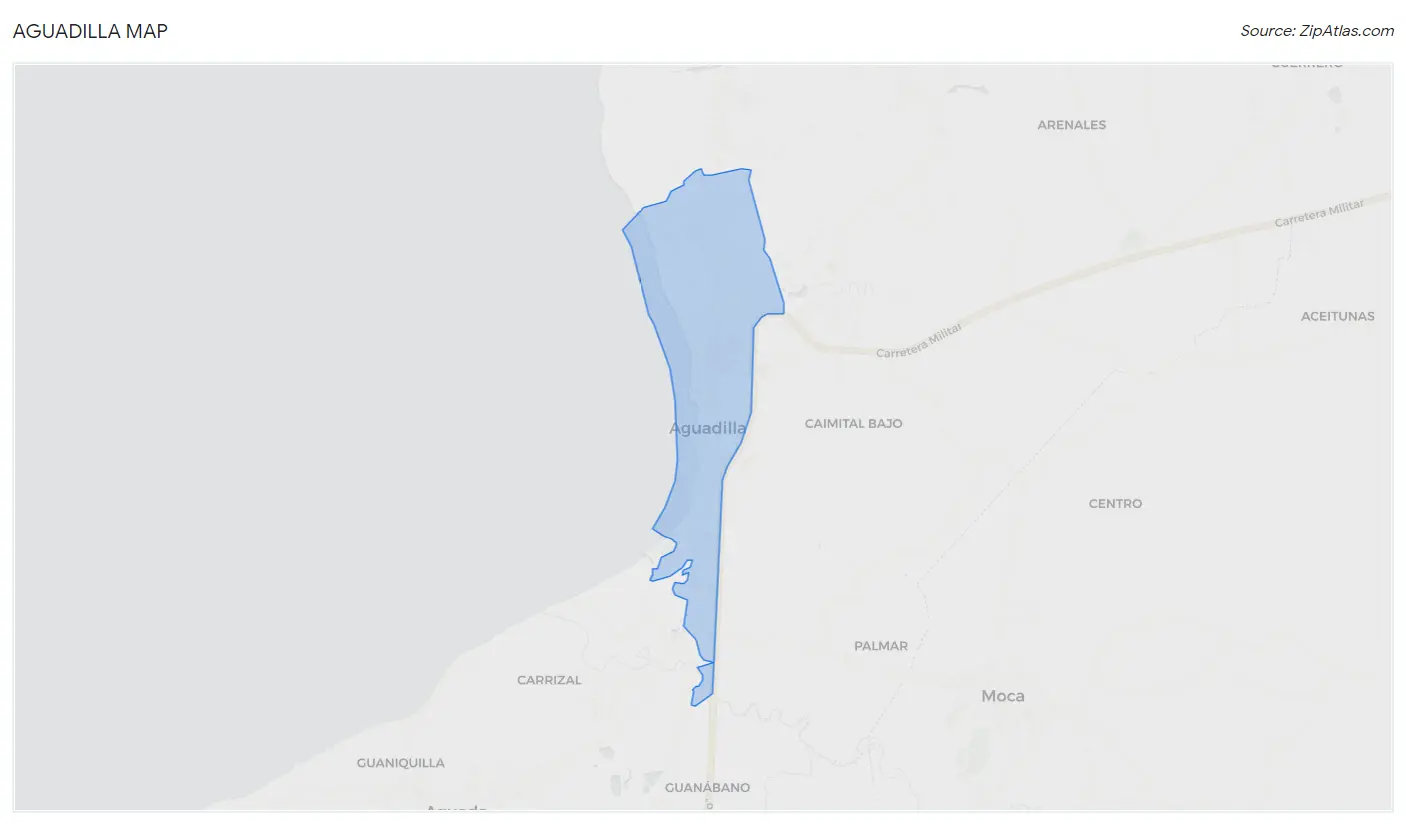
Aguadilla Map
Aguadilla Overview
$10,947
PER CAPITA INCOME
$16,224
AVG FAMILY INCOME
$11,938
AVG HOUSEHOLD INCOME
17.1%
WAGE / INCOME GAP [ % ]
82.9¢/ $1
WAGE / INCOME GAP [ $ ]
$13,087
FAMILY INCOME DEFICIT
0.63
INEQUALITY / GINI INDEX
11,383
TOTAL POPULATION
4,980
MALE POPULATION
6,403
FEMALE POPULATION
77.78
MALES / 100 FEMALES
128.57
FEMALES / 100 MALES
46.9
MEDIAN AGE
2.8
AVG FAMILY SIZE
2.1
AVG HOUSEHOLD SIZE
3,120
LABOR FORCE [ PEOPLE ]
32.5%
PERCENT IN LABOR FORCE
25.9%
UNEMPLOYMENT RATE
Aguadilla Zip Codes
Aguadilla Area Codes
Income in Aguadilla
Income Overview in Aguadilla
Per Capita Income in Aguadilla is $10,947, while median incomes of families and households are $16,224 and $11,938 respectively.
| Characteristic | Number | Measure |
| Per Capita Income | 11,383 | $10,947 |
| Median Family Income | 3,072 | $16,224 |
| Mean Family Income | 3,072 | $29,008 |
| Median Household Income | 5,274 | $11,938 |
| Mean Household Income | 5,274 | $22,255 |
| Income Deficit | 3,072 | $13,087 |
| Wage / Income Gap (%) | 11,383 | 17.08% |
| Wage / Income Gap ($) | 11,383 | 82.92¢ per $1 |
| Gini / Inequality Index | 11,383 | 0.63 |
Earnings by Sex in Aguadilla
Average Earnings in Aguadilla are $14,877, $15,725 for men and $13,039 for women, a difference of 17.1%.
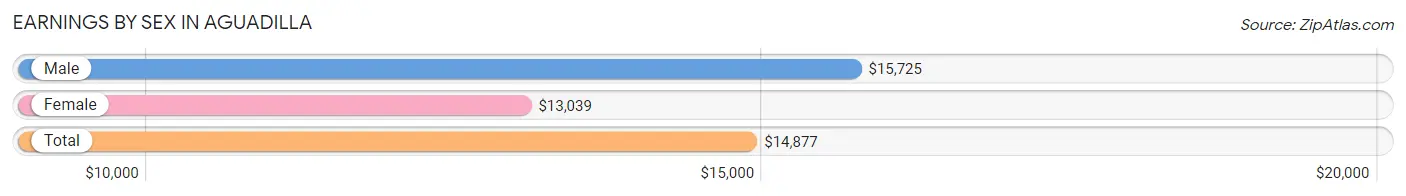
| Sex | Number | Average Earnings |
| Male | 1,259 (47.4%) | $15,725 |
| Female | 1,399 (52.6%) | $13,039 |
| Total | 2,658 (100.0%) | $14,877 |
Earnings by Sex by Income Bracket in Aguadilla
The most common earnings brackets in Aguadilla are $12,500 to $14,999 for men (165 | 13.1%) and $5,000 to $7,499 for women (189 | 13.5%).
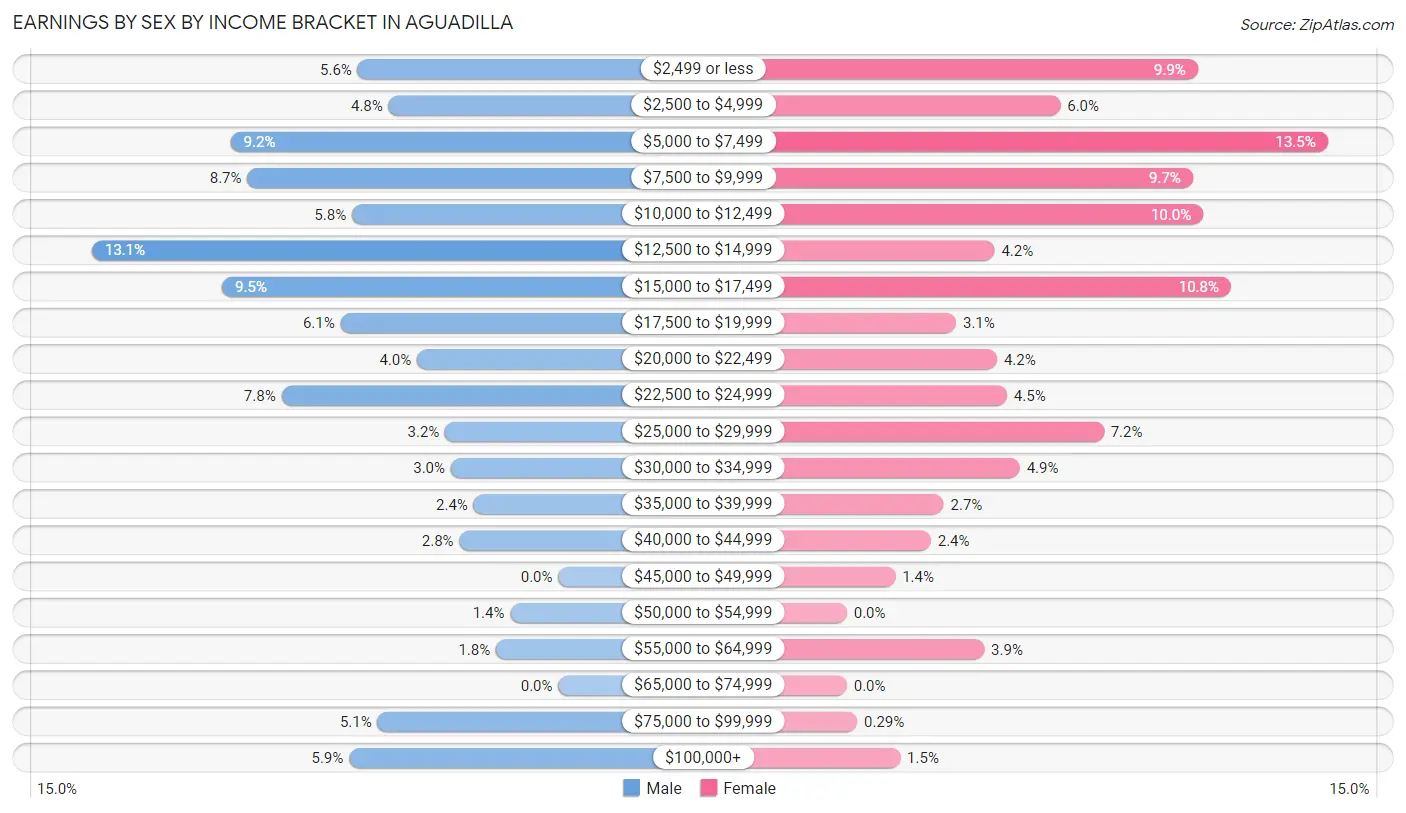
| Income | Male | Female |
| $2,499 or less | 71 (5.6%) | 138 (9.9%) |
| $2,500 to $4,999 | 60 (4.8%) | 84 (6.0%) |
| $5,000 to $7,499 | 116 (9.2%) | 189 (13.5%) |
| $7,500 to $9,999 | 110 (8.7%) | 136 (9.7%) |
| $10,000 to $12,499 | 73 (5.8%) | 140 (10.0%) |
| $12,500 to $14,999 | 165 (13.1%) | 58 (4.2%) |
| $15,000 to $17,499 | 119 (9.5%) | 151 (10.8%) |
| $17,500 to $19,999 | 77 (6.1%) | 43 (3.1%) |
| $20,000 to $22,499 | 50 (4.0%) | 59 (4.2%) |
| $22,500 to $24,999 | 98 (7.8%) | 63 (4.5%) |
| $25,000 to $29,999 | 40 (3.2%) | 101 (7.2%) |
| $30,000 to $34,999 | 38 (3.0%) | 68 (4.9%) |
| $35,000 to $39,999 | 30 (2.4%) | 38 (2.7%) |
| $40,000 to $44,999 | 35 (2.8%) | 33 (2.4%) |
| $45,000 to $49,999 | 0 (0.0%) | 19 (1.4%) |
| $50,000 to $54,999 | 17 (1.3%) | 0 (0.0%) |
| $55,000 to $64,999 | 22 (1.8%) | 54 (3.9%) |
| $65,000 to $74,999 | 0 (0.0%) | 0 (0.0%) |
| $75,000 to $99,999 | 64 (5.1%) | 4 (0.3%) |
| $100,000+ | 74 (5.9%) | 21 (1.5%) |
| Total | 1,259 (100.0%) | 1,399 (100.0%) |
Earnings by Sex by Educational Attainment in Aguadilla
Average earnings in Aguadilla are $15,952 for men and $13,987 for women, a difference of 12.3%. Men with an educational attainment of bachelor's degree enjoy the highest average annual earnings of $22,411, while those with less than high school education earn the least with $11,389. Women with an educational attainment of graduate degree earn the most with the average annual earnings of $26,071, while those with high school diploma education have the smallest earnings of $9,875.
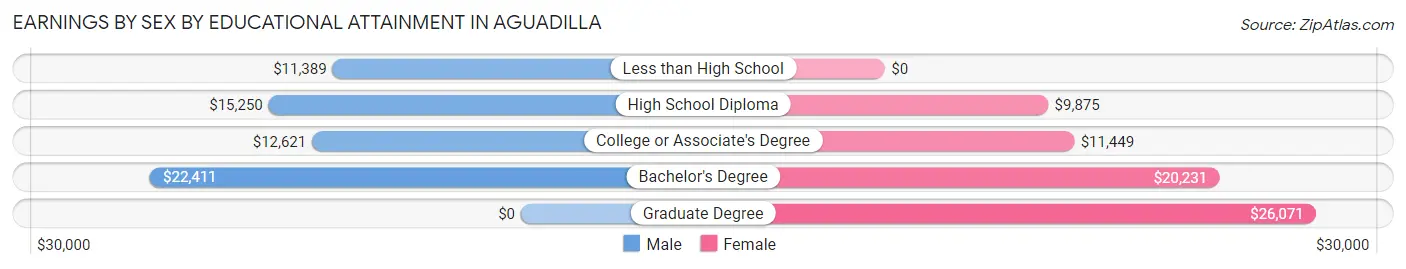
| Educational Attainment | Male Income | Female Income |
| Less than High School | $11,389 | $0 |
| High School Diploma | $15,250 | $9,875 |
| College or Associate's Degree | $12,621 | $11,449 |
| Bachelor's Degree | $22,411 | $20,231 |
| Graduate Degree | - | - |
| Total | $15,952 | $13,987 |
Family Income in Aguadilla
Family Income Brackets in Aguadilla
According to the Aguadilla family income data, there are 1,198 families falling into the less than $10,000 income range, which is the most common income bracket and makes up 39.0% of all families. Conversely, the $150,000 to $199,999 income bracket is the least frequent group with only 15 families (0.5%) belonging to this category.
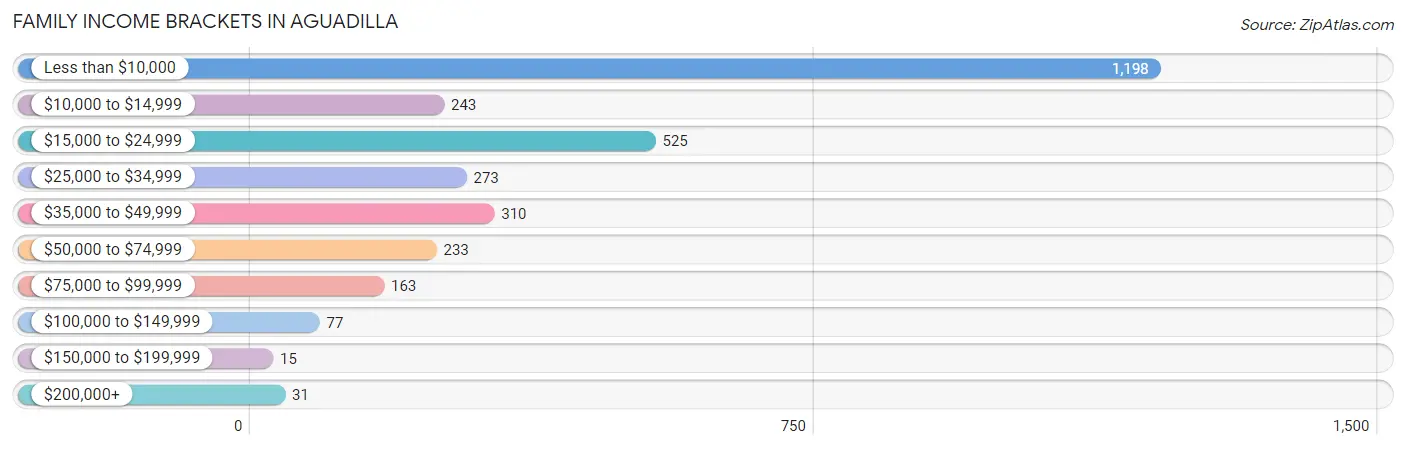
| Income Bracket | # Families | % Families |
| Less than $10,000 | 1,198 | 39.0% |
| $10,000 to $14,999 | 243 | 7.9% |
| $15,000 to $24,999 | 525 | 17.1% |
| $25,000 to $34,999 | 273 | 8.9% |
| $35,000 to $49,999 | 310 | 10.1% |
| $50,000 to $74,999 | 233 | 7.6% |
| $75,000 to $99,999 | 163 | 5.3% |
| $100,000 to $149,999 | 77 | 2.5% |
| $150,000 to $199,999 | 15 | 0.5% |
| $200,000+ | 31 | 1.0% |
Family Income by Famaliy Size in Aguadilla
5-person families (77 | 2.5%) account for the highest median family income in Aguadilla with $24,306 per family, while 2-person families (1,783 | 58.0%) have the highest median income of $7,792 per family member.
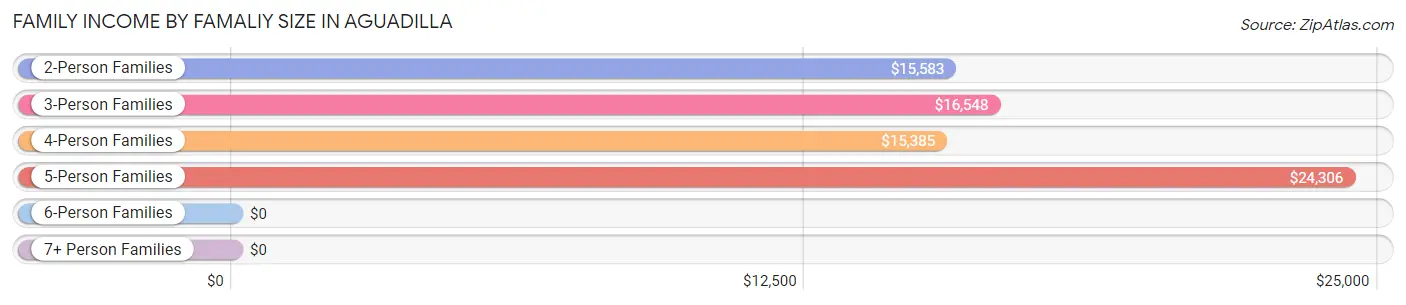
| Income Bracket | # Families | Median Income |
| 2-Person Families | 1,783 (58.0%) | $15,583 |
| 3-Person Families | 868 (28.3%) | $16,548 |
| 4-Person Families | 338 (11.0%) | $15,385 |
| 5-Person Families | 77 (2.5%) | $24,306 |
| 6-Person Families | 6 (0.2%) | $0 |
| 7+ Person Families | 0 (0.0%) | $0 |
| Total | 3,072 (100.0%) | $16,224 |
Family Income by Number of Earners in Aguadilla
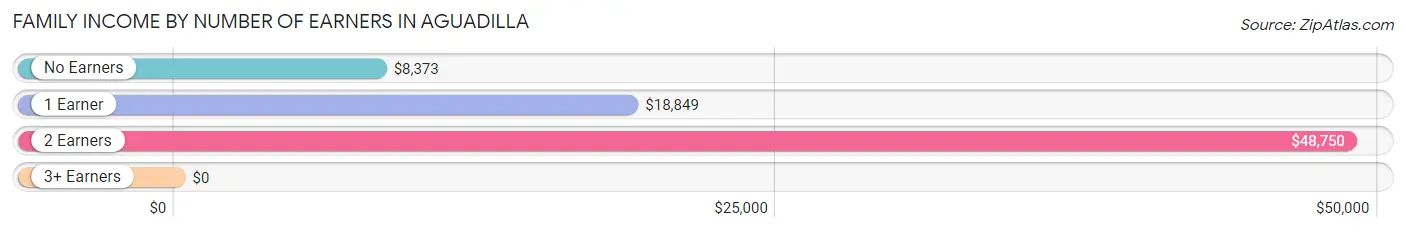
| Number of Earners | # Families | Median Income |
| No Earners | 1,610 (52.4%) | $8,373 |
| 1 Earner | 1,066 (34.7%) | $18,849 |
| 2 Earners | 371 (12.1%) | $48,750 |
| 3+ Earners | 25 (0.8%) | $0 |
| Total | 3,072 (100.0%) | $16,224 |
Household Income in Aguadilla
Household Income Brackets in Aguadilla
With 2,442 households falling in the category, the less than $10,000 income range is the most frequent in Aguadilla, accounting for 46.3% of all households. In contrast, only 32 households (0.6%) fall into the $150,000 to $199,999 income bracket, making it the least populous group.
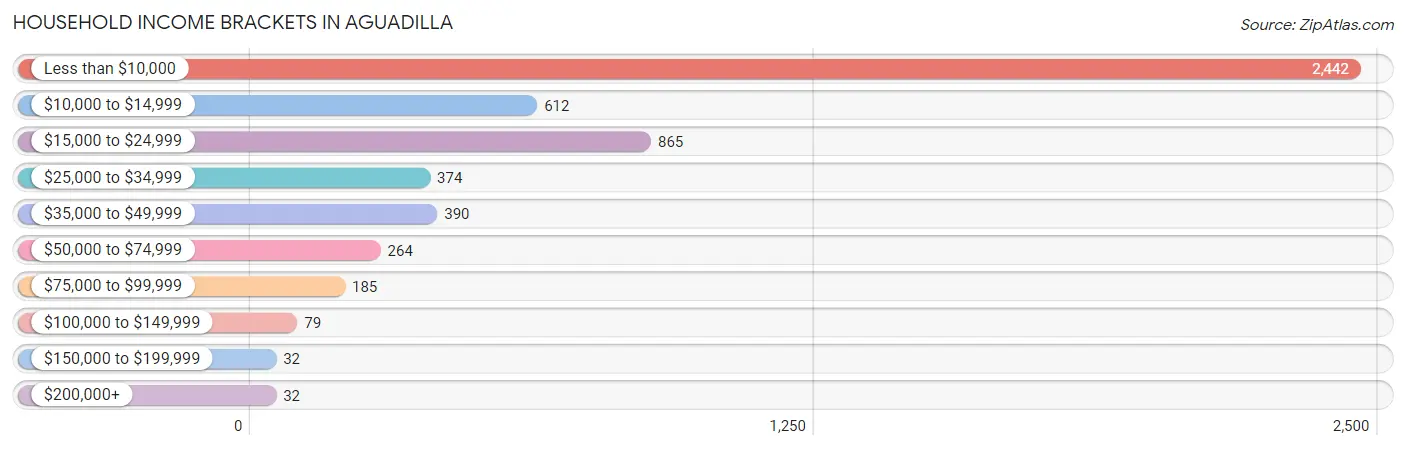
| Income Bracket | # Households | % Households |
| Less than $10,000 | 2,442 | 46.3% |
| $10,000 to $14,999 | 612 | 11.6% |
| $15,000 to $24,999 | 865 | 16.4% |
| $25,000 to $34,999 | 374 | 7.1% |
| $35,000 to $49,999 | 390 | 7.4% |
| $50,000 to $74,999 | 264 | 5.0% |
| $75,000 to $99,999 | 185 | 3.5% |
| $100,000 to $149,999 | 79 | 1.5% |
| $150,000 to $199,999 | 32 | 0.6% |
| $200,000+ | 32 | 0.6% |
Household Income by Householder Age in Aguadilla
The median household income in Aguadilla is $11,938, with the highest median household income of $13,414 found in the 65+ years age bracket for the primary householder. A total of 2,111 households (40.0%) fall into this category. Meanwhile, the 15 to 24 years age bracket for the primary householder has the lowest median household income of $0, with 133 households (2.5%) in this group.
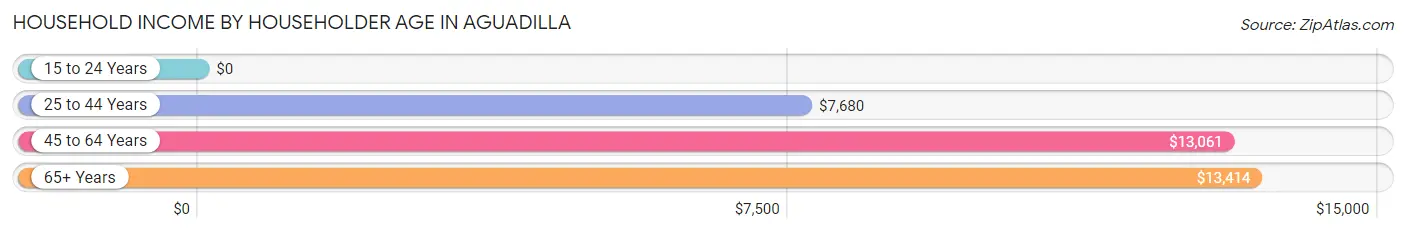
| Income Bracket | # Households | Median Income |
| 15 to 24 Years | 133 (2.5%) | $0 |
| 25 to 44 Years | 1,252 (23.7%) | $7,680 |
| 45 to 64 Years | 1,778 (33.7%) | $13,061 |
| 65+ Years | 2,111 (40.0%) | $13,414 |
| Total | 5,274 (100.0%) | $11,938 |
Poverty in Aguadilla
Income Below Poverty by Sex and Age in Aguadilla
With 59.9% poverty level for males and 67.3% for females among the residents of Aguadilla, 5 year old males and 5 year old females are the most vulnerable to poverty, with 10 males (100.0%) and 42 females (100.0%) in their respective age groups living below the poverty level.
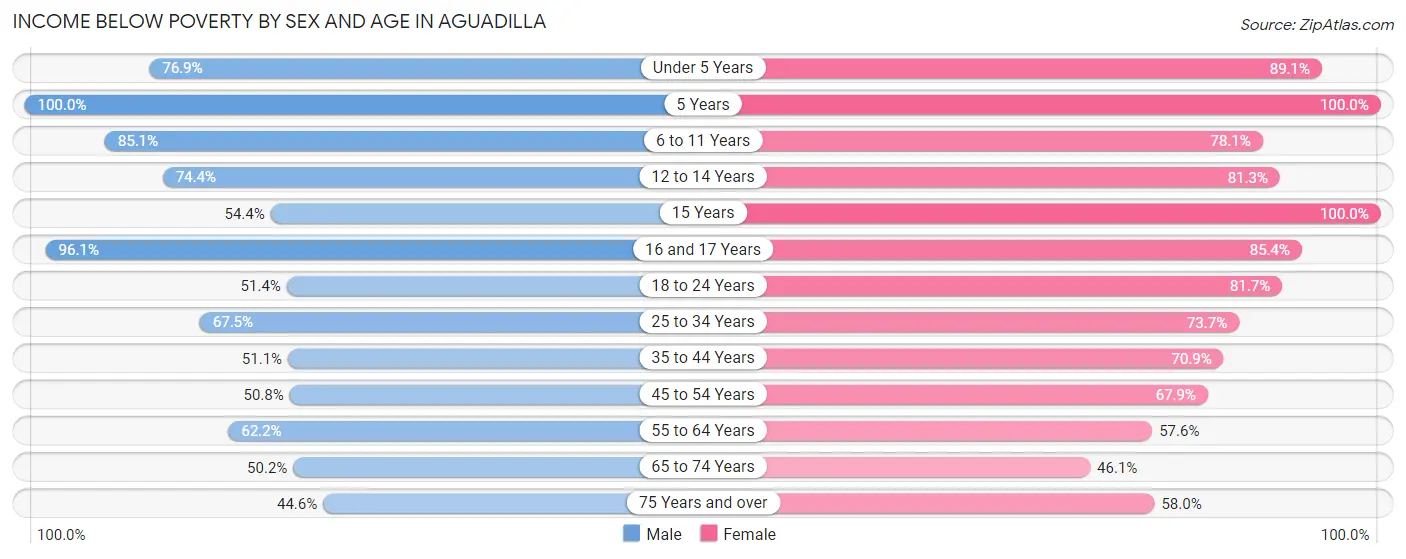
| Age Bracket | Male | Female |
| Under 5 Years | 156 (76.8%) | 343 (89.1%) |
| 5 Years | 10 (100.0%) | 42 (100.0%) |
| 6 to 11 Years | 337 (85.1%) | 246 (78.1%) |
| 12 to 14 Years | 116 (74.4%) | 152 (81.3%) |
| 15 Years | 25 (54.3%) | 43 (100.0%) |
| 16 and 17 Years | 172 (96.1%) | 70 (85.4%) |
| 18 to 24 Years | 151 (51.4%) | 429 (81.7%) |
| 25 to 34 Years | 369 (67.5%) | 592 (73.7%) |
| 35 to 44 Years | 248 (51.1%) | 501 (70.9%) |
| 45 to 54 Years | 277 (50.8%) | 572 (67.9%) |
| 55 to 64 Years | 500 (62.2%) | 416 (57.6%) |
| 65 to 74 Years | 327 (50.1%) | 431 (46.1%) |
| 75 Years and over | 293 (44.6%) | 462 (58.0%) |
| Total | 2,981 (59.9%) | 4,299 (67.3%) |
Income Above Poverty by Sex and Age in Aguadilla
According to the poverty statistics in Aguadilla, males aged 75 years and over and females aged 65 to 74 years are the age groups that are most secure financially, with 55.4% of males and 53.9% of females in these age groups living above the poverty line.
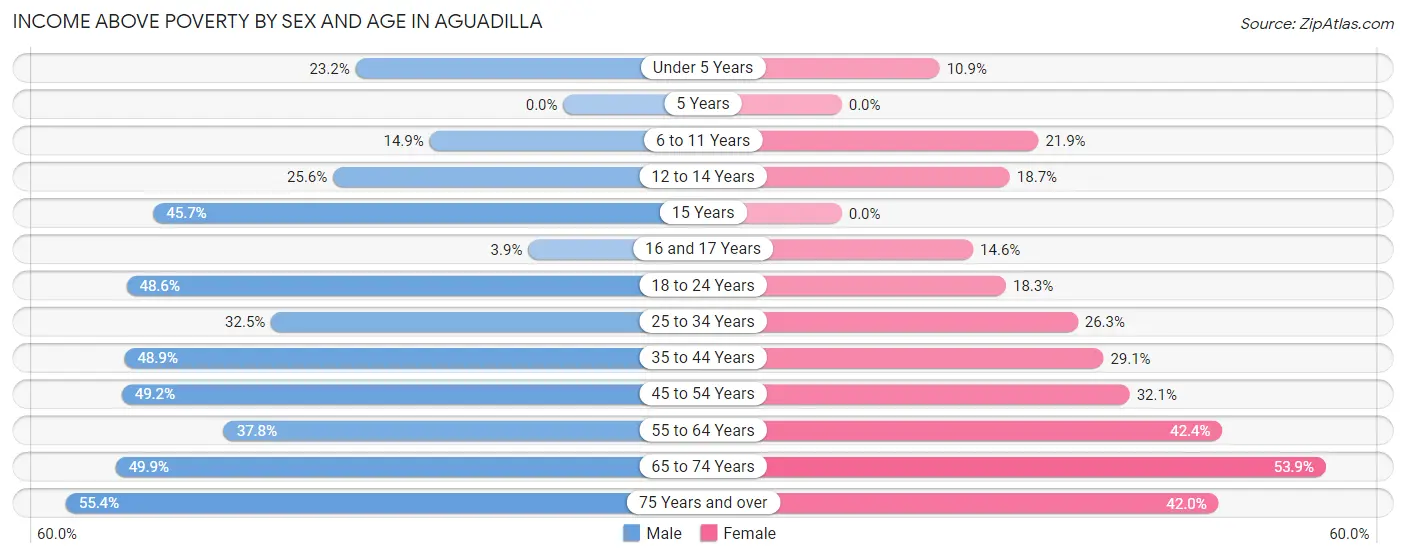
| Age Bracket | Male | Female |
| Under 5 Years | 47 (23.2%) | 42 (10.9%) |
| 5 Years | 0 (0.0%) | 0 (0.0%) |
| 6 to 11 Years | 59 (14.9%) | 69 (21.9%) |
| 12 to 14 Years | 40 (25.6%) | 35 (18.7%) |
| 15 Years | 21 (45.7%) | 0 (0.0%) |
| 16 and 17 Years | 7 (3.9%) | 12 (14.6%) |
| 18 to 24 Years | 143 (48.6%) | 96 (18.3%) |
| 25 to 34 Years | 178 (32.5%) | 211 (26.3%) |
| 35 to 44 Years | 237 (48.9%) | 206 (29.1%) |
| 45 to 54 Years | 268 (49.2%) | 270 (32.1%) |
| 55 to 64 Years | 304 (37.8%) | 306 (42.4%) |
| 65 to 74 Years | 325 (49.8%) | 504 (53.9%) |
| 75 Years and over | 364 (55.4%) | 334 (42.0%) |
| Total | 1,993 (40.1%) | 2,085 (32.7%) |
Income Below Poverty Among Married-Couple Families in Aguadilla
The poverty statistics for married-couple families in Aguadilla show that 44.0% or 606 of the total 1,377 families live below the poverty line. Families with 3 or 4 children have the highest poverty rate of 100.0%, comprising of 48 families. On the other hand, families with no children have the lowest poverty rate of 38.9%, which includes 434 families.
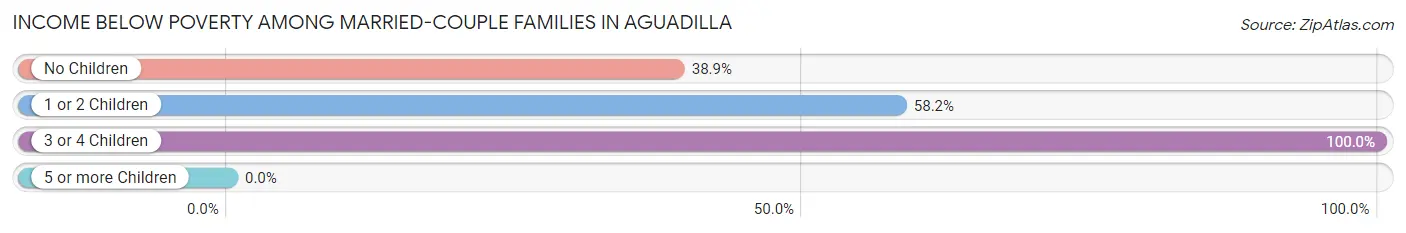
| Children | Above Poverty | Below Poverty |
| No Children | 682 (61.1%) | 434 (38.9%) |
| 1 or 2 Children | 89 (41.8%) | 124 (58.2%) |
| 3 or 4 Children | 0 (0.0%) | 48 (100.0%) |
| 5 or more Children | 0 (0.0%) | 0 (0.0%) |
| Total | 771 (56.0%) | 606 (44.0%) |
Income Below Poverty Among Single-Parent Households in Aguadilla
According to the poverty data in Aguadilla, 51.7% or 133 single-father households and 75.7% or 1,089 single-mother households are living below the poverty line. Among single-father households, those with 3 or 4 children have the highest poverty rate, with 16 households (100.0%) experiencing poverty. Likewise, among single-mother households, those with 3 or 4 children have the highest poverty rate, with 78 households (100.0%) falling below the poverty line.
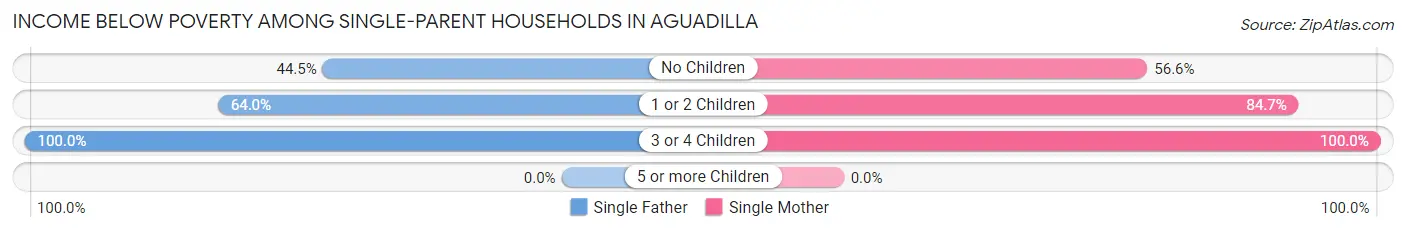
| Children | Single Father | Single Mother |
| No Children | 85 (44.5%) | 284 (56.6%) |
| 1 or 2 Children | 32 (64.0%) | 727 (84.7%) |
| 3 or 4 Children | 16 (100.0%) | 78 (100.0%) |
| 5 or more Children | 0 (0.0%) | 0 (0.0%) |
| Total | 133 (51.7%) | 1,089 (75.7%) |
Income Below Poverty Among Married-Couple vs Single-Parent Households in Aguadilla
The poverty data for Aguadilla shows that 606 of the married-couple family households (44.0%) and 1,222 of the single-parent households (72.1%) are living below the poverty level. Within the married-couple family households, those with 3 or 4 children have the highest poverty rate, with 48 households (100.0%) falling below the poverty line. Among the single-parent households, those with 3 or 4 children have the highest poverty rate, with 94 household (100.0%) living below poverty.
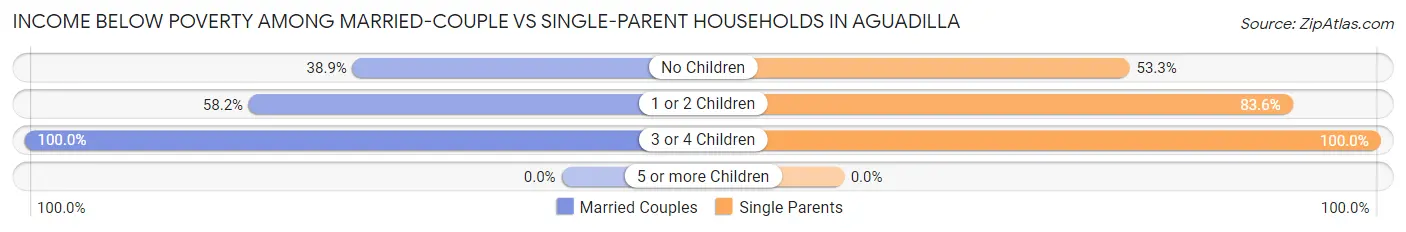
| Children | Married-Couple Families | Single-Parent Households |
| No Children | 434 (38.9%) | 369 (53.2%) |
| 1 or 2 Children | 124 (58.2%) | 759 (83.6%) |
| 3 or 4 Children | 48 (100.0%) | 94 (100.0%) |
| 5 or more Children | 0 (0.0%) | 0 (0.0%) |
| Total | 606 (44.0%) | 1,222 (72.1%) |
Race in Aguadilla
The most populous races in Aguadilla are Hispanic or Latino (11,231 | 98.7%), White / Caucasian (8,167 | 71.8%), and Some other Race (1,712 | 15.0%).
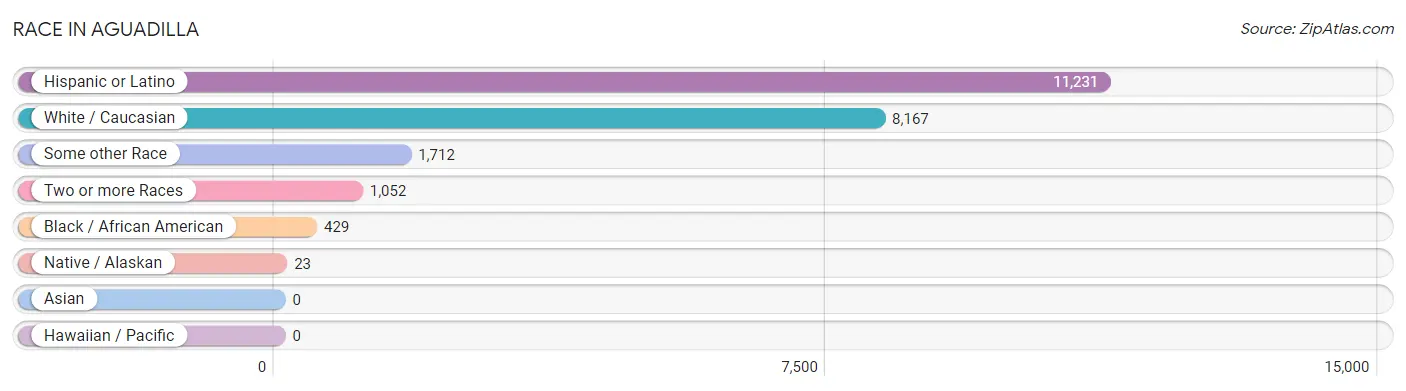
| Race | # Population | % Population |
| Asian | 0 | 0.0% |
| Black / African American | 429 | 3.8% |
| Hawaiian / Pacific | 0 | 0.0% |
| Hispanic or Latino | 11,231 | 98.7% |
| Native / Alaskan | 23 | 0.2% |
| White / Caucasian | 8,167 | 71.8% |
| Two or more Races | 1,052 | 9.2% |
| Some other Race | 1,712 | 15.0% |
| Total | 11,383 | 100.0% |
Ancestry in Aguadilla
The most populous ancestries reported in Aguadilla are Puerto Rican (11,112 | 97.6%), American (235 | 2.1%), Central American Indian (224 | 2.0%), African (51 | 0.4%), and Subsaharan African (51 | 0.4%), together accounting for 102.5% of all Aguadilla residents.
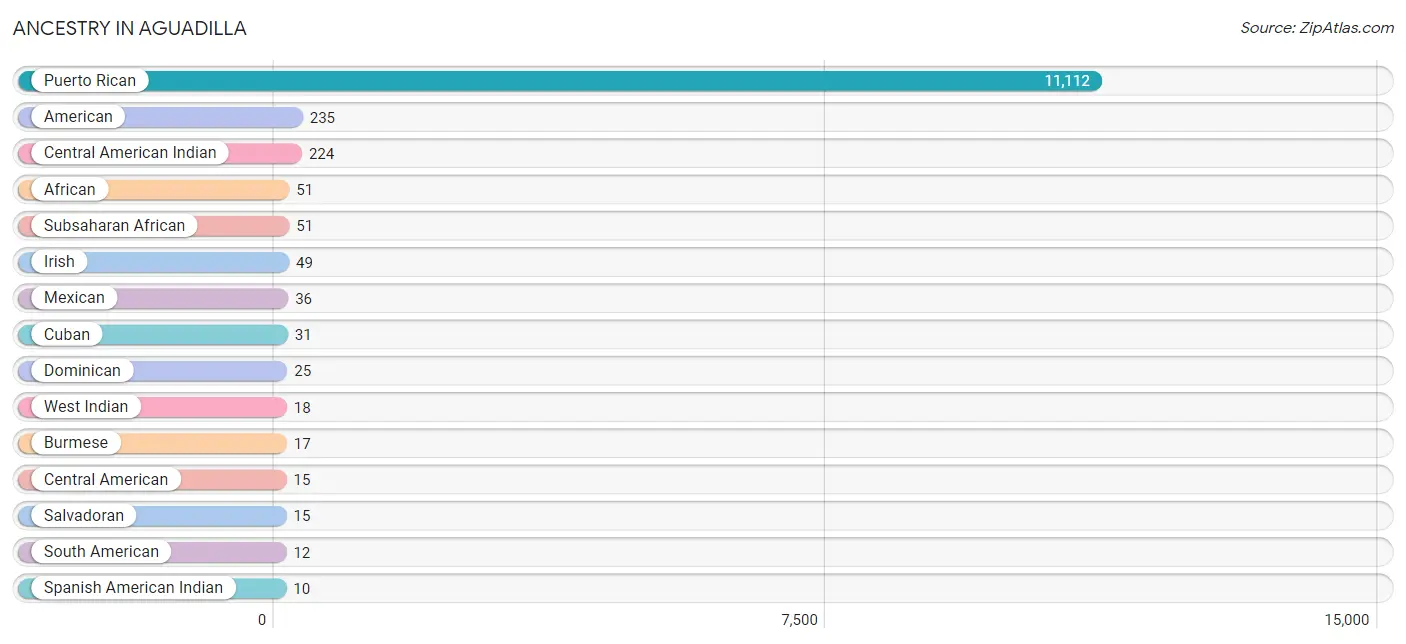
| Ancestry | # Population | % Population |
| African | 51 | 0.4% |
| American | 235 | 2.1% |
| Burmese | 17 | 0.2% |
| Central American | 15 | 0.1% |
| Central American Indian | 224 | 2.0% |
| Cuban | 31 | 0.3% |
| Dominican | 25 | 0.2% |
| Irish | 49 | 0.4% |
| Mexican | 36 | 0.3% |
| Polish | 5 | 0.0% |
| Puerto Rican | 11,112 | 97.6% |
| Salvadoran | 15 | 0.1% |
| South American | 12 | 0.1% |
| Spanish American Indian | 10 | 0.1% |
| Subsaharan African | 51 | 0.4% |
| West Indian | 18 | 0.2% | View All 16 Rows |
Immigrants in Aguadilla

| Immigration Origin | # Population | % Population | View All 0 Rows |
Sex and Age in Aguadilla
Sex and Age in Aguadilla
The most populous age groups in Aguadilla are 60 to 64 Years (472 | 9.5%) for men and 70 to 74 Years (566 | 8.8%) for women.
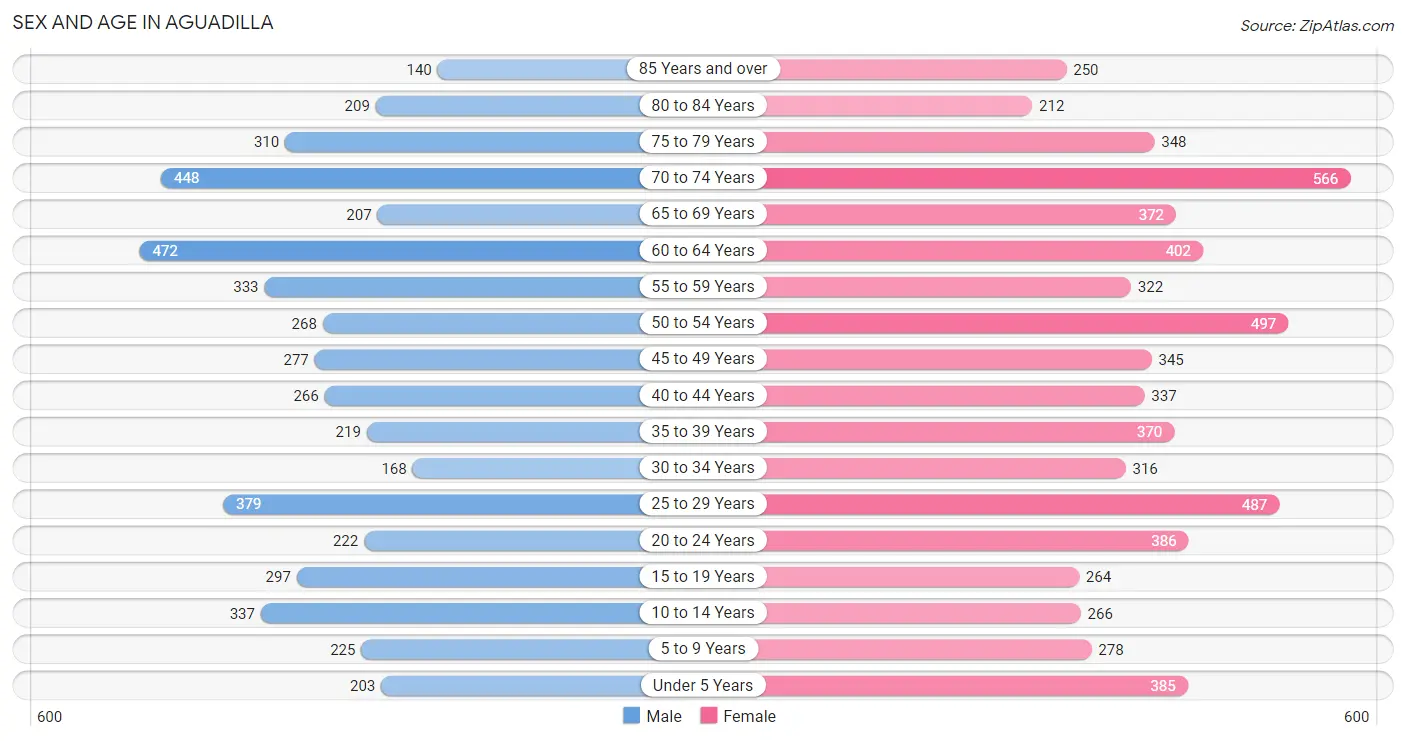
| Age Bracket | Male | Female |
| Under 5 Years | 203 (4.1%) | 385 (6.0%) |
| 5 to 9 Years | 225 (4.5%) | 278 (4.3%) |
| 10 to 14 Years | 337 (6.8%) | 266 (4.2%) |
| 15 to 19 Years | 297 (6.0%) | 264 (4.1%) |
| 20 to 24 Years | 222 (4.5%) | 386 (6.0%) |
| 25 to 29 Years | 379 (7.6%) | 487 (7.6%) |
| 30 to 34 Years | 168 (3.4%) | 316 (4.9%) |
| 35 to 39 Years | 219 (4.4%) | 370 (5.8%) |
| 40 to 44 Years | 266 (5.3%) | 337 (5.3%) |
| 45 to 49 Years | 277 (5.6%) | 345 (5.4%) |
| 50 to 54 Years | 268 (5.4%) | 497 (7.8%) |
| 55 to 59 Years | 333 (6.7%) | 322 (5.0%) |
| 60 to 64 Years | 472 (9.5%) | 402 (6.3%) |
| 65 to 69 Years | 207 (4.2%) | 372 (5.8%) |
| 70 to 74 Years | 448 (9.0%) | 566 (8.8%) |
| 75 to 79 Years | 310 (6.2%) | 348 (5.4%) |
| 80 to 84 Years | 209 (4.2%) | 212 (3.3%) |
| 85 Years and over | 140 (2.8%) | 250 (3.9%) |
| Total | 4,980 (100.0%) | 6,403 (100.0%) |
Families and Households in Aguadilla
Median Family Size in Aguadilla
The median family size in Aguadilla is 2.82 persons per family, with single female/mother families (1,438 | 46.8%) accounting for the largest median family size of 2.98 persons per family. On the other hand, married-couple families (1,377 | 44.8%) represent the smallest median family size with 2.64 persons per family.
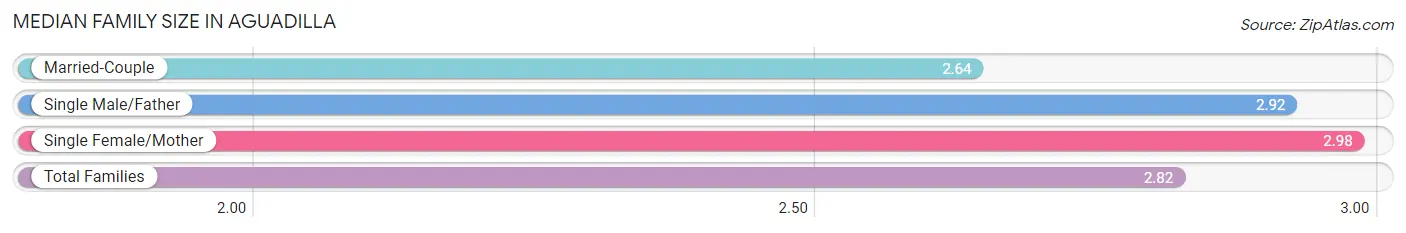
| Family Type | # Families | Family Size |
| Married-Couple | 1,377 (44.8%) | 2.64 |
| Single Male/Father | 257 (8.4%) | 2.92 |
| Single Female/Mother | 1,438 (46.8%) | 2.98 |
| Total Families | 3,072 (100.0%) | 2.82 |
Median Household Size in Aguadilla
The median household size in Aguadilla is 2.15 persons per household, with single male/father households (257 | 4.9%) accounting for the largest median household size of 3.22 persons per household. non-family households (2,202 | 41.7%) represent the smallest median household size with 1.11 persons per household.
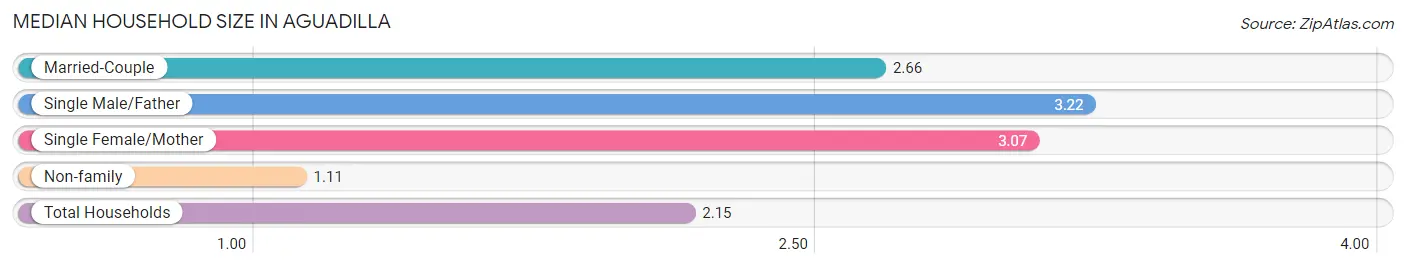
| Household Type | # Households | Household Size |
| Married-Couple | 1,377 (26.1%) | 2.66 |
| Single Male/Father | 257 (4.9%) | 3.22 |
| Single Female/Mother | 1,438 (27.3%) | 3.07 |
| Non-family | 2,202 (41.7%) | 1.11 |
| Total Households | 5,274 (100.0%) | 2.15 |
Household Size by Marriage Status in Aguadilla
Out of a total of 5,274 households in Aguadilla, 3,072 (58.3%) are family households, while 2,202 (41.7%) are nonfamily households. The most numerous type of family households are 2-person households, comprising 1,677, and the most common type of nonfamily households are 1-person households, comprising 2,004.
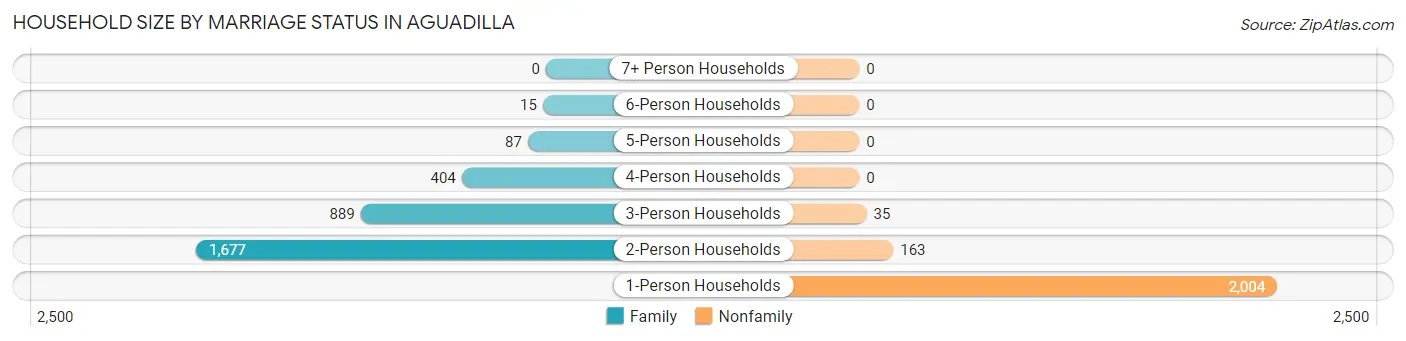
| Household Size | Family Households | Nonfamily Households |
| 1-Person Households | - | 2,004 (38.0%) |
| 2-Person Households | 1,677 (31.8%) | 163 (3.1%) |
| 3-Person Households | 889 (16.9%) | 35 (0.7%) |
| 4-Person Households | 404 (7.7%) | 0 (0.0%) |
| 5-Person Households | 87 (1.7%) | 0 (0.0%) |
| 6-Person Households | 15 (0.3%) | 0 (0.0%) |
| 7+ Person Households | 0 (0.0%) | 0 (0.0%) |
| Total | 3,072 (58.3%) | 2,202 (41.7%) |
Female Fertility in Aguadilla
Fertility by Age in Aguadilla
Average fertility rate in Aguadilla is 48.0 births per 1,000 women. Women in the age bracket of 20 to 34 years have the highest fertility rate with 71.0 births per 1,000 women. Women in the age bracket of 20 to 34 years acount for 66.1% of all women with births.
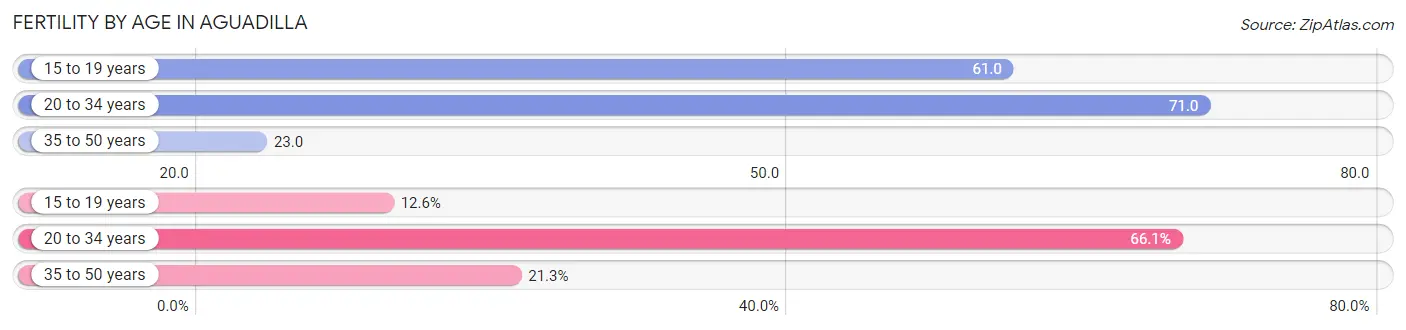
| Age Bracket | Women with Births | Births / 1,000 Women |
| 15 to 19 years | 16 (12.6%) | 61.0 |
| 20 to 34 years | 84 (66.1%) | 71.0 |
| 35 to 50 years | 27 (21.3%) | 23.0 |
| Total | 127 (100.0%) | 48.0 |
Fertility by Age by Marriage Status in Aguadilla
34.6% of women with births (127) in Aguadilla are married. The highest percentage of unmarried women with births falls into 15 to 19 years age bracket with 100.0% of them unmarried at the time of birth, while the lowest percentage of unmarried women with births belong to 35 to 50 years age bracket with 0.0% of them unmarried.
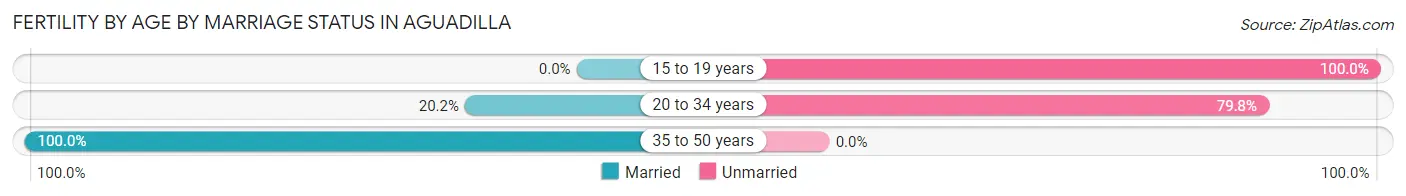
| Age Bracket | Married | Unmarried |
| 15 to 19 years | 0 (0.0%) | 16 (100.0%) |
| 20 to 34 years | 17 (20.2%) | 67 (79.8%) |
| 35 to 50 years | 27 (100.0%) | 0 (0.0%) |
| Total | 44 (34.6%) | 83 (65.3%) |
Fertility by Education in Aguadilla
Average fertility rate in Aguadilla is 48.0 births per 1,000 women. Women with the education attainment of graduate degree have the highest fertility rate of 103.0 births per 1,000 women, while women with the education attainment of bachelor's degree have the lowest fertility at 20.0 births per 1,000 women. Women with the education attainment of high school diploma represent 40.2% of all women with births.
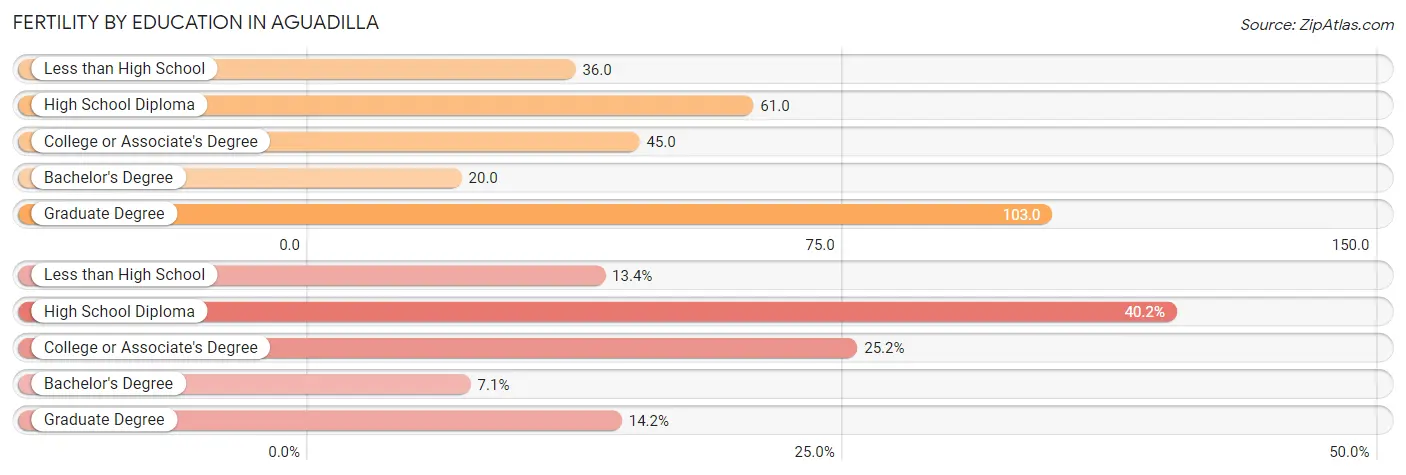
| Educational Attainment | Women with Births | Births / 1,000 Women |
| Less than High School | 17 (13.4%) | 36.0 |
| High School Diploma | 51 (40.2%) | 61.0 |
| College or Associate's Degree | 32 (25.2%) | 45.0 |
| Bachelor's Degree | 9 (7.1%) | 20.0 |
| Graduate Degree | 18 (14.2%) | 103.0 |
| Total | 127 (100.0%) | 48.0 |
Fertility by Education by Marriage Status in Aguadilla
65.3% of women with births in Aguadilla are unmarried. Women with the educational attainment of less than high school are most likely to be married with 100.0% of them married at childbirth, while women with the educational attainment of high school diploma are least likely to be married with 100.0% of them unmarried at childbirth.
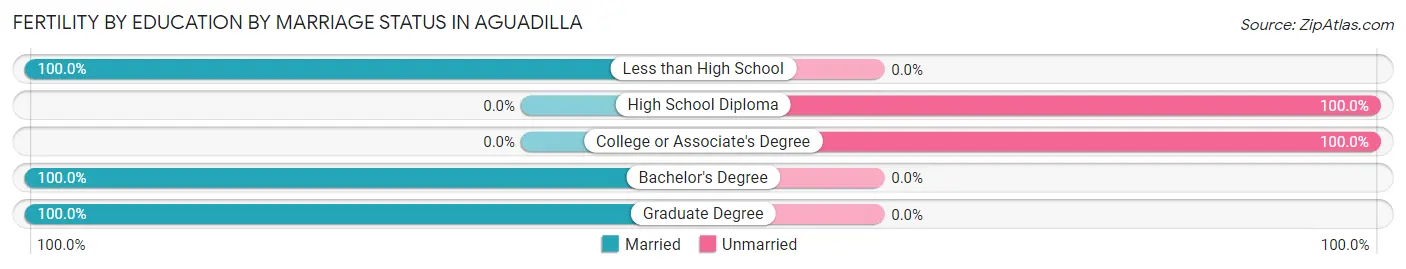
| Educational Attainment | Married | Unmarried |
| Less than High School | 17 (100.0%) | 0 (0.0%) |
| High School Diploma | 0 (0.0%) | 51 (100.0%) |
| College or Associate's Degree | 0 (0.0%) | 32 (100.0%) |
| Bachelor's Degree | 9 (100.0%) | 0 (0.0%) |
| Graduate Degree | 18 (100.0%) | 0 (0.0%) |
| Total | 44 (34.6%) | 83 (65.3%) |
Employment Characteristics in Aguadilla
Employment by Class of Employer in Aguadilla
Among the 2,132 employed individuals in Aguadilla, private company employees (1,266 | 59.4%), state government employees (310 | 14.5%), and self-employed (not incorporated) (210 | 9.9%) make up the most common classes of employment.
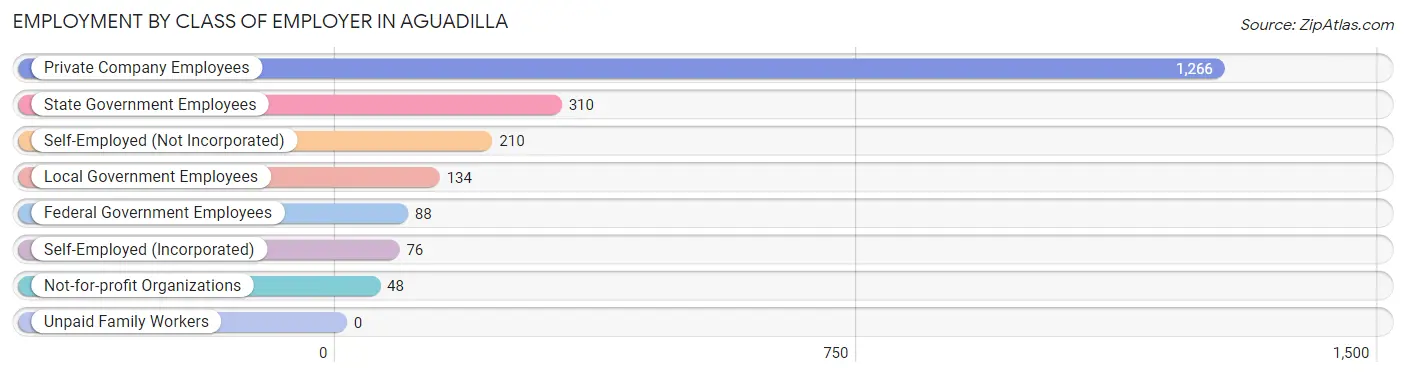
| Employer Class | # Employees | % Employees |
| Private Company Employees | 1,266 | 59.4% |
| Self-Employed (Incorporated) | 76 | 3.6% |
| Self-Employed (Not Incorporated) | 210 | 9.9% |
| Not-for-profit Organizations | 48 | 2.2% |
| Local Government Employees | 134 | 6.3% |
| State Government Employees | 310 | 14.5% |
| Federal Government Employees | 88 | 4.1% |
| Unpaid Family Workers | 0 | 0.0% |
| Total | 2,132 | 100.0% |
Employment Status by Age in Aguadilla
According to the labor force statistics for Aguadilla, out of the total population over 16 years of age (9,600), 32.5% or 3,120 individuals are in the labor force, with 25.9% or 808 of them unemployed. The age group with the highest labor force participation rate is 30 to 34 years, with 64.7% or 313 individuals in the labor force. Within the labor force, the 16 to 19 years age range has the highest percentage of unemployed individuals, with 100.0% or 91 of them being unemployed.
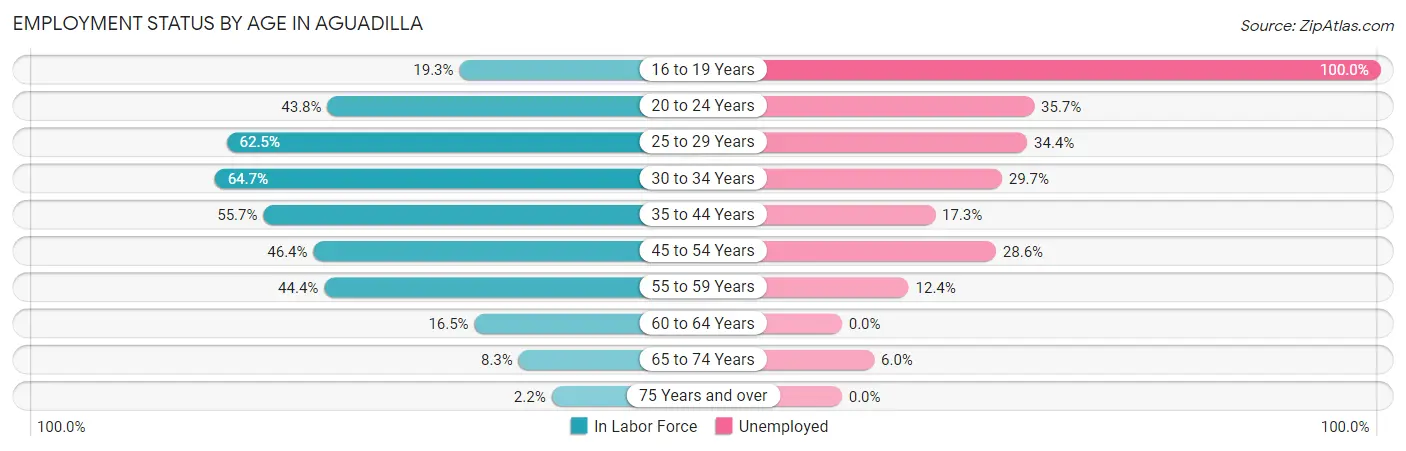
| Age Bracket | In Labor Force | Unemployed |
| 16 to 19 Years | 91 (19.3%) | 91 (100.0%) |
| 20 to 24 Years | 266 (43.8%) | 95 (35.7%) |
| 25 to 29 Years | 541 (62.5%) | 186 (34.4%) |
| 30 to 34 Years | 313 (64.7%) | 93 (29.7%) |
| 35 to 44 Years | 664 (55.7%) | 115 (17.3%) |
| 45 to 54 Years | 644 (46.4%) | 184 (28.6%) |
| 55 to 59 Years | 291 (44.4%) | 36 (12.4%) |
| 60 to 64 Years | 144 (16.5%) | 0 (0.0%) |
| 65 to 74 Years | 132 (8.3%) | 8 (6.0%) |
| 75 Years and over | 32 (2.2%) | 0 (0.0%) |
| Total | 3,120 (32.5%) | 808 (25.9%) |
Employment Status by Educational Attainment in Aguadilla
According to labor force statistics for Aguadilla, 47.6% of individuals (2,598) out of the total population between 25 and 64 years of age (5,458) are in the labor force, with 23.6% or 613 of them being unemployed. The group with the highest labor force participation rate are those with the educational attainment of bachelor's degree or higher, with 66.7% or 856 individuals in the labor force. Within the labor force, individuals with less than high school education have the highest percentage of unemployment, with 51.9% or 127 of them being unemployed.
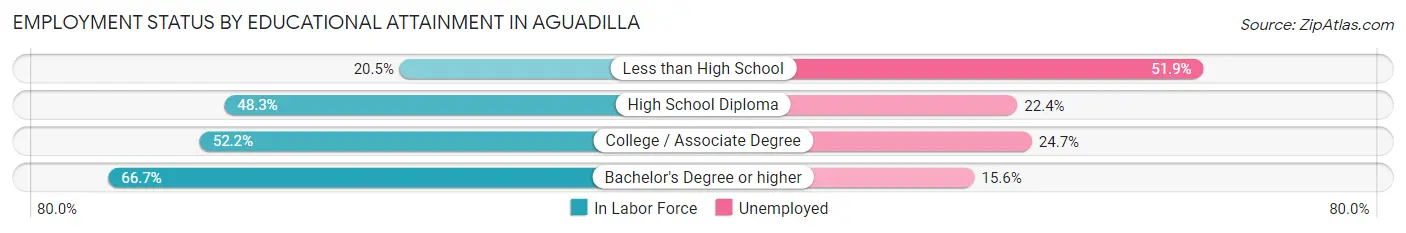
| Educational Attainment | In Labor Force | Unemployed |
| Less than High School | 244 (20.5%) | 617 (51.9%) |
| High School Diploma | 780 (48.3%) | 362 (22.4%) |
| College / Associate Degree | 716 (52.2%) | 339 (24.7%) |
| Bachelor's Degree or higher | 856 (66.7%) | 200 (15.6%) |
| Total | 2,598 (47.6%) | 1,288 (23.6%) |
Employment Occupations by Sex in Aguadilla
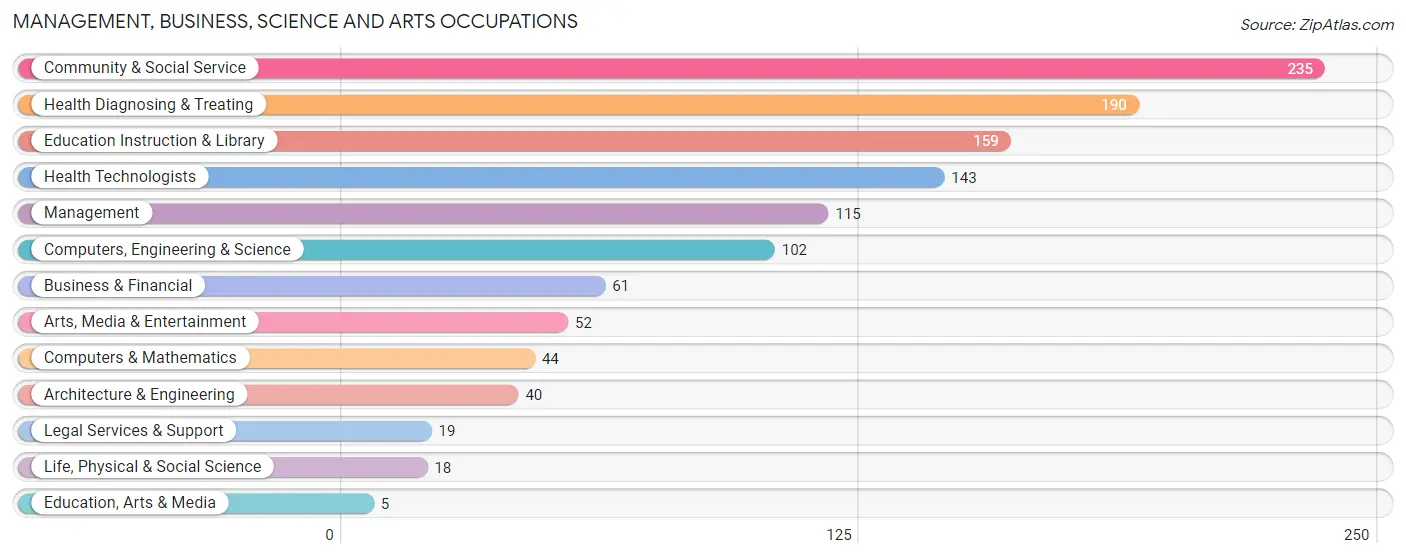
Management, Business, Science and Arts Occupations
The most common Management, Business, Science and Arts occupations in Aguadilla are Community & Social Service (235 | 10.2%), Health Diagnosing & Treating (190 | 8.3%), Education Instruction & Library (159 | 6.9%), Health Technologists (143 | 6.2%), and Management (115 | 5.0%).
Management, Business, Science and Arts Occupations by Sex
Within the Management, Business, Science and Arts occupations in Aguadilla, the most male-oriented occupations are Architecture & Engineering (100.0%), Legal Services & Support (100.0%), and Computers & Mathematics (75.0%), while the most female-oriented occupations are Life, Physical & Social Science (100.0%), Education Instruction & Library (93.7%), and Community & Social Service (83.4%).
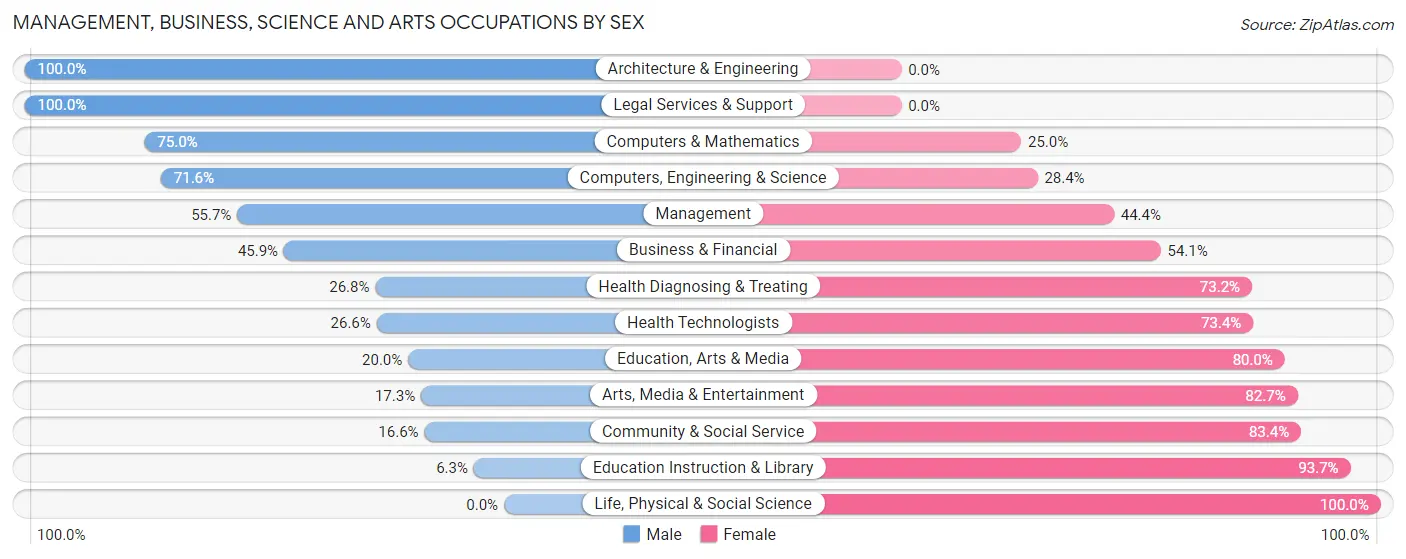
| Occupation | Male | Female |
| Management | 64 (55.6%) | 51 (44.4%) |
| Business & Financial | 28 (45.9%) | 33 (54.1%) |
| Computers, Engineering & Science | 73 (71.6%) | 29 (28.4%) |
| Computers & Mathematics | 33 (75.0%) | 11 (25.0%) |
| Architecture & Engineering | 40 (100.0%) | 0 (0.0%) |
| Life, Physical & Social Science | 0 (0.0%) | 18 (100.0%) |
| Community & Social Service | 39 (16.6%) | 196 (83.4%) |
| Education, Arts & Media | 1 (20.0%) | 4 (80.0%) |
| Legal Services & Support | 19 (100.0%) | 0 (0.0%) |
| Education Instruction & Library | 10 (6.3%) | 149 (93.7%) |
| Arts, Media & Entertainment | 9 (17.3%) | 43 (82.7%) |
| Health Diagnosing & Treating | 51 (26.8%) | 139 (73.2%) |
| Health Technologists | 38 (26.6%) | 105 (73.4%) |
| Total (Category) | 255 (36.3%) | 448 (63.7%) |
| Total (Overall) | 1,081 (47.0%) | 1,217 (53.0%) |
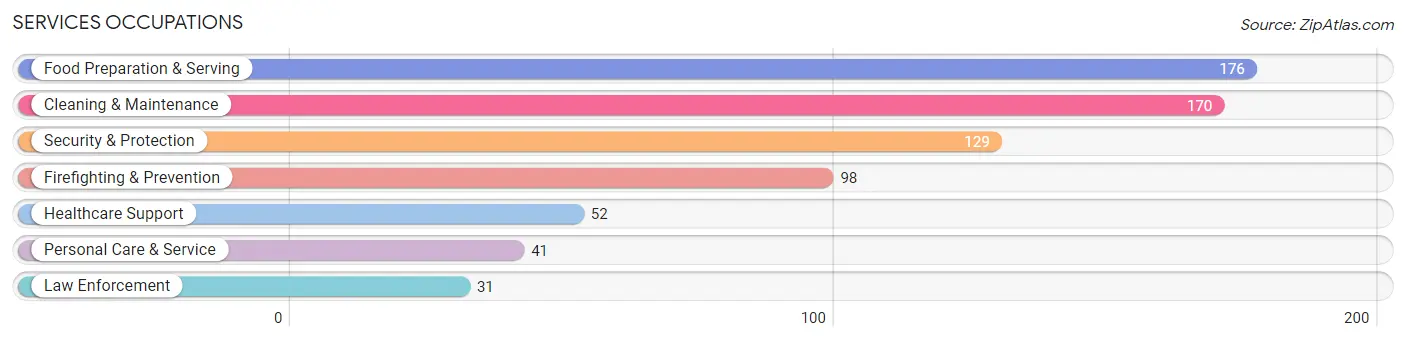
Services Occupations
The most common Services occupations in Aguadilla are Food Preparation & Serving (176 | 7.7%), Cleaning & Maintenance (170 | 7.4%), Security & Protection (129 | 5.6%), Firefighting & Prevention (98 | 4.3%), and Healthcare Support (52 | 2.3%).
Services Occupations by Sex
Within the Services occupations in Aguadilla, the most male-oriented occupations are Law Enforcement (100.0%), Security & Protection (94.6%), and Firefighting & Prevention (92.9%), while the most female-oriented occupations are Healthcare Support (78.8%), Food Preparation & Serving (63.6%), and Personal Care & Service (56.1%).
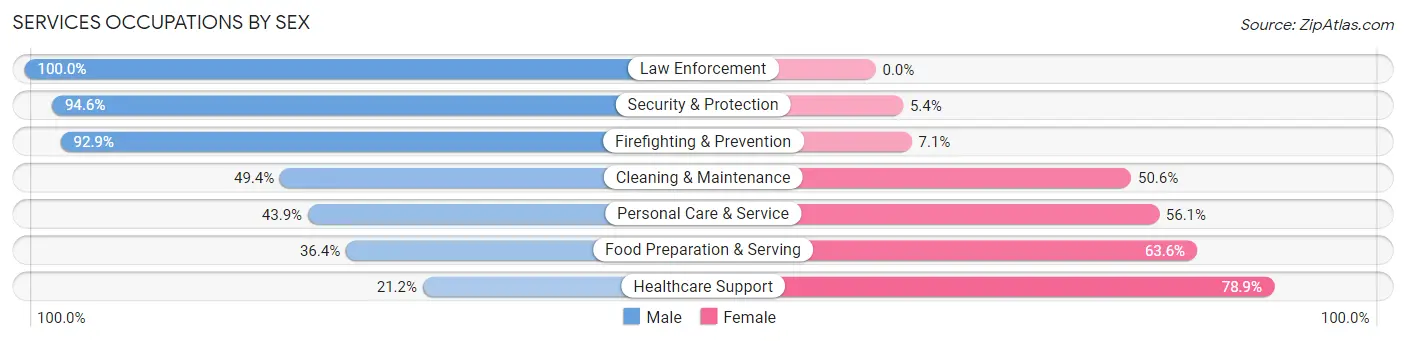
| Occupation | Male | Female |
| Healthcare Support | 11 (21.1%) | 41 (78.8%) |
| Security & Protection | 122 (94.6%) | 7 (5.4%) |
| Firefighting & Prevention | 91 (92.9%) | 7 (7.1%) |
| Law Enforcement | 31 (100.0%) | 0 (0.0%) |
| Food Preparation & Serving | 64 (36.4%) | 112 (63.6%) |
| Cleaning & Maintenance | 84 (49.4%) | 86 (50.6%) |
| Personal Care & Service | 18 (43.9%) | 23 (56.1%) |
| Total (Category) | 299 (52.6%) | 269 (47.4%) |
| Total (Overall) | 1,081 (47.0%) | 1,217 (53.0%) |
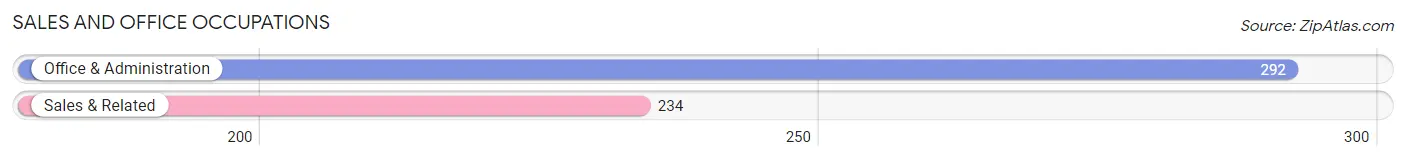
Sales and Office Occupations
The most common Sales and Office occupations in Aguadilla are Office & Administration (292 | 12.7%), and Sales & Related (234 | 10.2%).
Sales and Office Occupations by Sex

| Occupation | Male | Female |
| Sales & Related | 69 (29.5%) | 165 (70.5%) |
| Office & Administration | 48 (16.4%) | 244 (83.6%) |
| Total (Category) | 117 (22.2%) | 409 (77.8%) |
| Total (Overall) | 1,081 (47.0%) | 1,217 (53.0%) |
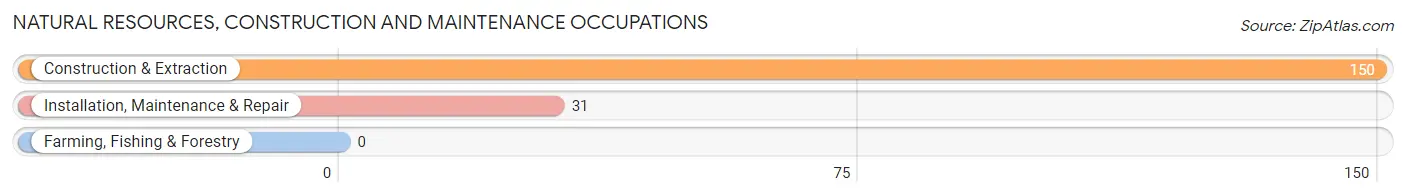
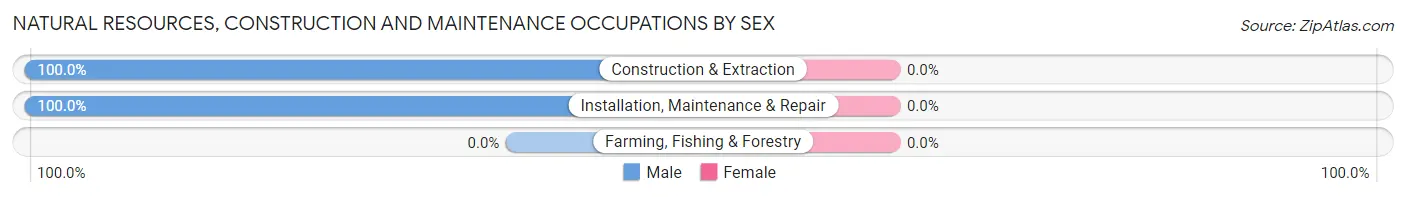
Natural Resources, Construction and Maintenance Occupations
The most common Natural Resources, Construction and Maintenance occupations in Aguadilla are Construction & Extraction (150 | 6.5%), and Installation, Maintenance & Repair (31 | 1.3%).
Natural Resources, Construction and Maintenance Occupations by Sex
| Occupation | Male | Female |
| Farming, Fishing & Forestry | 0 (0.0%) | 0 (0.0%) |
| Construction & Extraction | 150 (100.0%) | 0 (0.0%) |
| Installation, Maintenance & Repair | 31 (100.0%) | 0 (0.0%) |
| Total (Category) | 181 (100.0%) | 0 (0.0%) |
| Total (Overall) | 1,081 (47.0%) | 1,217 (53.0%) |
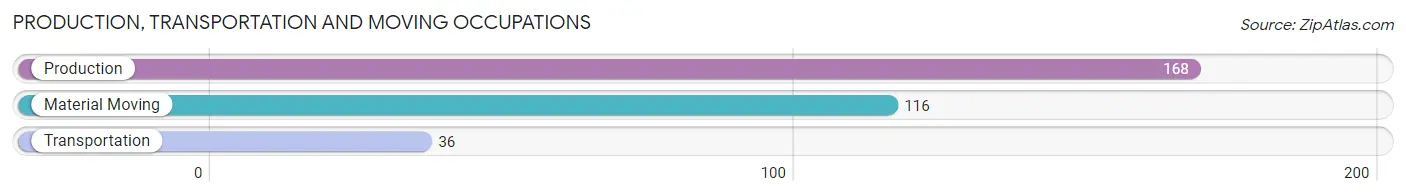
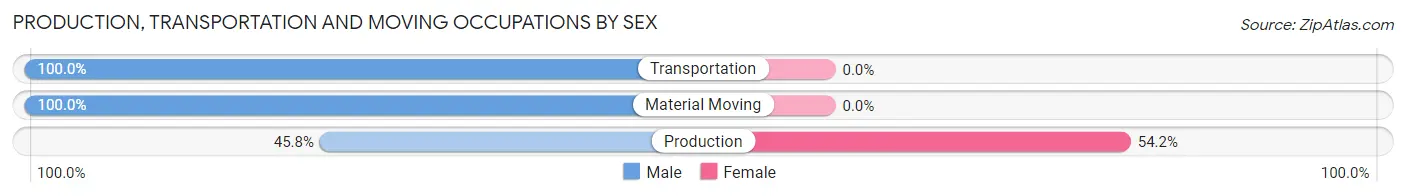
Production, Transportation and Moving Occupations
The most common Production, Transportation and Moving occupations in Aguadilla are Production (168 | 7.3%), Material Moving (116 | 5.1%), and Transportation (36 | 1.6%).
Production, Transportation and Moving Occupations by Sex
| Occupation | Male | Female |
| Production | 77 (45.8%) | 91 (54.2%) |
| Transportation | 36 (100.0%) | 0 (0.0%) |
| Material Moving | 116 (100.0%) | 0 (0.0%) |
| Total (Category) | 229 (71.6%) | 91 (28.4%) |
| Total (Overall) | 1,081 (47.0%) | 1,217 (53.0%) |
Employment Industries by Sex in Aguadilla
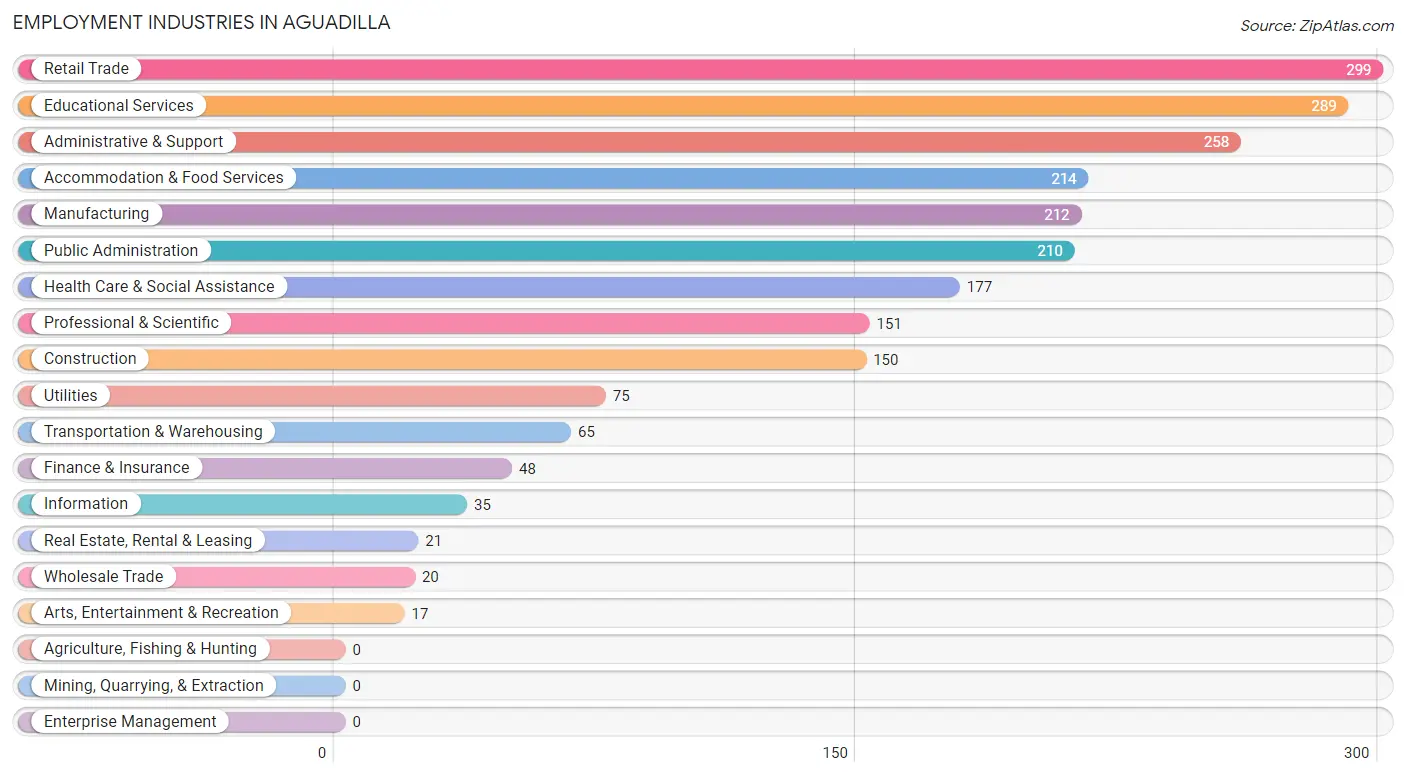
Employment Industries in Aguadilla
The major employment industries in Aguadilla include Retail Trade (299 | 13.0%), Educational Services (289 | 12.6%), Administrative & Support (258 | 11.2%), Accommodation & Food Services (214 | 9.3%), and Manufacturing (212 | 9.2%).
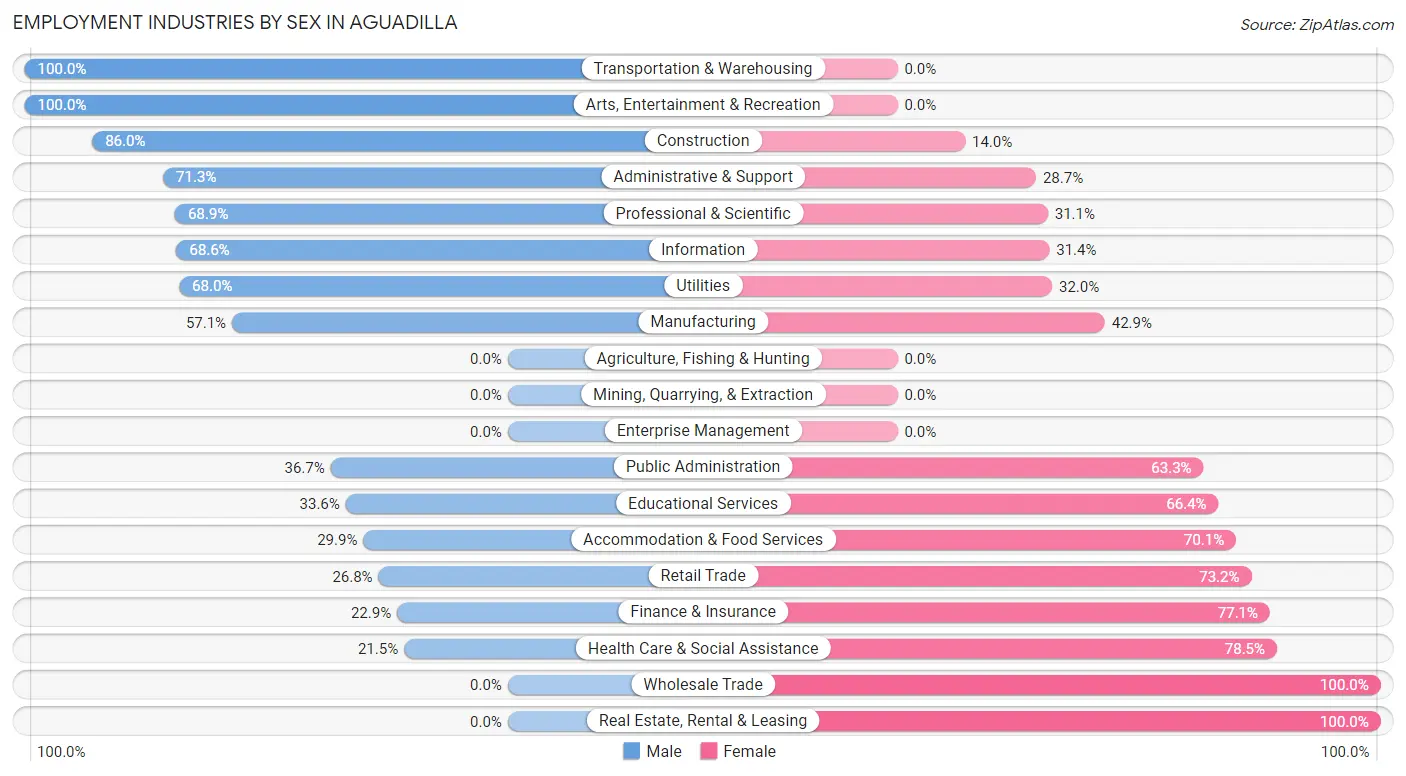
Employment Industries by Sex in Aguadilla
The Aguadilla industries that see more men than women are Transportation & Warehousing (100.0%), Arts, Entertainment & Recreation (100.0%), and Construction (86.0%), whereas the industries that tend to have a higher number of women are Wholesale Trade (100.0%), Real Estate, Rental & Leasing (100.0%), and Health Care & Social Assistance (78.5%).
| Industry | Male | Female |
| Agriculture, Fishing & Hunting | 0 (0.0%) | 0 (0.0%) |
| Mining, Quarrying, & Extraction | 0 (0.0%) | 0 (0.0%) |
| Construction | 129 (86.0%) | 21 (14.0%) |
| Manufacturing | 121 (57.1%) | 91 (42.9%) |
| Wholesale Trade | 0 (0.0%) | 20 (100.0%) |
| Retail Trade | 80 (26.8%) | 219 (73.2%) |
| Transportation & Warehousing | 65 (100.0%) | 0 (0.0%) |
| Utilities | 51 (68.0%) | 24 (32.0%) |
| Information | 24 (68.6%) | 11 (31.4%) |
| Finance & Insurance | 11 (22.9%) | 37 (77.1%) |
| Real Estate, Rental & Leasing | 0 (0.0%) | 21 (100.0%) |
| Professional & Scientific | 104 (68.9%) | 47 (31.1%) |
| Enterprise Management | 0 (0.0%) | 0 (0.0%) |
| Administrative & Support | 184 (71.3%) | 74 (28.7%) |
| Educational Services | 97 (33.6%) | 192 (66.4%) |
| Health Care & Social Assistance | 38 (21.5%) | 139 (78.5%) |
| Arts, Entertainment & Recreation | 17 (100.0%) | 0 (0.0%) |
| Accommodation & Food Services | 64 (29.9%) | 150 (70.1%) |
| Public Administration | 77 (36.7%) | 133 (63.3%) |
| Total | 1,081 (47.0%) | 1,217 (53.0%) |
Education in Aguadilla
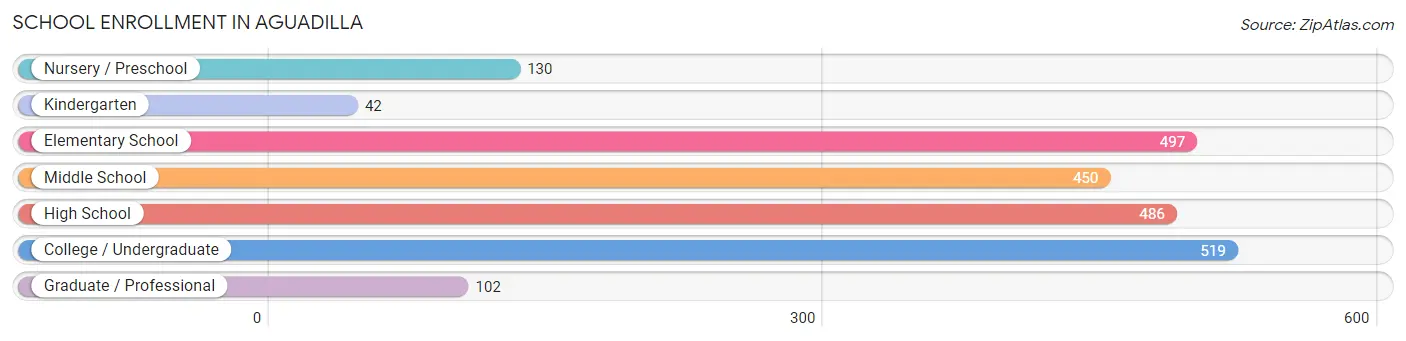
School Enrollment in Aguadilla
The most common levels of schooling among the 2,226 students in Aguadilla are college / undergraduate (519 | 23.3%), elementary school (497 | 22.3%), and high school (486 | 21.8%).
| School Level | # Students | % Students |
| Nursery / Preschool | 130 | 5.8% |
| Kindergarten | 42 | 1.9% |
| Elementary School | 497 | 22.3% |
| Middle School | 450 | 20.2% |
| High School | 486 | 21.8% |
| College / Undergraduate | 519 | 23.3% |
| Graduate / Professional | 102 | 4.6% |
| Total | 2,226 | 100.0% |
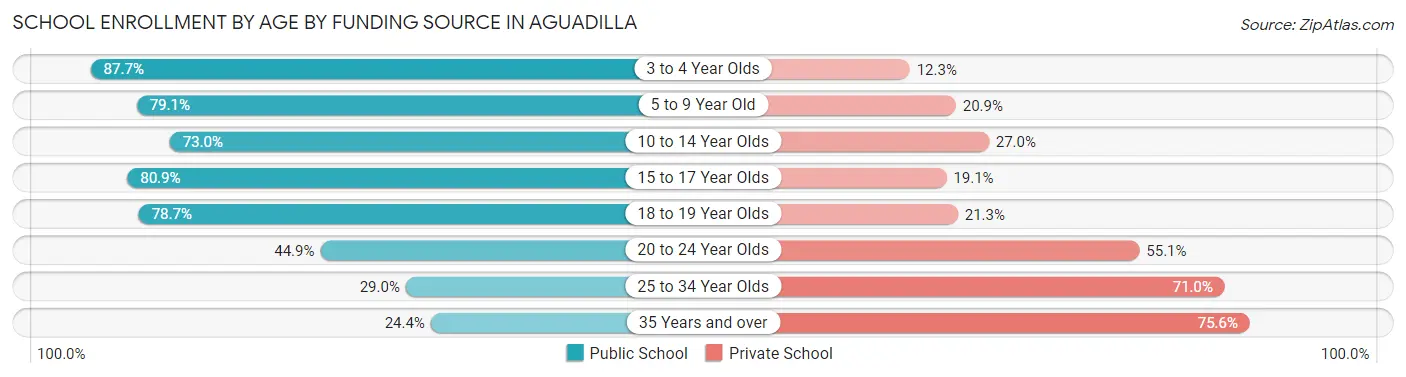
School Enrollment by Age by Funding Source in Aguadilla
Out of a total of 2,226 students who are enrolled in schools in Aguadilla, 703 (31.6%) attend a private institution, while the remaining 1,523 (68.4%) are enrolled in public schools. The age group of 35 years and over has the highest likelihood of being enrolled in private schools, with 59 (75.6% in the age bracket) enrolled. Conversely, the age group of 3 to 4 year olds has the lowest likelihood of being enrolled in a private school, with 114 (87.7% in the age bracket) attending a public institution.
| Age Bracket | Public School | Private School |
| 3 to 4 Year Olds | 114 (87.7%) | 16 (12.3%) |
| 5 to 9 Year Old | 390 (79.1%) | 103 (20.9%) |
| 10 to 14 Year Olds | 432 (73.0%) | 160 (27.0%) |
| 15 to 17 Year Olds | 283 (80.9%) | 67 (19.1%) |
| 18 to 19 Year Olds | 100 (78.7%) | 27 (21.3%) |
| 20 to 24 Year Olds | 146 (44.9%) | 179 (55.1%) |
| 25 to 34 Year Olds | 38 (29.0%) | 93 (71.0%) |
| 35 Years and over | 19 (24.4%) | 59 (75.6%) |
| Total | 1,523 (68.4%) | 703 (31.6%) |
Educational Attainment by Field of Study in Aguadilla
Education (423 | 23.4%), business (368 | 20.4%), science & technology (175 | 9.7%), social sciences (151 | 8.4%), and psychology (135 | 7.5%) are the most common fields of study among 1,805 individuals in Aguadilla who have obtained a bachelor's degree or higher.
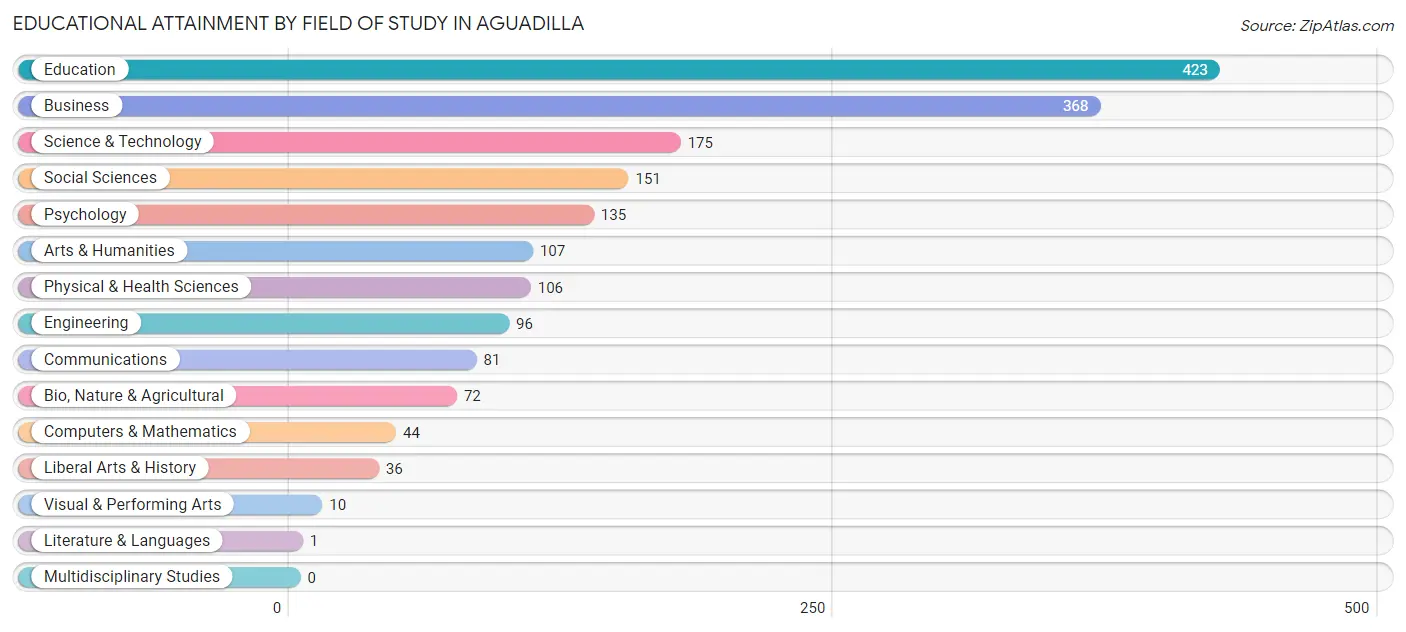
| Field of Study | # Graduates | % Graduates |
| Computers & Mathematics | 44 | 2.4% |
| Bio, Nature & Agricultural | 72 | 4.0% |
| Physical & Health Sciences | 106 | 5.9% |
| Psychology | 135 | 7.5% |
| Social Sciences | 151 | 8.4% |
| Engineering | 96 | 5.3% |
| Multidisciplinary Studies | 0 | 0.0% |
| Science & Technology | 175 | 9.7% |
| Business | 368 | 20.4% |
| Education | 423 | 23.4% |
| Literature & Languages | 1 | 0.1% |
| Liberal Arts & History | 36 | 2.0% |
| Visual & Performing Arts | 10 | 0.5% |
| Communications | 81 | 4.5% |
| Arts & Humanities | 107 | 5.9% |
| Total | 1,805 | 100.0% |
Transportation & Commute in Aguadilla
Vehicle Availability by Sex in Aguadilla
The most prevalent vehicle ownership categories in Aguadilla are males with 2 vehicles (296, accounting for 30.1%) and females with 2 vehicles (368, making up 25.8%).
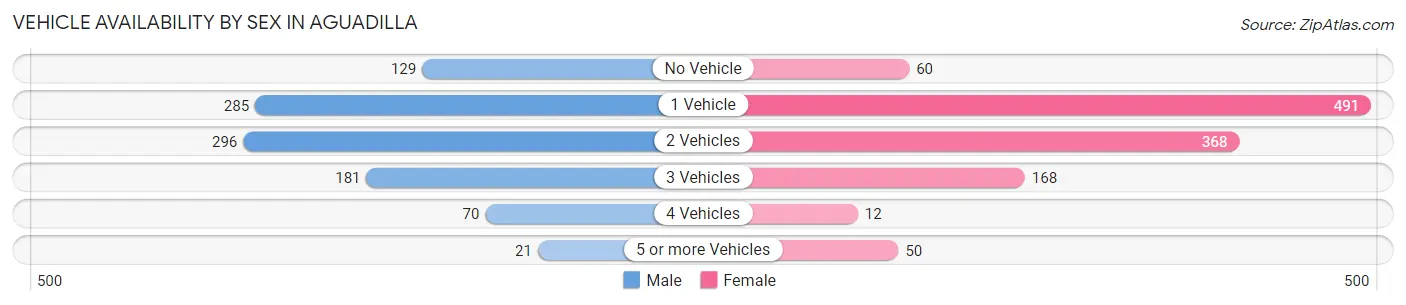
| Vehicles Available | Male | Female |
| No Vehicle | 129 (13.1%) | 60 (5.2%) |
| 1 Vehicle | 285 (29.0%) | 491 (42.7%) |
| 2 Vehicles | 296 (30.1%) | 368 (32.0%) |
| 3 Vehicles | 181 (18.4%) | 168 (14.6%) |
| 4 Vehicles | 70 (7.1%) | 12 (1.0%) |
| 5 or more Vehicles | 21 (2.1%) | 50 (4.3%) |
| Total | 982 (100.0%) | 1,149 (100.0%) |
Commute Time in Aguadilla
The most frequently occuring commute durations in Aguadilla are 15 to 19 minutes (558 commuters, 27.8%), 10 to 14 minutes (341 commuters, 17.0%), and 5 to 9 minutes (335 commuters, 16.7%).
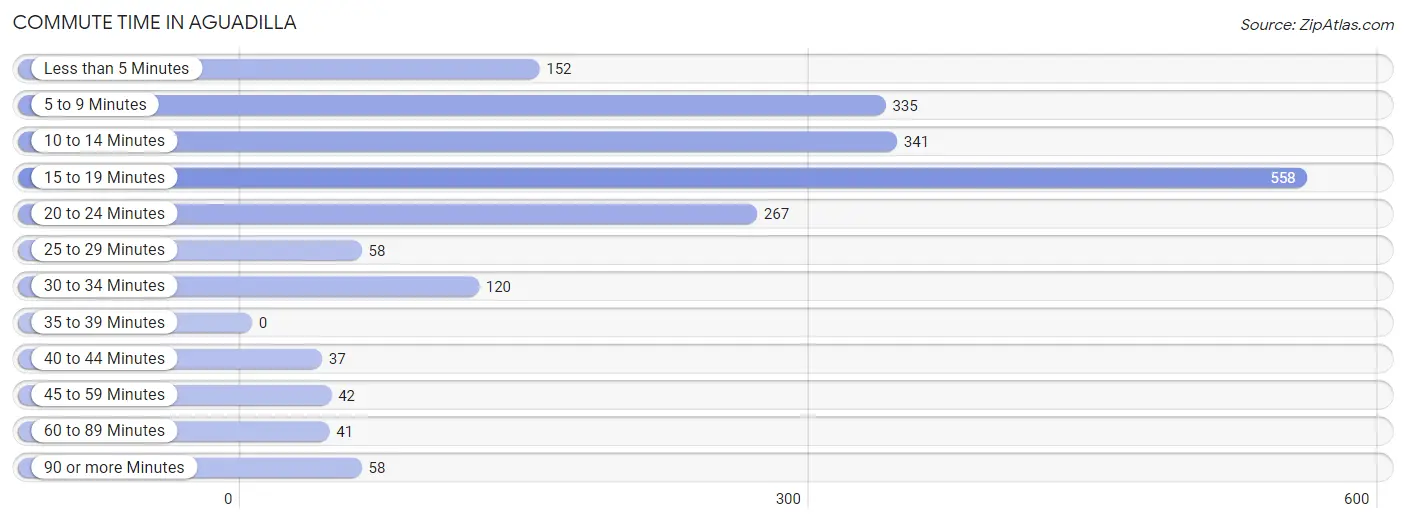
| Commute Time | # Commuters | % Commuters |
| Less than 5 Minutes | 152 | 7.6% |
| 5 to 9 Minutes | 335 | 16.7% |
| 10 to 14 Minutes | 341 | 17.0% |
| 15 to 19 Minutes | 558 | 27.8% |
| 20 to 24 Minutes | 267 | 13.3% |
| 25 to 29 Minutes | 58 | 2.9% |
| 30 to 34 Minutes | 120 | 6.0% |
| 35 to 39 Minutes | 0 | 0.0% |
| 40 to 44 Minutes | 37 | 1.8% |
| 45 to 59 Minutes | 42 | 2.1% |
| 60 to 89 Minutes | 41 | 2.0% |
| 90 or more Minutes | 58 | 2.9% |
Commute Time by Sex in Aguadilla
The most common commute times in Aguadilla are 15 to 19 minutes (221 commuters, 22.7%) for males and 15 to 19 minutes (337 commuters, 32.6%) for females.
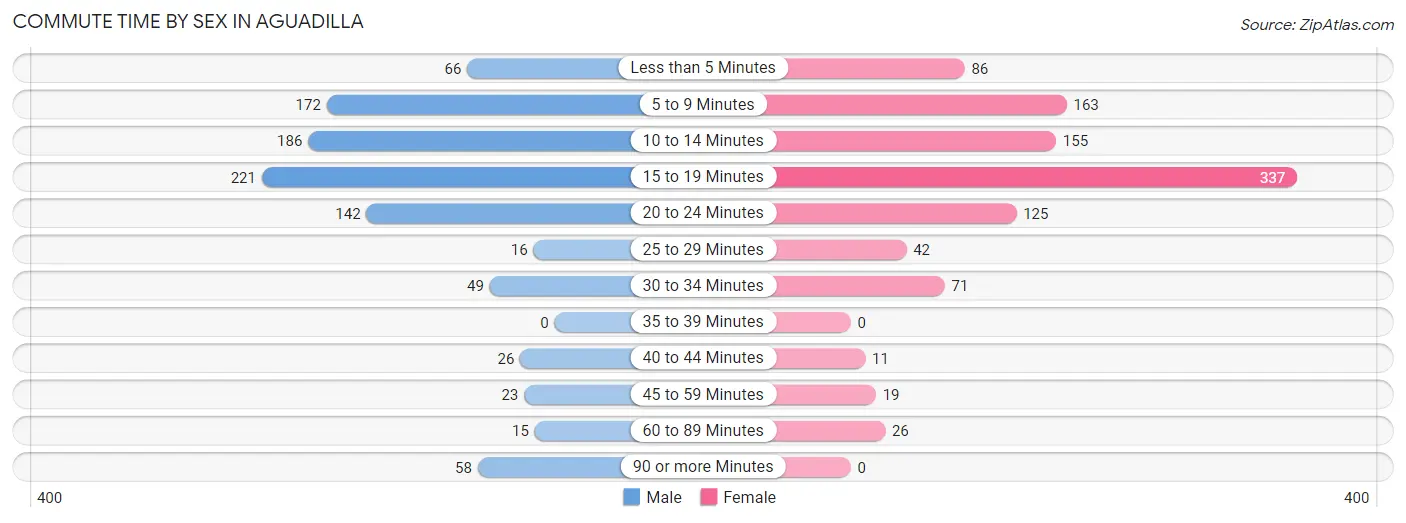
| Commute Time | Male | Female |
| Less than 5 Minutes | 66 (6.8%) | 86 (8.3%) |
| 5 to 9 Minutes | 172 (17.7%) | 163 (15.8%) |
| 10 to 14 Minutes | 186 (19.1%) | 155 (15.0%) |
| 15 to 19 Minutes | 221 (22.7%) | 337 (32.6%) |
| 20 to 24 Minutes | 142 (14.6%) | 125 (12.1%) |
| 25 to 29 Minutes | 16 (1.6%) | 42 (4.1%) |
| 30 to 34 Minutes | 49 (5.0%) | 71 (6.9%) |
| 35 to 39 Minutes | 0 (0.0%) | 0 (0.0%) |
| 40 to 44 Minutes | 26 (2.7%) | 11 (1.1%) |
| 45 to 59 Minutes | 23 (2.4%) | 19 (1.8%) |
| 60 to 89 Minutes | 15 (1.5%) | 26 (2.5%) |
| 90 or more Minutes | 58 (5.9%) | 0 (0.0%) |
Time of Departure to Work by Sex in Aguadilla
The most frequent times of departure to work in Aguadilla are 12:00 AM to 4:59 AM (110, 11.3%) for males and 7:00 AM to 7:29 AM (247, 23.9%) for females.
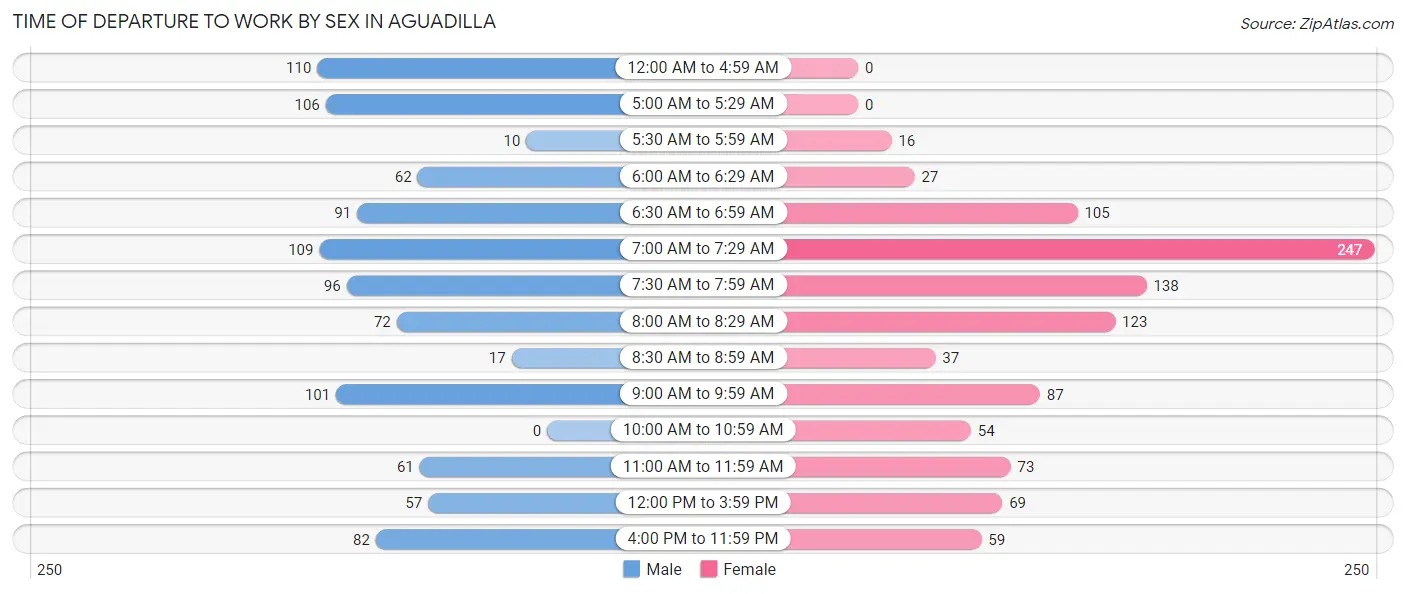
| Time of Departure | Male | Female |
| 12:00 AM to 4:59 AM | 110 (11.3%) | 0 (0.0%) |
| 5:00 AM to 5:29 AM | 106 (10.9%) | 0 (0.0%) |
| 5:30 AM to 5:59 AM | 10 (1.0%) | 16 (1.5%) |
| 6:00 AM to 6:29 AM | 62 (6.4%) | 27 (2.6%) |
| 6:30 AM to 6:59 AM | 91 (9.3%) | 105 (10.1%) |
| 7:00 AM to 7:29 AM | 109 (11.2%) | 247 (23.9%) |
| 7:30 AM to 7:59 AM | 96 (9.9%) | 138 (13.3%) |
| 8:00 AM to 8:29 AM | 72 (7.4%) | 123 (11.9%) |
| 8:30 AM to 8:59 AM | 17 (1.8%) | 37 (3.6%) |
| 9:00 AM to 9:59 AM | 101 (10.4%) | 87 (8.4%) |
| 10:00 AM to 10:59 AM | 0 (0.0%) | 54 (5.2%) |
| 11:00 AM to 11:59 AM | 61 (6.3%) | 73 (7.0%) |
| 12:00 PM to 3:59 PM | 57 (5.9%) | 69 (6.7%) |
| 4:00 PM to 11:59 PM | 82 (8.4%) | 59 (5.7%) |
| Total | 974 (100.0%) | 1,035 (100.0%) |
Housing Occupancy in Aguadilla
Occupancy by Ownership in Aguadilla
Of the total 5,274 dwellings in Aguadilla, owner-occupied units account for 2,305 (43.7%), while renter-occupied units make up 2,969 (56.3%).
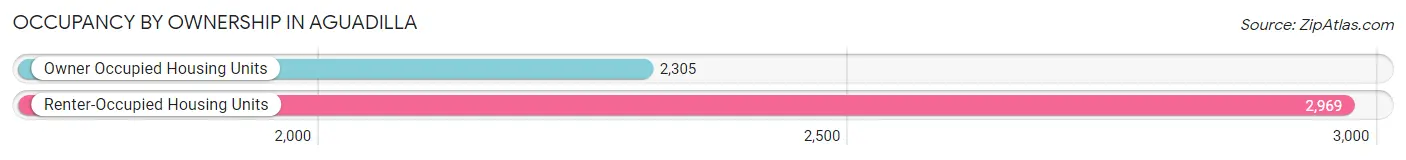
| Occupancy | # Housing Units | % Housing Units |
| Owner Occupied Housing Units | 2,305 | 43.7% |
| Renter-Occupied Housing Units | 2,969 | 56.3% |
| Total Occupied Housing Units | 5,274 | 100.0% |
Occupancy by Household Size in Aguadilla
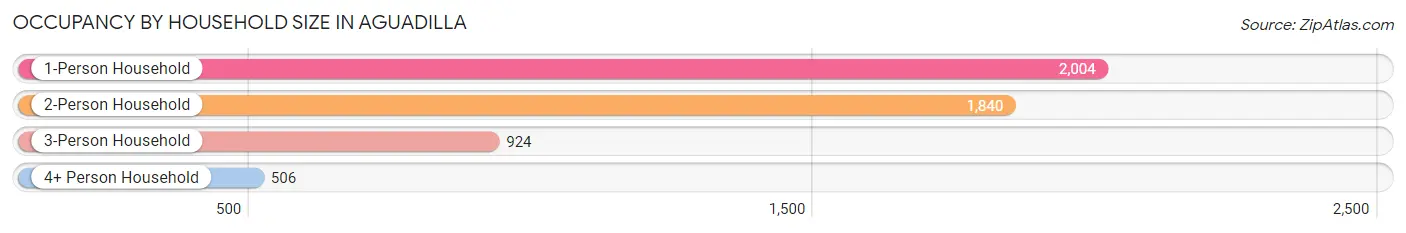
| Household Size | # Housing Units | % Housing Units |
| 1-Person Household | 2,004 | 38.0% |
| 2-Person Household | 1,840 | 34.9% |
| 3-Person Household | 924 | 17.5% |
| 4+ Person Household | 506 | 9.6% |
| Total Housing Units | 5,274 | 100.0% |
Occupancy by Ownership by Household Size in Aguadilla
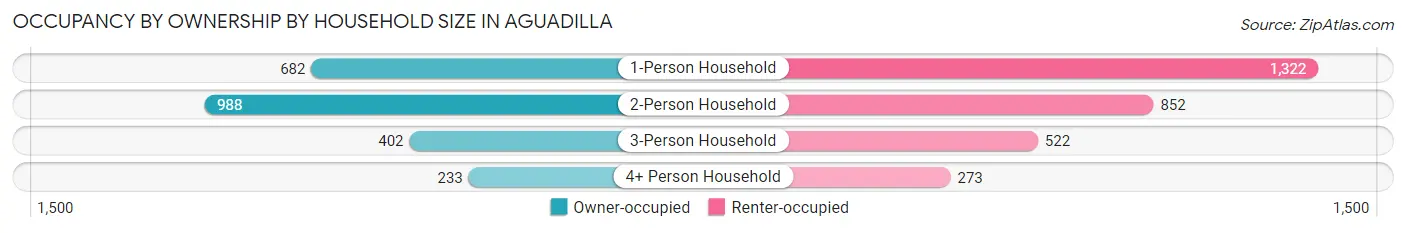
| Household Size | Owner-occupied | Renter-occupied |
| 1-Person Household | 682 (34.0%) | 1,322 (66.0%) |
| 2-Person Household | 988 (53.7%) | 852 (46.3%) |
| 3-Person Household | 402 (43.5%) | 522 (56.5%) |
| 4+ Person Household | 233 (46.1%) | 273 (53.9%) |
| Total Housing Units | 2,305 (43.7%) | 2,969 (56.3%) |
Occupancy by Educational Attainment in Aguadilla
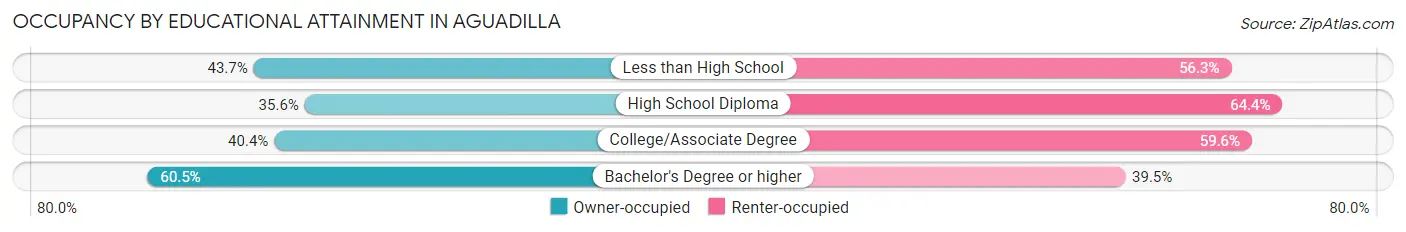
| Household Size | Owner-occupied | Renter-occupied |
| Less than High School | 717 (43.7%) | 924 (56.3%) |
| High School Diploma | 596 (35.6%) | 1,079 (64.4%) |
| College/Associate Degree | 388 (40.4%) | 572 (59.6%) |
| Bachelor's Degree or higher | 604 (60.5%) | 394 (39.5%) |
Occupancy by Age of Householder in Aguadilla
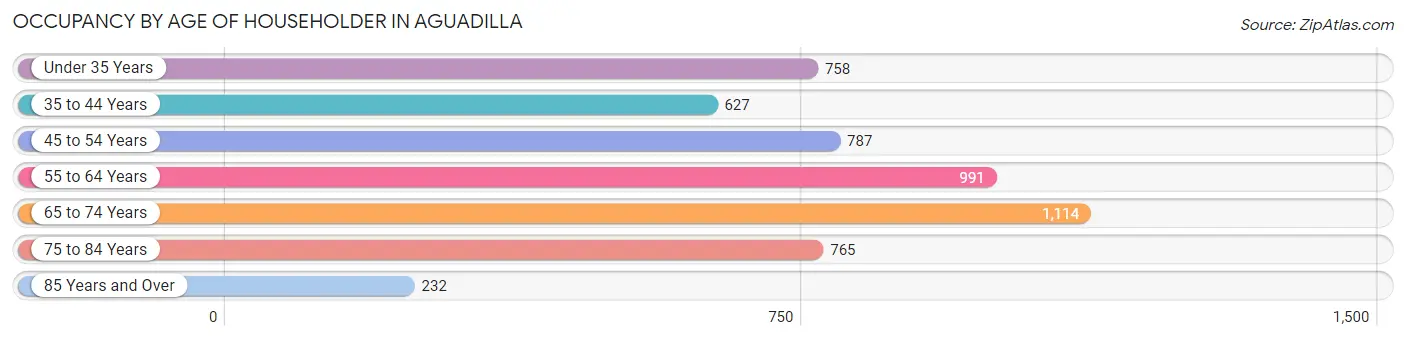
| Age Bracket | # Households | % Households |
| Under 35 Years | 758 | 14.4% |
| 35 to 44 Years | 627 | 11.9% |
| 45 to 54 Years | 787 | 14.9% |
| 55 to 64 Years | 991 | 18.8% |
| 65 to 74 Years | 1,114 | 21.1% |
| 75 to 84 Years | 765 | 14.5% |
| 85 Years and Over | 232 | 4.4% |
| Total | 5,274 | 100.0% |
Housing Finances in Aguadilla
Median Income by Occupancy in Aguadilla
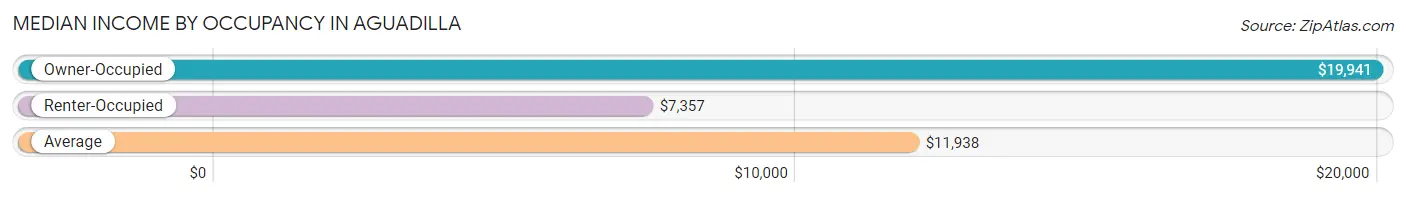
| Occupancy Type | # Households | Median Income |
| Owner-Occupied | 2,305 (43.7%) | $19,941 |
| Renter-Occupied | 2,969 (56.3%) | $7,357 |
| Average | 5,274 (100.0%) | $11,938 |
Occupancy by Householder Income Bracket in Aguadilla
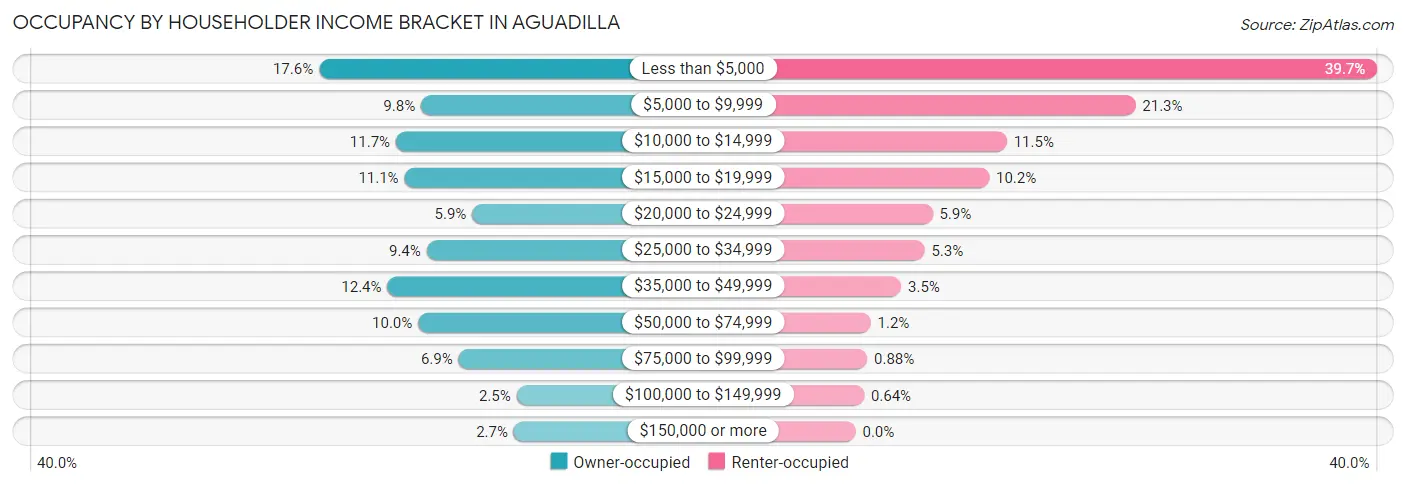
| Income Bracket | Owner-occupied | Renter-occupied |
| Less than $5,000 | 405 (17.6%) | 1,180 (39.7%) |
| $5,000 to $9,999 | 226 (9.8%) | 633 (21.3%) |
| $10,000 to $14,999 | 270 (11.7%) | 342 (11.5%) |
| $15,000 to $19,999 | 255 (11.1%) | 302 (10.2%) |
| $20,000 to $24,999 | 136 (5.9%) | 174 (5.9%) |
| $25,000 to $34,999 | 216 (9.4%) | 156 (5.2%) |
| $35,000 to $49,999 | 285 (12.4%) | 103 (3.5%) |
| $50,000 to $74,999 | 231 (10.0%) | 34 (1.1%) |
| $75,000 to $99,999 | 160 (6.9%) | 26 (0.9%) |
| $100,000 to $149,999 | 58 (2.5%) | 19 (0.6%) |
| $150,000 or more | 63 (2.7%) | 0 (0.0%) |
| Total | 2,305 (100.0%) | 2,969 (100.0%) |
Monthly Housing Cost Tiers in Aguadilla
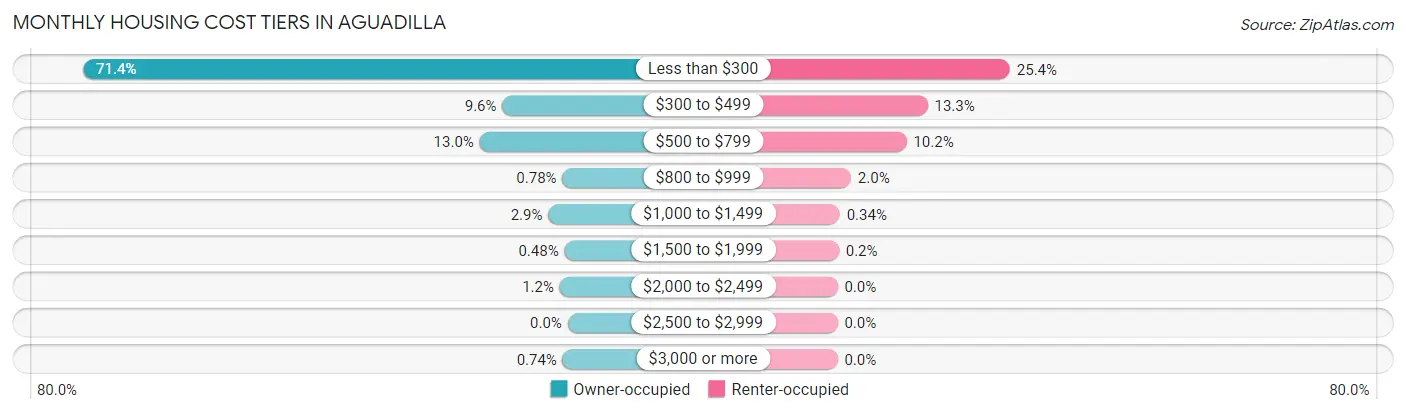
| Monthly Cost | Owner-occupied | Renter-occupied |
| Less than $300 | 1,645 (71.4%) | 754 (25.4%) |
| $300 to $499 | 222 (9.6%) | 394 (13.3%) |
| $500 to $799 | 299 (13.0%) | 302 (10.2%) |
| $800 to $999 | 18 (0.8%) | 59 (2.0%) |
| $1,000 to $1,499 | 66 (2.9%) | 10 (0.3%) |
| $1,500 to $1,999 | 11 (0.5%) | 6 (0.2%) |
| $2,000 to $2,499 | 27 (1.2%) | 0 (0.0%) |
| $2,500 to $2,999 | 0 (0.0%) | 0 (0.0%) |
| $3,000 or more | 17 (0.7%) | 0 (0.0%) |
| Total | 2,305 (100.0%) | 2,969 (100.0%) |
Physical Housing Characteristics in Aguadilla
Housing Structures in Aguadilla
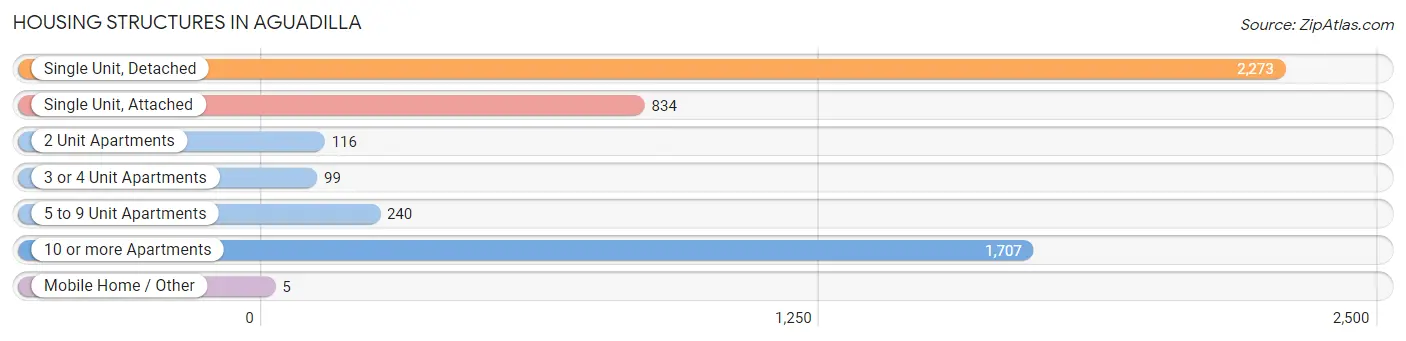
| Structure Type | # Housing Units | % Housing Units |
| Single Unit, Detached | 2,273 | 43.1% |
| Single Unit, Attached | 834 | 15.8% |
| 2 Unit Apartments | 116 | 2.2% |
| 3 or 4 Unit Apartments | 99 | 1.9% |
| 5 to 9 Unit Apartments | 240 | 4.5% |
| 10 or more Apartments | 1,707 | 32.4% |
| Mobile Home / Other | 5 | 0.1% |
| Total | 5,274 | 100.0% |
Housing Structures by Occupancy in Aguadilla
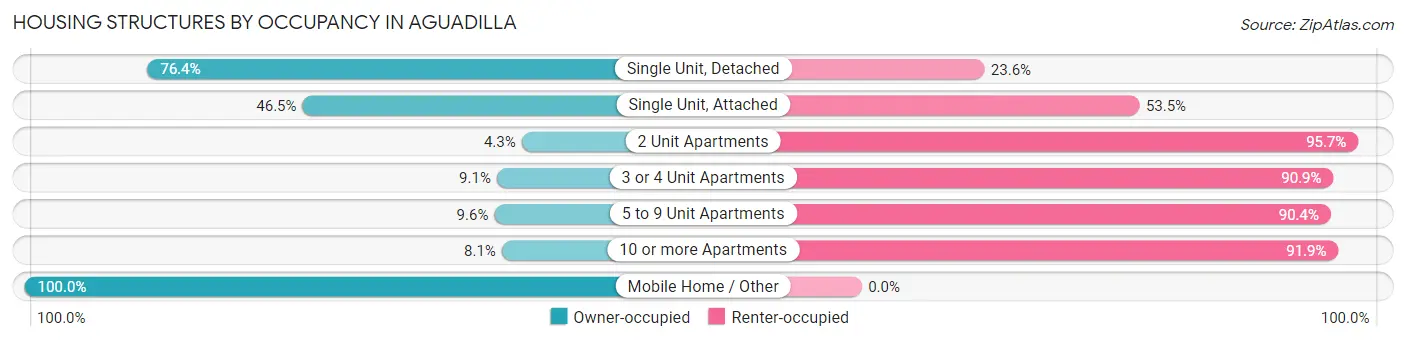
| Structure Type | Owner-occupied | Renter-occupied |
| Single Unit, Detached | 1,736 (76.4%) | 537 (23.6%) |
| Single Unit, Attached | 388 (46.5%) | 446 (53.5%) |
| 2 Unit Apartments | 5 (4.3%) | 111 (95.7%) |
| 3 or 4 Unit Apartments | 9 (9.1%) | 90 (90.9%) |
| 5 to 9 Unit Apartments | 23 (9.6%) | 217 (90.4%) |
| 10 or more Apartments | 139 (8.1%) | 1,568 (91.9%) |
| Mobile Home / Other | 5 (100.0%) | 0 (0.0%) |
| Total | 2,305 (43.7%) | 2,969 (56.3%) |
Housing Structures by Number of Rooms in Aguadilla
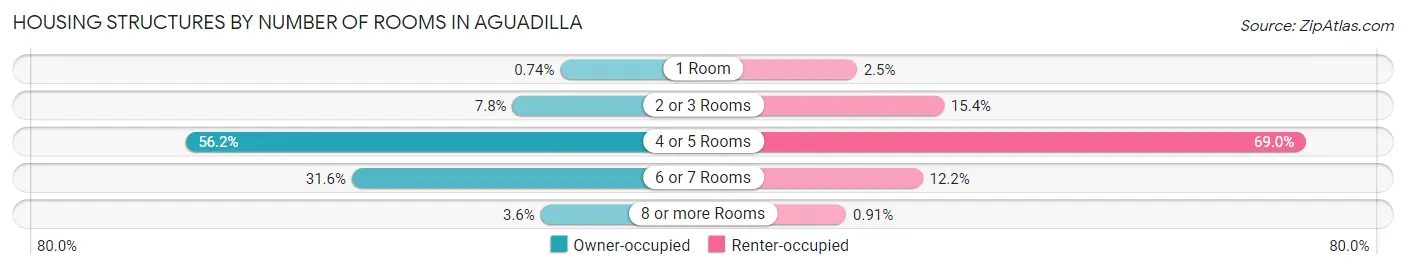
| Number of Rooms | Owner-occupied | Renter-occupied |
| 1 Room | 17 (0.7%) | 74 (2.5%) |
| 2 or 3 Rooms | 180 (7.8%) | 457 (15.4%) |
| 4 or 5 Rooms | 1,296 (56.2%) | 2,048 (69.0%) |
| 6 or 7 Rooms | 728 (31.6%) | 363 (12.2%) |
| 8 or more Rooms | 84 (3.6%) | 27 (0.9%) |
| Total | 2,305 (100.0%) | 2,969 (100.0%) |
Housing Structure by Heating Type in Aguadilla
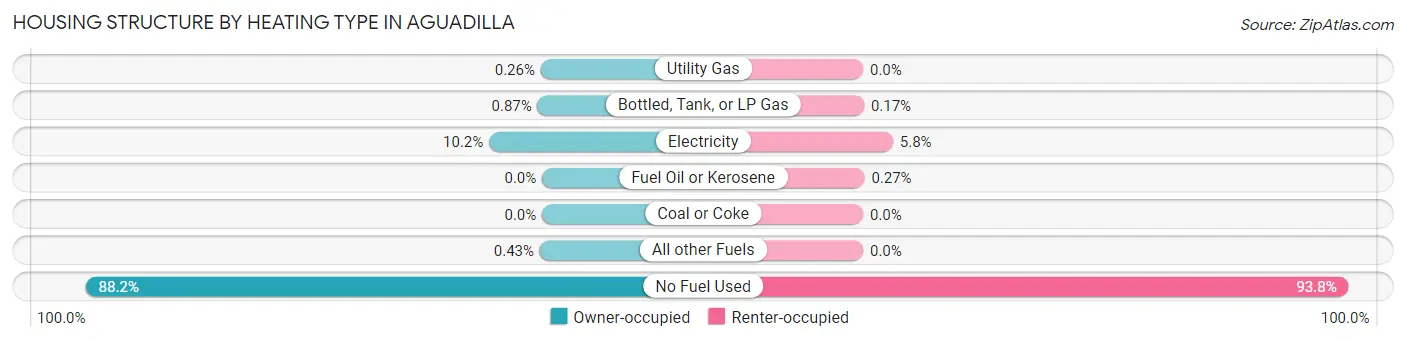
| Heating Type | Owner-occupied | Renter-occupied |
| Utility Gas | 6 (0.3%) | 0 (0.0%) |
| Bottled, Tank, or LP Gas | 20 (0.9%) | 5 (0.2%) |
| Electricity | 236 (10.2%) | 171 (5.8%) |
| Fuel Oil or Kerosene | 0 (0.0%) | 8 (0.3%) |
| Coal or Coke | 0 (0.0%) | 0 (0.0%) |
| All other Fuels | 10 (0.4%) | 0 (0.0%) |
| No Fuel Used | 2,033 (88.2%) | 2,785 (93.8%) |
| Total | 2,305 (100.0%) | 2,969 (100.0%) |
Household Vehicle Usage in Aguadilla
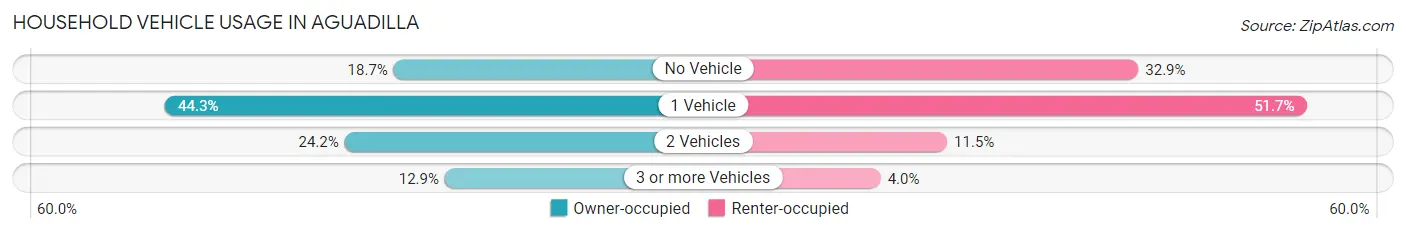
| Vehicles per Household | Owner-occupied | Renter-occupied |
| No Vehicle | 430 (18.7%) | 976 (32.9%) |
| 1 Vehicle | 1,020 (44.3%) | 1,534 (51.7%) |
| 2 Vehicles | 557 (24.2%) | 340 (11.5%) |
| 3 or more Vehicles | 298 (12.9%) | 119 (4.0%) |
| Total | 2,305 (100.0%) | 2,969 (100.0%) |
Real Estate & Mortgages in Aguadilla
Real Estate and Mortgage Overview in Aguadilla
| Characteristic | Without Mortgage | With Mortgage |
| Housing Units | 1,903 | 402 |
| Median Property Value | $94,800 | $151,100 |
| Median Household Income | $19,232 | $17 |
| Monthly Housing Costs | $150 | $17 |
| Real Estate Taxes | $724 | $350 |
Property Value by Mortgage Status in Aguadilla
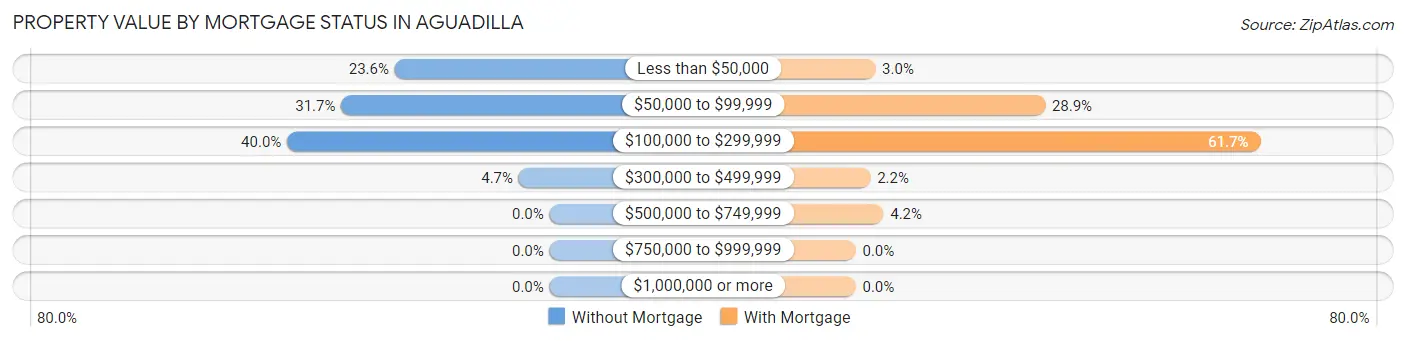
| Property Value | Without Mortgage | With Mortgage |
| Less than $50,000 | 449 (23.6%) | 12 (3.0%) |
| $50,000 to $99,999 | 604 (31.7%) | 116 (28.9%) |
| $100,000 to $299,999 | 761 (40.0%) | 248 (61.7%) |
| $300,000 to $499,999 | 89 (4.7%) | 9 (2.2%) |
| $500,000 to $749,999 | 0 (0.0%) | 17 (4.2%) |
| $750,000 to $999,999 | 0 (0.0%) | 0 (0.0%) |
| $1,000,000 or more | 0 (0.0%) | 0 (0.0%) |
| Total | 1,903 (100.0%) | 402 (100.0%) |
Household Income by Mortgage Status in Aguadilla
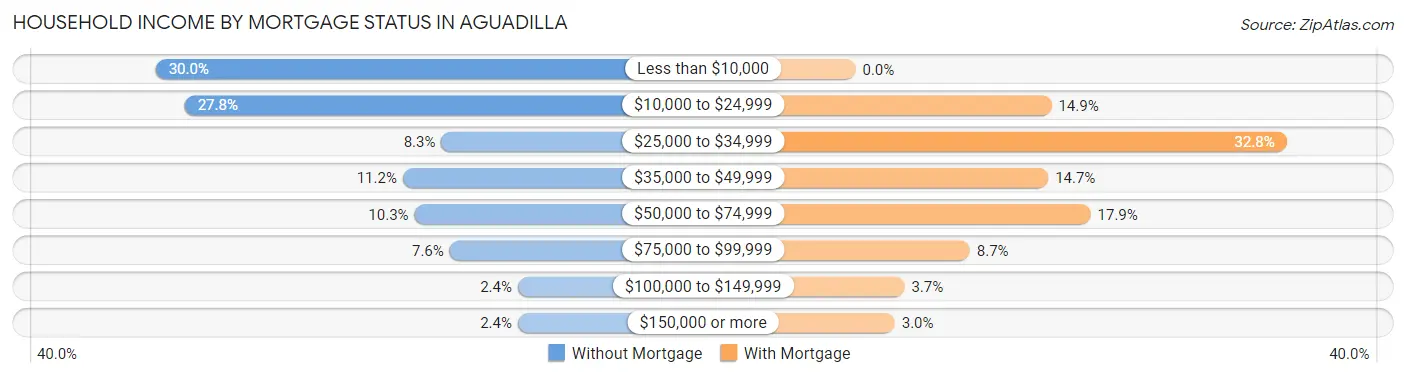
| Household Income | Without Mortgage | With Mortgage |
| Less than $10,000 | 571 (30.0%) | 0 (0.0%) |
| $10,000 to $24,999 | 529 (27.8%) | 60 (14.9%) |
| $25,000 to $34,999 | 157 (8.3%) | 132 (32.8%) |
| $35,000 to $49,999 | 213 (11.2%) | 59 (14.7%) |
| $50,000 to $74,999 | 196 (10.3%) | 72 (17.9%) |
| $75,000 to $99,999 | 145 (7.6%) | 35 (8.7%) |
| $100,000 to $149,999 | 46 (2.4%) | 15 (3.7%) |
| $150,000 or more | 46 (2.4%) | 12 (3.0%) |
| Total | 1,903 (100.0%) | 402 (100.0%) |
Property Value to Household Income Ratio in Aguadilla
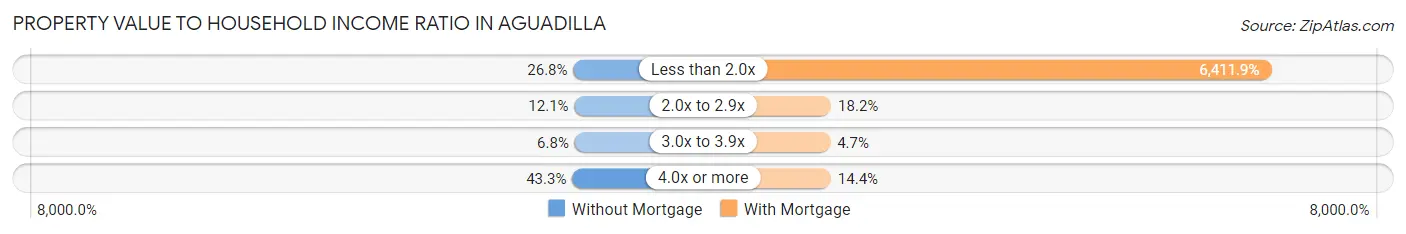
| Value-to-Income Ratio | Without Mortgage | With Mortgage |
| Less than 2.0x | 510 (26.8%) | 25,776 (6,411.9%) |
| 2.0x to 2.9x | 230 (12.1%) | 73 (18.2%) |
| 3.0x to 3.9x | 130 (6.8%) | 19 (4.7%) |
| 4.0x or more | 823 (43.2%) | 58 (14.4%) |
| Total | 1,903 (100.0%) | 402 (100.0%) |
Real Estate Taxes by Mortgage Status in Aguadilla
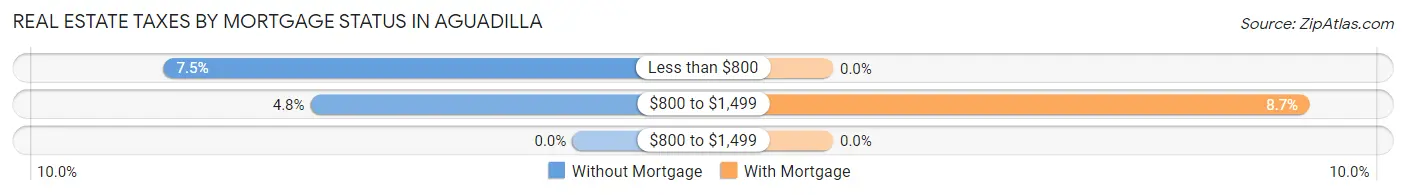
| Property Taxes | Without Mortgage | With Mortgage |
| Less than $800 | 142 (7.5%) | 0 (0.0%) |
| $800 to $1,499 | 91 (4.8%) | 35 (8.7%) |
| $800 to $1,499 | 0 (0.0%) | 0 (0.0%) |
| Total | 1,903 (100.0%) | 402 (100.0%) |
Health & Disability in Aguadilla
Health Insurance Coverage by Age in Aguadilla
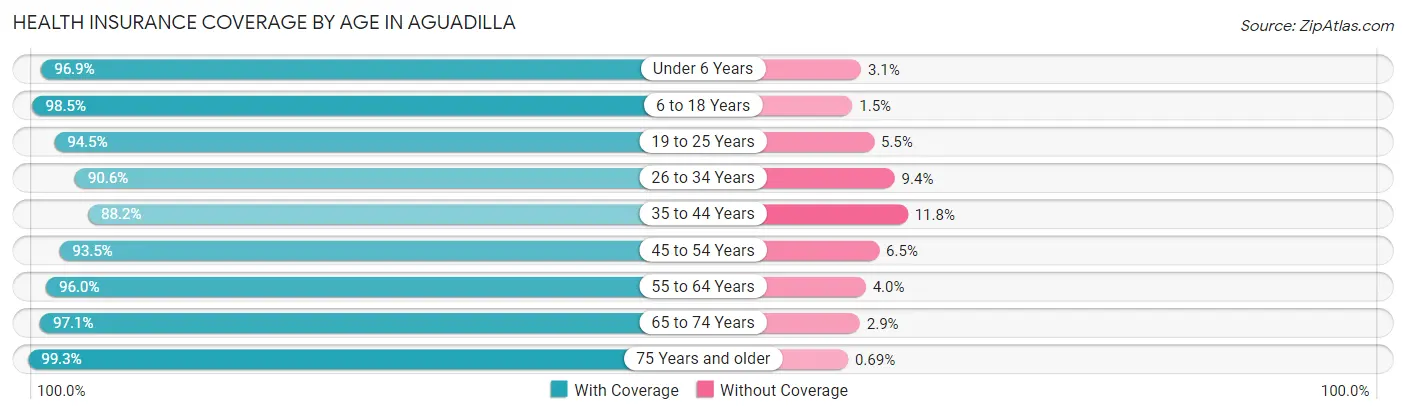
| Age Bracket | With Coverage | Without Coverage |
| Under 6 Years | 620 (96.9%) | 20 (3.1%) |
| 6 to 18 Years | 1,507 (98.5%) | 23 (1.5%) |
| 19 to 25 Years | 733 (94.5%) | 43 (5.5%) |
| 26 to 34 Years | 1,148 (90.6%) | 119 (9.4%) |
| 35 to 44 Years | 1,051 (88.2%) | 141 (11.8%) |
| 45 to 54 Years | 1,281 (93.5%) | 89 (6.5%) |
| 55 to 64 Years | 1,465 (96.0%) | 61 (4.0%) |
| 65 to 74 Years | 1,541 (97.1%) | 46 (2.9%) |
| 75 Years and older | 1,443 (99.3%) | 10 (0.7%) |
| Total | 10,789 (95.1%) | 552 (4.9%) |
Health Insurance Coverage by Citizenship Status in Aguadilla
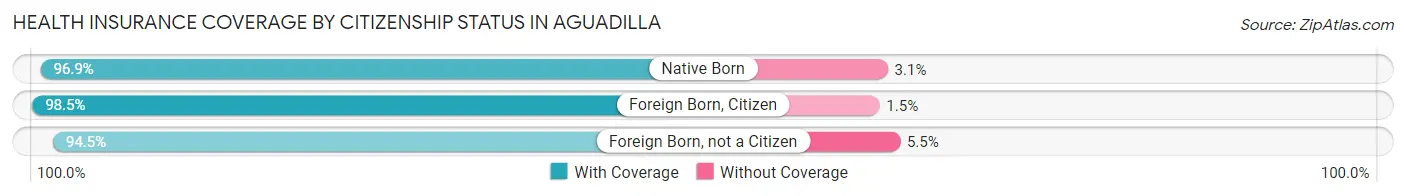
| Citizenship Status | With Coverage | Without Coverage |
| Native Born | 620 (96.9%) | 20 (3.1%) |
| Foreign Born, Citizen | 1,507 (98.5%) | 23 (1.5%) |
| Foreign Born, not a Citizen | 733 (94.5%) | 43 (5.5%) |
Health Insurance Coverage by Household Income in Aguadilla
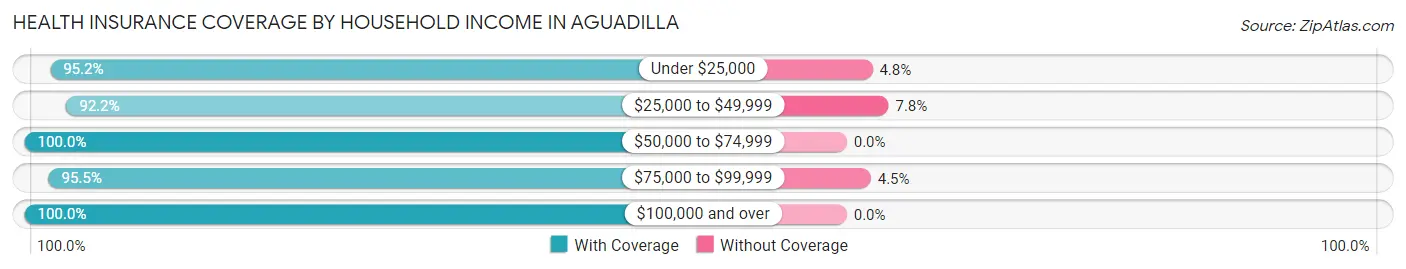
| Household Income | With Coverage | Without Coverage |
| Under $25,000 | 7,303 (95.2%) | 369 (4.8%) |
| $25,000 to $49,999 | 1,887 (92.2%) | 160 (7.8%) |
| $50,000 to $74,999 | 683 (100.0%) | 0 (0.0%) |
| $75,000 to $99,999 | 489 (95.5%) | 23 (4.5%) |
| $100,000 and over | 415 (100.0%) | 0 (0.0%) |
Public vs Private Health Insurance Coverage by Age in Aguadilla
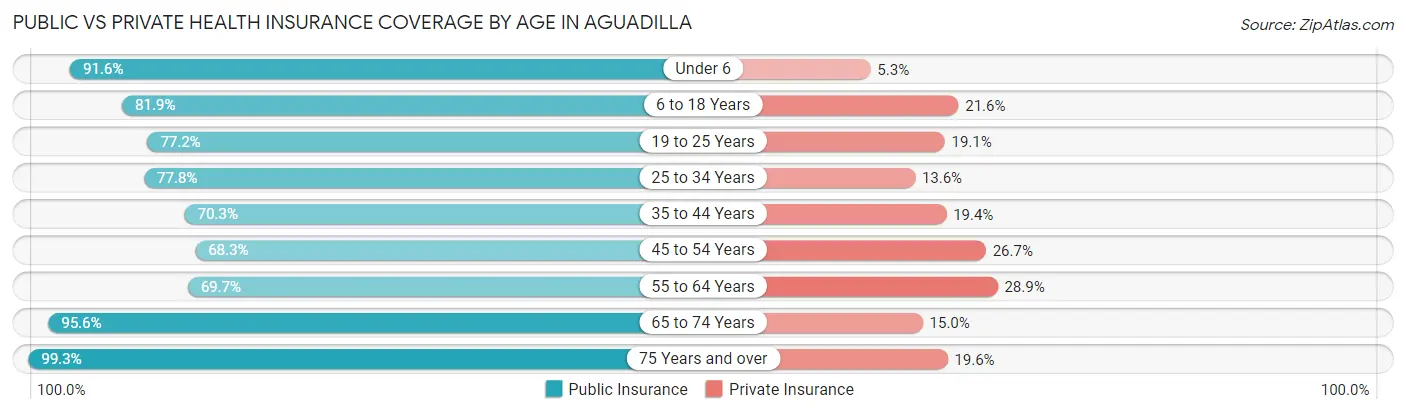
| Age Bracket | Public Insurance | Private Insurance |
| Under 6 | 586 (91.6%) | 34 (5.3%) |
| 6 to 18 Years | 1,253 (81.9%) | 331 (21.6%) |
| 19 to 25 Years | 599 (77.2%) | 148 (19.1%) |
| 25 to 34 Years | 986 (77.8%) | 172 (13.6%) |
| 35 to 44 Years | 838 (70.3%) | 231 (19.4%) |
| 45 to 54 Years | 936 (68.3%) | 366 (26.7%) |
| 55 to 64 Years | 1,064 (69.7%) | 441 (28.9%) |
| 65 to 74 Years | 1,517 (95.6%) | 238 (15.0%) |
| 75 Years and over | 1,443 (99.3%) | 285 (19.6%) |
| Total | 9,222 (81.3%) | 2,246 (19.8%) |
Disability Status by Sex by Age in Aguadilla
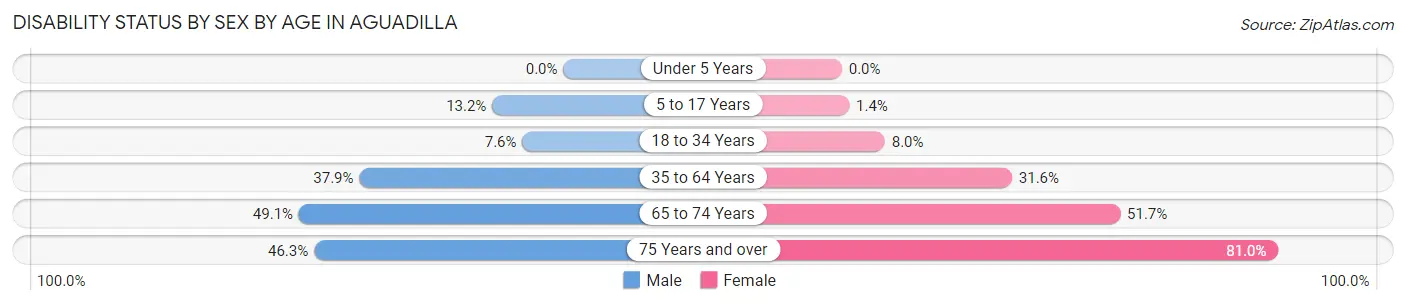
| Age Bracket | Male | Female |
| Under 5 Years | 0 (0.0%) | 0 (0.0%) |
| 5 to 17 Years | 104 (13.2%) | 9 (1.3%) |
| 18 to 34 Years | 64 (7.6%) | 106 (8.0%) |
| 35 to 64 Years | 688 (37.9%) | 717 (31.6%) |
| 65 to 74 Years | 320 (49.1%) | 483 (51.7%) |
| 75 Years and over | 304 (46.3%) | 645 (81.0%) |
Disability Class by Sex by Age in Aguadilla
Disability Class: Hearing Difficulty
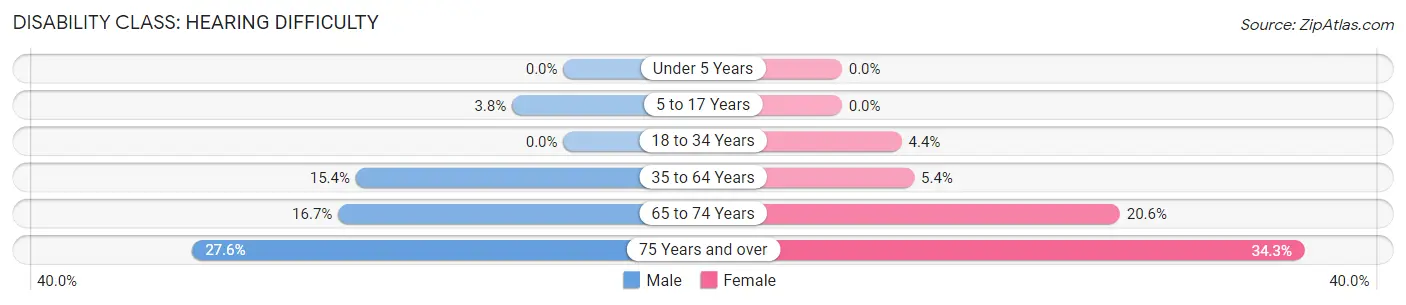
| Age Bracket | Male | Female |
| Under 5 Years | 0 (0.0%) | 0 (0.0%) |
| 5 to 17 Years | 30 (3.8%) | 0 (0.0%) |
| 18 to 34 Years | 0 (0.0%) | 59 (4.4%) |
| 35 to 64 Years | 280 (15.4%) | 122 (5.4%) |
| 65 to 74 Years | 109 (16.7%) | 193 (20.6%) |
| 75 Years and over | 181 (27.6%) | 273 (34.3%) |
Disability Class: Vision Difficulty
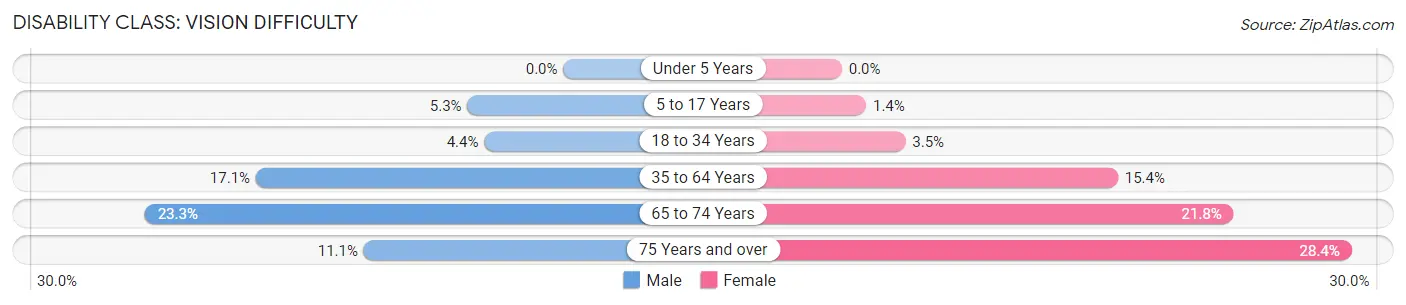
| Age Bracket | Male | Female |
| Under 5 Years | 0 (0.0%) | 0 (0.0%) |
| 5 to 17 Years | 42 (5.3%) | 9 (1.3%) |
| 18 to 34 Years | 37 (4.4%) | 47 (3.5%) |
| 35 to 64 Years | 311 (17.1%) | 349 (15.4%) |
| 65 to 74 Years | 152 (23.3%) | 204 (21.8%) |
| 75 Years and over | 73 (11.1%) | 226 (28.4%) |
Disability Class: Cognitive Difficulty
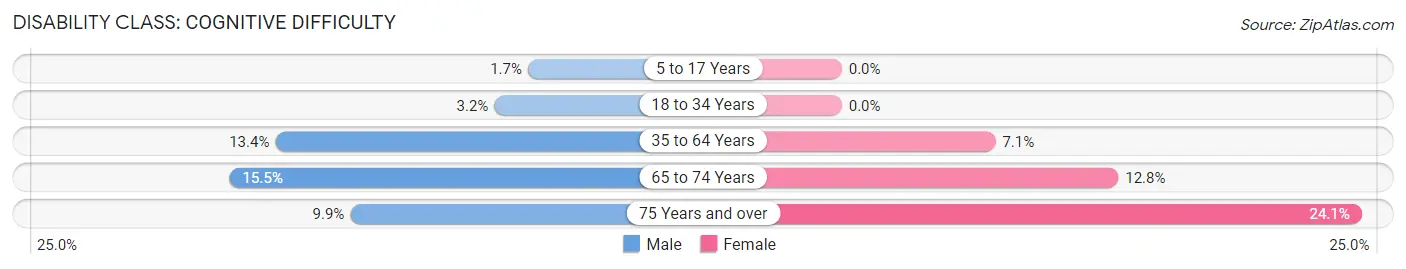
| Age Bracket | Male | Female |
| 5 to 17 Years | 13 (1.7%) | 0 (0.0%) |
| 18 to 34 Years | 27 (3.2%) | 0 (0.0%) |
| 35 to 64 Years | 243 (13.4%) | 162 (7.1%) |
| 65 to 74 Years | 101 (15.5%) | 120 (12.8%) |
| 75 Years and over | 65 (9.9%) | 192 (24.1%) |
Disability Class: Ambulatory Difficulty
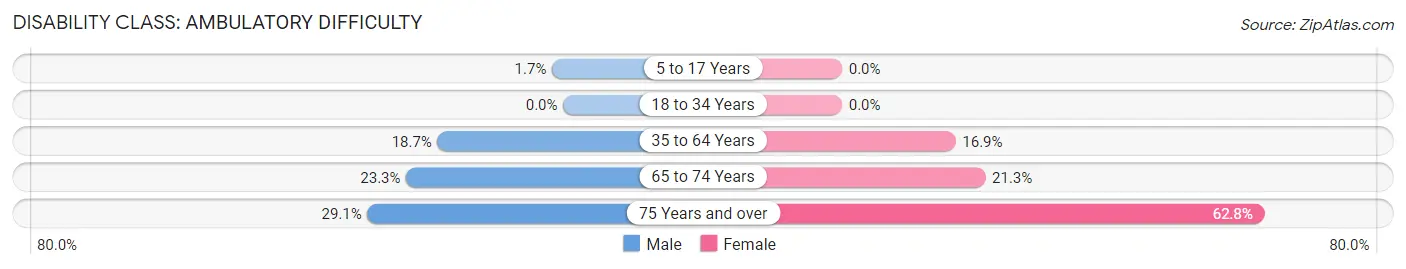
| Age Bracket | Male | Female |
| 5 to 17 Years | 13 (1.7%) | 0 (0.0%) |
| 18 to 34 Years | 0 (0.0%) | 0 (0.0%) |
| 35 to 64 Years | 339 (18.7%) | 383 (16.9%) |
| 65 to 74 Years | 152 (23.3%) | 199 (21.3%) |
| 75 Years and over | 191 (29.1%) | 500 (62.8%) |
Disability Class: Self-Care Difficulty
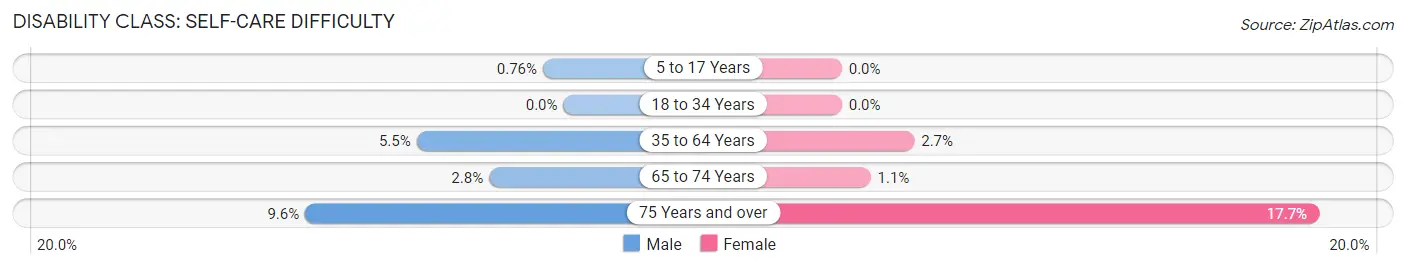
| Age Bracket | Male | Female |
| 5 to 17 Years | 6 (0.8%) | 0 (0.0%) |
| 18 to 34 Years | 0 (0.0%) | 0 (0.0%) |
| 35 to 64 Years | 99 (5.4%) | 61 (2.7%) |
| 65 to 74 Years | 18 (2.8%) | 10 (1.1%) |
| 75 Years and over | 63 (9.6%) | 141 (17.7%) |
Technology Access in Aguadilla
Computing Device Access in Aguadilla
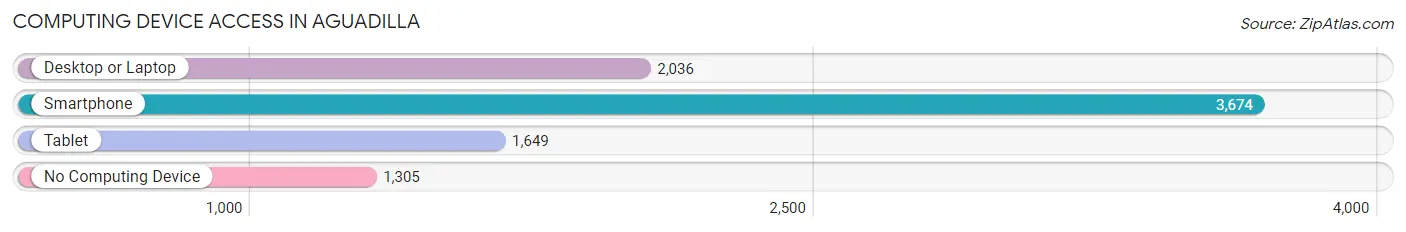
| Device Type | # Households | % Households |
| Desktop or Laptop | 2,036 | 38.6% |
| Smartphone | 3,674 | 69.7% |
| Tablet | 1,649 | 31.3% |
| No Computing Device | 1,305 | 24.7% |
| Total | 5,274 | 100.0% |
Internet Access in Aguadilla
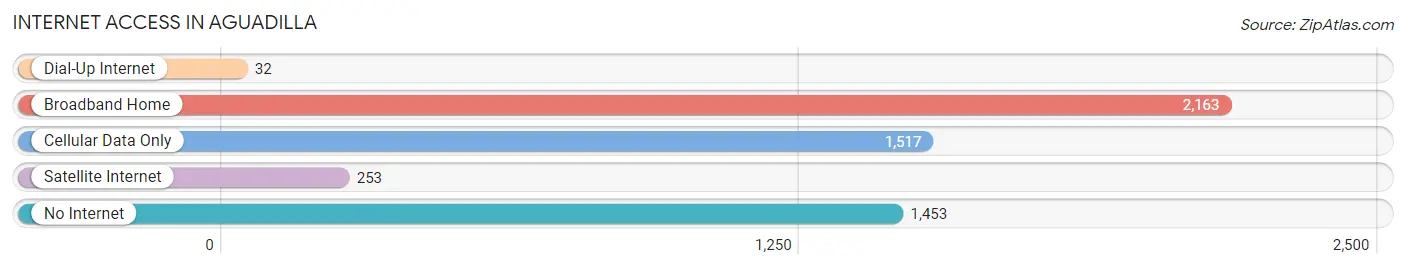
| Internet Type | # Households | % Households |
| Dial-Up Internet | 32 | 0.6% |
| Broadband Home | 2,163 | 41.0% |
| Cellular Data Only | 1,517 | 28.8% |
| Satellite Internet | 253 | 4.8% |
| No Internet | 1,453 | 27.6% |
| Total | 5,274 | 100.0% |
Aguadilla Summary
Aguadilla is a city located in the northwest corner of Puerto Rico, on the northern coast of the island. It is the second largest city in the region, after the capital city of San Juan. The city is known for its beautiful beaches, its vibrant culture, and its rich history.
History
Aguadilla was founded in 1775 by Don Juan de la Torre, a Spanish military officer. The city was originally named San Carlos de la Aguada, but was later changed to Aguadilla. The city was an important port during the Spanish colonial period, and was used to transport goods to and from the mainland. During the 19th century, the city was a major center for the production of sugar cane and coffee.
In 1898, Aguadilla was occupied by the United States during the Spanish-American War. The city was then annexed by the United States and became part of the newly formed Commonwealth of Puerto Rico. During the 20th century, the city experienced rapid growth and development, becoming an important center for tourism and commerce.
Geography
Aguadilla is located in the northwest corner of Puerto Rico, on the northern coast of the island. The city is bordered by the Atlantic Ocean to the north, the Caribbean Sea to the south, and the municipalities of Isabela and Moca to the east and west, respectively. The city covers an area of approximately 40 square miles and has a population of approximately 60,000 people.
The city is divided into two main sections: the urban area and the rural area. The urban area is located in the center of the city and is home to most of the city’s population. The rural area is located in the outskirts of the city and is home to many small farms and rural communities.
Economy
Aguadilla’s economy is largely based on tourism and services. The city is home to several resorts and hotels, as well as a variety of restaurants and bars. The city is also home to several manufacturing companies, including pharmaceuticals, electronics, and food processing.
The city is also home to several military installations, including the Rafael Hernandez Airport, the Aguadilla Coast Guard Station, and the Aguadilla Naval Air Station. These installations provide a significant boost to the local economy.
Demographics
As of the 2010 census, the population of Aguadilla was 60,851. The population is largely of Puerto Rican descent, with a small minority of other ethnicities. The city is predominantly Roman Catholic, with a small minority of other religious denominations.
The median household income in Aguadilla is $20,845, and the median age is 37. The city has a high rate of poverty, with approximately 28% of the population living below the poverty line.
Conclusion
Aguadilla is a vibrant city located in the northwest corner of Puerto Rico. The city is known for its beautiful beaches, its vibrant culture, and its rich history. The city’s economy is largely based on tourism and services, and the city is home to several military installations. The population of Aguadilla is largely of Puerto Rican descent, and the city has a high rate of poverty.
Common Questions
What is Per Capita Income in Aguadilla?
Per Capita income in Aguadilla is $10,947.
What is the Median Family Income in Aguadilla?
Median Family Income in Aguadilla is $16,224.
What is the Median Household income in Aguadilla?
Median Household Income in Aguadilla is $11,938.
What is Income or Wage Gap in Aguadilla?
Income or Wage Gap in Aguadilla is 17.1%.
Women in Aguadilla earn 82.9 cents for every dollar earned by a man.
What is Family Income Deficit in Aguadilla?
Family Income Deficit in Aguadilla is $13,087.
Families that are below poverty line in Aguadilla earn $13,087 less on average than the poverty threshold level.
What is Inequality or Gini Index in Aguadilla?
Inequality or Gini Index in Aguadilla is 0.63.
What is the Total Population of Aguadilla?
Total Population of Aguadilla is 11,383.
What is the Total Male Population of Aguadilla?
Total Male Population of Aguadilla is 4,980.
What is the Total Female Population of Aguadilla?
Total Female Population of Aguadilla is 6,403.
What is the Ratio of Males per 100 Females in Aguadilla?
There are 77.78 Males per 100 Females in Aguadilla.
What is the Ratio of Females per 100 Males in Aguadilla?
There are 128.57 Females per 100 Males in Aguadilla.
What is the Median Population Age in Aguadilla?
Median Population Age in Aguadilla is 46.9 Years.
What is the Average Family Size in Aguadilla
Average Family Size in Aguadilla is 2.8 People.
What is the Average Household Size in Aguadilla
Average Household Size in Aguadilla is 2.1 People.
How Large is the Labor Force in Aguadilla?
There are 3,120 People in the Labor Forcein in Aguadilla.
What is the Percentage of People in the Labor Force in Aguadilla?
32.5% of People are in the Labor Force in Aguadilla.
What is the Unemployment Rate in Aguadilla?
Unemployment Rate in Aguadilla is 25.9%.