Isabela, PR Map & Demographics
Isabela Map
Isabela Overview
$15,172
PER CAPITA INCOME
$26,875
AVG FAMILY INCOME
$18,616
AVG HOUSEHOLD INCOME
39.3%
WAGE / INCOME GAP [ % ]
60.7¢/ $1
WAGE / INCOME GAP [ $ ]
$10,958
FAMILY INCOME DEFICIT
0.54
INEQUALITY / GINI INDEX
10,110
TOTAL POPULATION
4,434
MALE POPULATION
5,676
FEMALE POPULATION
78.12
MALES / 100 FEMALES
128.01
FEMALES / 100 MALES
46.4
MEDIAN AGE
3.5
AVG FAMILY SIZE
2.6
AVG HOUSEHOLD SIZE
3,591
LABOR FORCE [ PEOPLE ]
39.4%
PERCENT IN LABOR FORCE
8.5%
UNEMPLOYMENT RATE
Isabela Zip Codes
Isabela Area Codes
Income in Isabela
Income Overview in Isabela
Per Capita Income in Isabela is $15,172, while median incomes of families and households are $26,875 and $18,616 respectively.
| Characteristic | Number | Measure |
| Per Capita Income | 10,110 | $15,172 |
| Median Family Income | 2,297 | $26,875 |
| Mean Family Income | 2,297 | $37,539 |
| Median Household Income | 3,801 | $18,616 |
| Mean Household Income | 3,801 | $30,346 |
| Income Deficit | 2,297 | $10,958 |
| Wage / Income Gap (%) | 10,110 | 39.26% |
| Wage / Income Gap ($) | 10,110 | 60.74¢ per $1 |
| Gini / Inequality Index | 10,110 | 0.54 |
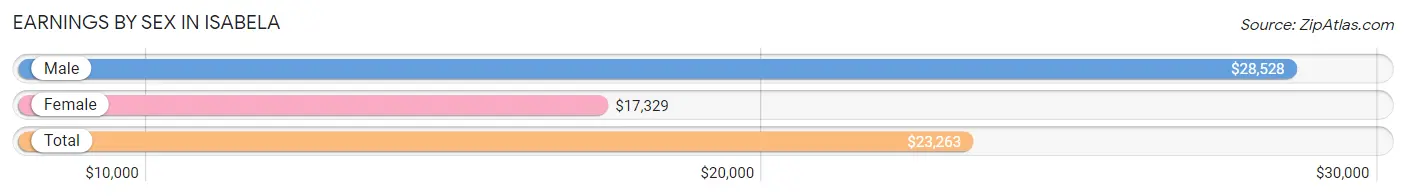
Earnings by Sex in Isabela
Average Earnings in Isabela are $23,263, $28,528 for men and $17,329 for women, a difference of 39.3%.
| Sex | Number | Average Earnings |
| Male | 1,826 (54.3%) | $28,528 |
| Female | 1,537 (45.7%) | $17,329 |
| Total | 3,363 (100.0%) | $23,263 |
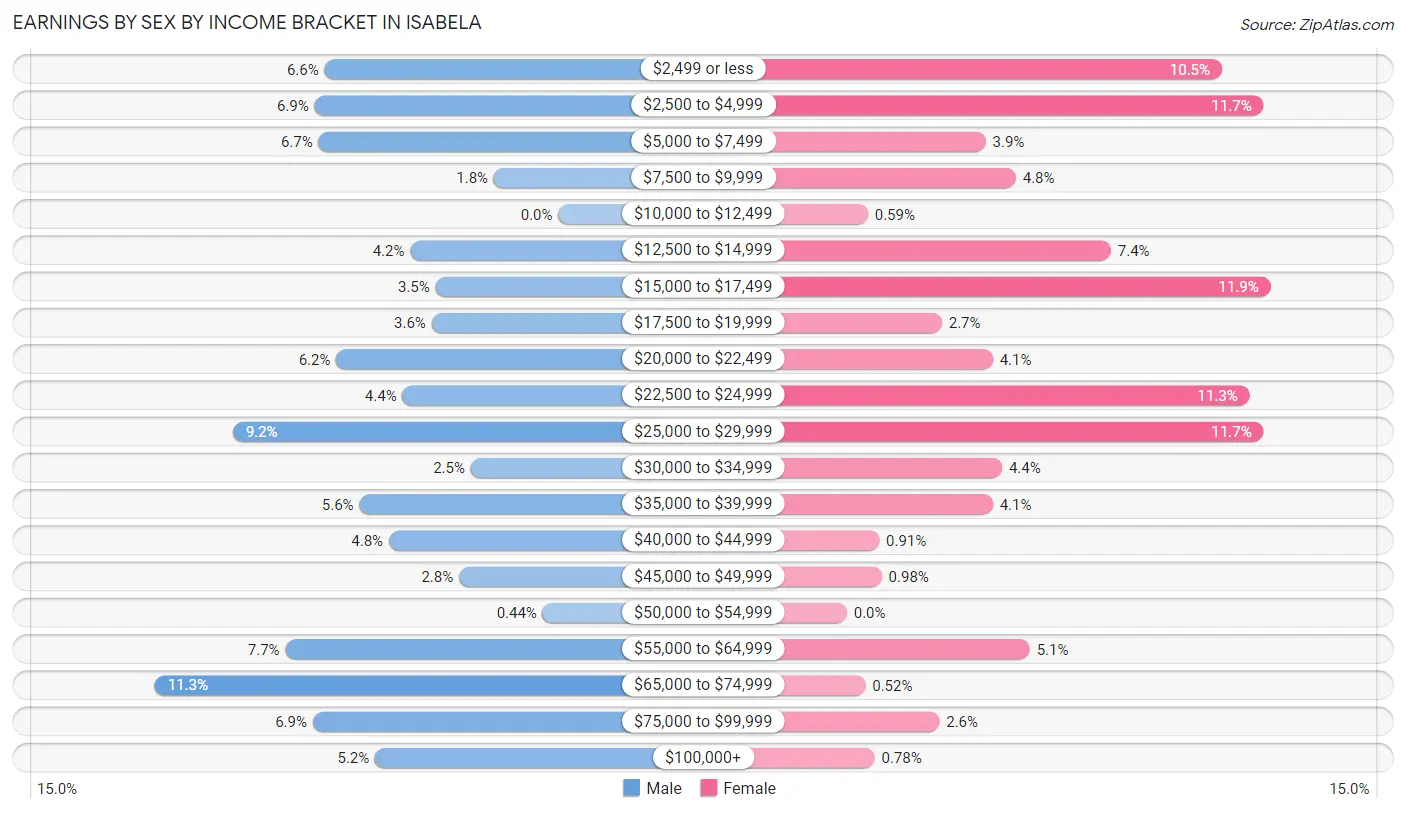
Earnings by Sex by Income Bracket in Isabela
The most common earnings brackets in Isabela are $65,000 to $74,999 for men (207 | 11.3%) and $15,000 to $17,499 for women (183 | 11.9%).
| Income | Male | Female |
| $2,499 or less | 120 (6.6%) | 162 (10.5%) |
| $2,500 to $4,999 | 125 (6.9%) | 180 (11.7%) |
| $5,000 to $7,499 | 123 (6.7%) | 60 (3.9%) |
| $7,500 to $9,999 | 33 (1.8%) | 73 (4.8%) |
| $10,000 to $12,499 | 0 (0.0%) | 9 (0.6%) |
| $12,500 to $14,999 | 76 (4.2%) | 114 (7.4%) |
| $15,000 to $17,499 | 63 (3.5%) | 183 (11.9%) |
| $17,500 to $19,999 | 65 (3.6%) | 41 (2.7%) |
| $20,000 to $22,499 | 114 (6.2%) | 63 (4.1%) |
| $22,500 to $24,999 | 80 (4.4%) | 174 (11.3%) |
| $25,000 to $29,999 | 167 (9.1%) | 180 (11.7%) |
| $30,000 to $34,999 | 45 (2.5%) | 67 (4.4%) |
| $35,000 to $39,999 | 102 (5.6%) | 63 (4.1%) |
| $40,000 to $44,999 | 87 (4.8%) | 14 (0.9%) |
| $45,000 to $49,999 | 51 (2.8%) | 15 (1.0%) |
| $50,000 to $54,999 | 8 (0.4%) | 0 (0.0%) |
| $55,000 to $64,999 | 140 (7.7%) | 79 (5.1%) |
| $65,000 to $74,999 | 207 (11.3%) | 8 (0.5%) |
| $75,000 to $99,999 | 126 (6.9%) | 40 (2.6%) |
| $100,000+ | 94 (5.1%) | 12 (0.8%) |
| Total | 1,826 (100.0%) | 1,537 (100.0%) |
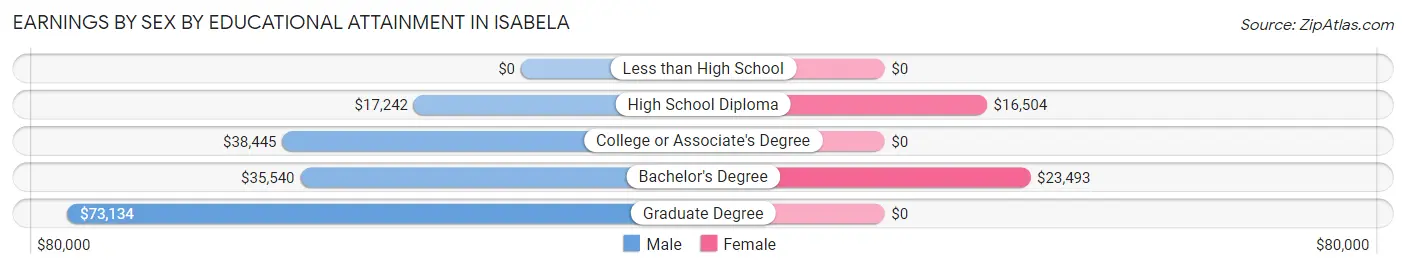
Earnings by Sex by Educational Attainment in Isabela
Average earnings in Isabela are $28,792 for men and $18,994 for women, a difference of 34.0%. Men with an educational attainment of graduate degree enjoy the highest average annual earnings of $73,134, while those with high school diploma education earn the least with $17,242. Women with an educational attainment of bachelor's degree earn the most with the average annual earnings of $23,493, while those with high school diploma education have the smallest earnings of $16,504.
| Educational Attainment | Male Income | Female Income |
| Less than High School | - | - |
| High School Diploma | $17,242 | $16,504 |
| College or Associate's Degree | $38,445 | $0 |
| Bachelor's Degree | $35,540 | $23,493 |
| Graduate Degree | $73,134 | $0 |
| Total | $28,792 | $18,994 |
Family Income in Isabela
Family Income Brackets in Isabela
According to the Isabela family income data, there are 551 families falling into the less than $10,000 income range, which is the most common income bracket and makes up 24.0% of all families. Conversely, the $200,000+ income bracket is the least frequent group with only 16 families (0.7%) belonging to this category.
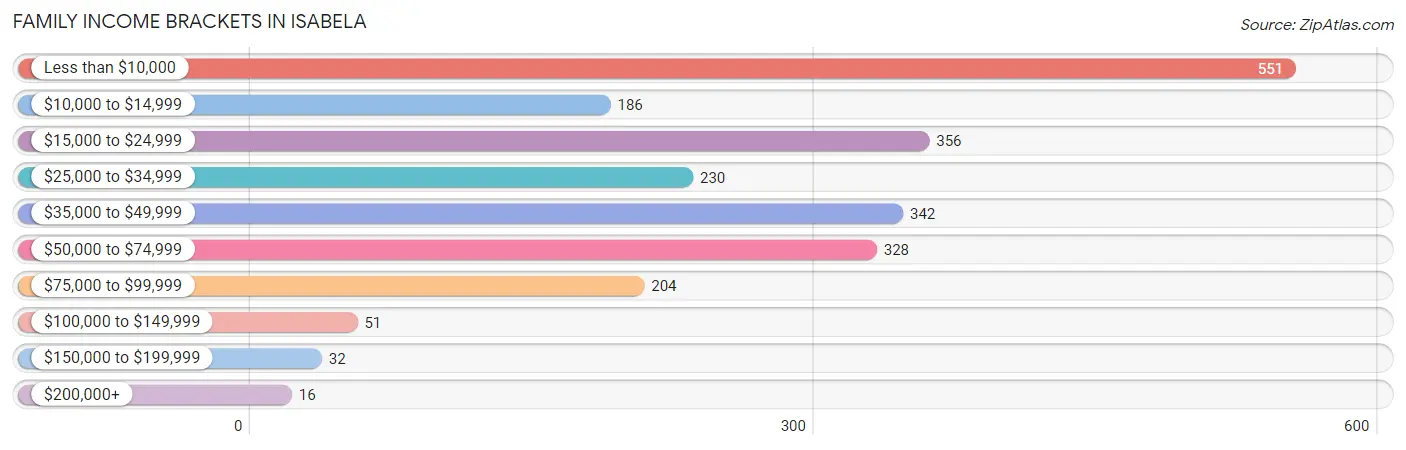
| Income Bracket | # Families | % Families |
| Less than $10,000 | 551 | 24.0% |
| $10,000 to $14,999 | 186 | 8.1% |
| $15,000 to $24,999 | 356 | 15.5% |
| $25,000 to $34,999 | 230 | 10.0% |
| $35,000 to $49,999 | 342 | 14.9% |
| $50,000 to $74,999 | 328 | 14.3% |
| $75,000 to $99,999 | 204 | 8.9% |
| $100,000 to $149,999 | 51 | 2.2% |
| $150,000 to $199,999 | 32 | 1.4% |
| $200,000+ | 16 | 0.7% |
Family Income by Famaliy Size in Isabela
5-person families (107 | 4.7%) account for the highest median family income in Isabela with $68,750 per family, while 5-person families (107 | 4.7%) have the highest median income of $13,750 per family member.
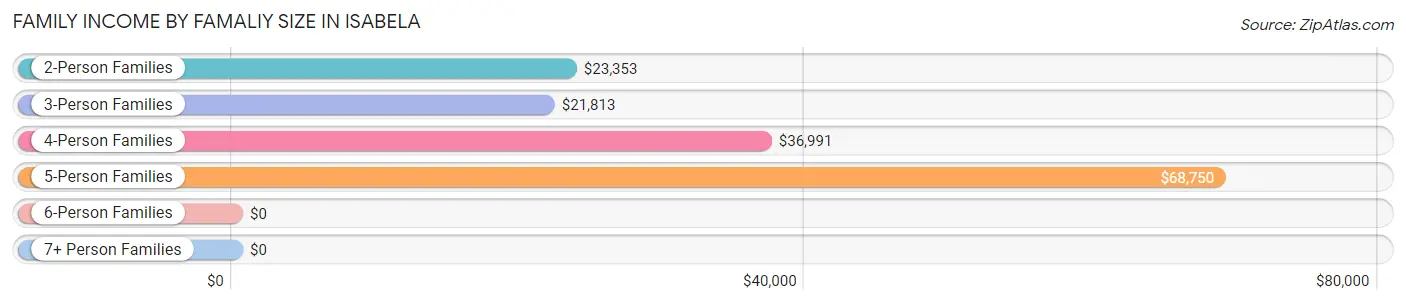
| Income Bracket | # Families | Median Income |
| 2-Person Families | 1,477 (64.3%) | $23,353 |
| 3-Person Families | 476 (20.7%) | $21,813 |
| 4-Person Families | 237 (10.3%) | $36,991 |
| 5-Person Families | 107 (4.7%) | $68,750 |
| 6-Person Families | 0 (0.0%) | $0 |
| 7+ Person Families | 0 (0.0%) | $0 |
| Total | 2,297 (100.0%) | $26,875 |
Family Income by Number of Earners in Isabela
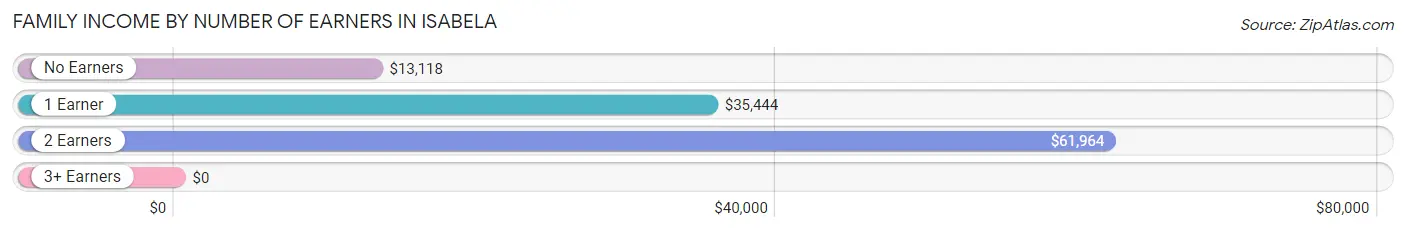
| Number of Earners | # Families | Median Income |
| No Earners | 1,037 (45.2%) | $13,118 |
| 1 Earner | 747 (32.5%) | $35,444 |
| 2 Earners | 494 (21.5%) | $61,964 |
| 3+ Earners | 19 (0.8%) | $0 |
| Total | 2,297 (100.0%) | $26,875 |
Household Income in Isabela
Household Income Brackets in Isabela
With 1,049 households falling in the category, the less than $10,000 income range is the most frequent in Isabela, accounting for 27.6% of all households. In contrast, only 15 households (0.4%) fall into the $200,000+ income bracket, making it the least populous group.
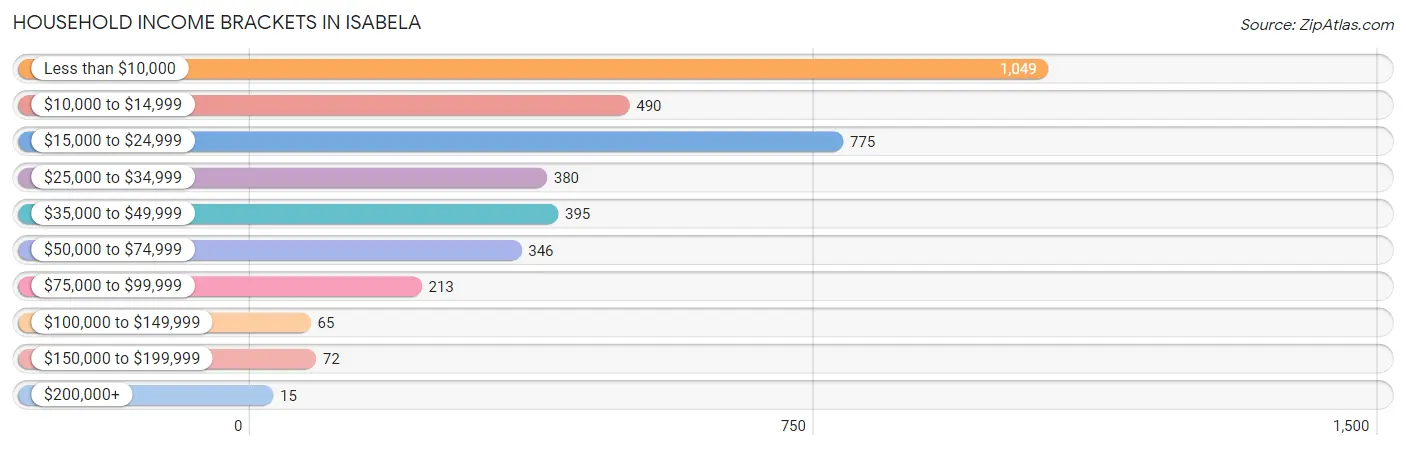
| Income Bracket | # Households | % Households |
| Less than $10,000 | 1,049 | 27.6% |
| $10,000 to $14,999 | 490 | 12.9% |
| $15,000 to $24,999 | 775 | 20.4% |
| $25,000 to $34,999 | 380 | 10.0% |
| $35,000 to $49,999 | 395 | 10.4% |
| $50,000 to $74,999 | 346 | 9.1% |
| $75,000 to $99,999 | 213 | 5.6% |
| $100,000 to $149,999 | 65 | 1.7% |
| $150,000 to $199,999 | 72 | 1.9% |
| $200,000+ | 15 | 0.4% |
Household Income by Householder Age in Isabela
The median household income in Isabela is $18,616, with the highest median household income of $25,708 found in the 25 to 44 years age bracket for the primary householder. A total of 862 households (22.7%) fall into this category. Meanwhile, the 15 to 24 years age bracket for the primary householder has the lowest median household income of $0, with 24 households (0.6%) in this group.
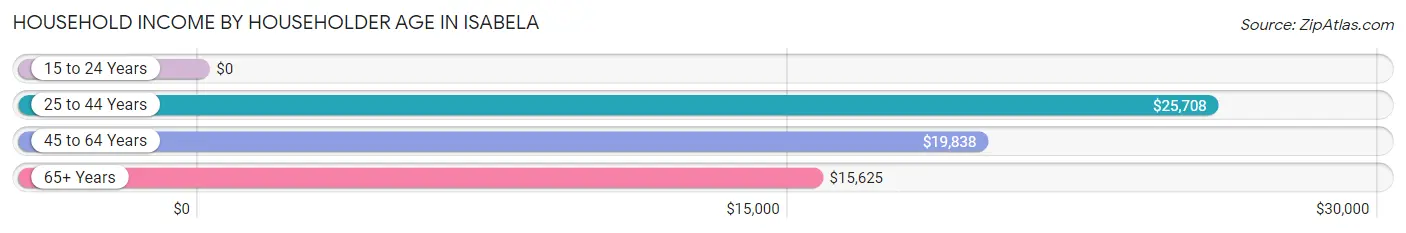
| Income Bracket | # Households | Median Income |
| 15 to 24 Years | 24 (0.6%) | $0 |
| 25 to 44 Years | 862 (22.7%) | $25,708 |
| 45 to 64 Years | 1,705 (44.9%) | $19,838 |
| 65+ Years | 1,210 (31.8%) | $15,625 |
| Total | 3,801 (100.0%) | $18,616 |
Poverty in Isabela
Income Below Poverty by Sex and Age in Isabela
With 42.4% poverty level for males and 45.5% for females among the residents of Isabela, under 5 year old males and 75 year old and over females are the most vulnerable to poverty, with 37 males (100.0%) and 412 females (65.9%) in their respective age groups living below the poverty level.
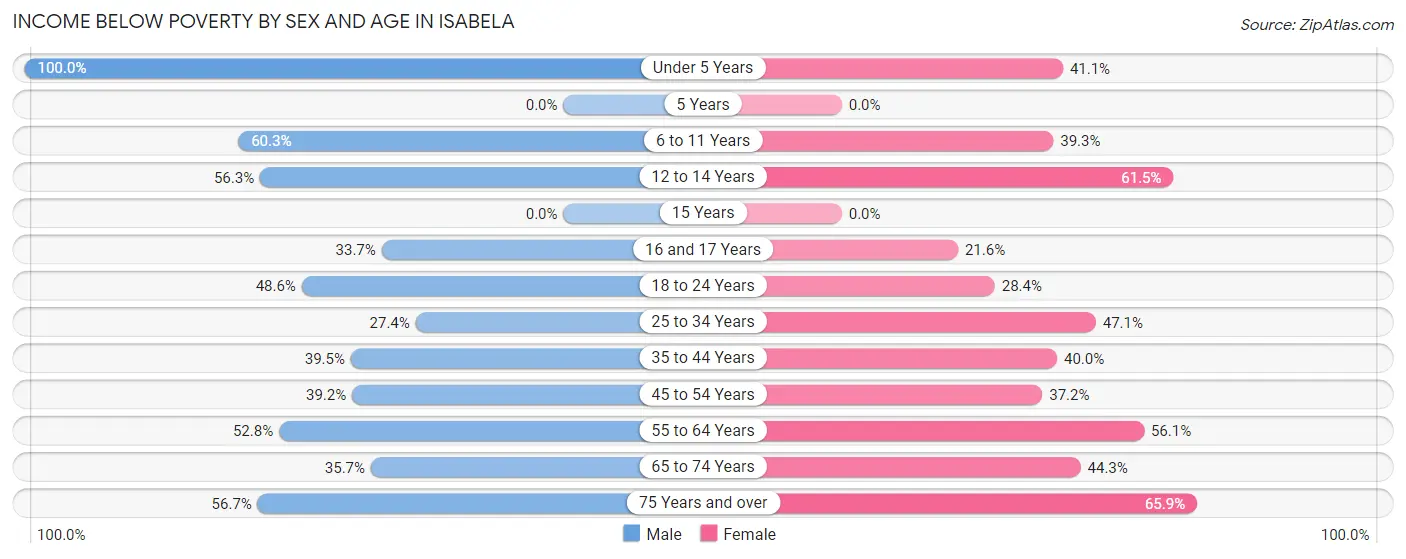
| Age Bracket | Male | Female |
| Under 5 Years | 37 (100.0%) | 149 (41.0%) |
| 5 Years | 0 (0.0%) | 0 (0.0%) |
| 6 to 11 Years | 70 (60.3%) | 128 (39.3%) |
| 12 to 14 Years | 58 (56.3%) | 32 (61.5%) |
| 15 Years | 0 (0.0%) | 0 (0.0%) |
| 16 and 17 Years | 28 (33.7%) | 44 (21.6%) |
| 18 to 24 Years | 221 (48.6%) | 119 (28.4%) |
| 25 to 34 Years | 232 (27.4%) | 322 (47.1%) |
| 35 to 44 Years | 234 (39.5%) | 227 (40.0%) |
| 45 to 54 Years | 251 (39.2%) | 269 (37.2%) |
| 55 to 64 Years | 342 (52.8%) | 580 (56.1%) |
| 65 to 74 Years | 179 (35.7%) | 289 (44.3%) |
| 75 Years and over | 219 (56.7%) | 412 (65.9%) |
| Total | 1,871 (42.4%) | 2,571 (45.5%) |
Income Above Poverty by Sex and Age in Isabela
According to the poverty statistics in Isabela, males aged 25 to 34 years and females aged 16 and 17 years are the age groups that are most secure financially, with 72.6% of males and 78.4% of females in these age groups living above the poverty line.
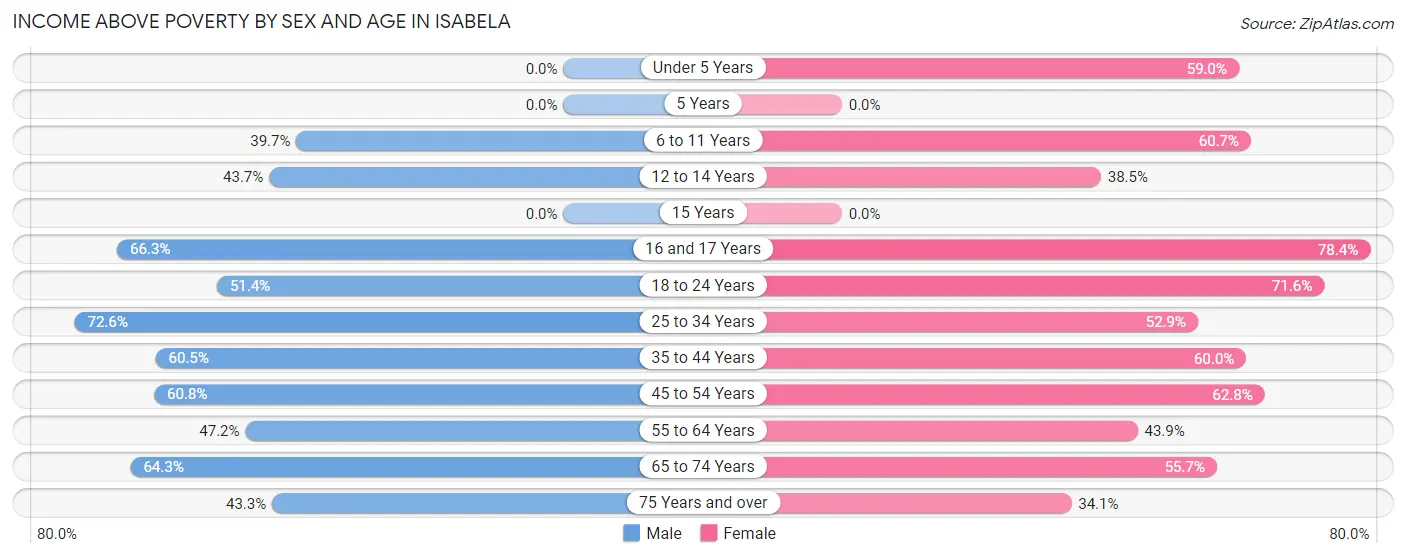
| Age Bracket | Male | Female |
| Under 5 Years | 0 (0.0%) | 214 (59.0%) |
| 5 Years | 0 (0.0%) | 0 (0.0%) |
| 6 to 11 Years | 46 (39.7%) | 198 (60.7%) |
| 12 to 14 Years | 45 (43.7%) | 20 (38.5%) |
| 15 Years | 0 (0.0%) | 0 (0.0%) |
| 16 and 17 Years | 55 (66.3%) | 160 (78.4%) |
| 18 to 24 Years | 234 (51.4%) | 300 (71.6%) |
| 25 to 34 Years | 614 (72.6%) | 361 (52.9%) |
| 35 to 44 Years | 359 (60.5%) | 341 (60.0%) |
| 45 to 54 Years | 389 (60.8%) | 454 (62.8%) |
| 55 to 64 Years | 306 (47.2%) | 454 (43.9%) |
| 65 to 74 Years | 322 (64.3%) | 363 (55.7%) |
| 75 Years and over | 167 (43.3%) | 213 (34.1%) |
| Total | 2,537 (57.6%) | 3,078 (54.5%) |
Income Below Poverty Among Married-Couple Families in Isabela
The poverty statistics for married-couple families in Isabela show that 31.2% or 372 of the total 1,191 families live below the poverty line. Families with no children have the highest poverty rate of 33.4%, comprising of 295 families. On the other hand, families with 3 or 4 children have the lowest poverty rate of 0.0%, which includes 0 families.
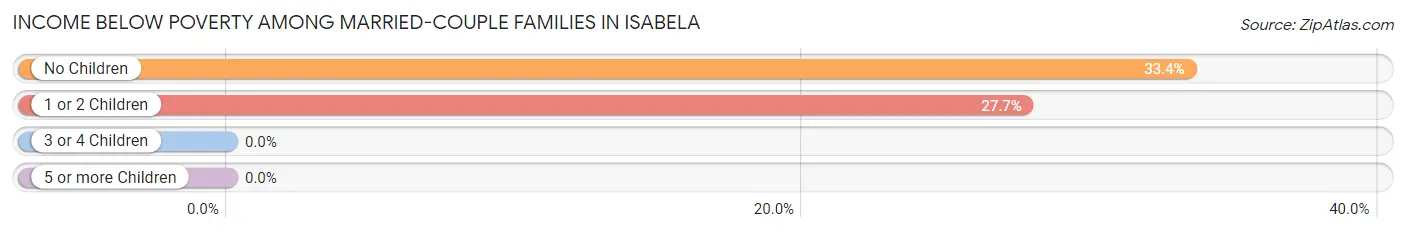
| Children | Above Poverty | Below Poverty |
| No Children | 589 (66.6%) | 295 (33.4%) |
| 1 or 2 Children | 201 (72.3%) | 77 (27.7%) |
| 3 or 4 Children | 29 (100.0%) | 0 (0.0%) |
| 5 or more Children | 0 (0.0%) | 0 (0.0%) |
| Total | 819 (68.8%) | 372 (31.2%) |
Income Below Poverty Among Single-Parent Households in Isabela
According to the poverty data in Isabela, 45.1% or 105 single-father households and 55.6% or 485 single-mother households are living below the poverty line. Among single-father households, those with 1 or 2 children have the highest poverty rate, with 38 households (64.4%) experiencing poverty. Likewise, among single-mother households, those with no children have the highest poverty rate, with 335 households (57.2%) falling below the poverty line.
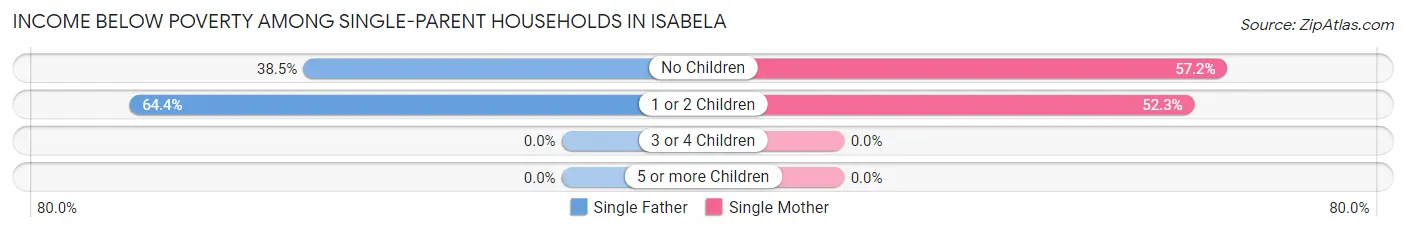
| Children | Single Father | Single Mother |
| No Children | 67 (38.5%) | 335 (57.2%) |
| 1 or 2 Children | 38 (64.4%) | 150 (52.3%) |
| 3 or 4 Children | 0 (0.0%) | 0 (0.0%) |
| 5 or more Children | 0 (0.0%) | 0 (0.0%) |
| Total | 105 (45.1%) | 485 (55.6%) |
Income Below Poverty Among Married-Couple vs Single-Parent Households in Isabela
The poverty data for Isabela shows that 372 of the married-couple family households (31.2%) and 590 of the single-parent households (53.3%) are living below the poverty level. Within the married-couple family households, those with no children have the highest poverty rate, with 295 households (33.4%) falling below the poverty line. Among the single-parent households, those with 1 or 2 children have the highest poverty rate, with 188 household (54.3%) living below poverty.
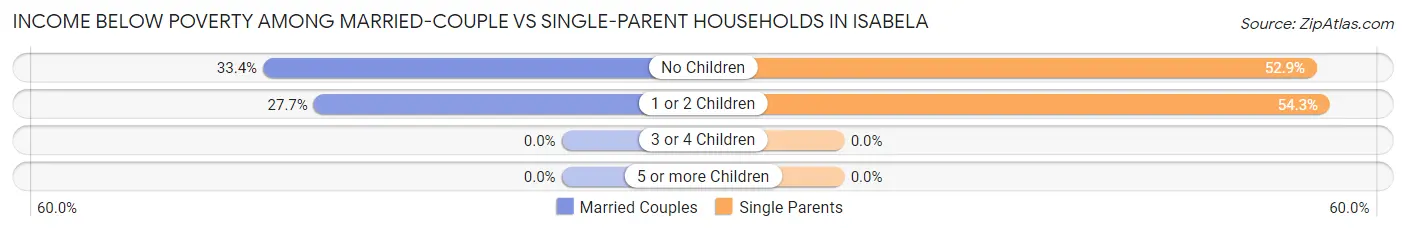
| Children | Married-Couple Families | Single-Parent Households |
| No Children | 295 (33.4%) | 402 (52.9%) |
| 1 or 2 Children | 77 (27.7%) | 188 (54.3%) |
| 3 or 4 Children | 0 (0.0%) | 0 (0.0%) |
| 5 or more Children | 0 (0.0%) | 0 (0.0%) |
| Total | 372 (31.2%) | 590 (53.3%) |
Race in Isabela
The most populous races in Isabela are Hispanic or Latino (9,819 | 97.1%), White / Caucasian (5,689 | 56.3%), and Some other Race (2,285 | 22.6%).
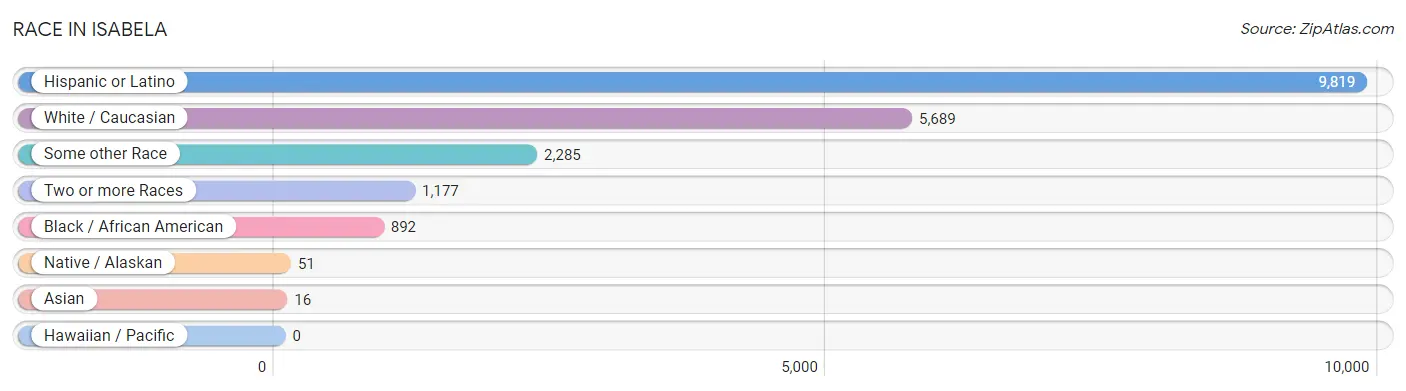
| Race | # Population | % Population |
| Asian | 16 | 0.2% |
| Black / African American | 892 | 8.8% |
| Hawaiian / Pacific | 0 | 0.0% |
| Hispanic or Latino | 9,819 | 97.1% |
| Native / Alaskan | 51 | 0.5% |
| White / Caucasian | 5,689 | 56.3% |
| Two or more Races | 1,177 | 11.6% |
| Some other Race | 2,285 | 22.6% |
| Total | 10,110 | 100.0% |
Ancestry in Isabela
The most populous ancestries reported in Isabela are Puerto Rican (9,739 | 96.3%), American (434 | 4.3%), Paraguayan (35 | 0.4%), South American (35 | 0.4%), and West Indian (32 | 0.3%), together accounting for 101.6% of all Isabela residents.
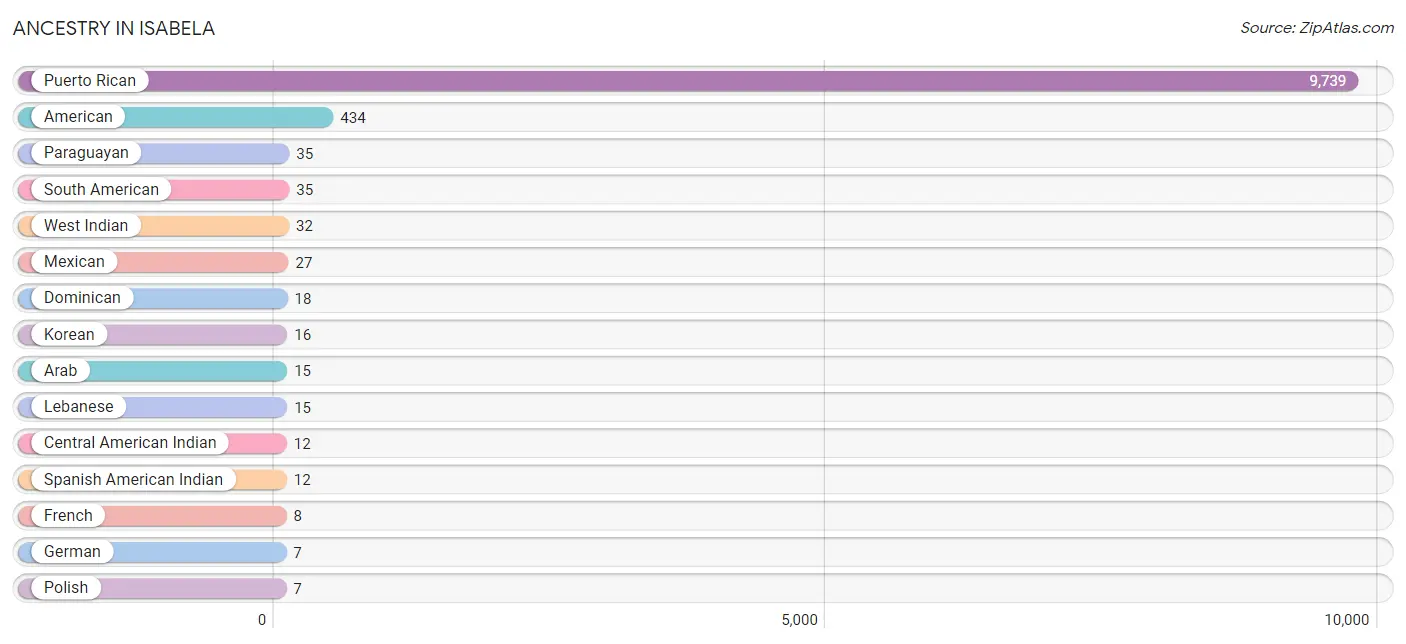
| Ancestry | # Population | % Population |
| American | 434 | 4.3% |
| Arab | 15 | 0.2% |
| Central American Indian | 12 | 0.1% |
| Dominican | 18 | 0.2% |
| French | 8 | 0.1% |
| German | 7 | 0.1% |
| Korean | 16 | 0.2% |
| Lebanese | 15 | 0.2% |
| Mexican | 27 | 0.3% |
| Paraguayan | 35 | 0.4% |
| Polish | 7 | 0.1% |
| Puerto Rican | 9,739 | 96.3% |
| South American | 35 | 0.4% |
| Spanish American Indian | 12 | 0.1% |
| West Indian | 32 | 0.3% | View All 15 Rows |
Immigrants in Isabela

| Immigration Origin | # Population | % Population | View All 0 Rows |
Sex and Age in Isabela
Sex and Age in Isabela
The most populous age groups in Isabela are 25 to 29 Years (523 | 11.8%) for men and 60 to 64 Years (575 | 10.1%) for women.
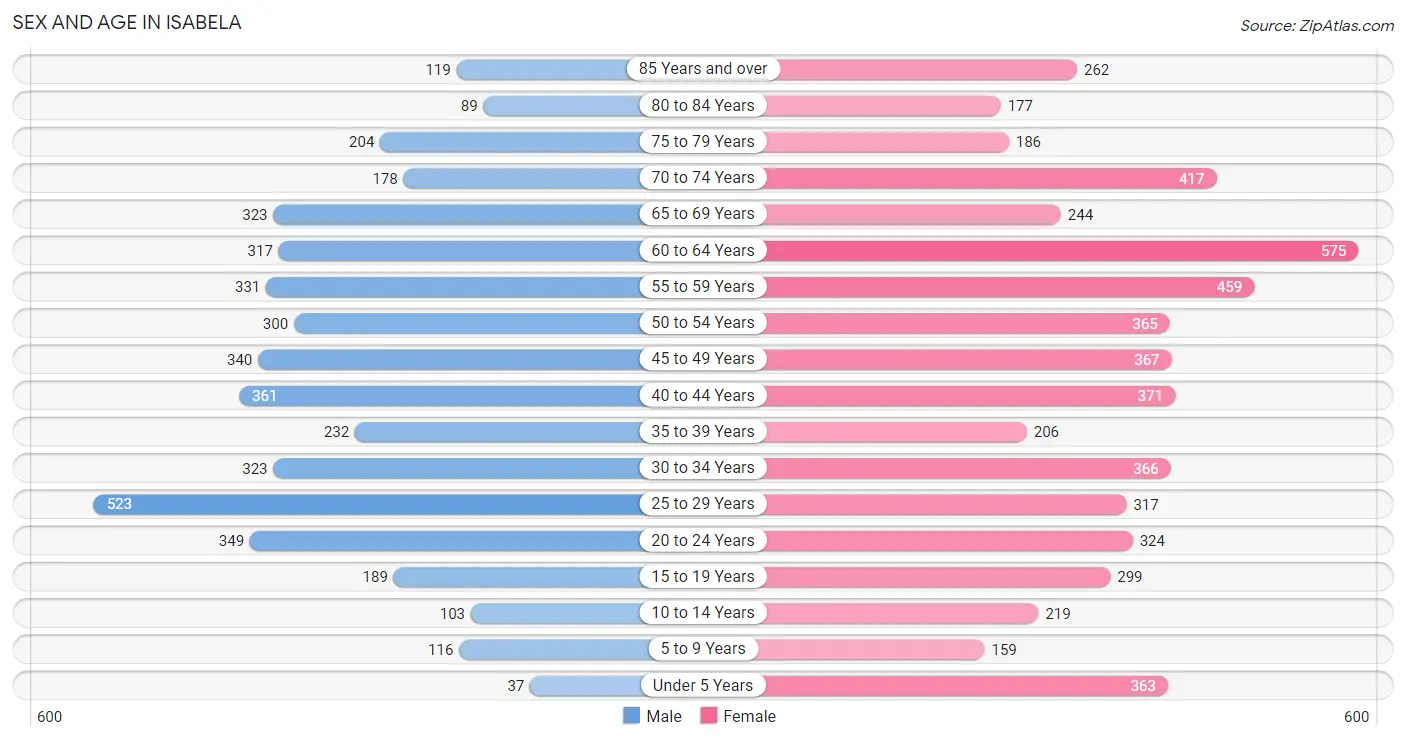
| Age Bracket | Male | Female |
| Under 5 Years | 37 (0.8%) | 363 (6.4%) |
| 5 to 9 Years | 116 (2.6%) | 159 (2.8%) |
| 10 to 14 Years | 103 (2.3%) | 219 (3.9%) |
| 15 to 19 Years | 189 (4.3%) | 299 (5.3%) |
| 20 to 24 Years | 349 (7.9%) | 324 (5.7%) |
| 25 to 29 Years | 523 (11.8%) | 317 (5.6%) |
| 30 to 34 Years | 323 (7.3%) | 366 (6.5%) |
| 35 to 39 Years | 232 (5.2%) | 206 (3.6%) |
| 40 to 44 Years | 361 (8.1%) | 371 (6.5%) |
| 45 to 49 Years | 340 (7.7%) | 367 (6.5%) |
| 50 to 54 Years | 300 (6.8%) | 365 (6.4%) |
| 55 to 59 Years | 331 (7.5%) | 459 (8.1%) |
| 60 to 64 Years | 317 (7.1%) | 575 (10.1%) |
| 65 to 69 Years | 323 (7.3%) | 244 (4.3%) |
| 70 to 74 Years | 178 (4.0%) | 417 (7.3%) |
| 75 to 79 Years | 204 (4.6%) | 186 (3.3%) |
| 80 to 84 Years | 89 (2.0%) | 177 (3.1%) |
| 85 Years and over | 119 (2.7%) | 262 (4.6%) |
| Total | 4,434 (100.0%) | 5,676 (100.0%) |
Families and Households in Isabela
Median Family Size in Isabela
The median family size in Isabela is 3.49 persons per family, with single male/father families (233 | 10.1%) accounting for the largest median family size of 4.68 persons per family. On the other hand, married-couple families (1,191 | 51.8%) represent the smallest median family size with 3.30 persons per family.
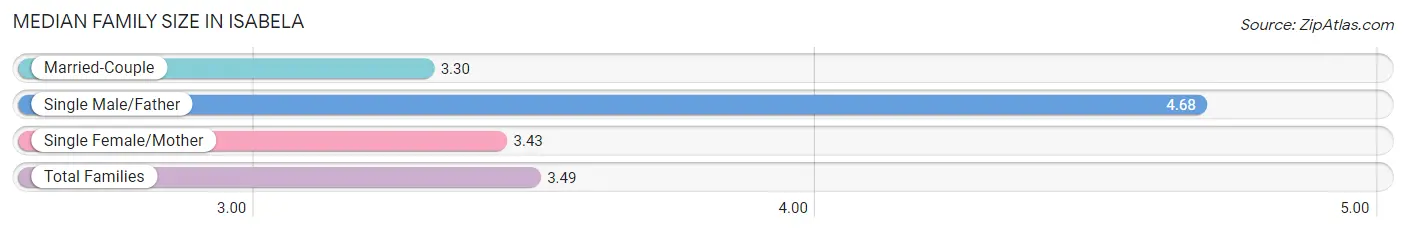
| Family Type | # Families | Family Size |
| Married-Couple | 1,191 (51.8%) | 3.30 |
| Single Male/Father | 233 (10.1%) | 4.68 |
| Single Female/Mother | 873 (38.0%) | 3.43 |
| Total Families | 2,297 (100.0%) | 3.49 |
Median Household Size in Isabela
The median household size in Isabela is 2.64 persons per household, with single male/father households (233 | 6.1%) accounting for the largest median household size of 4.98 persons per household. non-family households (1,504 | 39.6%) represent the smallest median household size with 1.13 persons per household.
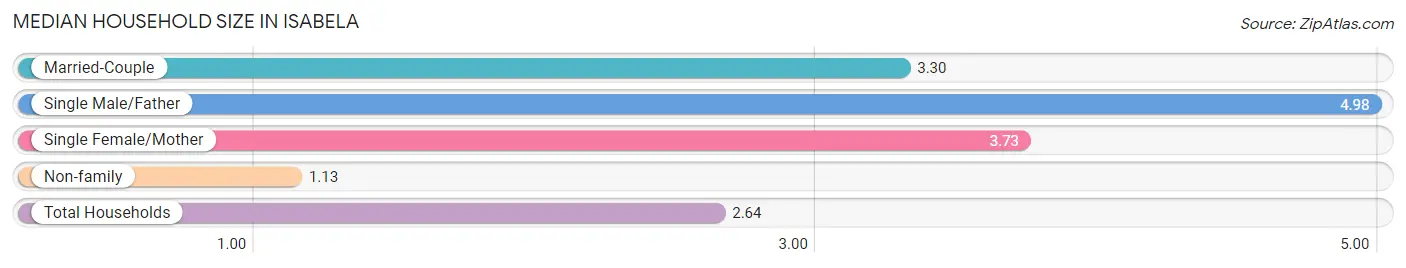
| Household Type | # Households | Household Size |
| Married-Couple | 1,191 (31.3%) | 3.30 |
| Single Male/Father | 233 (6.1%) | 4.98 |
| Single Female/Mother | 873 (23.0%) | 3.73 |
| Non-family | 1,504 (39.6%) | 1.13 |
| Total Households | 3,801 (100.0%) | 2.64 |
Household Size by Marriage Status in Isabela
Out of a total of 3,801 households in Isabela, 2,297 (60.4%) are family households, while 1,504 (39.6%) are nonfamily households. The most numerous type of family households are 2-person households, comprising 1,315, and the most common type of nonfamily households are 1-person households, comprising 1,382.
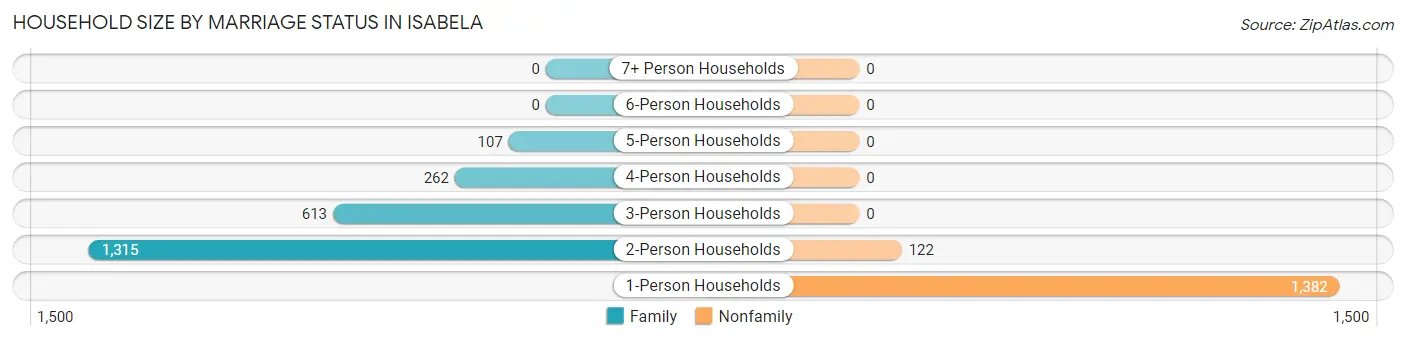
| Household Size | Family Households | Nonfamily Households |
| 1-Person Households | - | 1,382 (36.4%) |
| 2-Person Households | 1,315 (34.6%) | 122 (3.2%) |
| 3-Person Households | 613 (16.1%) | 0 (0.0%) |
| 4-Person Households | 262 (6.9%) | 0 (0.0%) |
| 5-Person Households | 107 (2.8%) | 0 (0.0%) |
| 6-Person Households | 0 (0.0%) | 0 (0.0%) |
| 7+ Person Households | 0 (0.0%) | 0 (0.0%) |
| Total | 2,297 (60.4%) | 1,504 (39.6%) |
Female Fertility in Isabela
Fertility by Age in Isabela
Average fertility rate in Isabela is 55.0 births per 1,000 women. Women in the age bracket of 20 to 34 years have the highest fertility rate with 127.0 births per 1,000 women. Women in the age bracket of 20 to 34 years acount for 100.0% of all women with births.
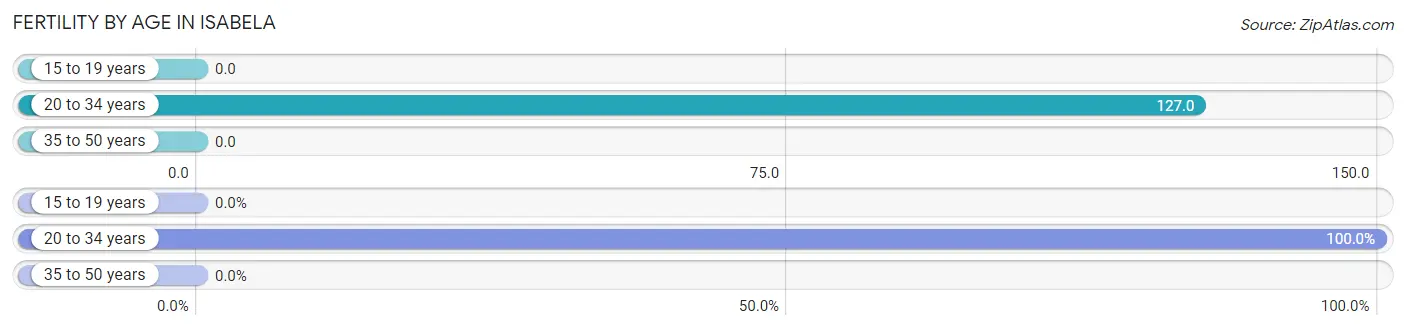
| Age Bracket | Women with Births | Births / 1,000 Women |
| 15 to 19 years | 0 (0.0%) | 0.0 |
| 20 to 34 years | 128 (100.0%) | 127.0 |
| 35 to 50 years | 0 (0.0%) | 0.0 |
| Total | 128 (100.0%) | 55.0 |
Fertility by Age by Marriage Status in Isabela
71.9% of women with births (128) in Isabela are married. The highest percentage of unmarried women with births falls into 20 to 34 years age bracket with 28.1% of them unmarried at the time of birth, while the lowest percentage of unmarried women with births belong to 20 to 34 years age bracket with 28.1% of them unmarried.
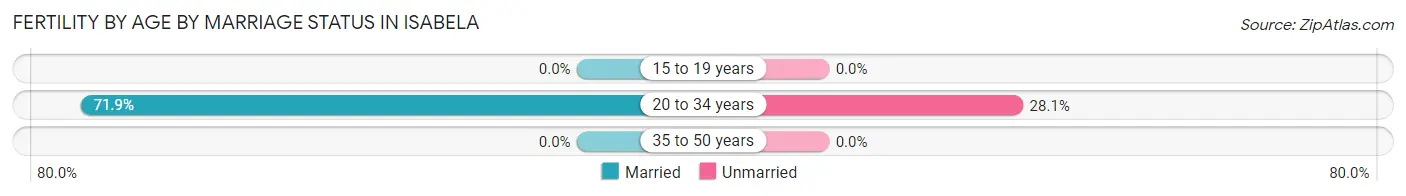
| Age Bracket | Married | Unmarried |
| 15 to 19 years | 0 (0.0%) | 0 (0.0%) |
| 20 to 34 years | 92 (71.9%) | 36 (28.1%) |
| 35 to 50 years | 0 (0.0%) | 0 (0.0%) |
| Total | 92 (71.9%) | 36 (28.1%) |
Fertility by Education in Isabela
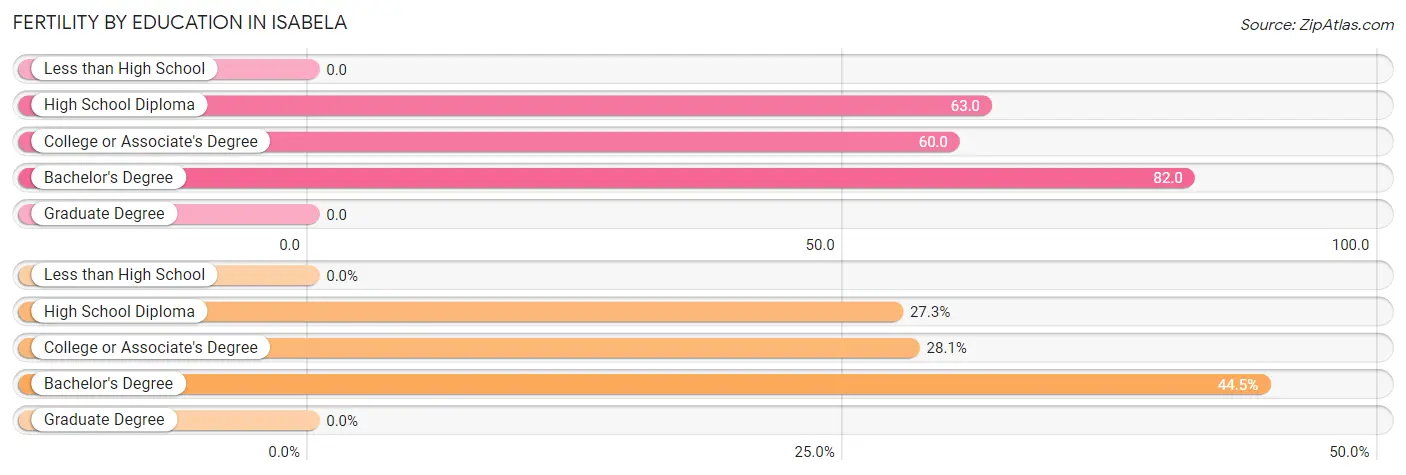
| Educational Attainment | Women with Births | Births / 1,000 Women |
| Less than High School | 0 (0.0%) | 0.0 |
| High School Diploma | 35 (27.3%) | 63.0 |
| College or Associate's Degree | 36 (28.1%) | 60.0 |
| Bachelor's Degree | 57 (44.5%) | 82.0 |
| Graduate Degree | 0 (0.0%) | 0.0 |
| Total | 128 (100.0%) | 55.0 |
Fertility by Education by Marriage Status in Isabela
28.1% of women with births in Isabela are unmarried. Women with the educational attainment of high school diploma are most likely to be married with 100.0% of them married at childbirth, while women with the educational attainment of college or associate's degree are least likely to be married with 100.0% of them unmarried at childbirth.
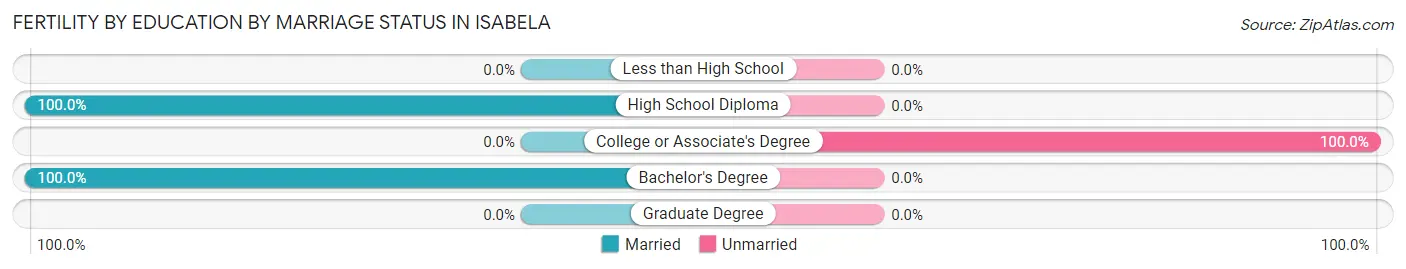
| Educational Attainment | Married | Unmarried |
| Less than High School | 0 (0.0%) | 0 (0.0%) |
| High School Diploma | 35 (100.0%) | 0 (0.0%) |
| College or Associate's Degree | 0 (0.0%) | 36 (100.0%) |
| Bachelor's Degree | 57 (100.0%) | 0 (0.0%) |
| Graduate Degree | 0 (0.0%) | 0 (0.0%) |
| Total | 92 (71.9%) | 36 (28.1%) |
Employment Characteristics in Isabela
Employment by Class of Employer in Isabela
Among the 3,206 employed individuals in Isabela, private company employees (1,996 | 62.3%), self-employed (not incorporated) (571 | 17.8%), and state government employees (255 | 8.0%) make up the most common classes of employment.
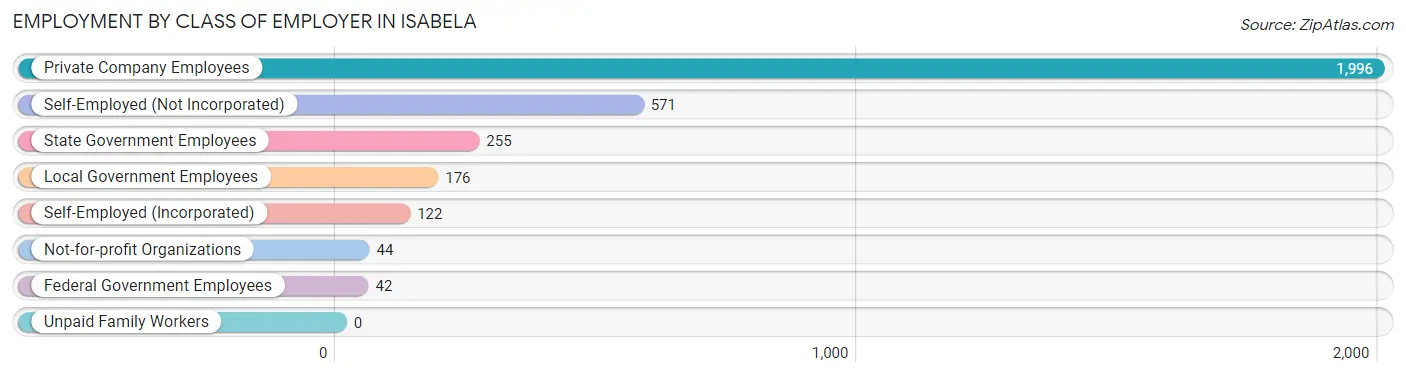
| Employer Class | # Employees | % Employees |
| Private Company Employees | 1,996 | 62.3% |
| Self-Employed (Incorporated) | 122 | 3.8% |
| Self-Employed (Not Incorporated) | 571 | 17.8% |
| Not-for-profit Organizations | 44 | 1.4% |
| Local Government Employees | 176 | 5.5% |
| State Government Employees | 255 | 8.0% |
| Federal Government Employees | 42 | 1.3% |
| Unpaid Family Workers | 0 | 0.0% |
| Total | 3,206 | 100.0% |
Employment Status by Age in Isabela
According to the labor force statistics for Isabela, out of the total population over 16 years of age (9,113), 39.4% or 3,591 individuals are in the labor force, with 8.5% or 305 of them unemployed. The age group with the highest labor force participation rate is 30 to 34 years, with 79.1% or 545 individuals in the labor force. Within the labor force, the 20 to 24 years age range has the highest percentage of unemployed individuals, with 47.7% or 115 of them being unemployed.
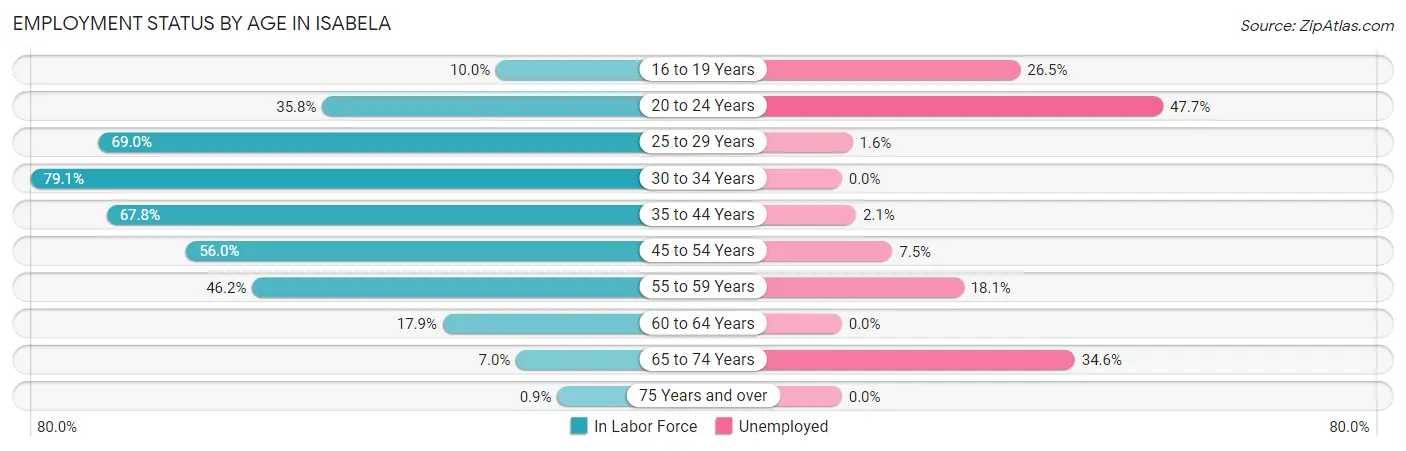
| Age Bracket | In Labor Force | Unemployed |
| 16 to 19 Years | 49 (10.0%) | 13 (26.5%) |
| 20 to 24 Years | 241 (35.8%) | 115 (47.7%) |
| 25 to 29 Years | 580 (69.0%) | 9 (1.6%) |
| 30 to 34 Years | 545 (79.1%) | 0 (0.0%) |
| 35 to 44 Years | 793 (67.8%) | 17 (2.1%) |
| 45 to 54 Years | 768 (56.0%) | 58 (7.5%) |
| 55 to 59 Years | 365 (46.2%) | 66 (18.1%) |
| 60 to 64 Years | 160 (17.9%) | 0 (0.0%) |
| 65 to 74 Years | 81 (7.0%) | 28 (34.6%) |
| 75 Years and over | 9 (0.9%) | 0 (0.0%) |
| Total | 3,591 (39.4%) | 305 (8.5%) |
Employment Status by Educational Attainment in Isabela
According to labor force statistics for Isabela, 55.8% of individuals (3,210) out of the total population between 25 and 64 years of age (5,753) are in the labor force, with 4.6% or 148 of them being unemployed. The group with the highest labor force participation rate are those with the educational attainment of bachelor's degree or higher, with 80.8% or 1,540 individuals in the labor force. Within the labor force, individuals with college / associate degree education have the highest percentage of unemployment, with 10.1% or 67 of them being unemployed.
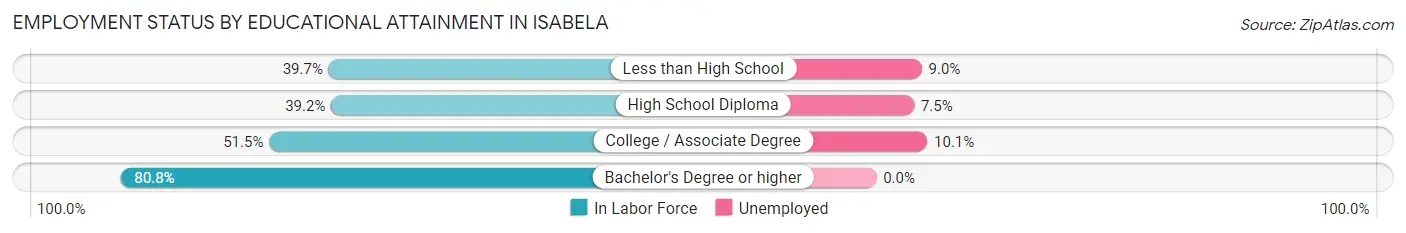
| Educational Attainment | In Labor Force | Unemployed |
| Less than High School | 332 (39.7%) | 75 (9.0%) |
| High School Diploma | 676 (39.2%) | 129 (7.5%) |
| College / Associate Degree | 662 (51.5%) | 130 (10.1%) |
| Bachelor's Degree or higher | 1,540 (80.8%) | 0 (0.0%) |
| Total | 3,210 (55.8%) | 265 (4.6%) |
Employment Occupations by Sex in Isabela
Management, Business, Science and Arts Occupations
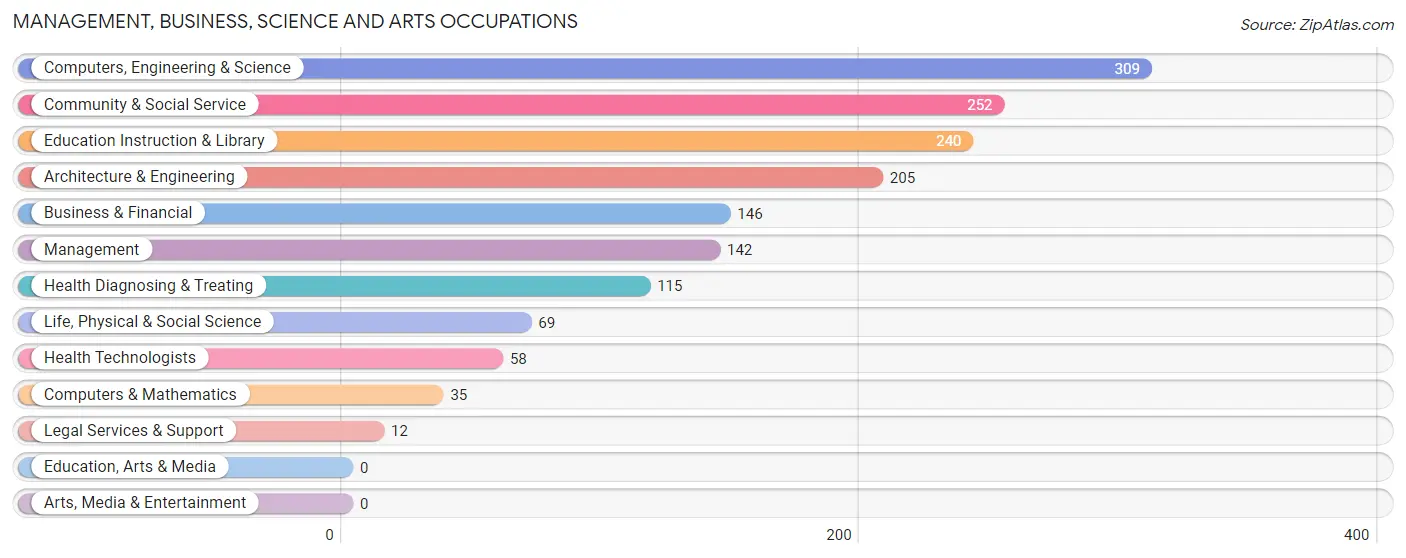
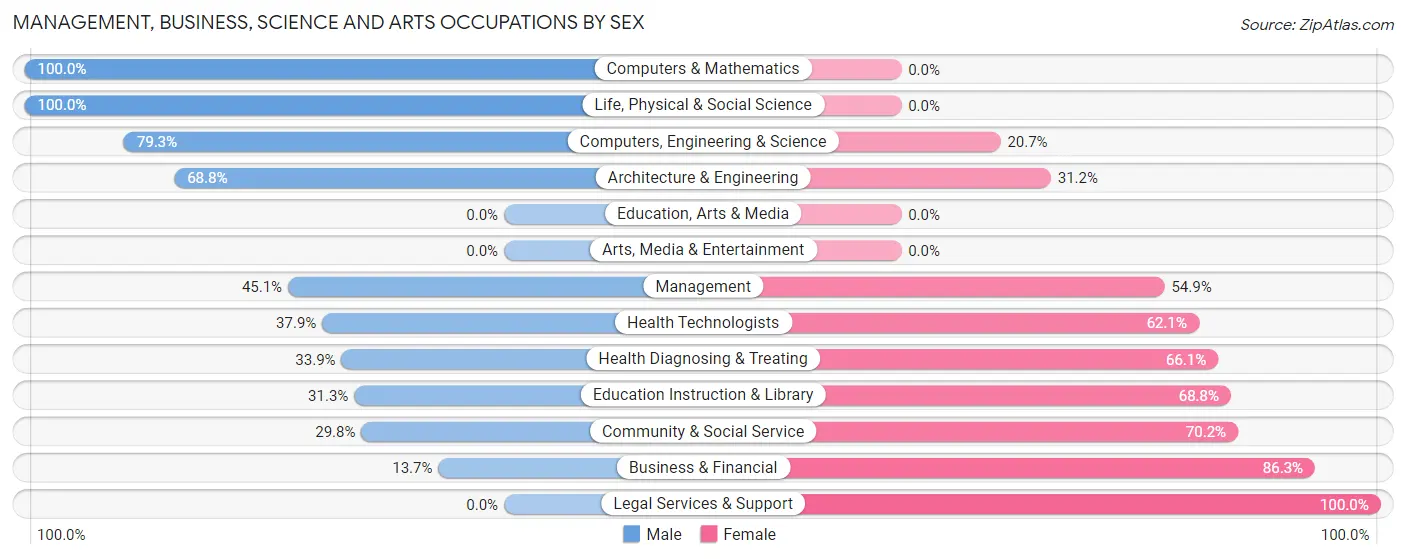
The most common Management, Business, Science and Arts occupations in Isabela are Computers, Engineering & Science (309 | 9.5%), Community & Social Service (252 | 7.7%), Education Instruction & Library (240 | 7.3%), Architecture & Engineering (205 | 6.3%), and Business & Financial (146 | 4.5%).
Management, Business, Science and Arts Occupations by Sex
Within the Management, Business, Science and Arts occupations in Isabela, the most male-oriented occupations are Computers & Mathematics (100.0%), Life, Physical & Social Science (100.0%), and Computers, Engineering & Science (79.3%), while the most female-oriented occupations are Legal Services & Support (100.0%), Business & Financial (86.3%), and Community & Social Service (70.2%).
| Occupation | Male | Female |
| Management | 64 (45.1%) | 78 (54.9%) |
| Business & Financial | 20 (13.7%) | 126 (86.3%) |
| Computers, Engineering & Science | 245 (79.3%) | 64 (20.7%) |
| Computers & Mathematics | 35 (100.0%) | 0 (0.0%) |
| Architecture & Engineering | 141 (68.8%) | 64 (31.2%) |
| Life, Physical & Social Science | 69 (100.0%) | 0 (0.0%) |
| Community & Social Service | 75 (29.8%) | 177 (70.2%) |
| Education, Arts & Media | 0 (0.0%) | 0 (0.0%) |
| Legal Services & Support | 0 (0.0%) | 12 (100.0%) |
| Education Instruction & Library | 75 (31.2%) | 165 (68.8%) |
| Arts, Media & Entertainment | 0 (0.0%) | 0 (0.0%) |
| Health Diagnosing & Treating | 39 (33.9%) | 76 (66.1%) |
| Health Technologists | 22 (37.9%) | 36 (62.1%) |
| Total (Category) | 443 (46.0%) | 521 (54.0%) |
| Total (Overall) | 1,778 (54.5%) | 1,487 (45.5%) |
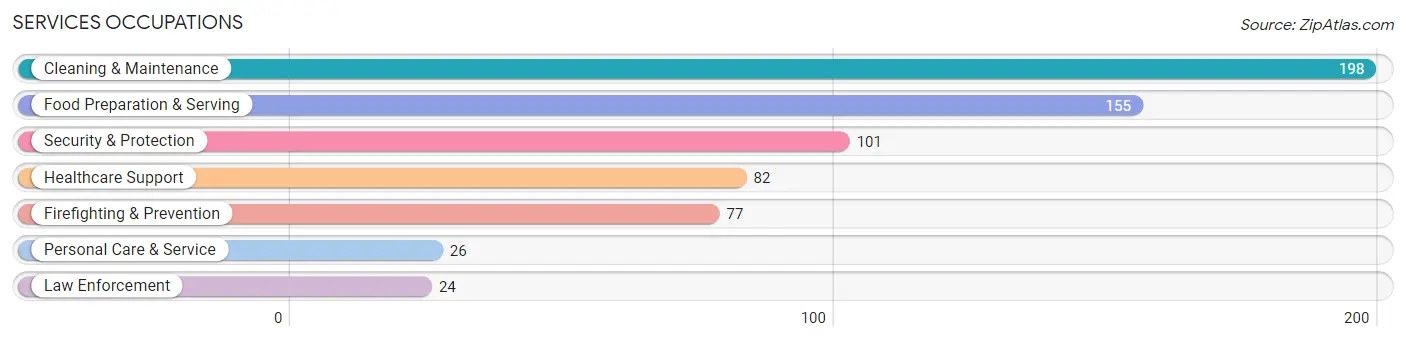
Services Occupations
The most common Services occupations in Isabela are Cleaning & Maintenance (198 | 6.1%), Food Preparation & Serving (155 | 4.8%), Security & Protection (101 | 3.1%), Healthcare Support (82 | 2.5%), and Firefighting & Prevention (77 | 2.4%).
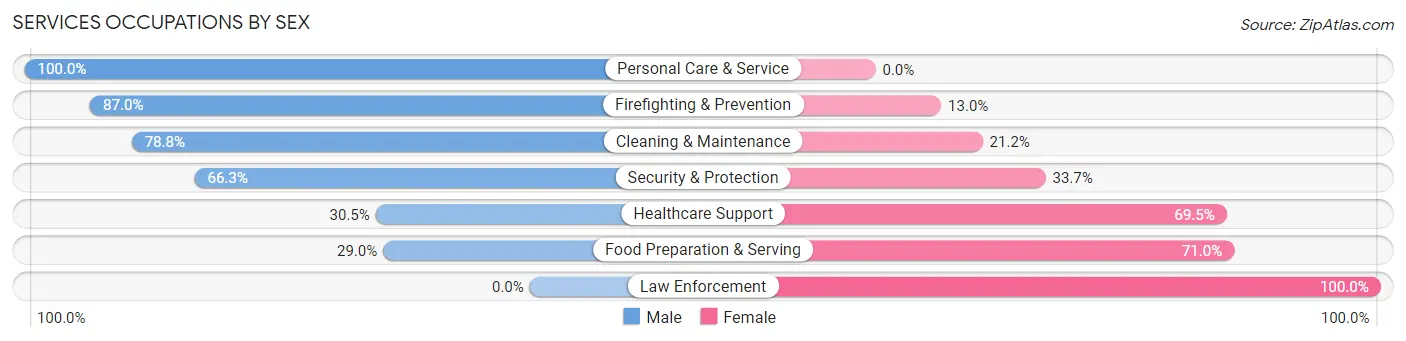
Services Occupations by Sex
Within the Services occupations in Isabela, the most male-oriented occupations are Personal Care & Service (100.0%), Firefighting & Prevention (87.0%), and Cleaning & Maintenance (78.8%), while the most female-oriented occupations are Law Enforcement (100.0%), Food Preparation & Serving (71.0%), and Healthcare Support (69.5%).
| Occupation | Male | Female |
| Healthcare Support | 25 (30.5%) | 57 (69.5%) |
| Security & Protection | 67 (66.3%) | 34 (33.7%) |
| Firefighting & Prevention | 67 (87.0%) | 10 (13.0%) |
| Law Enforcement | 0 (0.0%) | 24 (100.0%) |
| Food Preparation & Serving | 45 (29.0%) | 110 (71.0%) |
| Cleaning & Maintenance | 156 (78.8%) | 42 (21.2%) |
| Personal Care & Service | 26 (100.0%) | 0 (0.0%) |
| Total (Category) | 319 (56.8%) | 243 (43.2%) |
| Total (Overall) | 1,778 (54.5%) | 1,487 (45.5%) |
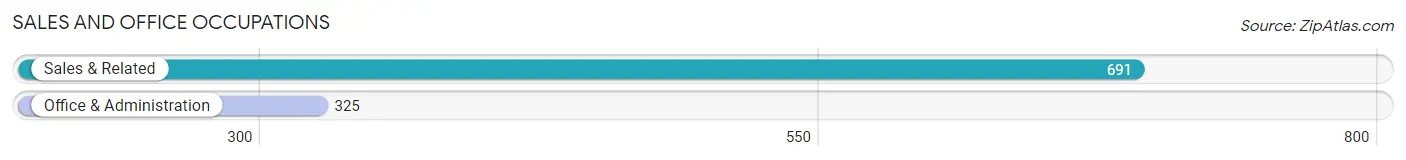
Sales and Office Occupations
The most common Sales and Office occupations in Isabela are Sales & Related (691 | 21.2%), and Office & Administration (325 | 10.0%).
Sales and Office Occupations by Sex
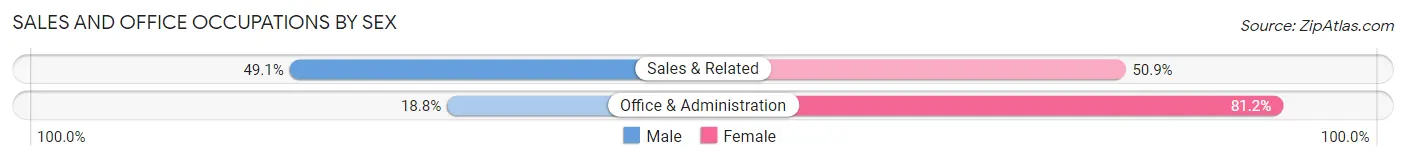
| Occupation | Male | Female |
| Sales & Related | 339 (49.1%) | 352 (50.9%) |
| Office & Administration | 61 (18.8%) | 264 (81.2%) |
| Total (Category) | 400 (39.4%) | 616 (60.6%) |
| Total (Overall) | 1,778 (54.5%) | 1,487 (45.5%) |
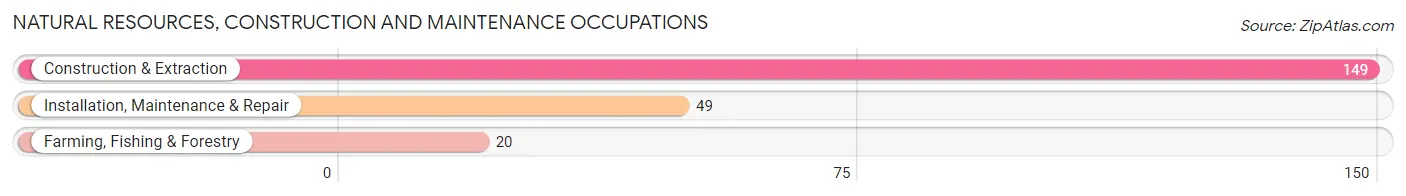
Natural Resources, Construction and Maintenance Occupations
The most common Natural Resources, Construction and Maintenance occupations in Isabela are Construction & Extraction (149 | 4.6%), Installation, Maintenance & Repair (49 | 1.5%), and Farming, Fishing & Forestry (20 | 0.6%).
Natural Resources, Construction and Maintenance Occupations by Sex
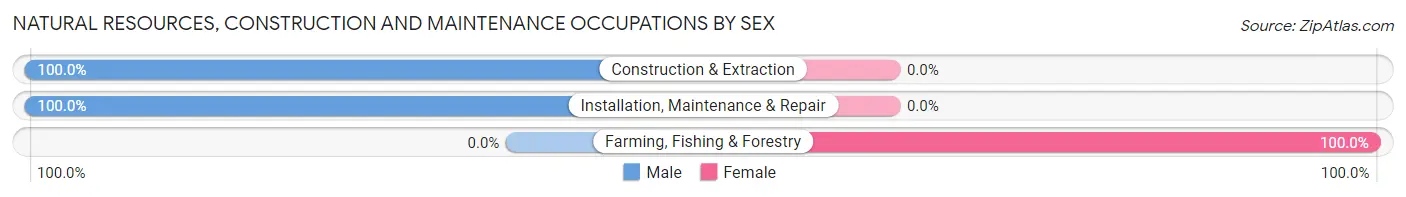
| Occupation | Male | Female |
| Farming, Fishing & Forestry | 0 (0.0%) | 20 (100.0%) |
| Construction & Extraction | 149 (100.0%) | 0 (0.0%) |
| Installation, Maintenance & Repair | 49 (100.0%) | 0 (0.0%) |
| Total (Category) | 198 (90.8%) | 20 (9.2%) |
| Total (Overall) | 1,778 (54.5%) | 1,487 (45.5%) |
Production, Transportation and Moving Occupations
The most common Production, Transportation and Moving occupations in Isabela are Production (211 | 6.5%), Transportation (151 | 4.6%), and Material Moving (143 | 4.4%).

Production, Transportation and Moving Occupations by Sex
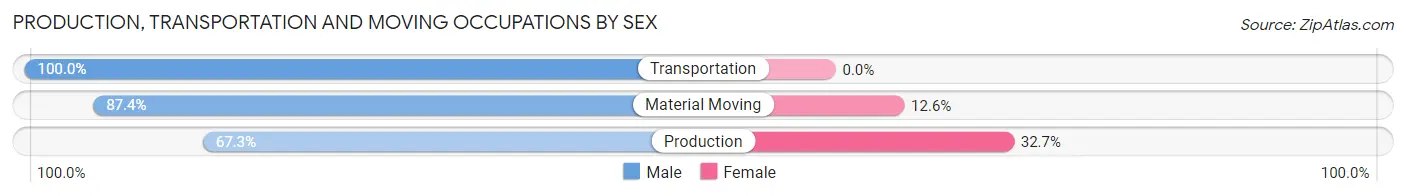
| Occupation | Male | Female |
| Production | 142 (67.3%) | 69 (32.7%) |
| Transportation | 151 (100.0%) | 0 (0.0%) |
| Material Moving | 125 (87.4%) | 18 (12.6%) |
| Total (Category) | 418 (82.8%) | 87 (17.2%) |
| Total (Overall) | 1,778 (54.5%) | 1,487 (45.5%) |
Employment Industries by Sex in Isabela
Employment Industries in Isabela
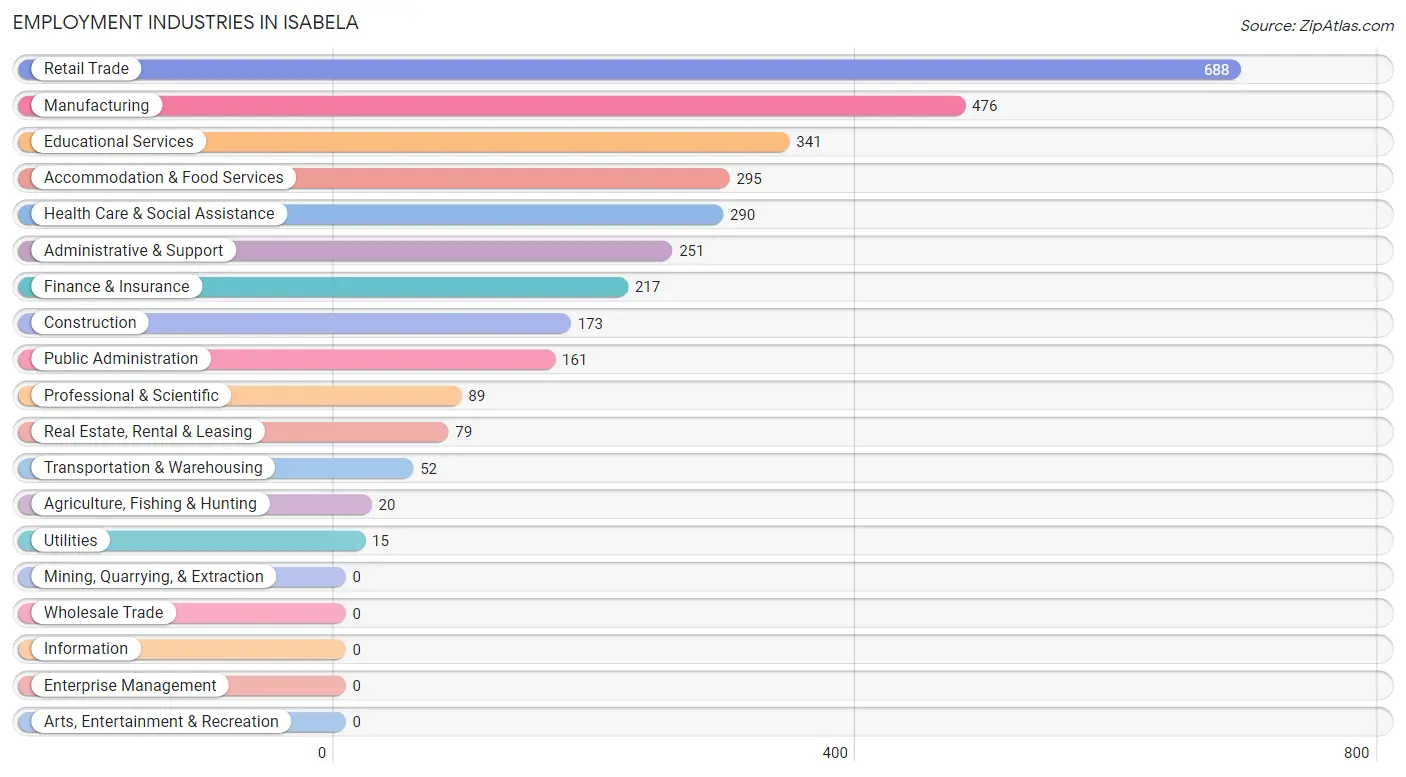
The major employment industries in Isabela include Retail Trade (688 | 21.1%), Manufacturing (476 | 14.6%), Educational Services (341 | 10.4%), Accommodation & Food Services (295 | 9.0%), and Health Care & Social Assistance (290 | 8.9%).
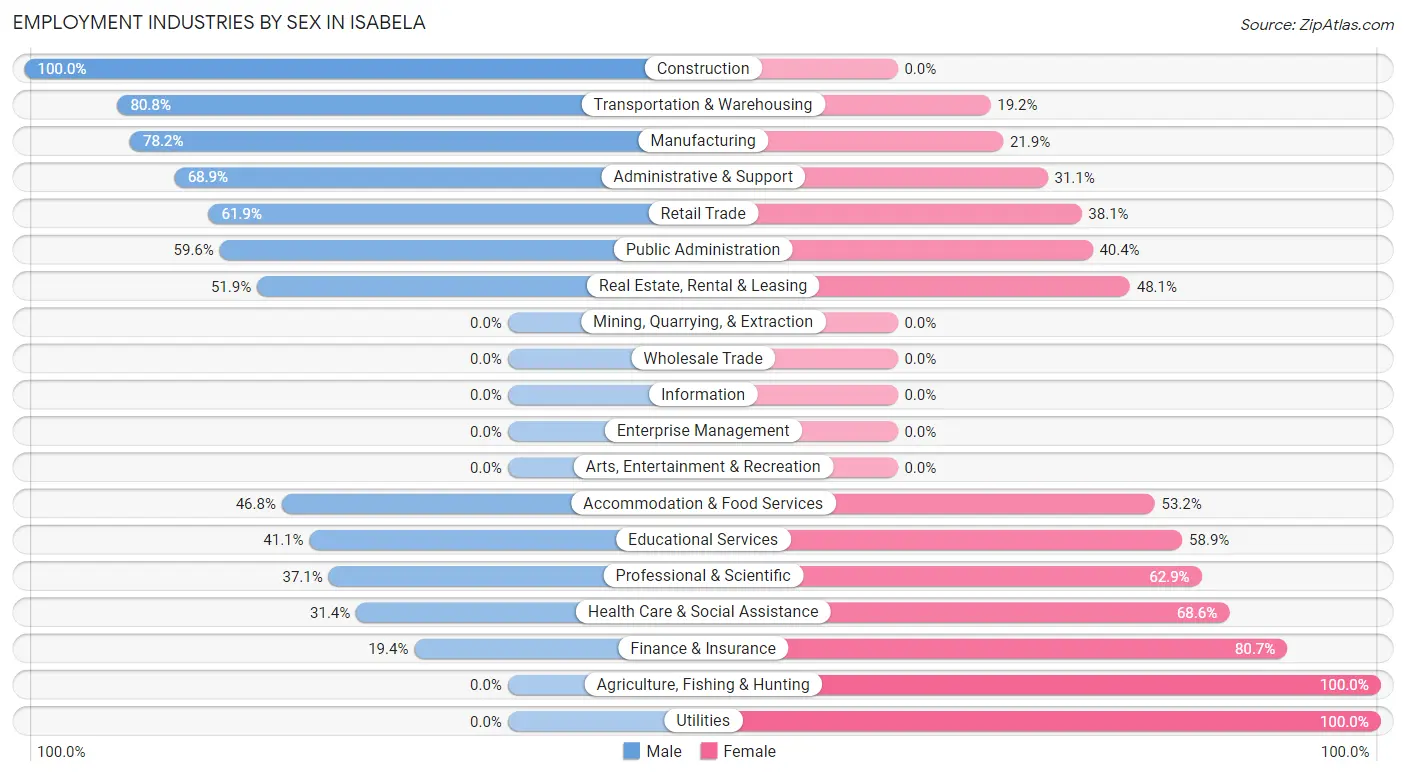
Employment Industries by Sex in Isabela
The Isabela industries that see more men than women are Construction (100.0%), Transportation & Warehousing (80.8%), and Manufacturing (78.1%), whereas the industries that tend to have a higher number of women are Agriculture, Fishing & Hunting (100.0%), Utilities (100.0%), and Finance & Insurance (80.6%).
| Industry | Male | Female |
| Agriculture, Fishing & Hunting | 0 (0.0%) | 20 (100.0%) |
| Mining, Quarrying, & Extraction | 0 (0.0%) | 0 (0.0%) |
| Construction | 173 (100.0%) | 0 (0.0%) |
| Manufacturing | 372 (78.1%) | 104 (21.8%) |
| Wholesale Trade | 0 (0.0%) | 0 (0.0%) |
| Retail Trade | 426 (61.9%) | 262 (38.1%) |
| Transportation & Warehousing | 42 (80.8%) | 10 (19.2%) |
| Utilities | 0 (0.0%) | 15 (100.0%) |
| Information | 0 (0.0%) | 0 (0.0%) |
| Finance & Insurance | 42 (19.4%) | 175 (80.6%) |
| Real Estate, Rental & Leasing | 41 (51.9%) | 38 (48.1%) |
| Professional & Scientific | 33 (37.1%) | 56 (62.9%) |
| Enterprise Management | 0 (0.0%) | 0 (0.0%) |
| Administrative & Support | 173 (68.9%) | 78 (31.1%) |
| Educational Services | 140 (41.1%) | 201 (58.9%) |
| Health Care & Social Assistance | 91 (31.4%) | 199 (68.6%) |
| Arts, Entertainment & Recreation | 0 (0.0%) | 0 (0.0%) |
| Accommodation & Food Services | 138 (46.8%) | 157 (53.2%) |
| Public Administration | 96 (59.6%) | 65 (40.4%) |
| Total | 1,778 (54.5%) | 1,487 (45.5%) |
Education in Isabela
School Enrollment in Isabela
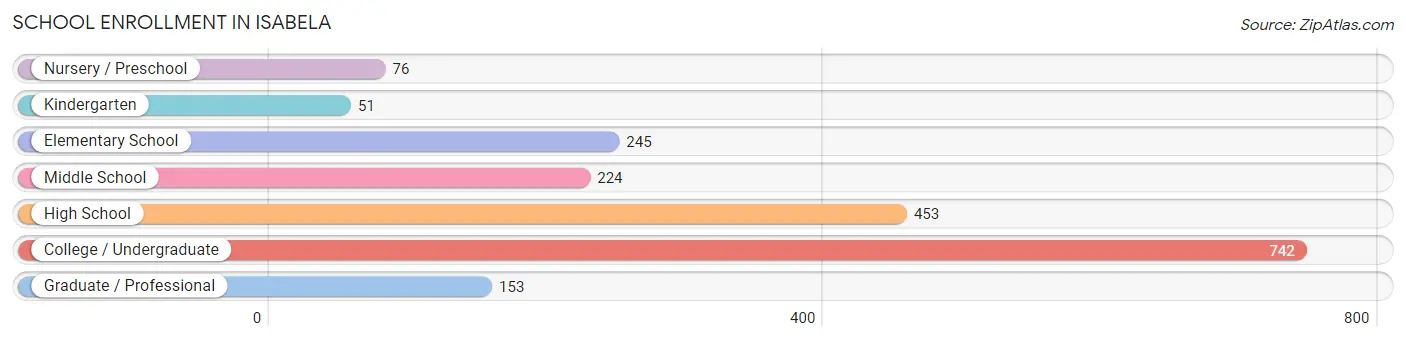
The most common levels of schooling among the 1,944 students in Isabela are college / undergraduate (742 | 38.2%), high school (453 | 23.3%), and elementary school (245 | 12.6%).
| School Level | # Students | % Students |
| Nursery / Preschool | 76 | 3.9% |
| Kindergarten | 51 | 2.6% |
| Elementary School | 245 | 12.6% |
| Middle School | 224 | 11.5% |
| High School | 453 | 23.3% |
| College / Undergraduate | 742 | 38.2% |
| Graduate / Professional | 153 | 7.9% |
| Total | 1,944 | 100.0% |
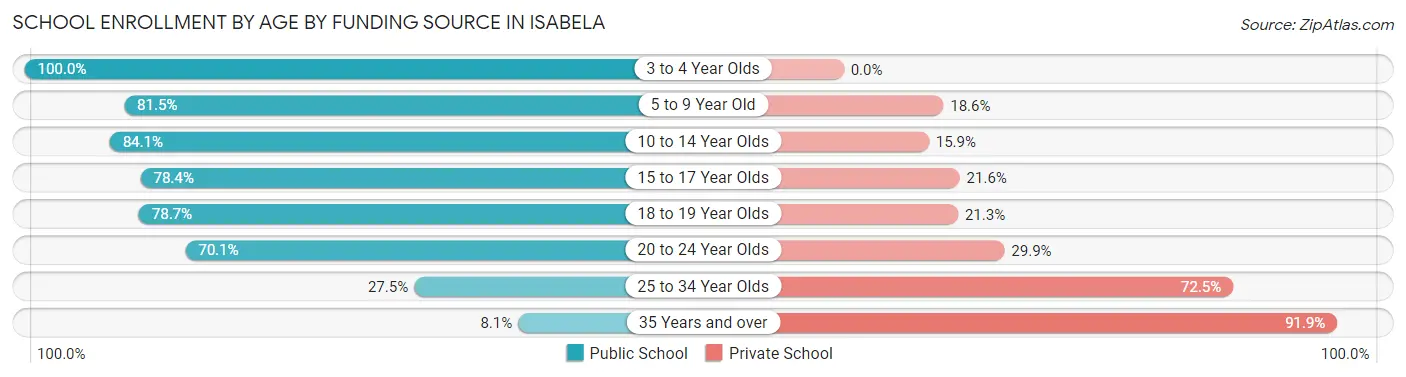
School Enrollment by Age by Funding Source in Isabela
Out of a total of 1,944 students who are enrolled in schools in Isabela, 649 (33.4%) attend a private institution, while the remaining 1,295 (66.6%) are enrolled in public schools. The age group of 35 years and over has the highest likelihood of being enrolled in private schools, with 182 (91.9% in the age bracket) enrolled. Conversely, the age group of 3 to 4 year olds has the lowest likelihood of being enrolled in a private school, with 76 (100.0% in the age bracket) attending a public institution.
| Age Bracket | Public School | Private School |
| 3 to 4 Year Olds | 76 (100.0%) | 0 (0.0%) |
| 5 to 9 Year Old | 224 (81.5%) | 51 (18.5%) |
| 10 to 14 Year Olds | 244 (84.1%) | 46 (15.9%) |
| 15 to 17 Year Olds | 225 (78.4%) | 62 (21.6%) |
| 18 to 19 Year Olds | 122 (78.7%) | 33 (21.3%) |
| 20 to 24 Year Olds | 337 (70.1%) | 144 (29.9%) |
| 25 to 34 Year Olds | 50 (27.5%) | 132 (72.5%) |
| 35 Years and over | 16 (8.1%) | 182 (91.9%) |
| Total | 1,295 (66.6%) | 649 (33.4%) |
Educational Attainment by Field of Study in Isabela
Business (824 | 32.7%), science & technology (397 | 15.8%), engineering (293 | 11.6%), education (267 | 10.6%), and psychology (206 | 8.2%) are the most common fields of study among 2,517 individuals in Isabela who have obtained a bachelor's degree or higher.
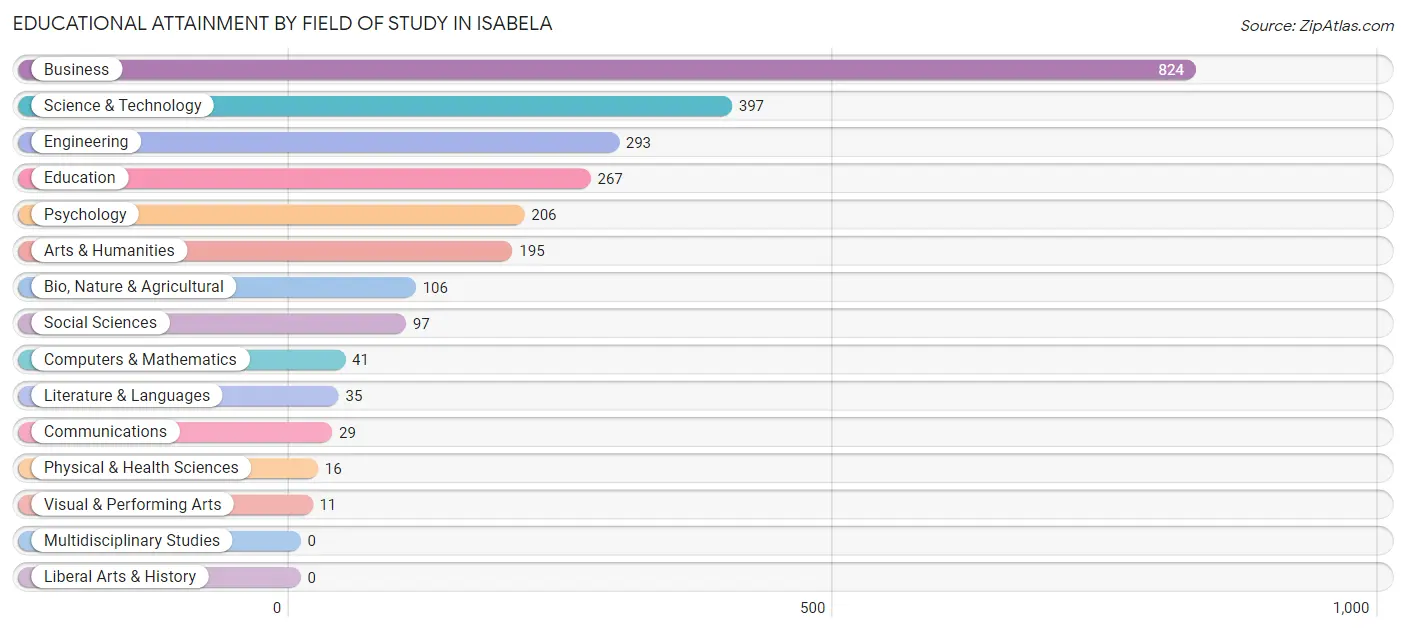
| Field of Study | # Graduates | % Graduates |
| Computers & Mathematics | 41 | 1.6% |
| Bio, Nature & Agricultural | 106 | 4.2% |
| Physical & Health Sciences | 16 | 0.6% |
| Psychology | 206 | 8.2% |
| Social Sciences | 97 | 3.8% |
| Engineering | 293 | 11.6% |
| Multidisciplinary Studies | 0 | 0.0% |
| Science & Technology | 397 | 15.8% |
| Business | 824 | 32.7% |
| Education | 267 | 10.6% |
| Literature & Languages | 35 | 1.4% |
| Liberal Arts & History | 0 | 0.0% |
| Visual & Performing Arts | 11 | 0.4% |
| Communications | 29 | 1.1% |
| Arts & Humanities | 195 | 7.7% |
| Total | 2,517 | 100.0% |
Transportation & Commute in Isabela
Vehicle Availability by Sex in Isabela
The most prevalent vehicle ownership categories in Isabela are males with 2 vehicles (880, accounting for 49.2%) and females with 2 vehicles (505, making up 62.2%).
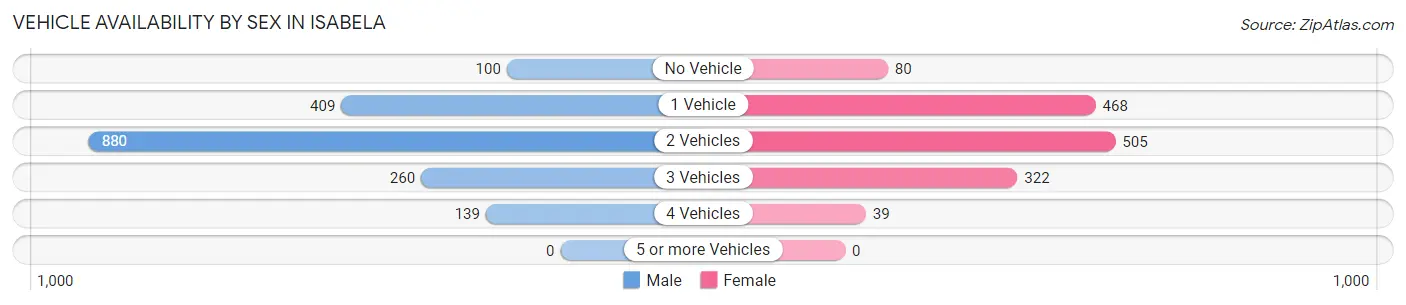
| Vehicles Available | Male | Female |
| No Vehicle | 100 (5.6%) | 80 (5.7%) |
| 1 Vehicle | 409 (22.9%) | 468 (33.1%) |
| 2 Vehicles | 880 (49.2%) | 505 (35.7%) |
| 3 Vehicles | 260 (14.5%) | 322 (22.8%) |
| 4 Vehicles | 139 (7.8%) | 39 (2.8%) |
| 5 or more Vehicles | 0 (0.0%) | 0 (0.0%) |
| Total | 1,788 (100.0%) | 1,414 (100.0%) |
Commute Time in Isabela
The most frequently occuring commute durations in Isabela are 20 to 24 minutes (633 commuters, 20.4%), 10 to 14 minutes (389 commuters, 12.5%), and 45 to 59 minutes (380 commuters, 12.2%).
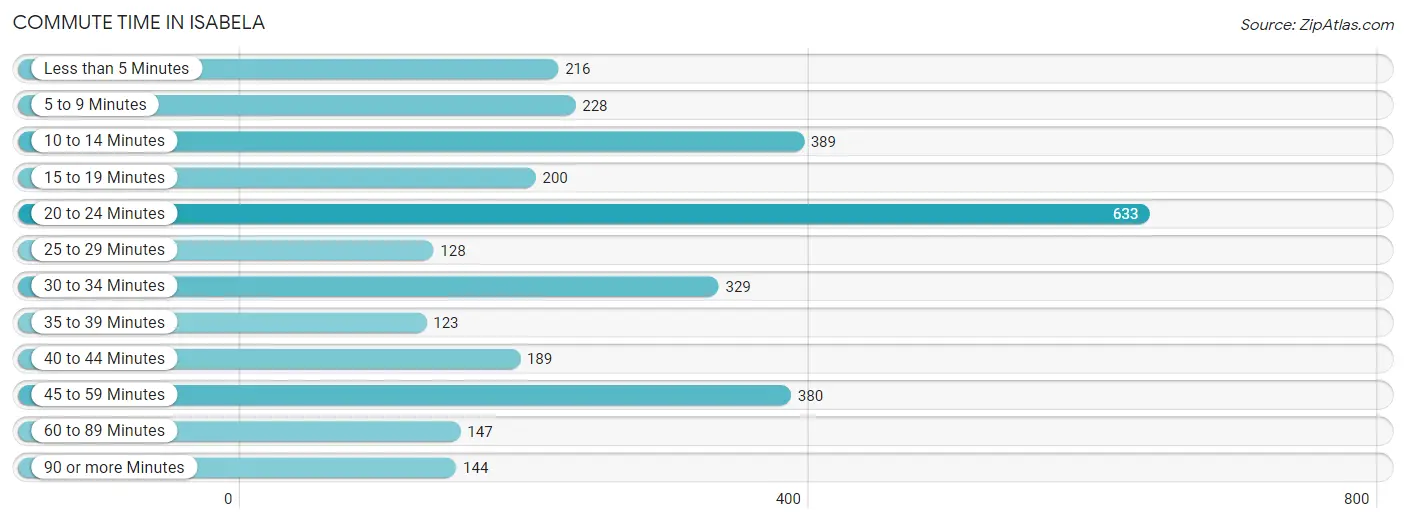
| Commute Time | # Commuters | % Commuters |
| Less than 5 Minutes | 216 | 7.0% |
| 5 to 9 Minutes | 228 | 7.3% |
| 10 to 14 Minutes | 389 | 12.5% |
| 15 to 19 Minutes | 200 | 6.4% |
| 20 to 24 Minutes | 633 | 20.4% |
| 25 to 29 Minutes | 128 | 4.1% |
| 30 to 34 Minutes | 329 | 10.6% |
| 35 to 39 Minutes | 123 | 4.0% |
| 40 to 44 Minutes | 189 | 6.1% |
| 45 to 59 Minutes | 380 | 12.2% |
| 60 to 89 Minutes | 147 | 4.7% |
| 90 or more Minutes | 144 | 4.6% |
Commute Time by Sex in Isabela
The most common commute times in Isabela are 20 to 24 minutes (421 commuters, 24.3%) for males and 20 to 24 minutes (212 commuters, 15.4%) for females.
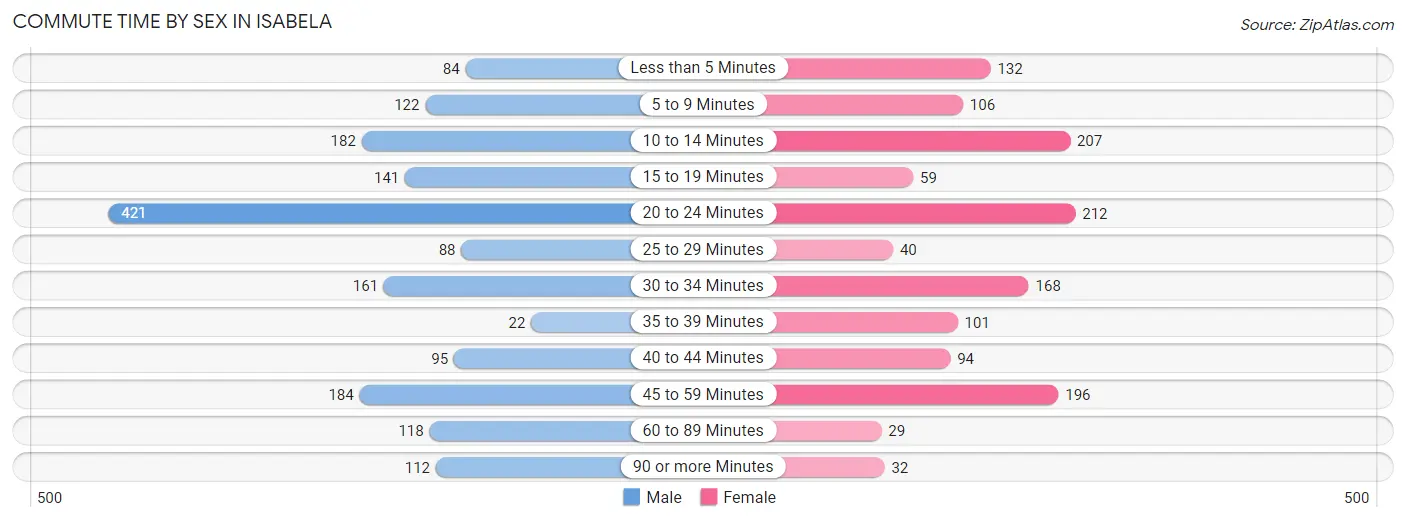
| Commute Time | Male | Female |
| Less than 5 Minutes | 84 (4.9%) | 132 (9.6%) |
| 5 to 9 Minutes | 122 (7.0%) | 106 (7.7%) |
| 10 to 14 Minutes | 182 (10.5%) | 207 (15.0%) |
| 15 to 19 Minutes | 141 (8.2%) | 59 (4.3%) |
| 20 to 24 Minutes | 421 (24.3%) | 212 (15.4%) |
| 25 to 29 Minutes | 88 (5.1%) | 40 (2.9%) |
| 30 to 34 Minutes | 161 (9.3%) | 168 (12.2%) |
| 35 to 39 Minutes | 22 (1.3%) | 101 (7.3%) |
| 40 to 44 Minutes | 95 (5.5%) | 94 (6.8%) |
| 45 to 59 Minutes | 184 (10.6%) | 196 (14.2%) |
| 60 to 89 Minutes | 118 (6.8%) | 29 (2.1%) |
| 90 or more Minutes | 112 (6.5%) | 32 (2.3%) |
Time of Departure to Work by Sex in Isabela
The most frequent times of departure to work in Isabela are 7:00 AM to 7:29 AM (535, 30.9%) for males and 8:00 AM to 8:29 AM (370, 26.9%) for females.
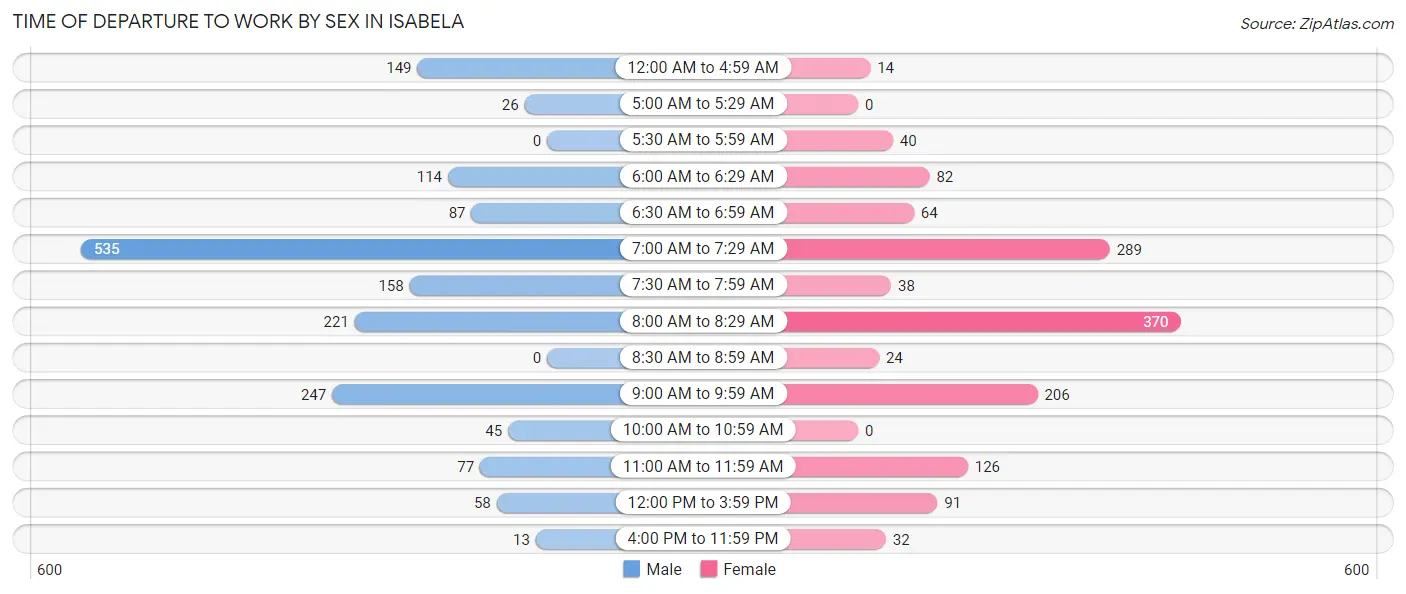
| Time of Departure | Male | Female |
| 12:00 AM to 4:59 AM | 149 (8.6%) | 14 (1.0%) |
| 5:00 AM to 5:29 AM | 26 (1.5%) | 0 (0.0%) |
| 5:30 AM to 5:59 AM | 0 (0.0%) | 40 (2.9%) |
| 6:00 AM to 6:29 AM | 114 (6.6%) | 82 (6.0%) |
| 6:30 AM to 6:59 AM | 87 (5.0%) | 64 (4.6%) |
| 7:00 AM to 7:29 AM | 535 (30.9%) | 289 (21.0%) |
| 7:30 AM to 7:59 AM | 158 (9.1%) | 38 (2.8%) |
| 8:00 AM to 8:29 AM | 221 (12.8%) | 370 (26.9%) |
| 8:30 AM to 8:59 AM | 0 (0.0%) | 24 (1.7%) |
| 9:00 AM to 9:59 AM | 247 (14.3%) | 206 (15.0%) |
| 10:00 AM to 10:59 AM | 45 (2.6%) | 0 (0.0%) |
| 11:00 AM to 11:59 AM | 77 (4.4%) | 126 (9.2%) |
| 12:00 PM to 3:59 PM | 58 (3.4%) | 91 (6.6%) |
| 4:00 PM to 11:59 PM | 13 (0.7%) | 32 (2.3%) |
| Total | 1,730 (100.0%) | 1,376 (100.0%) |
Housing Occupancy in Isabela
Occupancy by Ownership in Isabela
Of the total 3,801 dwellings in Isabela, owner-occupied units account for 2,296 (60.4%), while renter-occupied units make up 1,505 (39.6%).
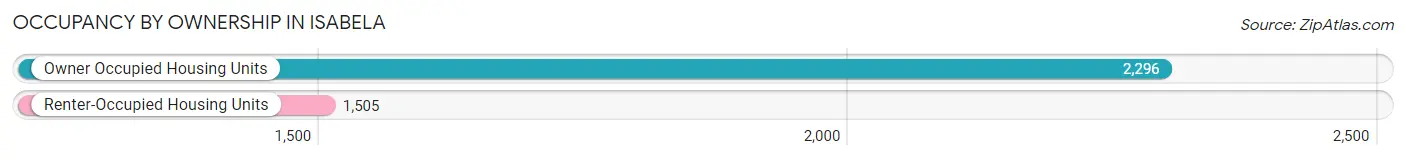
| Occupancy | # Housing Units | % Housing Units |
| Owner Occupied Housing Units | 2,296 | 60.4% |
| Renter-Occupied Housing Units | 1,505 | 39.6% |
| Total Occupied Housing Units | 3,801 | 100.0% |
Occupancy by Household Size in Isabela
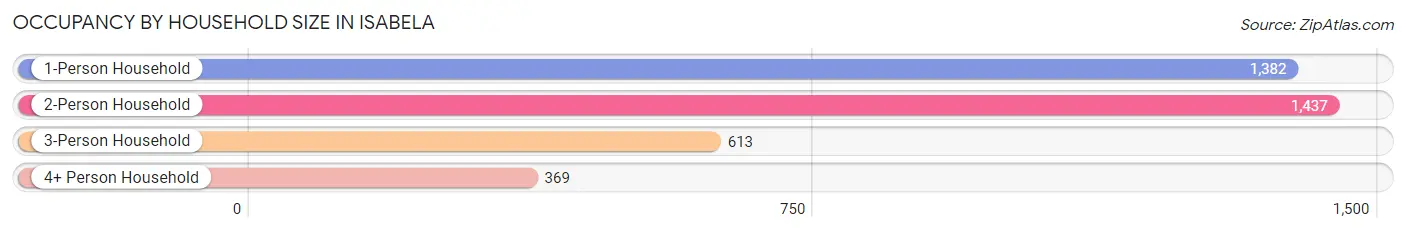
| Household Size | # Housing Units | % Housing Units |
| 1-Person Household | 1,382 | 36.4% |
| 2-Person Household | 1,437 | 37.8% |
| 3-Person Household | 613 | 16.1% |
| 4+ Person Household | 369 | 9.7% |
| Total Housing Units | 3,801 | 100.0% |
Occupancy by Ownership by Household Size in Isabela
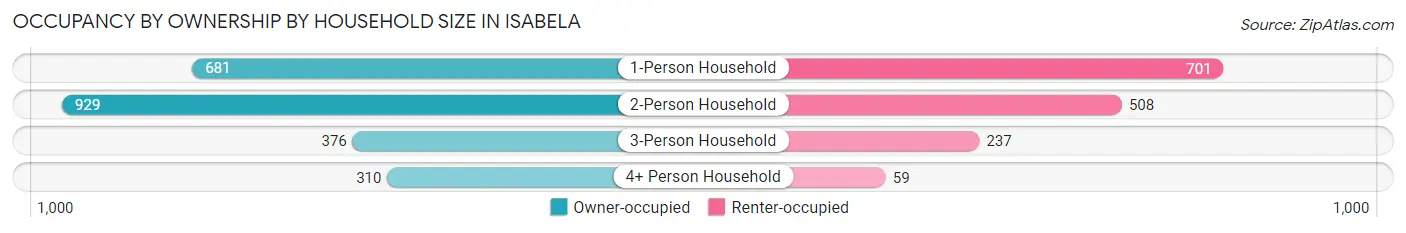
| Household Size | Owner-occupied | Renter-occupied |
| 1-Person Household | 681 (49.3%) | 701 (50.7%) |
| 2-Person Household | 929 (64.6%) | 508 (35.3%) |
| 3-Person Household | 376 (61.3%) | 237 (38.7%) |
| 4+ Person Household | 310 (84.0%) | 59 (16.0%) |
| Total Housing Units | 2,296 (60.4%) | 1,505 (39.6%) |
Occupancy by Educational Attainment in Isabela
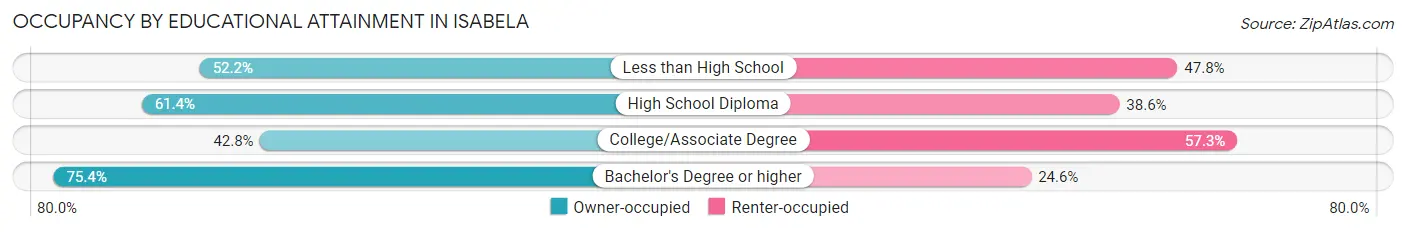
| Household Size | Owner-occupied | Renter-occupied |
| Less than High School | 423 (52.2%) | 387 (47.8%) |
| High School Diploma | 710 (61.4%) | 446 (38.6%) |
| College/Associate Degree | 289 (42.7%) | 387 (57.3%) |
| Bachelor's Degree or higher | 874 (75.4%) | 285 (24.6%) |
Occupancy by Age of Householder in Isabela
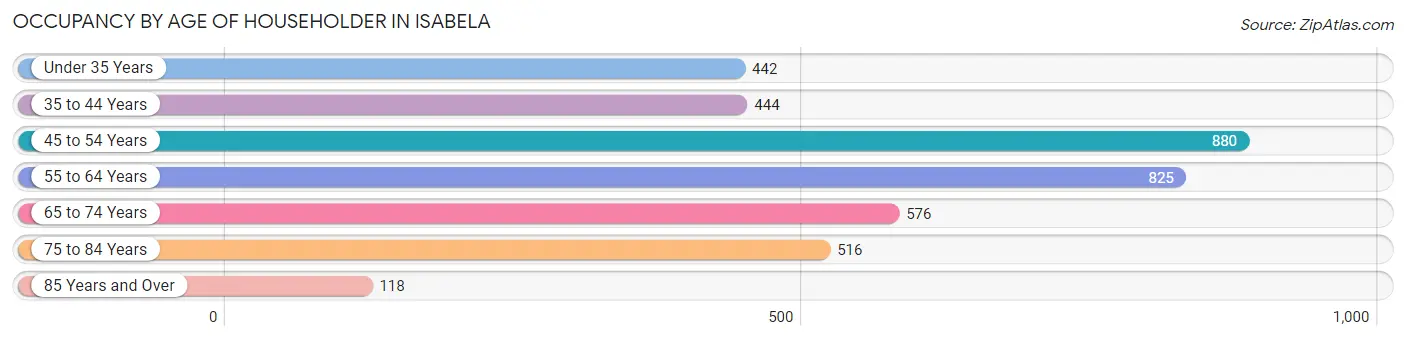
| Age Bracket | # Households | % Households |
| Under 35 Years | 442 | 11.6% |
| 35 to 44 Years | 444 | 11.7% |
| 45 to 54 Years | 880 | 23.2% |
| 55 to 64 Years | 825 | 21.7% |
| 65 to 74 Years | 576 | 15.1% |
| 75 to 84 Years | 516 | 13.6% |
| 85 Years and Over | 118 | 3.1% |
| Total | 3,801 | 100.0% |
Housing Finances in Isabela
Median Income by Occupancy in Isabela
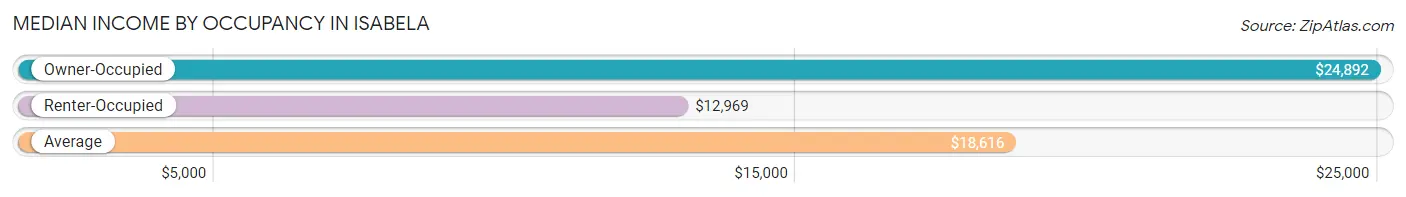
| Occupancy Type | # Households | Median Income |
| Owner-Occupied | 2,296 (60.4%) | $24,892 |
| Renter-Occupied | 1,505 (39.6%) | $12,969 |
| Average | 3,801 (100.0%) | $18,616 |
Occupancy by Householder Income Bracket in Isabela
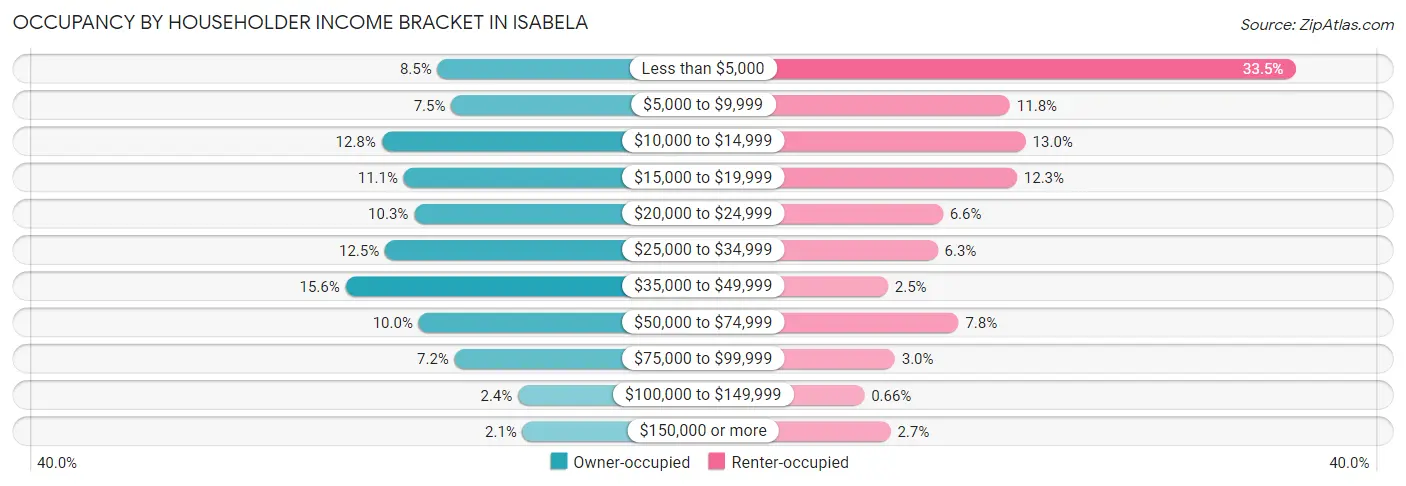
| Income Bracket | Owner-occupied | Renter-occupied |
| Less than $5,000 | 196 (8.5%) | 504 (33.5%) |
| $5,000 to $9,999 | 172 (7.5%) | 177 (11.8%) |
| $10,000 to $14,999 | 294 (12.8%) | 195 (13.0%) |
| $15,000 to $19,999 | 255 (11.1%) | 185 (12.3%) |
| $20,000 to $24,999 | 237 (10.3%) | 100 (6.6%) |
| $25,000 to $34,999 | 288 (12.5%) | 94 (6.2%) |
| $35,000 to $49,999 | 357 (15.5%) | 37 (2.5%) |
| $50,000 to $74,999 | 229 (10.0%) | 118 (7.8%) |
| $75,000 to $99,999 | 166 (7.2%) | 45 (3.0%) |
| $100,000 to $149,999 | 55 (2.4%) | 10 (0.7%) |
| $150,000 or more | 47 (2.1%) | 40 (2.7%) |
| Total | 2,296 (100.0%) | 1,505 (100.0%) |
Monthly Housing Cost Tiers in Isabela
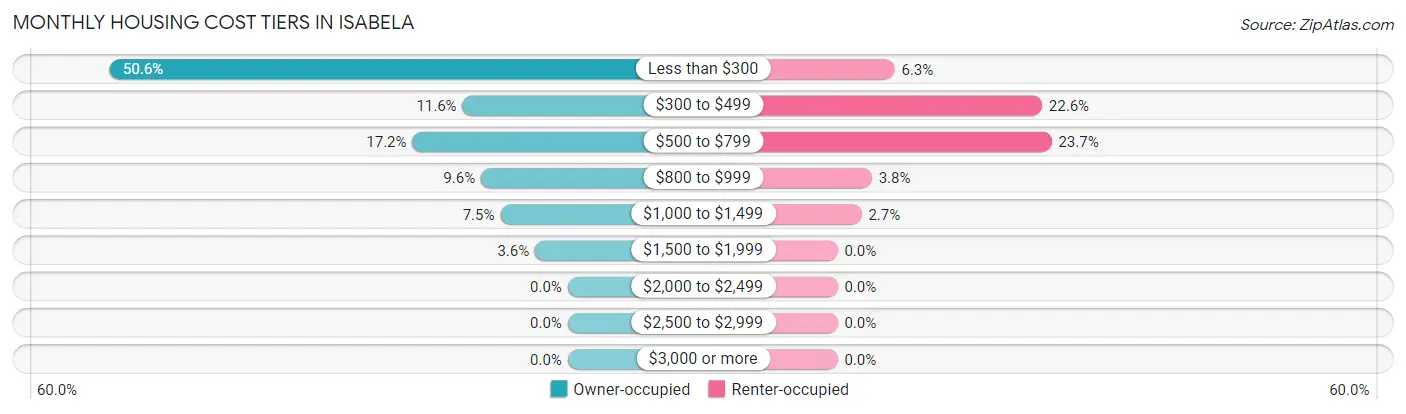
| Monthly Cost | Owner-occupied | Renter-occupied |
| Less than $300 | 1,161 (50.6%) | 95 (6.3%) |
| $300 to $499 | 267 (11.6%) | 340 (22.6%) |
| $500 to $799 | 394 (17.2%) | 356 (23.6%) |
| $800 to $999 | 220 (9.6%) | 57 (3.8%) |
| $1,000 to $1,499 | 171 (7.4%) | 40 (2.7%) |
| $1,500 to $1,999 | 83 (3.6%) | 0 (0.0%) |
| $2,000 to $2,499 | 0 (0.0%) | 0 (0.0%) |
| $2,500 to $2,999 | 0 (0.0%) | 0 (0.0%) |
| $3,000 or more | 0 (0.0%) | 0 (0.0%) |
| Total | 2,296 (100.0%) | 1,505 (100.0%) |
Physical Housing Characteristics in Isabela
Housing Structures in Isabela
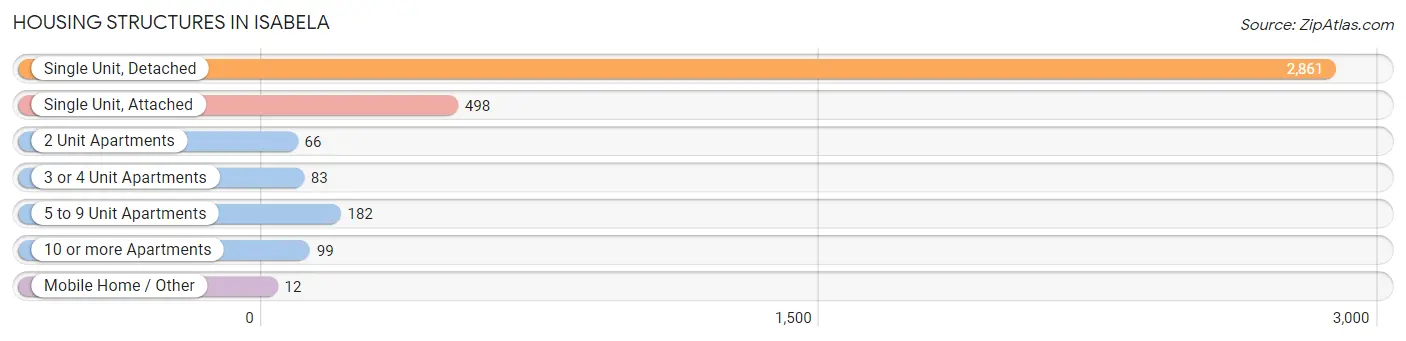
| Structure Type | # Housing Units | % Housing Units |
| Single Unit, Detached | 2,861 | 75.3% |
| Single Unit, Attached | 498 | 13.1% |
| 2 Unit Apartments | 66 | 1.7% |
| 3 or 4 Unit Apartments | 83 | 2.2% |
| 5 to 9 Unit Apartments | 182 | 4.8% |
| 10 or more Apartments | 99 | 2.6% |
| Mobile Home / Other | 12 | 0.3% |
| Total | 3,801 | 100.0% |
Housing Structures by Occupancy in Isabela
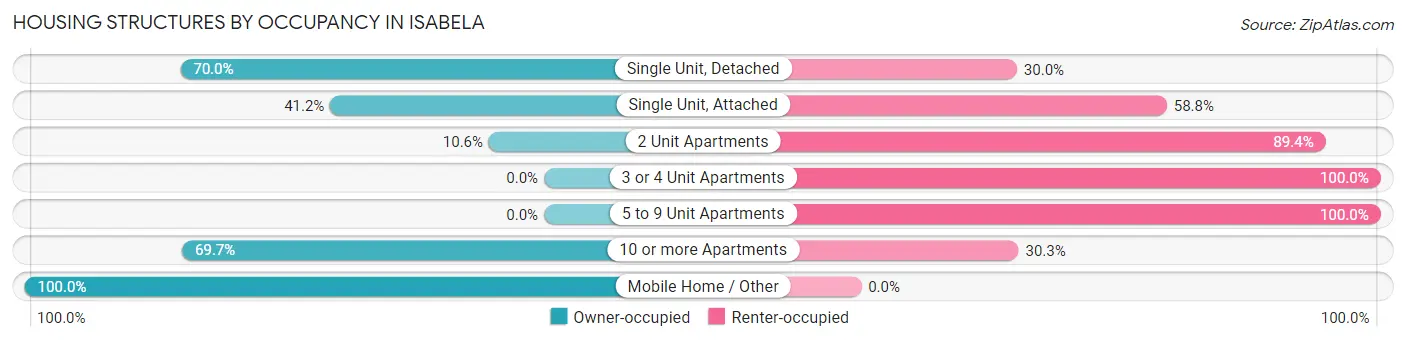
| Structure Type | Owner-occupied | Renter-occupied |
| Single Unit, Detached | 2,003 (70.0%) | 858 (30.0%) |
| Single Unit, Attached | 205 (41.2%) | 293 (58.8%) |
| 2 Unit Apartments | 7 (10.6%) | 59 (89.4%) |
| 3 or 4 Unit Apartments | 0 (0.0%) | 83 (100.0%) |
| 5 to 9 Unit Apartments | 0 (0.0%) | 182 (100.0%) |
| 10 or more Apartments | 69 (69.7%) | 30 (30.3%) |
| Mobile Home / Other | 12 (100.0%) | 0 (0.0%) |
| Total | 2,296 (60.4%) | 1,505 (39.6%) |
Housing Structures by Number of Rooms in Isabela
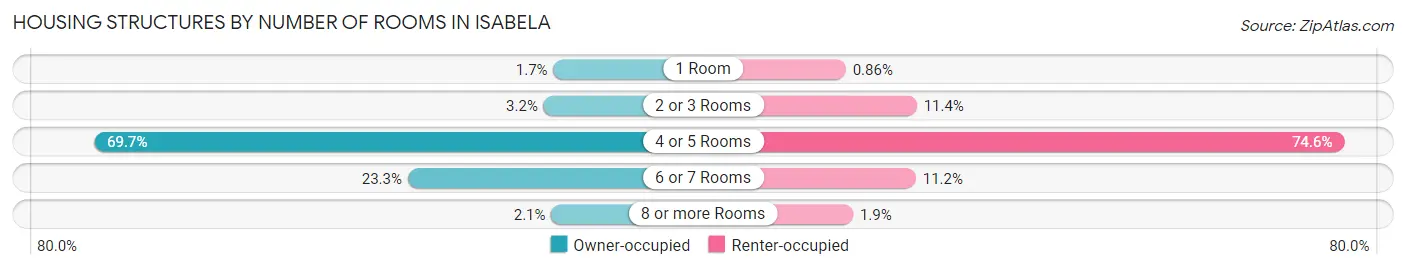
| Number of Rooms | Owner-occupied | Renter-occupied |
| 1 Room | 40 (1.7%) | 13 (0.9%) |
| 2 or 3 Rooms | 73 (3.2%) | 171 (11.4%) |
| 4 or 5 Rooms | 1,601 (69.7%) | 1,123 (74.6%) |
| 6 or 7 Rooms | 535 (23.3%) | 169 (11.2%) |
| 8 or more Rooms | 47 (2.1%) | 29 (1.9%) |
| Total | 2,296 (100.0%) | 1,505 (100.0%) |
Housing Structure by Heating Type in Isabela
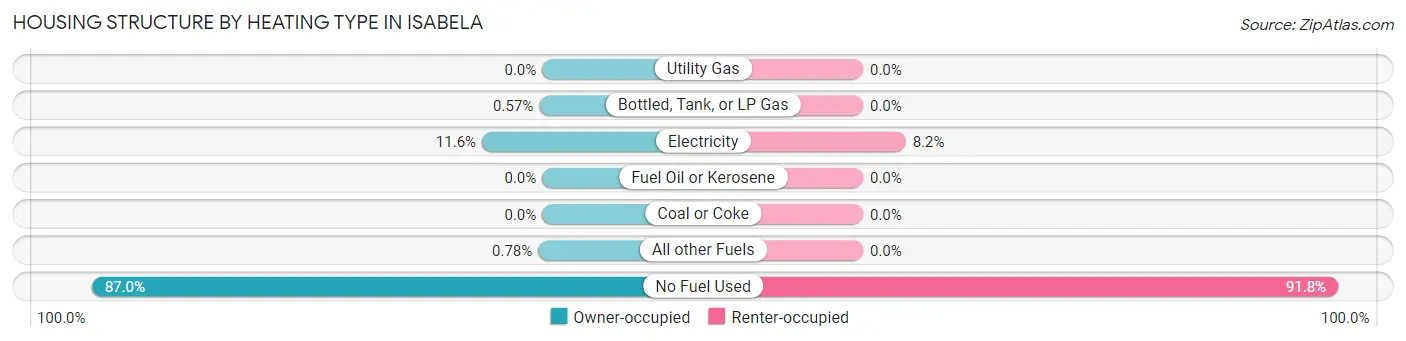
| Heating Type | Owner-occupied | Renter-occupied |
| Utility Gas | 0 (0.0%) | 0 (0.0%) |
| Bottled, Tank, or LP Gas | 13 (0.6%) | 0 (0.0%) |
| Electricity | 267 (11.6%) | 124 (8.2%) |
| Fuel Oil or Kerosene | 0 (0.0%) | 0 (0.0%) |
| Coal or Coke | 0 (0.0%) | 0 (0.0%) |
| All other Fuels | 18 (0.8%) | 0 (0.0%) |
| No Fuel Used | 1,998 (87.0%) | 1,381 (91.8%) |
| Total | 2,296 (100.0%) | 1,505 (100.0%) |
Household Vehicle Usage in Isabela
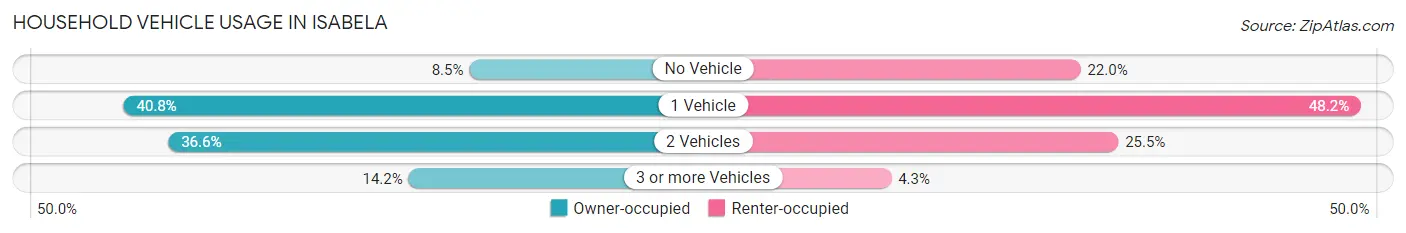
| Vehicles per Household | Owner-occupied | Renter-occupied |
| No Vehicle | 195 (8.5%) | 331 (22.0%) |
| 1 Vehicle | 936 (40.8%) | 725 (48.2%) |
| 2 Vehicles | 840 (36.6%) | 384 (25.5%) |
| 3 or more Vehicles | 325 (14.2%) | 65 (4.3%) |
| Total | 2,296 (100.0%) | 1,505 (100.0%) |
Real Estate & Mortgages in Isabela
Real Estate and Mortgage Overview in Isabela
| Characteristic | Without Mortgage | With Mortgage |
| Housing Units | 1,378 | 918 |
| Median Property Value | $100,500 | $122,400 |
| Median Household Income | $19,615 | $19 |
| Monthly Housing Costs | $156 | $0 |
| Real Estate Taxes | $544 | $816 |
Property Value by Mortgage Status in Isabela
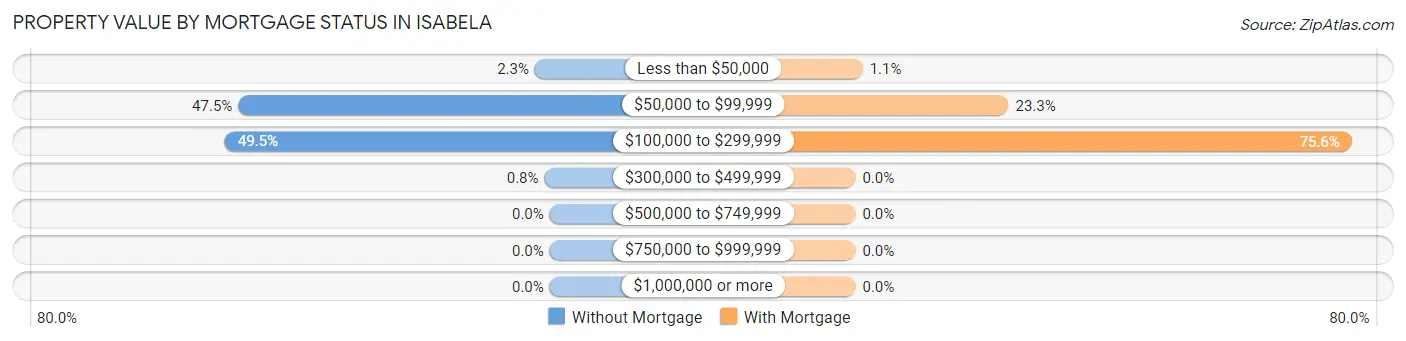
| Property Value | Without Mortgage | With Mortgage |
| Less than $50,000 | 31 (2.2%) | 10 (1.1%) |
| $50,000 to $99,999 | 654 (47.5%) | 214 (23.3%) |
| $100,000 to $299,999 | 682 (49.5%) | 694 (75.6%) |
| $300,000 to $499,999 | 11 (0.8%) | 0 (0.0%) |
| $500,000 to $749,999 | 0 (0.0%) | 0 (0.0%) |
| $750,000 to $999,999 | 0 (0.0%) | 0 (0.0%) |
| $1,000,000 or more | 0 (0.0%) | 0 (0.0%) |
| Total | 1,378 (100.0%) | 918 (100.0%) |
Household Income by Mortgage Status in Isabela
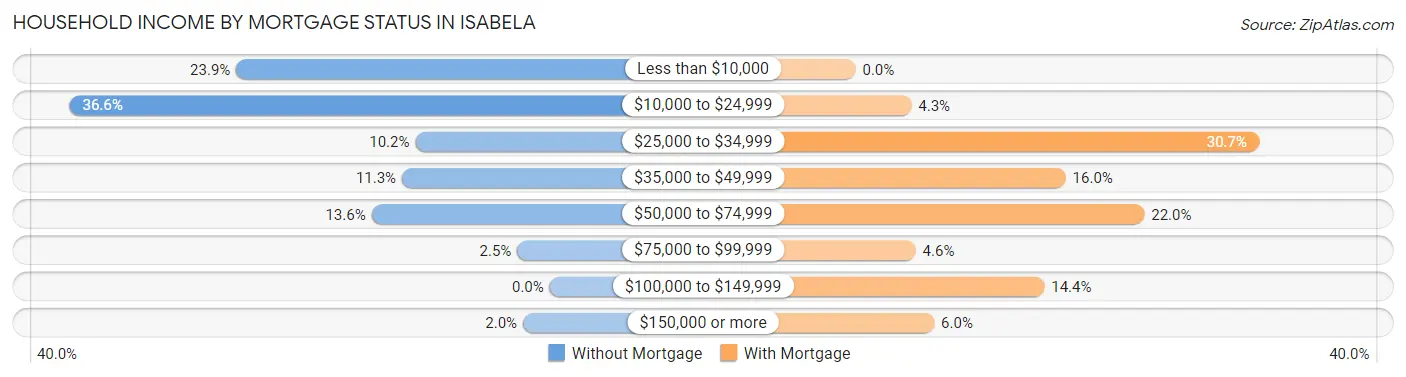
| Household Income | Without Mortgage | With Mortgage |
| Less than $10,000 | 329 (23.9%) | 0 (0.0%) |
| $10,000 to $24,999 | 504 (36.6%) | 39 (4.3%) |
| $25,000 to $34,999 | 141 (10.2%) | 282 (30.7%) |
| $35,000 to $49,999 | 155 (11.3%) | 147 (16.0%) |
| $50,000 to $74,999 | 187 (13.6%) | 202 (22.0%) |
| $75,000 to $99,999 | 34 (2.5%) | 42 (4.6%) |
| $100,000 to $149,999 | 0 (0.0%) | 132 (14.4%) |
| $150,000 or more | 28 (2.0%) | 55 (6.0%) |
| Total | 1,378 (100.0%) | 918 (100.0%) |
Property Value to Household Income Ratio in Isabela
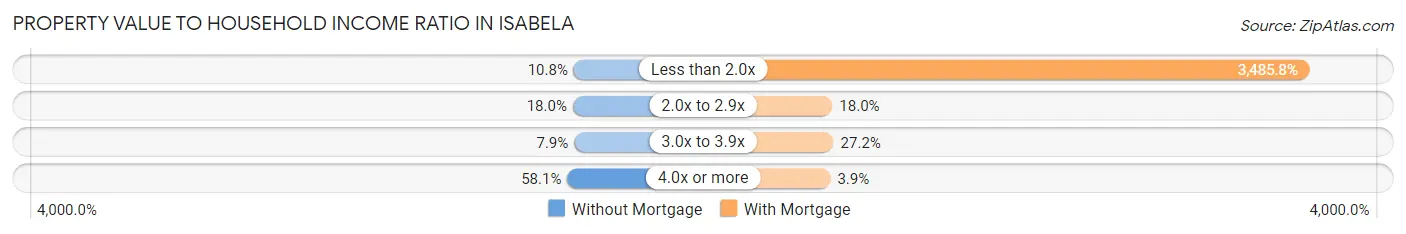
| Value-to-Income Ratio | Without Mortgage | With Mortgage |
| Less than 2.0x | 149 (10.8%) | 32,000 (3,485.8%) |
| 2.0x to 2.9x | 248 (18.0%) | 165 (18.0%) |
| 3.0x to 3.9x | 109 (7.9%) | 250 (27.2%) |
| 4.0x or more | 801 (58.1%) | 36 (3.9%) |
| Total | 1,378 (100.0%) | 918 (100.0%) |
Real Estate Taxes by Mortgage Status in Isabela
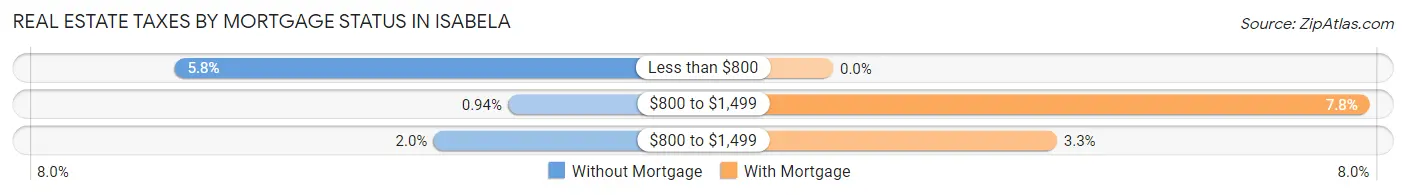
| Property Taxes | Without Mortgage | With Mortgage |
| Less than $800 | 80 (5.8%) | 0 (0.0%) |
| $800 to $1,499 | 13 (0.9%) | 72 (7.8%) |
| $800 to $1,499 | 28 (2.0%) | 30 (3.3%) |
| Total | 1,378 (100.0%) | 918 (100.0%) |
Health & Disability in Isabela
Health Insurance Coverage by Age in Isabela
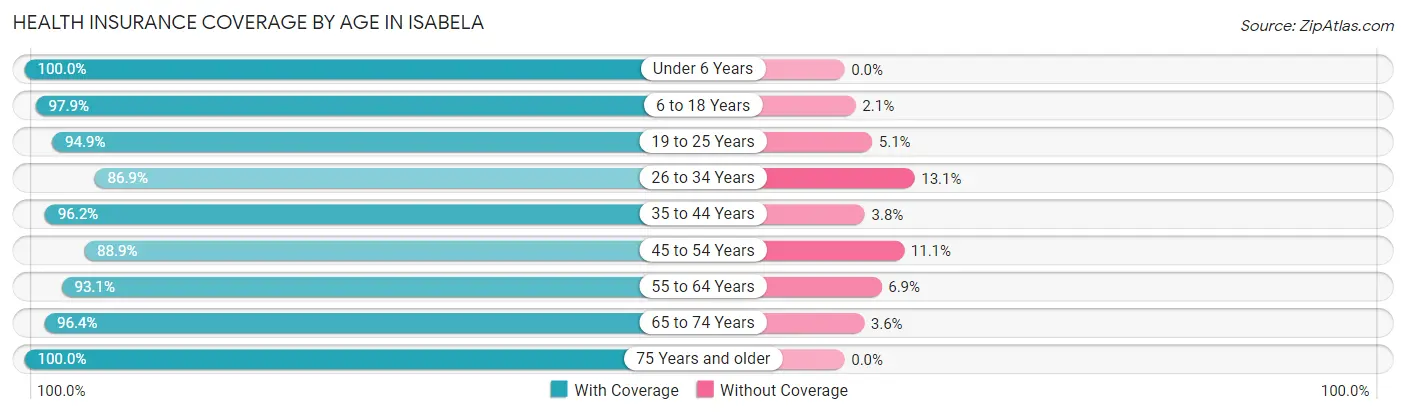
| Age Bracket | With Coverage | Without Coverage |
| Under 6 Years | 400 (100.0%) | 0 (0.0%) |
| 6 to 18 Years | 992 (97.9%) | 21 (2.1%) |
| 19 to 25 Years | 922 (94.9%) | 50 (5.1%) |
| 26 to 34 Years | 1,132 (86.9%) | 170 (13.1%) |
| 35 to 44 Years | 1,117 (96.2%) | 44 (3.8%) |
| 45 to 54 Years | 1,192 (88.9%) | 149 (11.1%) |
| 55 to 64 Years | 1,566 (93.1%) | 116 (6.9%) |
| 65 to 74 Years | 1,111 (96.4%) | 42 (3.6%) |
| 75 Years and older | 1,011 (100.0%) | 0 (0.0%) |
| Total | 9,443 (94.1%) | 592 (5.9%) |
Health Insurance Coverage by Citizenship Status in Isabela
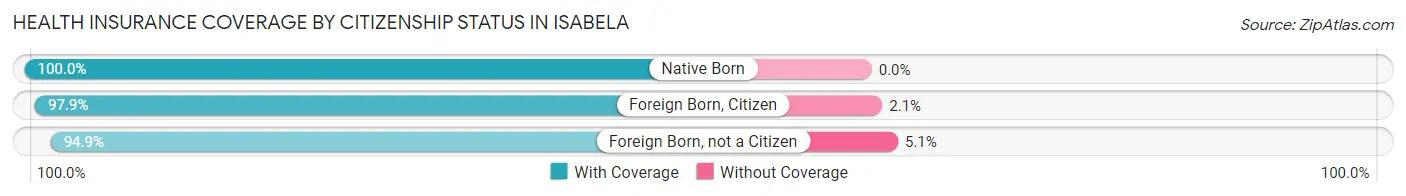
| Citizenship Status | With Coverage | Without Coverage |
| Native Born | 400 (100.0%) | 0 (0.0%) |
| Foreign Born, Citizen | 992 (97.9%) | 21 (2.1%) |
| Foreign Born, not a Citizen | 922 (94.9%) | 50 (5.1%) |
Health Insurance Coverage by Household Income in Isabela
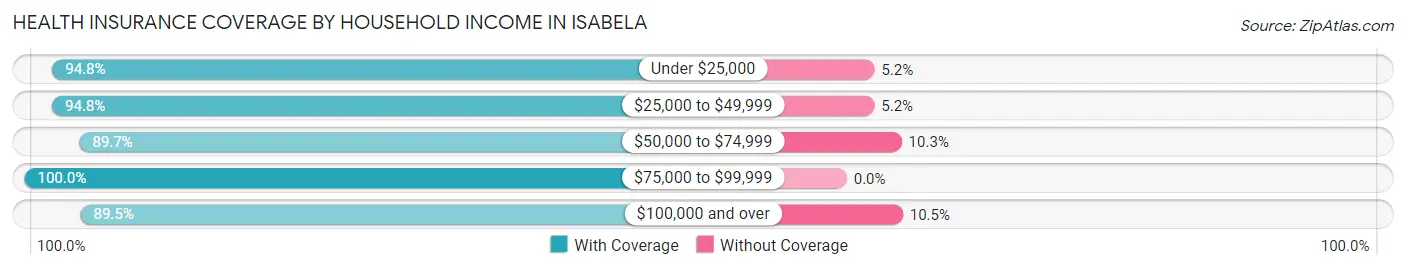
| Household Income | With Coverage | Without Coverage |
| Under $25,000 | 4,733 (94.8%) | 259 (5.2%) |
| $25,000 to $49,999 | 2,260 (94.8%) | 123 (5.2%) |
| $50,000 to $74,999 | 1,230 (89.7%) | 141 (10.3%) |
| $75,000 to $99,999 | 631 (100.0%) | 0 (0.0%) |
| $100,000 and over | 580 (89.5%) | 68 (10.5%) |
Public vs Private Health Insurance Coverage by Age in Isabela
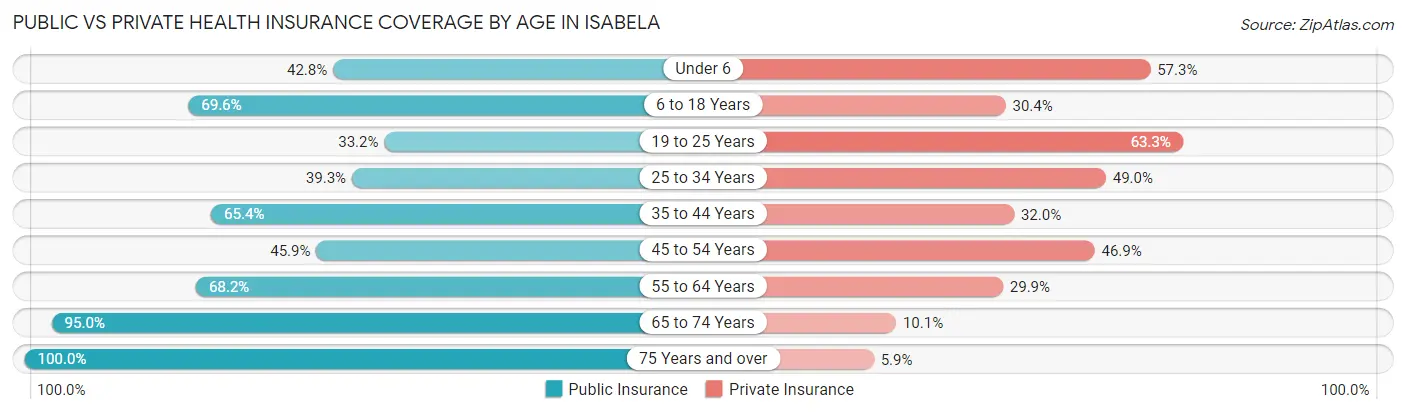
| Age Bracket | Public Insurance | Private Insurance |
| Under 6 | 171 (42.7%) | 229 (57.3%) |
| 6 to 18 Years | 705 (69.6%) | 308 (30.4%) |
| 19 to 25 Years | 323 (33.2%) | 615 (63.3%) |
| 25 to 34 Years | 511 (39.3%) | 638 (49.0%) |
| 35 to 44 Years | 759 (65.4%) | 371 (32.0%) |
| 45 to 54 Years | 615 (45.9%) | 629 (46.9%) |
| 55 to 64 Years | 1,147 (68.2%) | 503 (29.9%) |
| 65 to 74 Years | 1,095 (95.0%) | 116 (10.1%) |
| 75 Years and over | 1,011 (100.0%) | 60 (5.9%) |
| Total | 6,337 (63.1%) | 3,469 (34.6%) |
Disability Status by Sex by Age in Isabela
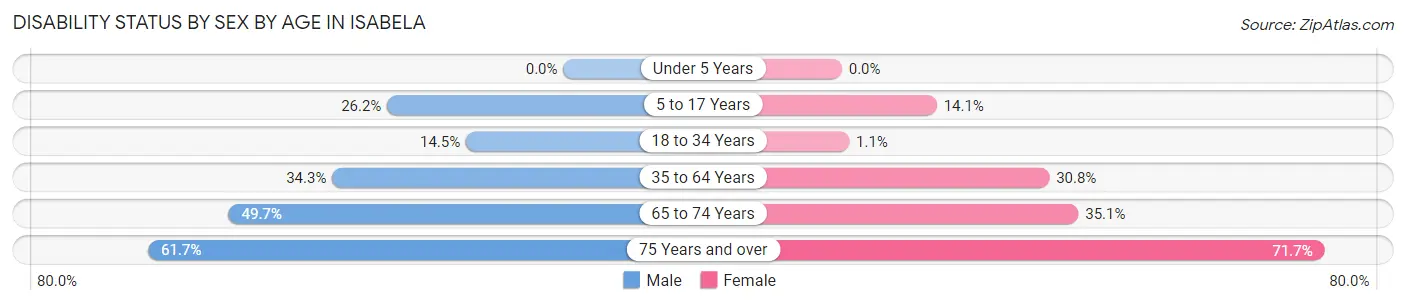
| Age Bracket | Male | Female |
| Under 5 Years | 0 (0.0%) | 0 (0.0%) |
| 5 to 17 Years | 79 (26.2%) | 82 (14.1%) |
| 18 to 34 Years | 188 (14.4%) | 12 (1.1%) |
| 35 to 64 Years | 638 (34.3%) | 716 (30.8%) |
| 65 to 74 Years | 249 (49.7%) | 229 (35.1%) |
| 75 Years and over | 238 (61.7%) | 448 (71.7%) |
Disability Class by Sex by Age in Isabela
Disability Class: Hearing Difficulty
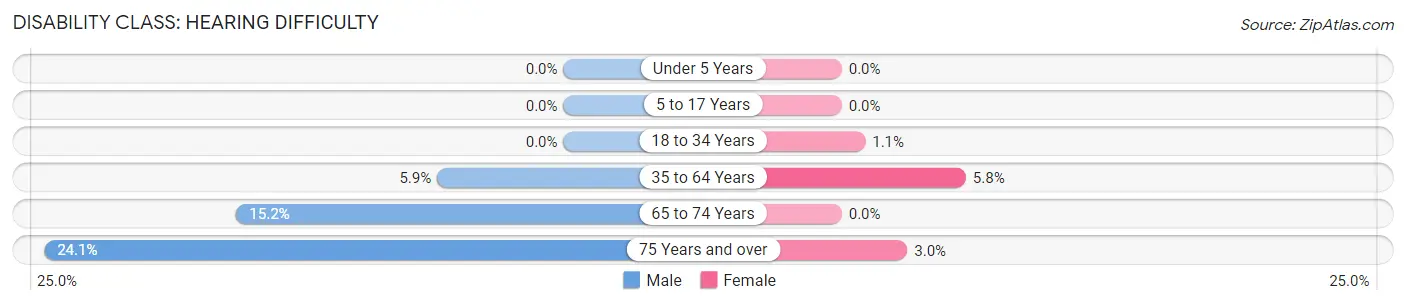
| Age Bracket | Male | Female |
| Under 5 Years | 0 (0.0%) | 0 (0.0%) |
| 5 to 17 Years | 0 (0.0%) | 0 (0.0%) |
| 18 to 34 Years | 0 (0.0%) | 12 (1.1%) |
| 35 to 64 Years | 109 (5.9%) | 134 (5.8%) |
| 65 to 74 Years | 76 (15.2%) | 0 (0.0%) |
| 75 Years and over | 93 (24.1%) | 19 (3.0%) |
Disability Class: Vision Difficulty
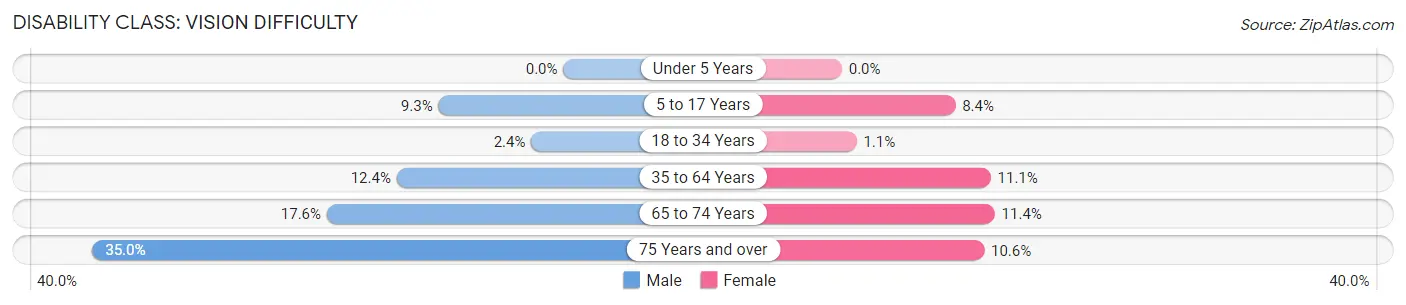
| Age Bracket | Male | Female |
| Under 5 Years | 0 (0.0%) | 0 (0.0%) |
| 5 to 17 Years | 28 (9.3%) | 49 (8.4%) |
| 18 to 34 Years | 31 (2.4%) | 12 (1.1%) |
| 35 to 64 Years | 230 (12.4%) | 257 (11.1%) |
| 65 to 74 Years | 88 (17.6%) | 74 (11.4%) |
| 75 Years and over | 135 (35.0%) | 66 (10.6%) |
Disability Class: Cognitive Difficulty
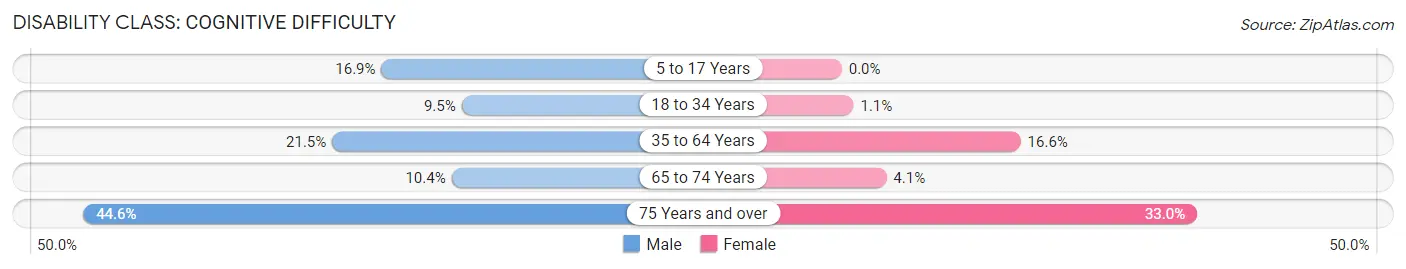
| Age Bracket | Male | Female |
| 5 to 17 Years | 51 (16.9%) | 0 (0.0%) |
| 18 to 34 Years | 123 (9.5%) | 12 (1.1%) |
| 35 to 64 Years | 399 (21.5%) | 386 (16.6%) |
| 65 to 74 Years | 52 (10.4%) | 27 (4.1%) |
| 75 Years and over | 172 (44.6%) | 206 (33.0%) |
Disability Class: Ambulatory Difficulty
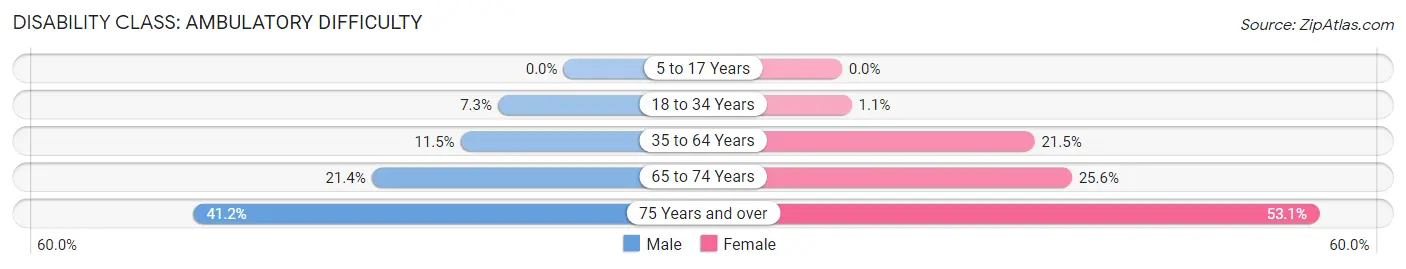
| Age Bracket | Male | Female |
| 5 to 17 Years | 0 (0.0%) | 0 (0.0%) |
| 18 to 34 Years | 95 (7.3%) | 12 (1.1%) |
| 35 to 64 Years | 213 (11.5%) | 499 (21.5%) |
| 65 to 74 Years | 107 (21.4%) | 167 (25.6%) |
| 75 Years and over | 159 (41.2%) | 332 (53.1%) |
Disability Class: Self-Care Difficulty
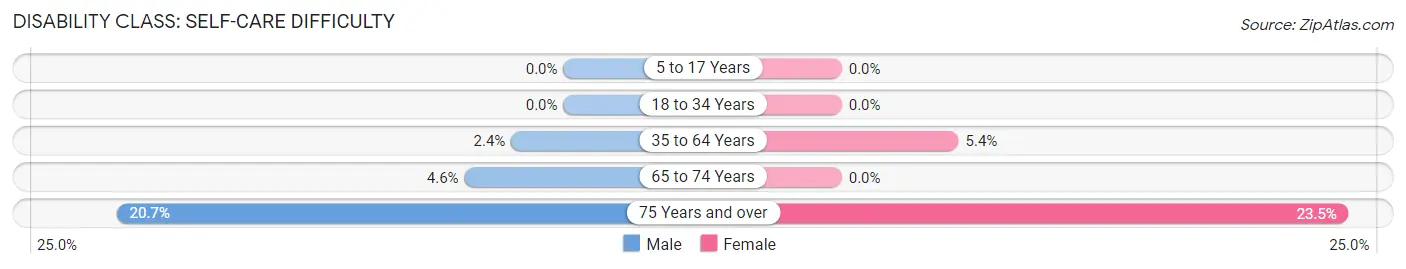
| Age Bracket | Male | Female |
| 5 to 17 Years | 0 (0.0%) | 0 (0.0%) |
| 18 to 34 Years | 0 (0.0%) | 0 (0.0%) |
| 35 to 64 Years | 45 (2.4%) | 126 (5.4%) |
| 65 to 74 Years | 23 (4.6%) | 0 (0.0%) |
| 75 Years and over | 80 (20.7%) | 147 (23.5%) |
Technology Access in Isabela
Computing Device Access in Isabela
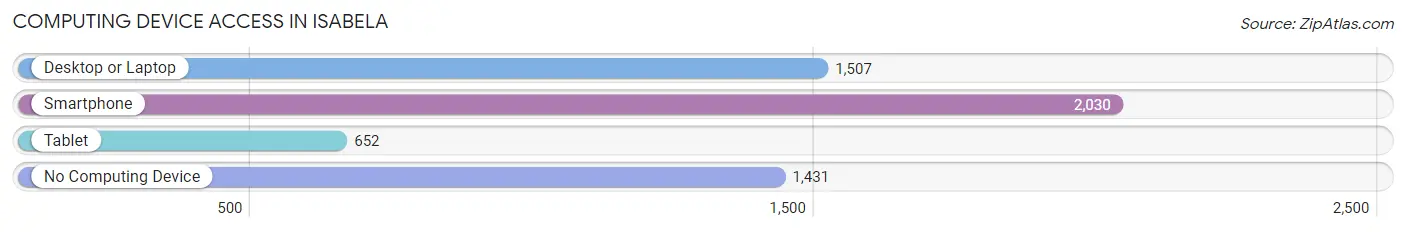
| Device Type | # Households | % Households |
| Desktop or Laptop | 1,507 | 39.7% |
| Smartphone | 2,030 | 53.4% |
| Tablet | 652 | 17.2% |
| No Computing Device | 1,431 | 37.7% |
| Total | 3,801 | 100.0% |
Internet Access in Isabela
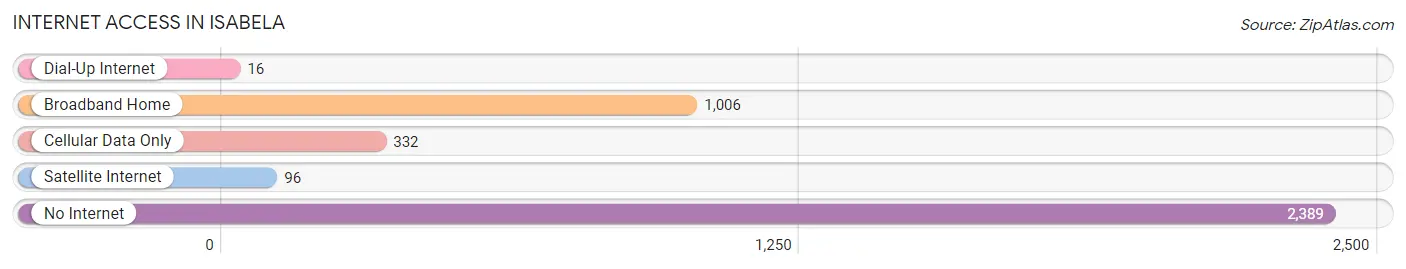
| Internet Type | # Households | % Households |
| Dial-Up Internet | 16 | 0.4% |
| Broadband Home | 1,006 | 26.5% |
| Cellular Data Only | 332 | 8.7% |
| Satellite Internet | 96 | 2.5% |
| No Internet | 2,389 | 62.8% |
| Total | 3,801 | 100.0% |
Isabela Summary
Isabela is a municipality located in the northwest region of Puerto Rico. It is part of the San Juan-Caguas-Guaynabo Metropolitan Statistical Area. The town is bordered by the municipalities of Quebradillas to the north, San Sebastián to the east, and Aguadilla to the west. The Atlantic Ocean lies to the north of Isabela.
History
Isabela was founded in 1819 by Don Francisco de Sotomayor. It was named after Queen Isabella of Spain. The town was originally part of the municipality of Aguadilla, but it was separated in 1831. During the 19th century, Isabela was a small agricultural town, with its main crops being coffee, tobacco, and sugar cane.
In the early 20th century, Isabela began to develop as a tourist destination. The town was known for its beautiful beaches and its proximity to the nearby city of Aguadilla. In the 1950s, the town began to develop its economy further, with the construction of a new port and the development of the local fishing industry.
Geography
Isabela is located in the northwest region of Puerto Rico. It is bordered by the municipalities of Quebradillas to the north, San Sebastián to the east, and Aguadilla to the west. The Atlantic Ocean lies to the north of Isabela. The town has a total area of 39.2 square miles, of which 37.2 square miles is land and 2.0 square miles is water.
The terrain of Isabela is mostly flat, with some hills in the northern part of the municipality. The highest point in Isabela is Cerro de Punta, which has an elevation of 1,067 feet. The town is home to several rivers, including the Grande de Isabela, which is the longest river in Puerto Rico.
Economy
The economy of Isabela is largely based on tourism and agriculture. The town is home to several resorts and hotels, which attract tourists from all over the world. The local fishing industry is also an important part of the economy, with the town’s port being a major hub for the fishing industry in Puerto Rico.
Agriculture is also an important part of the economy, with the main crops being coffee, tobacco, and sugar cane. The town is also home to several manufacturing plants, which produce a variety of products, including electronics, pharmaceuticals, and food products.
Demographics
As of the 2010 census, Isabela had a population of 39,921. The population is mostly of Puerto Rican descent, with a small percentage of other ethnicities, including African, Asian, and European. The median age in Isabela is 37.7 years, and the median household income is $20,845.
The town is home to several churches, including the Iglesia de Nuestra Señora de la Candelaria, which is the oldest church in Isabela. The town also has several schools, including the University of Puerto Rico at Isabela, which offers a variety of degree programs.
Conclusion
Isabela is a municipality located in the northwest region of Puerto Rico. It was founded in 1819 and is bordered by the municipalities of Quebradillas to the north, San Sebastián to the east, and Aguadilla to the west. The town has a total area of 39.2 square miles, and its population is mostly of Puerto Rican descent. The economy of Isabela is largely based on tourism and agriculture, with the main crops being coffee, tobacco, and sugar cane. The town is also home to several churches, schools, and manufacturing plants.
Common Questions
What is Per Capita Income in Isabela?
Per Capita income in Isabela is $15,172.
What is the Median Family Income in Isabela?
Median Family Income in Isabela is $26,875.
What is the Median Household income in Isabela?
Median Household Income in Isabela is $18,616.
What is Income or Wage Gap in Isabela?
Income or Wage Gap in Isabela is 39.3%.
Women in Isabela earn 60.7 cents for every dollar earned by a man.
What is Family Income Deficit in Isabela?
Family Income Deficit in Isabela is $10,958.
Families that are below poverty line in Isabela earn $10,958 less on average than the poverty threshold level.
What is Inequality or Gini Index in Isabela?
Inequality or Gini Index in Isabela is 0.54.
What is the Total Population of Isabela?
Total Population of Isabela is 10,110.
What is the Total Male Population of Isabela?
Total Male Population of Isabela is 4,434.
What is the Total Female Population of Isabela?
Total Female Population of Isabela is 5,676.
What is the Ratio of Males per 100 Females in Isabela?
There are 78.12 Males per 100 Females in Isabela.
What is the Ratio of Females per 100 Males in Isabela?
There are 128.01 Females per 100 Males in Isabela.
What is the Median Population Age in Isabela?
Median Population Age in Isabela is 46.4 Years.
What is the Average Family Size in Isabela
Average Family Size in Isabela is 3.5 People.
What is the Average Household Size in Isabela
Average Household Size in Isabela is 2.6 People.
How Large is the Labor Force in Isabela?
There are 3,591 People in the Labor Forcein in Isabela.
What is the Percentage of People in the Labor Force in Isabela?
39.4% of People are in the Labor Force in Isabela.
What is the Unemployment Rate in Isabela?
Unemployment Rate in Isabela is 8.5%.