Carolina, PR Map & Demographics
Carolina Map
Carolina Overview
$19,522
PER CAPITA INCOME
$38,860
AVG FAMILY INCOME
$33,548
AVG HOUSEHOLD INCOME
9.5%
WAGE / INCOME GAP [ % ]
90.5¢/ $1
WAGE / INCOME GAP [ $ ]
$11,607
FAMILY INCOME DEFICIT
0.48
INEQUALITY / GINI INDEX
139,201
TOTAL POPULATION
62,812
MALE POPULATION
76,389
FEMALE POPULATION
82.23
MALES / 100 FEMALES
121.62
FEMALES / 100 MALES
44.3
MEDIAN AGE
3.0
AVG FAMILY SIZE
2.5
AVG HOUSEHOLD SIZE
63,330
LABOR FORCE [ PEOPLE ]
53.0%
PERCENT IN LABOR FORCE
13.5%
UNEMPLOYMENT RATE
Income in Carolina
Income Overview in Carolina
Per Capita Income in Carolina is $19,522, while median incomes of families and households are $38,860 and $33,548 respectively.
| Characteristic | Number | Measure |
| Per Capita Income | 139,201 | $19,522 |
| Median Family Income | 36,066 | $38,860 |
| Mean Family Income | 36,066 | $51,085 |
| Median Household Income | 56,654 | $33,548 |
| Mean Household Income | 56,654 | $45,401 |
| Income Deficit | 36,066 | $11,607 |
| Wage / Income Gap (%) | 139,201 | 9.55% |
| Wage / Income Gap ($) | 139,201 | 90.45¢ per $1 |
| Gini / Inequality Index | 139,201 | 0.48 |
Earnings by Sex in Carolina
Average Earnings in Carolina are $22,568, $23,850 for men and $21,573 for women, a difference of 9.6%.
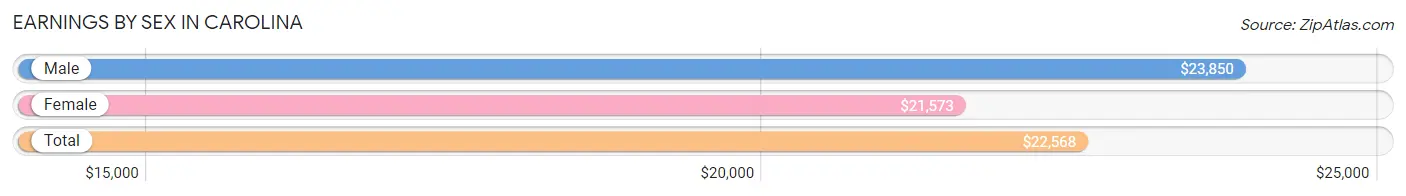
| Sex | Number | Average Earnings |
| Male | 29,783 (49.5%) | $23,850 |
| Female | 30,394 (50.5%) | $21,573 |
| Total | 60,177 (100.0%) | $22,568 |
Earnings by Sex by Income Bracket in Carolina
The most common earnings brackets in Carolina are $25,000 to $29,999 for men (3,041 | 10.2%) and $25,000 to $29,999 for women (3,270 | 10.8%).
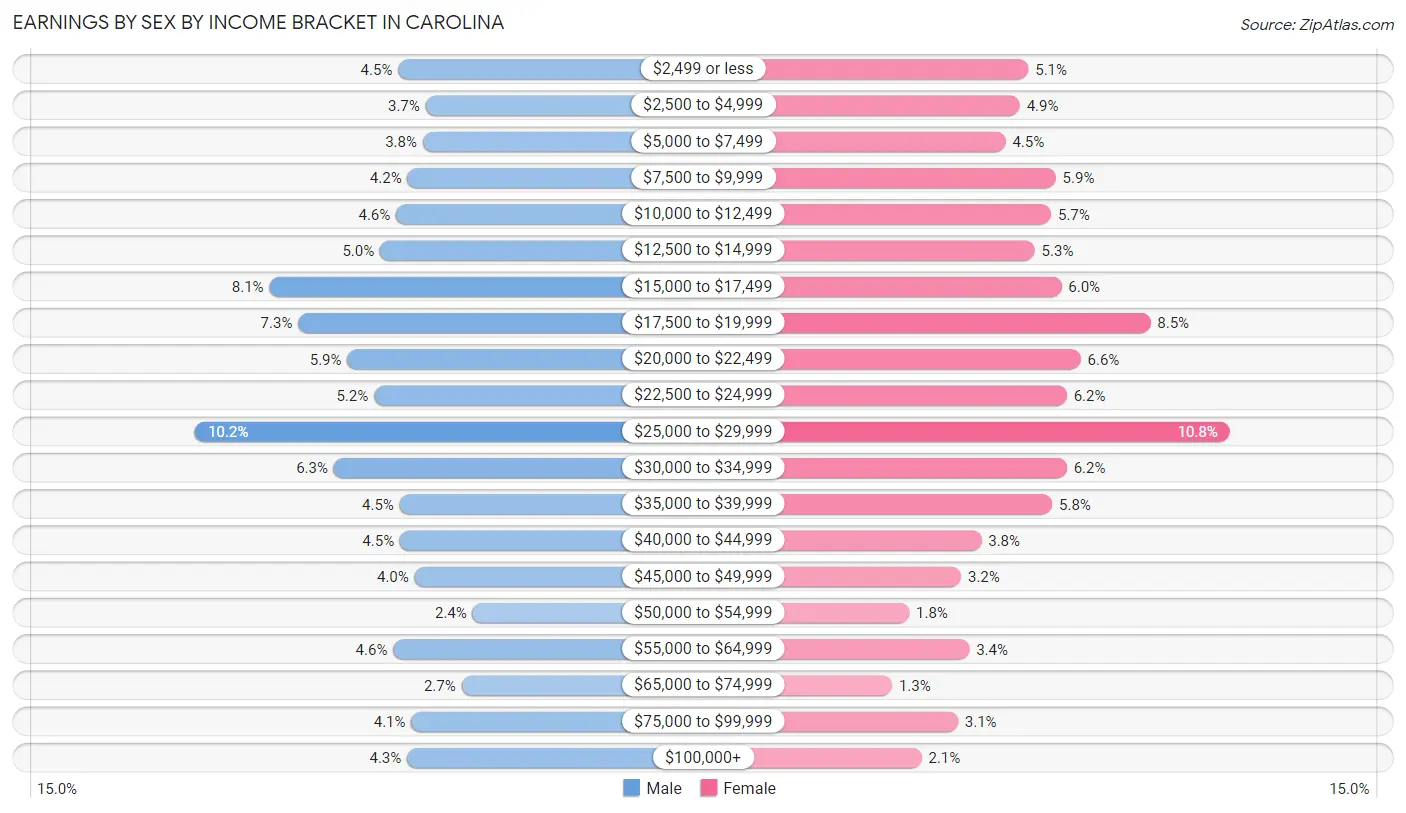
| Income | Male | Female |
| $2,499 or less | 1,339 (4.5%) | 1,549 (5.1%) |
| $2,500 to $4,999 | 1,110 (3.7%) | 1,478 (4.9%) |
| $5,000 to $7,499 | 1,135 (3.8%) | 1,355 (4.5%) |
| $7,500 to $9,999 | 1,263 (4.2%) | 1,784 (5.9%) |
| $10,000 to $12,499 | 1,357 (4.6%) | 1,745 (5.7%) |
| $12,500 to $14,999 | 1,493 (5.0%) | 1,605 (5.3%) |
| $15,000 to $17,499 | 2,418 (8.1%) | 1,832 (6.0%) |
| $17,500 to $19,999 | 2,178 (7.3%) | 2,593 (8.5%) |
| $20,000 to $22,499 | 1,766 (5.9%) | 1,996 (6.6%) |
| $22,500 to $24,999 | 1,542 (5.2%) | 1,878 (6.2%) |
| $25,000 to $29,999 | 3,041 (10.2%) | 3,270 (10.8%) |
| $30,000 to $34,999 | 1,878 (6.3%) | 1,879 (6.2%) |
| $35,000 to $39,999 | 1,327 (4.5%) | 1,753 (5.8%) |
| $40,000 to $44,999 | 1,324 (4.4%) | 1,149 (3.8%) |
| $45,000 to $49,999 | 1,203 (4.0%) | 977 (3.2%) |
| $50,000 to $54,999 | 719 (2.4%) | 532 (1.8%) |
| $55,000 to $64,999 | 1,382 (4.6%) | 1,047 (3.4%) |
| $65,000 to $74,999 | 810 (2.7%) | 386 (1.3%) |
| $75,000 to $99,999 | 1,231 (4.1%) | 948 (3.1%) |
| $100,000+ | 1,267 (4.3%) | 638 (2.1%) |
| Total | 29,783 (100.0%) | 30,394 (100.0%) |
Earnings by Sex by Educational Attainment in Carolina
Average earnings in Carolina are $25,815 for men and $23,318 for women, a difference of 9.7%. Men with an educational attainment of graduate degree enjoy the highest average annual earnings of $45,079, while those with less than high school education earn the least with $16,396. Women with an educational attainment of graduate degree earn the most with the average annual earnings of $39,297, while those with less than high school education have the smallest earnings of $12,681.
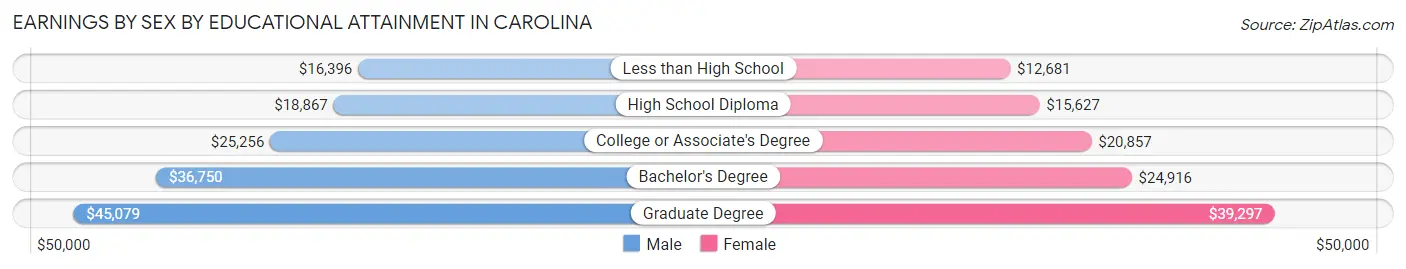
| Educational Attainment | Male Income | Female Income |
| Less than High School | $16,396 | $12,681 |
| High School Diploma | $18,867 | $15,627 |
| College or Associate's Degree | $25,256 | $20,857 |
| Bachelor's Degree | $36,750 | $24,916 |
| Graduate Degree | $45,079 | $39,297 |
| Total | $25,815 | $23,318 |
Family Income in Carolina
Family Income Brackets in Carolina
According to the Carolina family income data, there are 6,600 families falling into the $35,000 to $49,999 income range, which is the most common income bracket and makes up 18.3% of all families. Conversely, the $200,000+ income bracket is the least frequent group with only 613 families (1.7%) belonging to this category.
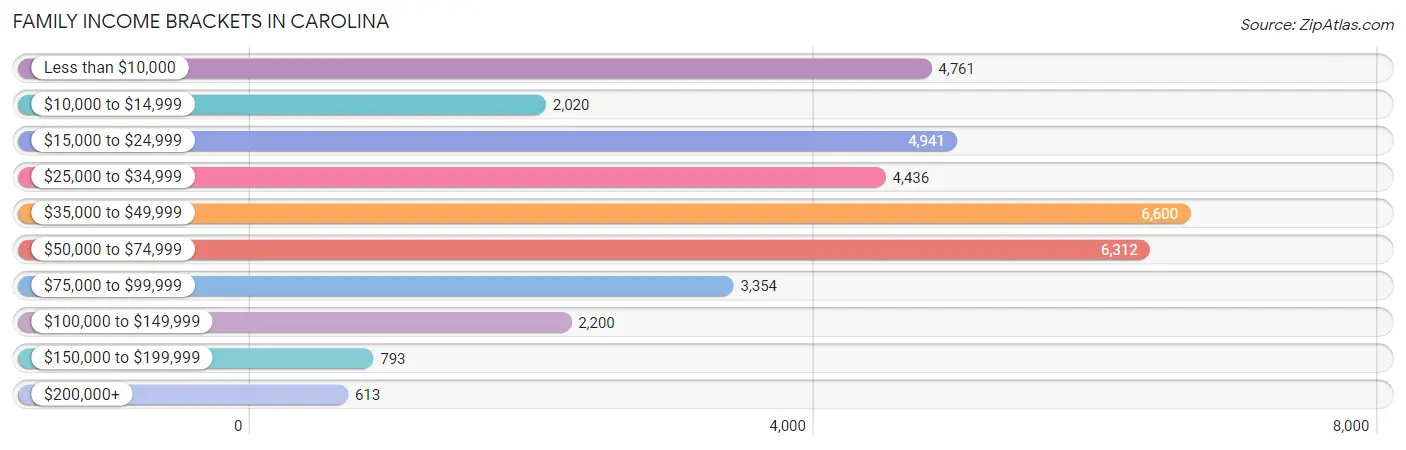
| Income Bracket | # Families | % Families |
| Less than $10,000 | 4,761 | 13.2% |
| $10,000 to $14,999 | 2,020 | 5.6% |
| $15,000 to $24,999 | 4,941 | 13.7% |
| $25,000 to $34,999 | 4,436 | 12.3% |
| $35,000 to $49,999 | 6,600 | 18.3% |
| $50,000 to $74,999 | 6,312 | 17.5% |
| $75,000 to $99,999 | 3,354 | 9.3% |
| $100,000 to $149,999 | 2,200 | 6.1% |
| $150,000 to $199,999 | 793 | 2.2% |
| $200,000+ | 613 | 1.7% |
Family Income by Famaliy Size in Carolina
4-person families (5,107 | 14.2%) account for the highest median family income in Carolina with $53,323 per family, while 2-person families (18,277 | 50.7%) have the highest median income of $17,091 per family member.
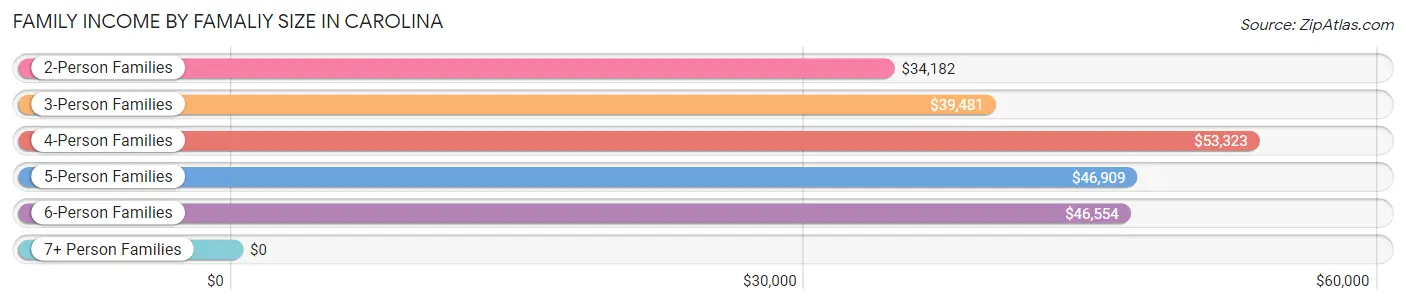
| Income Bracket | # Families | Median Income |
| 2-Person Families | 18,277 (50.7%) | $34,182 |
| 3-Person Families | 10,310 (28.6%) | $39,481 |
| 4-Person Families | 5,107 (14.2%) | $53,323 |
| 5-Person Families | 1,783 (4.9%) | $46,909 |
| 6-Person Families | 458 (1.3%) | $46,554 |
| 7+ Person Families | 131 (0.4%) | $0 |
| Total | 36,066 (100.0%) | $38,860 |
Family Income by Number of Earners in Carolina
The median family income in Carolina is $38,860, with families comprising 3+ earners (2,325) having the highest median family income of $70,024, while families with no earners (10,750) have the lowest median family income of $20,190, accounting for 6.5% and 29.8% of families, respectively.
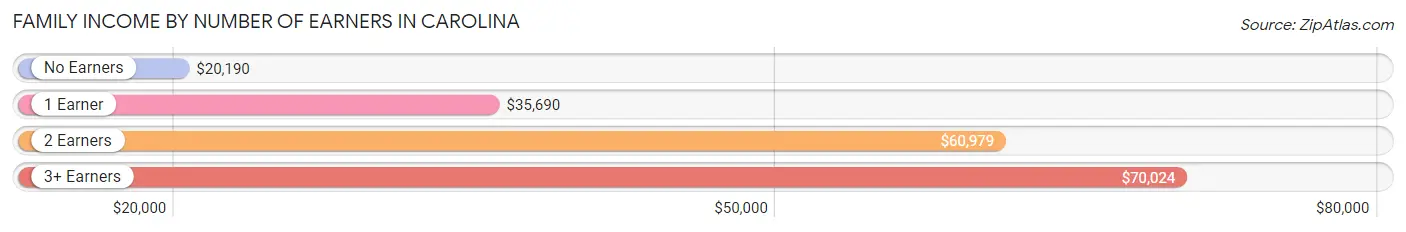
| Number of Earners | # Families | Median Income |
| No Earners | 10,750 (29.8%) | $20,190 |
| 1 Earner | 13,801 (38.3%) | $35,690 |
| 2 Earners | 9,190 (25.5%) | $60,979 |
| 3+ Earners | 2,325 (6.5%) | $70,024 |
| Total | 36,066 (100.0%) | $38,860 |
Household Income in Carolina
Household Income Brackets in Carolina
With 9,235 households falling in the category, the $35,000 to $49,999 income range is the most frequent in Carolina, accounting for 16.3% of all households. In contrast, only 793 households (1.4%) fall into the $200,000+ income bracket, making it the least populous group.
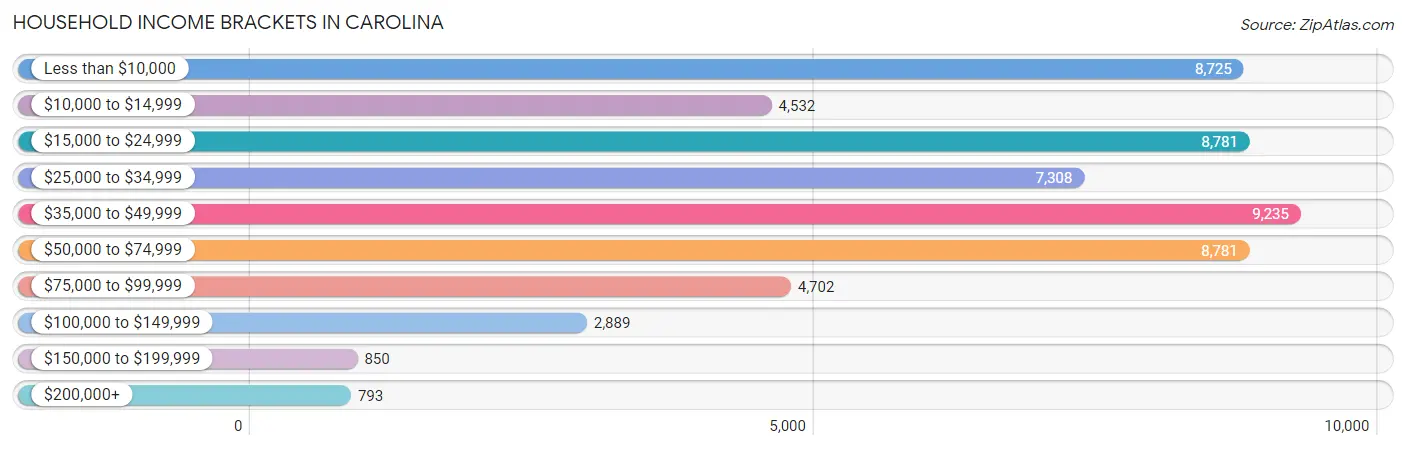
| Income Bracket | # Households | % Households |
| Less than $10,000 | 8,725 | 15.4% |
| $10,000 to $14,999 | 4,532 | 8.0% |
| $15,000 to $24,999 | 8,781 | 15.5% |
| $25,000 to $34,999 | 7,308 | 12.9% |
| $35,000 to $49,999 | 9,235 | 16.3% |
| $50,000 to $74,999 | 8,781 | 15.5% |
| $75,000 to $99,999 | 4,702 | 8.3% |
| $100,000 to $149,999 | 2,889 | 5.1% |
| $150,000 to $199,999 | 850 | 1.5% |
| $200,000+ | 793 | 1.4% |
Household Income by Householder Age in Carolina
The median household income in Carolina is $33,548, with the highest median household income of $40,561 found in the 45 to 64 years age bracket for the primary householder. A total of 20,577 households (36.3%) fall into this category. Meanwhile, the 15 to 24 years age bracket for the primary householder has the lowest median household income of $23,533, with 909 households (1.6%) in this group.
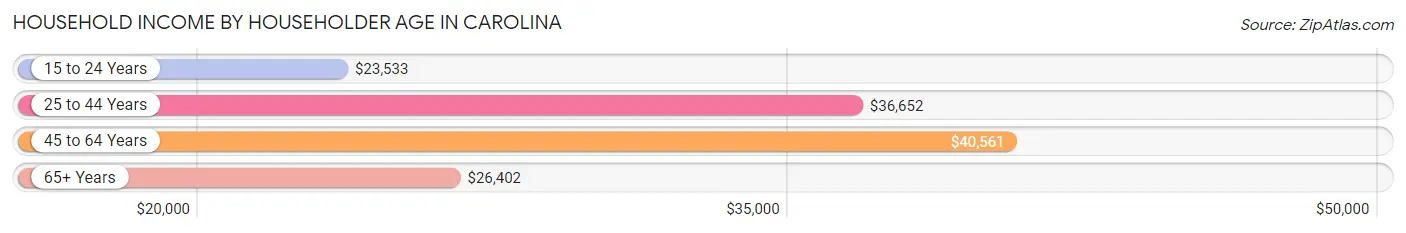
| Income Bracket | # Households | Median Income |
| 15 to 24 Years | 909 (1.6%) | $23,533 |
| 25 to 44 Years | 14,142 (25.0%) | $36,652 |
| 45 to 64 Years | 20,577 (36.3%) | $40,561 |
| 65+ Years | 21,026 (37.1%) | $26,402 |
| Total | 56,654 (100.0%) | $33,548 |
Poverty in Carolina
Income Below Poverty by Sex and Age in Carolina
With 26.9% poverty level for males and 33.7% for females among the residents of Carolina, 6 to 11 year old males and 16 and 17 year old females are the most vulnerable to poverty, with 1,974 males (50.2%) and 677 females (51.4%) in their respective age groups living below the poverty level.
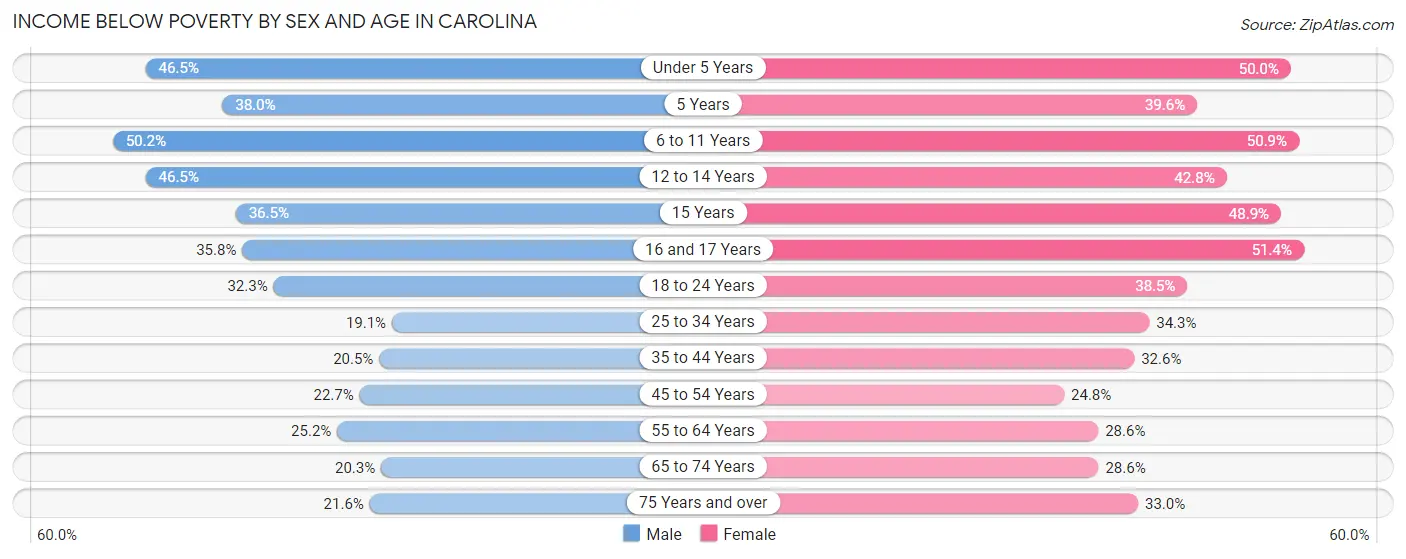
| Age Bracket | Male | Female |
| Under 5 Years | 1,074 (46.5%) | 1,224 (50.0%) |
| 5 Years | 177 (38.0%) | 214 (39.6%) |
| 6 to 11 Years | 1,974 (50.2%) | 2,038 (50.9%) |
| 12 to 14 Years | 1,003 (46.5%) | 903 (42.8%) |
| 15 Years | 201 (36.5%) | 491 (48.9%) |
| 16 and 17 Years | 658 (35.8%) | 677 (51.4%) |
| 18 to 24 Years | 2,028 (32.3%) | 2,523 (38.5%) |
| 25 to 34 Years | 1,656 (19.1%) | 3,237 (34.3%) |
| 35 to 44 Years | 1,598 (20.5%) | 2,915 (32.6%) |
| 45 to 54 Years | 1,853 (22.7%) | 2,467 (24.8%) |
| 55 to 64 Years | 1,960 (25.2%) | 2,845 (28.6%) |
| 65 to 74 Years | 1,312 (20.3%) | 2,660 (28.6%) |
| 75 Years and over | 1,335 (21.6%) | 3,442 (33.0%) |
| Total | 16,829 (26.9%) | 25,636 (33.7%) |
Income Above Poverty by Sex and Age in Carolina
According to the poverty statistics in Carolina, males aged 25 to 34 years and females aged 45 to 54 years are the age groups that are most secure financially, with 80.9% of males and 75.2% of females in these age groups living above the poverty line.
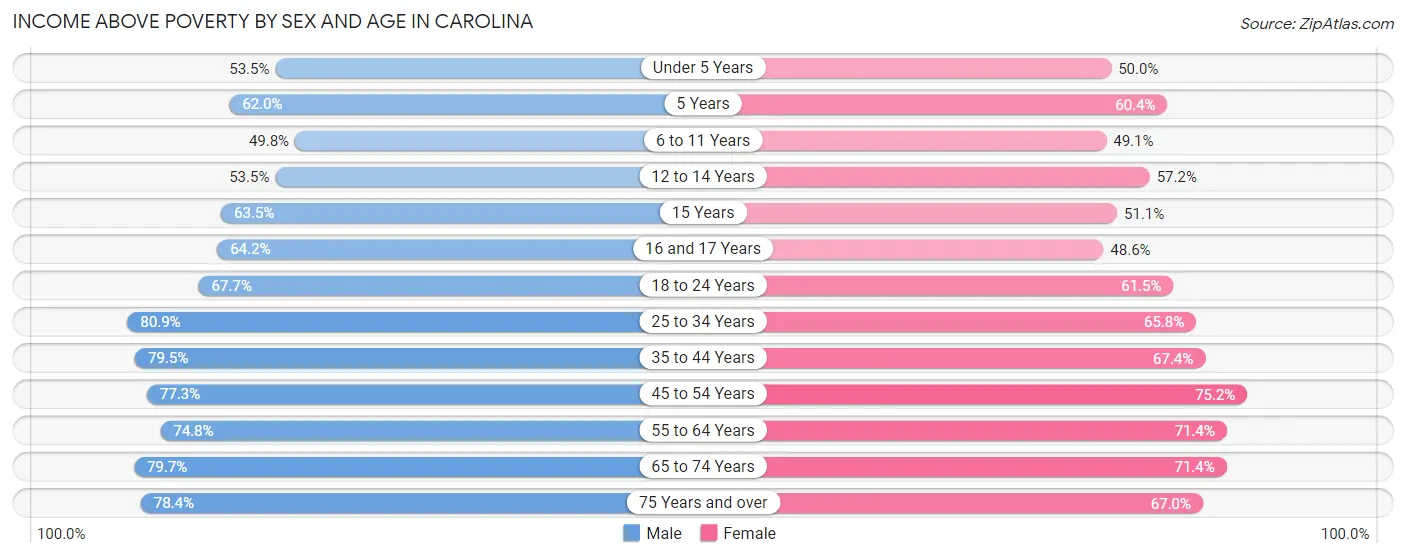
| Age Bracket | Male | Female |
| Under 5 Years | 1,234 (53.5%) | 1,224 (50.0%) |
| 5 Years | 289 (62.0%) | 327 (60.4%) |
| 6 to 11 Years | 1,960 (49.8%) | 1,966 (49.1%) |
| 12 to 14 Years | 1,153 (53.5%) | 1,205 (57.2%) |
| 15 Years | 350 (63.5%) | 513 (51.1%) |
| 16 and 17 Years | 1,182 (64.2%) | 639 (48.6%) |
| 18 to 24 Years | 4,255 (67.7%) | 4,034 (61.5%) |
| 25 to 34 Years | 7,017 (80.9%) | 6,214 (65.7%) |
| 35 to 44 Years | 6,195 (79.5%) | 6,035 (67.4%) |
| 45 to 54 Years | 6,309 (77.3%) | 7,497 (75.2%) |
| 55 to 64 Years | 5,820 (74.8%) | 7,115 (71.4%) |
| 65 to 74 Years | 5,150 (79.7%) | 6,644 (71.4%) |
| 75 Years and over | 4,855 (78.4%) | 6,992 (67.0%) |
| Total | 45,769 (73.1%) | 50,405 (66.3%) |
Income Below Poverty Among Married-Couple Families in Carolina
The poverty statistics for married-couple families in Carolina show that 14.1% or 2,477 of the total 17,612 families live below the poverty line. Families with 5 or more children have the highest poverty rate of 100.0%, comprising of 23 families. On the other hand, families with no children have the lowest poverty rate of 13.5%, which includes 1,694 families.
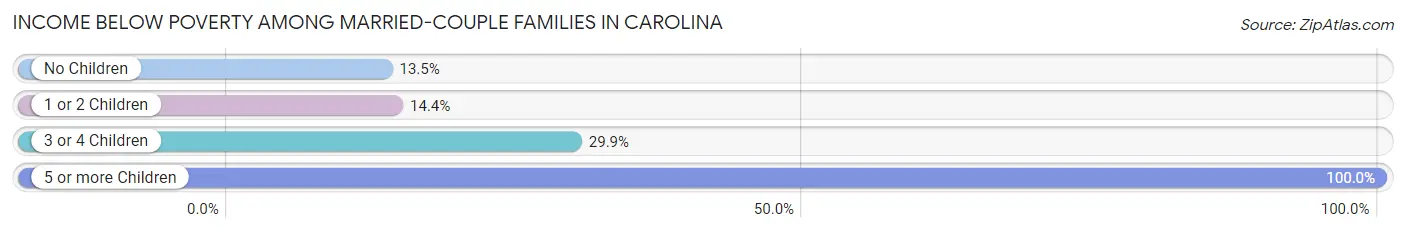
| Children | Above Poverty | Below Poverty |
| No Children | 10,903 (86.6%) | 1,694 (13.5%) |
| 1 or 2 Children | 4,040 (85.6%) | 678 (14.4%) |
| 3 or 4 Children | 192 (70.1%) | 82 (29.9%) |
| 5 or more Children | 0 (0.0%) | 23 (100.0%) |
| Total | 15,135 (85.9%) | 2,477 (14.1%) |
Income Below Poverty Among Single-Parent Households in Carolina
According to the poverty data in Carolina, 30.7% or 1,088 single-father households and 44.1% or 6,570 single-mother households are living below the poverty line. Among single-father households, those with 3 or 4 children have the highest poverty rate, with 96 households (67.6%) experiencing poverty. Likewise, among single-mother households, those with 5 or more children have the highest poverty rate, with 38 households (84.4%) falling below the poverty line.
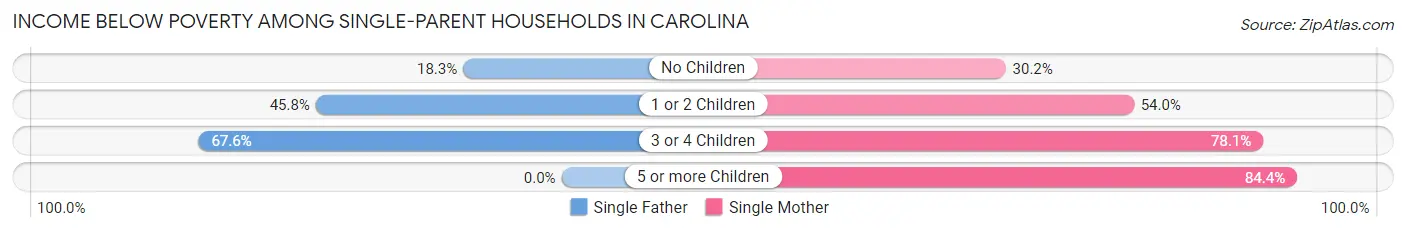
| Children | Single Father | Single Mother |
| No Children | 379 (18.3%) | 2,141 (30.2%) |
| 1 or 2 Children | 613 (45.8%) | 3,748 (54.0%) |
| 3 or 4 Children | 96 (67.6%) | 643 (78.1%) |
| 5 or more Children | 0 (0.0%) | 38 (84.4%) |
| Total | 1,088 (30.7%) | 6,570 (44.1%) |
Income Below Poverty Among Married-Couple vs Single-Parent Households in Carolina
The poverty data for Carolina shows that 2,477 of the married-couple family households (14.1%) and 7,658 of the single-parent households (41.5%) are living below the poverty level. Within the married-couple family households, those with 5 or more children have the highest poverty rate, with 23 households (100.0%) falling below the poverty line. Among the single-parent households, those with 5 or more children have the highest poverty rate, with 38 household (84.4%) living below poverty.
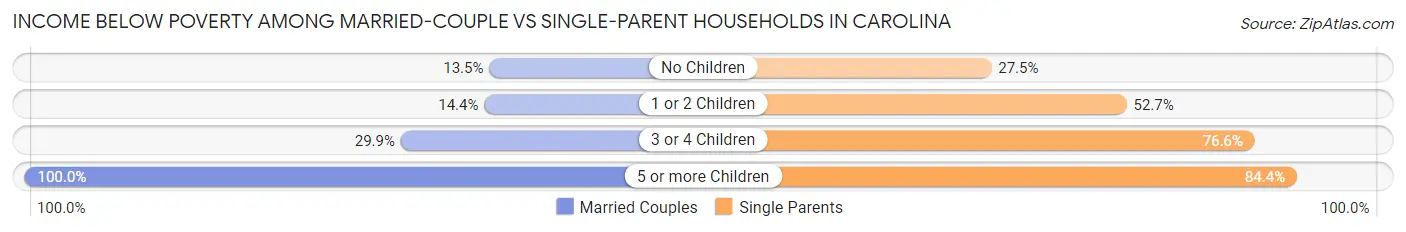
| Children | Married-Couple Families | Single-Parent Households |
| No Children | 1,694 (13.5%) | 2,520 (27.5%) |
| 1 or 2 Children | 678 (14.4%) | 4,361 (52.7%) |
| 3 or 4 Children | 82 (29.9%) | 739 (76.6%) |
| 5 or more Children | 23 (100.0%) | 38 (84.4%) |
| Total | 2,477 (14.1%) | 7,658 (41.5%) |
Race in Carolina
The most populous races in Carolina are Hispanic or Latino (137,398 | 98.7%), White / Caucasian (50,440 | 36.2%), and Some other Race (43,960 | 31.6%).
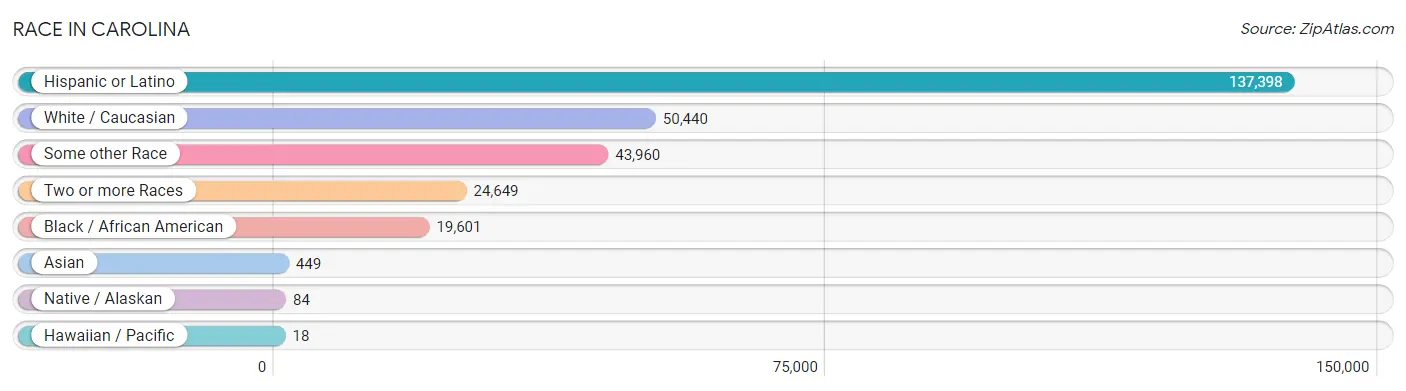
| Race | # Population | % Population |
| Asian | 449 | 0.3% |
| Black / African American | 19,601 | 14.1% |
| Hawaiian / Pacific | 18 | 0.0% |
| Hispanic or Latino | 137,398 | 98.7% |
| Native / Alaskan | 84 | 0.1% |
| White / Caucasian | 50,440 | 36.2% |
| Two or more Races | 24,649 | 17.7% |
| Some other Race | 43,960 | 31.6% |
| Total | 139,201 | 100.0% |
Ancestry in Carolina
The most populous ancestries reported in Carolina are Puerto Rican (126,999 | 91.2%), Dominican (6,993 | 5.0%), American (2,216 | 1.6%), Cuban (1,256 | 0.9%), and South American (1,056 | 0.8%), together accounting for 99.5% of all Carolina residents.
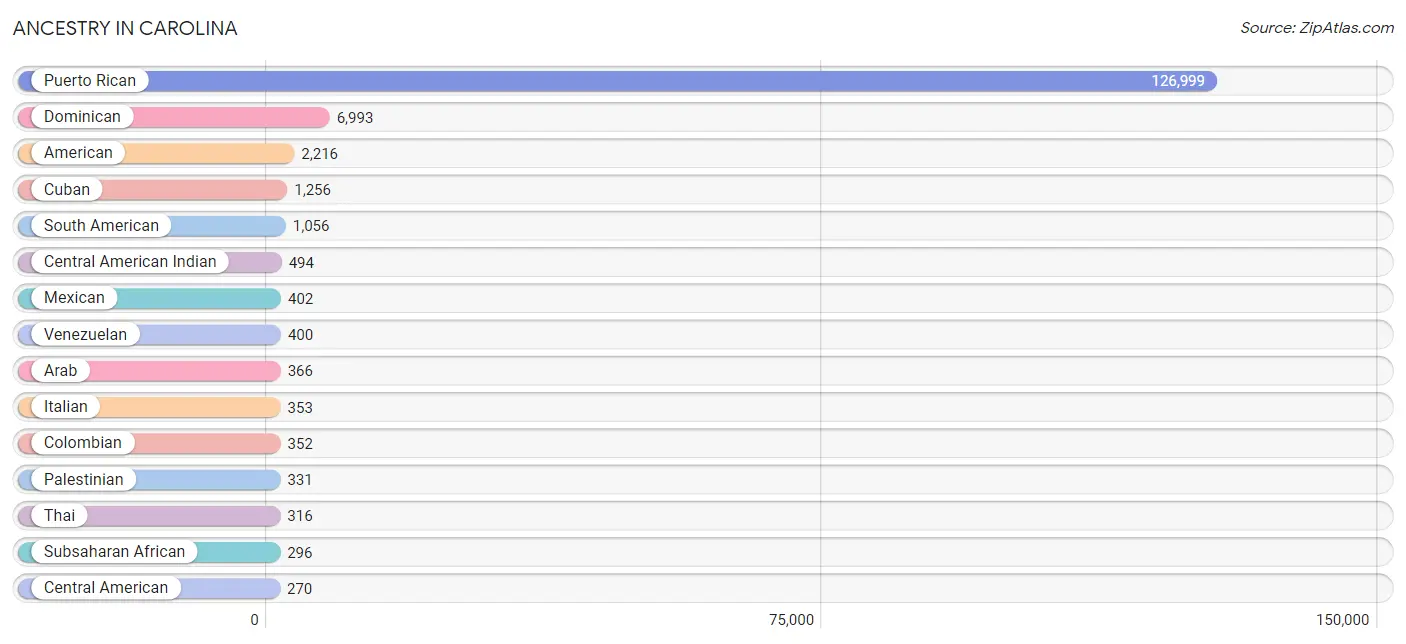
| Ancestry | # Population | % Population |
| African | 253 | 0.2% |
| American | 2,216 | 1.6% |
| Arab | 366 | 0.3% |
| Basque | 15 | 0.0% |
| Belgian | 16 | 0.0% |
| British | 89 | 0.1% |
| Burmese | 21 | 0.0% |
| Cape Verdean | 20 | 0.0% |
| Central American | 270 | 0.2% |
| Central American Indian | 494 | 0.4% |
| Chilean | 13 | 0.0% |
| Colombian | 352 | 0.3% |
| Costa Rican | 101 | 0.1% |
| Cuban | 1,256 | 0.9% |
| Dominican | 6,993 | 5.0% |
| Dutch West Indian | 31 | 0.0% |
| Ecuadorian | 114 | 0.1% |
| English | 142 | 0.1% |
| European | 54 | 0.0% |
| French | 29 | 0.0% |
| German | 125 | 0.1% |
| Haitian | 56 | 0.0% |
| Honduran | 67 | 0.1% |
| Indian (Asian) | 139 | 0.1% |
| Irish | 84 | 0.1% |
| Italian | 353 | 0.3% |
| Kenyan | 23 | 0.0% |
| Mexican | 402 | 0.3% |
| Native Hawaiian | 18 | 0.0% |
| Nicaraguan | 44 | 0.0% |
| Norwegian | 6 | 0.0% |
| Palestinian | 331 | 0.2% |
| Panamanian | 58 | 0.0% |
| Peruvian | 124 | 0.1% |
| Polish | 97 | 0.1% |
| Portuguese | 85 | 0.1% |
| Pueblo | 11 | 0.0% |
| Puerto Rican | 126,999 | 91.2% |
| Russian | 29 | 0.0% |
| Scottish | 29 | 0.0% |
| South American | 1,056 | 0.8% |
| Spaniard | 137 | 0.1% |
| Spanish American Indian | 93 | 0.1% |
| Sri Lankan | 37 | 0.0% |
| Subsaharan African | 296 | 0.2% |
| Swedish | 9 | 0.0% |
| Syrian | 13 | 0.0% |
| Thai | 316 | 0.2% |
| Uruguayan | 53 | 0.0% |
| Venezuelan | 400 | 0.3% |
| Welsh | 1 | 0.0% |
| West Indian | 218 | 0.2% | View All 52 Rows |
Immigrants in Carolina

| Immigration Origin | # Population | % Population | View All 0 Rows |
Sex and Age in Carolina
Sex and Age in Carolina
The most populous age groups in Carolina are 25 to 29 Years (4,759 | 7.6%) for men and 50 to 54 Years (5,115 | 6.7%) for women.
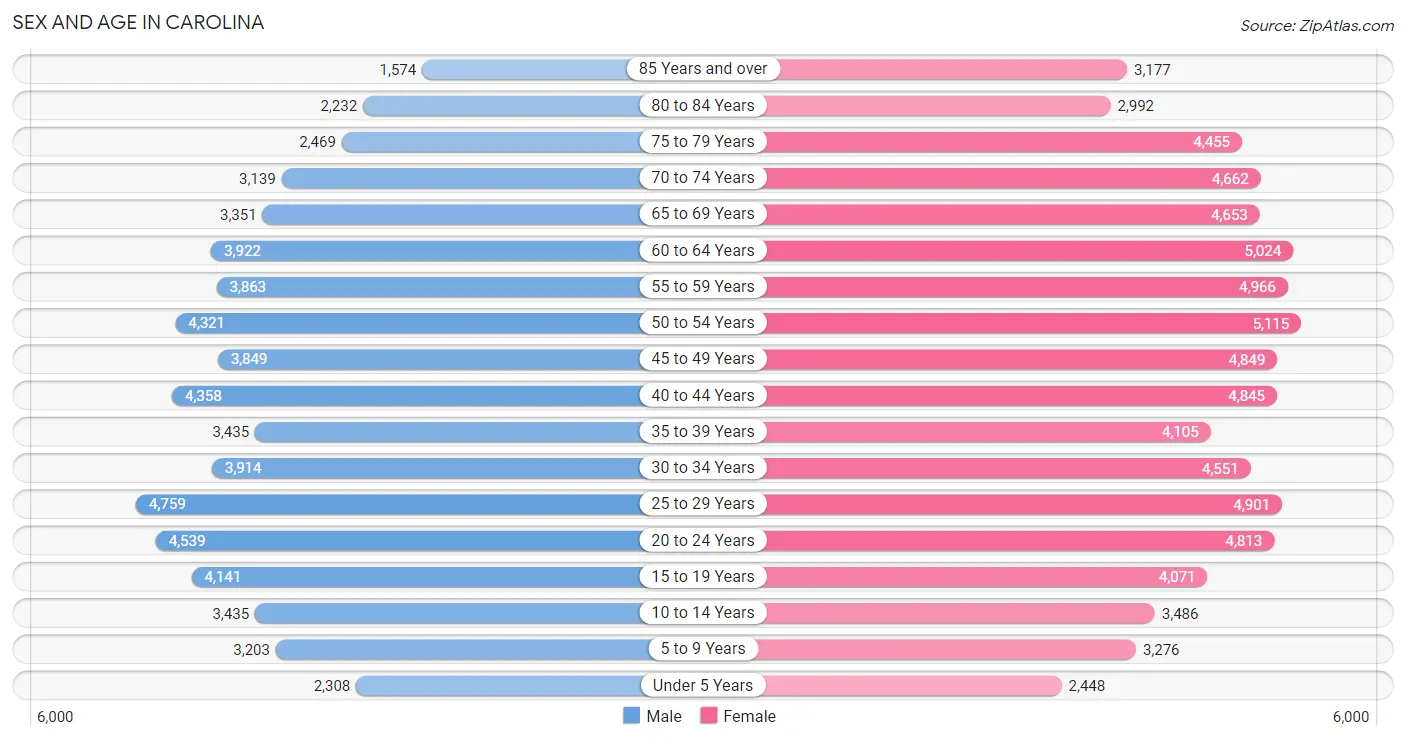
| Age Bracket | Male | Female |
| Under 5 Years | 2,308 (3.7%) | 2,448 (3.2%) |
| 5 to 9 Years | 3,203 (5.1%) | 3,276 (4.3%) |
| 10 to 14 Years | 3,435 (5.5%) | 3,486 (4.6%) |
| 15 to 19 Years | 4,141 (6.6%) | 4,071 (5.3%) |
| 20 to 24 Years | 4,539 (7.2%) | 4,813 (6.3%) |
| 25 to 29 Years | 4,759 (7.6%) | 4,901 (6.4%) |
| 30 to 34 Years | 3,914 (6.2%) | 4,551 (6.0%) |
| 35 to 39 Years | 3,435 (5.5%) | 4,105 (5.4%) |
| 40 to 44 Years | 4,358 (6.9%) | 4,845 (6.3%) |
| 45 to 49 Years | 3,849 (6.1%) | 4,849 (6.4%) |
| 50 to 54 Years | 4,321 (6.9%) | 5,115 (6.7%) |
| 55 to 59 Years | 3,863 (6.1%) | 4,966 (6.5%) |
| 60 to 64 Years | 3,922 (6.2%) | 5,024 (6.6%) |
| 65 to 69 Years | 3,351 (5.3%) | 4,653 (6.1%) |
| 70 to 74 Years | 3,139 (5.0%) | 4,662 (6.1%) |
| 75 to 79 Years | 2,469 (3.9%) | 4,455 (5.8%) |
| 80 to 84 Years | 2,232 (3.5%) | 2,992 (3.9%) |
| 85 Years and over | 1,574 (2.5%) | 3,177 (4.2%) |
| Total | 62,812 (100.0%) | 76,389 (100.0%) |
Families and Households in Carolina
Median Family Size in Carolina
The median family size in Carolina is 3.05 persons per family, with single female/mother families (14,905 | 41.3%) accounting for the largest median family size of 3.12 persons per family. On the other hand, single male/father families (3,549 | 9.8%) represent the smallest median family size with 2.70 persons per family.
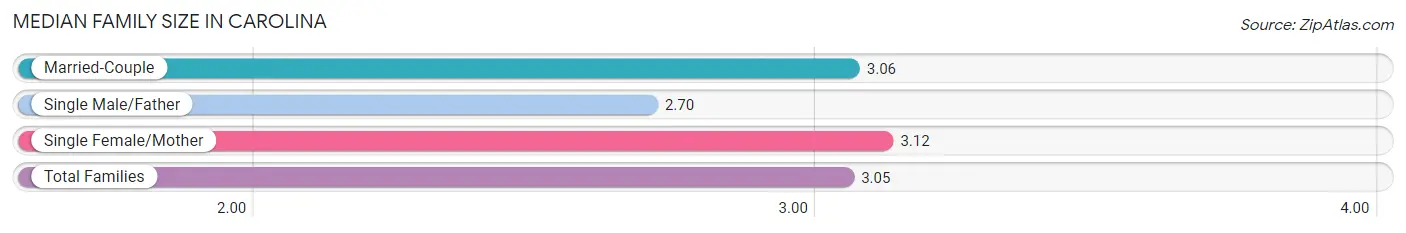
| Family Type | # Families | Family Size |
| Married-Couple | 17,612 (48.8%) | 3.06 |
| Single Male/Father | 3,549 (9.8%) | 2.70 |
| Single Female/Mother | 14,905 (41.3%) | 3.12 |
| Total Families | 36,066 (100.0%) | 3.05 |
Median Household Size in Carolina
The median household size in Carolina is 2.45 persons per household, with single female/mother households (14,905 | 26.3%) accounting for the largest median household size of 3.28 persons per household. non-family households (20,588 | 36.3%) represent the smallest median household size with 1.19 persons per household.
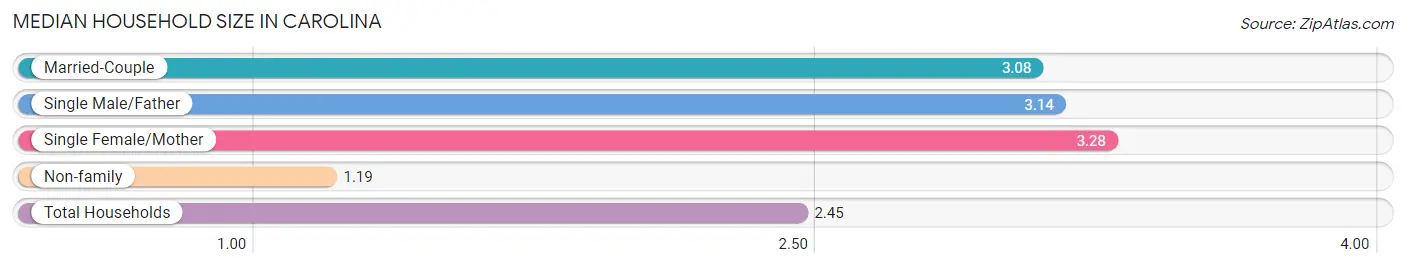
| Household Type | # Households | Household Size |
| Married-Couple | 17,612 (31.1%) | 3.08 |
| Single Male/Father | 3,549 (6.3%) | 3.14 |
| Single Female/Mother | 14,905 (26.3%) | 3.28 |
| Non-family | 20,588 (36.3%) | 1.19 |
| Total Households | 56,654 (100.0%) | 2.45 |
Household Size by Marriage Status in Carolina
Out of a total of 56,654 households in Carolina, 36,066 (63.7%) are family households, while 20,588 (36.3%) are nonfamily households. The most numerous type of family households are 2-person households, comprising 16,340, and the most common type of nonfamily households are 1-person households, comprising 17,169.
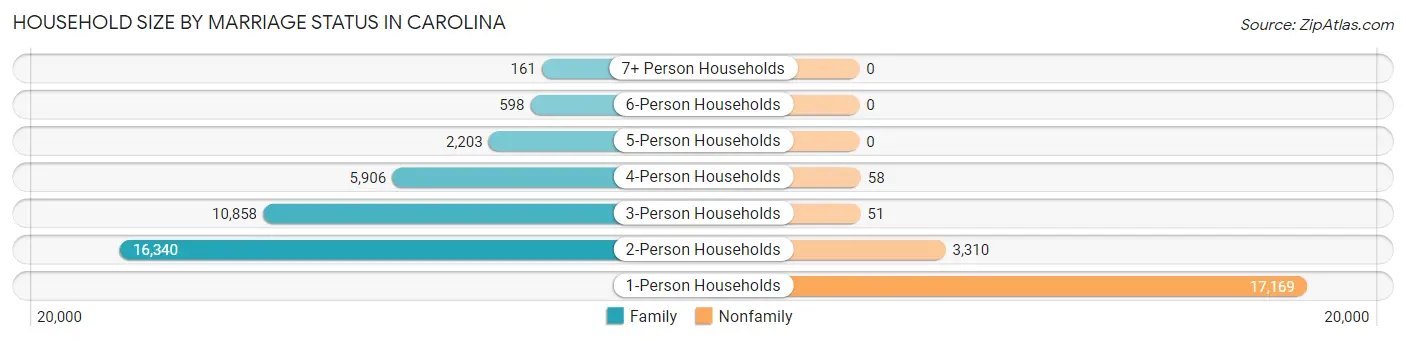
| Household Size | Family Households | Nonfamily Households |
| 1-Person Households | - | 17,169 (30.3%) |
| 2-Person Households | 16,340 (28.8%) | 3,310 (5.8%) |
| 3-Person Households | 10,858 (19.2%) | 51 (0.1%) |
| 4-Person Households | 5,906 (10.4%) | 58 (0.1%) |
| 5-Person Households | 2,203 (3.9%) | 0 (0.0%) |
| 6-Person Households | 598 (1.1%) | 0 (0.0%) |
| 7+ Person Households | 161 (0.3%) | 0 (0.0%) |
| Total | 36,066 (63.7%) | 20,588 (36.3%) |
Female Fertility in Carolina
Fertility by Age in Carolina
Average fertility rate in Carolina is 26.0 births per 1,000 women. Women in the age bracket of 20 to 34 years have the highest fertility rate with 54.0 births per 1,000 women. Women in the age bracket of 20 to 34 years acount for 89.9% of all women with births.
| Age Bracket | Women with Births | Births / 1,000 Women |
| 15 to 19 years | 24 (2.8%) | 6.0 |
| 20 to 34 years | 766 (89.9%) | 54.0 |
| 35 to 50 years | 62 (7.3%) | 4.0 |
| Total | 852 (100.0%) | 26.0 |
Fertility by Age by Marriage Status in Carolina
38.6% of women with births (852) in Carolina are married. The highest percentage of unmarried women with births falls into 15 to 19 years age bracket with 100.0% of them unmarried at the time of birth, while the lowest percentage of unmarried women with births belong to 35 to 50 years age bracket with 51.6% of them unmarried.
| Age Bracket | Married | Unmarried |
| 15 to 19 years | 0 (0.0%) | 24 (100.0%) |
| 20 to 34 years | 299 (39.0%) | 467 (61.0%) |
| 35 to 50 years | 30 (48.4%) | 32 (51.6%) |
| Total | 329 (38.6%) | 523 (61.4%) |
Fertility by Education in Carolina
Average fertility rate in Carolina is 26.0 births per 1,000 women. Women with the education attainment of graduate degree have the highest fertility rate of 37.0 births per 1,000 women, while women with the education attainment of less than high school have the lowest fertility at 8.0 births per 1,000 women. Women with the education attainment of college or associate's degree represent 38.4% of all women with births.
| Educational Attainment | Women with Births | Births / 1,000 Women |
| Less than High School | 28 (3.3%) | 8.0 |
| High School Diploma | 125 (14.7%) | 22.0 |
| College or Associate's Degree | 327 (38.4%) | 30.0 |
| Bachelor's Degree | 252 (29.6%) | 26.0 |
| Graduate Degree | 120 (14.1%) | 37.0 |
| Total | 852 (100.0%) | 26.0 |
Fertility by Education by Marriage Status in Carolina
61.4% of women with births in Carolina are unmarried. Women with the educational attainment of bachelor's degree are most likely to be married with 77.0% of them married at childbirth, while women with the educational attainment of less than high school are least likely to be married with 100.0% of them unmarried at childbirth.
| Educational Attainment | Married | Unmarried |
| Less than High School | 0 (0.0%) | 28 (100.0%) |
| High School Diploma | 38 (30.4%) | 87 (69.6%) |
| College or Associate's Degree | 29 (8.9%) | 298 (91.1%) |
| Bachelor's Degree | 194 (77.0%) | 58 (23.0%) |
| Graduate Degree | 68 (56.7%) | 52 (43.3%) |
| Total | 329 (38.6%) | 523 (61.4%) |
Employment Characteristics in Carolina
Employment by Class of Employer in Carolina
Among the 52,279 employed individuals in Carolina, private company employees (33,598 | 64.3%), state government employees (5,541 | 10.6%), and self-employed (not incorporated) (4,794 | 9.2%) make up the most common classes of employment.
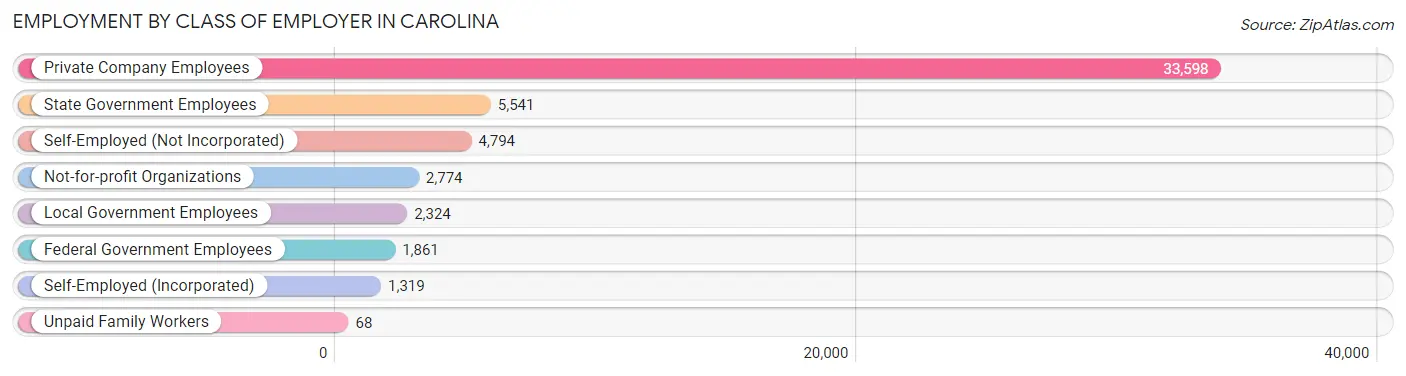
| Employer Class | # Employees | % Employees |
| Private Company Employees | 33,598 | 64.3% |
| Self-Employed (Incorporated) | 1,319 | 2.5% |
| Self-Employed (Not Incorporated) | 4,794 | 9.2% |
| Not-for-profit Organizations | 2,774 | 5.3% |
| Local Government Employees | 2,324 | 4.4% |
| State Government Employees | 5,541 | 10.6% |
| Federal Government Employees | 1,861 | 3.6% |
| Unpaid Family Workers | 68 | 0.1% |
| Total | 52,279 | 100.0% |
Employment Status by Age in Carolina
According to the labor force statistics for Carolina, out of the total population over 16 years of age (119,490), 53.0% or 63,330 individuals are in the labor force, with 13.5% or 8,550 of them unemployed. The age group with the highest labor force participation rate is 35 to 44 years, with 85.0% or 14,232 individuals in the labor force. Within the labor force, the 16 to 19 years age range has the highest percentage of unemployed individuals, with 43.1% or 554 of them being unemployed.
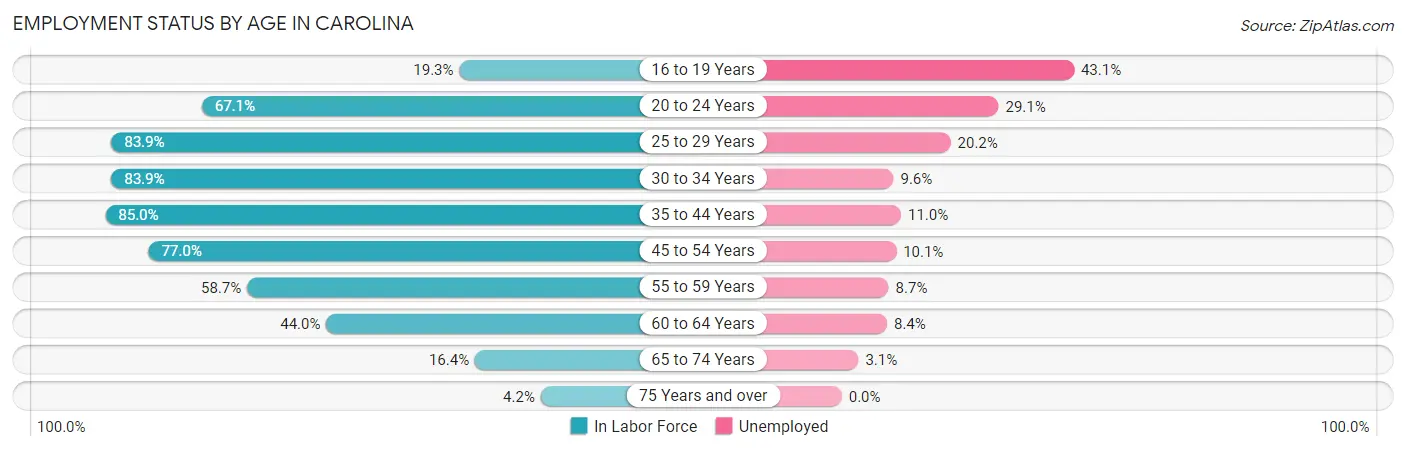
| Age Bracket | In Labor Force | Unemployed |
| 16 to 19 Years | 1,285 (19.3%) | 554 (43.1%) |
| 20 to 24 Years | 6,275 (67.1%) | 1,826 (29.1%) |
| 25 to 29 Years | 8,105 (83.9%) | 1,637 (20.2%) |
| 30 to 34 Years | 7,102 (83.9%) | 682 (9.6%) |
| 35 to 44 Years | 14,232 (85.0%) | 1,566 (11.0%) |
| 45 to 54 Years | 13,963 (77.0%) | 1,410 (10.1%) |
| 55 to 59 Years | 5,183 (58.7%) | 451 (8.7%) |
| 60 to 64 Years | 3,936 (44.0%) | 331 (8.4%) |
| 65 to 74 Years | 2,592 (16.4%) | 80 (3.1%) |
| 75 Years and over | 710 (4.2%) | 0 (0.0%) |
| Total | 63,330 (53.0%) | 8,550 (13.5%) |
Employment Status by Educational Attainment in Carolina
According to labor force statistics for Carolina, 74.2% of individuals (52,517) out of the total population between 25 and 64 years of age (70,777) are in the labor force, with 11.6% or 6,092 of them being unemployed. The group with the highest labor force participation rate are those with the educational attainment of bachelor's degree or higher, with 82.4% or 23,828 individuals in the labor force. Within the labor force, individuals with less than high school education have the highest percentage of unemployment, with 25.3% or 471 of them being unemployed.
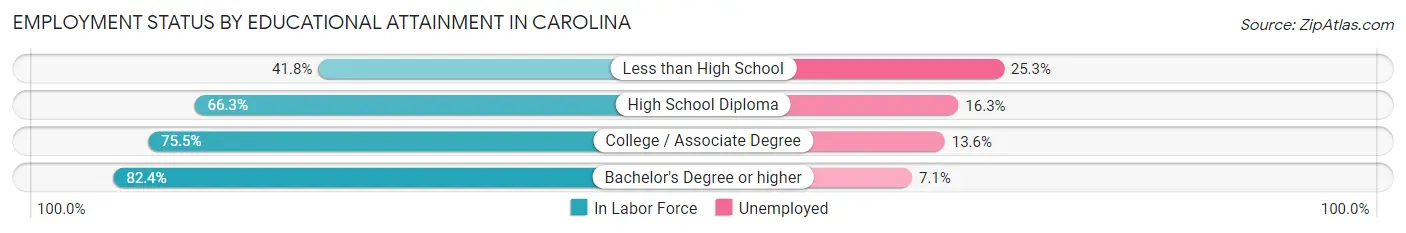
| Educational Attainment | In Labor Force | Unemployed |
| Less than High School | 1,863 (41.8%) | 1,128 (25.3%) |
| High School Diploma | 10,148 (66.3%) | 2,495 (16.3%) |
| College / Associate Degree | 16,682 (75.5%) | 3,005 (13.6%) |
| Bachelor's Degree or higher | 23,828 (82.4%) | 2,053 (7.1%) |
| Total | 52,517 (74.2%) | 8,210 (11.6%) |
Employment Occupations by Sex in Carolina
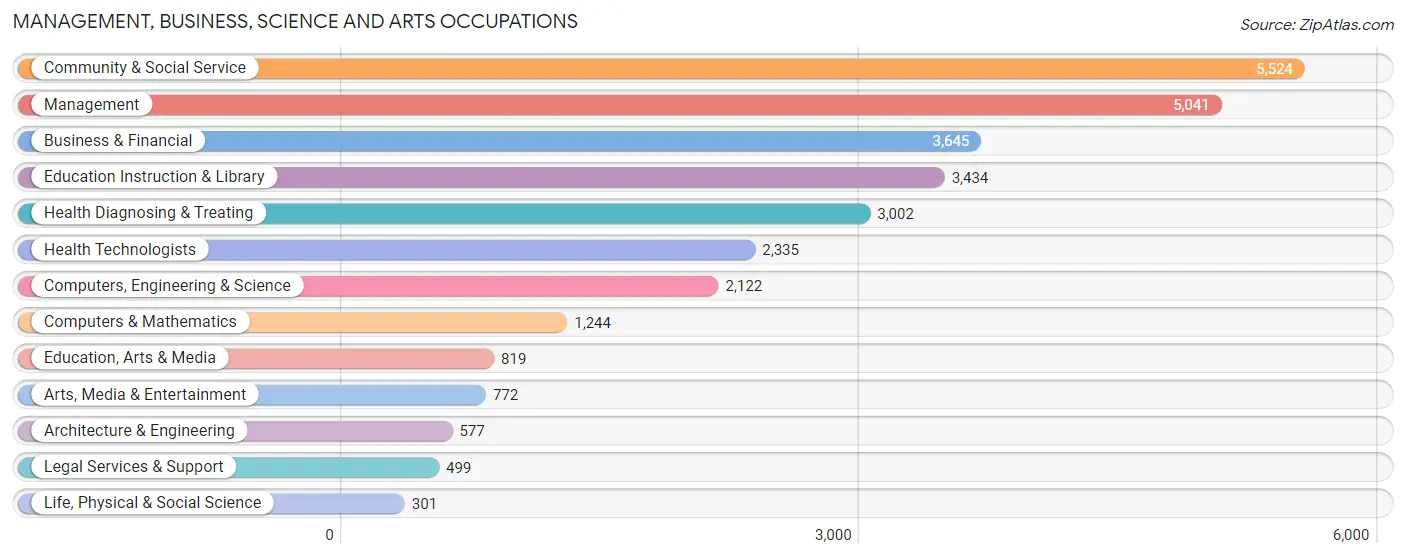
Management, Business, Science and Arts Occupations
The most common Management, Business, Science and Arts occupations in Carolina are Community & Social Service (5,524 | 10.1%), Management (5,041 | 9.2%), Business & Financial (3,645 | 6.7%), Education Instruction & Library (3,434 | 6.3%), and Health Diagnosing & Treating (3,002 | 5.5%).
Management, Business, Science and Arts Occupations by Sex
Within the Management, Business, Science and Arts occupations in Carolina, the most male-oriented occupations are Architecture & Engineering (70.5%), Arts, Media & Entertainment (67.7%), and Computers & Mathematics (67.4%), while the most female-oriented occupations are Health Technologists (80.9%), Health Diagnosing & Treating (78.2%), and Education Instruction & Library (73.6%).
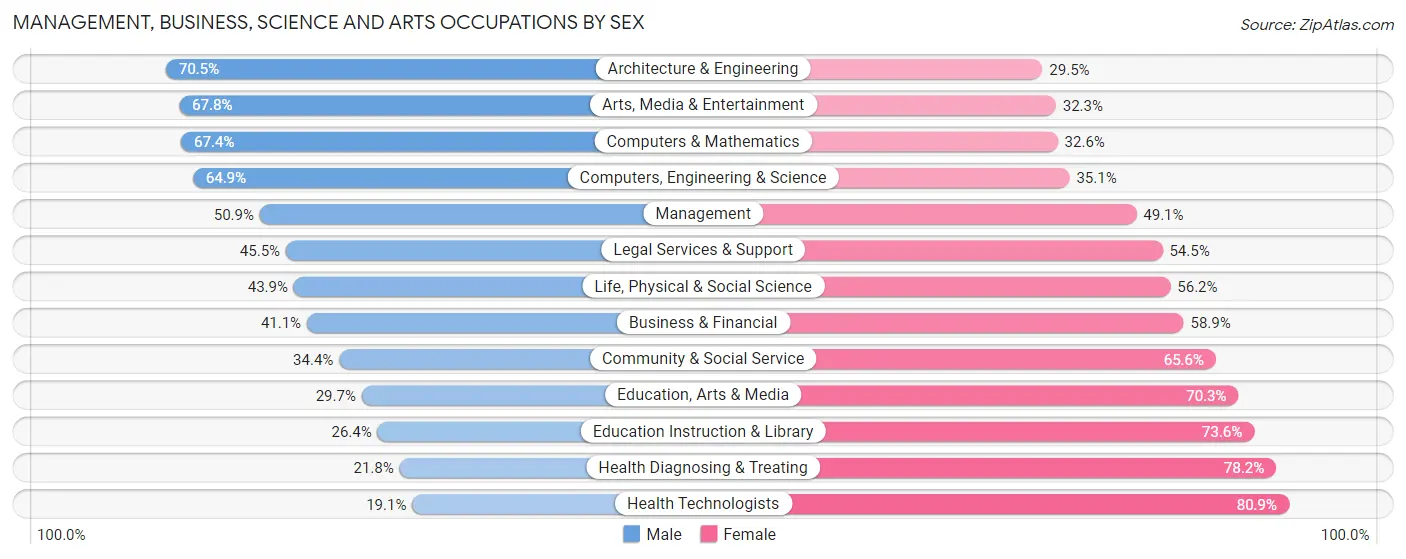
| Occupation | Male | Female |
| Management | 2,568 (50.9%) | 2,473 (49.1%) |
| Business & Financial | 1,498 (41.1%) | 2,147 (58.9%) |
| Computers, Engineering & Science | 1,377 (64.9%) | 745 (35.1%) |
| Computers & Mathematics | 838 (67.4%) | 406 (32.6%) |
| Architecture & Engineering | 407 (70.5%) | 170 (29.5%) |
| Life, Physical & Social Science | 132 (43.9%) | 169 (56.1%) |
| Community & Social Service | 1,899 (34.4%) | 3,625 (65.6%) |
| Education, Arts & Media | 243 (29.7%) | 576 (70.3%) |
| Legal Services & Support | 227 (45.5%) | 272 (54.5%) |
| Education Instruction & Library | 906 (26.4%) | 2,528 (73.6%) |
| Arts, Media & Entertainment | 523 (67.7%) | 249 (32.3%) |
| Health Diagnosing & Treating | 654 (21.8%) | 2,348 (78.2%) |
| Health Technologists | 447 (19.1%) | 1,888 (80.9%) |
| Total (Category) | 7,996 (41.4%) | 11,338 (58.6%) |
| Total (Overall) | 26,937 (49.3%) | 27,685 (50.7%) |
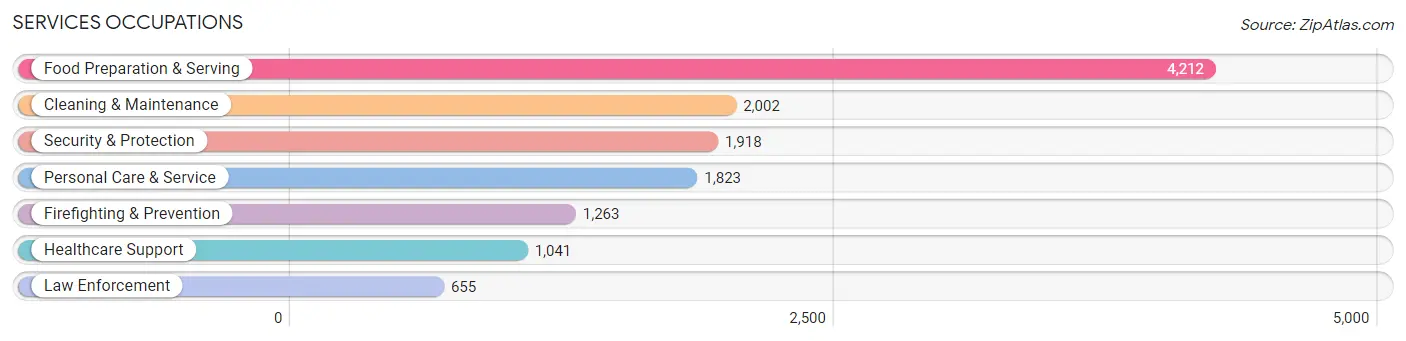
Services Occupations
The most common Services occupations in Carolina are Food Preparation & Serving (4,212 | 7.7%), Cleaning & Maintenance (2,002 | 3.7%), Security & Protection (1,918 | 3.5%), Personal Care & Service (1,823 | 3.3%), and Firefighting & Prevention (1,263 | 2.3%).
Services Occupations by Sex
Within the Services occupations in Carolina, the most male-oriented occupations are Firefighting & Prevention (73.2%), Security & Protection (72.5%), and Law Enforcement (71.2%), while the most female-oriented occupations are Healthcare Support (80.6%), Personal Care & Service (54.0%), and Food Preparation & Serving (45.4%).
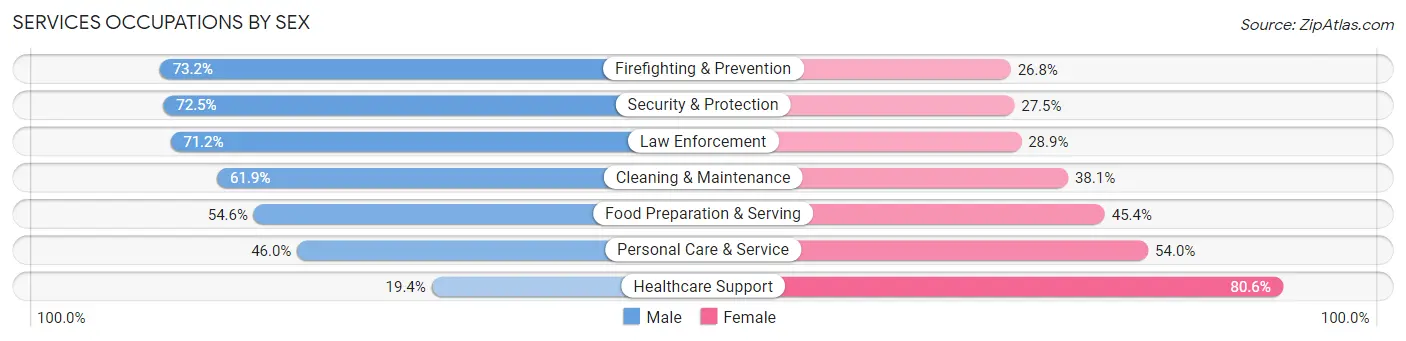
| Occupation | Male | Female |
| Healthcare Support | 202 (19.4%) | 839 (80.6%) |
| Security & Protection | 1,391 (72.5%) | 527 (27.5%) |
| Firefighting & Prevention | 925 (73.2%) | 338 (26.8%) |
| Law Enforcement | 466 (71.2%) | 189 (28.8%) |
| Food Preparation & Serving | 2,300 (54.6%) | 1,912 (45.4%) |
| Cleaning & Maintenance | 1,239 (61.9%) | 763 (38.1%) |
| Personal Care & Service | 839 (46.0%) | 984 (54.0%) |
| Total (Category) | 5,971 (54.3%) | 5,025 (45.7%) |
| Total (Overall) | 26,937 (49.3%) | 27,685 (50.7%) |
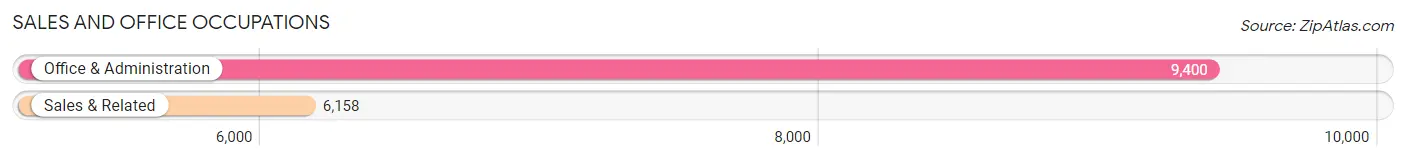
Sales and Office Occupations
The most common Sales and Office occupations in Carolina are Office & Administration (9,400 | 17.2%), and Sales & Related (6,158 | 11.3%).
Sales and Office Occupations by Sex
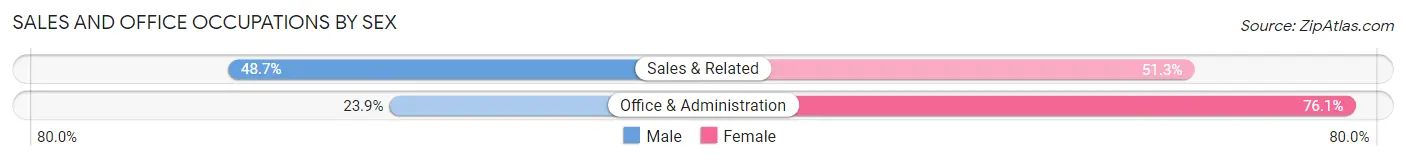
| Occupation | Male | Female |
| Sales & Related | 2,998 (48.7%) | 3,160 (51.3%) |
| Office & Administration | 2,247 (23.9%) | 7,153 (76.1%) |
| Total (Category) | 5,245 (33.7%) | 10,313 (66.3%) |
| Total (Overall) | 26,937 (49.3%) | 27,685 (50.7%) |
Natural Resources, Construction and Maintenance Occupations
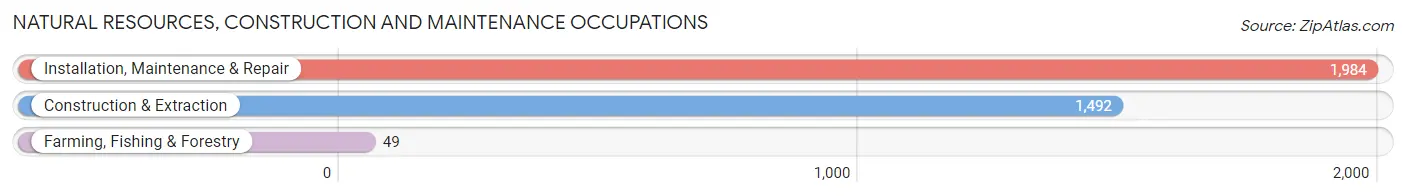
The most common Natural Resources, Construction and Maintenance occupations in Carolina are Installation, Maintenance & Repair (1,984 | 3.6%), Construction & Extraction (1,492 | 2.7%), and Farming, Fishing & Forestry (49 | 0.1%).
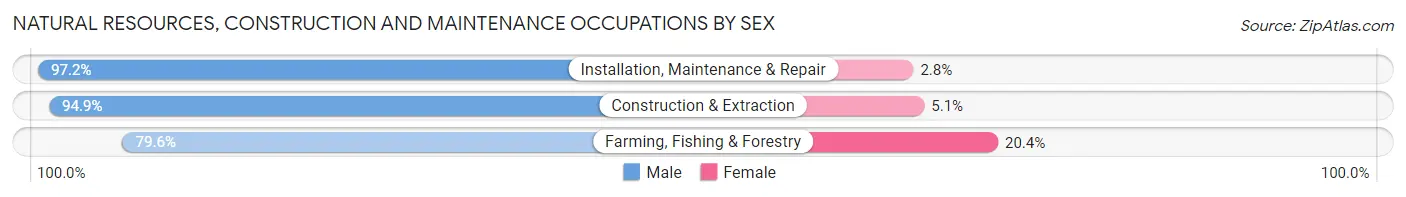
Natural Resources, Construction and Maintenance Occupations by Sex
| Occupation | Male | Female |
| Farming, Fishing & Forestry | 39 (79.6%) | 10 (20.4%) |
| Construction & Extraction | 1,416 (94.9%) | 76 (5.1%) |
| Installation, Maintenance & Repair | 1,928 (97.2%) | 56 (2.8%) |
| Total (Category) | 3,383 (96.0%) | 142 (4.0%) |
| Total (Overall) | 26,937 (49.3%) | 27,685 (50.7%) |
Production, Transportation and Moving Occupations
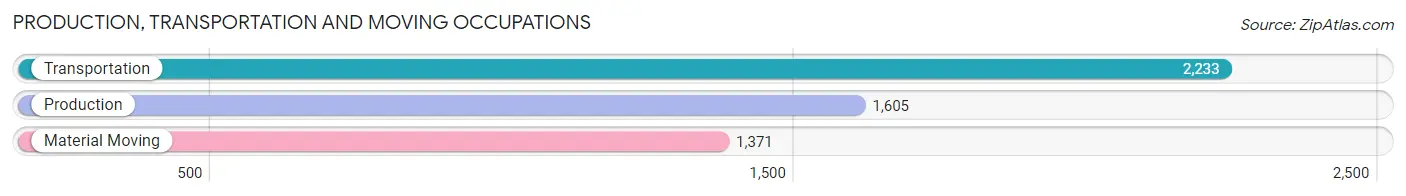
The most common Production, Transportation and Moving occupations in Carolina are Transportation (2,233 | 4.1%), Production (1,605 | 2.9%), and Material Moving (1,371 | 2.5%).
Production, Transportation and Moving Occupations by Sex
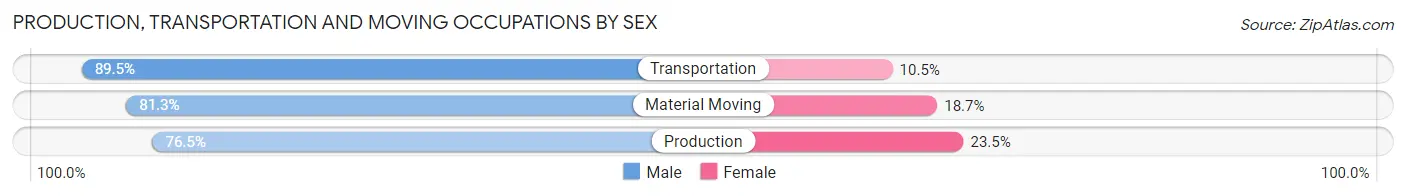
| Occupation | Male | Female |
| Production | 1,228 (76.5%) | 377 (23.5%) |
| Transportation | 1,999 (89.5%) | 234 (10.5%) |
| Material Moving | 1,115 (81.3%) | 256 (18.7%) |
| Total (Category) | 4,342 (83.4%) | 867 (16.6%) |
| Total (Overall) | 26,937 (49.3%) | 27,685 (50.7%) |
Employment Industries by Sex in Carolina
Employment Industries in Carolina
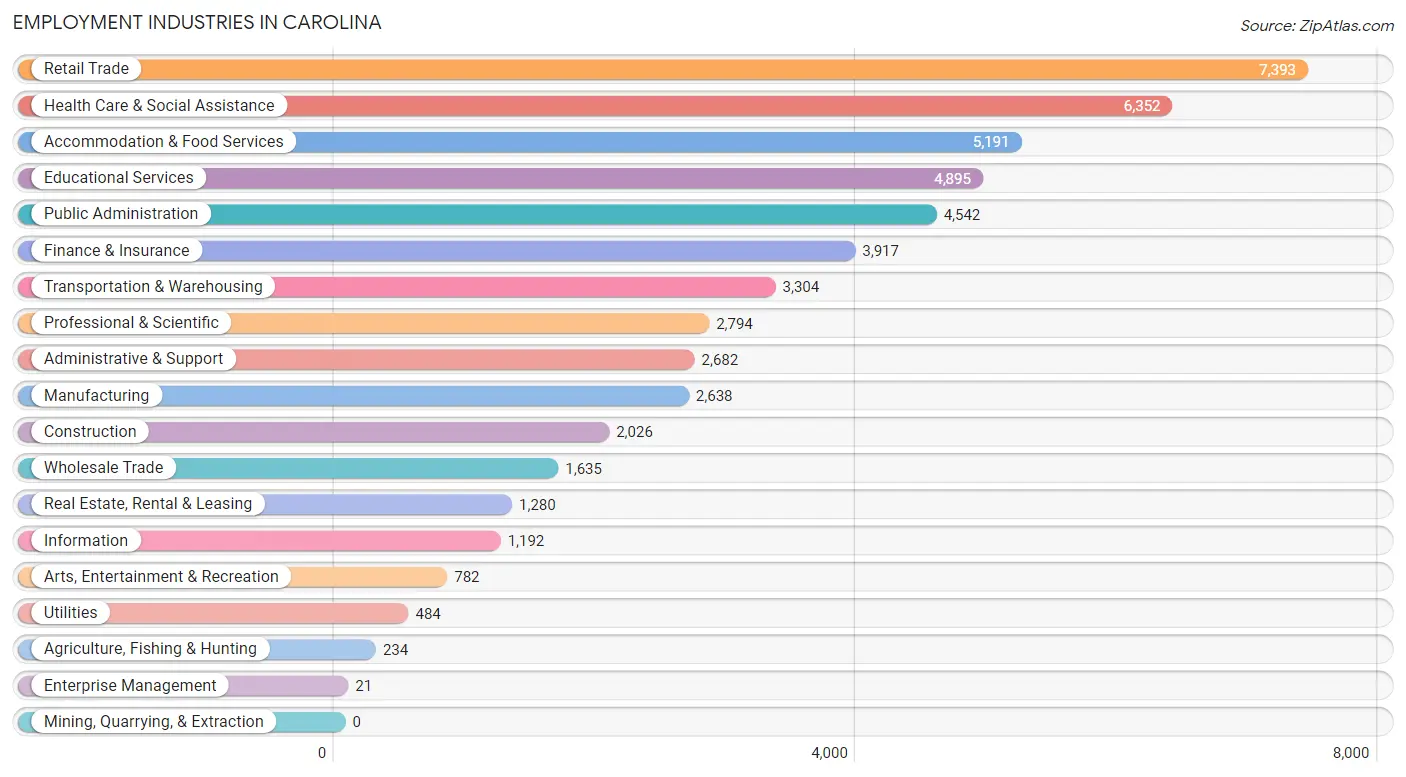
The major employment industries in Carolina include Retail Trade (7,393 | 13.5%), Health Care & Social Assistance (6,352 | 11.6%), Accommodation & Food Services (5,191 | 9.5%), Educational Services (4,895 | 9.0%), and Public Administration (4,542 | 8.3%).
Employment Industries by Sex in Carolina
The Carolina industries that see more men than women are Construction (83.5%), Manufacturing (79.4%), and Transportation & Warehousing (73.6%), whereas the industries that tend to have a higher number of women are Enterprise Management (100.0%), Health Care & Social Assistance (80.5%), and Educational Services (69.2%).
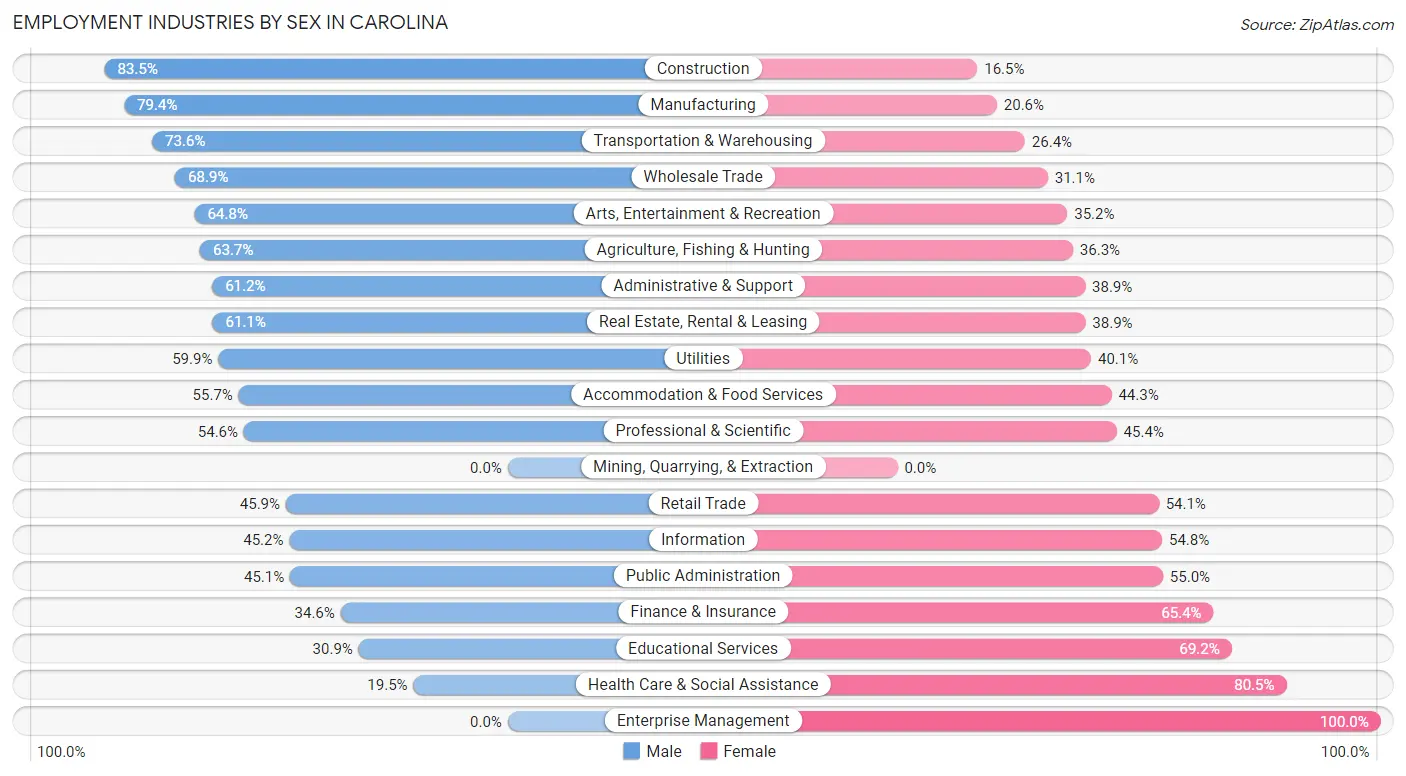
| Industry | Male | Female |
| Agriculture, Fishing & Hunting | 149 (63.7%) | 85 (36.3%) |
| Mining, Quarrying, & Extraction | 0 (0.0%) | 0 (0.0%) |
| Construction | 1,691 (83.5%) | 335 (16.5%) |
| Manufacturing | 2,095 (79.4%) | 543 (20.6%) |
| Wholesale Trade | 1,126 (68.9%) | 509 (31.1%) |
| Retail Trade | 3,395 (45.9%) | 3,998 (54.1%) |
| Transportation & Warehousing | 2,432 (73.6%) | 872 (26.4%) |
| Utilities | 290 (59.9%) | 194 (40.1%) |
| Information | 539 (45.2%) | 653 (54.8%) |
| Finance & Insurance | 1,355 (34.6%) | 2,562 (65.4%) |
| Real Estate, Rental & Leasing | 782 (61.1%) | 498 (38.9%) |
| Professional & Scientific | 1,526 (54.6%) | 1,268 (45.4%) |
| Enterprise Management | 0 (0.0%) | 21 (100.0%) |
| Administrative & Support | 1,640 (61.2%) | 1,042 (38.9%) |
| Educational Services | 1,510 (30.8%) | 3,385 (69.2%) |
| Health Care & Social Assistance | 1,240 (19.5%) | 5,112 (80.5%) |
| Arts, Entertainment & Recreation | 507 (64.8%) | 275 (35.2%) |
| Accommodation & Food Services | 2,891 (55.7%) | 2,300 (44.3%) |
| Public Administration | 2,046 (45.1%) | 2,496 (54.9%) |
| Total | 26,937 (49.3%) | 27,685 (50.7%) |
Education in Carolina
School Enrollment in Carolina
The most common levels of schooling among the 30,349 students in Carolina are college / undergraduate (8,357 | 27.5%), high school (6,045 | 19.9%), and elementary school (5,794 | 19.1%).
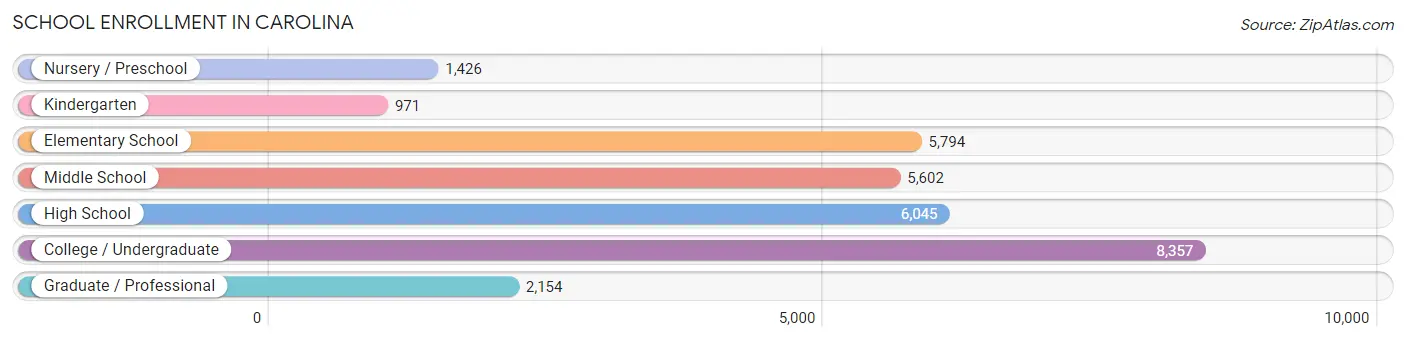
| School Level | # Students | % Students |
| Nursery / Preschool | 1,426 | 4.7% |
| Kindergarten | 971 | 3.2% |
| Elementary School | 5,794 | 19.1% |
| Middle School | 5,602 | 18.5% |
| High School | 6,045 | 19.9% |
| College / Undergraduate | 8,357 | 27.5% |
| Graduate / Professional | 2,154 | 7.1% |
| Total | 30,349 | 100.0% |
School Enrollment by Age by Funding Source in Carolina
Out of a total of 30,349 students who are enrolled in schools in Carolina, 14,871 (49.0%) attend a private institution, while the remaining 15,478 (51.0%) are enrolled in public schools. The age group of 35 years and over has the highest likelihood of being enrolled in private schools, with 1,657 (79.0% in the age bracket) enrolled. Conversely, the age group of 18 to 19 year olds has the lowest likelihood of being enrolled in a private school, with 1,707 (60.0% in the age bracket) attending a public institution.
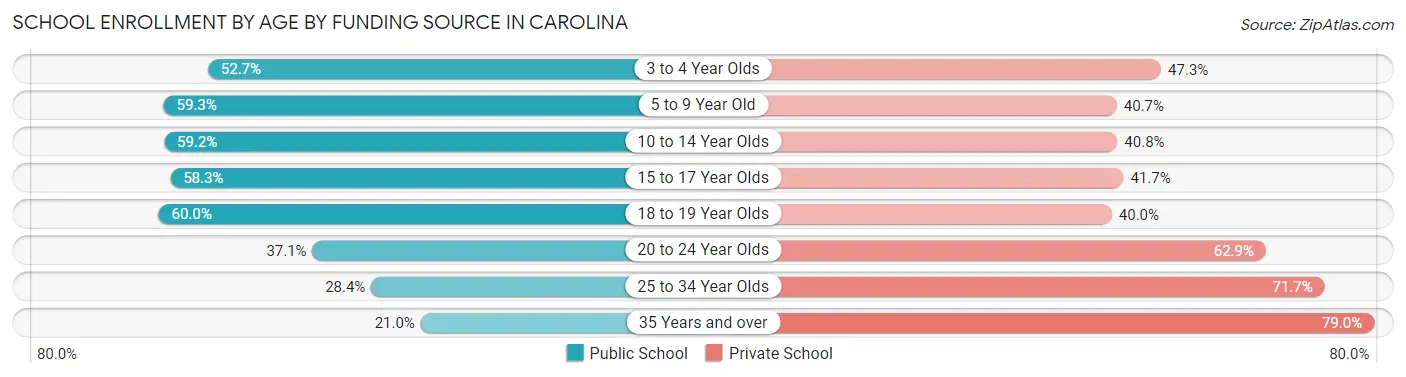
| Age Bracket | Public School | Private School |
| 3 to 4 Year Olds | 704 (52.7%) | 632 (47.3%) |
| 5 to 9 Year Old | 3,696 (59.3%) | 2,538 (40.7%) |
| 10 to 14 Year Olds | 4,050 (59.2%) | 2,790 (40.8%) |
| 15 to 17 Year Olds | 2,638 (58.3%) | 1,887 (41.7%) |
| 18 to 19 Year Olds | 1,707 (60.0%) | 1,136 (40.0%) |
| 20 to 24 Year Olds | 1,723 (37.1%) | 2,920 (62.9%) |
| 25 to 34 Year Olds | 519 (28.3%) | 1,312 (71.7%) |
| 35 Years and over | 440 (21.0%) | 1,657 (79.0%) |
| Total | 15,478 (51.0%) | 14,871 (49.0%) |
Educational Attainment by Field of Study in Carolina
Business (12,103 | 32.3%), education (5,455 | 14.5%), science & technology (4,021 | 10.7%), arts & humanities (3,235 | 8.6%), and engineering (1,925 | 5.1%) are the most common fields of study among 37,520 individuals in Carolina who have obtained a bachelor's degree or higher.
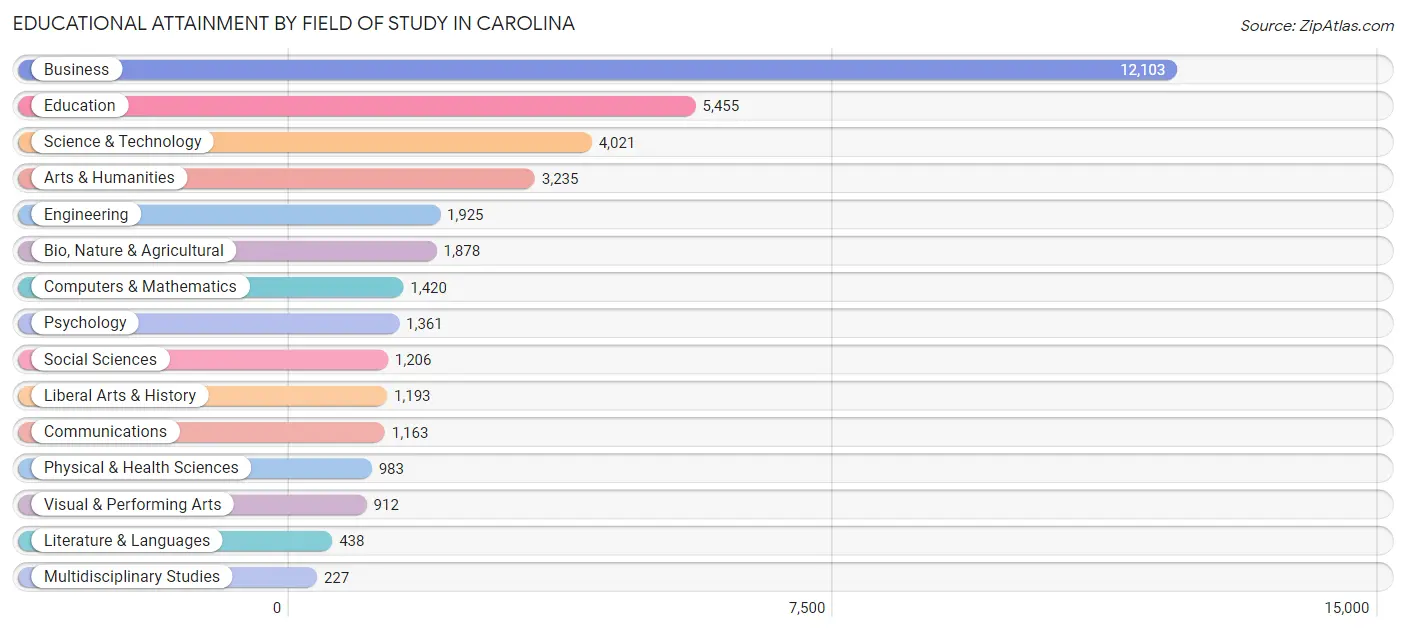
| Field of Study | # Graduates | % Graduates |
| Computers & Mathematics | 1,420 | 3.8% |
| Bio, Nature & Agricultural | 1,878 | 5.0% |
| Physical & Health Sciences | 983 | 2.6% |
| Psychology | 1,361 | 3.6% |
| Social Sciences | 1,206 | 3.2% |
| Engineering | 1,925 | 5.1% |
| Multidisciplinary Studies | 227 | 0.6% |
| Science & Technology | 4,021 | 10.7% |
| Business | 12,103 | 32.3% |
| Education | 5,455 | 14.5% |
| Literature & Languages | 438 | 1.2% |
| Liberal Arts & History | 1,193 | 3.2% |
| Visual & Performing Arts | 912 | 2.4% |
| Communications | 1,163 | 3.1% |
| Arts & Humanities | 3,235 | 8.6% |
| Total | 37,520 | 100.0% |
Transportation & Commute in Carolina
Vehicle Availability by Sex in Carolina
The most prevalent vehicle ownership categories in Carolina are males with 2 vehicles (11,838, accounting for 45.6%) and females with 2 vehicles (10,623, making up 45.0%).
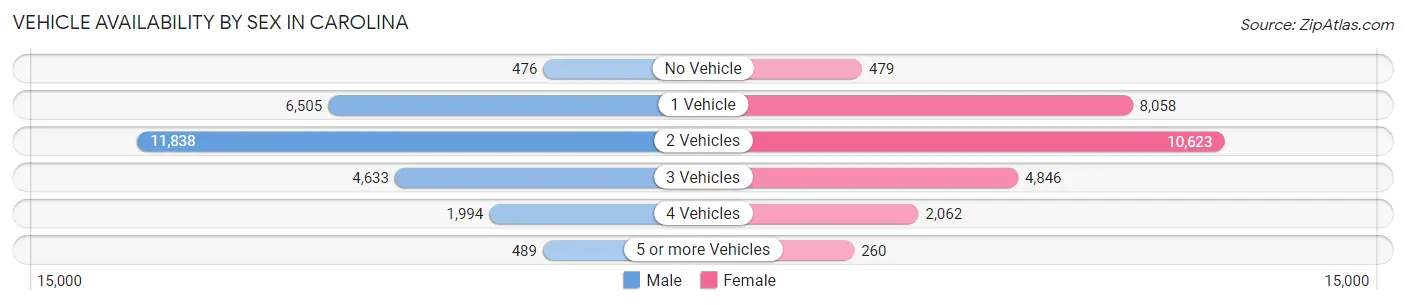
| Vehicles Available | Male | Female |
| No Vehicle | 476 (1.8%) | 479 (1.8%) |
| 1 Vehicle | 6,505 (25.1%) | 8,058 (30.6%) |
| 2 Vehicles | 11,838 (45.6%) | 10,623 (40.4%) |
| 3 Vehicles | 4,633 (17.9%) | 4,846 (18.4%) |
| 4 Vehicles | 1,994 (7.7%) | 2,062 (7.8%) |
| 5 or more Vehicles | 489 (1.9%) | 260 (1.0%) |
| Total | 25,935 (100.0%) | 26,328 (100.0%) |
Commute Time in Carolina
The most frequently occuring commute durations in Carolina are 30 to 34 minutes (8,377 commuters, 17.3%), 20 to 24 minutes (8,209 commuters, 17.0%), and 15 to 19 minutes (6,860 commuters, 14.2%).
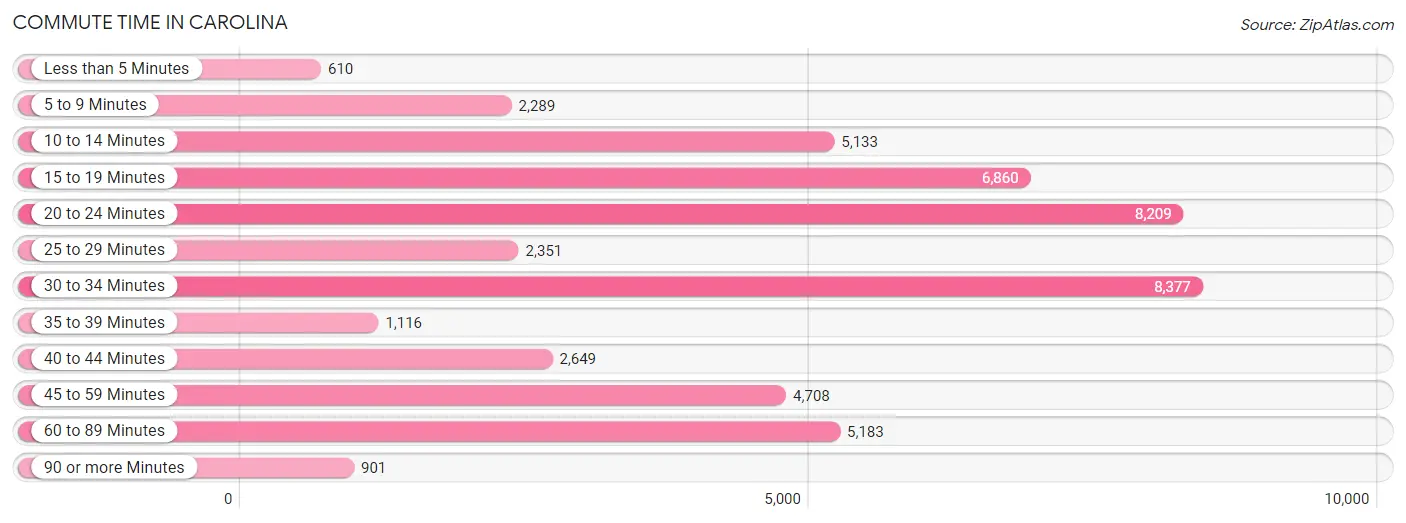
| Commute Time | # Commuters | % Commuters |
| Less than 5 Minutes | 610 | 1.3% |
| 5 to 9 Minutes | 2,289 | 4.7% |
| 10 to 14 Minutes | 5,133 | 10.6% |
| 15 to 19 Minutes | 6,860 | 14.2% |
| 20 to 24 Minutes | 8,209 | 17.0% |
| 25 to 29 Minutes | 2,351 | 4.9% |
| 30 to 34 Minutes | 8,377 | 17.3% |
| 35 to 39 Minutes | 1,116 | 2.3% |
| 40 to 44 Minutes | 2,649 | 5.5% |
| 45 to 59 Minutes | 4,708 | 9.7% |
| 60 to 89 Minutes | 5,183 | 10.7% |
| 90 or more Minutes | 901 | 1.9% |
Commute Time by Sex in Carolina
The most common commute times in Carolina are 20 to 24 minutes (4,250 commuters, 17.4%) for males and 30 to 34 minutes (4,226 commuters, 17.6%) for females.
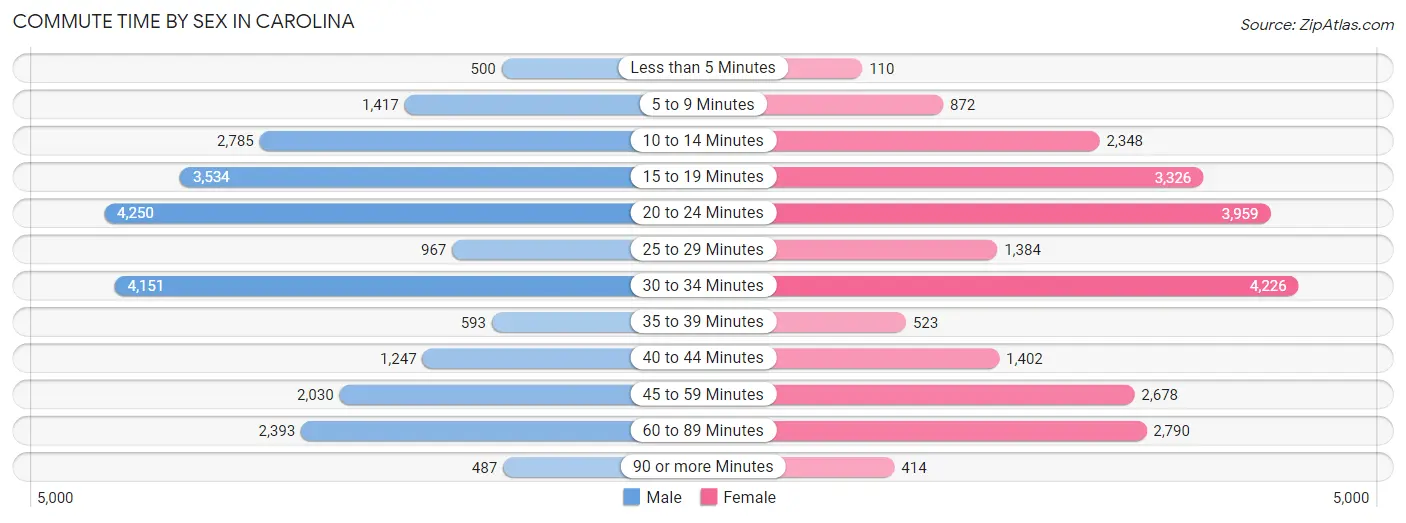
| Commute Time | Male | Female |
| Less than 5 Minutes | 500 (2.1%) | 110 (0.5%) |
| 5 to 9 Minutes | 1,417 (5.8%) | 872 (3.6%) |
| 10 to 14 Minutes | 2,785 (11.4%) | 2,348 (9.8%) |
| 15 to 19 Minutes | 3,534 (14.5%) | 3,326 (13.8%) |
| 20 to 24 Minutes | 4,250 (17.4%) | 3,959 (16.5%) |
| 25 to 29 Minutes | 967 (4.0%) | 1,384 (5.8%) |
| 30 to 34 Minutes | 4,151 (17.0%) | 4,226 (17.6%) |
| 35 to 39 Minutes | 593 (2.4%) | 523 (2.2%) |
| 40 to 44 Minutes | 1,247 (5.1%) | 1,402 (5.8%) |
| 45 to 59 Minutes | 2,030 (8.3%) | 2,678 (11.1%) |
| 60 to 89 Minutes | 2,393 (9.8%) | 2,790 (11.6%) |
| 90 or more Minutes | 487 (2.0%) | 414 (1.7%) |
Time of Departure to Work by Sex in Carolina
The most frequent times of departure to work in Carolina are 6:00 AM to 6:29 AM (3,184, 13.1%) for males and 7:00 AM to 7:29 AM (3,950, 16.4%) for females.
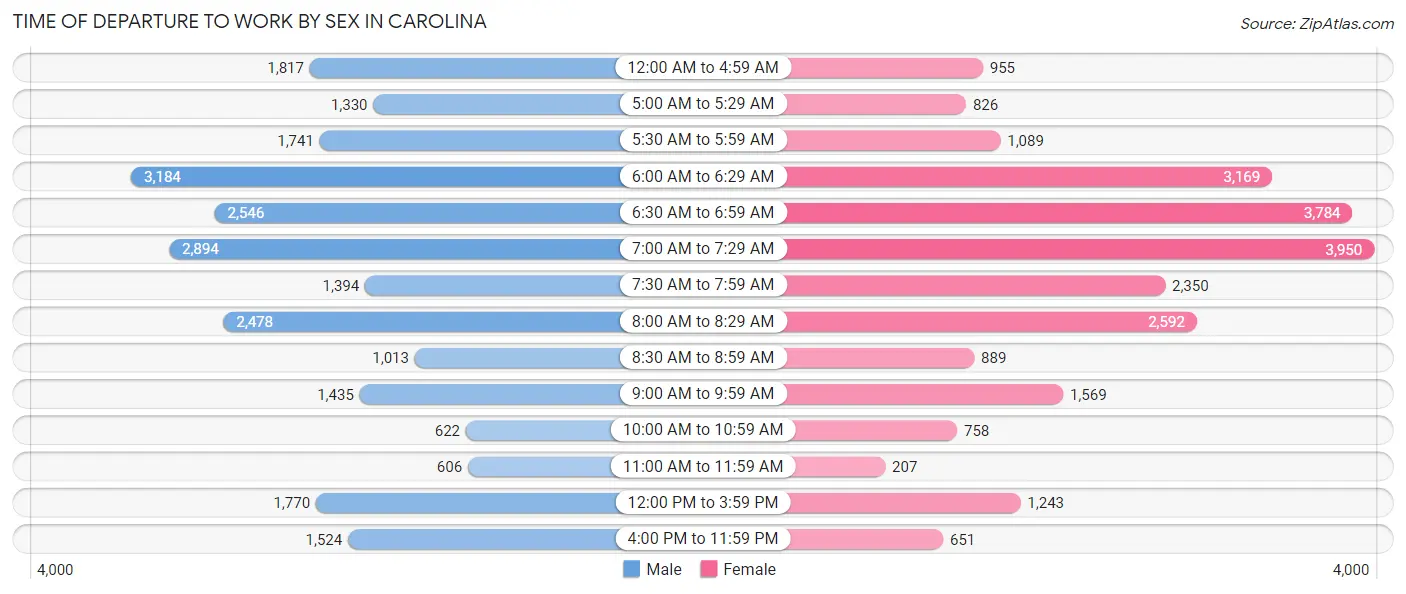
| Time of Departure | Male | Female |
| 12:00 AM to 4:59 AM | 1,817 (7.5%) | 955 (4.0%) |
| 5:00 AM to 5:29 AM | 1,330 (5.5%) | 826 (3.4%) |
| 5:30 AM to 5:59 AM | 1,741 (7.1%) | 1,089 (4.5%) |
| 6:00 AM to 6:29 AM | 3,184 (13.1%) | 3,169 (13.2%) |
| 6:30 AM to 6:59 AM | 2,546 (10.4%) | 3,784 (15.8%) |
| 7:00 AM to 7:29 AM | 2,894 (11.9%) | 3,950 (16.4%) |
| 7:30 AM to 7:59 AM | 1,394 (5.7%) | 2,350 (9.8%) |
| 8:00 AM to 8:29 AM | 2,478 (10.2%) | 2,592 (10.8%) |
| 8:30 AM to 8:59 AM | 1,013 (4.2%) | 889 (3.7%) |
| 9:00 AM to 9:59 AM | 1,435 (5.9%) | 1,569 (6.5%) |
| 10:00 AM to 10:59 AM | 622 (2.5%) | 758 (3.2%) |
| 11:00 AM to 11:59 AM | 606 (2.5%) | 207 (0.9%) |
| 12:00 PM to 3:59 PM | 1,770 (7.3%) | 1,243 (5.2%) |
| 4:00 PM to 11:59 PM | 1,524 (6.3%) | 651 (2.7%) |
| Total | 24,354 (100.0%) | 24,032 (100.0%) |
Housing Occupancy in Carolina
Occupancy by Ownership in Carolina
Of the total 56,654 dwellings in Carolina, owner-occupied units account for 38,677 (68.3%), while renter-occupied units make up 17,977 (31.7%).
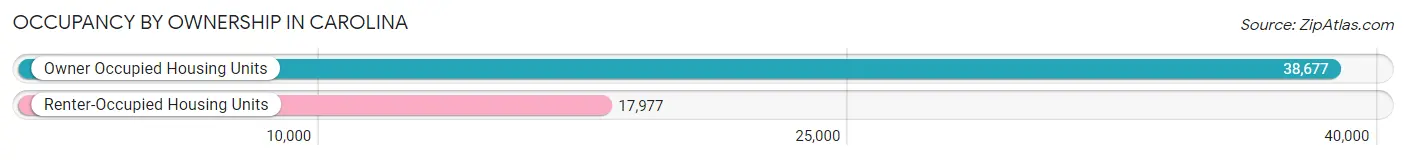
| Occupancy | # Housing Units | % Housing Units |
| Owner Occupied Housing Units | 38,677 | 68.3% |
| Renter-Occupied Housing Units | 17,977 | 31.7% |
| Total Occupied Housing Units | 56,654 | 100.0% |
Occupancy by Household Size in Carolina
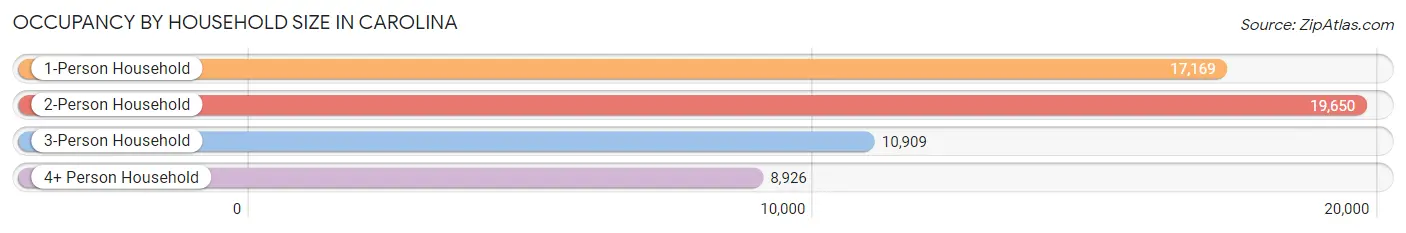
| Household Size | # Housing Units | % Housing Units |
| 1-Person Household | 17,169 | 30.3% |
| 2-Person Household | 19,650 | 34.7% |
| 3-Person Household | 10,909 | 19.3% |
| 4+ Person Household | 8,926 | 15.8% |
| Total Housing Units | 56,654 | 100.0% |
Occupancy by Ownership by Household Size in Carolina
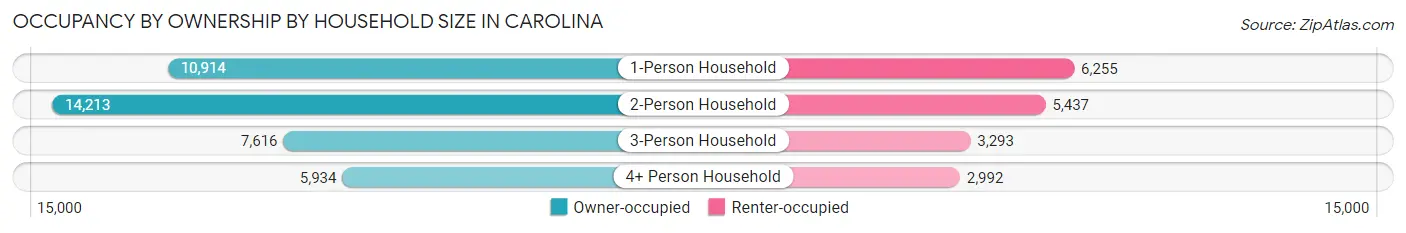
| Household Size | Owner-occupied | Renter-occupied |
| 1-Person Household | 10,914 (63.6%) | 6,255 (36.4%) |
| 2-Person Household | 14,213 (72.3%) | 5,437 (27.7%) |
| 3-Person Household | 7,616 (69.8%) | 3,293 (30.2%) |
| 4+ Person Household | 5,934 (66.5%) | 2,992 (33.5%) |
| Total Housing Units | 38,677 (68.3%) | 17,977 (31.7%) |
Occupancy by Educational Attainment in Carolina
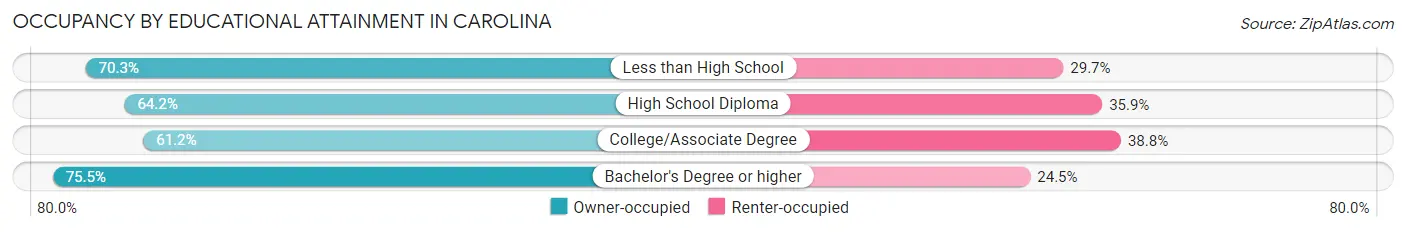
| Household Size | Owner-occupied | Renter-occupied |
| Less than High School | 4,448 (70.3%) | 1,878 (29.7%) |
| High School Diploma | 8,735 (64.1%) | 4,881 (35.8%) |
| College/Associate Degree | 9,522 (61.2%) | 6,045 (38.8%) |
| Bachelor's Degree or higher | 15,972 (75.5%) | 5,173 (24.5%) |
Occupancy by Age of Householder in Carolina
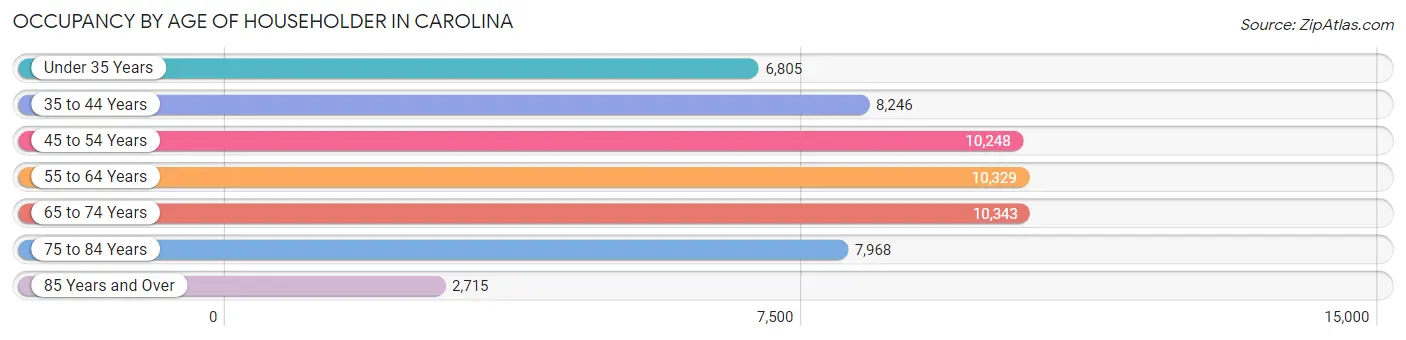
| Age Bracket | # Households | % Households |
| Under 35 Years | 6,805 | 12.0% |
| 35 to 44 Years | 8,246 | 14.6% |
| 45 to 54 Years | 10,248 | 18.1% |
| 55 to 64 Years | 10,329 | 18.2% |
| 65 to 74 Years | 10,343 | 18.3% |
| 75 to 84 Years | 7,968 | 14.1% |
| 85 Years and Over | 2,715 | 4.8% |
| Total | 56,654 | 100.0% |
Housing Finances in Carolina
Median Income by Occupancy in Carolina
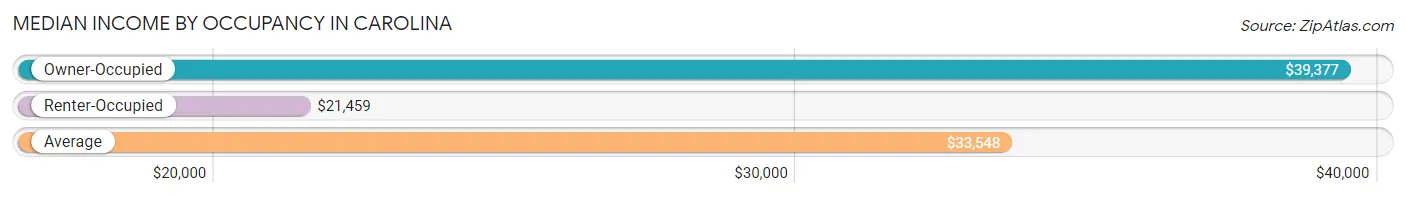
| Occupancy Type | # Households | Median Income |
| Owner-Occupied | 38,677 (68.3%) | $39,377 |
| Renter-Occupied | 17,977 (31.7%) | $21,459 |
| Average | 56,654 (100.0%) | $33,548 |
Occupancy by Householder Income Bracket in Carolina
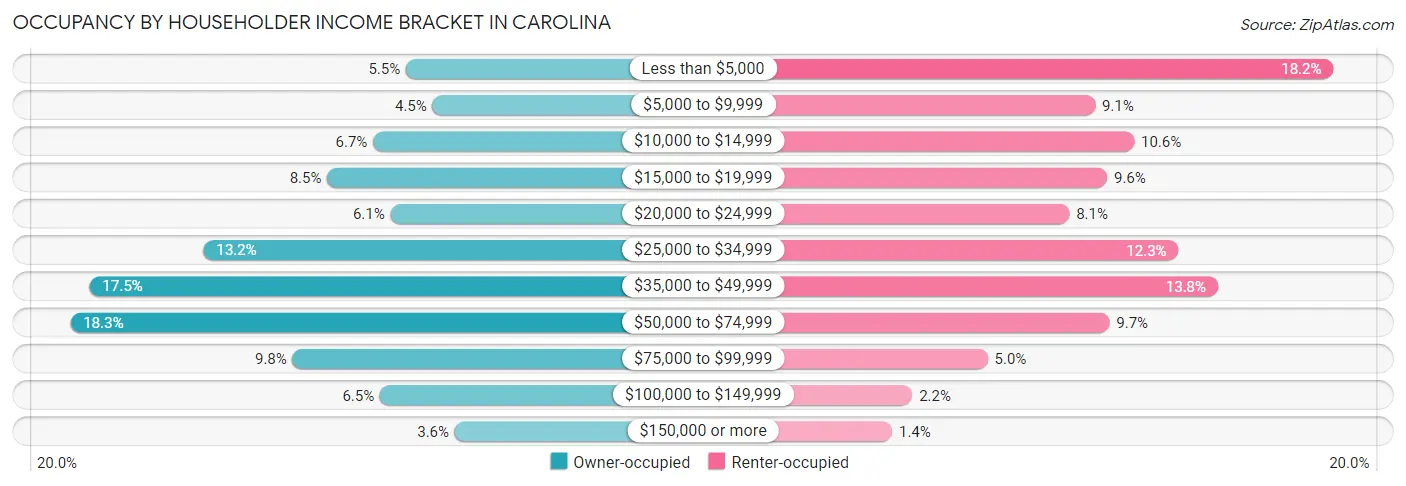
| Income Bracket | Owner-occupied | Renter-occupied |
| Less than $5,000 | 2,116 (5.5%) | 3,272 (18.2%) |
| $5,000 to $9,999 | 1,724 (4.5%) | 1,639 (9.1%) |
| $10,000 to $14,999 | 2,598 (6.7%) | 1,907 (10.6%) |
| $15,000 to $19,999 | 3,275 (8.5%) | 1,723 (9.6%) |
| $20,000 to $24,999 | 2,344 (6.1%) | 1,464 (8.1%) |
| $25,000 to $34,999 | 5,101 (13.2%) | 2,211 (12.3%) |
| $35,000 to $49,999 | 6,779 (17.5%) | 2,480 (13.8%) |
| $50,000 to $74,999 | 7,061 (18.3%) | 1,738 (9.7%) |
| $75,000 to $99,999 | 3,785 (9.8%) | 904 (5.0%) |
| $100,000 to $149,999 | 2,497 (6.5%) | 389 (2.2%) |
| $150,000 or more | 1,397 (3.6%) | 250 (1.4%) |
| Total | 38,677 (100.0%) | 17,977 (100.0%) |
Monthly Housing Cost Tiers in Carolina
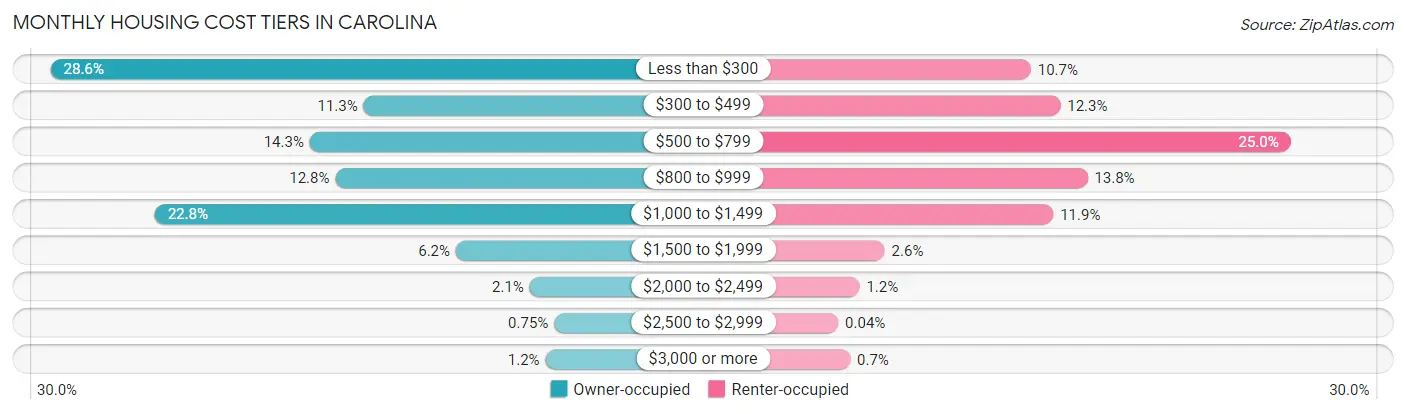
| Monthly Cost | Owner-occupied | Renter-occupied |
| Less than $300 | 11,045 (28.6%) | 1,920 (10.7%) |
| $300 to $499 | 4,361 (11.3%) | 2,213 (12.3%) |
| $500 to $799 | 5,513 (14.2%) | 4,500 (25.0%) |
| $800 to $999 | 4,967 (12.8%) | 2,483 (13.8%) |
| $1,000 to $1,499 | 8,822 (22.8%) | 2,143 (11.9%) |
| $1,500 to $1,999 | 2,389 (6.2%) | 469 (2.6%) |
| $2,000 to $2,499 | 814 (2.1%) | 220 (1.2%) |
| $2,500 to $2,999 | 292 (0.7%) | 8 (0.0%) |
| $3,000 or more | 474 (1.2%) | 126 (0.7%) |
| Total | 38,677 (100.0%) | 17,977 (100.0%) |
Physical Housing Characteristics in Carolina
Housing Structures in Carolina
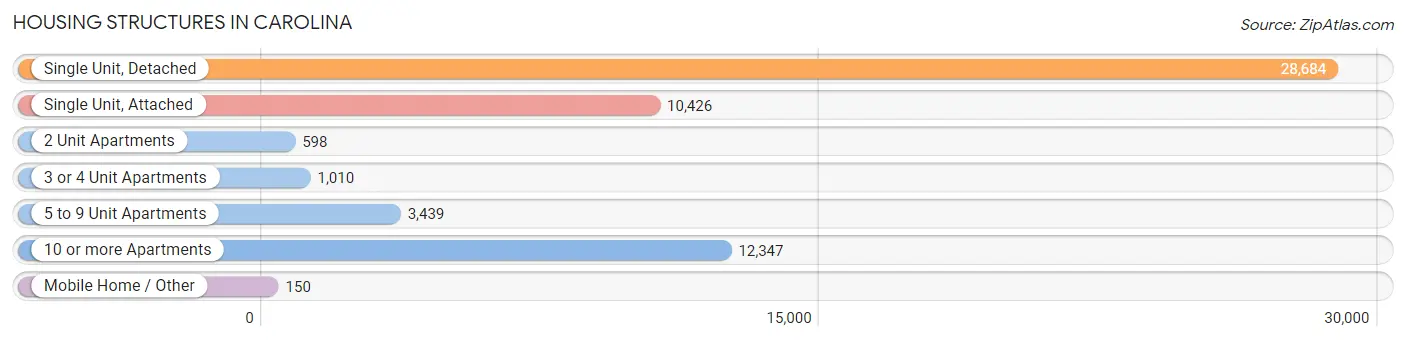
| Structure Type | # Housing Units | % Housing Units |
| Single Unit, Detached | 28,684 | 50.6% |
| Single Unit, Attached | 10,426 | 18.4% |
| 2 Unit Apartments | 598 | 1.1% |
| 3 or 4 Unit Apartments | 1,010 | 1.8% |
| 5 to 9 Unit Apartments | 3,439 | 6.1% |
| 10 or more Apartments | 12,347 | 21.8% |
| Mobile Home / Other | 150 | 0.3% |
| Total | 56,654 | 100.0% |
Housing Structures by Occupancy in Carolina
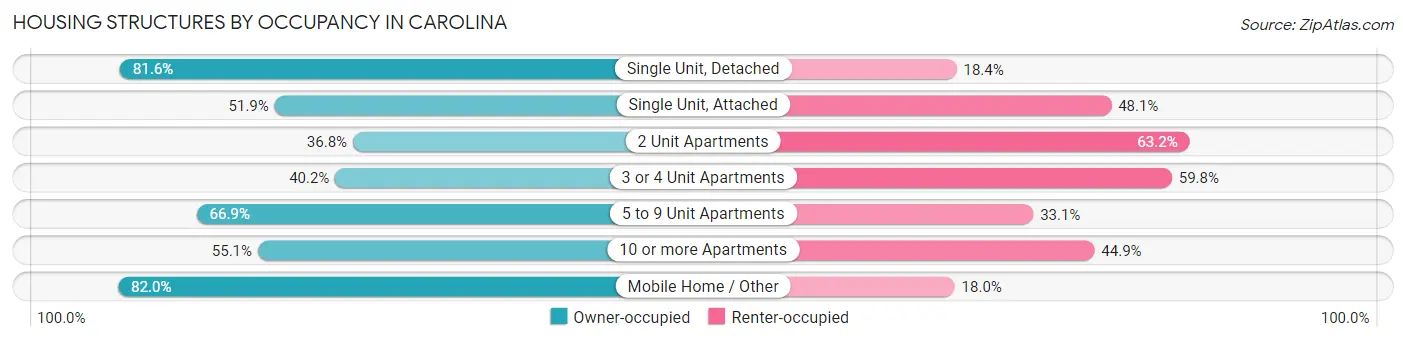
| Structure Type | Owner-occupied | Renter-occupied |
| Single Unit, Detached | 23,419 (81.6%) | 5,265 (18.4%) |
| Single Unit, Attached | 5,407 (51.9%) | 5,019 (48.1%) |
| 2 Unit Apartments | 220 (36.8%) | 378 (63.2%) |
| 3 or 4 Unit Apartments | 406 (40.2%) | 604 (59.8%) |
| 5 to 9 Unit Apartments | 2,300 (66.9%) | 1,139 (33.1%) |
| 10 or more Apartments | 6,802 (55.1%) | 5,545 (44.9%) |
| Mobile Home / Other | 123 (82.0%) | 27 (18.0%) |
| Total | 38,677 (68.3%) | 17,977 (31.7%) |
Housing Structures by Number of Rooms in Carolina
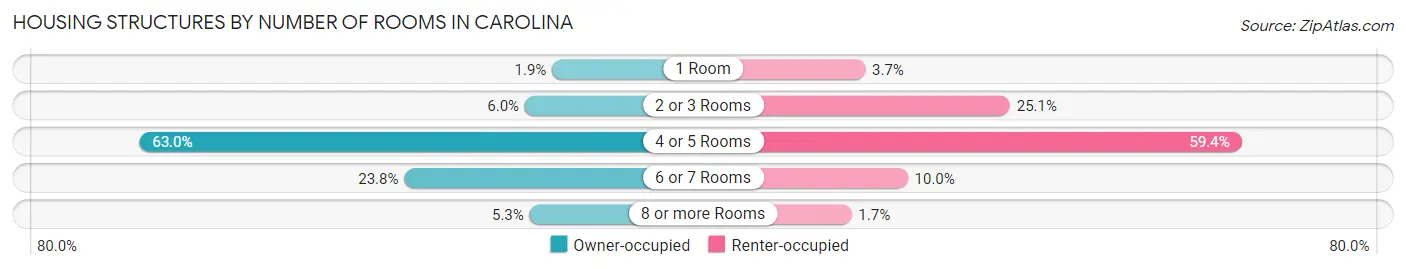
| Number of Rooms | Owner-occupied | Renter-occupied |
| 1 Room | 748 (1.9%) | 669 (3.7%) |
| 2 or 3 Rooms | 2,305 (6.0%) | 4,519 (25.1%) |
| 4 or 5 Rooms | 24,376 (63.0%) | 10,682 (59.4%) |
| 6 or 7 Rooms | 9,209 (23.8%) | 1,801 (10.0%) |
| 8 or more Rooms | 2,039 (5.3%) | 306 (1.7%) |
| Total | 38,677 (100.0%) | 17,977 (100.0%) |
Housing Structure by Heating Type in Carolina
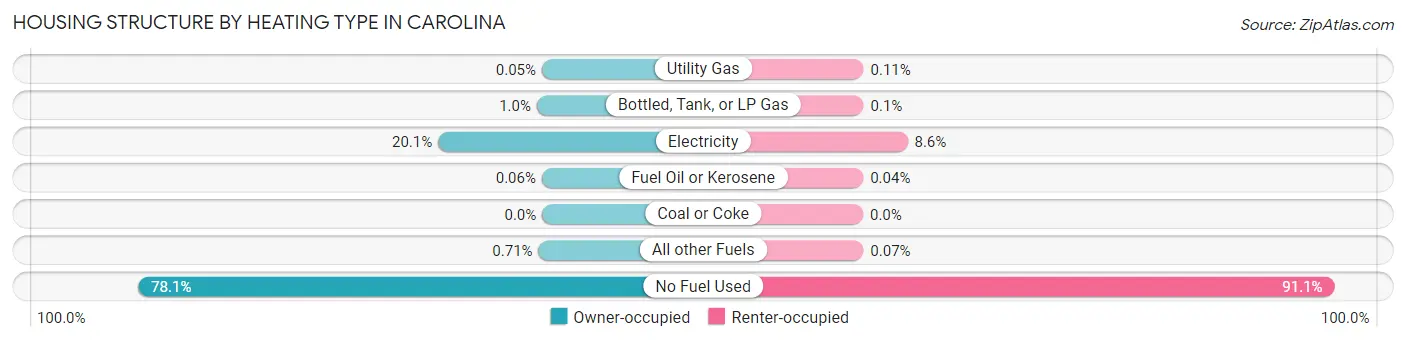
| Heating Type | Owner-occupied | Renter-occupied |
| Utility Gas | 19 (0.1%) | 20 (0.1%) |
| Bottled, Tank, or LP Gas | 393 (1.0%) | 18 (0.1%) |
| Electricity | 7,778 (20.1%) | 1,545 (8.6%) |
| Fuel Oil or Kerosene | 24 (0.1%) | 8 (0.0%) |
| Coal or Coke | 0 (0.0%) | 0 (0.0%) |
| All other Fuels | 275 (0.7%) | 12 (0.1%) |
| No Fuel Used | 30,188 (78.0%) | 16,374 (91.1%) |
| Total | 38,677 (100.0%) | 17,977 (100.0%) |
Household Vehicle Usage in Carolina
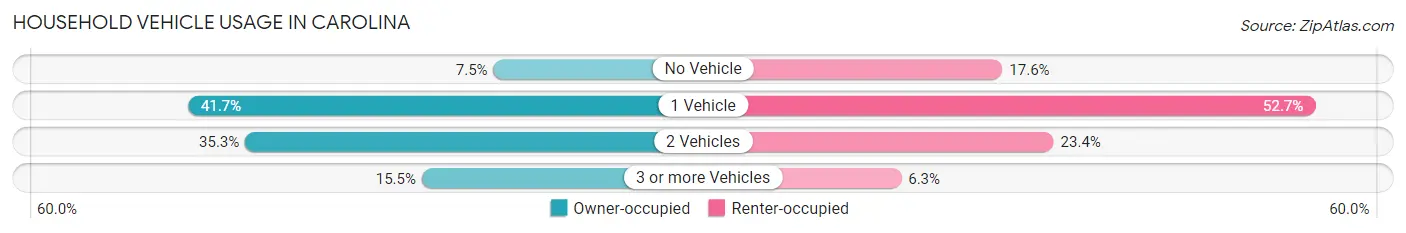
| Vehicles per Household | Owner-occupied | Renter-occupied |
| No Vehicle | 2,894 (7.5%) | 3,171 (17.6%) |
| 1 Vehicle | 16,132 (41.7%) | 9,469 (52.7%) |
| 2 Vehicles | 13,653 (35.3%) | 4,203 (23.4%) |
| 3 or more Vehicles | 5,998 (15.5%) | 1,134 (6.3%) |
| Total | 38,677 (100.0%) | 17,977 (100.0%) |
Real Estate & Mortgages in Carolina
Real Estate and Mortgage Overview in Carolina
| Characteristic | Without Mortgage | With Mortgage |
| Housing Units | 17,528 | 21,149 |
| Median Property Value | $144,500 | $152,900 |
| Median Household Income | $31,871 | $956 |
| Monthly Housing Costs | $232 | $468 |
| Real Estate Taxes | $793 | $15,491 |
Property Value by Mortgage Status in Carolina
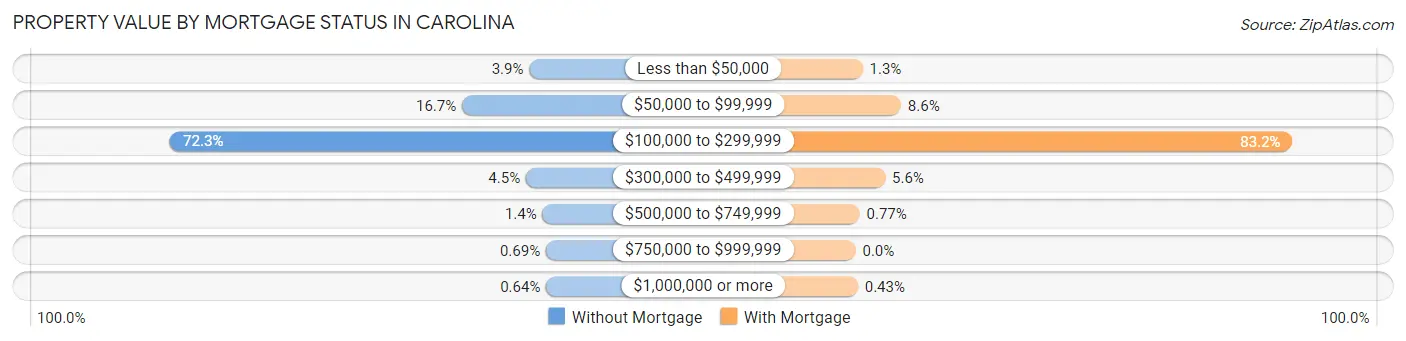
| Property Value | Without Mortgage | With Mortgage |
| Less than $50,000 | 679 (3.9%) | 283 (1.3%) |
| $50,000 to $99,999 | 2,924 (16.7%) | 1,828 (8.6%) |
| $100,000 to $299,999 | 12,668 (72.3%) | 17,595 (83.2%) |
| $300,000 to $499,999 | 788 (4.5%) | 1,190 (5.6%) |
| $500,000 to $749,999 | 236 (1.3%) | 163 (0.8%) |
| $750,000 to $999,999 | 121 (0.7%) | 0 (0.0%) |
| $1,000,000 or more | 112 (0.6%) | 90 (0.4%) |
| Total | 17,528 (100.0%) | 21,149 (100.0%) |
Household Income by Mortgage Status in Carolina
| Household Income | Without Mortgage | With Mortgage |
| Less than $10,000 | 2,267 (12.9%) | 11 (0.1%) |
| $10,000 to $24,999 | 4,747 (27.1%) | 1,573 (7.4%) |
| $25,000 to $34,999 | 2,777 (15.8%) | 3,470 (16.4%) |
| $35,000 to $49,999 | 3,013 (17.2%) | 2,324 (11.0%) |
| $50,000 to $74,999 | 2,076 (11.8%) | 3,766 (17.8%) |
| $75,000 to $99,999 | 1,397 (8.0%) | 4,985 (23.6%) |
| $100,000 to $149,999 | 810 (4.6%) | 2,388 (11.3%) |
| $150,000 or more | 441 (2.5%) | 1,687 (8.0%) |
| Total | 17,528 (100.0%) | 21,149 (100.0%) |
Property Value to Household Income Ratio in Carolina
| Value-to-Income Ratio | Without Mortgage | With Mortgage |
| Less than 2.0x | 2,945 (16.8%) | 47,231 (223.3%) |
| 2.0x to 2.9x | 2,293 (13.1%) | 5,289 (25.0%) |
| 3.0x to 3.9x | 2,254 (12.9%) | 4,523 (21.4%) |
| 4.0x or more | 9,433 (53.8%) | 3,066 (14.5%) |
| Total | 17,528 (100.0%) | 21,149 (100.0%) |
Real Estate Taxes by Mortgage Status in Carolina
| Property Taxes | Without Mortgage | With Mortgage |
| Less than $800 | 2,140 (12.2%) | 386 (1.8%) |
| $800 to $1,499 | 1,188 (6.8%) | 3,376 (16.0%) |
| $800 to $1,499 | 912 (5.2%) | 1,420 (6.7%) |
| Total | 17,528 (100.0%) | 21,149 (100.0%) |
Health & Disability in Carolina
Health Insurance Coverage by Age in Carolina
| Age Bracket | With Coverage | Without Coverage |
| Under 6 Years | 5,621 (97.5%) | 142 (2.5%) |
| 6 to 18 Years | 18,004 (96.0%) | 759 (4.1%) |
| 19 to 25 Years | 11,379 (85.1%) | 1,997 (14.9%) |
| 26 to 34 Years | 13,342 (85.0%) | 2,361 (15.0%) |
| 35 to 44 Years | 14,708 (87.8%) | 2,035 (12.1%) |
| 45 to 54 Years | 16,317 (90.2%) | 1,779 (9.8%) |
| 55 to 64 Years | 15,961 (90.0%) | 1,779 (10.0%) |
| 65 to 74 Years | 15,479 (98.2%) | 287 (1.8%) |
| 75 Years and older | 16,563 (99.6%) | 61 (0.4%) |
| Total | 127,374 (91.9%) | 11,200 (8.1%) |
Health Insurance Coverage by Citizenship Status in Carolina
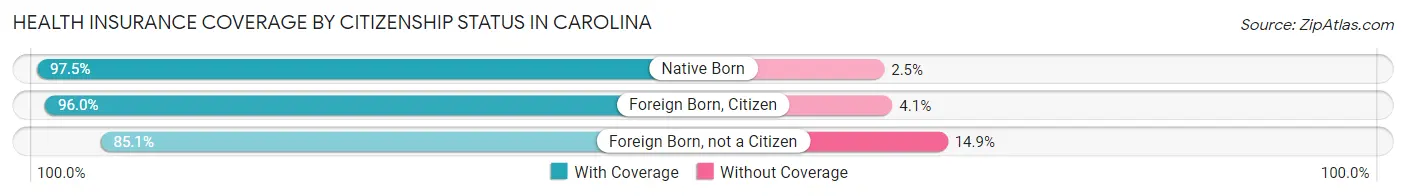
| Citizenship Status | With Coverage | Without Coverage |
| Native Born | 5,621 (97.5%) | 142 (2.5%) |
| Foreign Born, Citizen | 18,004 (96.0%) | 759 (4.1%) |
| Foreign Born, not a Citizen | 11,379 (85.1%) | 1,997 (14.9%) |
Health Insurance Coverage by Household Income in Carolina
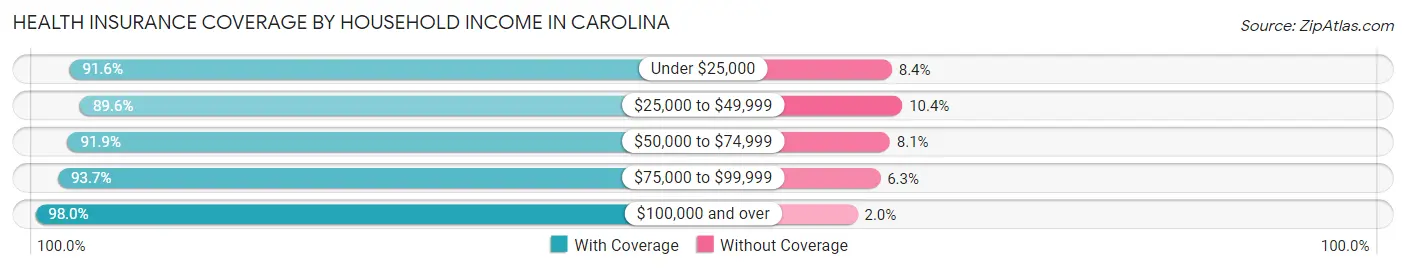
| Household Income | With Coverage | Without Coverage |
| Under $25,000 | 39,901 (91.6%) | 3,672 (8.4%) |
| $25,000 to $49,999 | 36,780 (89.6%) | 4,262 (10.4%) |
| $50,000 to $74,999 | 23,846 (91.9%) | 2,091 (8.1%) |
| $75,000 to $99,999 | 13,451 (93.7%) | 898 (6.3%) |
| $100,000 and over | 13,290 (98.0%) | 272 (2.0%) |
Public vs Private Health Insurance Coverage by Age in Carolina
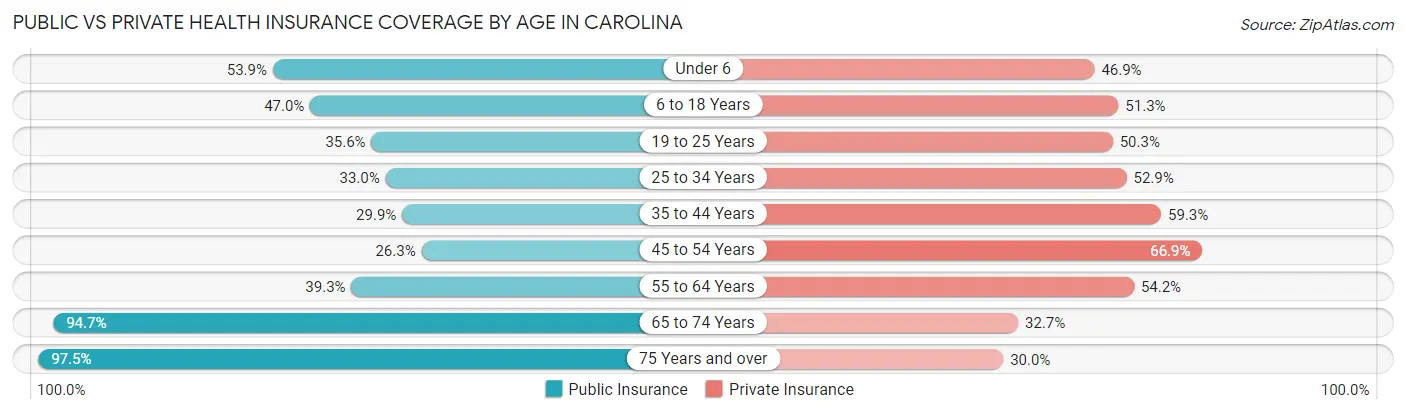
| Age Bracket | Public Insurance | Private Insurance |
| Under 6 | 3,108 (53.9%) | 2,703 (46.9%) |
| 6 to 18 Years | 8,817 (47.0%) | 9,632 (51.3%) |
| 19 to 25 Years | 4,764 (35.6%) | 6,727 (50.3%) |
| 25 to 34 Years | 5,183 (33.0%) | 8,300 (52.9%) |
| 35 to 44 Years | 5,009 (29.9%) | 9,923 (59.3%) |
| 45 to 54 Years | 4,765 (26.3%) | 12,108 (66.9%) |
| 55 to 64 Years | 6,979 (39.3%) | 9,620 (54.2%) |
| 65 to 74 Years | 14,928 (94.7%) | 5,157 (32.7%) |
| 75 Years and over | 16,204 (97.5%) | 4,981 (30.0%) |
| Total | 69,757 (50.3%) | 69,151 (49.9%) |
Disability Status by Sex by Age in Carolina
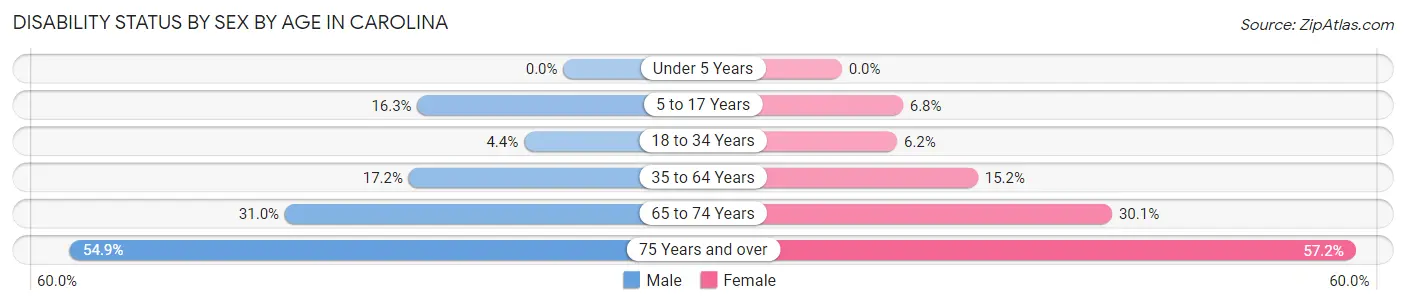
| Age Bracket | Male | Female |
| Under 5 Years | 0 (0.0%) | 0 (0.0%) |
| 5 to 17 Years | 1,467 (16.3%) | 617 (6.8%) |
| 18 to 34 Years | 646 (4.4%) | 983 (6.1%) |
| 35 to 64 Years | 4,082 (17.2%) | 4,372 (15.1%) |
| 65 to 74 Years | 2,004 (31.0%) | 2,800 (30.1%) |
| 75 Years and over | 3,400 (54.9%) | 5,969 (57.2%) |
Disability Class by Sex by Age in Carolina
Disability Class: Hearing Difficulty
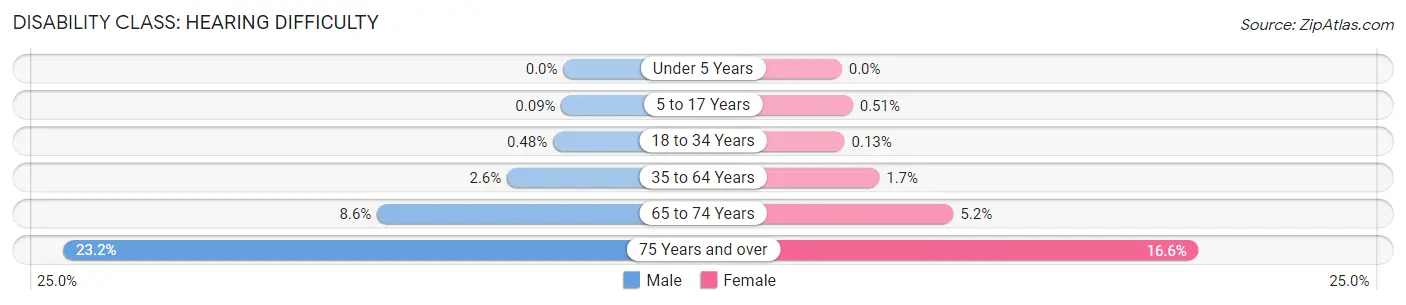
| Age Bracket | Male | Female |
| Under 5 Years | 0 (0.0%) | 0 (0.0%) |
| 5 to 17 Years | 8 (0.1%) | 46 (0.5%) |
| 18 to 34 Years | 71 (0.5%) | 21 (0.1%) |
| 35 to 64 Years | 618 (2.6%) | 502 (1.7%) |
| 65 to 74 Years | 558 (8.6%) | 482 (5.2%) |
| 75 Years and over | 1,437 (23.2%) | 1,728 (16.6%) |
Disability Class: Vision Difficulty
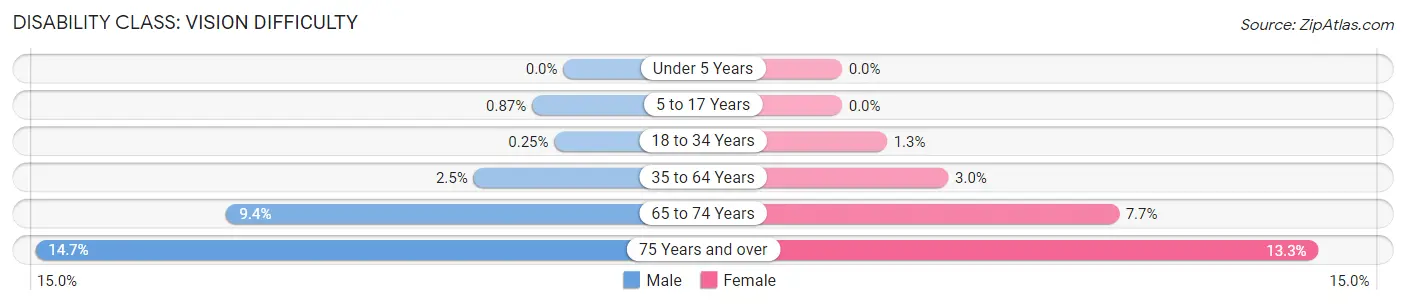
| Age Bracket | Male | Female |
| Under 5 Years | 0 (0.0%) | 0 (0.0%) |
| 5 to 17 Years | 79 (0.9%) | 0 (0.0%) |
| 18 to 34 Years | 37 (0.3%) | 200 (1.3%) |
| 35 to 64 Years | 593 (2.5%) | 855 (3.0%) |
| 65 to 74 Years | 606 (9.4%) | 717 (7.7%) |
| 75 Years and over | 910 (14.7%) | 1,385 (13.3%) |
Disability Class: Cognitive Difficulty
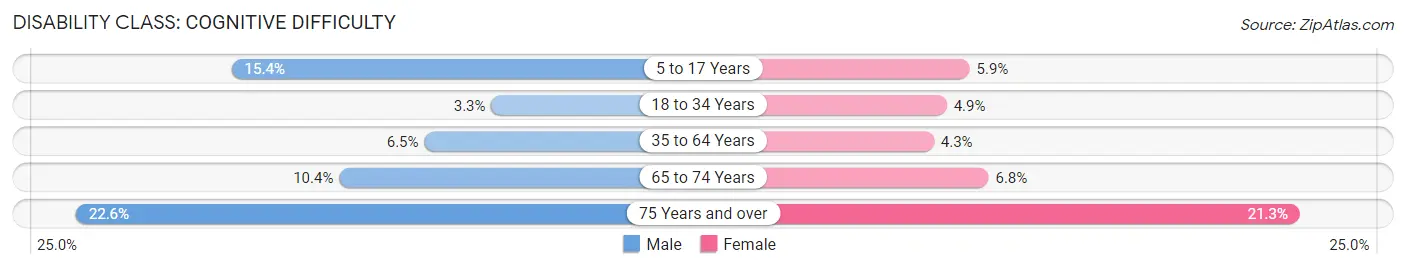
| Age Bracket | Male | Female |
| 5 to 17 Years | 1,390 (15.4%) | 539 (5.9%) |
| 18 to 34 Years | 493 (3.3%) | 779 (4.9%) |
| 35 to 64 Years | 1,529 (6.5%) | 1,232 (4.3%) |
| 65 to 74 Years | 672 (10.4%) | 634 (6.8%) |
| 75 Years and over | 1,400 (22.6%) | 2,217 (21.2%) |
Disability Class: Ambulatory Difficulty
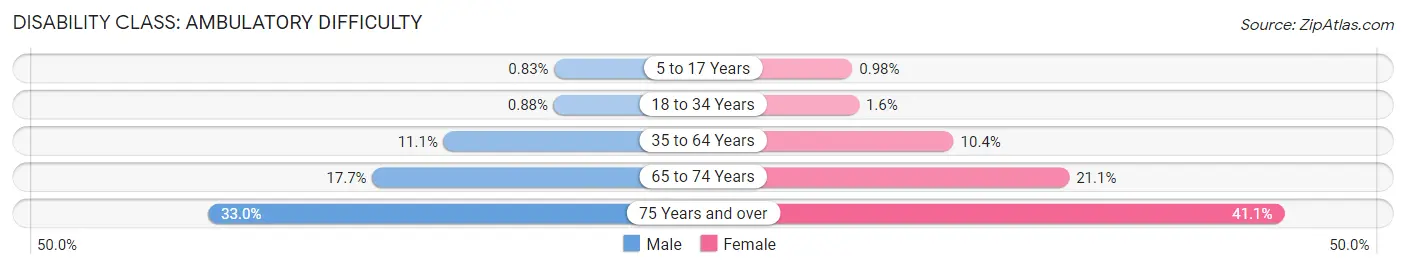
| Age Bracket | Male | Female |
| 5 to 17 Years | 75 (0.8%) | 89 (1.0%) |
| 18 to 34 Years | 130 (0.9%) | 255 (1.6%) |
| 35 to 64 Years | 2,633 (11.1%) | 2,996 (10.4%) |
| 65 to 74 Years | 1,145 (17.7%) | 1,964 (21.1%) |
| 75 Years and over | 2,040 (33.0%) | 4,285 (41.1%) |
Disability Class: Self-Care Difficulty
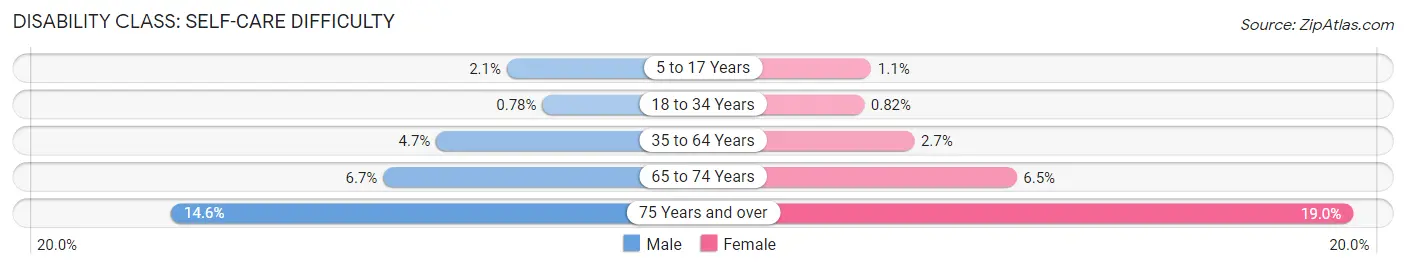
| Age Bracket | Male | Female |
| 5 to 17 Years | 190 (2.1%) | 98 (1.1%) |
| 18 to 34 Years | 115 (0.8%) | 131 (0.8%) |
| 35 to 64 Years | 1,119 (4.7%) | 772 (2.7%) |
| 65 to 74 Years | 432 (6.7%) | 603 (6.5%) |
| 75 Years and over | 901 (14.6%) | 1,980 (19.0%) |
Technology Access in Carolina
Computing Device Access in Carolina
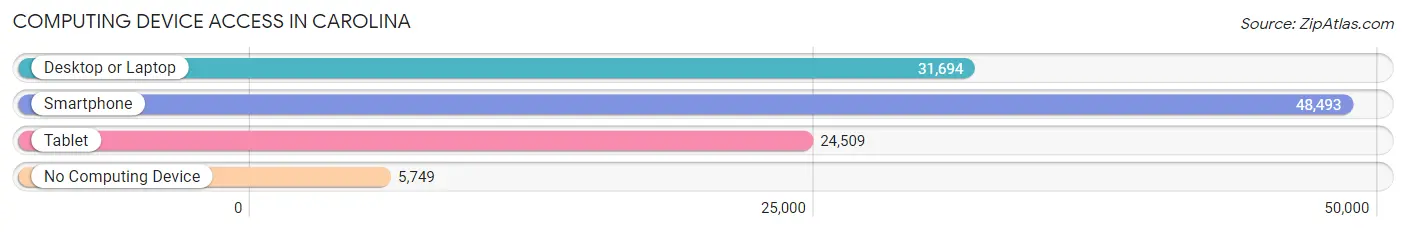
| Device Type | # Households | % Households |
| Desktop or Laptop | 31,694 | 55.9% |
| Smartphone | 48,493 | 85.6% |
| Tablet | 24,509 | 43.3% |
| No Computing Device | 5,749 | 10.2% |
| Total | 56,654 | 100.0% |
Internet Access in Carolina
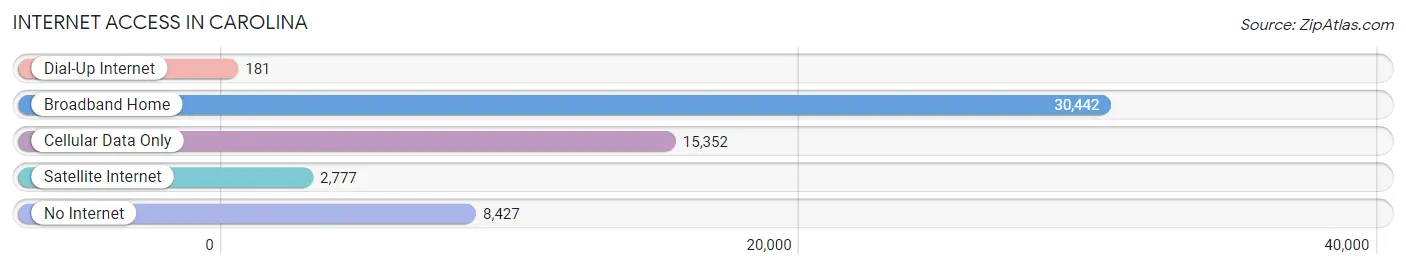
| Internet Type | # Households | % Households |
| Dial-Up Internet | 181 | 0.3% |
| Broadband Home | 30,442 | 53.7% |
| Cellular Data Only | 15,352 | 27.1% |
| Satellite Internet | 2,777 | 4.9% |
| No Internet | 8,427 | 14.9% |
| Total | 56,654 | 100.0% |
Carolina Summary
Carolina is a municipality located in the northern coast of Puerto Rico. It is part of the San Juan-Caguas-Guaynabo Metropolitan Statistical Area. As of the 2010 census, it had a population of 176,762, making it the third most populous municipality in Puerto Rico.
History
Carolina was founded in 1816 by Don Tomás Pizarro, who named it after his wife, Carolina. The town was originally part of the municipality of Trujillo Alto, but was separated in 1857. During the Spanish-American War, the town was occupied by the United States in 1898.
Geography
Carolina is located in the northern coast of Puerto Rico, bordered by the municipalities of Trujillo Alto, San Juan, Canóvanas, Loíza, and Río Grande. It is situated on the Atlantic Ocean and is home to the Isla Verde beach. The municipality has a total area of 24.2 square miles.
Economy
Carolina is home to the Luis Muñoz Marín International Airport, the largest airport in Puerto Rico. The airport is a major economic driver for the municipality, providing jobs and generating revenue. Other major industries in the area include tourism, manufacturing, and retail.
Demographics
As of the 2010 census, Carolina had a population of 176,762. The population is predominantly of Hispanic origin, with a small percentage of African-American and White residents. The median household income is $20,845, and the poverty rate is 28.3%. The majority of the population is Roman Catholic, with a small percentage of other religious affiliations.
Common Questions
What is Per Capita Income in Carolina?
Per Capita income in Carolina is $19,522.
What is the Median Family Income in Carolina?
Median Family Income in Carolina is $38,860.
What is the Median Household income in Carolina?
Median Household Income in Carolina is $33,548.
What is Income or Wage Gap in Carolina?
Income or Wage Gap in Carolina is 9.5%.
Women in Carolina earn 90.5 cents for every dollar earned by a man.
What is Family Income Deficit in Carolina?
Family Income Deficit in Carolina is $11,607.
Families that are below poverty line in Carolina earn $11,607 less on average than the poverty threshold level.
What is Inequality or Gini Index in Carolina?
Inequality or Gini Index in Carolina is 0.48.
What is the Total Population of Carolina?
Total Population of Carolina is 139,201.
What is the Total Male Population of Carolina?
Total Male Population of Carolina is 62,812.
What is the Total Female Population of Carolina?
Total Female Population of Carolina is 76,389.
What is the Ratio of Males per 100 Females in Carolina?
There are 82.23 Males per 100 Females in Carolina.
What is the Ratio of Females per 100 Males in Carolina?
There are 121.62 Females per 100 Males in Carolina.
What is the Median Population Age in Carolina?
Median Population Age in Carolina is 44.3 Years.
What is the Average Family Size in Carolina
Average Family Size in Carolina is 3.0 People.
What is the Average Household Size in Carolina
Average Household Size in Carolina is 2.5 People.
How Large is the Labor Force in Carolina?
There are 63,330 People in the Labor Forcein in Carolina.
What is the Percentage of People in the Labor Force in Carolina?
53.0% of People are in the Labor Force in Carolina.
What is the Unemployment Rate in Carolina?
Unemployment Rate in Carolina is 13.5%.