Vega Baja, PR Map & Demographics
Vega Baja Map
Vega Baja Overview
$12,801
PER CAPITA INCOME
$26,632
AVG FAMILY INCOME
$22,544
AVG HOUSEHOLD INCOME
2.6%
WAGE / INCOME GAP [ % ]
97.4¢/ $1
WAGE / INCOME GAP [ $ ]
$12,102
FAMILY INCOME DEFICIT
0.49
INEQUALITY / GINI INDEX
23,418
TOTAL POPULATION
11,181
MALE POPULATION
12,237
FEMALE POPULATION
91.37
MALES / 100 FEMALES
109.44
FEMALES / 100 MALES
43.1
MEDIAN AGE
3.3
AVG FAMILY SIZE
2.6
AVG HOUSEHOLD SIZE
8,809
LABOR FORCE [ PEOPLE ]
44.7%
PERCENT IN LABOR FORCE
17.8%
UNEMPLOYMENT RATE
Vega Baja Area Codes
Income in Vega Baja
Income Overview in Vega Baja
Per Capita Income in Vega Baja is $12,801, while median incomes of families and households are $26,632 and $22,544 respectively.
| Characteristic | Number | Measure |
| Per Capita Income | 23,418 | $12,801 |
| Median Family Income | 5,679 | $26,632 |
| Mean Family Income | 5,679 | $34,533 |
| Median Household Income | 8,906 | $22,544 |
| Mean Household Income | 8,906 | $31,078 |
| Income Deficit | 5,679 | $12,102 |
| Wage / Income Gap (%) | 23,418 | 2.64% |
| Wage / Income Gap ($) | 23,418 | 97.36¢ per $1 |
| Gini / Inequality Index | 23,418 | 0.49 |
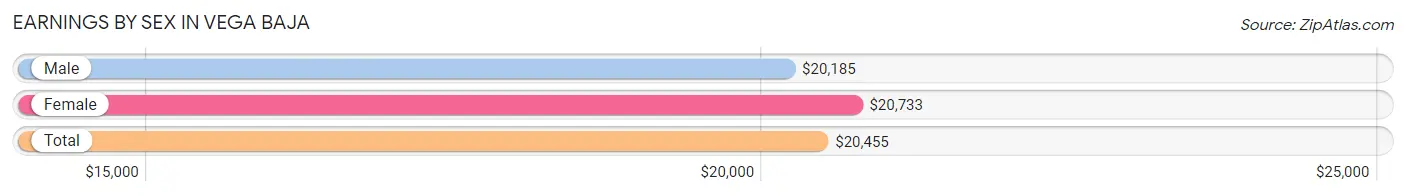
Earnings by Sex in Vega Baja
Average Earnings in Vega Baja are $20,455, $20,185 for men and $20,733 for women, a difference of 2.6%.
| Sex | Number | Average Earnings |
| Male | 4,107 (53.0%) | $20,185 |
| Female | 3,640 (47.0%) | $20,733 |
| Total | 7,747 (100.0%) | $20,455 |
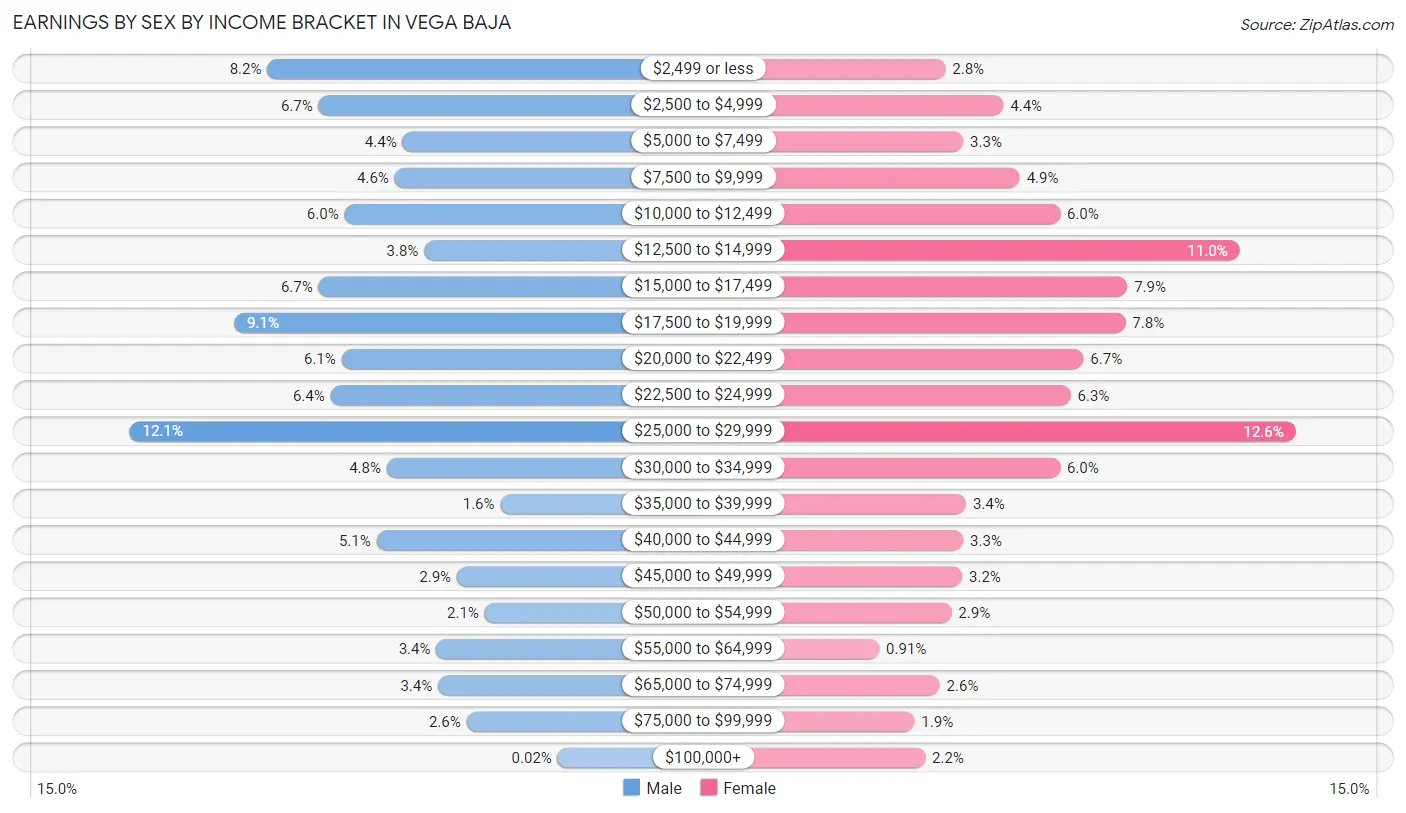
Earnings by Sex by Income Bracket in Vega Baja
The most common earnings brackets in Vega Baja are $25,000 to $29,999 for men (495 | 12.0%) and $25,000 to $29,999 for women (459 | 12.6%).
| Income | Male | Female |
| $2,499 or less | 336 (8.2%) | 101 (2.8%) |
| $2,500 to $4,999 | 277 (6.7%) | 160 (4.4%) |
| $5,000 to $7,499 | 180 (4.4%) | 119 (3.3%) |
| $7,500 to $9,999 | 189 (4.6%) | 177 (4.9%) |
| $10,000 to $12,499 | 247 (6.0%) | 218 (6.0%) |
| $12,500 to $14,999 | 155 (3.8%) | 402 (11.0%) |
| $15,000 to $17,499 | 277 (6.7%) | 287 (7.9%) |
| $17,500 to $19,999 | 374 (9.1%) | 285 (7.8%) |
| $20,000 to $22,499 | 250 (6.1%) | 242 (6.7%) |
| $22,500 to $24,999 | 263 (6.4%) | 229 (6.3%) |
| $25,000 to $29,999 | 495 (12.0%) | 459 (12.6%) |
| $30,000 to $34,999 | 198 (4.8%) | 218 (6.0%) |
| $35,000 to $39,999 | 67 (1.6%) | 122 (3.4%) |
| $40,000 to $44,999 | 210 (5.1%) | 119 (3.3%) |
| $45,000 to $49,999 | 117 (2.9%) | 118 (3.2%) |
| $50,000 to $54,999 | 85 (2.1%) | 107 (2.9%) |
| $55,000 to $64,999 | 141 (3.4%) | 33 (0.9%) |
| $65,000 to $74,999 | 139 (3.4%) | 95 (2.6%) |
| $75,000 to $99,999 | 106 (2.6%) | 69 (1.9%) |
| $100,000+ | 1 (0.0%) | 80 (2.2%) |
| Total | 4,107 (100.0%) | 3,640 (100.0%) |
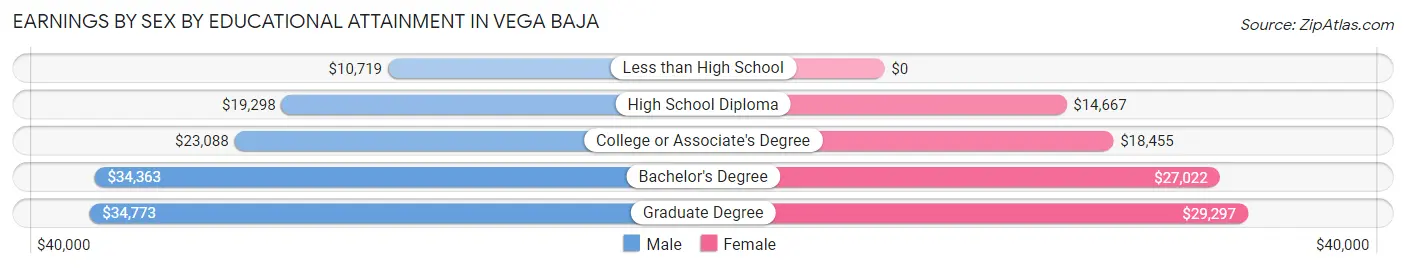
Earnings by Sex by Educational Attainment in Vega Baja
Average earnings in Vega Baja are $21,680 for men and $21,833 for women, a difference of 0.7%. Men with an educational attainment of graduate degree enjoy the highest average annual earnings of $34,773, while those with less than high school education earn the least with $10,719. Women with an educational attainment of graduate degree earn the most with the average annual earnings of $29,297, while those with high school diploma education have the smallest earnings of $14,667.
| Educational Attainment | Male Income | Female Income |
| Less than High School | $10,719 | $0 |
| High School Diploma | $19,298 | $14,667 |
| College or Associate's Degree | $23,088 | $18,455 |
| Bachelor's Degree | $34,363 | $27,022 |
| Graduate Degree | $34,773 | $29,297 |
| Total | $21,680 | $21,833 |
Family Income in Vega Baja
Family Income Brackets in Vega Baja
According to the Vega Baja family income data, there are 1,119 families falling into the $15,000 to $24,999 income range, which is the most common income bracket and makes up 19.7% of all families.
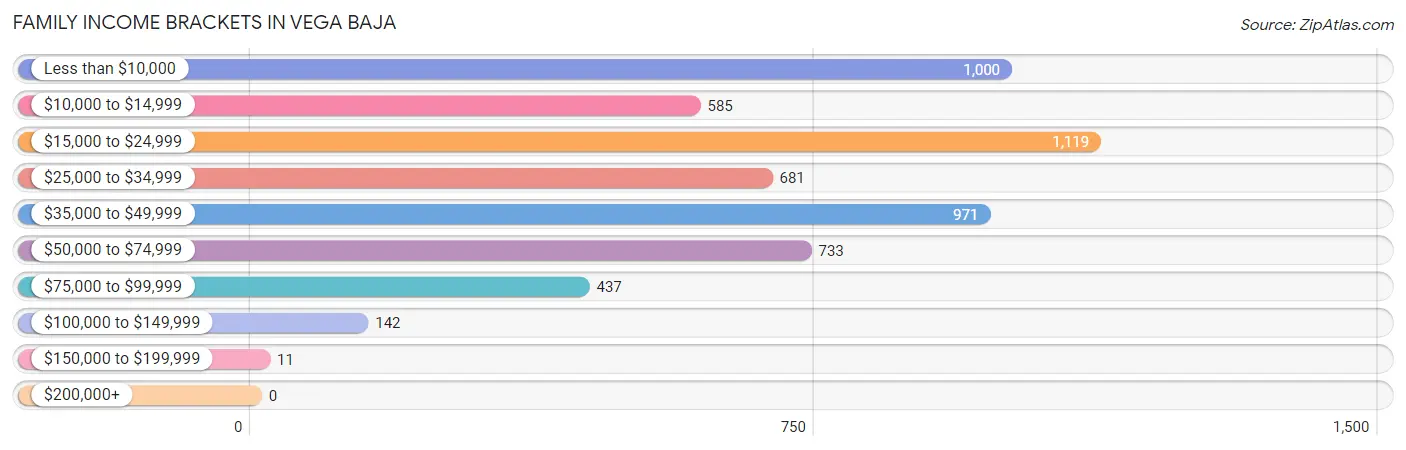
| Income Bracket | # Families | % Families |
| Less than $10,000 | 1,000 | 17.6% |
| $10,000 to $14,999 | 585 | 10.3% |
| $15,000 to $24,999 | 1,119 | 19.7% |
| $25,000 to $34,999 | 681 | 12.0% |
| $35,000 to $49,999 | 971 | 17.1% |
| $50,000 to $74,999 | 733 | 12.9% |
| $75,000 to $99,999 | 437 | 7.7% |
| $100,000 to $149,999 | 142 | 2.5% |
| $150,000 to $199,999 | 11 | 0.2% |
| $200,000+ | 0 | 0.0% |
Family Income by Famaliy Size in Vega Baja
5-person families (231 | 4.1%) account for the highest median family income in Vega Baja with $50,352 per family, while 3-person families (1,788 | 31.5%) have the highest median income of $11,318 per family member.
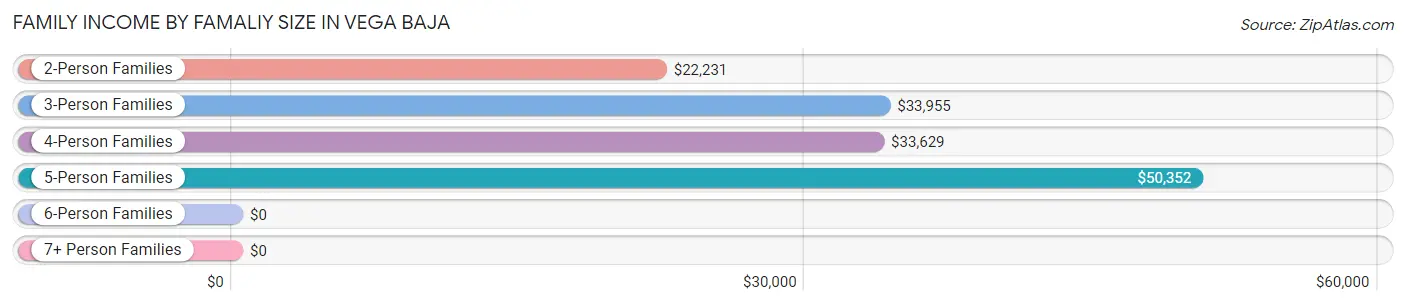
| Income Bracket | # Families | Median Income |
| 2-Person Families | 2,553 (45.0%) | $22,231 |
| 3-Person Families | 1,788 (31.5%) | $33,955 |
| 4-Person Families | 1,074 (18.9%) | $33,629 |
| 5-Person Families | 231 (4.1%) | $50,352 |
| 6-Person Families | 33 (0.6%) | $0 |
| 7+ Person Families | 0 (0.0%) | $0 |
| Total | 5,679 (100.0%) | $26,632 |
Family Income by Number of Earners in Vega Baja
The median family income in Vega Baja is $26,632, with families comprising 3+ earners (85) having the highest median family income of $61,607, while families with no earners (1,983) have the lowest median family income of $17,480, accounting for 1.5% and 34.9% of families, respectively.
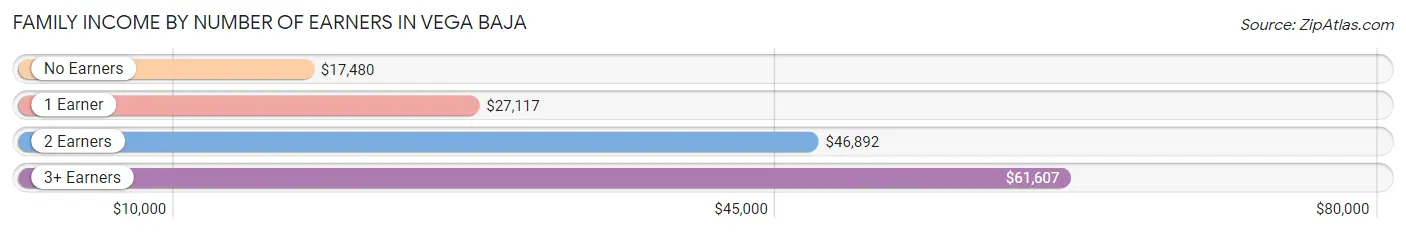
| Number of Earners | # Families | Median Income |
| No Earners | 1,983 (34.9%) | $17,480 |
| 1 Earner | 2,612 (46.0%) | $27,117 |
| 2 Earners | 999 (17.6%) | $46,892 |
| 3+ Earners | 85 (1.5%) | $61,607 |
| Total | 5,679 (100.0%) | $26,632 |
Household Income in Vega Baja
Household Income Brackets in Vega Baja
With 2,120 households falling in the category, the less than $10,000 income range is the most frequent in Vega Baja, accounting for 23.8% of all households.
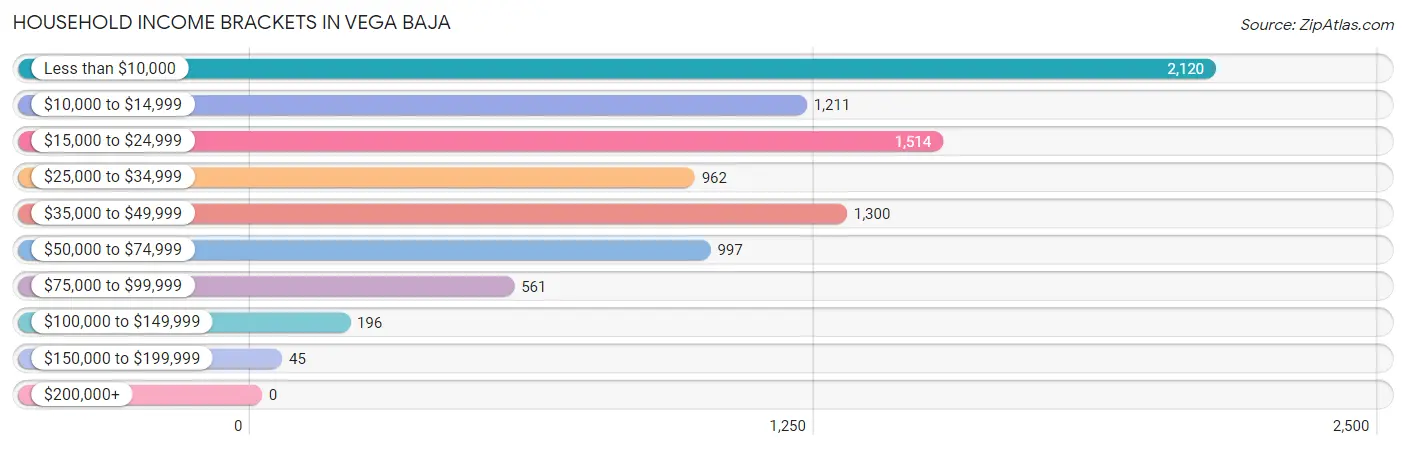
| Income Bracket | # Households | % Households |
| Less than $10,000 | 2,120 | 23.8% |
| $10,000 to $14,999 | 1,211 | 13.6% |
| $15,000 to $24,999 | 1,514 | 17.0% |
| $25,000 to $34,999 | 962 | 10.8% |
| $35,000 to $49,999 | 1,300 | 14.6% |
| $50,000 to $74,999 | 997 | 11.2% |
| $75,000 to $99,999 | 561 | 6.3% |
| $100,000 to $149,999 | 196 | 2.2% |
| $150,000 to $199,999 | 45 | 0.5% |
| $200,000+ | 0 | 0.0% |
Household Income by Householder Age in Vega Baja
The median household income in Vega Baja is $22,544, with the highest median household income of $29,125 found in the 25 to 44 years age bracket for the primary householder. A total of 2,208 households (24.8%) fall into this category. Meanwhile, the 15 to 24 years age bracket for the primary householder has the lowest median household income of $0, with 58 households (0.6%) in this group.
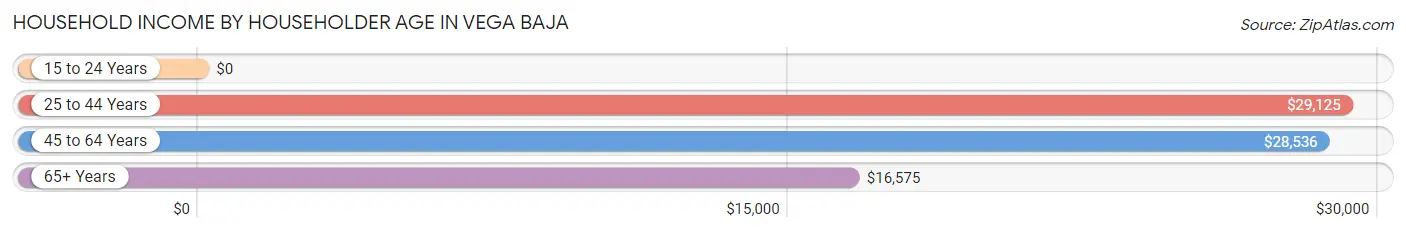
| Income Bracket | # Households | Median Income |
| 15 to 24 Years | 58 (0.6%) | $0 |
| 25 to 44 Years | 2,208 (24.8%) | $29,125 |
| 45 to 64 Years | 3,045 (34.2%) | $28,536 |
| 65+ Years | 3,595 (40.4%) | $16,575 |
| Total | 8,906 (100.0%) | $22,544 |
Poverty in Vega Baja
Income Below Poverty by Sex and Age in Vega Baja
With 40.0% poverty level for males and 46.6% for females among the residents of Vega Baja, 16 and 17 year old males and 15 year old females are the most vulnerable to poverty, with 328 males (78.1%) and 151 females (74.8%) in their respective age groups living below the poverty level.
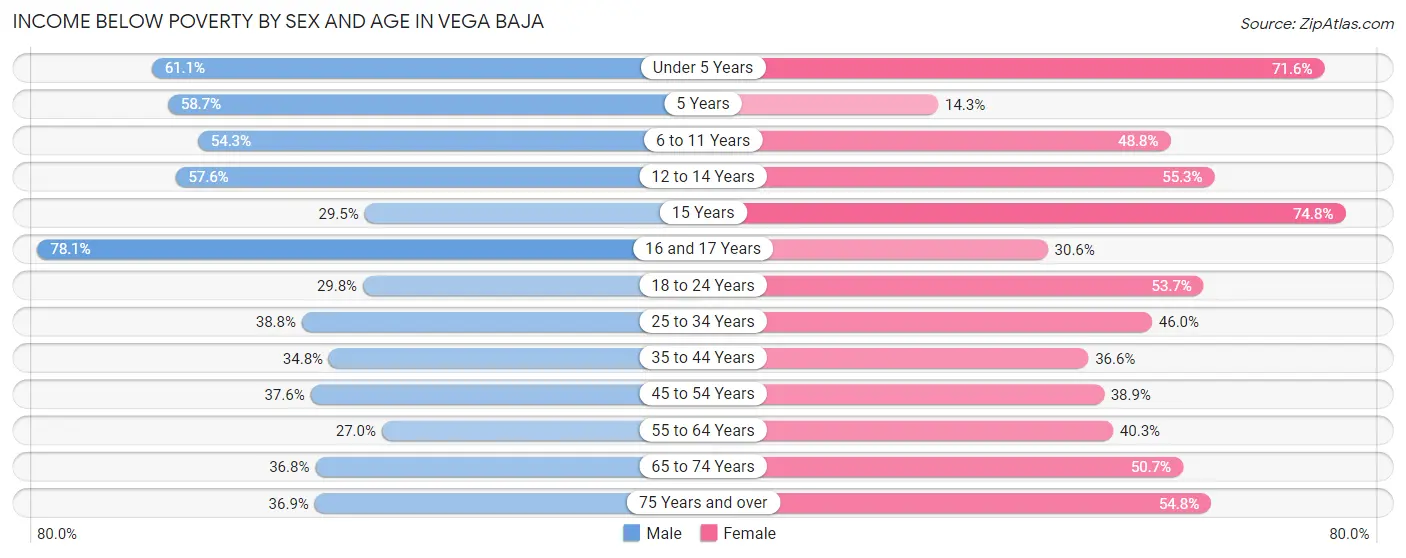
| Age Bracket | Male | Female |
| Under 5 Years | 316 (61.1%) | 260 (71.6%) |
| 5 Years | 37 (58.7%) | 8 (14.3%) |
| 6 to 11 Years | 470 (54.3%) | 239 (48.8%) |
| 12 to 14 Years | 235 (57.6%) | 260 (55.3%) |
| 15 Years | 67 (29.5%) | 151 (74.8%) |
| 16 and 17 Years | 328 (78.1%) | 77 (30.6%) |
| 18 to 24 Years | 311 (29.8%) | 446 (53.7%) |
| 25 to 34 Years | 536 (38.8%) | 802 (46.0%) |
| 35 to 44 Years | 470 (34.8%) | 517 (36.6%) |
| 45 to 54 Years | 561 (37.6%) | 637 (38.9%) |
| 55 to 64 Years | 313 (27.0%) | 688 (40.3%) |
| 65 to 74 Years | 448 (36.8%) | 814 (50.6%) |
| 75 Years and over | 363 (36.9%) | 773 (54.8%) |
| Total | 4,455 (40.0%) | 5,672 (46.6%) |
Income Above Poverty by Sex and Age in Vega Baja
According to the poverty statistics in Vega Baja, males aged 55 to 64 years and females aged 5 years are the age groups that are most secure financially, with 73.0% of males and 85.7% of females in these age groups living above the poverty line.
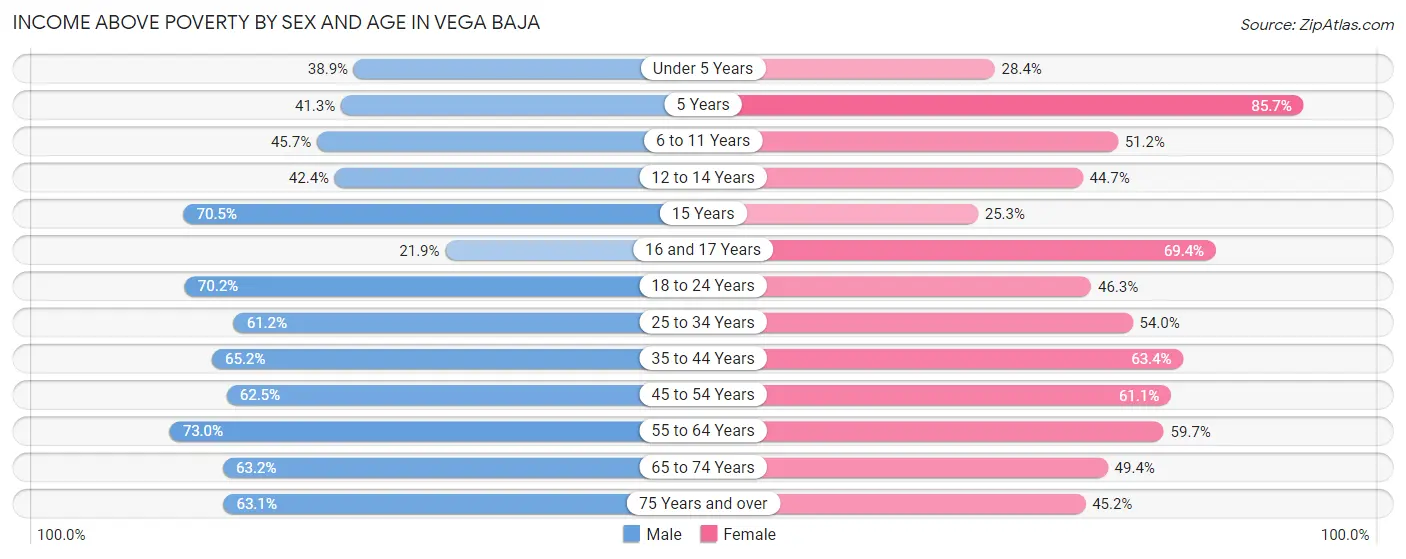
| Age Bracket | Male | Female |
| Under 5 Years | 201 (38.9%) | 103 (28.4%) |
| 5 Years | 26 (41.3%) | 48 (85.7%) |
| 6 to 11 Years | 396 (45.7%) | 251 (51.2%) |
| 12 to 14 Years | 173 (42.4%) | 210 (44.7%) |
| 15 Years | 160 (70.5%) | 51 (25.3%) |
| 16 and 17 Years | 92 (21.9%) | 175 (69.4%) |
| 18 to 24 Years | 734 (70.2%) | 384 (46.3%) |
| 25 to 34 Years | 844 (61.2%) | 940 (54.0%) |
| 35 to 44 Years | 880 (65.2%) | 896 (63.4%) |
| 45 to 54 Years | 933 (62.5%) | 1,001 (61.1%) |
| 55 to 64 Years | 848 (73.0%) | 1,021 (59.7%) |
| 65 to 74 Years | 768 (63.2%) | 793 (49.3%) |
| 75 Years and over | 620 (63.1%) | 637 (45.2%) |
| Total | 6,675 (60.0%) | 6,510 (53.4%) |
Income Below Poverty Among Married-Couple Families in Vega Baja
The poverty statistics for married-couple families in Vega Baja show that 23.0% or 662 of the total 2,885 families live below the poverty line. Families with 1 or 2 children have the highest poverty rate of 33.8%, comprising of 252 families. On the other hand, families with no children have the lowest poverty rate of 18.9%, which includes 392 families.
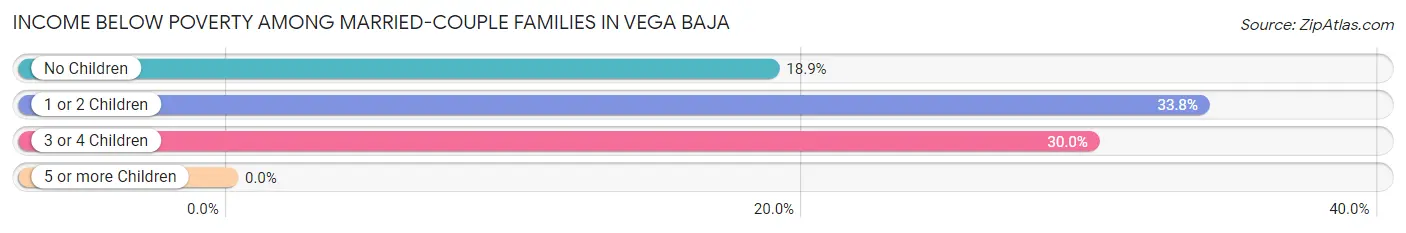
| Children | Above Poverty | Below Poverty |
| No Children | 1,688 (81.1%) | 392 (18.9%) |
| 1 or 2 Children | 493 (66.2%) | 252 (33.8%) |
| 3 or 4 Children | 42 (70.0%) | 18 (30.0%) |
| 5 or more Children | 0 (0.0%) | 0 (0.0%) |
| Total | 2,223 (77.0%) | 662 (23.0%) |
Income Below Poverty Among Single-Parent Households in Vega Baja
According to the poverty data in Vega Baja, 47.1% or 387 single-father households and 59.1% or 1,165 single-mother households are living below the poverty line. Among single-father households, those with no children have the highest poverty rate, with 172 households (48.3%) experiencing poverty. Likewise, among single-mother households, those with 3 or 4 children have the highest poverty rate, with 194 households (100.0%) falling below the poverty line.
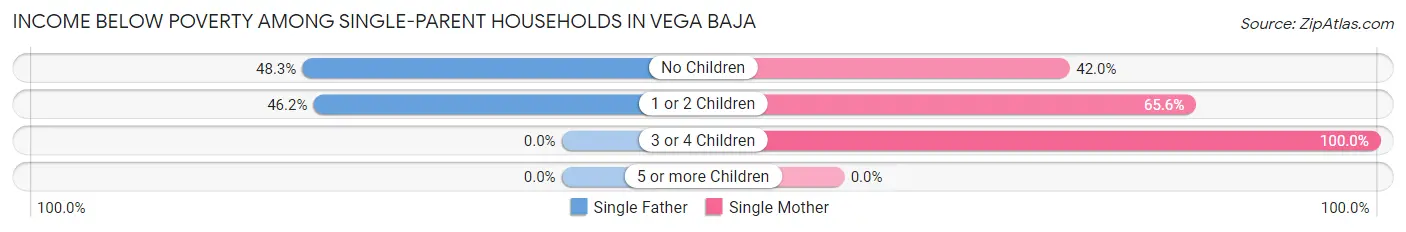
| Children | Single Father | Single Mother |
| No Children | 172 (48.3%) | 350 (42.0%) |
| 1 or 2 Children | 215 (46.2%) | 621 (65.6%) |
| 3 or 4 Children | 0 (0.0%) | 194 (100.0%) |
| 5 or more Children | 0 (0.0%) | 0 (0.0%) |
| Total | 387 (47.1%) | 1,165 (59.1%) |
Income Below Poverty Among Married-Couple vs Single-Parent Households in Vega Baja
The poverty data for Vega Baja shows that 662 of the married-couple family households (23.0%) and 1,552 of the single-parent households (55.5%) are living below the poverty level. Within the married-couple family households, those with 1 or 2 children have the highest poverty rate, with 252 households (33.8%) falling below the poverty line. Among the single-parent households, those with 3 or 4 children have the highest poverty rate, with 194 household (100.0%) living below poverty.
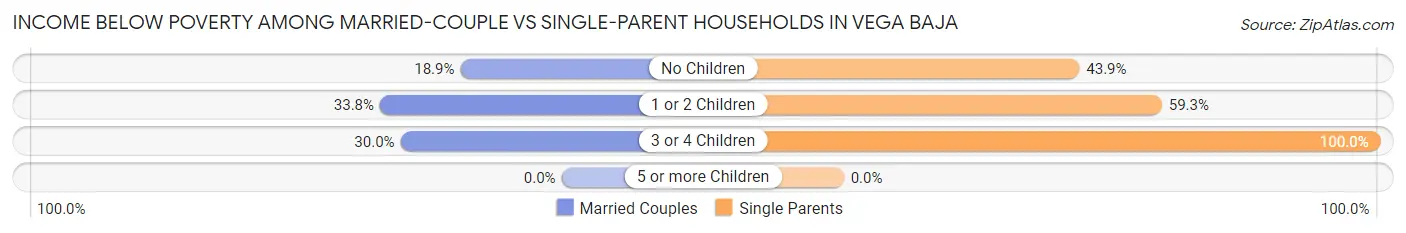
| Children | Married-Couple Families | Single-Parent Households |
| No Children | 392 (18.9%) | 522 (43.9%) |
| 1 or 2 Children | 252 (33.8%) | 836 (59.3%) |
| 3 or 4 Children | 18 (30.0%) | 194 (100.0%) |
| 5 or more Children | 0 (0.0%) | 0 (0.0%) |
| Total | 662 (23.0%) | 1,552 (55.5%) |
Race in Vega Baja
The most populous races in Vega Baja are Hispanic or Latino (22,961 | 98.1%), White / Caucasian (9,940 | 42.4%), and Two or more Races (8,657 | 37.0%).
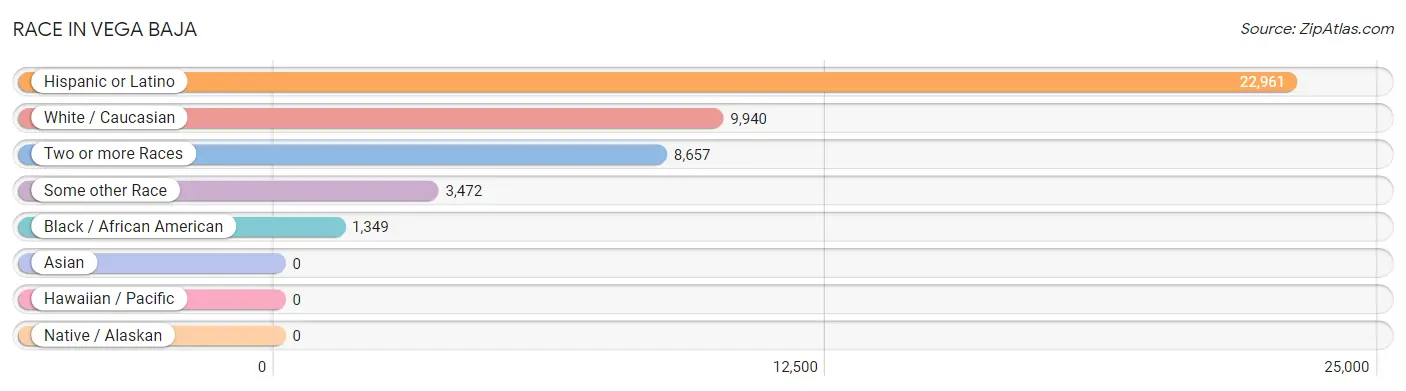
| Race | # Population | % Population |
| Asian | 0 | 0.0% |
| Black / African American | 1,349 | 5.8% |
| Hawaiian / Pacific | 0 | 0.0% |
| Hispanic or Latino | 22,961 | 98.1% |
| Native / Alaskan | 0 | 0.0% |
| White / Caucasian | 9,940 | 42.4% |
| Two or more Races | 8,657 | 37.0% |
| Some other Race | 3,472 | 14.8% |
| Total | 23,418 | 100.0% |
Ancestry in Vega Baja
The most populous ancestries reported in Vega Baja are Puerto Rican (22,750 | 97.2%), American (182 | 0.8%), Mexican (73 | 0.3%), African (43 | 0.2%), and Subsaharan African (43 | 0.2%), together accounting for 98.6% of all Vega Baja residents.
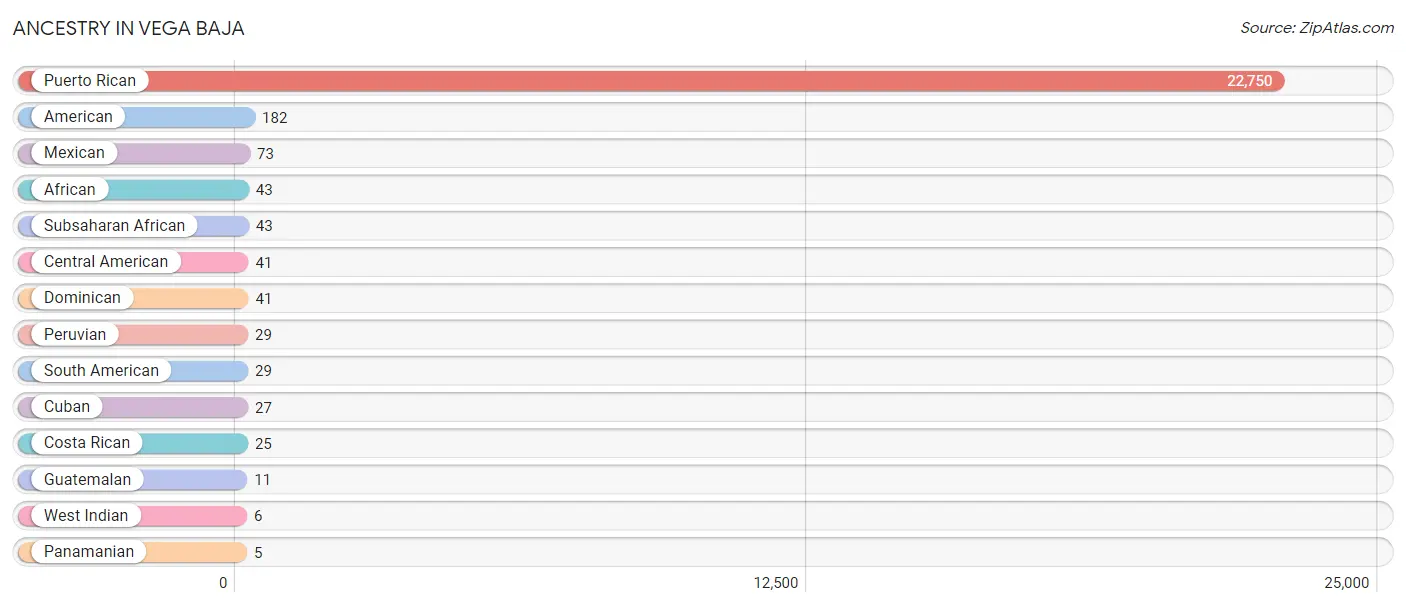
| Ancestry | # Population | % Population |
| African | 43 | 0.2% |
| American | 182 | 0.8% |
| Central American | 41 | 0.2% |
| Costa Rican | 25 | 0.1% |
| Cuban | 27 | 0.1% |
| Dominican | 41 | 0.2% |
| Guatemalan | 11 | 0.1% |
| Mexican | 73 | 0.3% |
| Panamanian | 5 | 0.0% |
| Peruvian | 29 | 0.1% |
| Puerto Rican | 22,750 | 97.2% |
| South American | 29 | 0.1% |
| Subsaharan African | 43 | 0.2% |
| West Indian | 6 | 0.0% | View All 14 Rows |
Immigrants in Vega Baja

| Immigration Origin | # Population | % Population | View All 0 Rows |
Sex and Age in Vega Baja
Sex and Age in Vega Baja
The most populous age groups in Vega Baja are 15 to 19 Years (893 | 8.0%) for men and 55 to 59 Years (955 | 7.8%) for women.
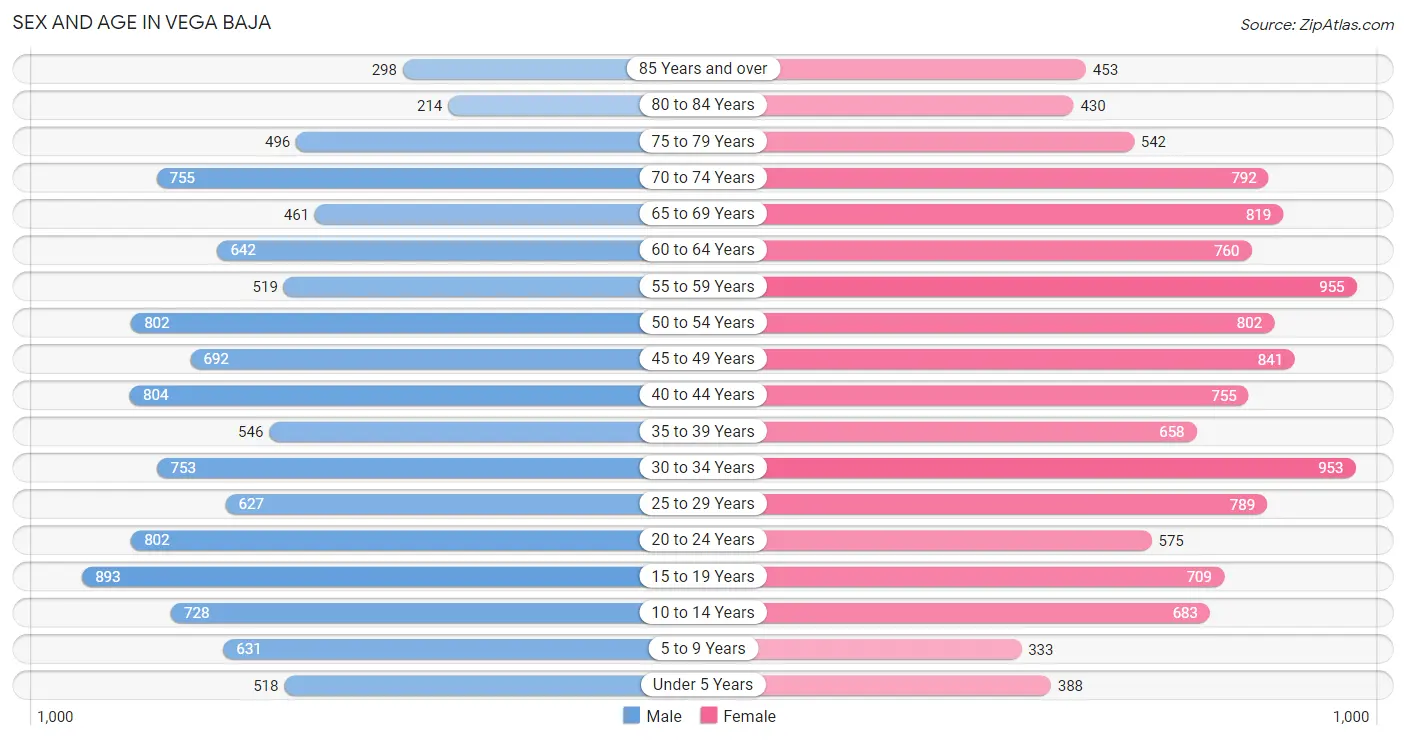
| Age Bracket | Male | Female |
| Under 5 Years | 518 (4.6%) | 388 (3.2%) |
| 5 to 9 Years | 631 (5.6%) | 333 (2.7%) |
| 10 to 14 Years | 728 (6.5%) | 683 (5.6%) |
| 15 to 19 Years | 893 (8.0%) | 709 (5.8%) |
| 20 to 24 Years | 802 (7.2%) | 575 (4.7%) |
| 25 to 29 Years | 627 (5.6%) | 789 (6.5%) |
| 30 to 34 Years | 753 (6.7%) | 953 (7.8%) |
| 35 to 39 Years | 546 (4.9%) | 658 (5.4%) |
| 40 to 44 Years | 804 (7.2%) | 755 (6.2%) |
| 45 to 49 Years | 692 (6.2%) | 841 (6.9%) |
| 50 to 54 Years | 802 (7.2%) | 802 (6.6%) |
| 55 to 59 Years | 519 (4.6%) | 955 (7.8%) |
| 60 to 64 Years | 642 (5.7%) | 760 (6.2%) |
| 65 to 69 Years | 461 (4.1%) | 819 (6.7%) |
| 70 to 74 Years | 755 (6.8%) | 792 (6.5%) |
| 75 to 79 Years | 496 (4.4%) | 542 (4.4%) |
| 80 to 84 Years | 214 (1.9%) | 430 (3.5%) |
| 85 Years and over | 298 (2.7%) | 453 (3.7%) |
| Total | 11,181 (100.0%) | 12,237 (100.0%) |
Families and Households in Vega Baja
Median Family Size in Vega Baja
The median family size in Vega Baja is 3.28 persons per family, with married-couple families (2,885 | 50.8%) accounting for the largest median family size of 3.35 persons per family. On the other hand, single male/father families (821 | 14.5%) represent the smallest median family size with 2.95 persons per family.
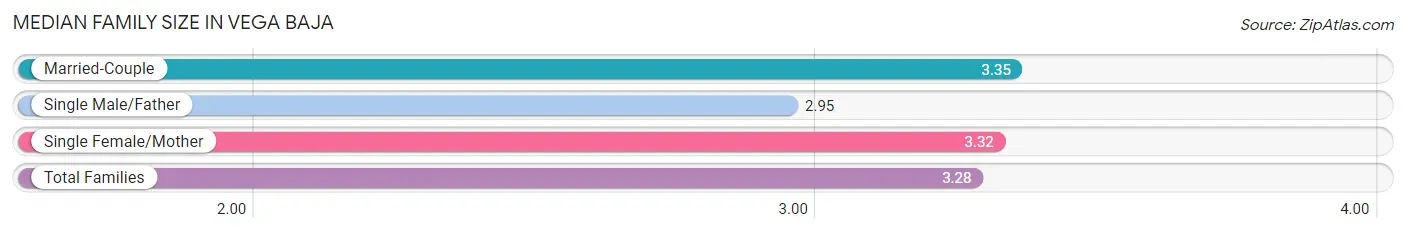
| Family Type | # Families | Family Size |
| Married-Couple | 2,885 (50.8%) | 3.35 |
| Single Male/Father | 821 (14.5%) | 2.95 |
| Single Female/Mother | 1,973 (34.7%) | 3.32 |
| Total Families | 5,679 (100.0%) | 3.28 |
Median Household Size in Vega Baja
The median household size in Vega Baja is 2.62 persons per household, with single female/mother households (1,973 | 22.2%) accounting for the largest median household size of 3.58 persons per household. non-family households (3,227 | 36.2%) represent the smallest median household size with 1.13 persons per household.
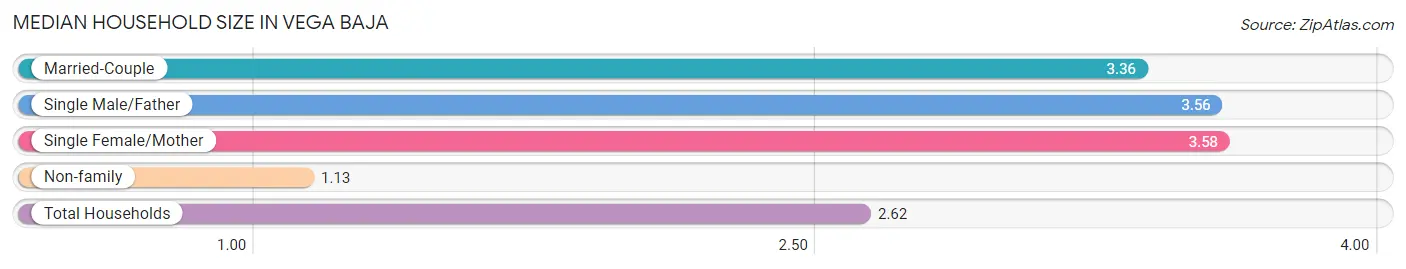
| Household Type | # Households | Household Size |
| Married-Couple | 2,885 (32.4%) | 3.36 |
| Single Male/Father | 821 (9.2%) | 3.56 |
| Single Female/Mother | 1,973 (22.2%) | 3.58 |
| Non-family | 3,227 (36.2%) | 1.13 |
| Total Households | 8,906 (100.0%) | 2.62 |
Household Size by Marriage Status in Vega Baja
Out of a total of 8,906 households in Vega Baja, 5,679 (63.8%) are family households, while 3,227 (36.2%) are nonfamily households. The most numerous type of family households are 2-person households, comprising 2,175, and the most common type of nonfamily households are 1-person households, comprising 2,787.
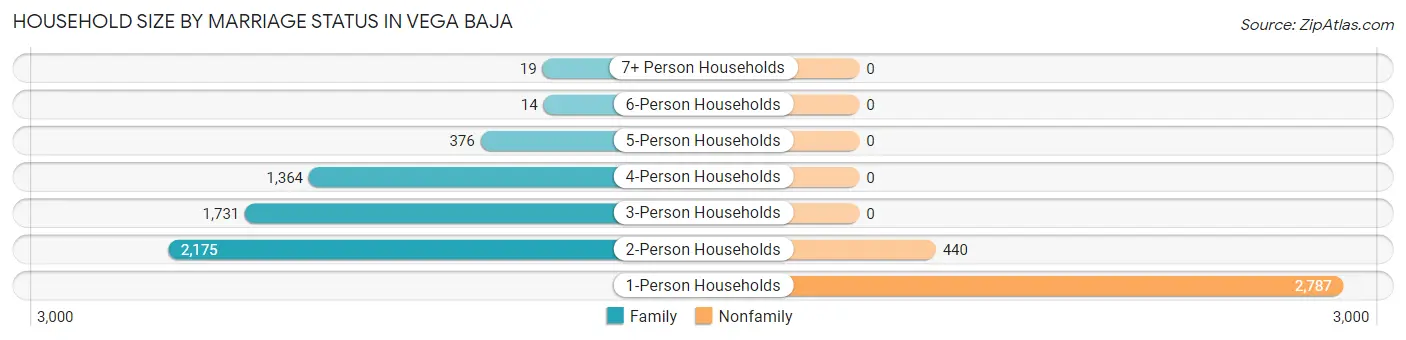
| Household Size | Family Households | Nonfamily Households |
| 1-Person Households | - | 2,787 (31.3%) |
| 2-Person Households | 2,175 (24.4%) | 440 (4.9%) |
| 3-Person Households | 1,731 (19.4%) | 0 (0.0%) |
| 4-Person Households | 1,364 (15.3%) | 0 (0.0%) |
| 5-Person Households | 376 (4.2%) | 0 (0.0%) |
| 6-Person Households | 14 (0.2%) | 0 (0.0%) |
| 7+ Person Households | 19 (0.2%) | 0 (0.0%) |
| Total | 5,679 (63.8%) | 3,227 (36.2%) |
Female Fertility in Vega Baja
Fertility by Age in Vega Baja
Average fertility rate in Vega Baja is 23.0 births per 1,000 women. Women in the age bracket of 20 to 34 years have the highest fertility rate with 54.0 births per 1,000 women. Women in the age bracket of 20 to 34 years acount for 100.0% of all women with births.
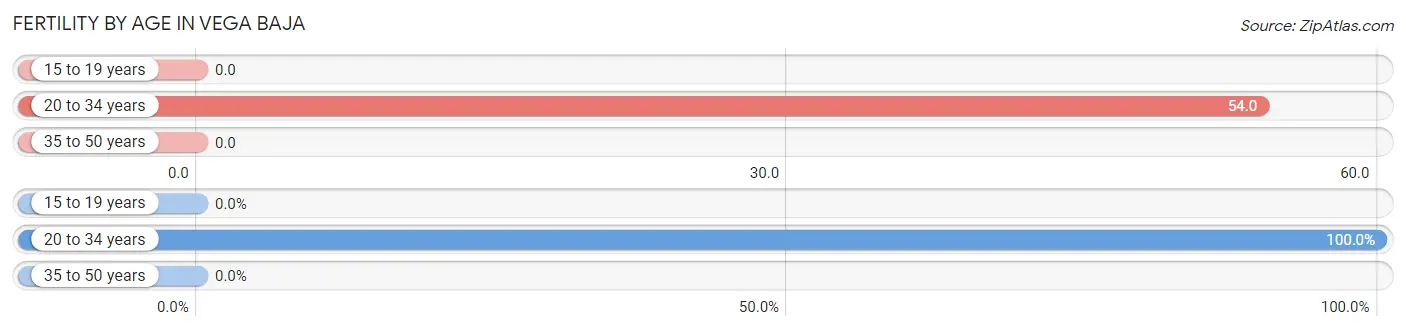
| Age Bracket | Women with Births | Births / 1,000 Women |
| 15 to 19 years | 0 (0.0%) | 0.0 |
| 20 to 34 years | 125 (100.0%) | 54.0 |
| 35 to 50 years | 0 (0.0%) | 0.0 |
| Total | 125 (100.0%) | 23.0 |
Fertility by Age by Marriage Status in Vega Baja
24.8% of women with births (125) in Vega Baja are married. The highest percentage of unmarried women with births falls into 20 to 34 years age bracket with 75.2% of them unmarried at the time of birth, while the lowest percentage of unmarried women with births belong to 20 to 34 years age bracket with 75.2% of them unmarried.
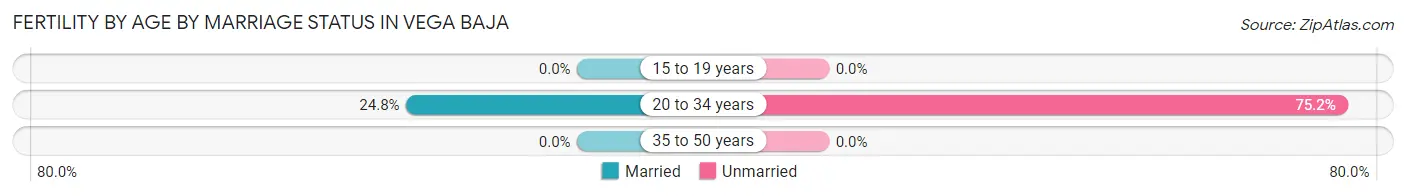
| Age Bracket | Married | Unmarried |
| 15 to 19 years | 0 (0.0%) | 0 (0.0%) |
| 20 to 34 years | 31 (24.8%) | 94 (75.2%) |
| 35 to 50 years | 0 (0.0%) | 0 (0.0%) |
| Total | 31 (24.8%) | 94 (75.2%) |
Fertility by Education in Vega Baja
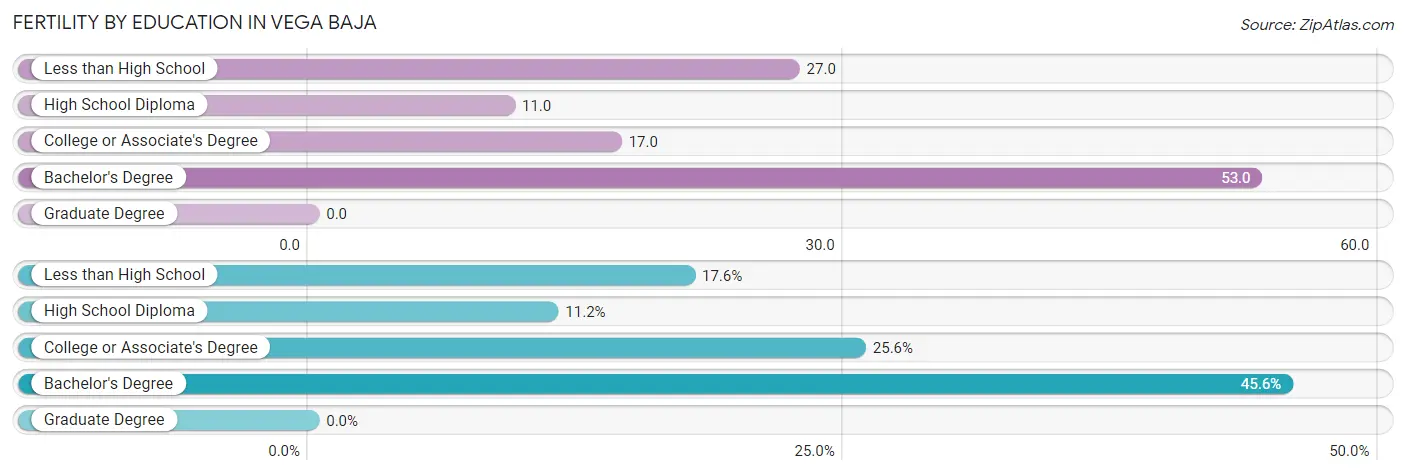
| Educational Attainment | Women with Births | Births / 1,000 Women |
| Less than High School | 22 (17.6%) | 27.0 |
| High School Diploma | 14 (11.2%) | 11.0 |
| College or Associate's Degree | 32 (25.6%) | 17.0 |
| Bachelor's Degree | 57 (45.6%) | 53.0 |
| Graduate Degree | 0 (0.0%) | 0.0 |
| Total | 125 (100.0%) | 23.0 |
Fertility by Education by Marriage Status in Vega Baja
75.2% of women with births in Vega Baja are unmarried. Women with the educational attainment of less than high school are most likely to be married with 100.0% of them married at childbirth, while women with the educational attainment of high school diploma are least likely to be married with 100.0% of them unmarried at childbirth.
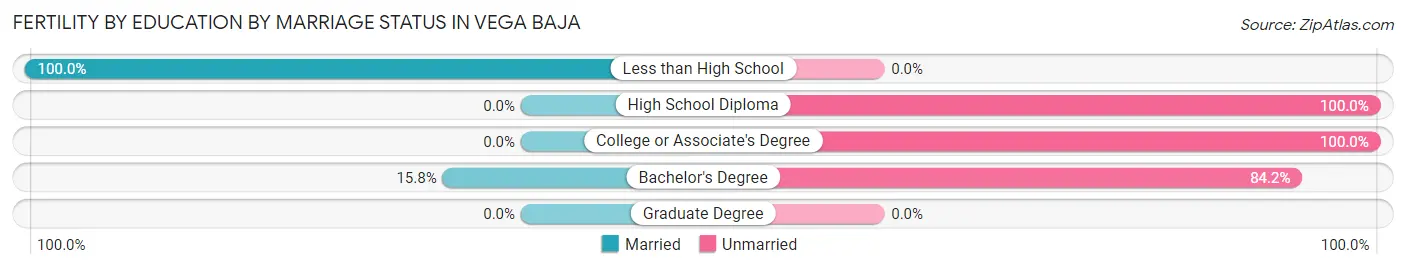
| Educational Attainment | Married | Unmarried |
| Less than High School | 22 (100.0%) | 0 (0.0%) |
| High School Diploma | 0 (0.0%) | 14 (100.0%) |
| College or Associate's Degree | 0 (0.0%) | 32 (100.0%) |
| Bachelor's Degree | 9 (15.8%) | 48 (84.2%) |
| Graduate Degree | 0 (0.0%) | 0 (0.0%) |
| Total | 31 (24.8%) | 94 (75.2%) |
Employment Characteristics in Vega Baja
Employment by Class of Employer in Vega Baja
Among the 7,201 employed individuals in Vega Baja, private company employees (5,267 | 73.1%), state government employees (802 | 11.1%), and self-employed (not incorporated) (493 | 6.9%) make up the most common classes of employment.
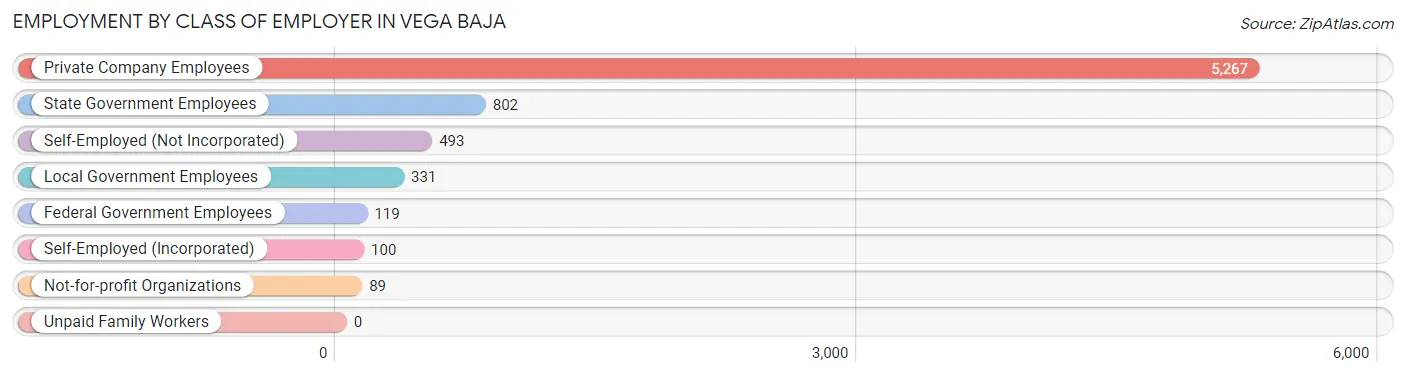
| Employer Class | # Employees | % Employees |
| Private Company Employees | 5,267 | 73.1% |
| Self-Employed (Incorporated) | 100 | 1.4% |
| Self-Employed (Not Incorporated) | 493 | 6.9% |
| Not-for-profit Organizations | 89 | 1.2% |
| Local Government Employees | 331 | 4.6% |
| State Government Employees | 802 | 11.1% |
| Federal Government Employees | 119 | 1.7% |
| Unpaid Family Workers | 0 | 0.0% |
| Total | 7,201 | 100.0% |
Employment Status by Age in Vega Baja
According to the labor force statistics for Vega Baja, out of the total population over 16 years of age (19,707), 44.7% or 8,809 individuals are in the labor force, with 17.8% or 1,568 of them unemployed. The age group with the highest labor force participation rate is 35 to 44 years, with 81.7% or 2,257 individuals in the labor force. Within the labor force, the 16 to 19 years age range has the highest percentage of unemployed individuals, with 79.6% or 172 of them being unemployed.
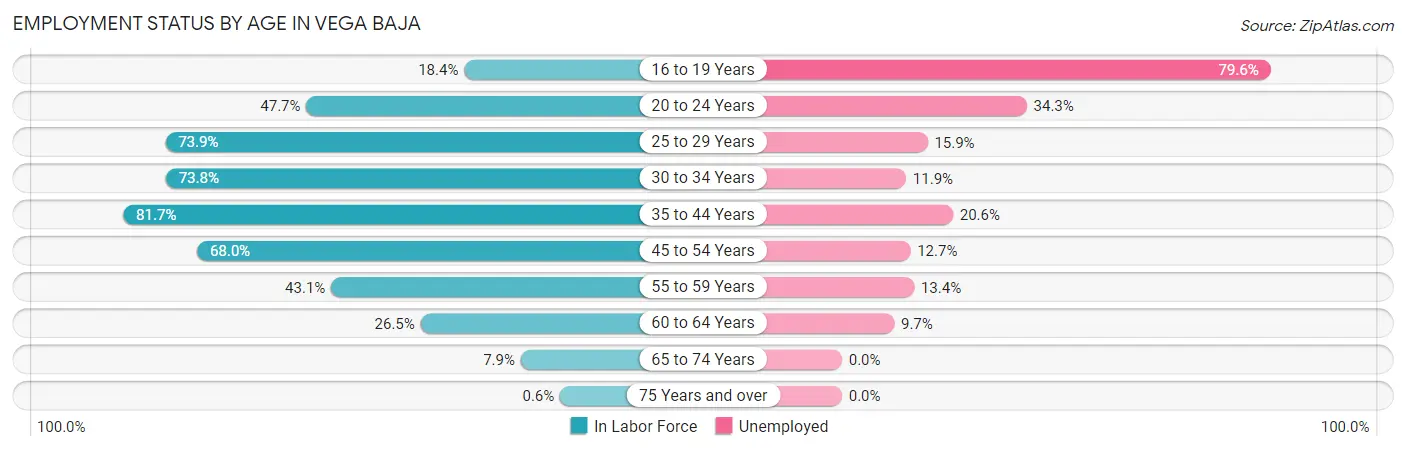
| Age Bracket | In Labor Force | Unemployed |
| 16 to 19 Years | 216 (18.4%) | 172 (79.6%) |
| 20 to 24 Years | 657 (47.7%) | 225 (34.3%) |
| 25 to 29 Years | 1,046 (73.9%) | 166 (15.9%) |
| 30 to 34 Years | 1,259 (73.8%) | 150 (11.9%) |
| 35 to 44 Years | 2,257 (81.7%) | 465 (20.6%) |
| 45 to 54 Years | 2,133 (68.0%) | 271 (12.7%) |
| 55 to 59 Years | 635 (43.1%) | 85 (13.4%) |
| 60 to 64 Years | 372 (26.5%) | 36 (9.7%) |
| 65 to 74 Years | 223 (7.9%) | 0 (0.0%) |
| 75 Years and over | 15 (0.6%) | 0 (0.0%) |
| Total | 8,809 (44.7%) | 1,568 (17.8%) |
Employment Status by Educational Attainment in Vega Baja
According to labor force statistics for Vega Baja, 64.7% of individuals (7,698) out of the total population between 25 and 64 years of age (11,898) are in the labor force, with 15.3% or 1,178 of them being unemployed. The group with the highest labor force participation rate are those with the educational attainment of bachelor's degree or higher, with 76.6% or 2,458 individuals in the labor force. Within the labor force, individuals with less than high school education have the highest percentage of unemployment, with 35.1% or 338 of them being unemployed.
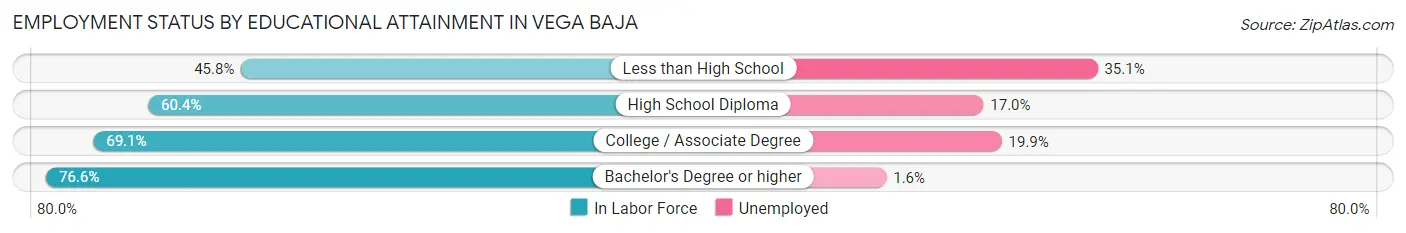
| Educational Attainment | In Labor Force | Unemployed |
| Less than High School | 963 (45.8%) | 738 (35.1%) |
| High School Diploma | 1,869 (60.4%) | 526 (17.0%) |
| College / Associate Degree | 2,413 (69.1%) | 695 (19.9%) |
| Bachelor's Degree or higher | 2,458 (76.6%) | 51 (1.6%) |
| Total | 7,698 (64.7%) | 1,820 (15.3%) |
Employment Occupations by Sex in Vega Baja
Management, Business, Science and Arts Occupations
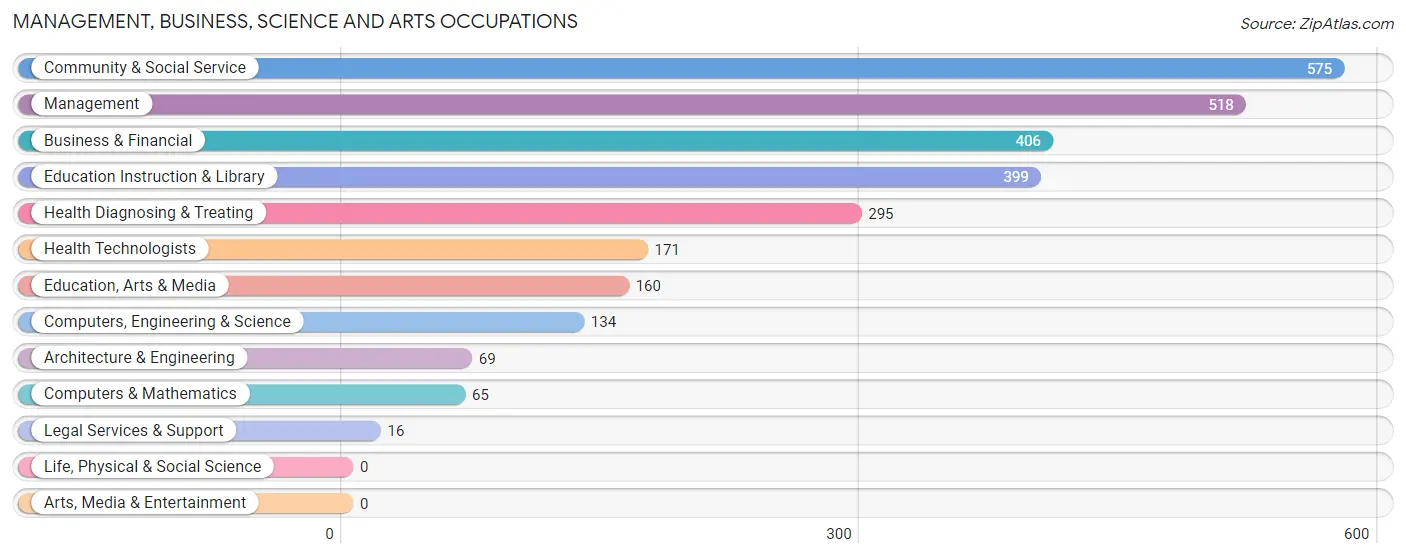
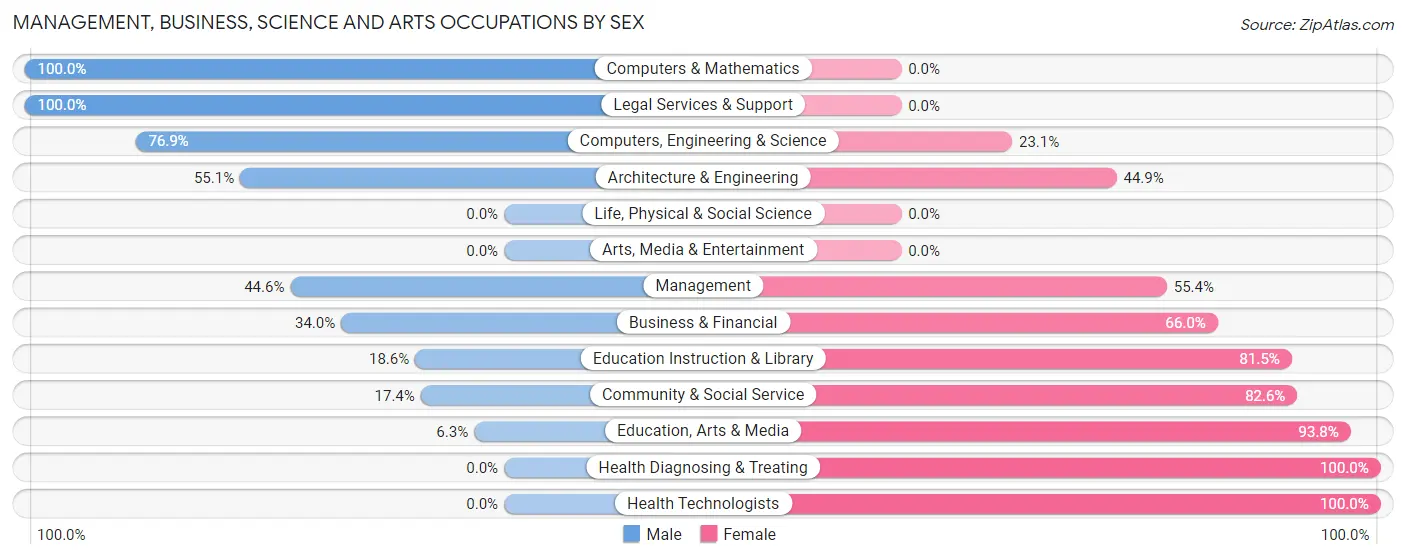
The most common Management, Business, Science and Arts occupations in Vega Baja are Community & Social Service (575 | 8.0%), Management (518 | 7.2%), Business & Financial (406 | 5.6%), Education Instruction & Library (399 | 5.5%), and Health Diagnosing & Treating (295 | 4.1%).
Management, Business, Science and Arts Occupations by Sex
Within the Management, Business, Science and Arts occupations in Vega Baja, the most male-oriented occupations are Computers & Mathematics (100.0%), Legal Services & Support (100.0%), and Computers, Engineering & Science (76.9%), while the most female-oriented occupations are Health Diagnosing & Treating (100.0%), Health Technologists (100.0%), and Education, Arts & Media (93.8%).
| Occupation | Male | Female |
| Management | 231 (44.6%) | 287 (55.4%) |
| Business & Financial | 138 (34.0%) | 268 (66.0%) |
| Computers, Engineering & Science | 103 (76.9%) | 31 (23.1%) |
| Computers & Mathematics | 65 (100.0%) | 0 (0.0%) |
| Architecture & Engineering | 38 (55.1%) | 31 (44.9%) |
| Life, Physical & Social Science | 0 (0.0%) | 0 (0.0%) |
| Community & Social Service | 100 (17.4%) | 475 (82.6%) |
| Education, Arts & Media | 10 (6.2%) | 150 (93.8%) |
| Legal Services & Support | 16 (100.0%) | 0 (0.0%) |
| Education Instruction & Library | 74 (18.5%) | 325 (81.5%) |
| Arts, Media & Entertainment | 0 (0.0%) | 0 (0.0%) |
| Health Diagnosing & Treating | 0 (0.0%) | 295 (100.0%) |
| Health Technologists | 0 (0.0%) | 171 (100.0%) |
| Total (Category) | 572 (29.7%) | 1,356 (70.3%) |
| Total (Overall) | 3,704 (51.2%) | 3,523 (48.7%) |
Services Occupations
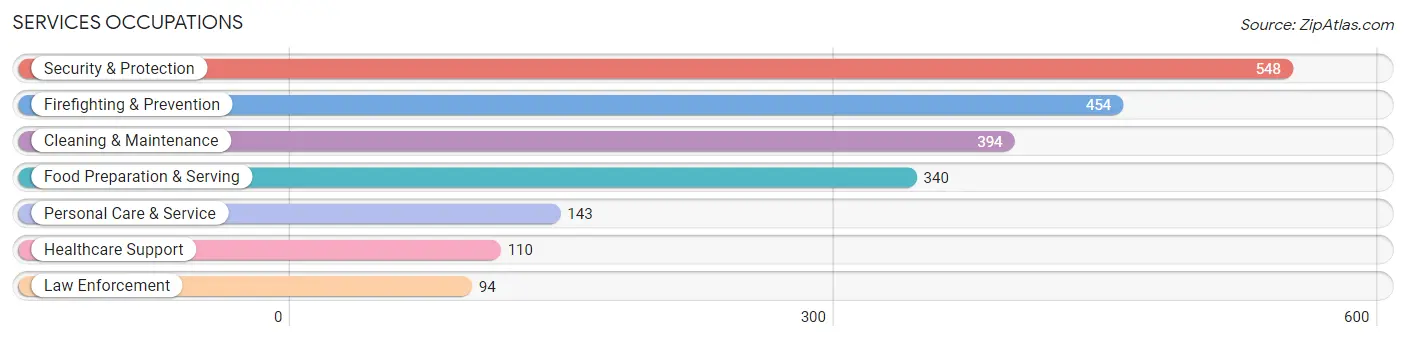
The most common Services occupations in Vega Baja are Security & Protection (548 | 7.6%), Firefighting & Prevention (454 | 6.3%), Cleaning & Maintenance (394 | 5.4%), Food Preparation & Serving (340 | 4.7%), and Personal Care & Service (143 | 2.0%).
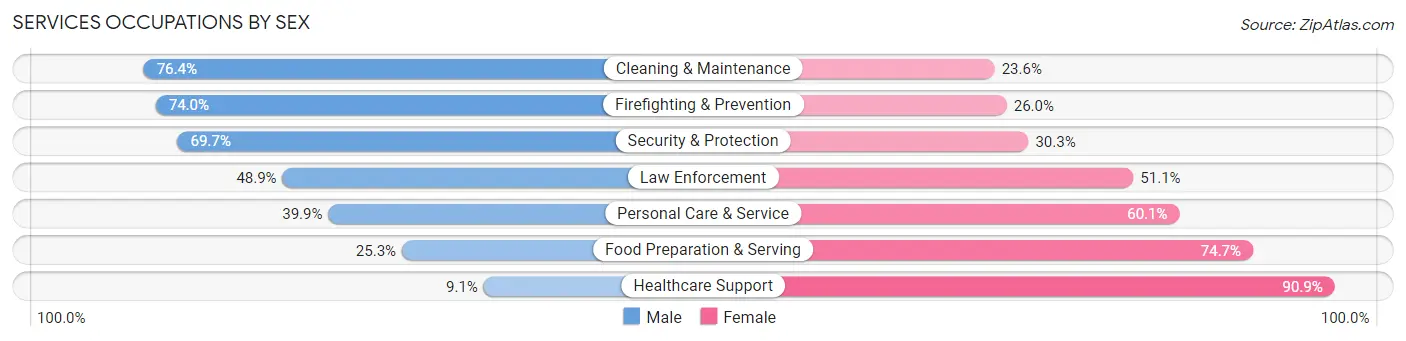
Services Occupations by Sex
Within the Services occupations in Vega Baja, the most male-oriented occupations are Cleaning & Maintenance (76.4%), Firefighting & Prevention (74.0%), and Security & Protection (69.7%), while the most female-oriented occupations are Healthcare Support (90.9%), Food Preparation & Serving (74.7%), and Personal Care & Service (60.1%).
| Occupation | Male | Female |
| Healthcare Support | 10 (9.1%) | 100 (90.9%) |
| Security & Protection | 382 (69.7%) | 166 (30.3%) |
| Firefighting & Prevention | 336 (74.0%) | 118 (26.0%) |
| Law Enforcement | 46 (48.9%) | 48 (51.1%) |
| Food Preparation & Serving | 86 (25.3%) | 254 (74.7%) |
| Cleaning & Maintenance | 301 (76.4%) | 93 (23.6%) |
| Personal Care & Service | 57 (39.9%) | 86 (60.1%) |
| Total (Category) | 836 (54.5%) | 699 (45.5%) |
| Total (Overall) | 3,704 (51.2%) | 3,523 (48.7%) |
Sales and Office Occupations
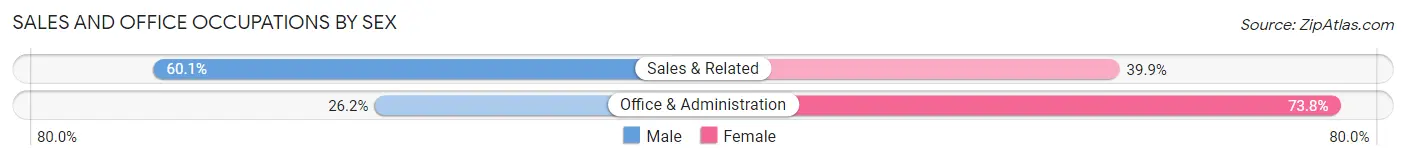
The most common Sales and Office occupations in Vega Baja are Office & Administration (1,156 | 16.0%), and Sales & Related (833 | 11.5%).

Sales and Office Occupations by Sex
| Occupation | Male | Female |
| Sales & Related | 501 (60.1%) | 332 (39.9%) |
| Office & Administration | 303 (26.2%) | 853 (73.8%) |
| Total (Category) | 804 (40.4%) | 1,185 (59.6%) |
| Total (Overall) | 3,704 (51.2%) | 3,523 (48.7%) |
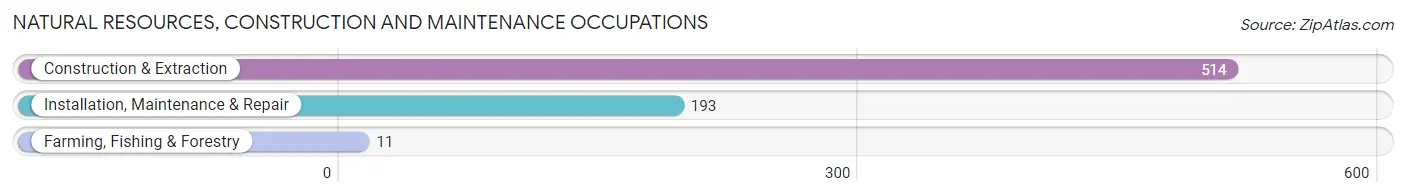
Natural Resources, Construction and Maintenance Occupations
The most common Natural Resources, Construction and Maintenance occupations in Vega Baja are Construction & Extraction (514 | 7.1%), Installation, Maintenance & Repair (193 | 2.7%), and Farming, Fishing & Forestry (11 | 0.2%).
Natural Resources, Construction and Maintenance Occupations by Sex
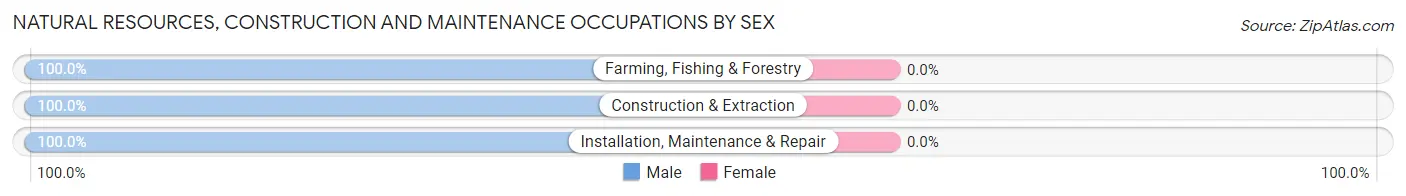
| Occupation | Male | Female |
| Farming, Fishing & Forestry | 11 (100.0%) | 0 (0.0%) |
| Construction & Extraction | 514 (100.0%) | 0 (0.0%) |
| Installation, Maintenance & Repair | 193 (100.0%) | 0 (0.0%) |
| Total (Category) | 718 (100.0%) | 0 (0.0%) |
| Total (Overall) | 3,704 (51.2%) | 3,523 (48.7%) |
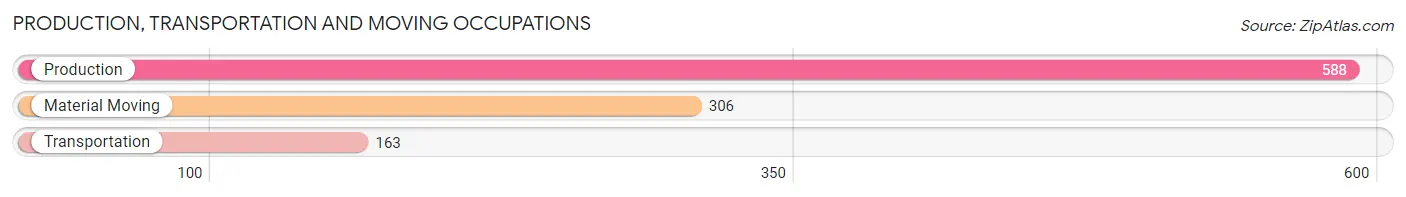
Production, Transportation and Moving Occupations
The most common Production, Transportation and Moving occupations in Vega Baja are Production (588 | 8.1%), Material Moving (306 | 4.2%), and Transportation (163 | 2.3%).
Production, Transportation and Moving Occupations by Sex
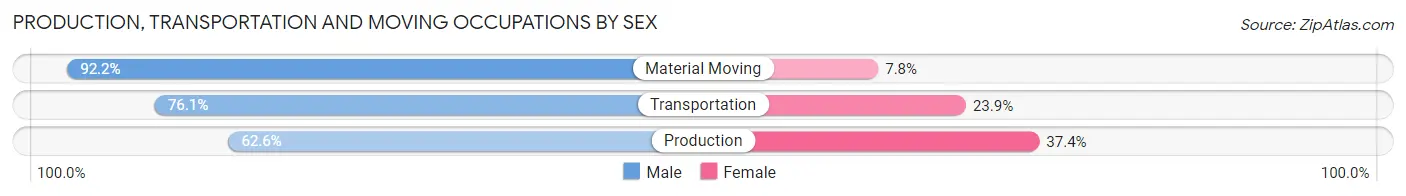
| Occupation | Male | Female |
| Production | 368 (62.6%) | 220 (37.4%) |
| Transportation | 124 (76.1%) | 39 (23.9%) |
| Material Moving | 282 (92.2%) | 24 (7.8%) |
| Total (Category) | 774 (73.2%) | 283 (26.8%) |
| Total (Overall) | 3,704 (51.2%) | 3,523 (48.7%) |
Employment Industries by Sex in Vega Baja
Employment Industries in Vega Baja
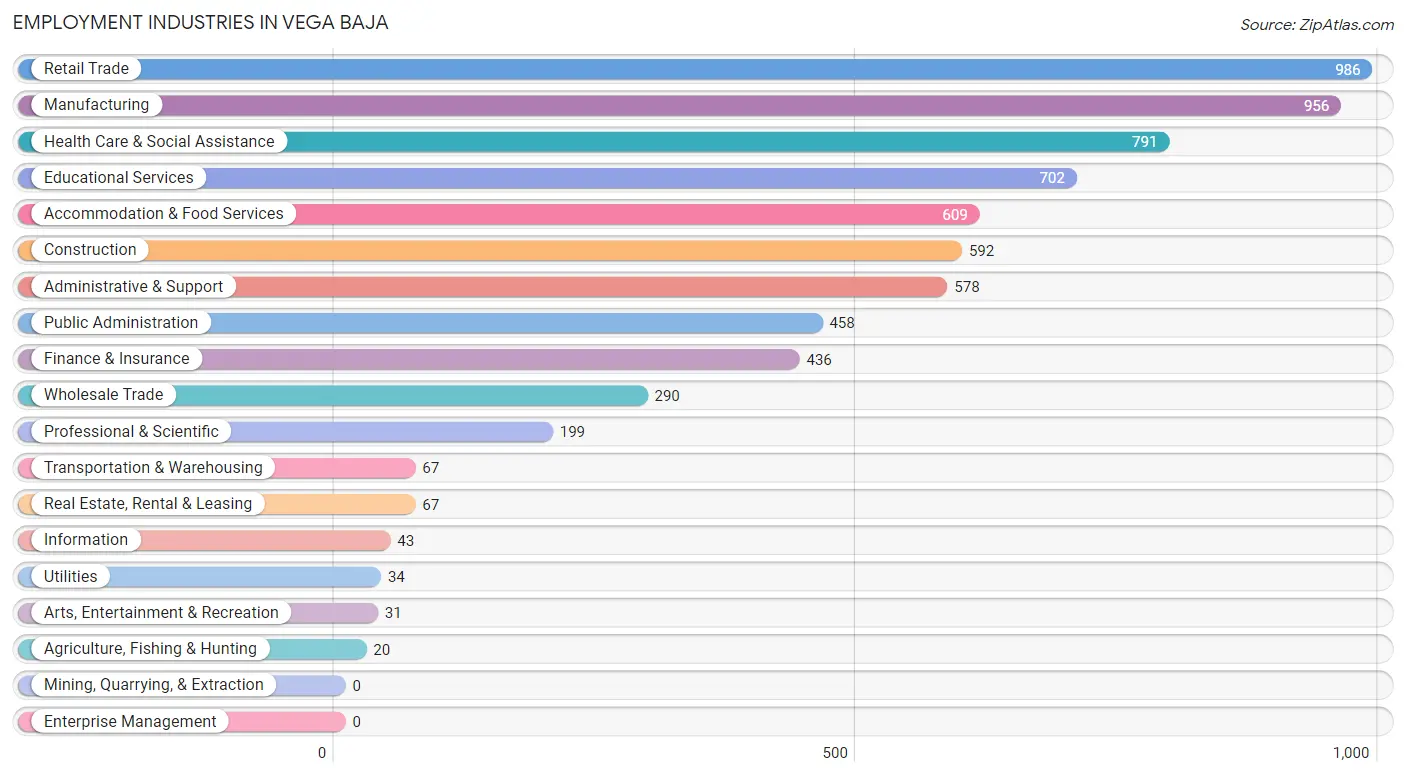
The major employment industries in Vega Baja include Retail Trade (986 | 13.6%), Manufacturing (956 | 13.2%), Health Care & Social Assistance (791 | 11.0%), Educational Services (702 | 9.7%), and Accommodation & Food Services (609 | 8.4%).
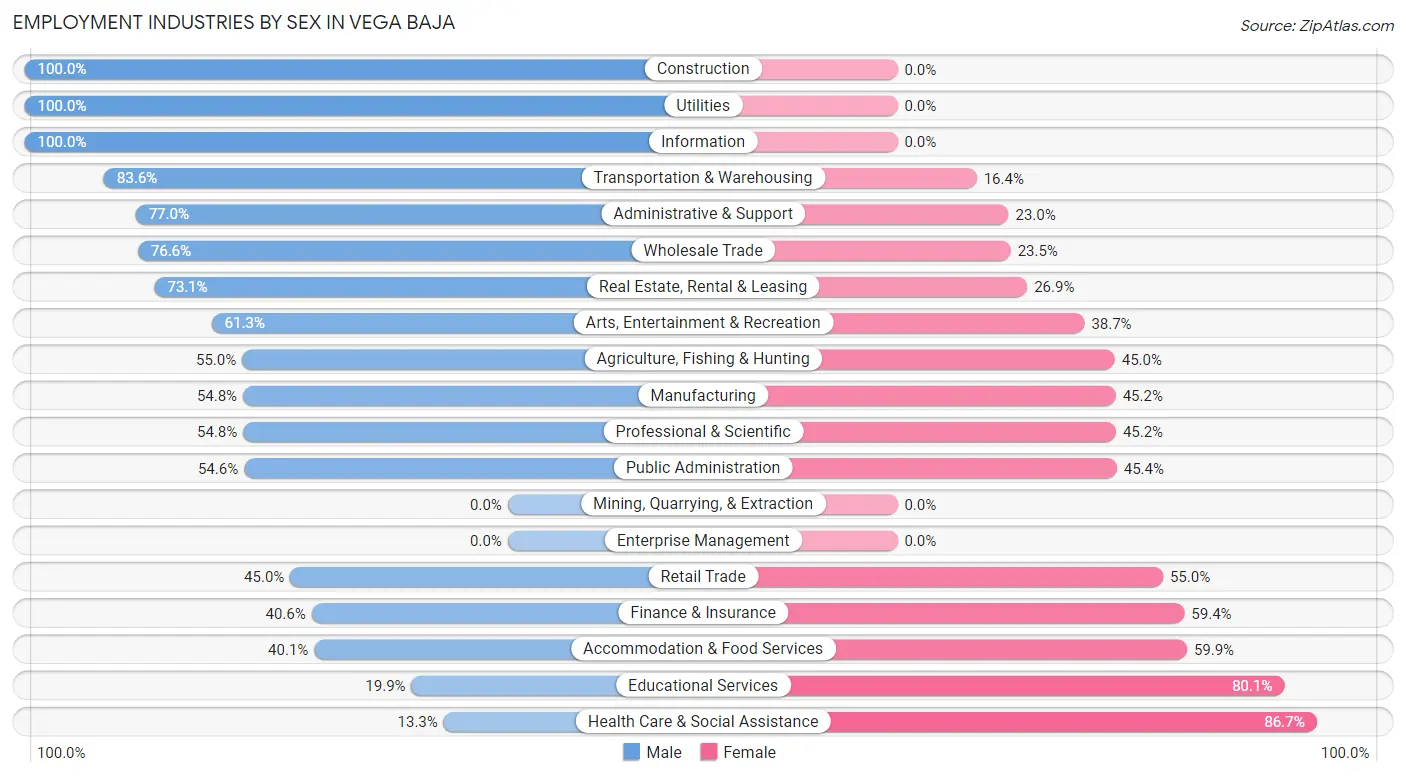
Employment Industries by Sex in Vega Baja
The Vega Baja industries that see more men than women are Construction (100.0%), Utilities (100.0%), and Information (100.0%), whereas the industries that tend to have a higher number of women are Health Care & Social Assistance (86.7%), Educational Services (80.1%), and Accommodation & Food Services (59.9%).
| Industry | Male | Female |
| Agriculture, Fishing & Hunting | 11 (55.0%) | 9 (45.0%) |
| Mining, Quarrying, & Extraction | 0 (0.0%) | 0 (0.0%) |
| Construction | 592 (100.0%) | 0 (0.0%) |
| Manufacturing | 524 (54.8%) | 432 (45.2%) |
| Wholesale Trade | 222 (76.5%) | 68 (23.4%) |
| Retail Trade | 444 (45.0%) | 542 (55.0%) |
| Transportation & Warehousing | 56 (83.6%) | 11 (16.4%) |
| Utilities | 34 (100.0%) | 0 (0.0%) |
| Information | 43 (100.0%) | 0 (0.0%) |
| Finance & Insurance | 177 (40.6%) | 259 (59.4%) |
| Real Estate, Rental & Leasing | 49 (73.1%) | 18 (26.9%) |
| Professional & Scientific | 109 (54.8%) | 90 (45.2%) |
| Enterprise Management | 0 (0.0%) | 0 (0.0%) |
| Administrative & Support | 445 (77.0%) | 133 (23.0%) |
| Educational Services | 140 (19.9%) | 562 (80.1%) |
| Health Care & Social Assistance | 105 (13.3%) | 686 (86.7%) |
| Arts, Entertainment & Recreation | 19 (61.3%) | 12 (38.7%) |
| Accommodation & Food Services | 244 (40.1%) | 365 (59.9%) |
| Public Administration | 250 (54.6%) | 208 (45.4%) |
| Total | 3,704 (51.2%) | 3,523 (48.7%) |
Education in Vega Baja
School Enrollment in Vega Baja
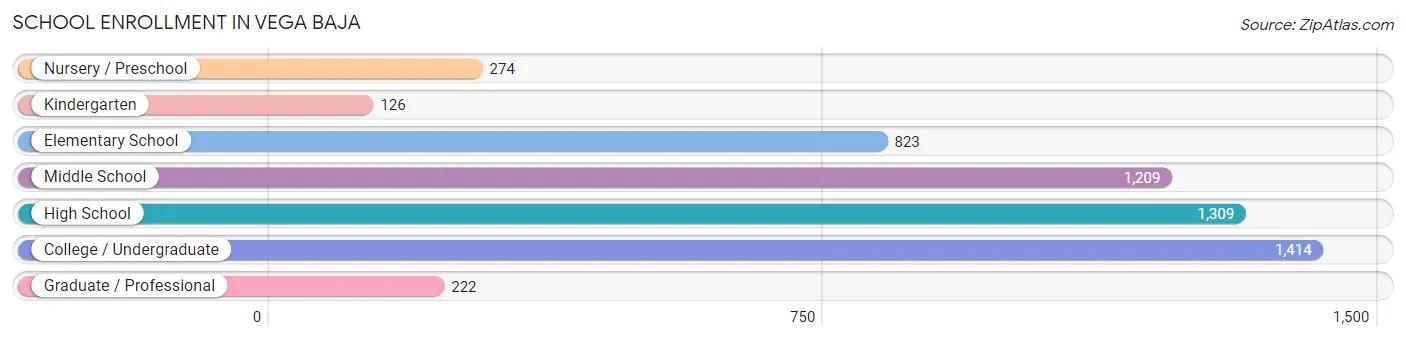
The most common levels of schooling among the 5,377 students in Vega Baja are college / undergraduate (1,414 | 26.3%), high school (1,309 | 24.3%), and middle school (1,209 | 22.5%).
| School Level | # Students | % Students |
| Nursery / Preschool | 274 | 5.1% |
| Kindergarten | 126 | 2.3% |
| Elementary School | 823 | 15.3% |
| Middle School | 1,209 | 22.5% |
| High School | 1,309 | 24.3% |
| College / Undergraduate | 1,414 | 26.3% |
| Graduate / Professional | 222 | 4.1% |
| Total | 5,377 | 100.0% |
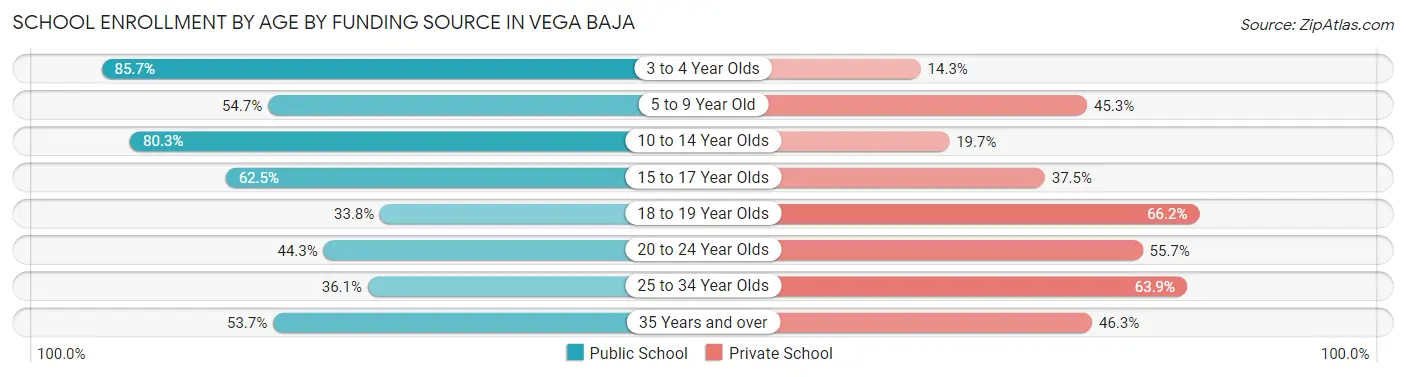
School Enrollment by Age by Funding Source in Vega Baja
Out of a total of 5,377 students who are enrolled in schools in Vega Baja, 2,124 (39.5%) attend a private institution, while the remaining 3,253 (60.5%) are enrolled in public schools. The age group of 18 to 19 year olds has the highest likelihood of being enrolled in private schools, with 247 (66.2% in the age bracket) enrolled. Conversely, the age group of 3 to 4 year olds has the lowest likelihood of being enrolled in a private school, with 239 (85.7% in the age bracket) attending a public institution.
| Age Bracket | Public School | Private School |
| 3 to 4 Year Olds | 239 (85.7%) | 40 (14.3%) |
| 5 to 9 Year Old | 527 (54.7%) | 437 (45.3%) |
| 10 to 14 Year Olds | 1,120 (80.3%) | 274 (19.7%) |
| 15 to 17 Year Olds | 666 (62.5%) | 399 (37.5%) |
| 18 to 19 Year Olds | 126 (33.8%) | 247 (66.2%) |
| 20 to 24 Year Olds | 324 (44.3%) | 407 (55.7%) |
| 25 to 34 Year Olds | 114 (36.1%) | 202 (63.9%) |
| 35 Years and over | 137 (53.7%) | 118 (46.3%) |
| Total | 3,253 (60.5%) | 2,124 (39.5%) |
Educational Attainment by Field of Study in Vega Baja
Business (1,287 | 32.4%), education (693 | 17.5%), science & technology (377 | 9.5%), arts & humanities (357 | 9.0%), and engineering (243 | 6.1%) are the most common fields of study among 3,968 individuals in Vega Baja who have obtained a bachelor's degree or higher.
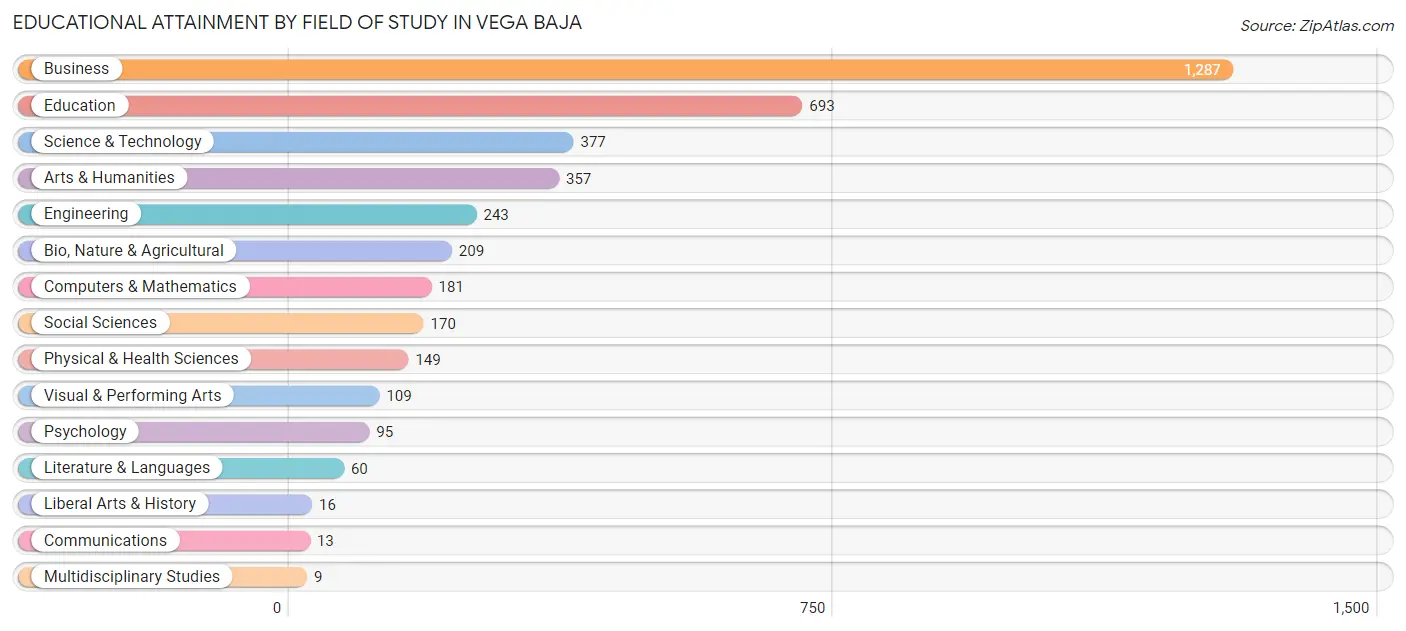
| Field of Study | # Graduates | % Graduates |
| Computers & Mathematics | 181 | 4.6% |
| Bio, Nature & Agricultural | 209 | 5.3% |
| Physical & Health Sciences | 149 | 3.8% |
| Psychology | 95 | 2.4% |
| Social Sciences | 170 | 4.3% |
| Engineering | 243 | 6.1% |
| Multidisciplinary Studies | 9 | 0.2% |
| Science & Technology | 377 | 9.5% |
| Business | 1,287 | 32.4% |
| Education | 693 | 17.5% |
| Literature & Languages | 60 | 1.5% |
| Liberal Arts & History | 16 | 0.4% |
| Visual & Performing Arts | 109 | 2.8% |
| Communications | 13 | 0.3% |
| Arts & Humanities | 357 | 9.0% |
| Total | 3,968 | 100.0% |
Transportation & Commute in Vega Baja
Vehicle Availability by Sex in Vega Baja
The most prevalent vehicle ownership categories in Vega Baja are males with 2 vehicles (1,807, accounting for 49.0%) and females with 2 vehicles (1,328, making up 51.6%).
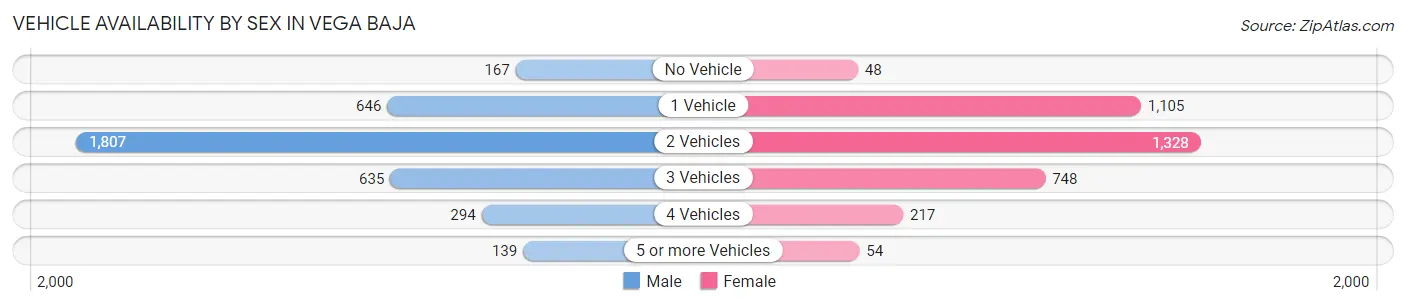
| Vehicles Available | Male | Female |
| No Vehicle | 167 (4.5%) | 48 (1.4%) |
| 1 Vehicle | 646 (17.5%) | 1,105 (31.6%) |
| 2 Vehicles | 1,807 (49.0%) | 1,328 (37.9%) |
| 3 Vehicles | 635 (17.2%) | 748 (21.4%) |
| 4 Vehicles | 294 (8.0%) | 217 (6.2%) |
| 5 or more Vehicles | 139 (3.8%) | 54 (1.5%) |
| Total | 3,688 (100.0%) | 3,500 (100.0%) |
Commute Time in Vega Baja
The most frequently occuring commute durations in Vega Baja are 20 to 24 minutes (1,431 commuters, 20.0%), 30 to 34 minutes (899 commuters, 12.6%), and 10 to 14 minutes (768 commuters, 10.7%).
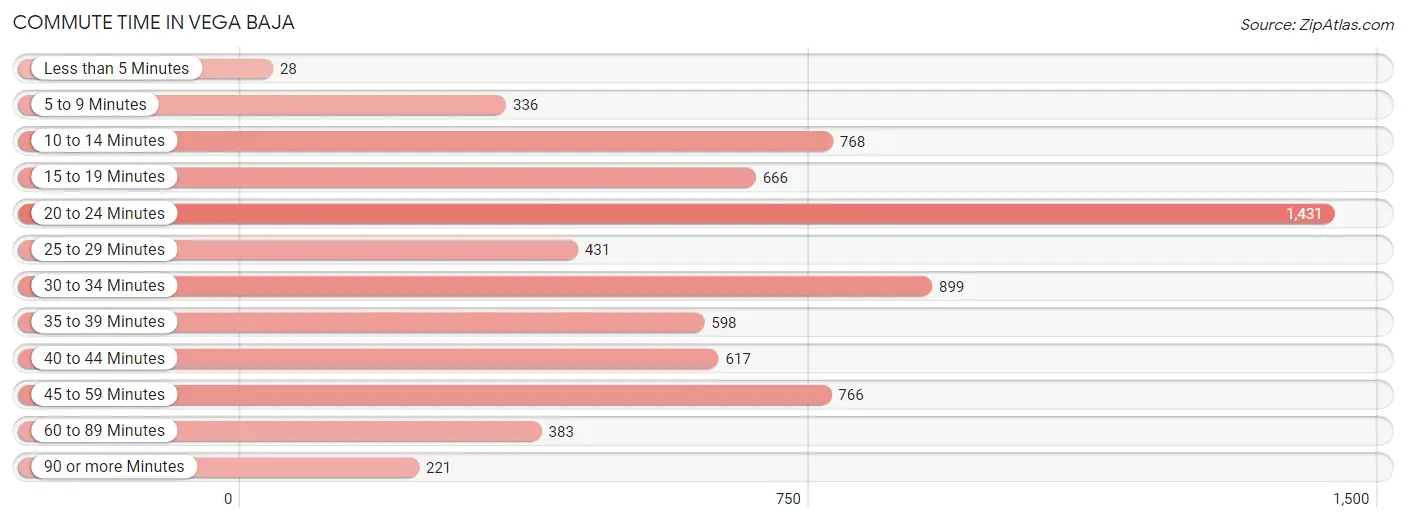
| Commute Time | # Commuters | % Commuters |
| Less than 5 Minutes | 28 | 0.4% |
| 5 to 9 Minutes | 336 | 4.7% |
| 10 to 14 Minutes | 768 | 10.7% |
| 15 to 19 Minutes | 666 | 9.3% |
| 20 to 24 Minutes | 1,431 | 20.0% |
| 25 to 29 Minutes | 431 | 6.0% |
| 30 to 34 Minutes | 899 | 12.6% |
| 35 to 39 Minutes | 598 | 8.4% |
| 40 to 44 Minutes | 617 | 8.6% |
| 45 to 59 Minutes | 766 | 10.7% |
| 60 to 89 Minutes | 383 | 5.4% |
| 90 or more Minutes | 221 | 3.1% |
Commute Time by Sex in Vega Baja
The most common commute times in Vega Baja are 20 to 24 minutes (596 commuters, 16.2%) for males and 20 to 24 minutes (835 commuters, 24.0%) for females.
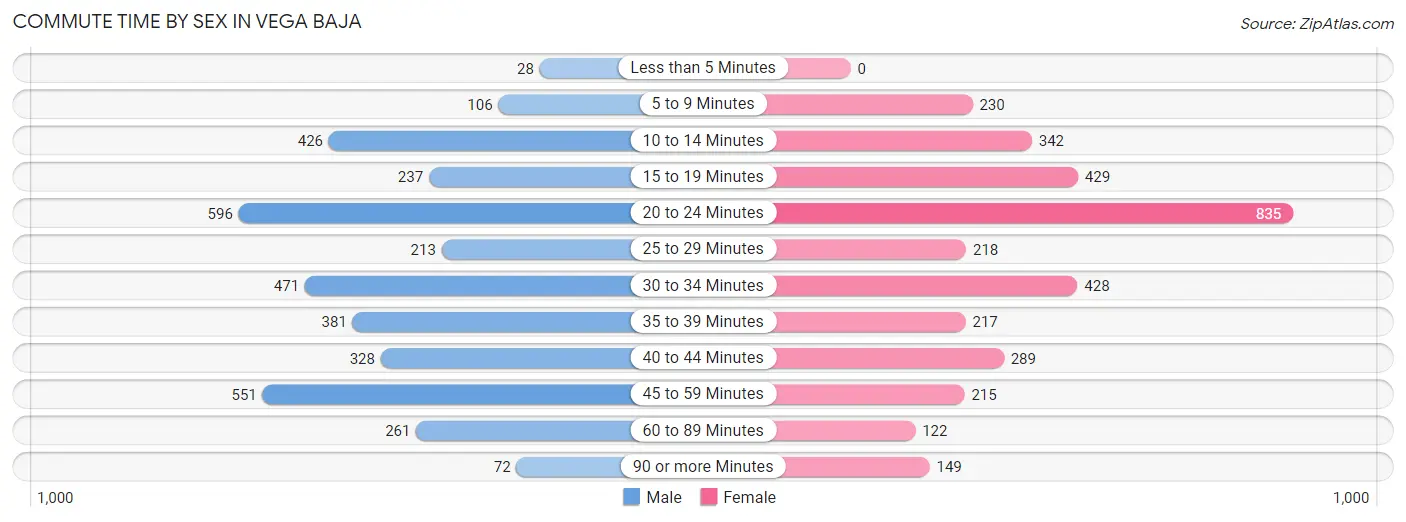
| Commute Time | Male | Female |
| Less than 5 Minutes | 28 (0.8%) | 0 (0.0%) |
| 5 to 9 Minutes | 106 (2.9%) | 230 (6.6%) |
| 10 to 14 Minutes | 426 (11.6%) | 342 (9.8%) |
| 15 to 19 Minutes | 237 (6.5%) | 429 (12.3%) |
| 20 to 24 Minutes | 596 (16.2%) | 835 (24.0%) |
| 25 to 29 Minutes | 213 (5.8%) | 218 (6.3%) |
| 30 to 34 Minutes | 471 (12.8%) | 428 (12.3%) |
| 35 to 39 Minutes | 381 (10.4%) | 217 (6.2%) |
| 40 to 44 Minutes | 328 (8.9%) | 289 (8.3%) |
| 45 to 59 Minutes | 551 (15.0%) | 215 (6.2%) |
| 60 to 89 Minutes | 261 (7.1%) | 122 (3.5%) |
| 90 or more Minutes | 72 (2.0%) | 149 (4.3%) |
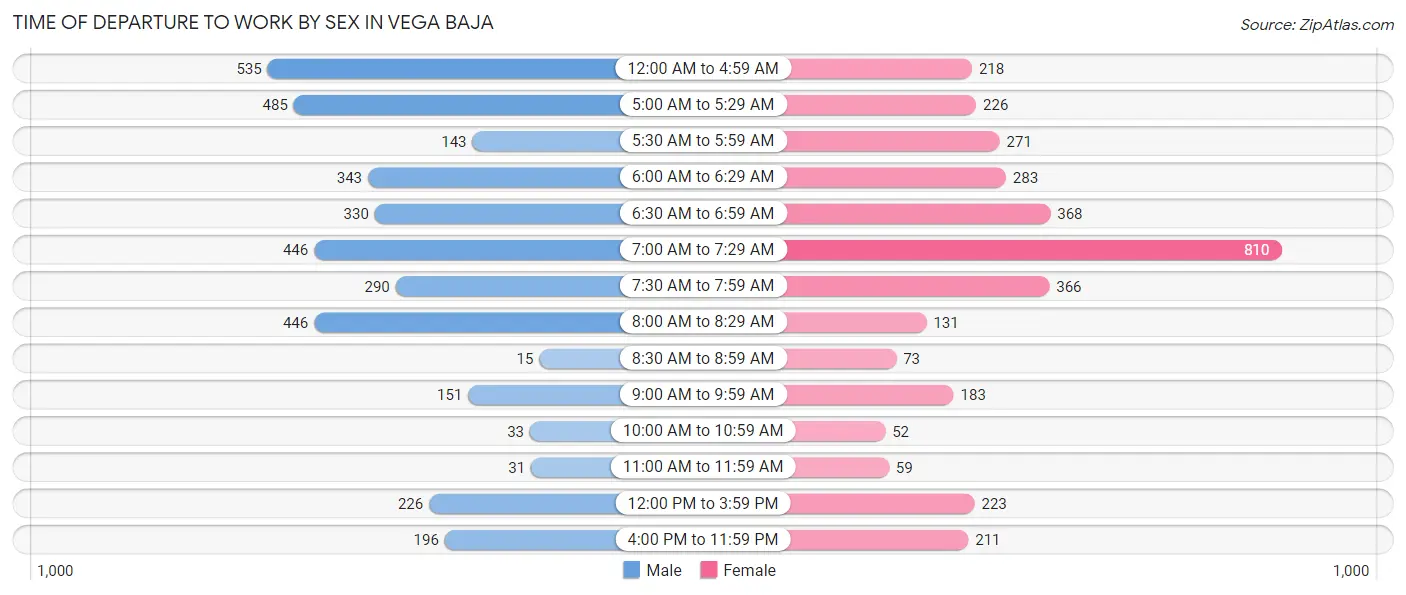
Time of Departure to Work by Sex in Vega Baja
The most frequent times of departure to work in Vega Baja are 12:00 AM to 4:59 AM (535, 14.6%) for males and 7:00 AM to 7:29 AM (810, 23.3%) for females.
| Time of Departure | Male | Female |
| 12:00 AM to 4:59 AM | 535 (14.6%) | 218 (6.3%) |
| 5:00 AM to 5:29 AM | 485 (13.2%) | 226 (6.5%) |
| 5:30 AM to 5:59 AM | 143 (3.9%) | 271 (7.8%) |
| 6:00 AM to 6:29 AM | 343 (9.3%) | 283 (8.2%) |
| 6:30 AM to 6:59 AM | 330 (9.0%) | 368 (10.6%) |
| 7:00 AM to 7:29 AM | 446 (12.1%) | 810 (23.3%) |
| 7:30 AM to 7:59 AM | 290 (7.9%) | 366 (10.5%) |
| 8:00 AM to 8:29 AM | 446 (12.1%) | 131 (3.8%) |
| 8:30 AM to 8:59 AM | 15 (0.4%) | 73 (2.1%) |
| 9:00 AM to 9:59 AM | 151 (4.1%) | 183 (5.3%) |
| 10:00 AM to 10:59 AM | 33 (0.9%) | 52 (1.5%) |
| 11:00 AM to 11:59 AM | 31 (0.8%) | 59 (1.7%) |
| 12:00 PM to 3:59 PM | 226 (6.2%) | 223 (6.4%) |
| 4:00 PM to 11:59 PM | 196 (5.3%) | 211 (6.1%) |
| Total | 3,670 (100.0%) | 3,474 (100.0%) |
Housing Occupancy in Vega Baja
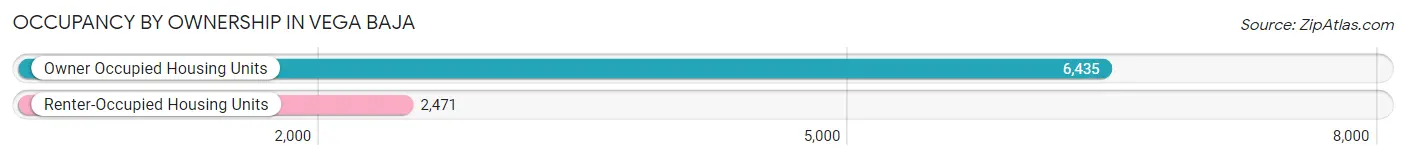
Occupancy by Ownership in Vega Baja
Of the total 8,906 dwellings in Vega Baja, owner-occupied units account for 6,435 (72.3%), while renter-occupied units make up 2,471 (27.8%).
| Occupancy | # Housing Units | % Housing Units |
| Owner Occupied Housing Units | 6,435 | 72.3% |
| Renter-Occupied Housing Units | 2,471 | 27.8% |
| Total Occupied Housing Units | 8,906 | 100.0% |
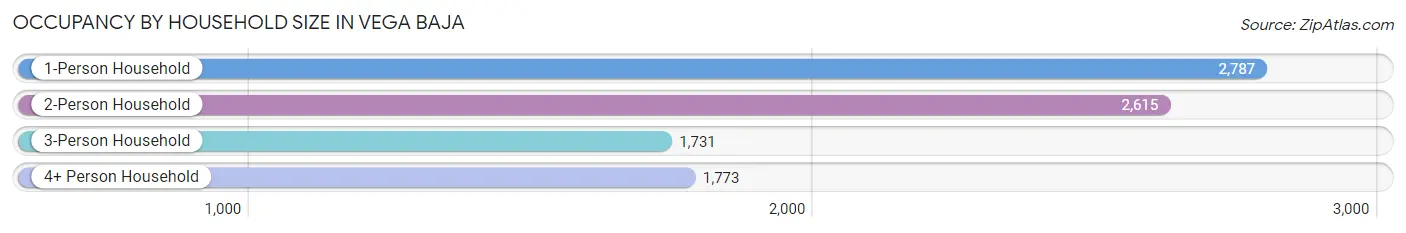
Occupancy by Household Size in Vega Baja
| Household Size | # Housing Units | % Housing Units |
| 1-Person Household | 2,787 | 31.3% |
| 2-Person Household | 2,615 | 29.4% |
| 3-Person Household | 1,731 | 19.4% |
| 4+ Person Household | 1,773 | 19.9% |
| Total Housing Units | 8,906 | 100.0% |
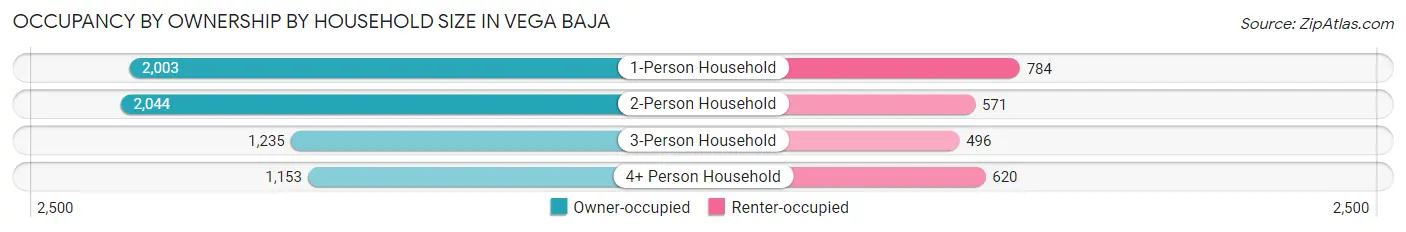
Occupancy by Ownership by Household Size in Vega Baja
| Household Size | Owner-occupied | Renter-occupied |
| 1-Person Household | 2,003 (71.9%) | 784 (28.1%) |
| 2-Person Household | 2,044 (78.2%) | 571 (21.8%) |
| 3-Person Household | 1,235 (71.4%) | 496 (28.6%) |
| 4+ Person Household | 1,153 (65.0%) | 620 (35.0%) |
| Total Housing Units | 6,435 (72.3%) | 2,471 (27.8%) |
Occupancy by Educational Attainment in Vega Baja
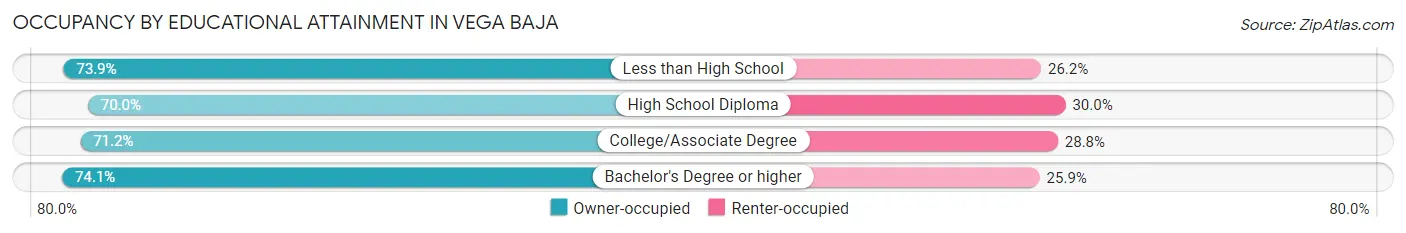
| Household Size | Owner-occupied | Renter-occupied |
| Less than High School | 1,892 (73.9%) | 670 (26.2%) |
| High School Diploma | 1,724 (70.0%) | 740 (30.0%) |
| College/Associate Degree | 1,351 (71.2%) | 547 (28.8%) |
| Bachelor's Degree or higher | 1,468 (74.1%) | 514 (25.9%) |
Occupancy by Age of Householder in Vega Baja
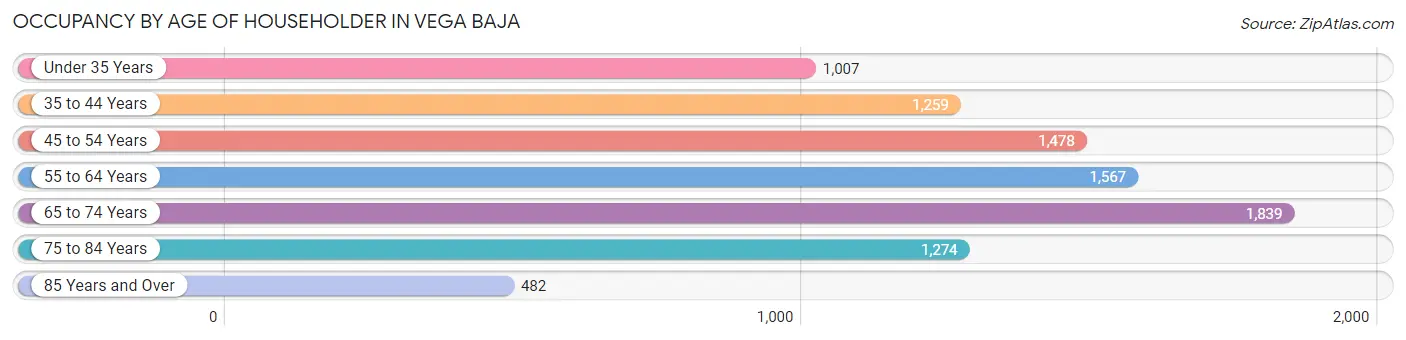
| Age Bracket | # Households | % Households |
| Under 35 Years | 1,007 | 11.3% |
| 35 to 44 Years | 1,259 | 14.1% |
| 45 to 54 Years | 1,478 | 16.6% |
| 55 to 64 Years | 1,567 | 17.6% |
| 65 to 74 Years | 1,839 | 20.6% |
| 75 to 84 Years | 1,274 | 14.3% |
| 85 Years and Over | 482 | 5.4% |
| Total | 8,906 | 100.0% |
Housing Finances in Vega Baja
Median Income by Occupancy in Vega Baja
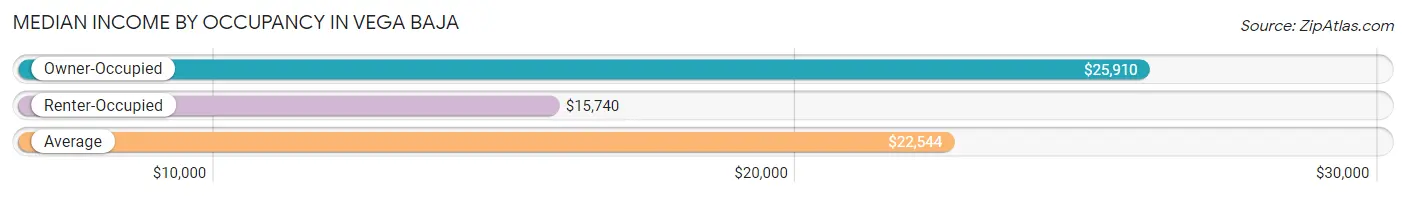
| Occupancy Type | # Households | Median Income |
| Owner-Occupied | 6,435 (72.3%) | $25,910 |
| Renter-Occupied | 2,471 (27.8%) | $15,740 |
| Average | 8,906 (100.0%) | $22,544 |
Occupancy by Householder Income Bracket in Vega Baja
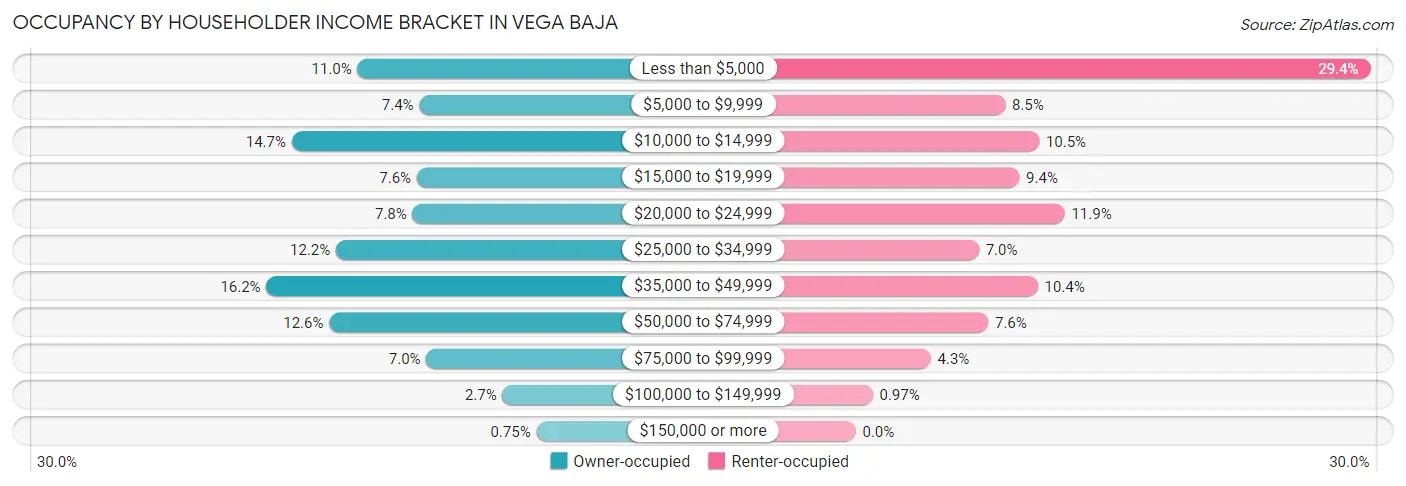
| Income Bracket | Owner-occupied | Renter-occupied |
| Less than $5,000 | 706 (11.0%) | 727 (29.4%) |
| $5,000 to $9,999 | 479 (7.4%) | 211 (8.5%) |
| $10,000 to $14,999 | 948 (14.7%) | 259 (10.5%) |
| $15,000 to $19,999 | 488 (7.6%) | 231 (9.3%) |
| $20,000 to $24,999 | 504 (7.8%) | 295 (11.9%) |
| $25,000 to $34,999 | 785 (12.2%) | 174 (7.0%) |
| $35,000 to $49,999 | 1,041 (16.2%) | 257 (10.4%) |
| $50,000 to $74,999 | 810 (12.6%) | 187 (7.6%) |
| $75,000 to $99,999 | 453 (7.0%) | 106 (4.3%) |
| $100,000 to $149,999 | 173 (2.7%) | 24 (1.0%) |
| $150,000 or more | 48 (0.7%) | 0 (0.0%) |
| Total | 6,435 (100.0%) | 2,471 (100.0%) |
Monthly Housing Cost Tiers in Vega Baja
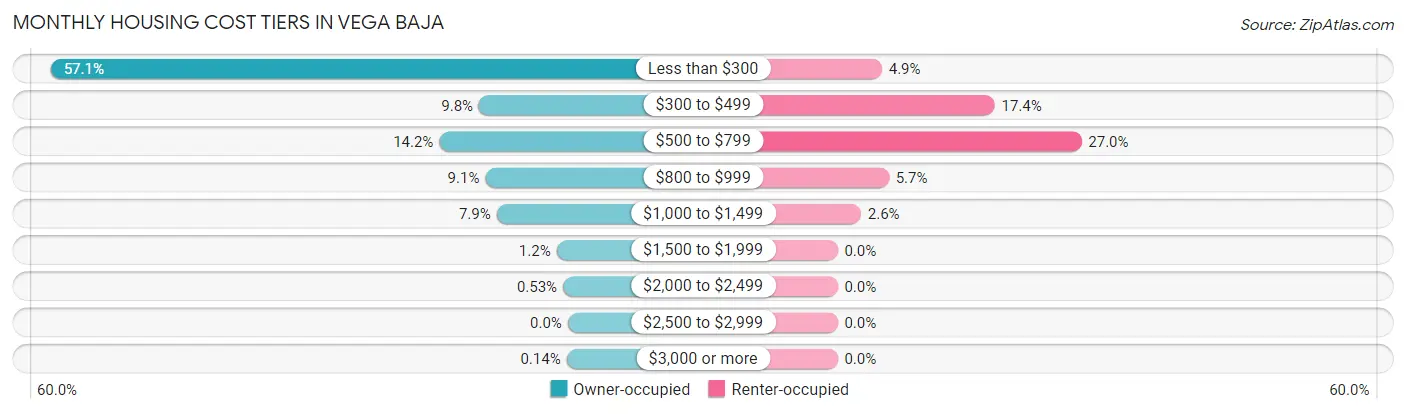
| Monthly Cost | Owner-occupied | Renter-occupied |
| Less than $300 | 3,675 (57.1%) | 121 (4.9%) |
| $300 to $499 | 631 (9.8%) | 429 (17.4%) |
| $500 to $799 | 914 (14.2%) | 666 (27.0%) |
| $800 to $999 | 586 (9.1%) | 140 (5.7%) |
| $1,000 to $1,499 | 506 (7.9%) | 64 (2.6%) |
| $1,500 to $1,999 | 80 (1.2%) | 0 (0.0%) |
| $2,000 to $2,499 | 34 (0.5%) | 0 (0.0%) |
| $2,500 to $2,999 | 0 (0.0%) | 0 (0.0%) |
| $3,000 or more | 9 (0.1%) | 0 (0.0%) |
| Total | 6,435 (100.0%) | 2,471 (100.0%) |
Physical Housing Characteristics in Vega Baja
Housing Structures in Vega Baja
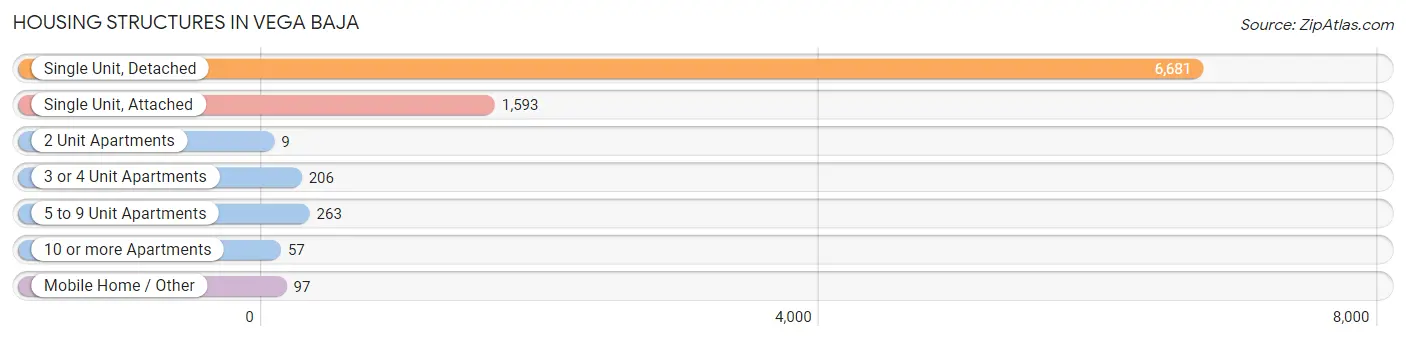
| Structure Type | # Housing Units | % Housing Units |
| Single Unit, Detached | 6,681 | 75.0% |
| Single Unit, Attached | 1,593 | 17.9% |
| 2 Unit Apartments | 9 | 0.1% |
| 3 or 4 Unit Apartments | 206 | 2.3% |
| 5 to 9 Unit Apartments | 263 | 2.9% |
| 10 or more Apartments | 57 | 0.6% |
| Mobile Home / Other | 97 | 1.1% |
| Total | 8,906 | 100.0% |
Housing Structures by Occupancy in Vega Baja
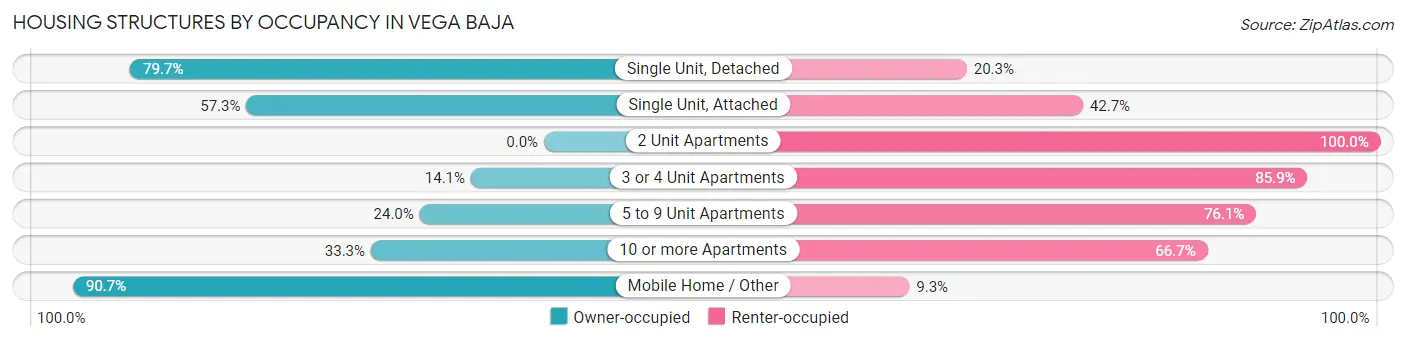
| Structure Type | Owner-occupied | Renter-occupied |
| Single Unit, Detached | 5,323 (79.7%) | 1,358 (20.3%) |
| Single Unit, Attached | 913 (57.3%) | 680 (42.7%) |
| 2 Unit Apartments | 0 (0.0%) | 9 (100.0%) |
| 3 or 4 Unit Apartments | 29 (14.1%) | 177 (85.9%) |
| 5 to 9 Unit Apartments | 63 (23.9%) | 200 (76.0%) |
| 10 or more Apartments | 19 (33.3%) | 38 (66.7%) |
| Mobile Home / Other | 88 (90.7%) | 9 (9.3%) |
| Total | 6,435 (72.3%) | 2,471 (27.8%) |
Housing Structures by Number of Rooms in Vega Baja
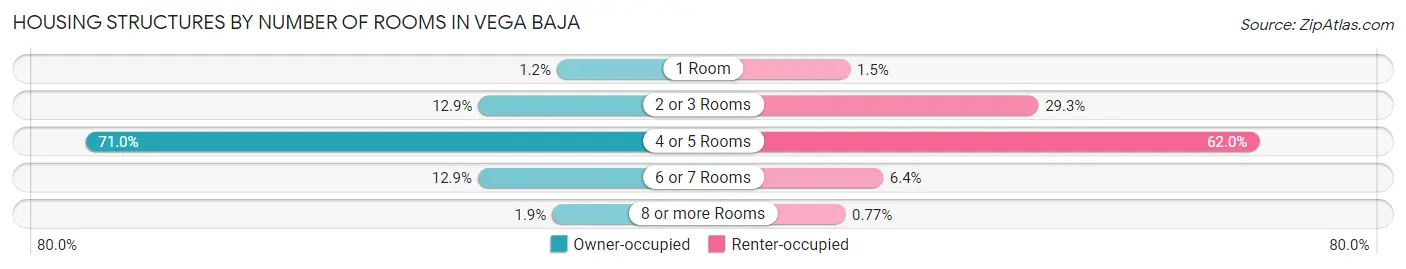
| Number of Rooms | Owner-occupied | Renter-occupied |
| 1 Room | 80 (1.2%) | 37 (1.5%) |
| 2 or 3 Rooms | 828 (12.9%) | 725 (29.3%) |
| 4 or 5 Rooms | 4,569 (71.0%) | 1,533 (62.0%) |
| 6 or 7 Rooms | 833 (12.9%) | 157 (6.4%) |
| 8 or more Rooms | 125 (1.9%) | 19 (0.8%) |
| Total | 6,435 (100.0%) | 2,471 (100.0%) |
Housing Structure by Heating Type in Vega Baja
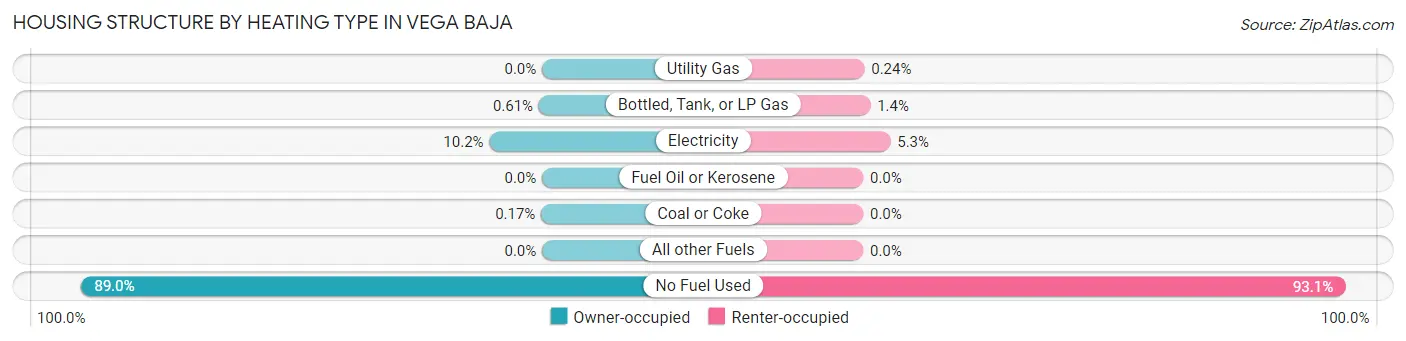
| Heating Type | Owner-occupied | Renter-occupied |
| Utility Gas | 0 (0.0%) | 6 (0.2%) |
| Bottled, Tank, or LP Gas | 39 (0.6%) | 34 (1.4%) |
| Electricity | 655 (10.2%) | 130 (5.3%) |
| Fuel Oil or Kerosene | 0 (0.0%) | 0 (0.0%) |
| Coal or Coke | 11 (0.2%) | 0 (0.0%) |
| All other Fuels | 0 (0.0%) | 0 (0.0%) |
| No Fuel Used | 5,730 (89.0%) | 2,301 (93.1%) |
| Total | 6,435 (100.0%) | 2,471 (100.0%) |
Household Vehicle Usage in Vega Baja
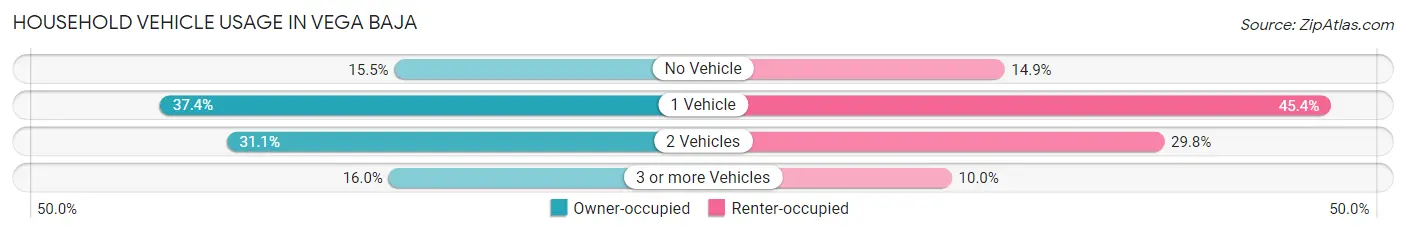
| Vehicles per Household | Owner-occupied | Renter-occupied |
| No Vehicle | 996 (15.5%) | 368 (14.9%) |
| 1 Vehicle | 2,405 (37.4%) | 1,121 (45.4%) |
| 2 Vehicles | 2,004 (31.1%) | 736 (29.8%) |
| 3 or more Vehicles | 1,030 (16.0%) | 246 (10.0%) |
| Total | 6,435 (100.0%) | 2,471 (100.0%) |
Real Estate & Mortgages in Vega Baja
Real Estate and Mortgage Overview in Vega Baja
| Characteristic | Without Mortgage | With Mortgage |
| Housing Units | 4,361 | 2,074 |
| Median Property Value | $104,700 | $133,400 |
| Median Household Income | $20,573 | $9 |
| Monthly Housing Costs | $163 | $9 |
| Real Estate Taxes | $400 | $2,038 |
Property Value by Mortgage Status in Vega Baja
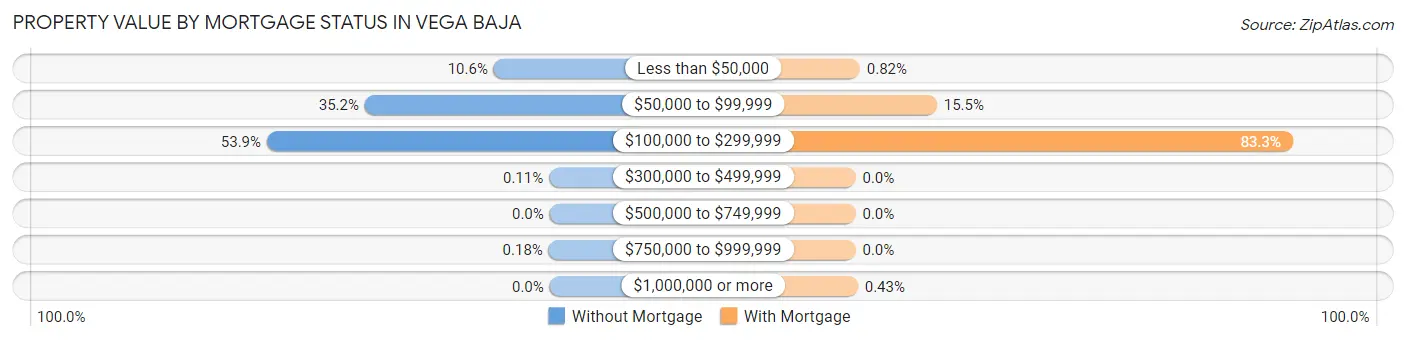
| Property Value | Without Mortgage | With Mortgage |
| Less than $50,000 | 464 (10.6%) | 17 (0.8%) |
| $50,000 to $99,999 | 1,535 (35.2%) | 321 (15.5%) |
| $100,000 to $299,999 | 2,349 (53.9%) | 1,727 (83.3%) |
| $300,000 to $499,999 | 5 (0.1%) | 0 (0.0%) |
| $500,000 to $749,999 | 0 (0.0%) | 0 (0.0%) |
| $750,000 to $999,999 | 8 (0.2%) | 0 (0.0%) |
| $1,000,000 or more | 0 (0.0%) | 9 (0.4%) |
| Total | 4,361 (100.0%) | 2,074 (100.0%) |
Household Income by Mortgage Status in Vega Baja
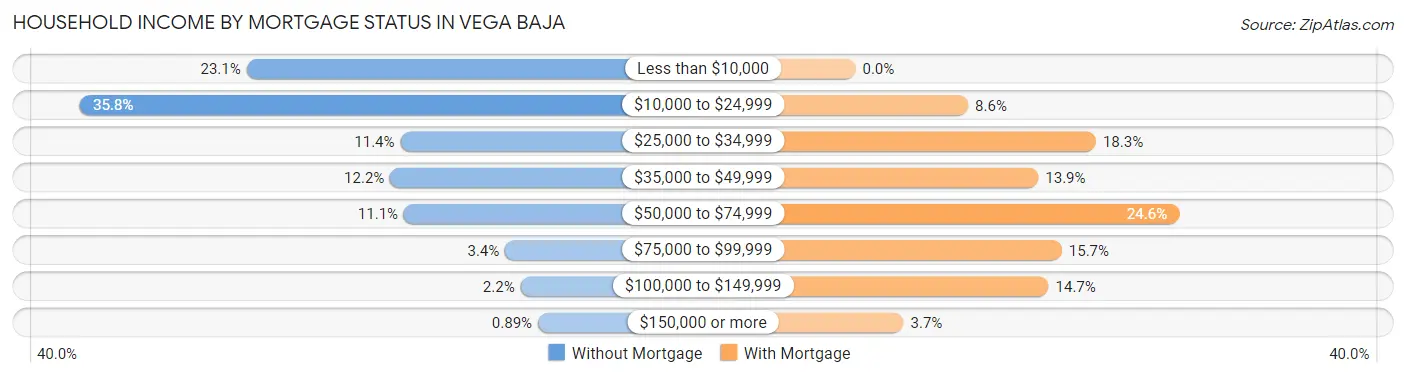
| Household Income | Without Mortgage | With Mortgage |
| Less than $10,000 | 1,007 (23.1%) | 0 (0.0%) |
| $10,000 to $24,999 | 1,560 (35.8%) | 178 (8.6%) |
| $25,000 to $34,999 | 496 (11.4%) | 380 (18.3%) |
| $35,000 to $49,999 | 530 (12.1%) | 289 (13.9%) |
| $50,000 to $74,999 | 484 (11.1%) | 511 (24.6%) |
| $75,000 to $99,999 | 148 (3.4%) | 326 (15.7%) |
| $100,000 to $149,999 | 97 (2.2%) | 305 (14.7%) |
| $150,000 or more | 39 (0.9%) | 76 (3.7%) |
| Total | 4,361 (100.0%) | 2,074 (100.0%) |
Property Value to Household Income Ratio in Vega Baja
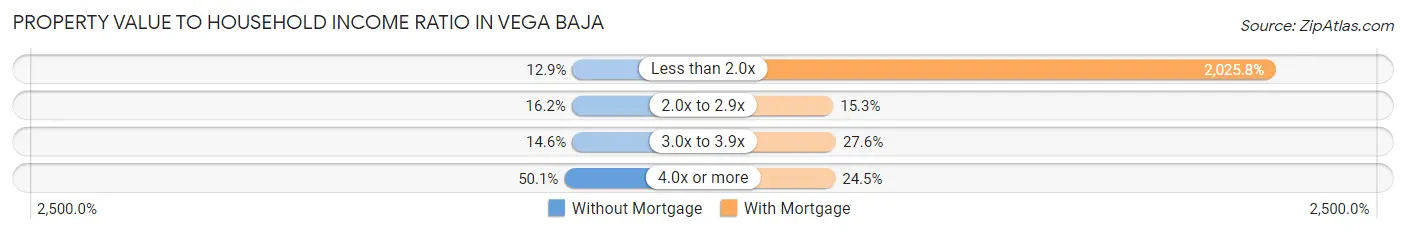
| Value-to-Income Ratio | Without Mortgage | With Mortgage |
| Less than 2.0x | 564 (12.9%) | 42,014 (2,025.8%) |
| 2.0x to 2.9x | 705 (16.2%) | 318 (15.3%) |
| 3.0x to 3.9x | 638 (14.6%) | 572 (27.6%) |
| 4.0x or more | 2,186 (50.1%) | 507 (24.4%) |
| Total | 4,361 (100.0%) | 2,074 (100.0%) |
Real Estate Taxes by Mortgage Status in Vega Baja
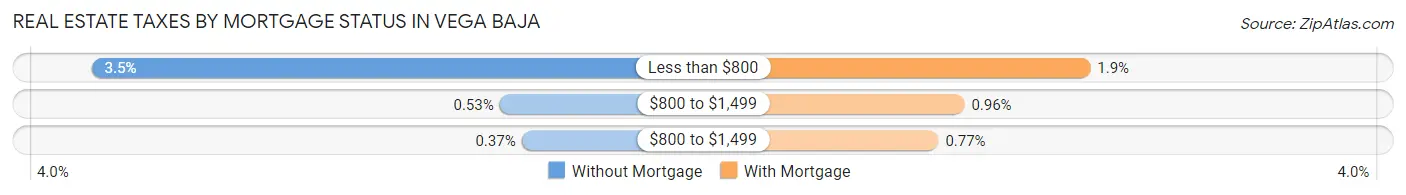
| Property Taxes | Without Mortgage | With Mortgage |
| Less than $800 | 153 (3.5%) | 39 (1.9%) |
| $800 to $1,499 | 23 (0.5%) | 20 (1.0%) |
| $800 to $1,499 | 16 (0.4%) | 16 (0.8%) |
| Total | 4,361 (100.0%) | 2,074 (100.0%) |
Health & Disability in Vega Baja
Health Insurance Coverage by Age in Vega Baja
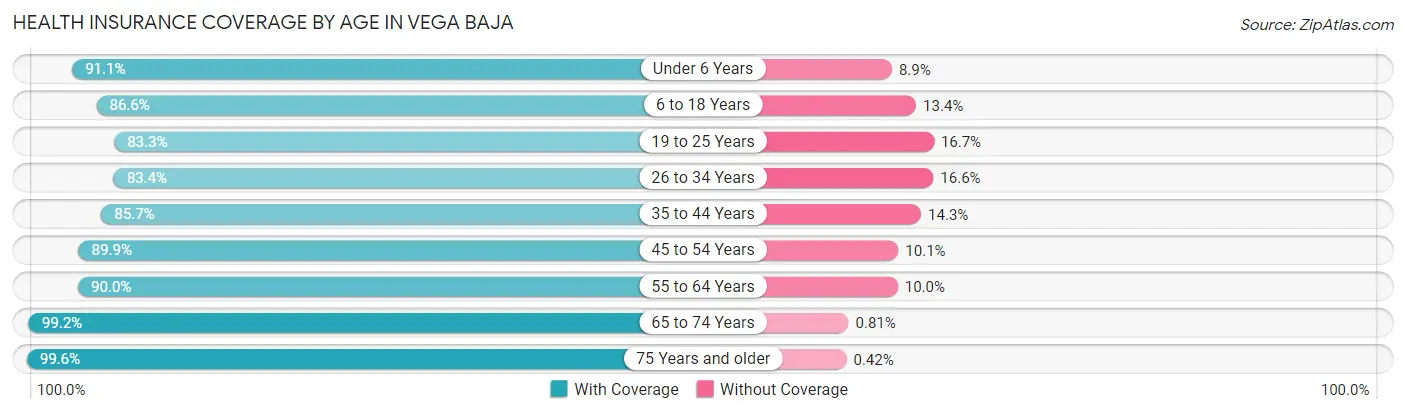
| Age Bracket | With Coverage | Without Coverage |
| Under 6 Years | 933 (91.1%) | 91 (8.9%) |
| 6 to 18 Years | 3,114 (86.6%) | 482 (13.4%) |
| 19 to 25 Years | 1,594 (83.3%) | 320 (16.7%) |
| 26 to 34 Years | 2,353 (83.4%) | 469 (16.6%) |
| 35 to 44 Years | 2,367 (85.7%) | 396 (14.3%) |
| 45 to 54 Years | 2,816 (89.9%) | 316 (10.1%) |
| 55 to 64 Years | 2,584 (90.0%) | 286 (10.0%) |
| 65 to 74 Years | 2,800 (99.2%) | 23 (0.8%) |
| 75 Years and older | 2,383 (99.6%) | 10 (0.4%) |
| Total | 20,944 (89.7%) | 2,393 (10.2%) |
Health Insurance Coverage by Citizenship Status in Vega Baja
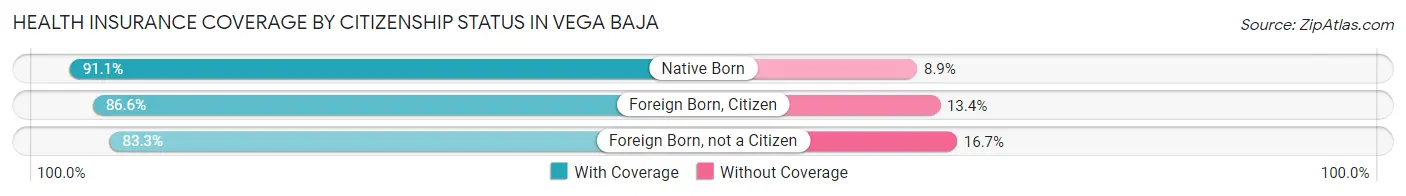
| Citizenship Status | With Coverage | Without Coverage |
| Native Born | 933 (91.1%) | 91 (8.9%) |
| Foreign Born, Citizen | 3,114 (86.6%) | 482 (13.4%) |
| Foreign Born, not a Citizen | 1,594 (83.3%) | 320 (16.7%) |
Health Insurance Coverage by Household Income in Vega Baja
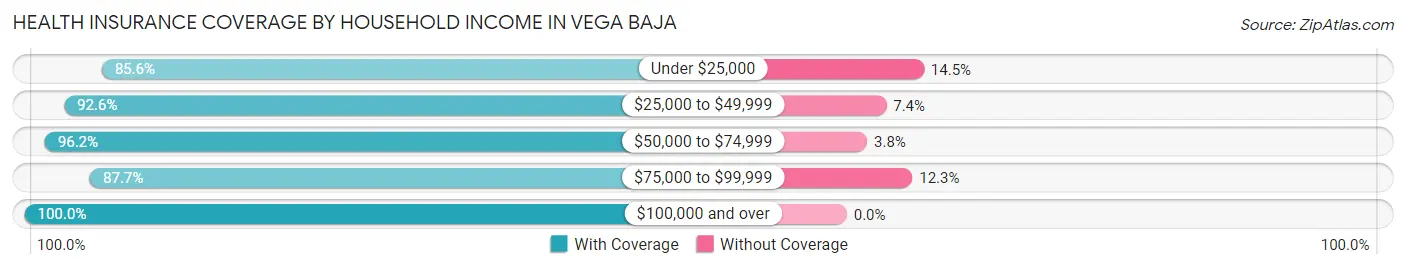
| Household Income | With Coverage | Without Coverage |
| Under $25,000 | 9,138 (85.6%) | 1,543 (14.4%) |
| $25,000 to $49,999 | 5,880 (92.6%) | 470 (7.4%) |
| $50,000 to $74,999 | 3,414 (96.2%) | 135 (3.8%) |
| $75,000 to $99,999 | 1,680 (87.7%) | 235 (12.3%) |
| $100,000 and over | 803 (100.0%) | 0 (0.0%) |
Public vs Private Health Insurance Coverage by Age in Vega Baja
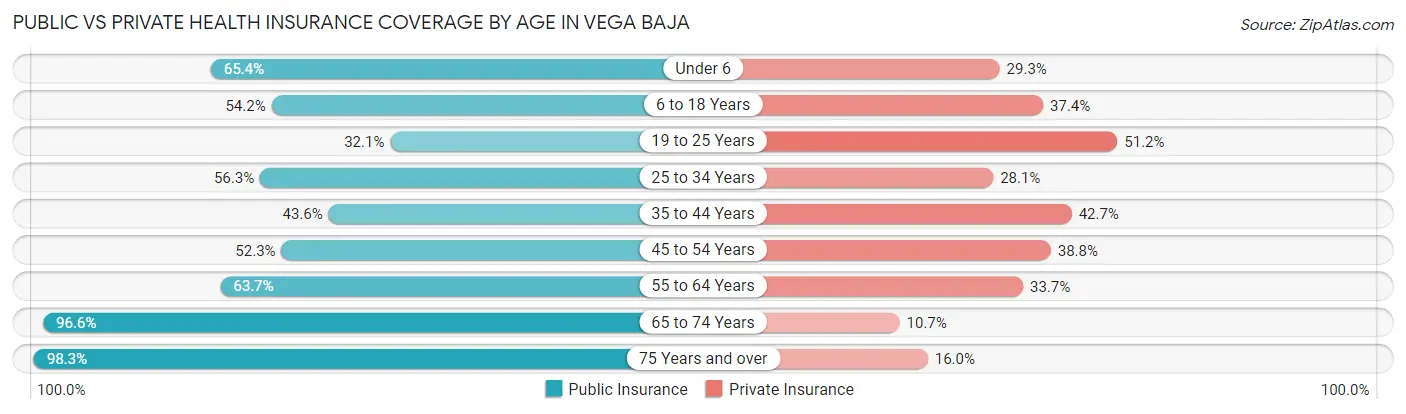
| Age Bracket | Public Insurance | Private Insurance |
| Under 6 | 670 (65.4%) | 300 (29.3%) |
| 6 to 18 Years | 1,948 (54.2%) | 1,344 (37.4%) |
| 19 to 25 Years | 615 (32.1%) | 979 (51.1%) |
| 25 to 34 Years | 1,589 (56.3%) | 793 (28.1%) |
| 35 to 44 Years | 1,204 (43.6%) | 1,179 (42.7%) |
| 45 to 54 Years | 1,639 (52.3%) | 1,215 (38.8%) |
| 55 to 64 Years | 1,827 (63.7%) | 966 (33.7%) |
| 65 to 74 Years | 2,726 (96.6%) | 303 (10.7%) |
| 75 Years and over | 2,352 (98.3%) | 382 (16.0%) |
| Total | 14,570 (62.4%) | 7,461 (32.0%) |
Disability Status by Sex by Age in Vega Baja
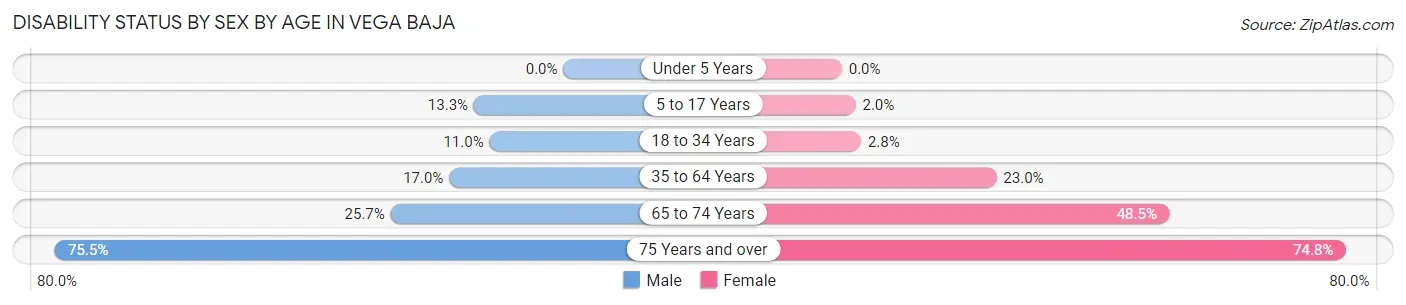
| Age Bracket | Male | Female |
| Under 5 Years | 0 (0.0%) | 0 (0.0%) |
| 5 to 17 Years | 266 (13.3%) | 30 (2.0%) |
| 18 to 34 Years | 264 (11.0%) | 73 (2.8%) |
| 35 to 64 Years | 679 (17.0%) | 1,093 (23.0%) |
| 65 to 74 Years | 312 (25.7%) | 780 (48.5%) |
| 75 Years and over | 742 (75.5%) | 1,054 (74.8%) |
Disability Class by Sex by Age in Vega Baja
Disability Class: Hearing Difficulty
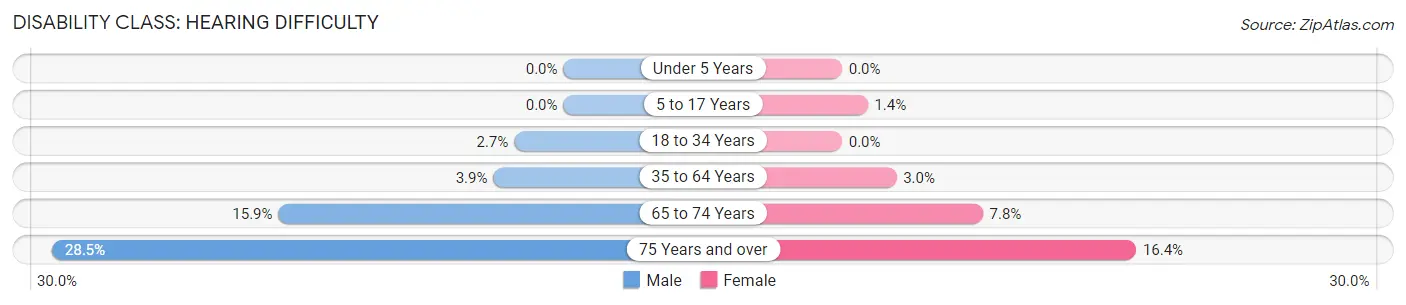
| Age Bracket | Male | Female |
| Under 5 Years | 0 (0.0%) | 0 (0.0%) |
| 5 to 17 Years | 0 (0.0%) | 21 (1.4%) |
| 18 to 34 Years | 66 (2.7%) | 0 (0.0%) |
| 35 to 64 Years | 156 (3.9%) | 144 (3.0%) |
| 65 to 74 Years | 193 (15.9%) | 126 (7.8%) |
| 75 Years and over | 280 (28.5%) | 231 (16.4%) |
Disability Class: Vision Difficulty
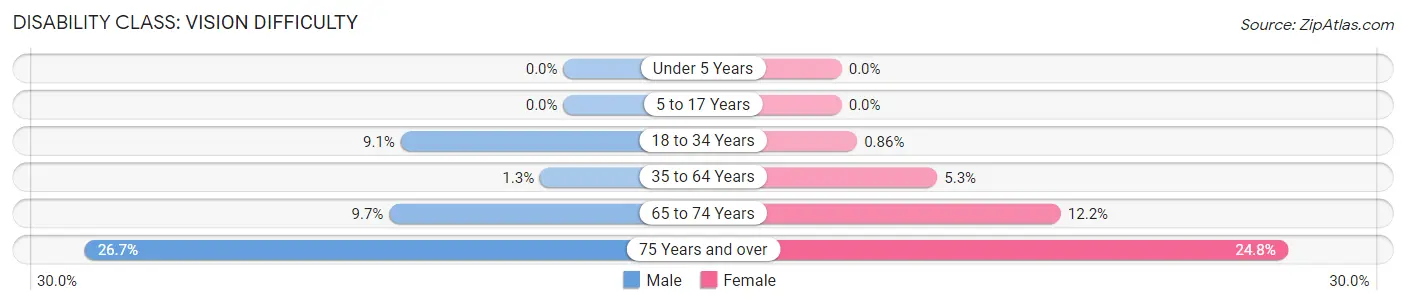
| Age Bracket | Male | Female |
| Under 5 Years | 0 (0.0%) | 0 (0.0%) |
| 5 to 17 Years | 0 (0.0%) | 0 (0.0%) |
| 18 to 34 Years | 218 (9.1%) | 22 (0.9%) |
| 35 to 64 Years | 52 (1.3%) | 253 (5.3%) |
| 65 to 74 Years | 118 (9.7%) | 196 (12.2%) |
| 75 Years and over | 262 (26.7%) | 350 (24.8%) |
Disability Class: Cognitive Difficulty
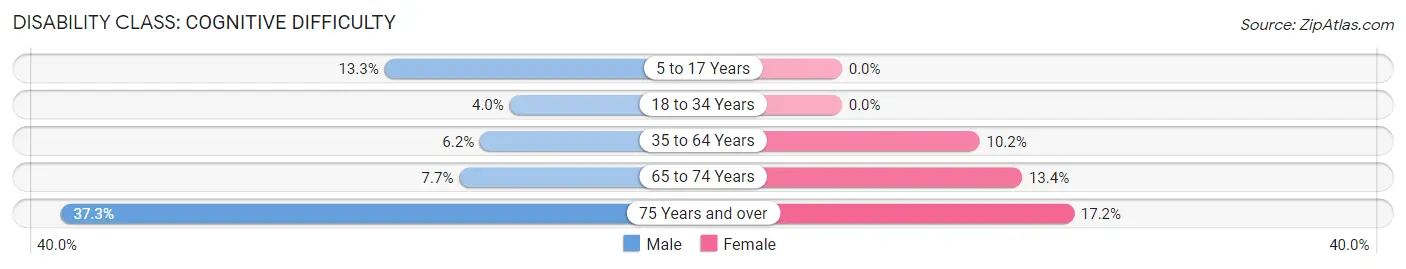
| Age Bracket | Male | Female |
| 5 to 17 Years | 266 (13.3%) | 0 (0.0%) |
| 18 to 34 Years | 96 (4.0%) | 0 (0.0%) |
| 35 to 64 Years | 248 (6.2%) | 487 (10.2%) |
| 65 to 74 Years | 94 (7.7%) | 215 (13.4%) |
| 75 Years and over | 367 (37.3%) | 243 (17.2%) |
Disability Class: Ambulatory Difficulty
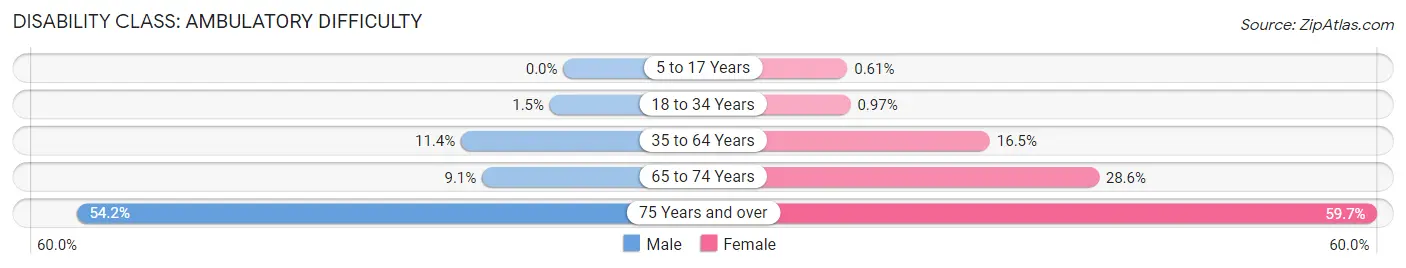
| Age Bracket | Male | Female |
| 5 to 17 Years | 0 (0.0%) | 9 (0.6%) |
| 18 to 34 Years | 36 (1.5%) | 25 (1.0%) |
| 35 to 64 Years | 456 (11.4%) | 785 (16.5%) |
| 65 to 74 Years | 110 (9.0%) | 460 (28.6%) |
| 75 Years and over | 533 (54.2%) | 841 (59.7%) |
Disability Class: Self-Care Difficulty
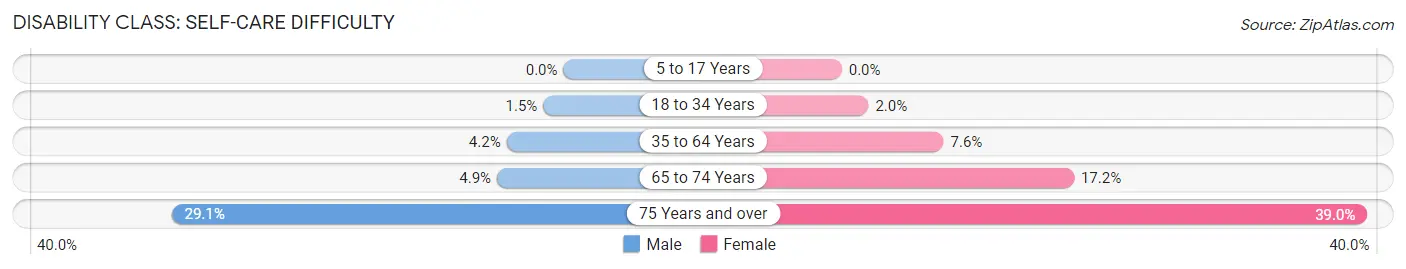
| Age Bracket | Male | Female |
| 5 to 17 Years | 0 (0.0%) | 0 (0.0%) |
| 18 to 34 Years | 36 (1.5%) | 51 (2.0%) |
| 35 to 64 Years | 169 (4.2%) | 360 (7.6%) |
| 65 to 74 Years | 60 (4.9%) | 277 (17.2%) |
| 75 Years and over | 286 (29.1%) | 550 (39.0%) |
Technology Access in Vega Baja
Computing Device Access in Vega Baja
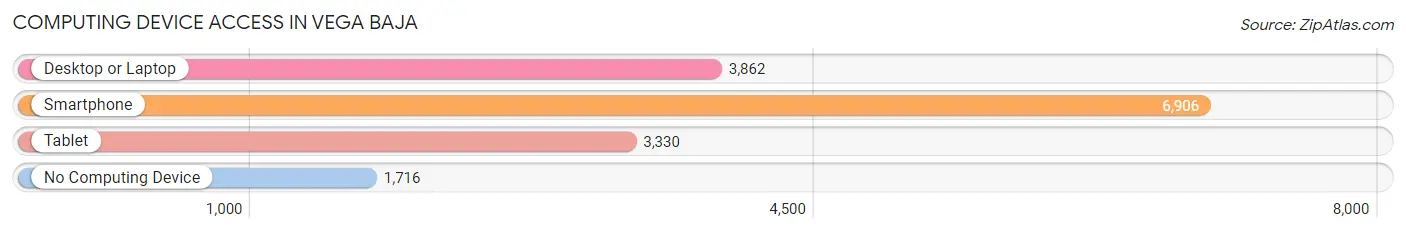
| Device Type | # Households | % Households |
| Desktop or Laptop | 3,862 | 43.4% |
| Smartphone | 6,906 | 77.5% |
| Tablet | 3,330 | 37.4% |
| No Computing Device | 1,716 | 19.3% |
| Total | 8,906 | 100.0% |
Internet Access in Vega Baja
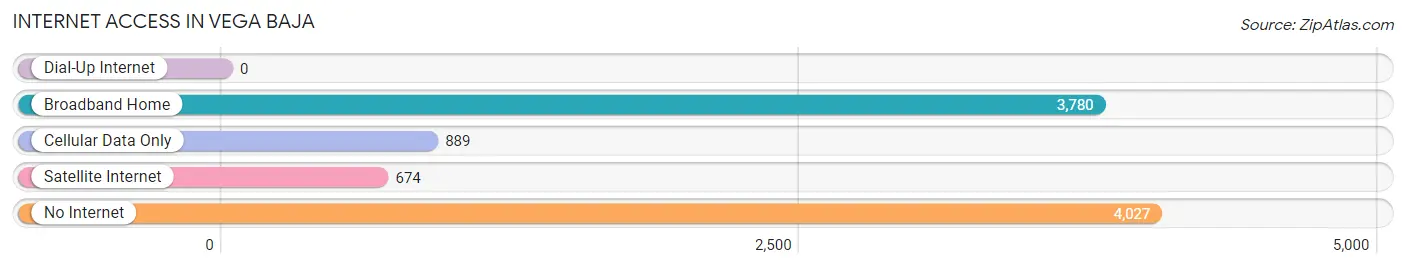
| Internet Type | # Households | % Households |
| Dial-Up Internet | 0 | 0.0% |
| Broadband Home | 3,780 | 42.4% |
| Cellular Data Only | 889 | 10.0% |
| Satellite Internet | 674 | 7.6% |
| No Internet | 4,027 | 45.2% |
| Total | 8,906 | 100.0% |
Vega Baja Summary
Vega Baja is a municipality located in the northern coast of Puerto Rico, in the northern part of the island. It is part of the San Juan-Caguas-Guaynabo Metropolitan Statistical Area. The population of Vega Baja was estimated to be 44,845 in 2019.
Geography
Vega Baja is located in the northern coast of Puerto Rico, in the northern part of the island. It is bordered by the municipalities of Dorado to the west, Toa Baja to the south, and Manatí to the east. The municipality is located on the northern coast of the island, and is part of the San Juan-Caguas-Guaynabo Metropolitan Statistical Area. The municipality covers an area of approximately 40 square miles (103 km2).
The terrain of Vega Baja is mostly flat, with some hills in the western part of the municipality. The highest point in the municipality is Cerro La Torrecilla, which is located in the western part of the municipality and has an elevation of 1,067 feet (325 m). The municipality is located in the northern coastal plain, and is crossed by several rivers, including the Grande de Manatí, the Cibuco, and the Culebrinas.
Climate
Vega Baja has a tropical climate, with hot and humid summers and mild winters. The average temperature in the municipality is around 79°F (26°C). The average annual precipitation is around 50 inches (1,270 mm).
Demographics
As of the 2010 United States Census, the population of Vega Baja was 44,845, of which 22,845 (51.1%) were male and 22,000 (48.9%) were female. The median age was 38.2 years. The racial makeup of the municipality was 79.2% White, 12.3% Black or African American, 0.3% Native American, 0.7% Asian, 0.1% Pacific Islander, and 6.4% from two or more races.
Economy
Vega Baja is an agricultural municipality, with a strong focus on the production of sugar cane, tobacco, and other crops. The municipality is also home to several industrial parks, which are home to a variety of manufacturing and service industries. The municipality is also home to several tourist attractions, including the Vega Baja Beach, the Vega Baja Aquarium, and the Vega Baja Botanical Garden.
The economy of Vega Baja is largely dependent on the agricultural sector, which accounts for around 40% of the municipality's GDP. The manufacturing sector accounts for around 25% of the municipality's GDP, while the service sector accounts for around 35%. The unemployment rate in Vega Baja is around 10%, which is slightly higher than the national average.
Conclusion
Vega Baja is a municipality located in the northern coast of Puerto Rico, in the northern part of the island. It is part of the San Juan-Caguas-Guaynabo Metropolitan Statistical Area. The population of Vega Baja was estimated to be 44,845 in 2019. The municipality has a tropical climate, with hot and humid summers and mild winters. The racial makeup of the municipality was 79.2% White, 12.3% Black or African American, 0.3% Native American, 0.7% Asian, 0.1% Pacific Islander, and 6.4% from two or more races. The economy of Vega Baja is largely dependent on the agricultural sector, which accounts for around 40% of the municipality's GDP. The manufacturing sector accounts for around 25% of the municipality's GDP, while the service sector accounts for around 35%. The unemployment rate in Vega Baja is around 10%, which is slightly higher than the national average.
Common Questions
What is Per Capita Income in Vega Baja?
Per Capita income in Vega Baja is $12,801.
What is the Median Family Income in Vega Baja?
Median Family Income in Vega Baja is $26,632.
What is the Median Household income in Vega Baja?
Median Household Income in Vega Baja is $22,544.
What is Income or Wage Gap in Vega Baja?
Income or Wage Gap in Vega Baja is 2.6%.
Women in Vega Baja earn 97.4 cents for every dollar earned by a man.
What is Family Income Deficit in Vega Baja?
Family Income Deficit in Vega Baja is $12,102.
Families that are below poverty line in Vega Baja earn $12,102 less on average than the poverty threshold level.
What is Inequality or Gini Index in Vega Baja?
Inequality or Gini Index in Vega Baja is 0.49.
What is the Total Population of Vega Baja?
Total Population of Vega Baja is 23,418.
What is the Total Male Population of Vega Baja?
Total Male Population of Vega Baja is 11,181.
What is the Total Female Population of Vega Baja?
Total Female Population of Vega Baja is 12,237.
What is the Ratio of Males per 100 Females in Vega Baja?
There are 91.37 Males per 100 Females in Vega Baja.
What is the Ratio of Females per 100 Males in Vega Baja?
There are 109.44 Females per 100 Males in Vega Baja.
What is the Median Population Age in Vega Baja?
Median Population Age in Vega Baja is 43.1 Years.
What is the Average Family Size in Vega Baja
Average Family Size in Vega Baja is 3.3 People.
What is the Average Household Size in Vega Baja
Average Household Size in Vega Baja is 2.6 People.
How Large is the Labor Force in Vega Baja?
There are 8,809 People in the Labor Forcein in Vega Baja.
What is the Percentage of People in the Labor Force in Vega Baja?
44.7% of People are in the Labor Force in Vega Baja.
What is the Unemployment Rate in Vega Baja?
Unemployment Rate in Vega Baja is 17.8%.