Naguabo, PR Map & Demographics
Naguabo Map
Naguabo Overview
$11,051
PER CAPITA INCOME
$22,175
AVG FAMILY INCOME
$20,267
AVG HOUSEHOLD INCOME
20.0%
WAGE / INCOME GAP [ % ]
80.0¢/ $1
WAGE / INCOME GAP [ $ ]
$13,465
FAMILY INCOME DEFICIT
0.47
INEQUALITY / GINI INDEX
5,104
TOTAL POPULATION
2,362
MALE POPULATION
2,742
FEMALE POPULATION
86.14
MALES / 100 FEMALES
116.09
FEMALES / 100 MALES
35.9
MEDIAN AGE
3.6
AVG FAMILY SIZE
2.9
AVG HOUSEHOLD SIZE
1,498
LABOR FORCE [ PEOPLE ]
39.5%
PERCENT IN LABOR FORCE
13.6%
UNEMPLOYMENT RATE
Naguabo Zip Codes
Naguabo Area Codes
Income in Naguabo
Income Overview in Naguabo
Per Capita Income in Naguabo is $11,051, while median incomes of families and households are $22,175 and $20,267 respectively.
| Characteristic | Number | Measure |
| Per Capita Income | 5,104 | $11,051 |
| Median Family Income | 1,206 | $22,175 |
| Mean Family Income | 1,206 | $30,236 |
| Median Household Income | 1,765 | $20,267 |
| Mean Household Income | 1,765 | $27,697 |
| Income Deficit | 1,206 | $13,465 |
| Wage / Income Gap (%) | 5,104 | 20.05% |
| Wage / Income Gap ($) | 5,104 | 79.95¢ per $1 |
| Gini / Inequality Index | 5,104 | 0.47 |
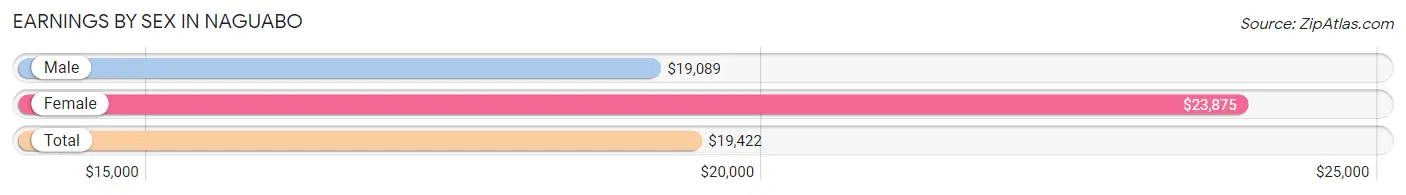
Earnings by Sex in Naguabo
Average Earnings in Naguabo are $19,422, $19,089 for men and $23,875 for women, a difference of 20.1%.
| Sex | Number | Average Earnings |
| Male | 747 (52.6%) | $19,089 |
| Female | 673 (47.4%) | $23,875 |
| Total | 1,420 (100.0%) | $19,422 |
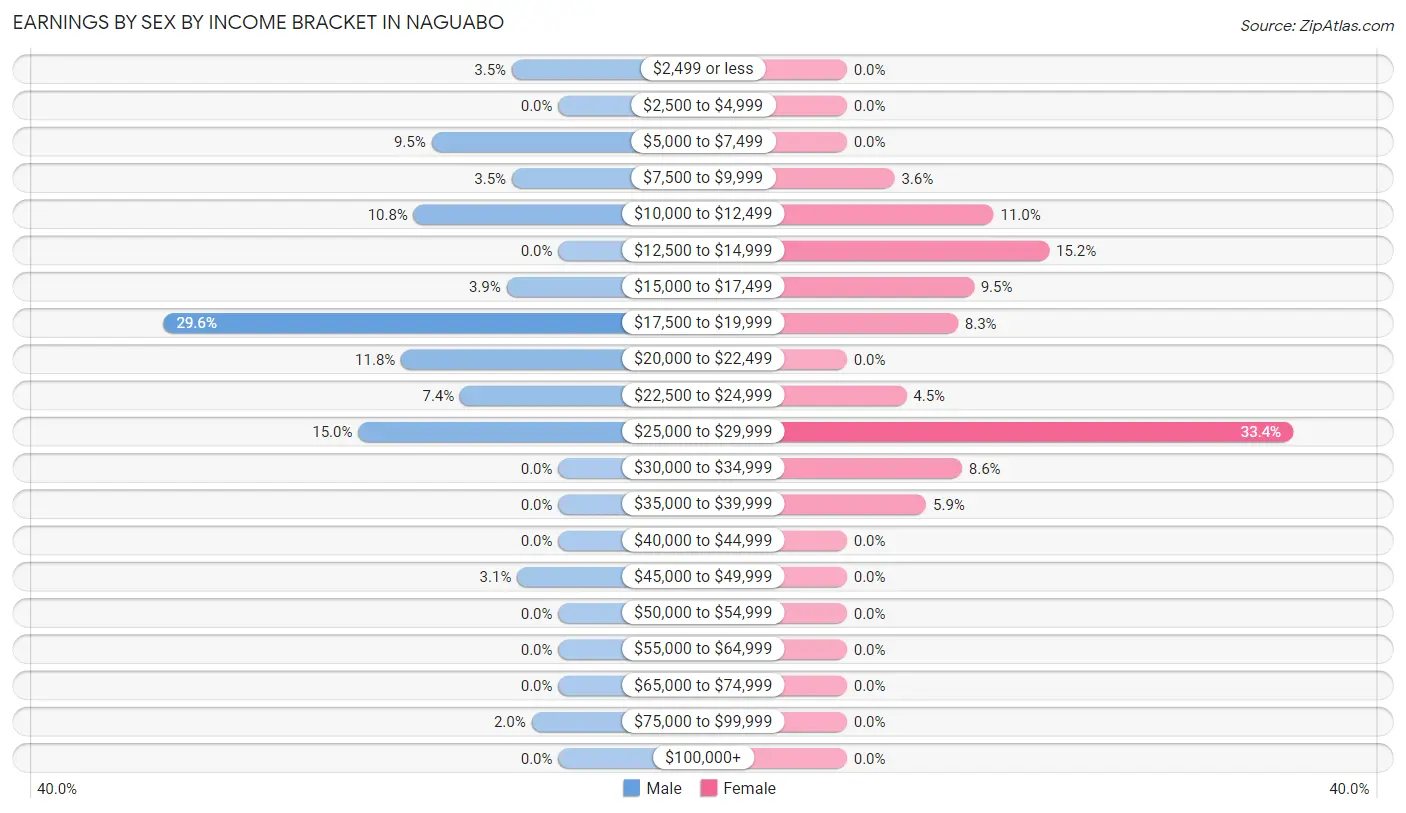
Earnings by Sex by Income Bracket in Naguabo
The most common earnings brackets in Naguabo are $17,500 to $19,999 for men (221 | 29.6%) and $25,000 to $29,999 for women (225 | 33.4%).
| Income | Male | Female |
| $2,499 or less | 26 (3.5%) | 0 (0.0%) |
| $2,500 to $4,999 | 0 (0.0%) | 0 (0.0%) |
| $5,000 to $7,499 | 71 (9.5%) | 0 (0.0%) |
| $7,500 to $9,999 | 26 (3.5%) | 24 (3.6%) |
| $10,000 to $12,499 | 81 (10.8%) | 74 (11.0%) |
| $12,500 to $14,999 | 0 (0.0%) | 102 (15.2%) |
| $15,000 to $17,499 | 29 (3.9%) | 64 (9.5%) |
| $17,500 to $19,999 | 221 (29.6%) | 56 (8.3%) |
| $20,000 to $22,499 | 88 (11.8%) | 0 (0.0%) |
| $22,500 to $24,999 | 55 (7.4%) | 30 (4.5%) |
| $25,000 to $29,999 | 112 (15.0%) | 225 (33.4%) |
| $30,000 to $34,999 | 0 (0.0%) | 58 (8.6%) |
| $35,000 to $39,999 | 0 (0.0%) | 40 (5.9%) |
| $40,000 to $44,999 | 0 (0.0%) | 0 (0.0%) |
| $45,000 to $49,999 | 23 (3.1%) | 0 (0.0%) |
| $50,000 to $54,999 | 0 (0.0%) | 0 (0.0%) |
| $55,000 to $64,999 | 0 (0.0%) | 0 (0.0%) |
| $65,000 to $74,999 | 0 (0.0%) | 0 (0.0%) |
| $75,000 to $99,999 | 15 (2.0%) | 0 (0.0%) |
| $100,000+ | 0 (0.0%) | 0 (0.0%) |
| Total | 747 (100.0%) | 673 (100.0%) |
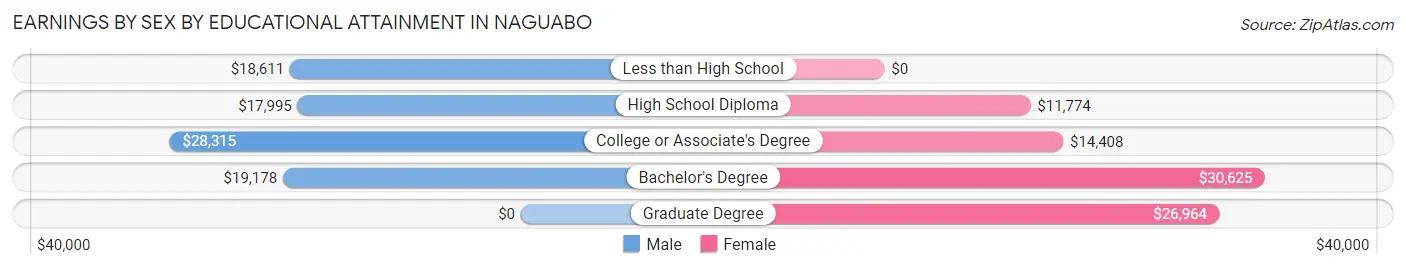
Earnings by Sex by Educational Attainment in Naguabo
Average earnings in Naguabo are $19,525 for men and $23,875 for women, a difference of 18.2%. Men with an educational attainment of college or associate's degree enjoy the highest average annual earnings of $28,315, while those with high school diploma education earn the least with $17,995. Women with an educational attainment of bachelor's degree earn the most with the average annual earnings of $30,625, while those with high school diploma education have the smallest earnings of $11,774.
| Educational Attainment | Male Income | Female Income |
| Less than High School | $18,611 | $0 |
| High School Diploma | $17,995 | $11,774 |
| College or Associate's Degree | $28,315 | $14,408 |
| Bachelor's Degree | $19,178 | $30,625 |
| Graduate Degree | - | - |
| Total | $19,525 | $23,875 |
Family Income in Naguabo
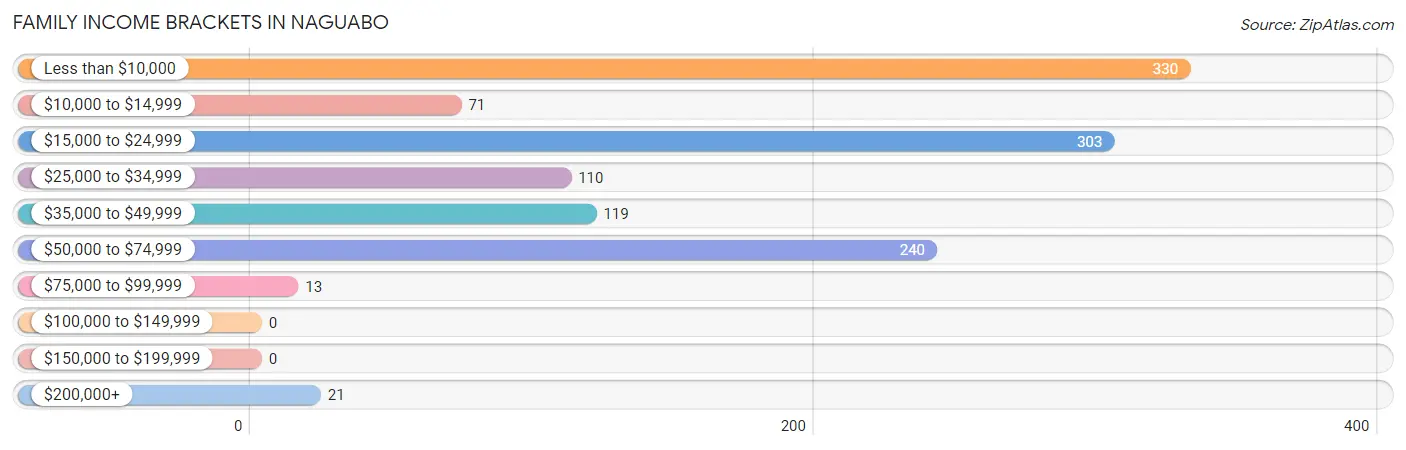
Family Income Brackets in Naguabo
According to the Naguabo family income data, there are 330 families falling into the less than $10,000 income range, which is the most common income bracket and makes up 27.4% of all families.
| Income Bracket | # Families | % Families |
| Less than $10,000 | 330 | 27.4% |
| $10,000 to $14,999 | 71 | 5.9% |
| $15,000 to $24,999 | 303 | 25.1% |
| $25,000 to $34,999 | 110 | 9.1% |
| $35,000 to $49,999 | 119 | 9.9% |
| $50,000 to $74,999 | 240 | 19.9% |
| $75,000 to $99,999 | 13 | 1.1% |
| $100,000 to $149,999 | 0 | 0.0% |
| $150,000 to $199,999 | 0 | 0.0% |
| $200,000+ | 21 | 1.7% |
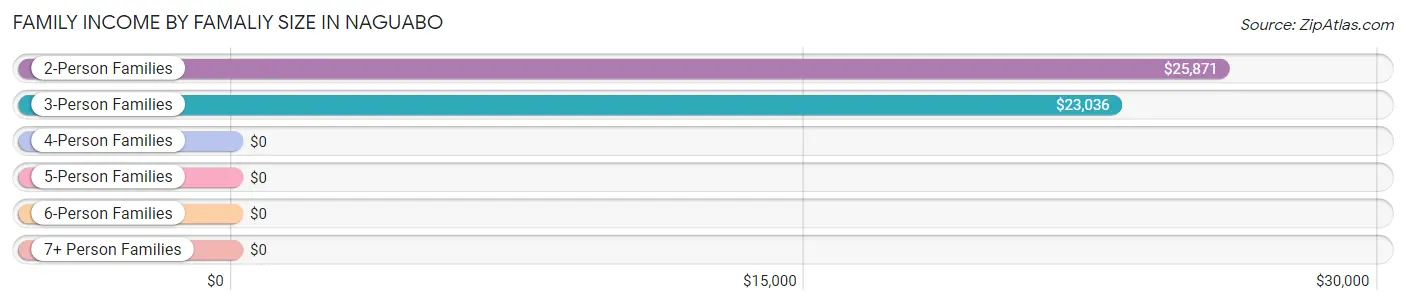
Family Income by Famaliy Size in Naguabo
2-person families (511 | 42.4%) account for the highest median family income in Naguabo with $25,871 per family, while 2-person families (511 | 42.4%) have the highest median income of $12,936 per family member.
| Income Bracket | # Families | Median Income |
| 2-Person Families | 511 (42.4%) | $25,871 |
| 3-Person Families | 375 (31.1%) | $23,036 |
| 4-Person Families | 251 (20.8%) | $0 |
| 5-Person Families | 69 (5.7%) | $0 |
| 6-Person Families | 0 (0.0%) | $0 |
| 7+ Person Families | 0 (0.0%) | $0 |
| Total | 1,206 (100.0%) | $22,175 |
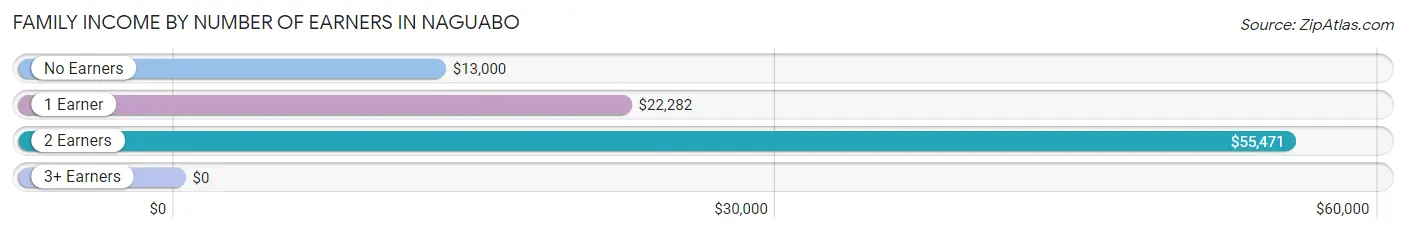
Family Income by Number of Earners in Naguabo
| Number of Earners | # Families | Median Income |
| No Earners | 624 (51.7%) | $13,000 |
| 1 Earner | 351 (29.1%) | $22,282 |
| 2 Earners | 213 (17.7%) | $55,471 |
| 3+ Earners | 18 (1.5%) | $0 |
| Total | 1,206 (100.0%) | $22,175 |
Household Income in Naguabo
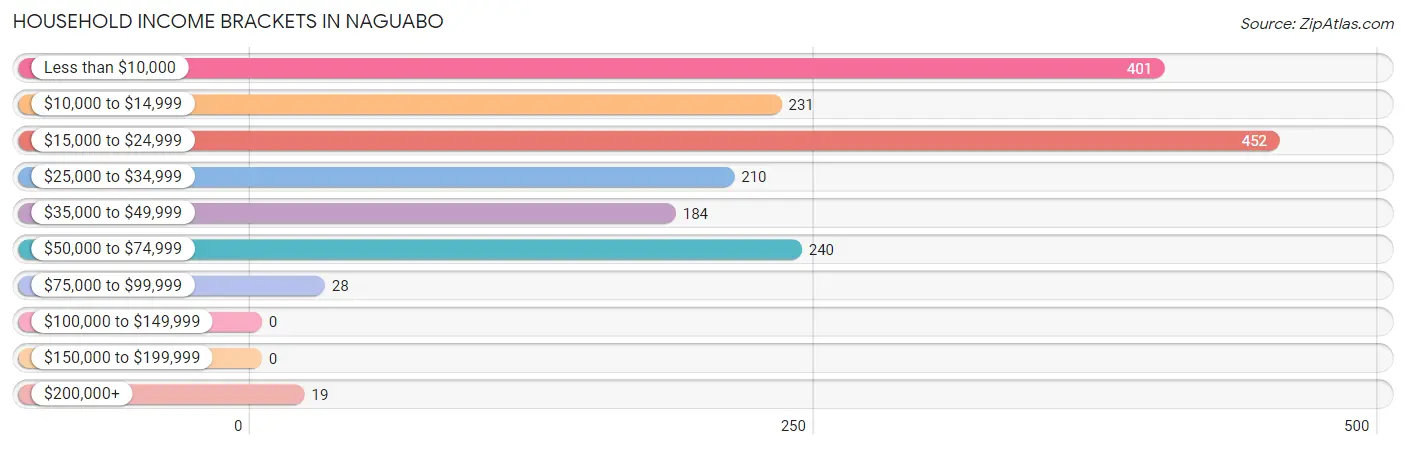
Household Income Brackets in Naguabo
With 452 households falling in the category, the $15,000 to $24,999 income range is the most frequent in Naguabo, accounting for 25.6% of all households.
| Income Bracket | # Households | % Households |
| Less than $10,000 | 401 | 22.7% |
| $10,000 to $14,999 | 231 | 13.1% |
| $15,000 to $24,999 | 452 | 25.6% |
| $25,000 to $34,999 | 210 | 11.9% |
| $35,000 to $49,999 | 184 | 10.4% |
| $50,000 to $74,999 | 240 | 13.6% |
| $75,000 to $99,999 | 28 | 1.6% |
| $100,000 to $149,999 | 0 | 0.0% |
| $150,000 to $199,999 | 0 | 0.0% |
| $200,000+ | 19 | 1.1% |
Household Income by Householder Age in Naguabo
The median household income in Naguabo is $20,267, with the highest median household income of $23,500 found in the 45 to 64 years age bracket for the primary householder. A total of 522 households (29.6%) fall into this category. Meanwhile, the 15 to 24 years age bracket for the primary householder has the lowest median household income of $0, with 22 households (1.3%) in this group.
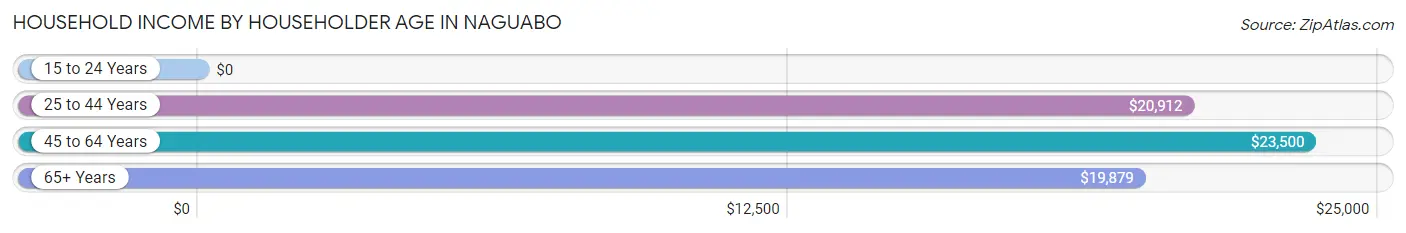
| Income Bracket | # Households | Median Income |
| 15 to 24 Years | 22 (1.3%) | $0 |
| 25 to 44 Years | 551 (31.2%) | $20,912 |
| 45 to 64 Years | 522 (29.6%) | $23,500 |
| 65+ Years | 670 (38.0%) | $19,879 |
| Total | 1,765 (100.0%) | $20,267 |
Poverty in Naguabo
Income Below Poverty by Sex and Age in Naguabo
With 56.0% poverty level for males and 51.2% for females among the residents of Naguabo, under 5 year old males and 15 year old females are the most vulnerable to poverty, with 96 males (100.0%) and 59 females (100.0%) in their respective age groups living below the poverty level.
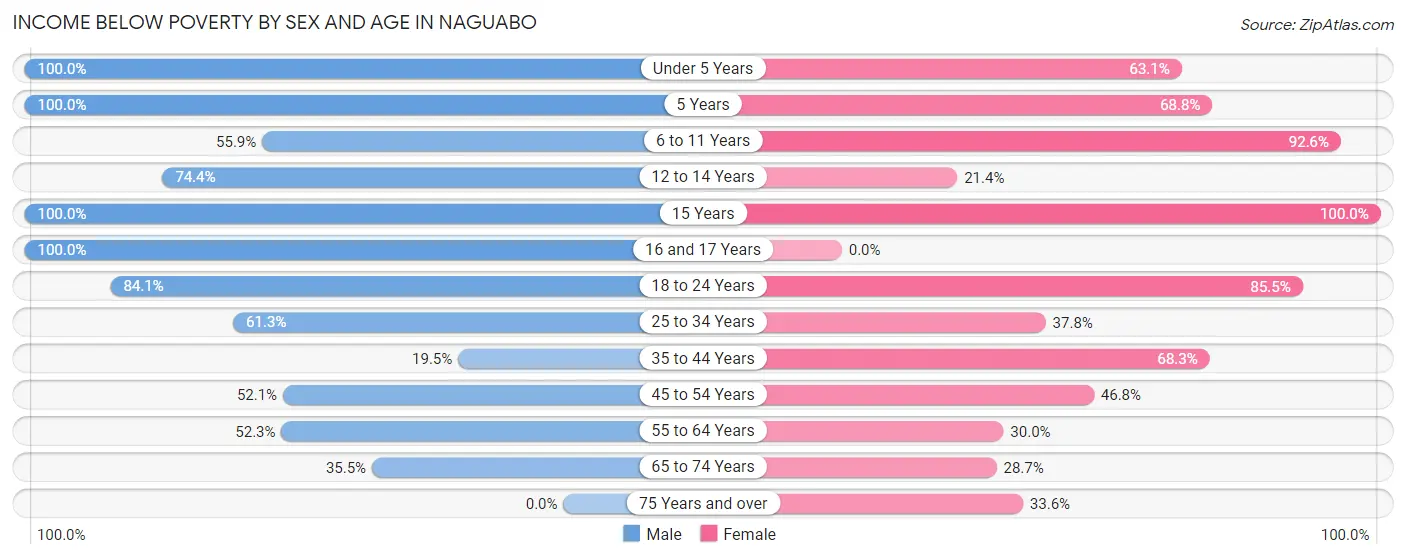
| Age Bracket | Male | Female |
| Under 5 Years | 96 (100.0%) | 99 (63.1%) |
| 5 Years | 36 (100.0%) | 77 (68.8%) |
| 6 to 11 Years | 213 (55.9%) | 201 (92.6%) |
| 12 to 14 Years | 67 (74.4%) | 15 (21.4%) |
| 15 Years | 93 (100.0%) | 59 (100.0%) |
| 16 and 17 Years | 86 (100.0%) | 0 (0.0%) |
| 18 to 24 Years | 269 (84.1%) | 124 (85.5%) |
| 25 to 34 Years | 141 (61.3%) | 140 (37.8%) |
| 35 to 44 Years | 68 (19.5%) | 286 (68.3%) |
| 45 to 54 Years | 114 (52.0%) | 102 (46.8%) |
| 55 to 64 Years | 56 (52.3%) | 72 (30.0%) |
| 65 to 74 Years | 81 (35.5%) | 110 (28.7%) |
| 75 Years and over | 0 (0.0%) | 117 (33.6%) |
| Total | 1,320 (56.0%) | 1,402 (51.2%) |
Income Above Poverty by Sex and Age in Naguabo
According to the poverty statistics in Naguabo, males aged 75 years and over and females aged 12 to 14 years are the age groups that are most secure financially, with 100.0% of males and 78.6% of females in these age groups living above the poverty line.
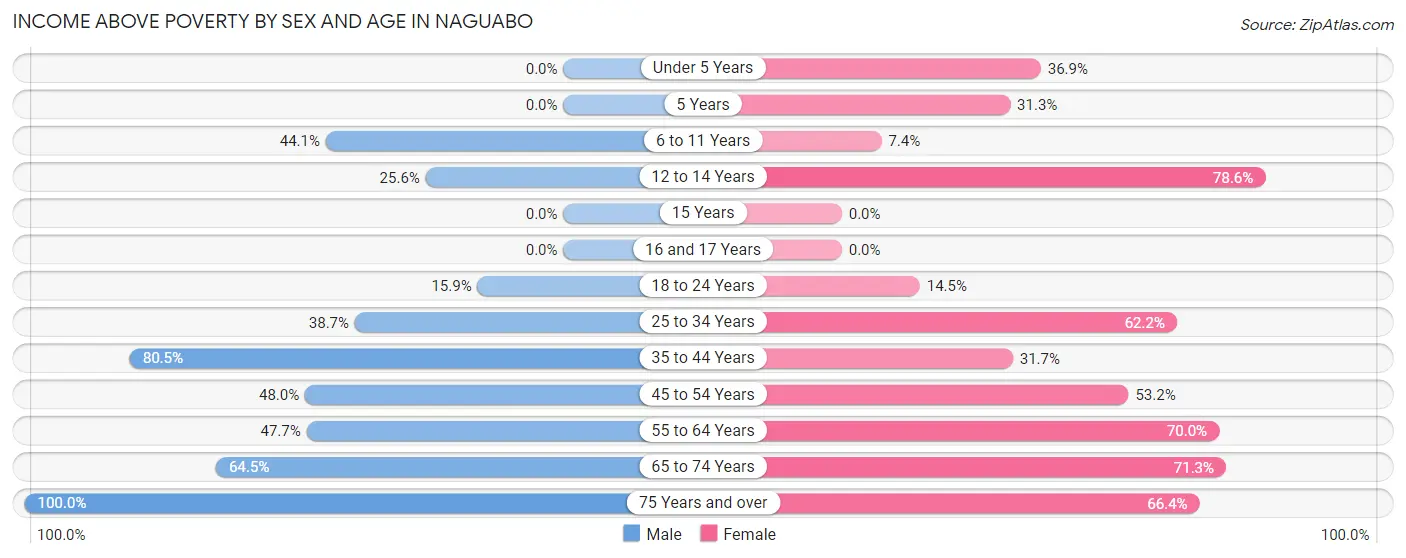
| Age Bracket | Male | Female |
| Under 5 Years | 0 (0.0%) | 58 (36.9%) |
| 5 Years | 0 (0.0%) | 35 (31.2%) |
| 6 to 11 Years | 168 (44.1%) | 16 (7.4%) |
| 12 to 14 Years | 23 (25.6%) | 55 (78.6%) |
| 15 Years | 0 (0.0%) | 0 (0.0%) |
| 16 and 17 Years | 0 (0.0%) | 0 (0.0%) |
| 18 to 24 Years | 51 (15.9%) | 21 (14.5%) |
| 25 to 34 Years | 89 (38.7%) | 230 (62.2%) |
| 35 to 44 Years | 280 (80.5%) | 133 (31.7%) |
| 45 to 54 Years | 105 (47.9%) | 116 (53.2%) |
| 55 to 64 Years | 51 (47.7%) | 168 (70.0%) |
| 65 to 74 Years | 147 (64.5%) | 273 (71.3%) |
| 75 Years and over | 124 (100.0%) | 231 (66.4%) |
| Total | 1,038 (44.0%) | 1,336 (48.8%) |
Income Below Poverty Among Married-Couple Families in Naguabo
The poverty statistics for married-couple families in Naguabo show that 21.2% or 112 of the total 529 families live below the poverty line. Families with no children have the highest poverty rate of 22.9%, comprising of 89 families. On the other hand, families with 3 or 4 children have the lowest poverty rate of 0.0%, which includes 0 families.
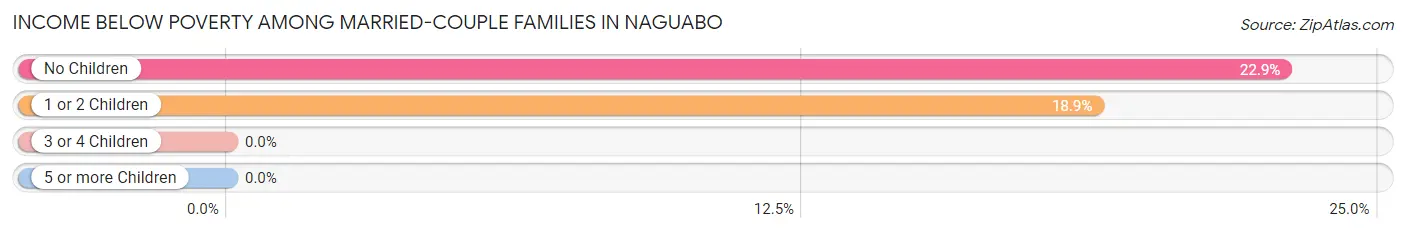
| Children | Above Poverty | Below Poverty |
| No Children | 299 (77.1%) | 89 (22.9%) |
| 1 or 2 Children | 99 (81.1%) | 23 (18.9%) |
| 3 or 4 Children | 19 (100.0%) | 0 (0.0%) |
| 5 or more Children | 0 (0.0%) | 0 (0.0%) |
| Total | 417 (78.8%) | 112 (21.2%) |
Income Below Poverty Among Single-Parent Households in Naguabo
According to the poverty data in Naguabo, 72.7% or 72 single-father households and 69.9% or 404 single-mother households are living below the poverty line. Among single-father households, those with no children have the highest poverty rate, with 44 households (100.0%) experiencing poverty. Likewise, among single-mother households, those with 3 or 4 children have the highest poverty rate, with 119 households (100.0%) falling below the poverty line.
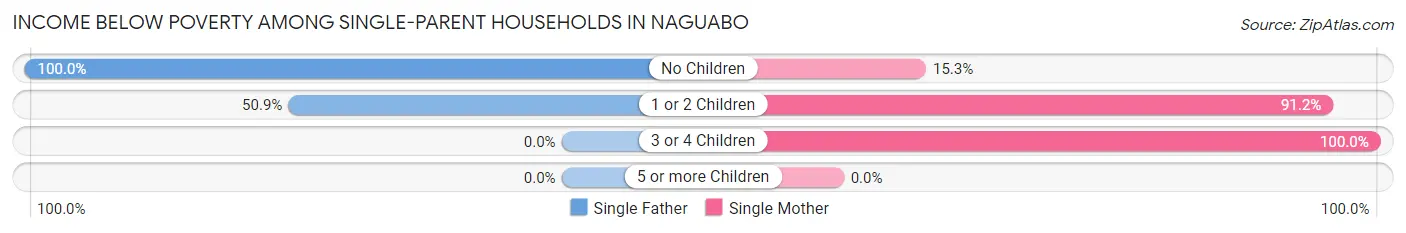
| Children | Single Father | Single Mother |
| No Children | 44 (100.0%) | 27 (15.3%) |
| 1 or 2 Children | 28 (50.9%) | 258 (91.2%) |
| 3 or 4 Children | 0 (0.0%) | 119 (100.0%) |
| 5 or more Children | 0 (0.0%) | 0 (0.0%) |
| Total | 72 (72.7%) | 404 (69.9%) |
Income Below Poverty Among Married-Couple vs Single-Parent Households in Naguabo
The poverty data for Naguabo shows that 112 of the married-couple family households (21.2%) and 476 of the single-parent households (70.3%) are living below the poverty level. Within the married-couple family households, those with no children have the highest poverty rate, with 89 households (22.9%) falling below the poverty line. Among the single-parent households, those with 3 or 4 children have the highest poverty rate, with 119 household (100.0%) living below poverty.
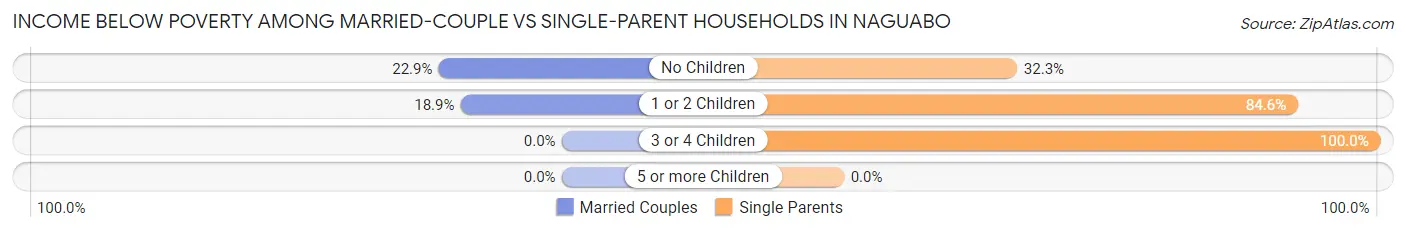
| Children | Married-Couple Families | Single-Parent Households |
| No Children | 89 (22.9%) | 71 (32.3%) |
| 1 or 2 Children | 23 (18.9%) | 286 (84.6%) |
| 3 or 4 Children | 0 (0.0%) | 119 (100.0%) |
| 5 or more Children | 0 (0.0%) | 0 (0.0%) |
| Total | 112 (21.2%) | 476 (70.3%) |
Race in Naguabo
The most populous races in Naguabo are Hispanic or Latino (5,001 | 98.0%), Some other Race (2,373 | 46.5%), and White / Caucasian (1,932 | 37.9%).
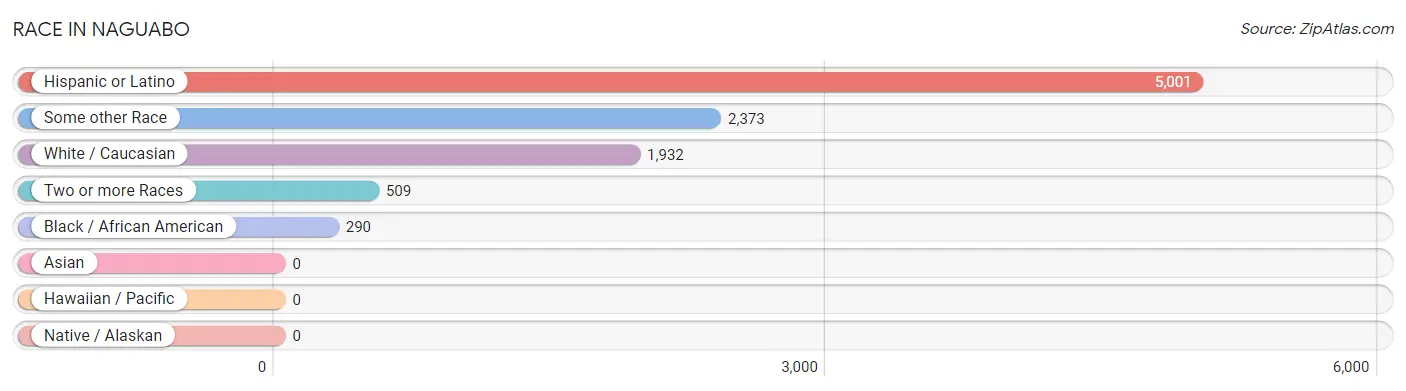
| Race | # Population | % Population |
| Asian | 0 | 0.0% |
| Black / African American | 290 | 5.7% |
| Hawaiian / Pacific | 0 | 0.0% |
| Hispanic or Latino | 5,001 | 98.0% |
| Native / Alaskan | 0 | 0.0% |
| White / Caucasian | 1,932 | 37.9% |
| Two or more Races | 509 | 10.0% |
| Some other Race | 2,373 | 46.5% |
| Total | 5,104 | 100.0% |
Ancestry in Naguabo
The most populous ancestries reported in Naguabo are Puerto Rican (4,916 | 96.3%), American (141 | 2.8%), West Indian (37 | 0.7%), Cuban (34 | 0.7%), and Dominican (26 | 0.5%), together accounting for 101.0% of all Naguabo residents.
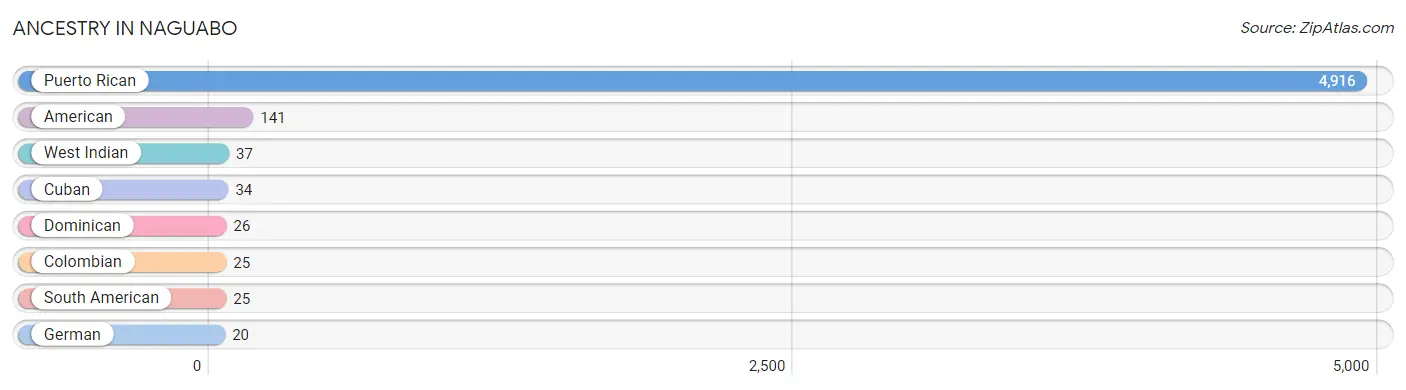
| Ancestry | # Population | % Population |
| American | 141 | 2.8% |
| Colombian | 25 | 0.5% |
| Cuban | 34 | 0.7% |
| Dominican | 26 | 0.5% |
| German | 20 | 0.4% |
| Puerto Rican | 4,916 | 96.3% |
| South American | 25 | 0.5% |
| West Indian | 37 | 0.7% | View All 8 Rows |
Immigrants in Naguabo

| Immigration Origin | # Population | % Population | View All 0 Rows |
Sex and Age in Naguabo
Sex and Age in Naguabo
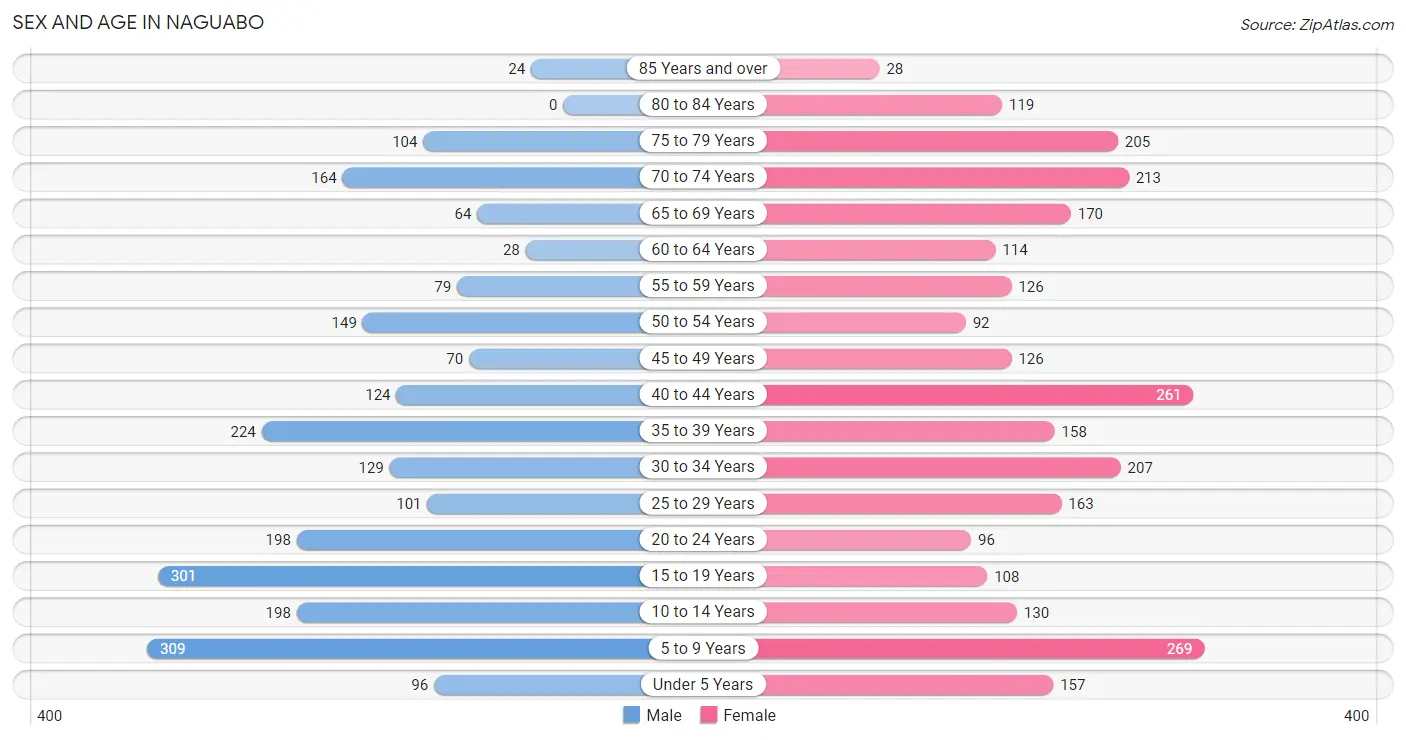
The most populous age groups in Naguabo are 5 to 9 Years (309 | 13.1%) for men and 5 to 9 Years (269 | 9.8%) for women.
| Age Bracket | Male | Female |
| Under 5 Years | 96 (4.1%) | 157 (5.7%) |
| 5 to 9 Years | 309 (13.1%) | 269 (9.8%) |
| 10 to 14 Years | 198 (8.4%) | 130 (4.7%) |
| 15 to 19 Years | 301 (12.7%) | 108 (3.9%) |
| 20 to 24 Years | 198 (8.4%) | 96 (3.5%) |
| 25 to 29 Years | 101 (4.3%) | 163 (5.9%) |
| 30 to 34 Years | 129 (5.5%) | 207 (7.5%) |
| 35 to 39 Years | 224 (9.5%) | 158 (5.8%) |
| 40 to 44 Years | 124 (5.2%) | 261 (9.5%) |
| 45 to 49 Years | 70 (3.0%) | 126 (4.6%) |
| 50 to 54 Years | 149 (6.3%) | 92 (3.4%) |
| 55 to 59 Years | 79 (3.3%) | 126 (4.6%) |
| 60 to 64 Years | 28 (1.2%) | 114 (4.2%) |
| 65 to 69 Years | 64 (2.7%) | 170 (6.2%) |
| 70 to 74 Years | 164 (6.9%) | 213 (7.8%) |
| 75 to 79 Years | 104 (4.4%) | 205 (7.5%) |
| 80 to 84 Years | 0 (0.0%) | 119 (4.3%) |
| 85 Years and over | 24 (1.0%) | 28 (1.0%) |
| Total | 2,362 (100.0%) | 2,742 (100.0%) |
Families and Households in Naguabo
Median Family Size in Naguabo
The median family size in Naguabo is 3.56 persons per family, with single male/father families (99 | 8.2%) accounting for the largest median family size of 3.94 persons per family. On the other hand, married-couple families (529 | 43.9%) represent the smallest median family size with 3.14 persons per family.
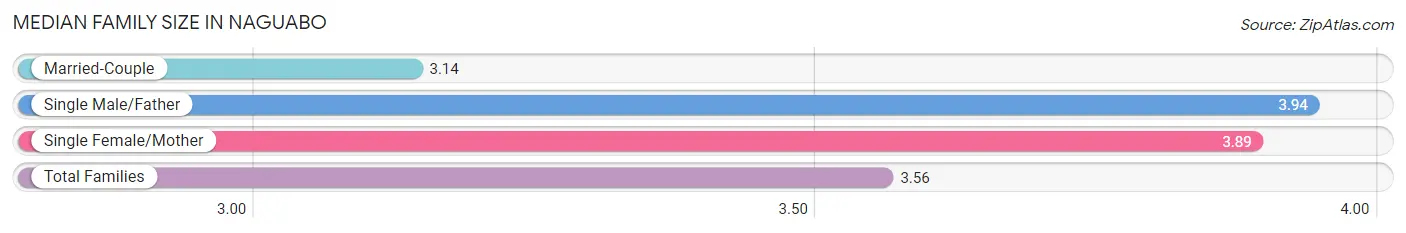
| Family Type | # Families | Family Size |
| Married-Couple | 529 (43.9%) | 3.14 |
| Single Male/Father | 99 (8.2%) | 3.94 |
| Single Female/Mother | 578 (47.9%) | 3.89 |
| Total Families | 1,206 (100.0%) | 3.56 |
Median Household Size in Naguabo
The median household size in Naguabo is 2.88 persons per household, with single male/father households (99 | 5.6%) accounting for the largest median household size of 4.22 persons per household. non-family households (559 | 31.7%) represent the smallest median household size with 1.14 persons per household.
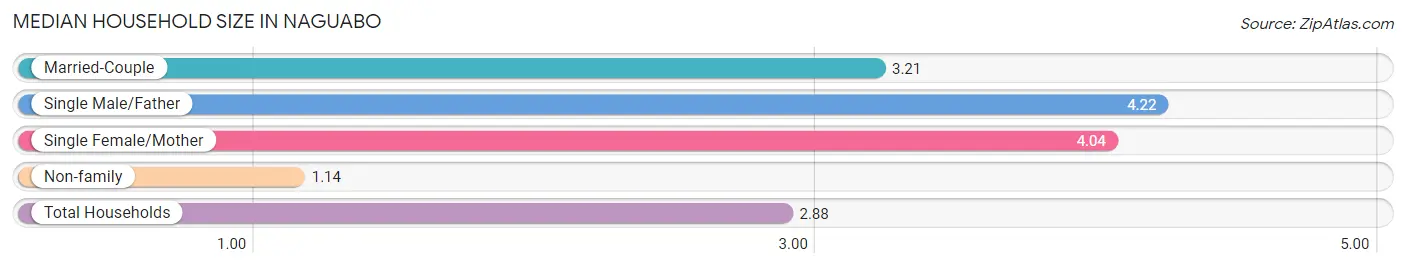
| Household Type | # Households | Household Size |
| Married-Couple | 529 (30.0%) | 3.21 |
| Single Male/Father | 99 (5.6%) | 4.22 |
| Single Female/Mother | 578 (32.8%) | 4.04 |
| Non-family | 559 (31.7%) | 1.14 |
| Total Households | 1,765 (100.0%) | 2.88 |
Household Size by Marriage Status in Naguabo
Out of a total of 1,765 households in Naguabo, 1,206 (68.3%) are family households, while 559 (31.7%) are nonfamily households. The most numerous type of family households are 2-person households, comprising 437, and the most common type of nonfamily households are 1-person households, comprising 531.
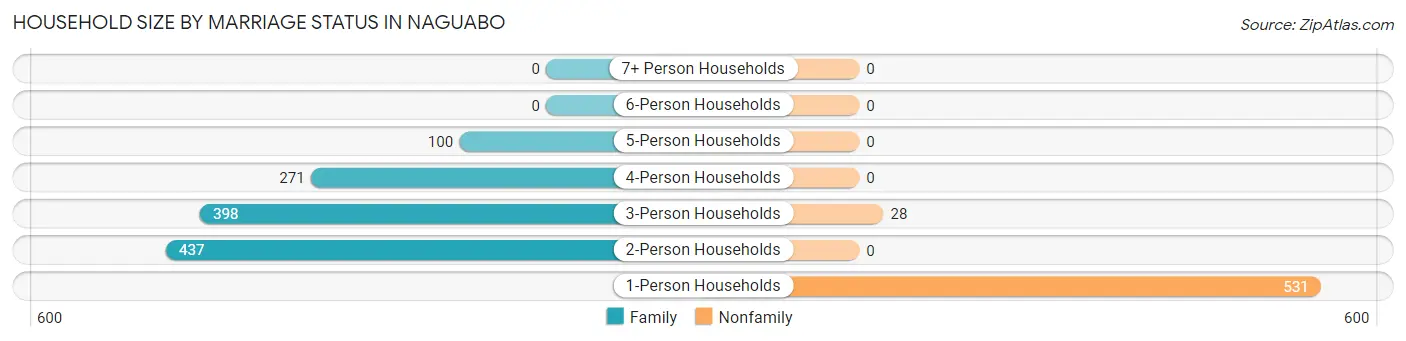
| Household Size | Family Households | Nonfamily Households |
| 1-Person Households | - | 531 (30.1%) |
| 2-Person Households | 437 (24.8%) | 0 (0.0%) |
| 3-Person Households | 398 (22.6%) | 28 (1.6%) |
| 4-Person Households | 271 (15.3%) | 0 (0.0%) |
| 5-Person Households | 100 (5.7%) | 0 (0.0%) |
| 6-Person Households | 0 (0.0%) | 0 (0.0%) |
| 7+ Person Households | 0 (0.0%) | 0 (0.0%) |
| Total | 1,206 (68.3%) | 559 (31.7%) |
Female Fertility in Naguabo
Fertility by Age in Naguabo
| Age Bracket | Women with Births | Births / 1,000 Women |
| 15 to 19 years | 0 (0.0%) | 0.0 |
| 20 to 34 years | 0 (0.0%) | 0.0 |
| 35 to 50 years | 0 (0.0%) | 0.0 |
| Total | 0 (0.0%) | 0.0 |
Fertility by Age by Marriage Status in Naguabo
| Age Bracket | Married | Unmarried |
| 15 to 19 years | 0 (0.0%) | 0 (0.0%) |
| 20 to 34 years | 0 (0.0%) | 0 (0.0%) |
| 35 to 50 years | 0 (0.0%) | 0 (0.0%) |
| Total | 0 (0.0%) | 0 (0.0%) |
Fertility by Education in Naguabo
| Educational Attainment | Women with Births | Births / 1,000 Women |
| Less than High School | 0 (0.0%) | 0.0 |
| High School Diploma | 0 (0.0%) | 0.0 |
| College or Associate's Degree | 0 (0.0%) | 0.0 |
| Bachelor's Degree | 0 (0.0%) | 0.0 |
| Graduate Degree | 0 (0.0%) | 0.0 |
| Total | 0 (0.0%) | 0.0 |
Fertility by Education by Marriage Status in Naguabo
| Educational Attainment | Married | Unmarried |
| Less than High School | 0 (0.0%) | 0 (0.0%) |
| High School Diploma | 0 (0.0%) | 0 (0.0%) |
| College or Associate's Degree | 0 (0.0%) | 0 (0.0%) |
| Bachelor's Degree | 0 (0.0%) | 0 (0.0%) |
| Graduate Degree | 0 (0.0%) | 0 (0.0%) |
| Total | 0 (0.0%) | 0 (0.0%) |
Employment Characteristics in Naguabo
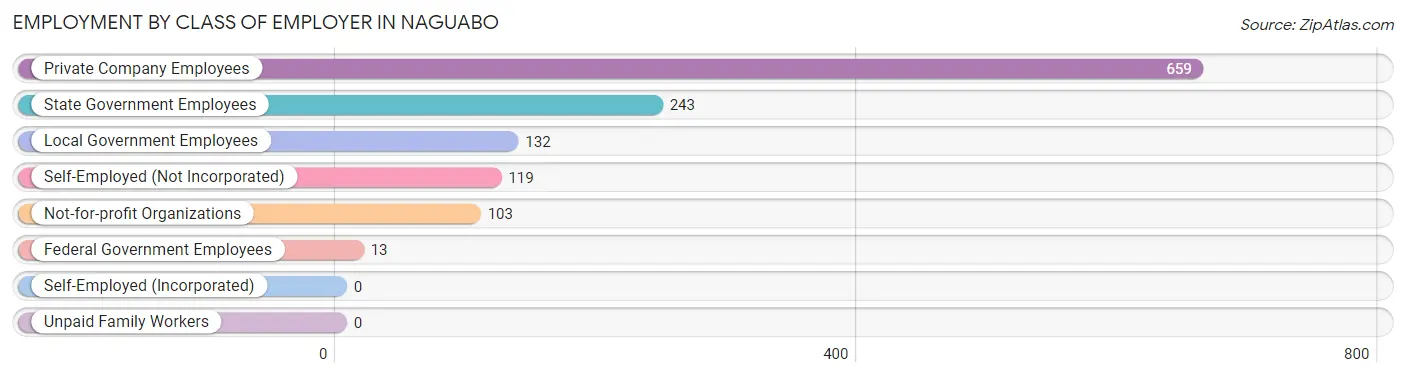
Employment by Class of Employer in Naguabo
Among the 1,269 employed individuals in Naguabo, private company employees (659 | 51.9%), state government employees (243 | 19.2%), and local government employees (132 | 10.4%) make up the most common classes of employment.
| Employer Class | # Employees | % Employees |
| Private Company Employees | 659 | 51.9% |
| Self-Employed (Incorporated) | 0 | 0.0% |
| Self-Employed (Not Incorporated) | 119 | 9.4% |
| Not-for-profit Organizations | 103 | 8.1% |
| Local Government Employees | 132 | 10.4% |
| State Government Employees | 243 | 19.2% |
| Federal Government Employees | 13 | 1.0% |
| Unpaid Family Workers | 0 | 0.0% |
| Total | 1,269 | 100.0% |
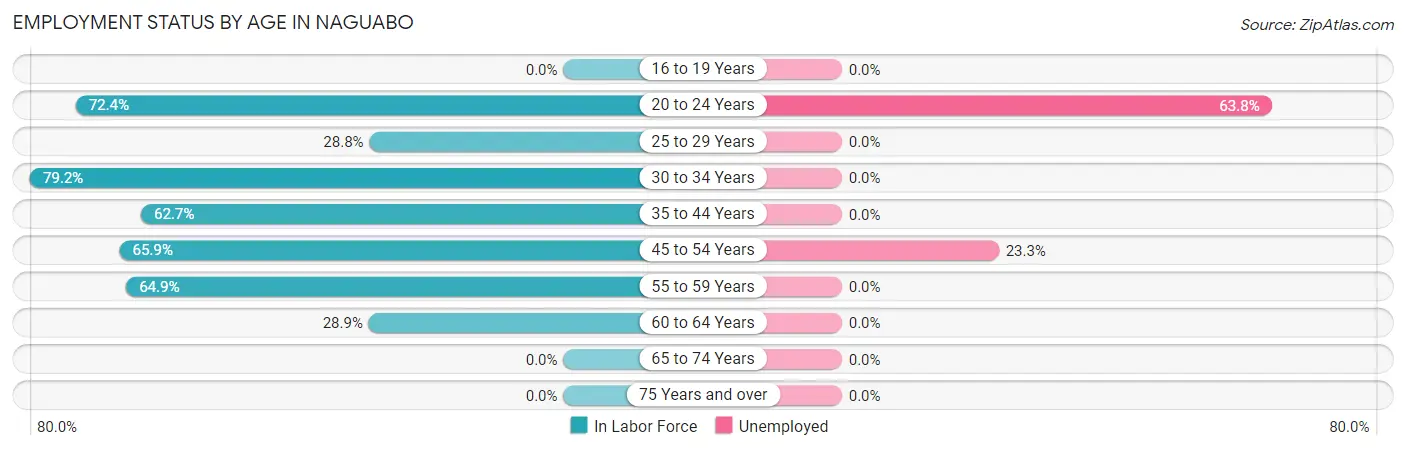
Employment Status by Age in Naguabo
According to the labor force statistics for Naguabo, out of the total population over 16 years of age (3,793), 39.5% or 1,498 individuals are in the labor force, with 13.6% or 204 of them unemployed. The age group with the highest labor force participation rate is 30 to 34 years, with 79.2% or 266 individuals in the labor force. Within the labor force, the 20 to 24 years age range has the highest percentage of unemployed individuals, with 63.8% or 136 of them being unemployed.
| Age Bracket | In Labor Force | Unemployed |
| 16 to 19 Years | 0 (0.0%) | 0 (0.0%) |
| 20 to 24 Years | 213 (72.4%) | 136 (63.8%) |
| 25 to 29 Years | 76 (28.8%) | 0 (0.0%) |
| 30 to 34 Years | 266 (79.2%) | 0 (0.0%) |
| 35 to 44 Years | 481 (62.7%) | 0 (0.0%) |
| 45 to 54 Years | 288 (65.9%) | 67 (23.3%) |
| 55 to 59 Years | 133 (64.9%) | 0 (0.0%) |
| 60 to 64 Years | 41 (28.9%) | 0 (0.0%) |
| 65 to 74 Years | 0 (0.0%) | 0 (0.0%) |
| 75 Years and over | 0 (0.0%) | 0 (0.0%) |
| Total | 1,498 (39.5%) | 204 (13.6%) |
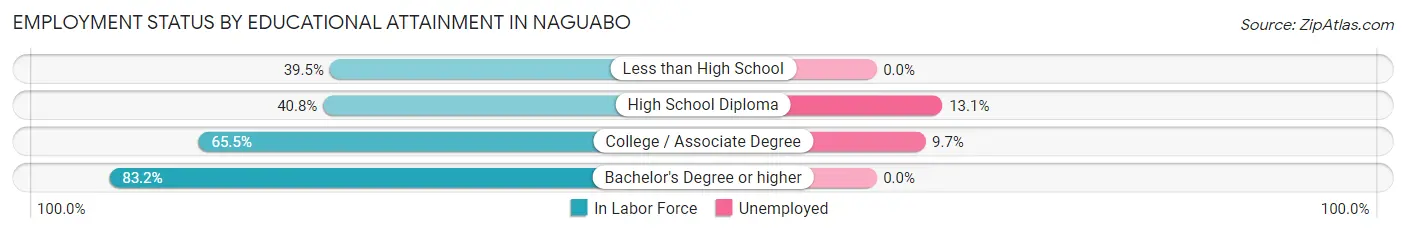
Employment Status by Educational Attainment in Naguabo
According to labor force statistics for Naguabo, 59.7% of individuals (1,284) out of the total population between 25 and 64 years of age (2,151) are in the labor force, with 5.2% or 67 of them being unemployed. The group with the highest labor force participation rate are those with the educational attainment of bachelor's degree or higher, with 83.2% or 570 individuals in the labor force. Within the labor force, individuals with high school diploma education have the highest percentage of unemployment, with 13.1% or 36 of them being unemployed.
| Educational Attainment | In Labor Force | Unemployed |
| Less than High School | 120 (39.5%) | 0 (0.0%) |
| High School Diploma | 274 (40.8%) | 88 (13.1%) |
| College / Associate Degree | 321 (65.5%) | 48 (9.7%) |
| Bachelor's Degree or higher | 570 (83.2%) | 0 (0.0%) |
| Total | 1,284 (59.7%) | 112 (5.2%) |
Employment Occupations by Sex in Naguabo
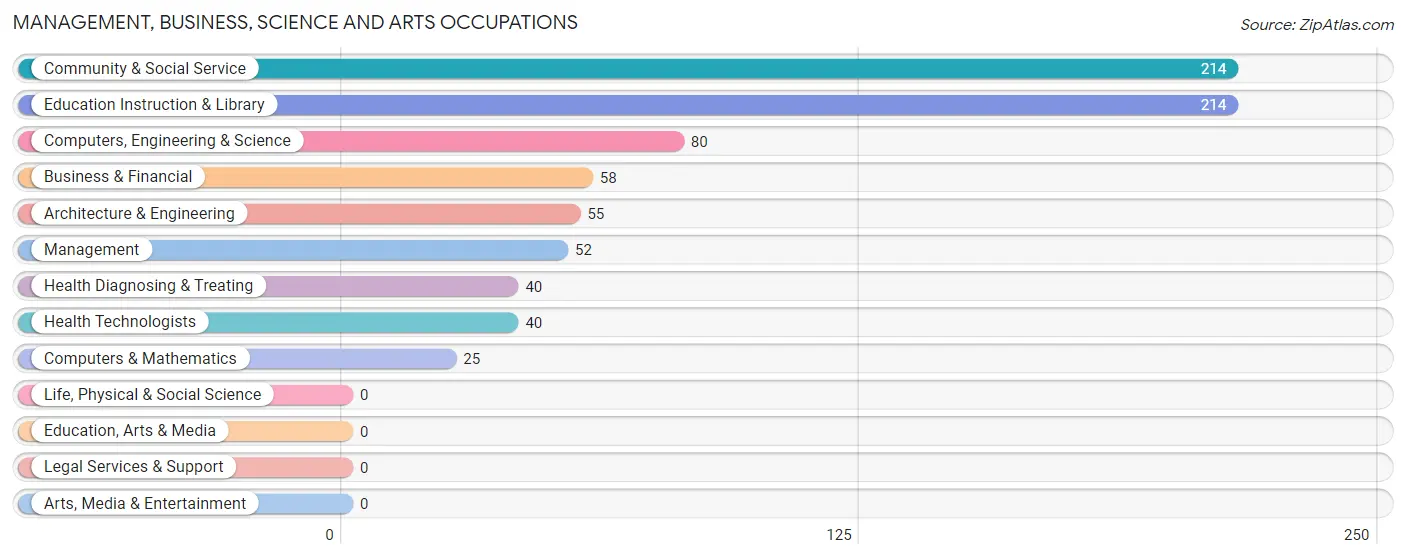
Management, Business, Science and Arts Occupations
The most common Management, Business, Science and Arts occupations in Naguabo are Community & Social Service (214 | 16.5%), Education Instruction & Library (214 | 16.5%), Computers, Engineering & Science (80 | 6.2%), Business & Financial (58 | 4.5%), and Architecture & Engineering (55 | 4.3%).
Management, Business, Science and Arts Occupations by Sex
Within the Management, Business, Science and Arts occupations in Naguabo, the most male-oriented occupations are Computers, Engineering & Science (100.0%), Computers & Mathematics (100.0%), and Architecture & Engineering (100.0%), while the most female-oriented occupations are Business & Financial (100.0%), Health Diagnosing & Treating (100.0%), and Health Technologists (100.0%).
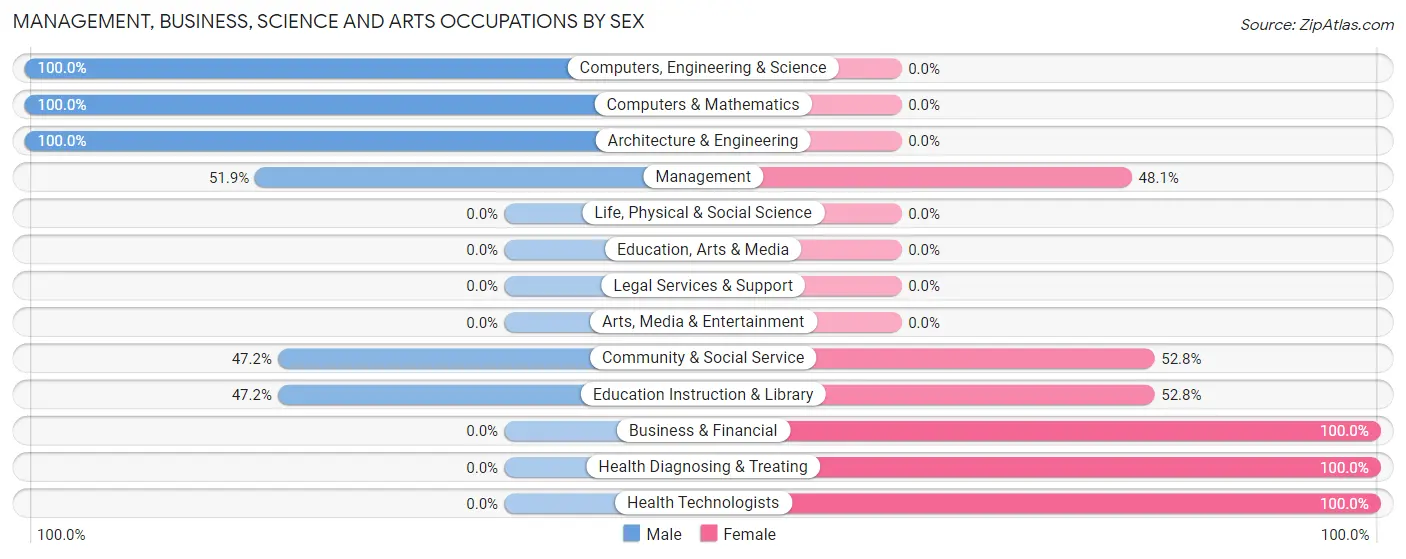
| Occupation | Male | Female |
| Management | 27 (51.9%) | 25 (48.1%) |
| Business & Financial | 0 (0.0%) | 58 (100.0%) |
| Computers, Engineering & Science | 80 (100.0%) | 0 (0.0%) |
| Computers & Mathematics | 25 (100.0%) | 0 (0.0%) |
| Architecture & Engineering | 55 (100.0%) | 0 (0.0%) |
| Life, Physical & Social Science | 0 (0.0%) | 0 (0.0%) |
| Community & Social Service | 101 (47.2%) | 113 (52.8%) |
| Education, Arts & Media | 0 (0.0%) | 0 (0.0%) |
| Legal Services & Support | 0 (0.0%) | 0 (0.0%) |
| Education Instruction & Library | 101 (47.2%) | 113 (52.8%) |
| Arts, Media & Entertainment | 0 (0.0%) | 0 (0.0%) |
| Health Diagnosing & Treating | 0 (0.0%) | 40 (100.0%) |
| Health Technologists | 0 (0.0%) | 40 (100.0%) |
| Total (Category) | 208 (46.9%) | 236 (53.1%) |
| Total (Overall) | 676 (52.2%) | 619 (47.8%) |
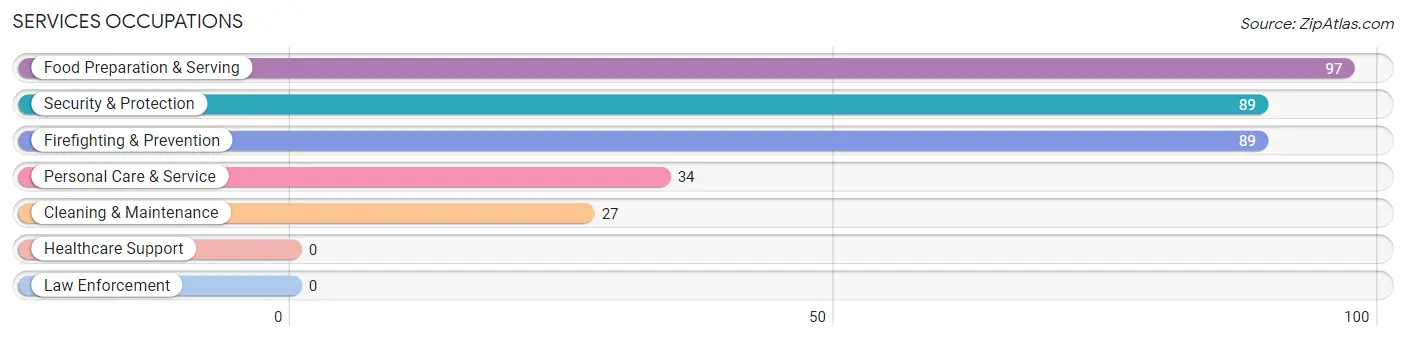
Services Occupations
The most common Services occupations in Naguabo are Food Preparation & Serving (97 | 7.5%), Security & Protection (89 | 6.9%), Firefighting & Prevention (89 | 6.9%), Personal Care & Service (34 | 2.6%), and Cleaning & Maintenance (27 | 2.1%).
Services Occupations by Sex
Within the Services occupations in Naguabo, the most male-oriented occupations are Cleaning & Maintenance (100.0%), Food Preparation & Serving (68.0%), and Security & Protection (55.1%), while the most female-oriented occupations are Personal Care & Service (100.0%), Security & Protection (44.9%), and Firefighting & Prevention (44.9%).
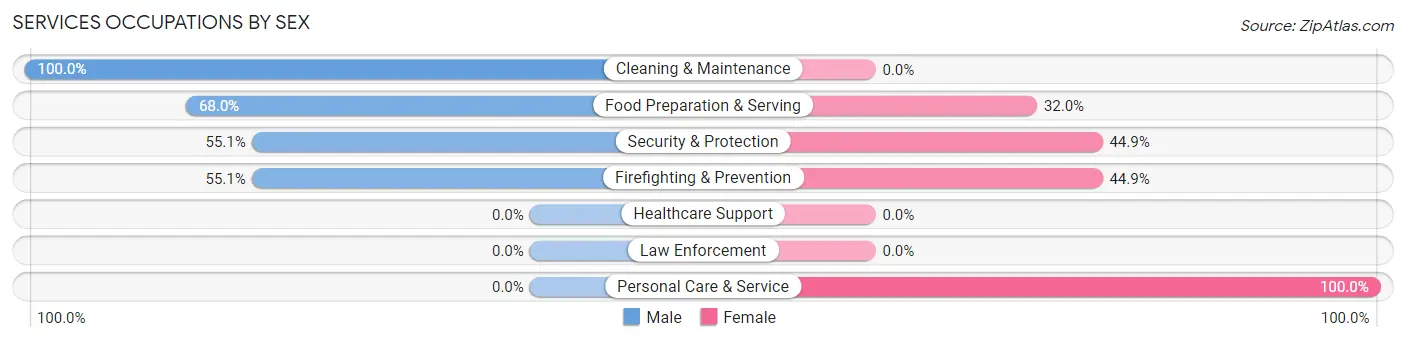
| Occupation | Male | Female |
| Healthcare Support | 0 (0.0%) | 0 (0.0%) |
| Security & Protection | 49 (55.1%) | 40 (44.9%) |
| Firefighting & Prevention | 49 (55.1%) | 40 (44.9%) |
| Law Enforcement | 0 (0.0%) | 0 (0.0%) |
| Food Preparation & Serving | 66 (68.0%) | 31 (32.0%) |
| Cleaning & Maintenance | 27 (100.0%) | 0 (0.0%) |
| Personal Care & Service | 0 (0.0%) | 34 (100.0%) |
| Total (Category) | 142 (57.5%) | 105 (42.5%) |
| Total (Overall) | 676 (52.2%) | 619 (47.8%) |
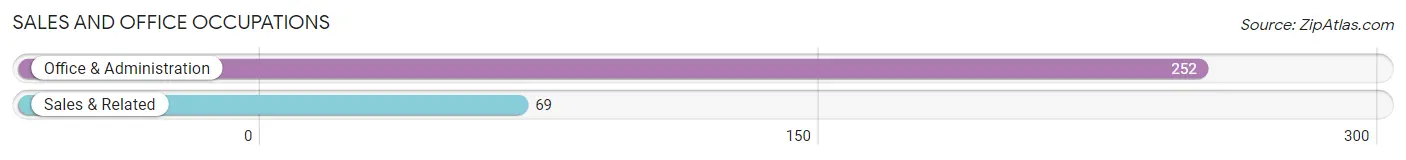
Sales and Office Occupations
The most common Sales and Office occupations in Naguabo are Office & Administration (252 | 19.5%), and Sales & Related (69 | 5.3%).
Sales and Office Occupations by Sex
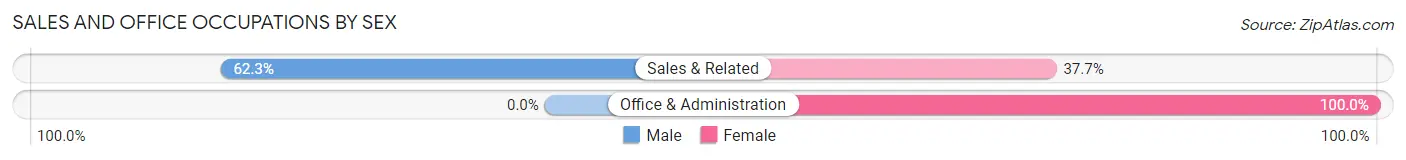
| Occupation | Male | Female |
| Sales & Related | 43 (62.3%) | 26 (37.7%) |
| Office & Administration | 0 (0.0%) | 252 (100.0%) |
| Total (Category) | 43 (13.4%) | 278 (86.6%) |
| Total (Overall) | 676 (52.2%) | 619 (47.8%) |
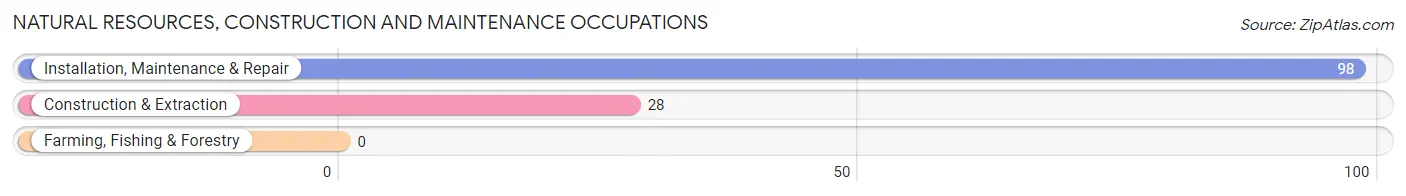
Natural Resources, Construction and Maintenance Occupations
The most common Natural Resources, Construction and Maintenance occupations in Naguabo are Installation, Maintenance & Repair (98 | 7.6%), and Construction & Extraction (28 | 2.2%).
Natural Resources, Construction and Maintenance Occupations by Sex
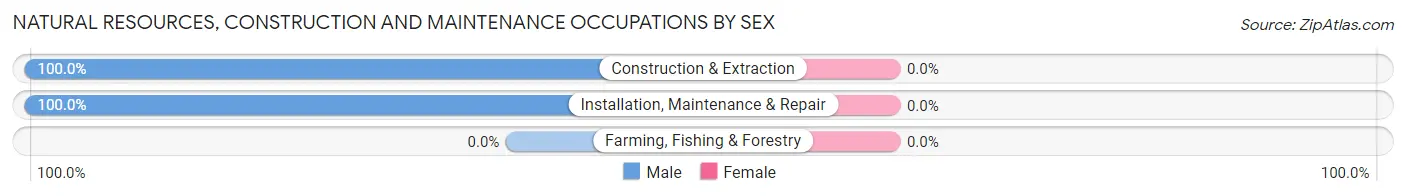
| Occupation | Male | Female |
| Farming, Fishing & Forestry | 0 (0.0%) | 0 (0.0%) |
| Construction & Extraction | 28 (100.0%) | 0 (0.0%) |
| Installation, Maintenance & Repair | 98 (100.0%) | 0 (0.0%) |
| Total (Category) | 126 (100.0%) | 0 (0.0%) |
| Total (Overall) | 676 (52.2%) | 619 (47.8%) |
Production, Transportation and Moving Occupations
The most common Production, Transportation and Moving occupations in Naguabo are Transportation (83 | 6.4%), and Production (74 | 5.7%).
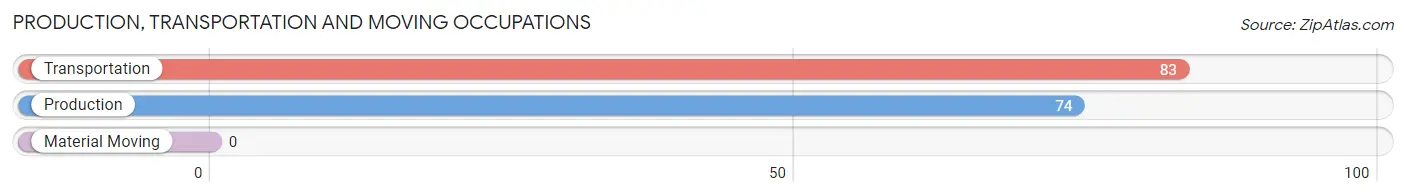
Production, Transportation and Moving Occupations by Sex
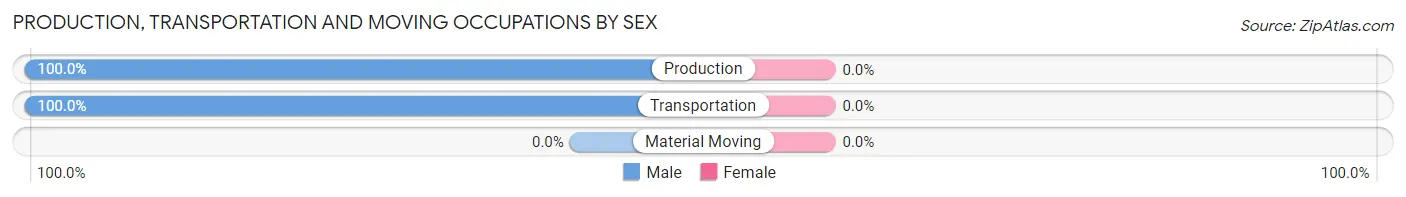
| Occupation | Male | Female |
| Production | 74 (100.0%) | 0 (0.0%) |
| Transportation | 83 (100.0%) | 0 (0.0%) |
| Material Moving | 0 (0.0%) | 0 (0.0%) |
| Total (Category) | 157 (100.0%) | 0 (0.0%) |
| Total (Overall) | 676 (52.2%) | 619 (47.8%) |
Employment Industries by Sex in Naguabo
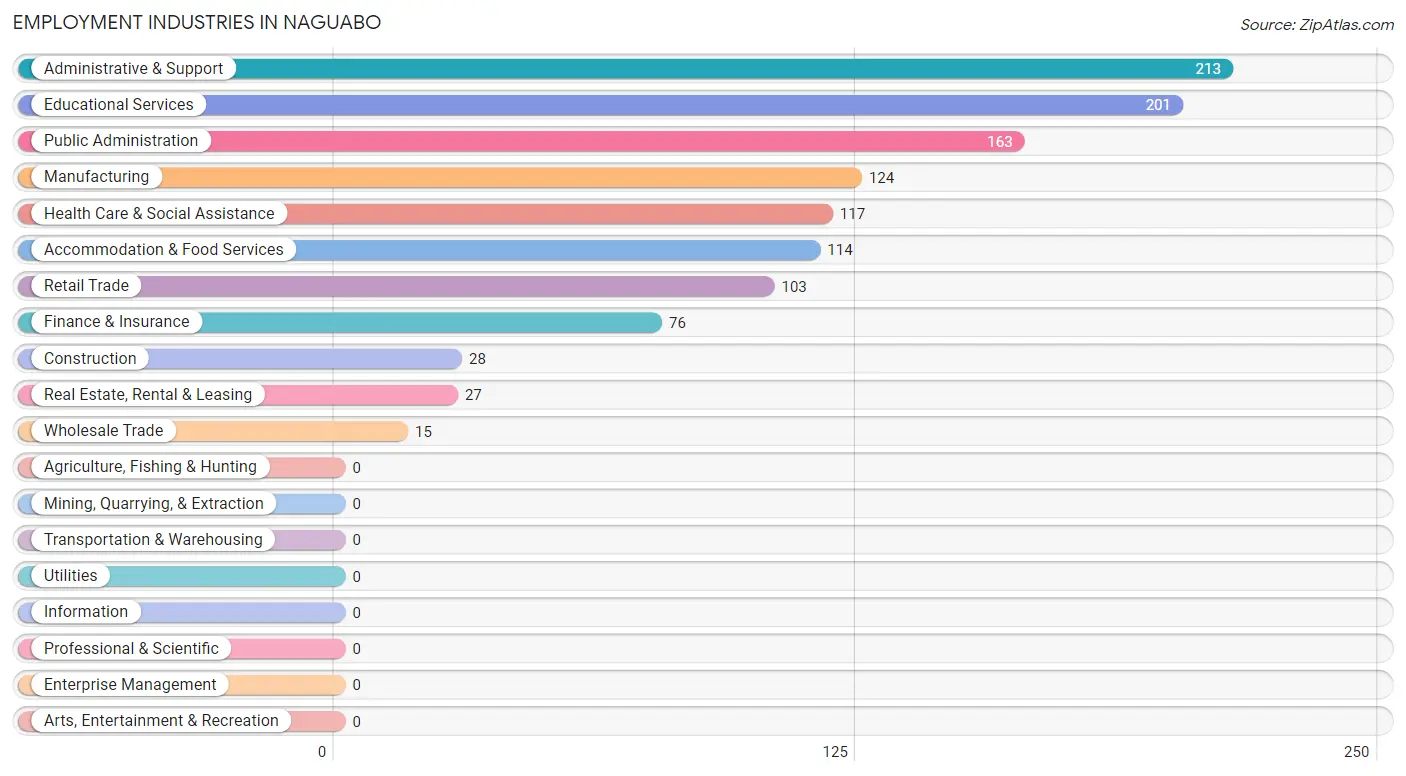
Employment Industries in Naguabo
The major employment industries in Naguabo include Administrative & Support (213 | 16.5%), Educational Services (201 | 15.5%), Public Administration (163 | 12.6%), Manufacturing (124 | 9.6%), and Health Care & Social Assistance (117 | 9.0%).
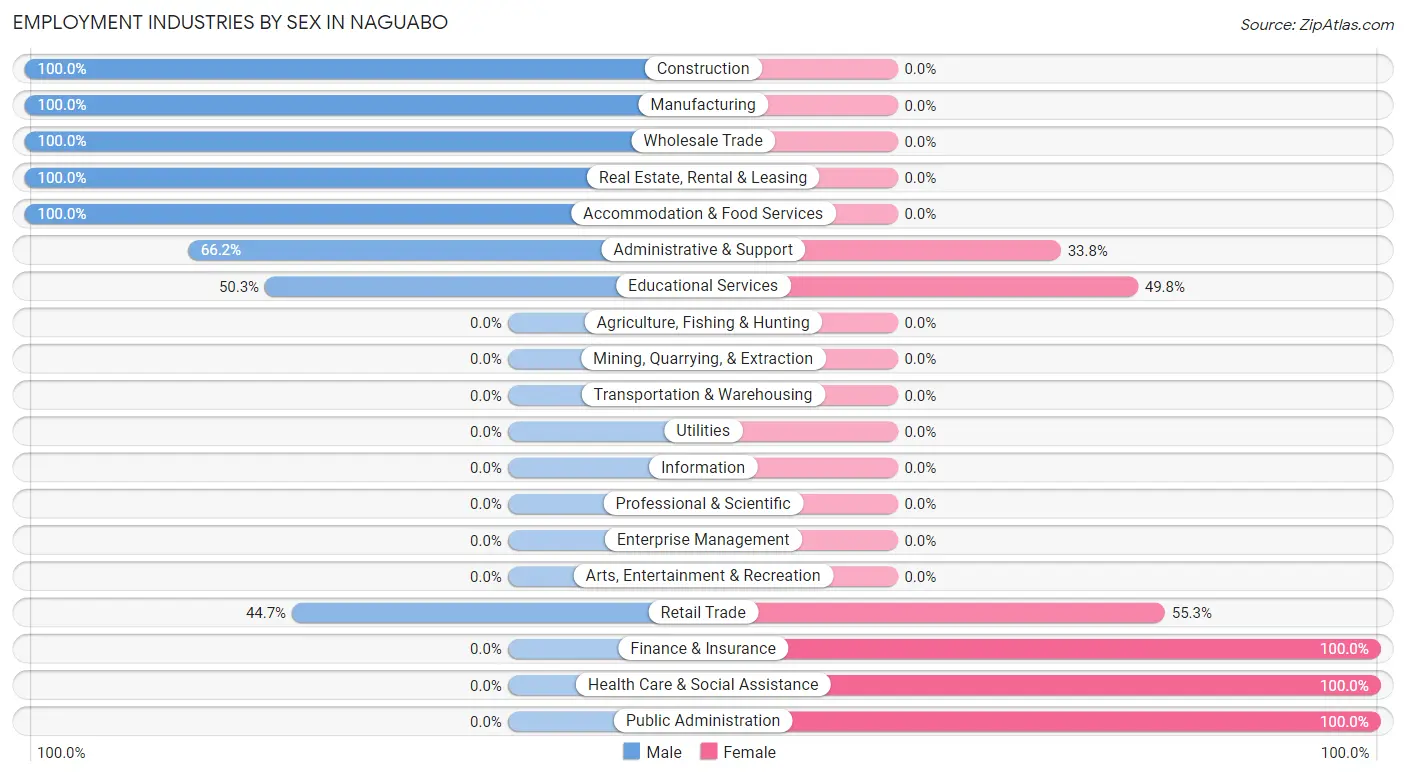
Employment Industries by Sex in Naguabo
The Naguabo industries that see more men than women are Construction (100.0%), Manufacturing (100.0%), and Wholesale Trade (100.0%), whereas the industries that tend to have a higher number of women are Finance & Insurance (100.0%), Health Care & Social Assistance (100.0%), and Public Administration (100.0%).
| Industry | Male | Female |
| Agriculture, Fishing & Hunting | 0 (0.0%) | 0 (0.0%) |
| Mining, Quarrying, & Extraction | 0 (0.0%) | 0 (0.0%) |
| Construction | 28 (100.0%) | 0 (0.0%) |
| Manufacturing | 124 (100.0%) | 0 (0.0%) |
| Wholesale Trade | 15 (100.0%) | 0 (0.0%) |
| Retail Trade | 46 (44.7%) | 57 (55.3%) |
| Transportation & Warehousing | 0 (0.0%) | 0 (0.0%) |
| Utilities | 0 (0.0%) | 0 (0.0%) |
| Information | 0 (0.0%) | 0 (0.0%) |
| Finance & Insurance | 0 (0.0%) | 76 (100.0%) |
| Real Estate, Rental & Leasing | 27 (100.0%) | 0 (0.0%) |
| Professional & Scientific | 0 (0.0%) | 0 (0.0%) |
| Enterprise Management | 0 (0.0%) | 0 (0.0%) |
| Administrative & Support | 141 (66.2%) | 72 (33.8%) |
| Educational Services | 101 (50.2%) | 100 (49.7%) |
| Health Care & Social Assistance | 0 (0.0%) | 117 (100.0%) |
| Arts, Entertainment & Recreation | 0 (0.0%) | 0 (0.0%) |
| Accommodation & Food Services | 114 (100.0%) | 0 (0.0%) |
| Public Administration | 0 (0.0%) | 163 (100.0%) |
| Total | 676 (52.2%) | 619 (47.8%) |
Education in Naguabo
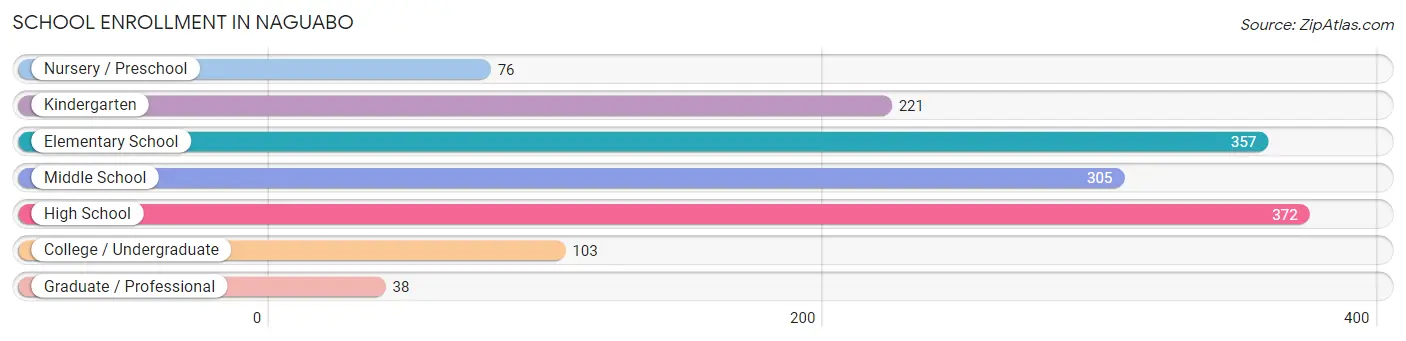
School Enrollment in Naguabo
The most common levels of schooling among the 1,472 students in Naguabo are high school (372 | 25.3%), elementary school (357 | 24.2%), and middle school (305 | 20.7%).
| School Level | # Students | % Students |
| Nursery / Preschool | 76 | 5.2% |
| Kindergarten | 221 | 15.0% |
| Elementary School | 357 | 24.2% |
| Middle School | 305 | 20.7% |
| High School | 372 | 25.3% |
| College / Undergraduate | 103 | 7.0% |
| Graduate / Professional | 38 | 2.6% |
| Total | 1,472 | 100.0% |
School Enrollment by Age by Funding Source in Naguabo
Out of a total of 1,472 students who are enrolled in schools in Naguabo, 241 (16.4%) attend a private institution, while the remaining 1,231 (83.6%) are enrolled in public schools. The age group of 5 to 9 year old has the highest likelihood of being enrolled in private schools, with 148 (25.6% in the age bracket) enrolled. Conversely, the age group of 3 to 4 year olds has the lowest likelihood of being enrolled in a private school, with 76 (100.0% in the age bracket) attending a public institution.
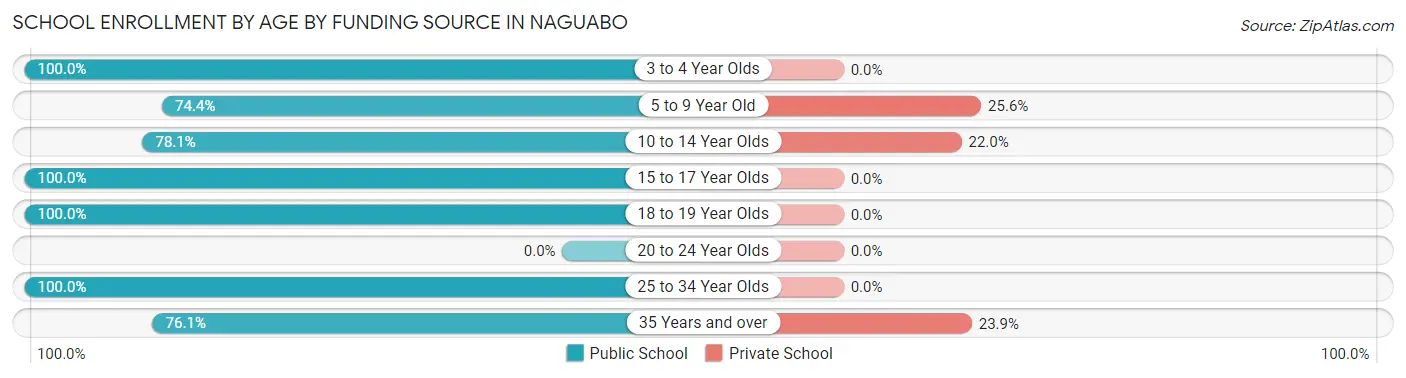
| Age Bracket | Public School | Private School |
| 3 to 4 Year Olds | 76 (100.0%) | 0 (0.0%) |
| 5 to 9 Year Old | 430 (74.4%) | 148 (25.6%) |
| 10 to 14 Year Olds | 256 (78.0%) | 72 (22.0%) |
| 15 to 17 Year Olds | 238 (100.0%) | 0 (0.0%) |
| 18 to 19 Year Olds | 111 (100.0%) | 0 (0.0%) |
| 20 to 24 Year Olds | 0 (0.0%) | 0 (0.0%) |
| 25 to 34 Year Olds | 53 (100.0%) | 0 (0.0%) |
| 35 Years and over | 67 (76.1%) | 21 (23.9%) |
| Total | 1,231 (83.6%) | 241 (16.4%) |
Educational Attainment by Field of Study in Naguabo
Education (342 | 31.9%), business (249 | 23.2%), social sciences (118 | 11.0%), visual & performing arts (92 | 8.6%), and science & technology (87 | 8.1%) are the most common fields of study among 1,072 individuals in Naguabo who have obtained a bachelor's degree or higher.
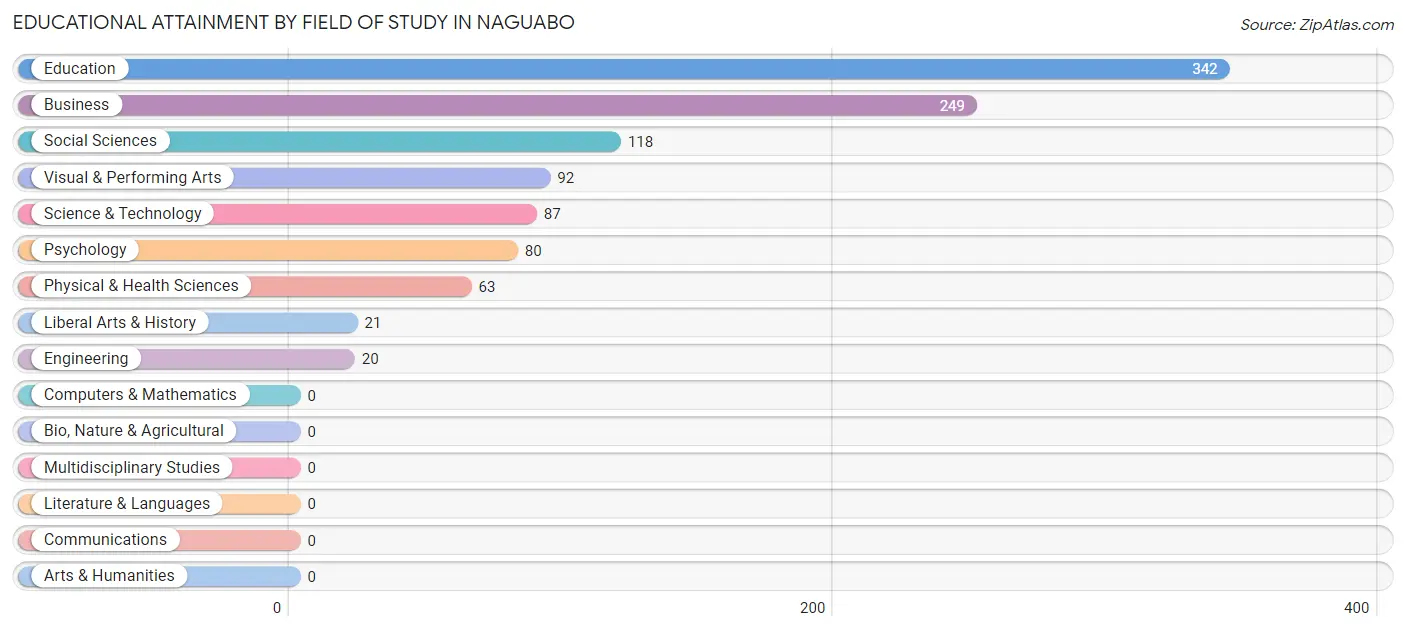
| Field of Study | # Graduates | % Graduates |
| Computers & Mathematics | 0 | 0.0% |
| Bio, Nature & Agricultural | 0 | 0.0% |
| Physical & Health Sciences | 63 | 5.9% |
| Psychology | 80 | 7.5% |
| Social Sciences | 118 | 11.0% |
| Engineering | 20 | 1.9% |
| Multidisciplinary Studies | 0 | 0.0% |
| Science & Technology | 87 | 8.1% |
| Business | 249 | 23.2% |
| Education | 342 | 31.9% |
| Literature & Languages | 0 | 0.0% |
| Liberal Arts & History | 21 | 2.0% |
| Visual & Performing Arts | 92 | 8.6% |
| Communications | 0 | 0.0% |
| Arts & Humanities | 0 | 0.0% |
| Total | 1,072 | 100.0% |
Transportation & Commute in Naguabo
Vehicle Availability by Sex in Naguabo
The most prevalent vehicle ownership categories in Naguabo are males with 1 vehicle (344, accounting for 50.9%) and females with 1 vehicle (226, making up 58.0%).
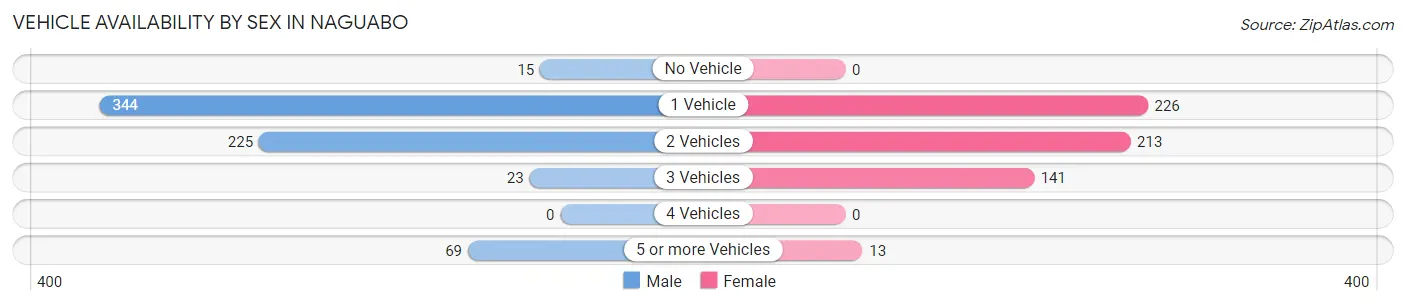
| Vehicles Available | Male | Female |
| No Vehicle | 15 (2.2%) | 0 (0.0%) |
| 1 Vehicle | 344 (50.9%) | 226 (38.1%) |
| 2 Vehicles | 225 (33.3%) | 213 (35.9%) |
| 3 Vehicles | 23 (3.4%) | 141 (23.8%) |
| 4 Vehicles | 0 (0.0%) | 0 (0.0%) |
| 5 or more Vehicles | 69 (10.2%) | 13 (2.2%) |
| Total | 676 (100.0%) | 593 (100.0%) |
Commute Time in Naguabo
The most frequently occuring commute durations in Naguabo are 30 to 34 minutes (241 commuters, 20.5%), 15 to 19 minutes (175 commuters, 14.9%), and 60 to 89 minutes (149 commuters, 12.7%).
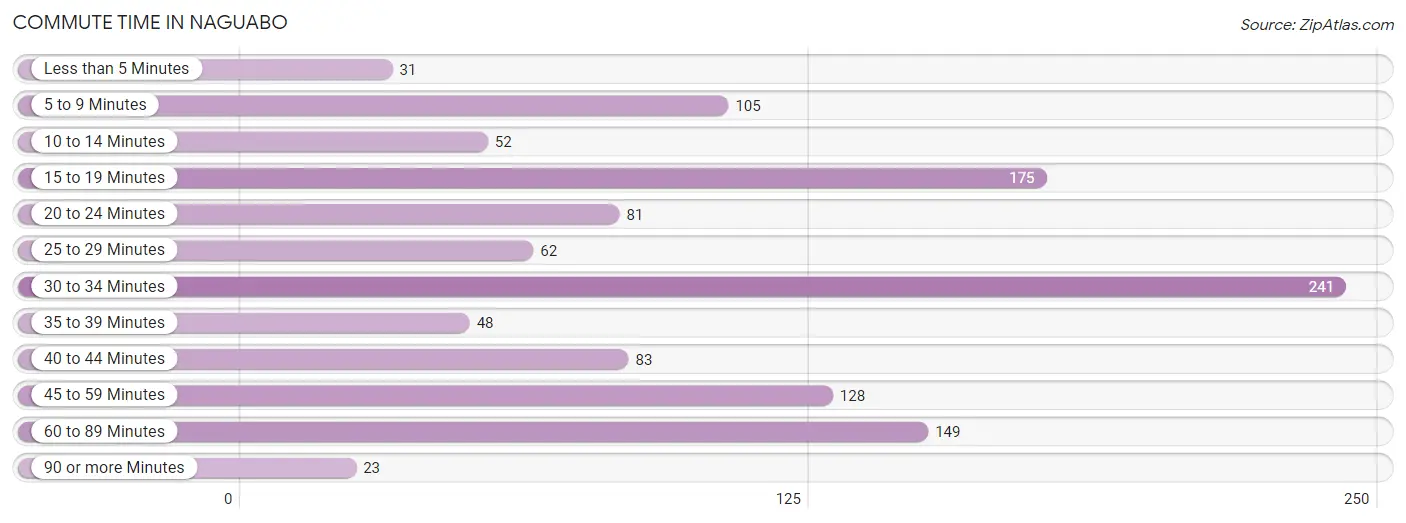
| Commute Time | # Commuters | % Commuters |
| Less than 5 Minutes | 31 | 2.6% |
| 5 to 9 Minutes | 105 | 8.9% |
| 10 to 14 Minutes | 52 | 4.4% |
| 15 to 19 Minutes | 175 | 14.9% |
| 20 to 24 Minutes | 81 | 6.9% |
| 25 to 29 Minutes | 62 | 5.3% |
| 30 to 34 Minutes | 241 | 20.5% |
| 35 to 39 Minutes | 48 | 4.1% |
| 40 to 44 Minutes | 83 | 7.0% |
| 45 to 59 Minutes | 128 | 10.9% |
| 60 to 89 Minutes | 149 | 12.7% |
| 90 or more Minutes | 23 | 1.9% |
Commute Time by Sex in Naguabo
The most common commute times in Naguabo are 15 to 19 minutes (95 commuters, 15.3%) for males and 30 to 34 minutes (196 commuters, 35.1%) for females.
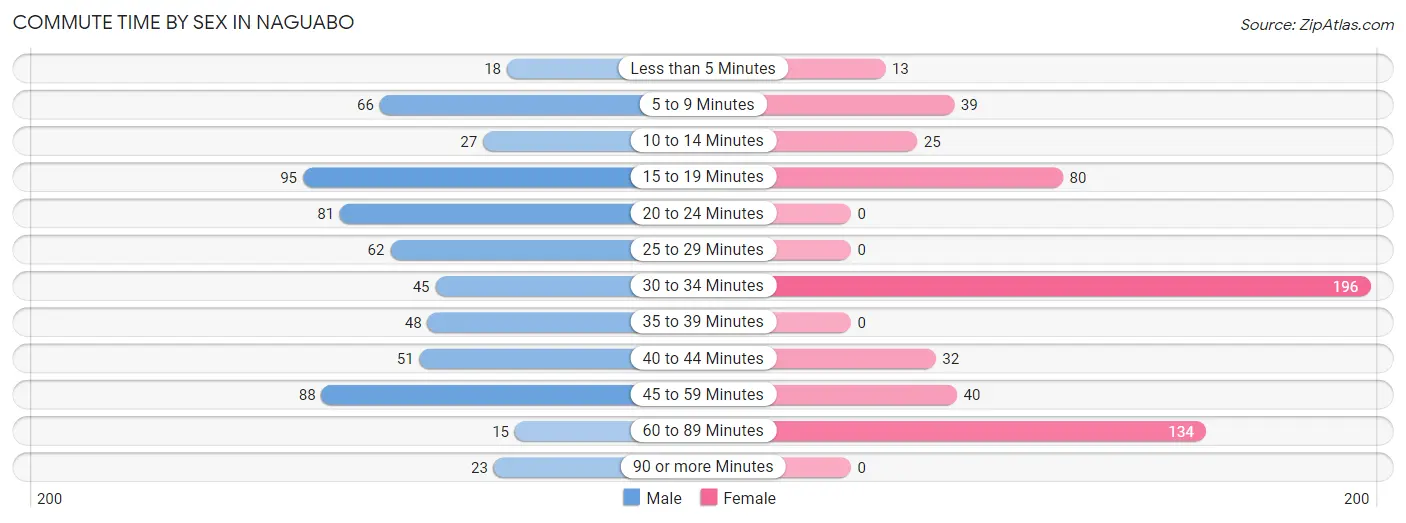
| Commute Time | Male | Female |
| Less than 5 Minutes | 18 (2.9%) | 13 (2.3%) |
| 5 to 9 Minutes | 66 (10.7%) | 39 (7.0%) |
| 10 to 14 Minutes | 27 (4.4%) | 25 (4.5%) |
| 15 to 19 Minutes | 95 (15.3%) | 80 (14.3%) |
| 20 to 24 Minutes | 81 (13.1%) | 0 (0.0%) |
| 25 to 29 Minutes | 62 (10.0%) | 0 (0.0%) |
| 30 to 34 Minutes | 45 (7.3%) | 196 (35.1%) |
| 35 to 39 Minutes | 48 (7.7%) | 0 (0.0%) |
| 40 to 44 Minutes | 51 (8.2%) | 32 (5.7%) |
| 45 to 59 Minutes | 88 (14.2%) | 40 (7.2%) |
| 60 to 89 Minutes | 15 (2.4%) | 134 (24.0%) |
| 90 or more Minutes | 23 (3.7%) | 0 (0.0%) |
Time of Departure to Work by Sex in Naguabo
The most frequent times of departure to work in Naguabo are 6:30 AM to 6:59 AM (148, 23.9%) for males and 6:00 AM to 6:29 AM (195, 34.9%) for females.
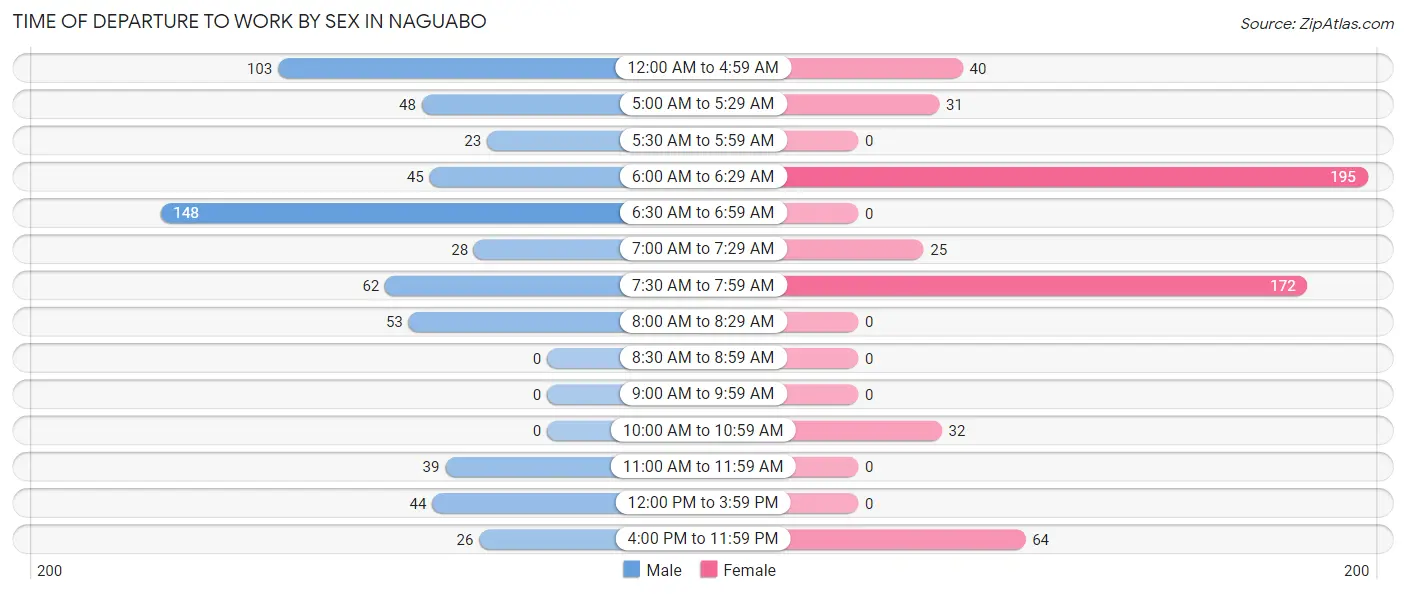
| Time of Departure | Male | Female |
| 12:00 AM to 4:59 AM | 103 (16.6%) | 40 (7.2%) |
| 5:00 AM to 5:29 AM | 48 (7.7%) | 31 (5.6%) |
| 5:30 AM to 5:59 AM | 23 (3.7%) | 0 (0.0%) |
| 6:00 AM to 6:29 AM | 45 (7.3%) | 195 (34.9%) |
| 6:30 AM to 6:59 AM | 148 (23.9%) | 0 (0.0%) |
| 7:00 AM to 7:29 AM | 28 (4.5%) | 25 (4.5%) |
| 7:30 AM to 7:59 AM | 62 (10.0%) | 172 (30.8%) |
| 8:00 AM to 8:29 AM | 53 (8.6%) | 0 (0.0%) |
| 8:30 AM to 8:59 AM | 0 (0.0%) | 0 (0.0%) |
| 9:00 AM to 9:59 AM | 0 (0.0%) | 0 (0.0%) |
| 10:00 AM to 10:59 AM | 0 (0.0%) | 32 (5.7%) |
| 11:00 AM to 11:59 AM | 39 (6.3%) | 0 (0.0%) |
| 12:00 PM to 3:59 PM | 44 (7.1%) | 0 (0.0%) |
| 4:00 PM to 11:59 PM | 26 (4.2%) | 64 (11.5%) |
| Total | 619 (100.0%) | 559 (100.0%) |
Housing Occupancy in Naguabo
Occupancy by Ownership in Naguabo
Of the total 1,765 dwellings in Naguabo, owner-occupied units account for 1,286 (72.9%), while renter-occupied units make up 479 (27.1%).
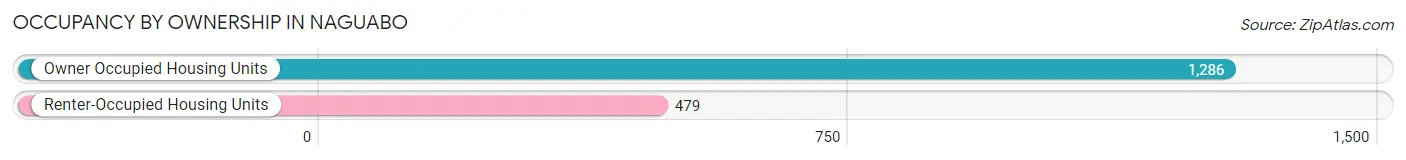
| Occupancy | # Housing Units | % Housing Units |
| Owner Occupied Housing Units | 1,286 | 72.9% |
| Renter-Occupied Housing Units | 479 | 27.1% |
| Total Occupied Housing Units | 1,765 | 100.0% |
Occupancy by Household Size in Naguabo
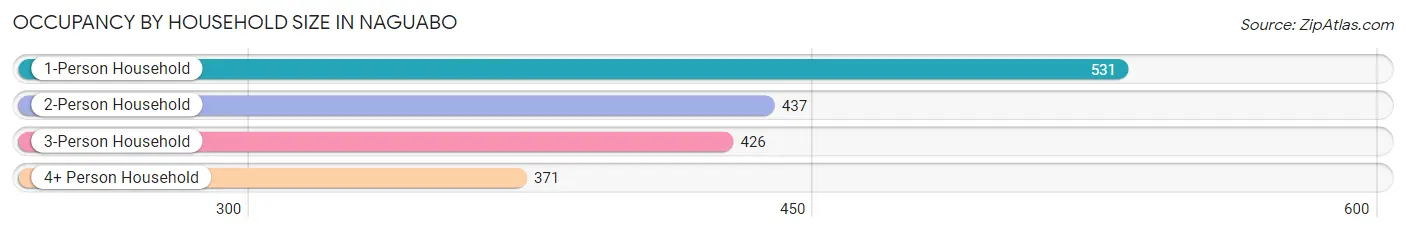
| Household Size | # Housing Units | % Housing Units |
| 1-Person Household | 531 | 30.1% |
| 2-Person Household | 437 | 24.8% |
| 3-Person Household | 426 | 24.1% |
| 4+ Person Household | 371 | 21.0% |
| Total Housing Units | 1,765 | 100.0% |
Occupancy by Ownership by Household Size in Naguabo
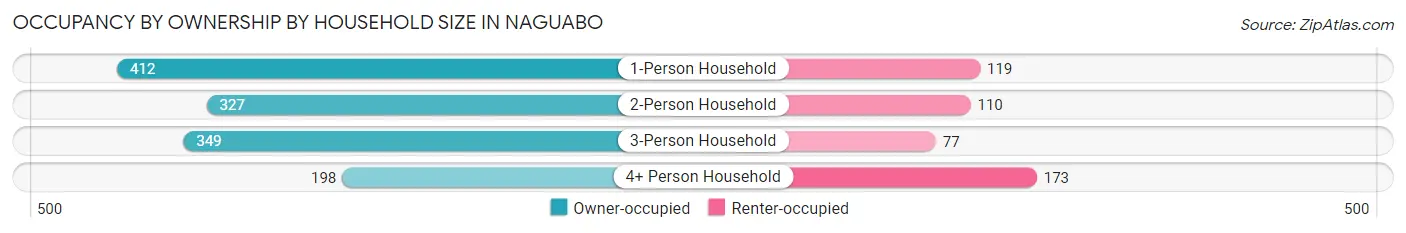
| Household Size | Owner-occupied | Renter-occupied |
| 1-Person Household | 412 (77.6%) | 119 (22.4%) |
| 2-Person Household | 327 (74.8%) | 110 (25.2%) |
| 3-Person Household | 349 (81.9%) | 77 (18.1%) |
| 4+ Person Household | 198 (53.4%) | 173 (46.6%) |
| Total Housing Units | 1,286 (72.9%) | 479 (27.1%) |
Occupancy by Educational Attainment in Naguabo
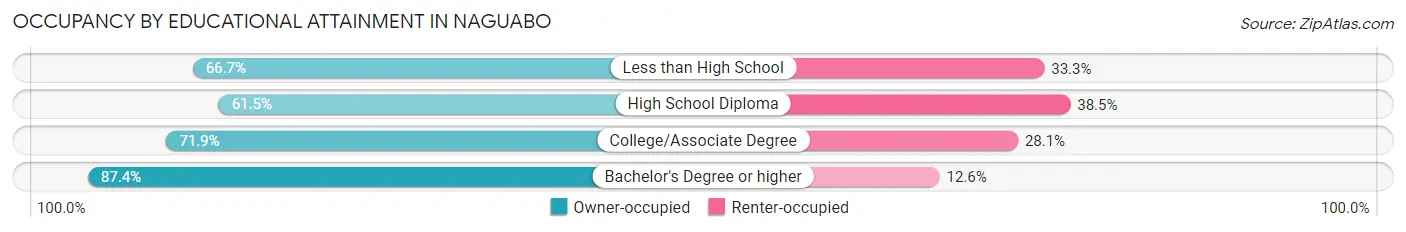
| Household Size | Owner-occupied | Renter-occupied |
| Less than High School | 228 (66.7%) | 114 (33.3%) |
| High School Diploma | 350 (61.5%) | 219 (38.5%) |
| College/Associate Degree | 179 (71.9%) | 70 (28.1%) |
| Bachelor's Degree or higher | 529 (87.4%) | 76 (12.6%) |
Occupancy by Age of Householder in Naguabo
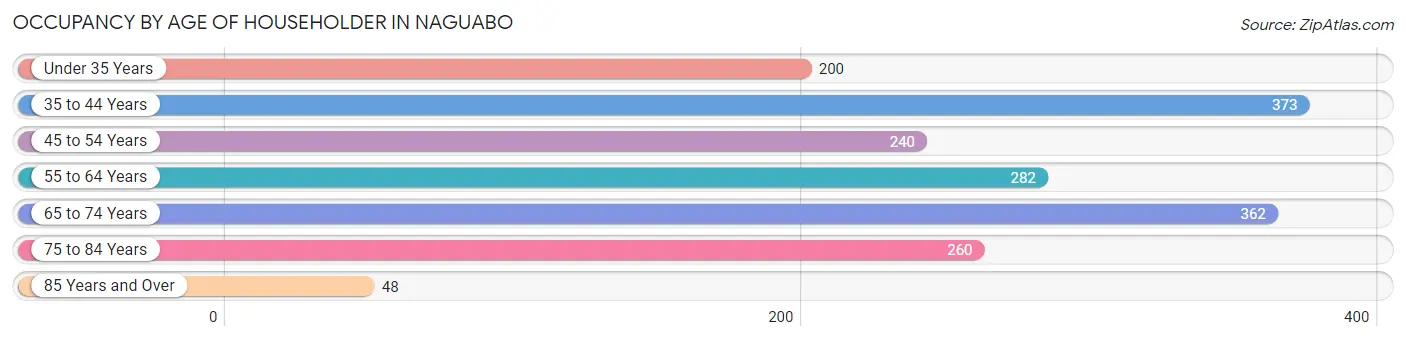
| Age Bracket | # Households | % Households |
| Under 35 Years | 200 | 11.3% |
| 35 to 44 Years | 373 | 21.1% |
| 45 to 54 Years | 240 | 13.6% |
| 55 to 64 Years | 282 | 16.0% |
| 65 to 74 Years | 362 | 20.5% |
| 75 to 84 Years | 260 | 14.7% |
| 85 Years and Over | 48 | 2.7% |
| Total | 1,765 | 100.0% |
Housing Finances in Naguabo
Median Income by Occupancy in Naguabo
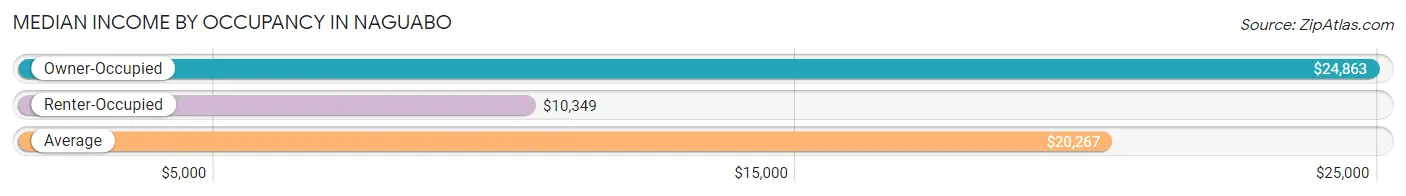
| Occupancy Type | # Households | Median Income |
| Owner-Occupied | 1,286 (72.9%) | $24,863 |
| Renter-Occupied | 479 (27.1%) | $10,349 |
| Average | 1,765 (100.0%) | $20,267 |
Occupancy by Householder Income Bracket in Naguabo
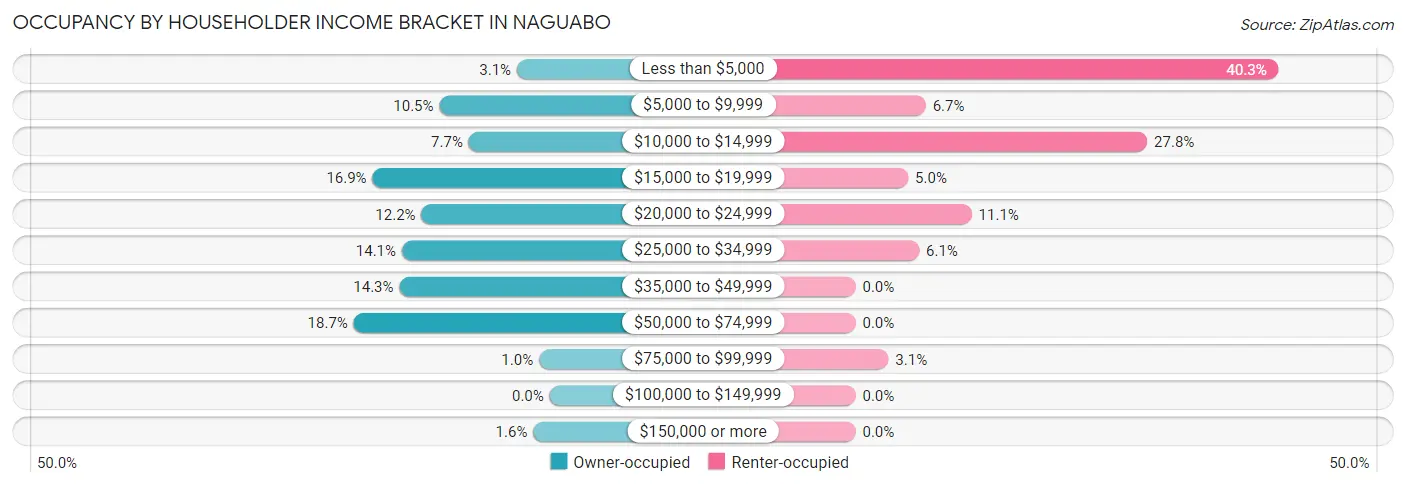
| Income Bracket | Owner-occupied | Renter-occupied |
| Less than $5,000 | 40 (3.1%) | 193 (40.3%) |
| $5,000 to $9,999 | 135 (10.5%) | 32 (6.7%) |
| $10,000 to $14,999 | 99 (7.7%) | 133 (27.8%) |
| $15,000 to $19,999 | 217 (16.9%) | 24 (5.0%) |
| $20,000 to $24,999 | 157 (12.2%) | 53 (11.1%) |
| $25,000 to $34,999 | 181 (14.1%) | 29 (6.0%) |
| $35,000 to $49,999 | 184 (14.3%) | 0 (0.0%) |
| $50,000 to $74,999 | 240 (18.7%) | 0 (0.0%) |
| $75,000 to $99,999 | 13 (1.0%) | 15 (3.1%) |
| $100,000 to $149,999 | 0 (0.0%) | 0 (0.0%) |
| $150,000 or more | 20 (1.6%) | 0 (0.0%) |
| Total | 1,286 (100.0%) | 479 (100.0%) |
Monthly Housing Cost Tiers in Naguabo
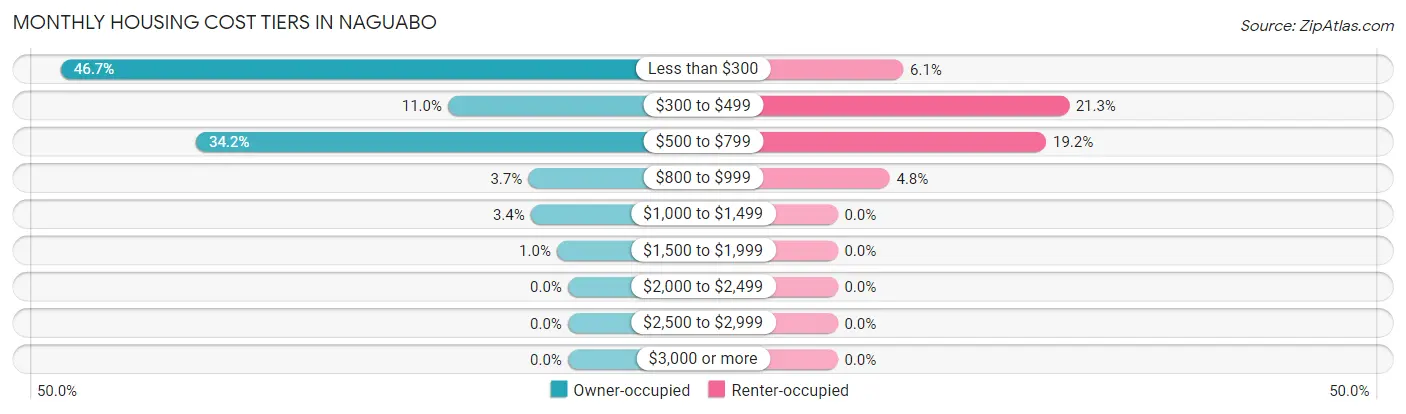
| Monthly Cost | Owner-occupied | Renter-occupied |
| Less than $300 | 600 (46.7%) | 29 (6.0%) |
| $300 to $499 | 142 (11.0%) | 102 (21.3%) |
| $500 to $799 | 440 (34.2%) | 92 (19.2%) |
| $800 to $999 | 47 (3.6%) | 23 (4.8%) |
| $1,000 to $1,499 | 44 (3.4%) | 0 (0.0%) |
| $1,500 to $1,999 | 13 (1.0%) | 0 (0.0%) |
| $2,000 to $2,499 | 0 (0.0%) | 0 (0.0%) |
| $2,500 to $2,999 | 0 (0.0%) | 0 (0.0%) |
| $3,000 or more | 0 (0.0%) | 0 (0.0%) |
| Total | 1,286 (100.0%) | 479 (100.0%) |
Physical Housing Characteristics in Naguabo
Housing Structures in Naguabo
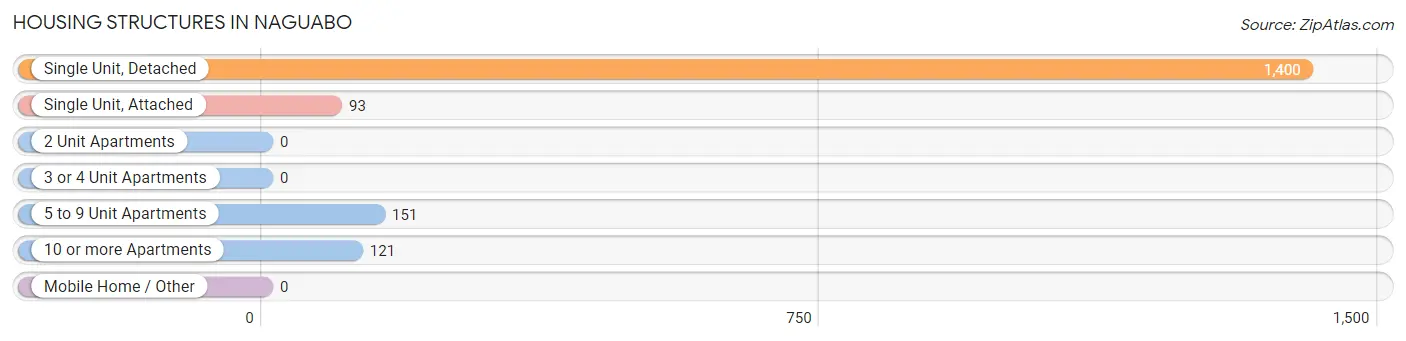
| Structure Type | # Housing Units | % Housing Units |
| Single Unit, Detached | 1,400 | 79.3% |
| Single Unit, Attached | 93 | 5.3% |
| 2 Unit Apartments | 0 | 0.0% |
| 3 or 4 Unit Apartments | 0 | 0.0% |
| 5 to 9 Unit Apartments | 151 | 8.6% |
| 10 or more Apartments | 121 | 6.9% |
| Mobile Home / Other | 0 | 0.0% |
| Total | 1,765 | 100.0% |
Housing Structures by Occupancy in Naguabo
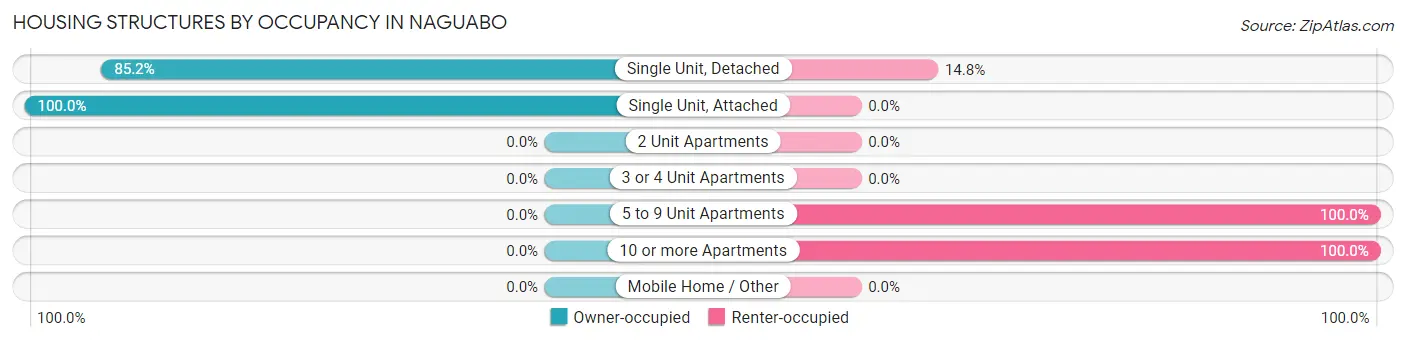
| Structure Type | Owner-occupied | Renter-occupied |
| Single Unit, Detached | 1,193 (85.2%) | 207 (14.8%) |
| Single Unit, Attached | 93 (100.0%) | 0 (0.0%) |
| 2 Unit Apartments | 0 (0.0%) | 0 (0.0%) |
| 3 or 4 Unit Apartments | 0 (0.0%) | 0 (0.0%) |
| 5 to 9 Unit Apartments | 0 (0.0%) | 151 (100.0%) |
| 10 or more Apartments | 0 (0.0%) | 121 (100.0%) |
| Mobile Home / Other | 0 (0.0%) | 0 (0.0%) |
| Total | 1,286 (72.9%) | 479 (27.1%) |
Housing Structures by Number of Rooms in Naguabo
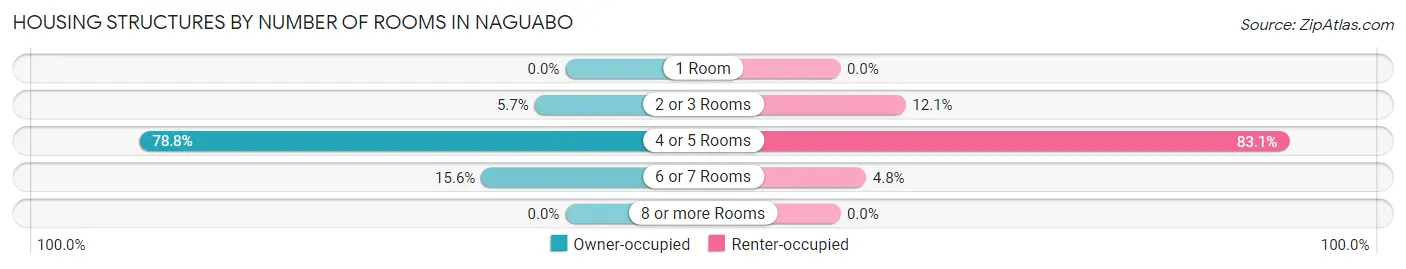
| Number of Rooms | Owner-occupied | Renter-occupied |
| 1 Room | 0 (0.0%) | 0 (0.0%) |
| 2 or 3 Rooms | 73 (5.7%) | 58 (12.1%) |
| 4 or 5 Rooms | 1,013 (78.8%) | 398 (83.1%) |
| 6 or 7 Rooms | 200 (15.5%) | 23 (4.8%) |
| 8 or more Rooms | 0 (0.0%) | 0 (0.0%) |
| Total | 1,286 (100.0%) | 479 (100.0%) |
Housing Structure by Heating Type in Naguabo
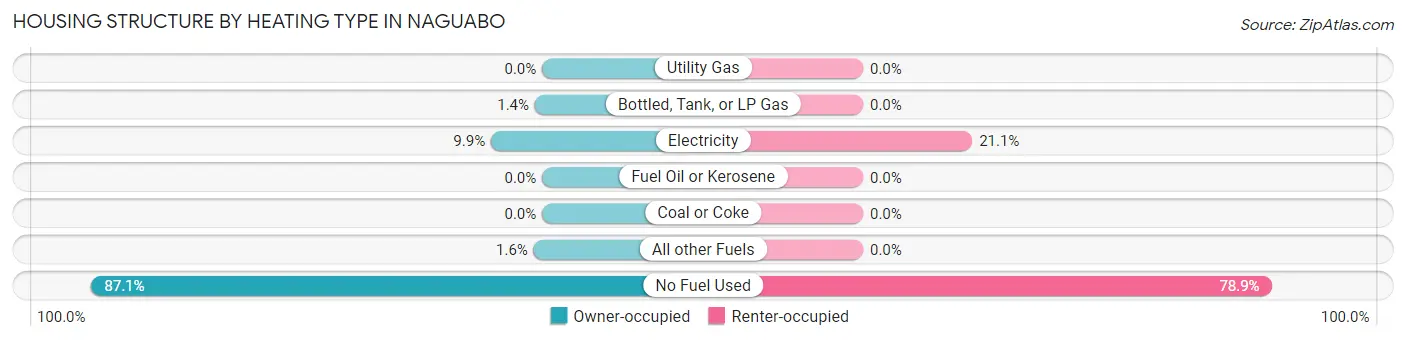
| Heating Type | Owner-occupied | Renter-occupied |
| Utility Gas | 0 (0.0%) | 0 (0.0%) |
| Bottled, Tank, or LP Gas | 18 (1.4%) | 0 (0.0%) |
| Electricity | 127 (9.9%) | 101 (21.1%) |
| Fuel Oil or Kerosene | 0 (0.0%) | 0 (0.0%) |
| Coal or Coke | 0 (0.0%) | 0 (0.0%) |
| All other Fuels | 21 (1.6%) | 0 (0.0%) |
| No Fuel Used | 1,120 (87.1%) | 378 (78.9%) |
| Total | 1,286 (100.0%) | 479 (100.0%) |
Household Vehicle Usage in Naguabo
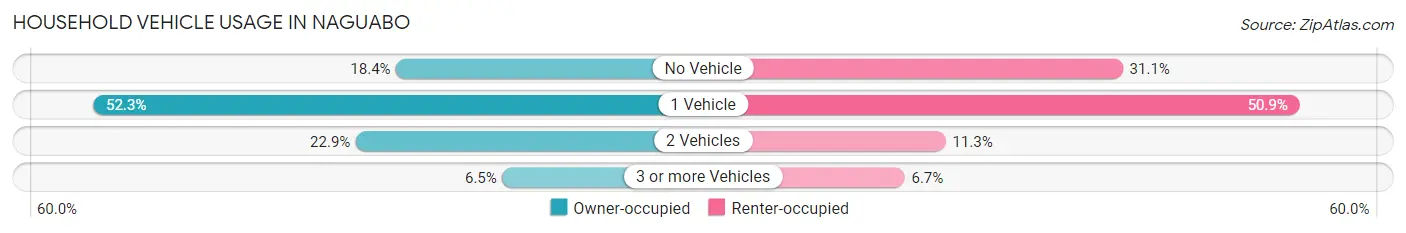
| Vehicles per Household | Owner-occupied | Renter-occupied |
| No Vehicle | 236 (18.3%) | 149 (31.1%) |
| 1 Vehicle | 673 (52.3%) | 244 (50.9%) |
| 2 Vehicles | 294 (22.9%) | 54 (11.3%) |
| 3 or more Vehicles | 83 (6.5%) | 32 (6.7%) |
| Total | 1,286 (100.0%) | 479 (100.0%) |
Real Estate & Mortgages in Naguabo
Real Estate and Mortgage Overview in Naguabo
| Characteristic | Without Mortgage | With Mortgage |
| Housing Units | 739 | 547 |
| Median Property Value | $105,900 | $89,100 |
| Median Household Income | $20,549 | $0 |
| Monthly Housing Costs | $174 | $0 |
| Real Estate Taxes | - | - |
Property Value by Mortgage Status in Naguabo
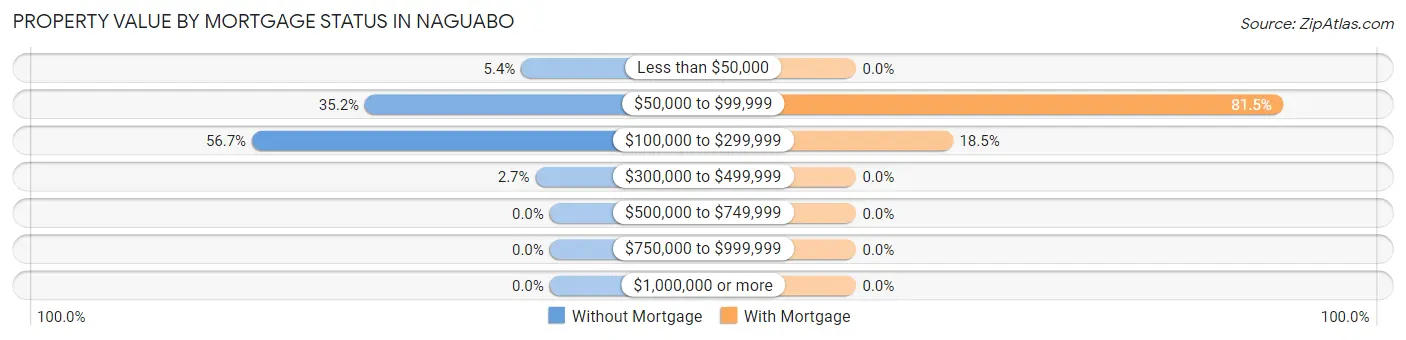
| Property Value | Without Mortgage | With Mortgage |
| Less than $50,000 | 40 (5.4%) | 0 (0.0%) |
| $50,000 to $99,999 | 260 (35.2%) | 446 (81.5%) |
| $100,000 to $299,999 | 419 (56.7%) | 101 (18.5%) |
| $300,000 to $499,999 | 20 (2.7%) | 0 (0.0%) |
| $500,000 to $749,999 | 0 (0.0%) | 0 (0.0%) |
| $750,000 to $999,999 | 0 (0.0%) | 0 (0.0%) |
| $1,000,000 or more | 0 (0.0%) | 0 (0.0%) |
| Total | 739 (100.0%) | 547 (100.0%) |
Household Income by Mortgage Status in Naguabo
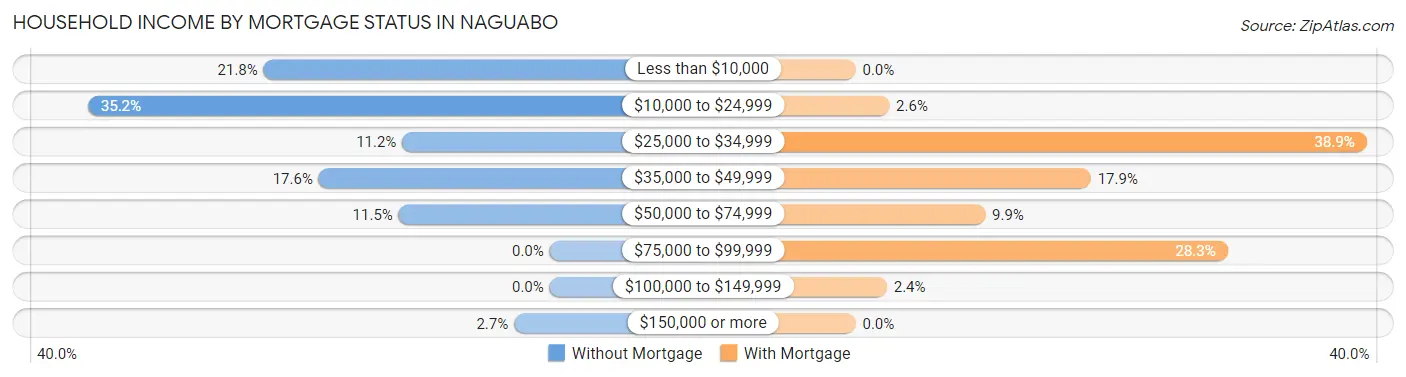
| Household Income | Without Mortgage | With Mortgage |
| Less than $10,000 | 161 (21.8%) | 0 (0.0%) |
| $10,000 to $24,999 | 260 (35.2%) | 14 (2.6%) |
| $25,000 to $34,999 | 83 (11.2%) | 213 (38.9%) |
| $35,000 to $49,999 | 130 (17.6%) | 98 (17.9%) |
| $50,000 to $74,999 | 85 (11.5%) | 54 (9.9%) |
| $75,000 to $99,999 | 0 (0.0%) | 155 (28.3%) |
| $100,000 to $149,999 | 0 (0.0%) | 13 (2.4%) |
| $150,000 or more | 20 (2.7%) | 0 (0.0%) |
| Total | 739 (100.0%) | 547 (100.0%) |
Property Value to Household Income Ratio in Naguabo
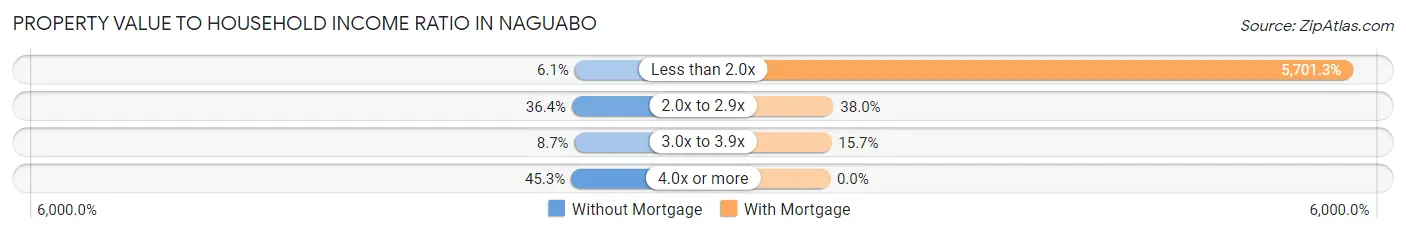
| Value-to-Income Ratio | Without Mortgage | With Mortgage |
| Less than 2.0x | 45 (6.1%) | 31,186 (5,701.3%) |
| 2.0x to 2.9x | 269 (36.4%) | 208 (38.0%) |
| 3.0x to 3.9x | 64 (8.7%) | 86 (15.7%) |
| 4.0x or more | 335 (45.3%) | 0 (0.0%) |
| Total | 739 (100.0%) | 547 (100.0%) |
Real Estate Taxes by Mortgage Status in Naguabo
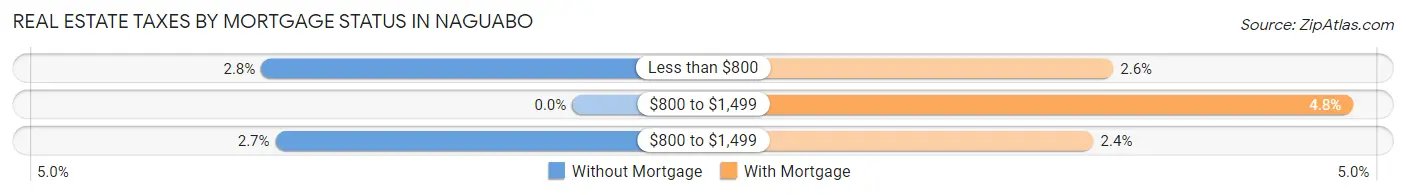
| Property Taxes | Without Mortgage | With Mortgage |
| Less than $800 | 21 (2.8%) | 14 (2.6%) |
| $800 to $1,499 | 0 (0.0%) | 26 (4.8%) |
| $800 to $1,499 | 20 (2.7%) | 13 (2.4%) |
| Total | 739 (100.0%) | 547 (100.0%) |
Health & Disability in Naguabo
Health Insurance Coverage by Age in Naguabo
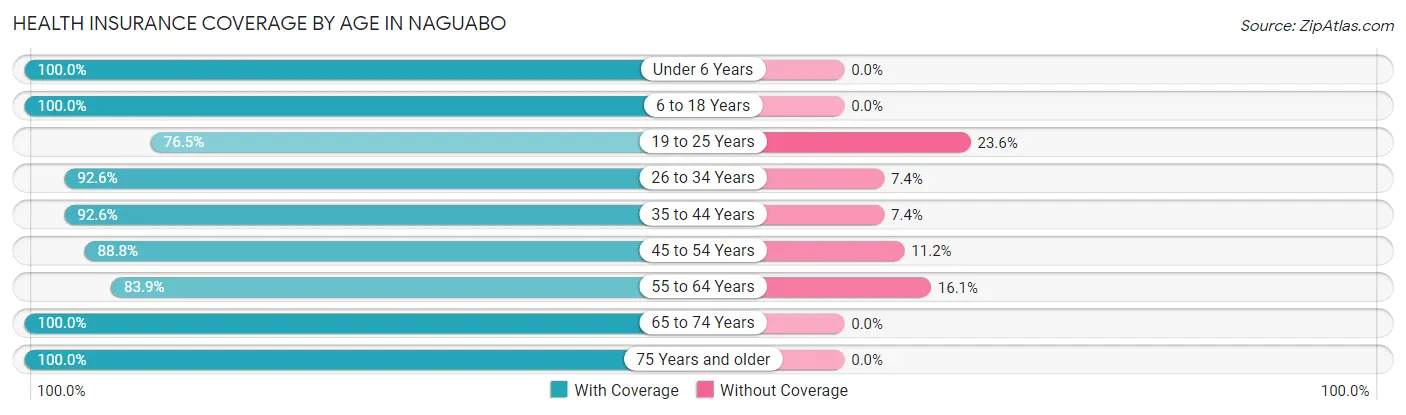
| Age Bracket | With Coverage | Without Coverage |
| Under 6 Years | 401 (100.0%) | 0 (0.0%) |
| 6 to 18 Years | 1,118 (100.0%) | 0 (0.0%) |
| 19 to 25 Years | 370 (76.4%) | 114 (23.5%) |
| 26 to 34 Years | 425 (92.6%) | 34 (7.4%) |
| 35 to 44 Years | 710 (92.6%) | 57 (7.4%) |
| 45 to 54 Years | 388 (88.8%) | 49 (11.2%) |
| 55 to 64 Years | 291 (83.9%) | 56 (16.1%) |
| 65 to 74 Years | 611 (100.0%) | 0 (0.0%) |
| 75 Years and older | 472 (100.0%) | 0 (0.0%) |
| Total | 4,786 (93.9%) | 310 (6.1%) |
Health Insurance Coverage by Citizenship Status in Naguabo
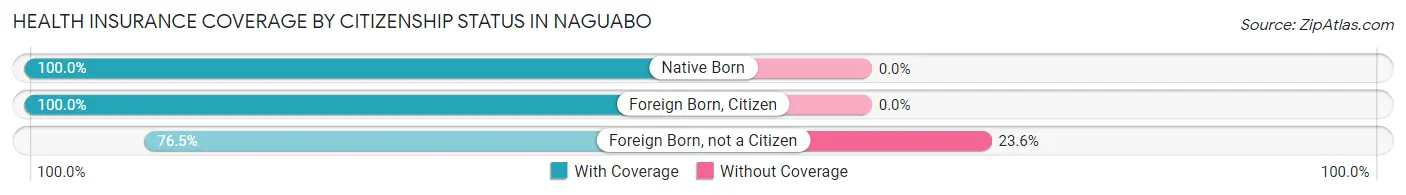
| Citizenship Status | With Coverage | Without Coverage |
| Native Born | 401 (100.0%) | 0 (0.0%) |
| Foreign Born, Citizen | 1,118 (100.0%) | 0 (0.0%) |
| Foreign Born, not a Citizen | 370 (76.4%) | 114 (23.5%) |
Health Insurance Coverage by Household Income in Naguabo
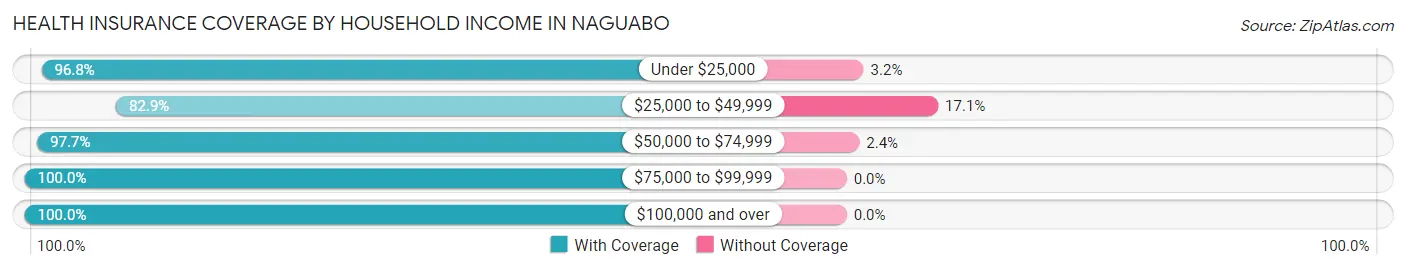
| Household Income | With Coverage | Without Coverage |
| Under $25,000 | 2,914 (96.8%) | 95 (3.2%) |
| $25,000 to $49,999 | 954 (82.9%) | 197 (17.1%) |
| $50,000 to $74,999 | 748 (97.7%) | 18 (2.4%) |
| $75,000 to $99,999 | 95 (100.0%) | 0 (0.0%) |
| $100,000 and over | 71 (100.0%) | 0 (0.0%) |
Public vs Private Health Insurance Coverage by Age in Naguabo
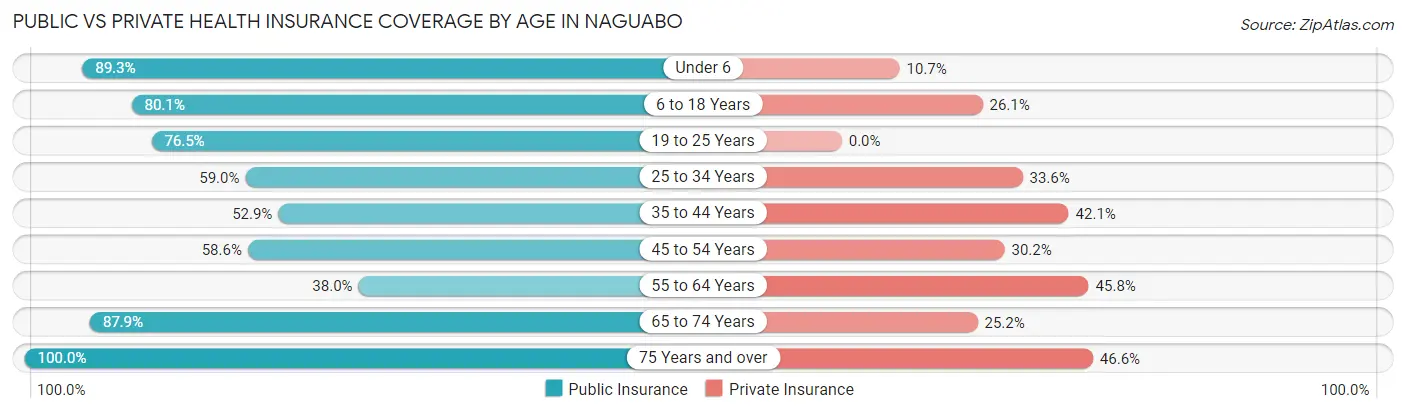
| Age Bracket | Public Insurance | Private Insurance |
| Under 6 | 358 (89.3%) | 43 (10.7%) |
| 6 to 18 Years | 896 (80.1%) | 292 (26.1%) |
| 19 to 25 Years | 370 (76.4%) | 0 (0.0%) |
| 25 to 34 Years | 271 (59.0%) | 154 (33.6%) |
| 35 to 44 Years | 406 (52.9%) | 323 (42.1%) |
| 45 to 54 Years | 256 (58.6%) | 132 (30.2%) |
| 55 to 64 Years | 132 (38.0%) | 159 (45.8%) |
| 65 to 74 Years | 537 (87.9%) | 154 (25.2%) |
| 75 Years and over | 472 (100.0%) | 220 (46.6%) |
| Total | 3,698 (72.6%) | 1,477 (29.0%) |
Disability Status by Sex by Age in Naguabo
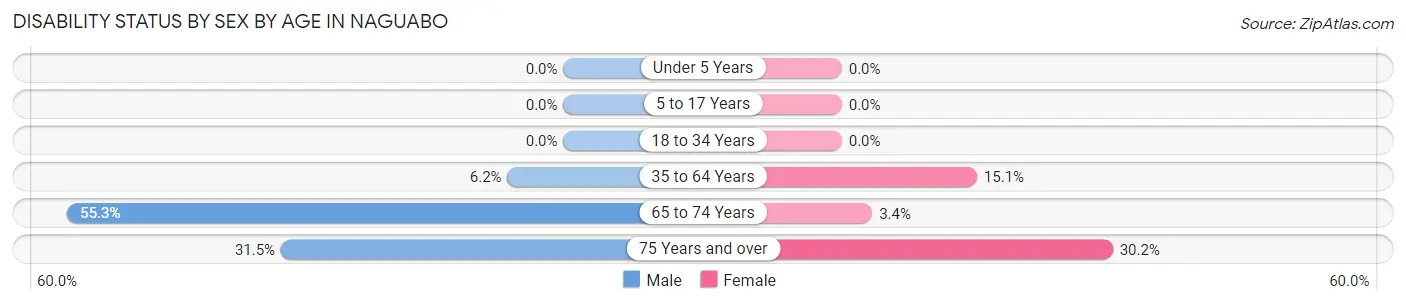
| Age Bracket | Male | Female |
| Under 5 Years | 0 (0.0%) | 0 (0.0%) |
| 5 to 17 Years | 0 (0.0%) | 0 (0.0%) |
| 18 to 34 Years | 0 (0.0%) | 0 (0.0%) |
| 35 to 64 Years | 42 (6.2%) | 132 (15.0%) |
| 65 to 74 Years | 126 (55.3%) | 13 (3.4%) |
| 75 Years and over | 39 (31.5%) | 105 (30.2%) |
Disability Class by Sex by Age in Naguabo
Disability Class: Hearing Difficulty
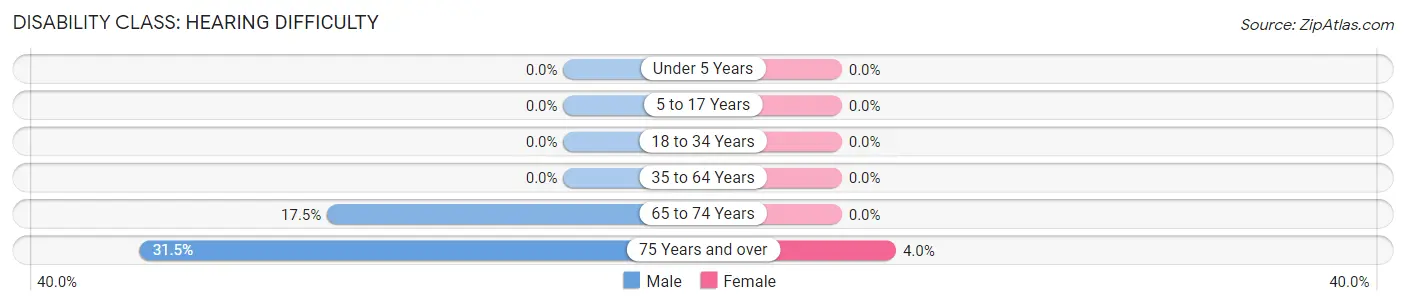
| Age Bracket | Male | Female |
| Under 5 Years | 0 (0.0%) | 0 (0.0%) |
| 5 to 17 Years | 0 (0.0%) | 0 (0.0%) |
| 18 to 34 Years | 0 (0.0%) | 0 (0.0%) |
| 35 to 64 Years | 0 (0.0%) | 0 (0.0%) |
| 65 to 74 Years | 40 (17.5%) | 0 (0.0%) |
| 75 Years and over | 39 (31.5%) | 14 (4.0%) |
Disability Class: Vision Difficulty
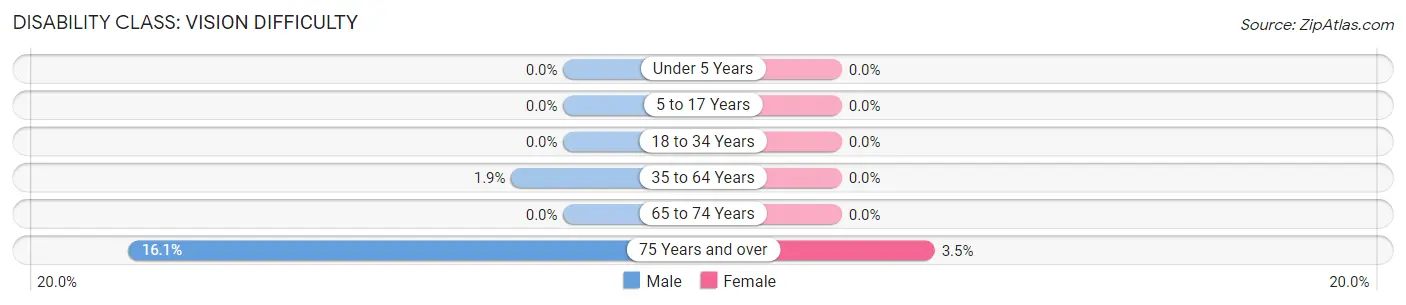
| Age Bracket | Male | Female |
| Under 5 Years | 0 (0.0%) | 0 (0.0%) |
| 5 to 17 Years | 0 (0.0%) | 0 (0.0%) |
| 18 to 34 Years | 0 (0.0%) | 0 (0.0%) |
| 35 to 64 Years | 13 (1.9%) | 0 (0.0%) |
| 65 to 74 Years | 0 (0.0%) | 0 (0.0%) |
| 75 Years and over | 20 (16.1%) | 12 (3.5%) |
Disability Class: Cognitive Difficulty
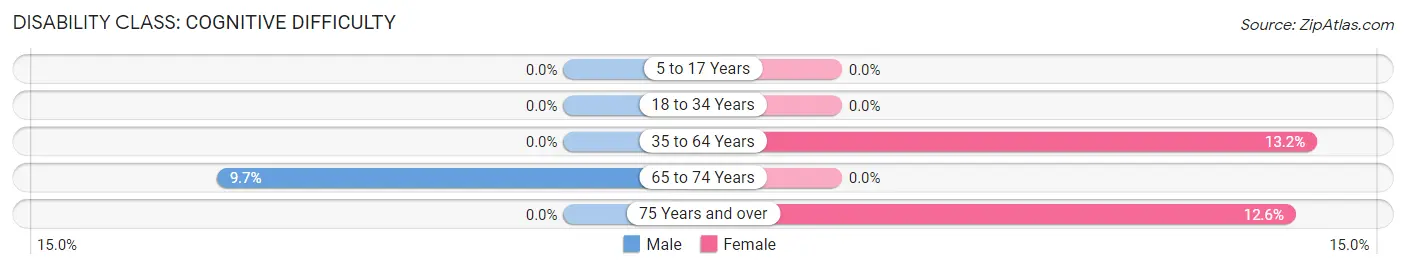
| Age Bracket | Male | Female |
| 5 to 17 Years | 0 (0.0%) | 0 (0.0%) |
| 18 to 34 Years | 0 (0.0%) | 0 (0.0%) |
| 35 to 64 Years | 0 (0.0%) | 116 (13.2%) |
| 65 to 74 Years | 22 (9.7%) | 0 (0.0%) |
| 75 Years and over | 0 (0.0%) | 44 (12.6%) |
Disability Class: Ambulatory Difficulty
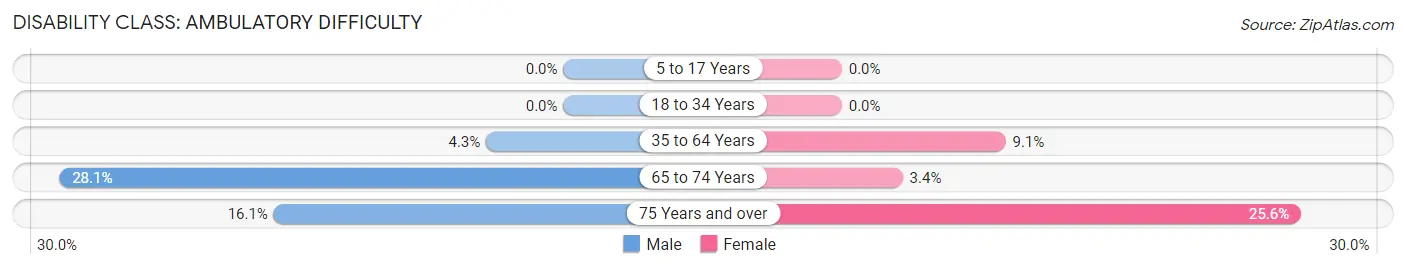
| Age Bracket | Male | Female |
| 5 to 17 Years | 0 (0.0%) | 0 (0.0%) |
| 18 to 34 Years | 0 (0.0%) | 0 (0.0%) |
| 35 to 64 Years | 29 (4.3%) | 80 (9.1%) |
| 65 to 74 Years | 64 (28.1%) | 13 (3.4%) |
| 75 Years and over | 20 (16.1%) | 89 (25.6%) |
Disability Class: Self-Care Difficulty
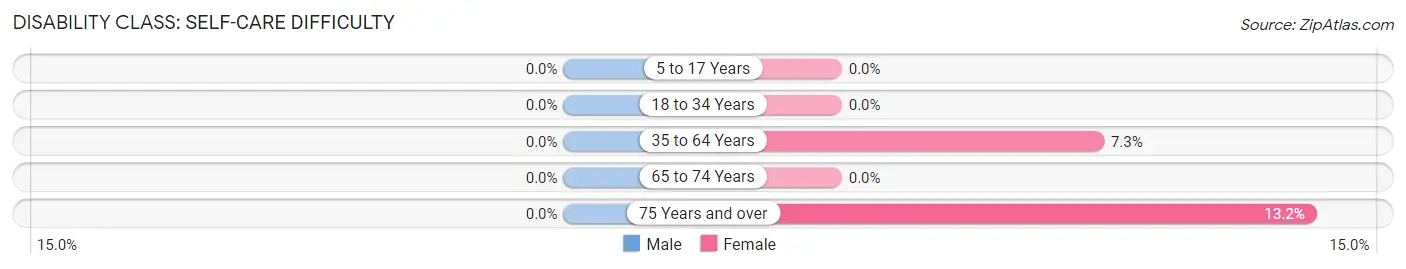
| Age Bracket | Male | Female |
| 5 to 17 Years | 0 (0.0%) | 0 (0.0%) |
| 18 to 34 Years | 0 (0.0%) | 0 (0.0%) |
| 35 to 64 Years | 0 (0.0%) | 64 (7.3%) |
| 65 to 74 Years | 0 (0.0%) | 0 (0.0%) |
| 75 Years and over | 0 (0.0%) | 46 (13.2%) |
Technology Access in Naguabo
Computing Device Access in Naguabo
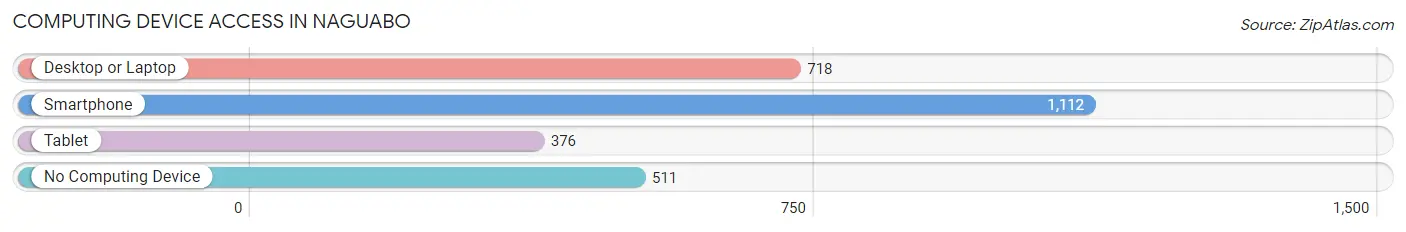
| Device Type | # Households | % Households |
| Desktop or Laptop | 718 | 40.7% |
| Smartphone | 1,112 | 63.0% |
| Tablet | 376 | 21.3% |
| No Computing Device | 511 | 28.9% |
| Total | 1,765 | 100.0% |
Internet Access in Naguabo
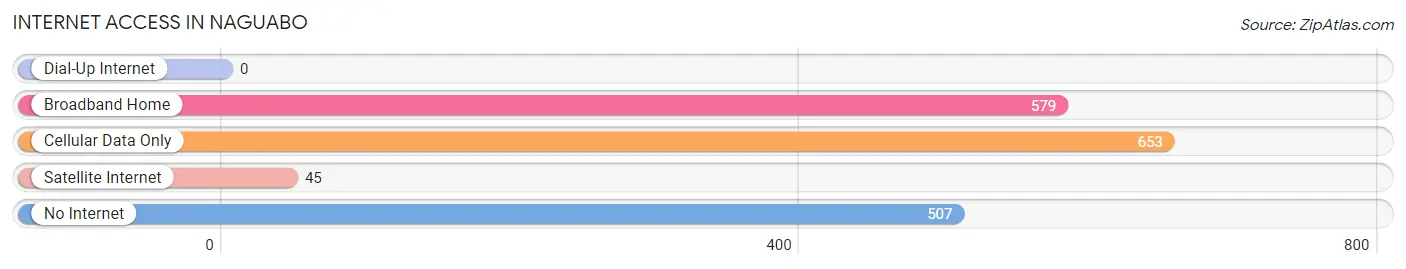
| Internet Type | # Households | % Households |
| Dial-Up Internet | 0 | 0.0% |
| Broadband Home | 579 | 32.8% |
| Cellular Data Only | 653 | 37.0% |
| Satellite Internet | 45 | 2.5% |
| No Internet | 507 | 28.7% |
| Total | 1,765 | 100.0% |
Naguabo Summary
Naguabo is a municipality located in the eastern region of Puerto Rico. It is bordered by the municipalities of Humacao, Yabucoa, and Río Grande. The municipality is located on the eastern coast of the island, and is part of the San Juan-Caguas-Guaynabo Metropolitan Statistical Area. As of the 2010 census, the population of Naguabo was 22,045.
History
The area of Naguabo was originally inhabited by the Taíno Indians. The first Spanish settlers arrived in the area in the early 16th century. The area was originally part of the municipality of Humacao, but in 1831 it was separated and became its own municipality.
Geography
Naguabo is located in the eastern region of Puerto Rico, on the eastern coast of the island. It is bordered by the municipalities of Humacao, Yabucoa, and Río Grande. The municipality has a total area of 39.9 square miles, of which 39.3 square miles is land and 0.6 square miles is water. The terrain is mostly flat, with some hills in the northern part of the municipality.
Economy
The economy of Naguabo is largely based on agriculture and fishing. The main agricultural products are bananas, plantains, coffee, and sugarcane. Fishing is also an important part of the economy, with the main catches being lobster, shrimp, and conch. Tourism is also an important part of the economy, with many visitors coming to the area to enjoy the beaches and other attractions.
Demographics
As of the 2010 census, the population of Naguabo was 22,045, with a population density of 551.3 people per square mile. The racial makeup of the municipality was 79.2% White, 0.7% African American, 0.3% Native American, 0.3% Asian, 0.1% Pacific Islander, 17.3% other races, and 2.2% from two or more races. The median household income was $14,945, and the median family income was $17,945. The per capita income was $7,845.
Naguabo is a municipality with a diverse population. The majority of the population is of Puerto Rican descent, but there is also a significant population of people of Dominican, Cuban, and other Caribbean descent. The majority of the population is Roman Catholic, but there is also a significant population of Protestants and other religions.
Naguabo is a municipality with a rich culture and history. It is home to many festivals and events throughout the year, including the Festival de la Pesca, the Festival de la Calabaza, and the Festival de la Chirimoya. The municipality is also home to many historical sites, including the ruins of the old Spanish fort, El Castillo de San Felipe del Morro.
Common Questions
What is Per Capita Income in Naguabo?
Per Capita income in Naguabo is $11,051.
What is the Median Family Income in Naguabo?
Median Family Income in Naguabo is $22,175.
What is the Median Household income in Naguabo?
Median Household Income in Naguabo is $20,267.
What is Income or Wage Gap in Naguabo?
Income or Wage Gap in Naguabo is 20.0%.
Women in Naguabo earn 80.0 cents for every dollar earned by a man.
What is Family Income Deficit in Naguabo?
Family Income Deficit in Naguabo is $13,465.
Families that are below poverty line in Naguabo earn $13,465 less on average than the poverty threshold level.
What is Inequality or Gini Index in Naguabo?
Inequality or Gini Index in Naguabo is 0.47.
What is the Total Population of Naguabo?
Total Population of Naguabo is 5,104.
What is the Total Male Population of Naguabo?
Total Male Population of Naguabo is 2,362.
What is the Total Female Population of Naguabo?
Total Female Population of Naguabo is 2,742.
What is the Ratio of Males per 100 Females in Naguabo?
There are 86.14 Males per 100 Females in Naguabo.
What is the Ratio of Females per 100 Males in Naguabo?
There are 116.09 Females per 100 Males in Naguabo.
What is the Median Population Age in Naguabo?
Median Population Age in Naguabo is 35.9 Years.
What is the Average Family Size in Naguabo
Average Family Size in Naguabo is 3.6 People.
What is the Average Household Size in Naguabo
Average Household Size in Naguabo is 2.9 People.
How Large is the Labor Force in Naguabo?
There are 1,498 People in the Labor Forcein in Naguabo.
What is the Percentage of People in the Labor Force in Naguabo?
39.5% of People are in the Labor Force in Naguabo.
What is the Unemployment Rate in Naguabo?
Unemployment Rate in Naguabo is 13.6%.