Rincon, PR Map & Demographics
Rincon Overview
$18,544
PER CAPITA INCOME
0.56
INEQUALITY / GINI INDEX
1,488
TOTAL POPULATION
758
MALE POPULATION
730
FEMALE POPULATION
103.84
MALES / 100 FEMALES
96.31
FEMALES / 100 MALES
49.7
MEDIAN AGE
3.1
AVG FAMILY SIZE
2.3
AVG HOUSEHOLD SIZE
576
LABOR FORCE [ PEOPLE ]
42.5%
PERCENT IN LABOR FORCE
13.2%
UNEMPLOYMENT RATE
Rincon Zip Codes
Income in Rincon
Income Overview in Rincon
| Characteristic | Number | Measure |
| Per Capita Income | 1,488 | $18,544 |
| Median Family Income | 356 | $0 |
| Mean Family Income | 356 | $41,083 |
| Median Household Income | 654 | $0 |
| Mean Household Income | 654 | $36,162 |
| Income Deficit | 356 | $0 |
| Wage / Income Gap (%) | 1,488 | 0.00% |
| Wage / Income Gap ($) | 1,488 | 100.00¢ per $1 |
| Gini / Inequality Index | 1,488 | 0.56 |
Earnings by Sex in Rincon
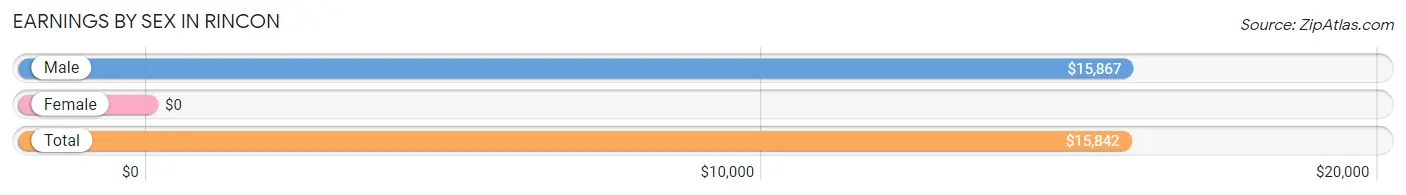
| Sex | Number | Average Earnings |
| Male | 391 (67.1%) | $15,867 |
| Female | 192 (32.9%) | $0 |
| Total | 583 (100.0%) | $15,842 |
Earnings by Sex by Income Bracket in Rincon
The most common earnings brackets in Rincon are $15,000 to $17,499 for men (137 | 35.0%) and $40,000 to $44,999 for women (65 | 33.9%).
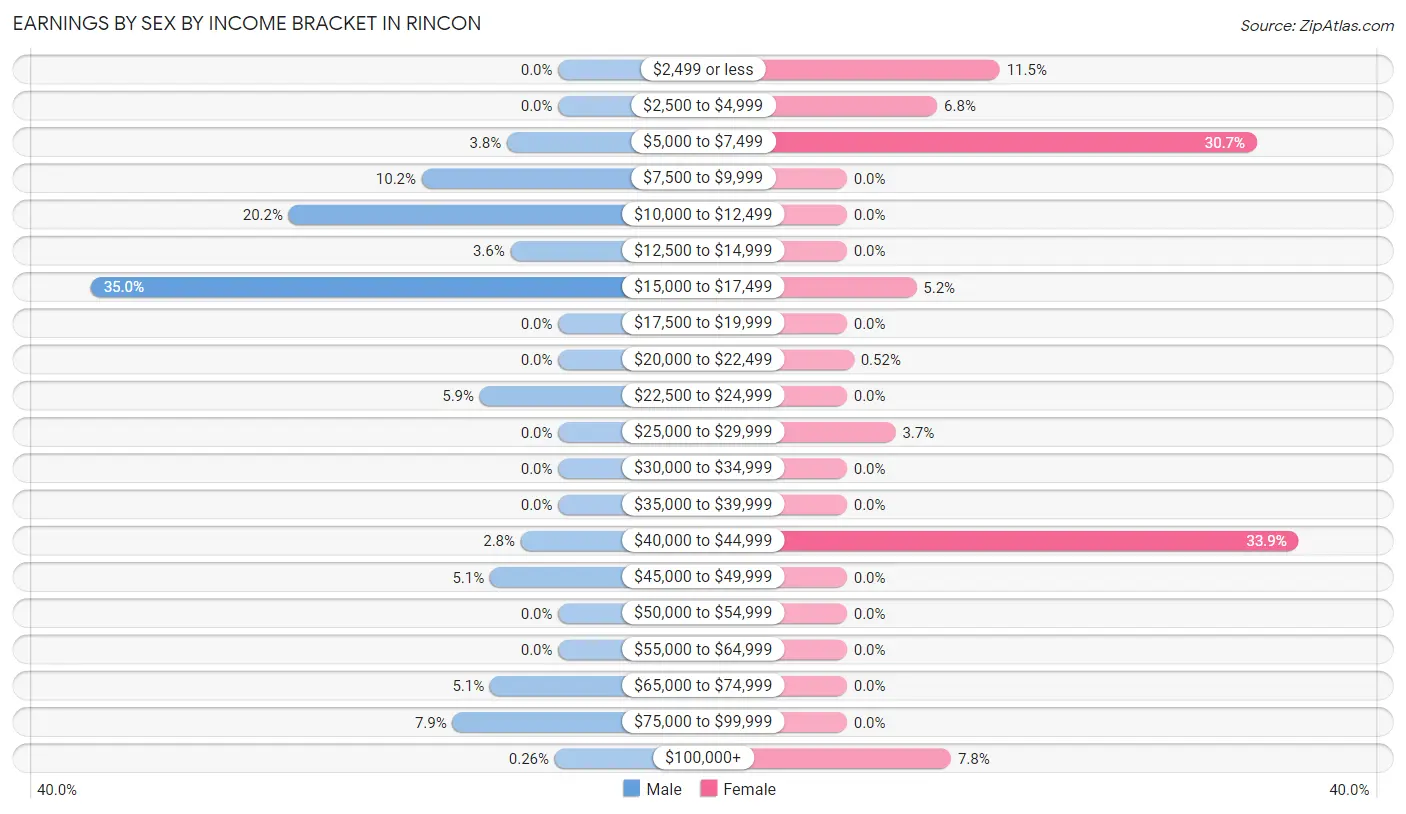
| Income | Male | Female |
| $2,499 or less | 0 (0.0%) | 22 (11.5%) |
| $2,500 to $4,999 | 0 (0.0%) | 13 (6.8%) |
| $5,000 to $7,499 | 15 (3.8%) | 59 (30.7%) |
| $7,500 to $9,999 | 40 (10.2%) | 0 (0.0%) |
| $10,000 to $12,499 | 79 (20.2%) | 0 (0.0%) |
| $12,500 to $14,999 | 14 (3.6%) | 0 (0.0%) |
| $15,000 to $17,499 | 137 (35.0%) | 10 (5.2%) |
| $17,500 to $19,999 | 0 (0.0%) | 0 (0.0%) |
| $20,000 to $22,499 | 0 (0.0%) | 1 (0.5%) |
| $22,500 to $24,999 | 23 (5.9%) | 0 (0.0%) |
| $25,000 to $29,999 | 0 (0.0%) | 7 (3.6%) |
| $30,000 to $34,999 | 0 (0.0%) | 0 (0.0%) |
| $35,000 to $39,999 | 0 (0.0%) | 0 (0.0%) |
| $40,000 to $44,999 | 11 (2.8%) | 65 (33.9%) |
| $45,000 to $49,999 | 20 (5.1%) | 0 (0.0%) |
| $50,000 to $54,999 | 0 (0.0%) | 0 (0.0%) |
| $55,000 to $64,999 | 0 (0.0%) | 0 (0.0%) |
| $65,000 to $74,999 | 20 (5.1%) | 0 (0.0%) |
| $75,000 to $99,999 | 31 (7.9%) | 0 (0.0%) |
| $100,000+ | 1 (0.3%) | 15 (7.8%) |
| Total | 391 (100.0%) | 192 (100.0%) |
Earnings by Sex by Educational Attainment in Rincon
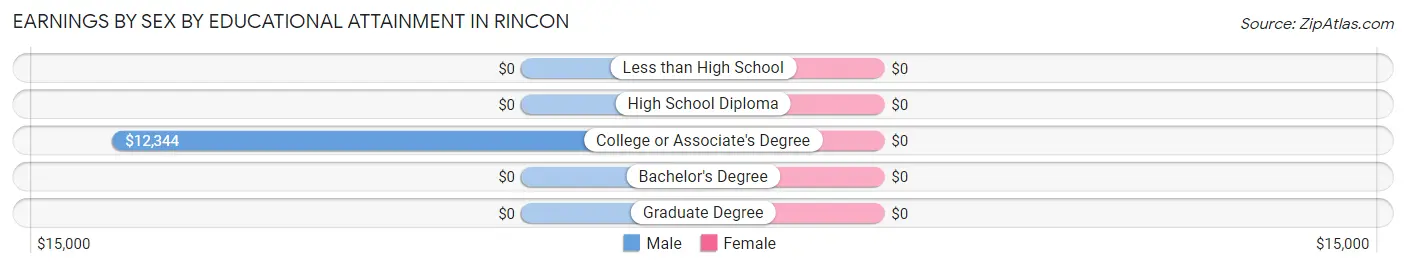
| Educational Attainment | Male Income | Female Income |
| Less than High School | - | - |
| High School Diploma | - | - |
| College or Associate's Degree | $12,344 | $0 |
| Bachelor's Degree | - | - |
| Graduate Degree | - | - |
| Total | $16,004 | $43,154 |
Family Income in Rincon
Family Income Brackets in Rincon
According to the Rincon family income data, there are 122 families falling into the less than $10,000 income range, which is the most common income bracket and makes up 34.3% of all families.
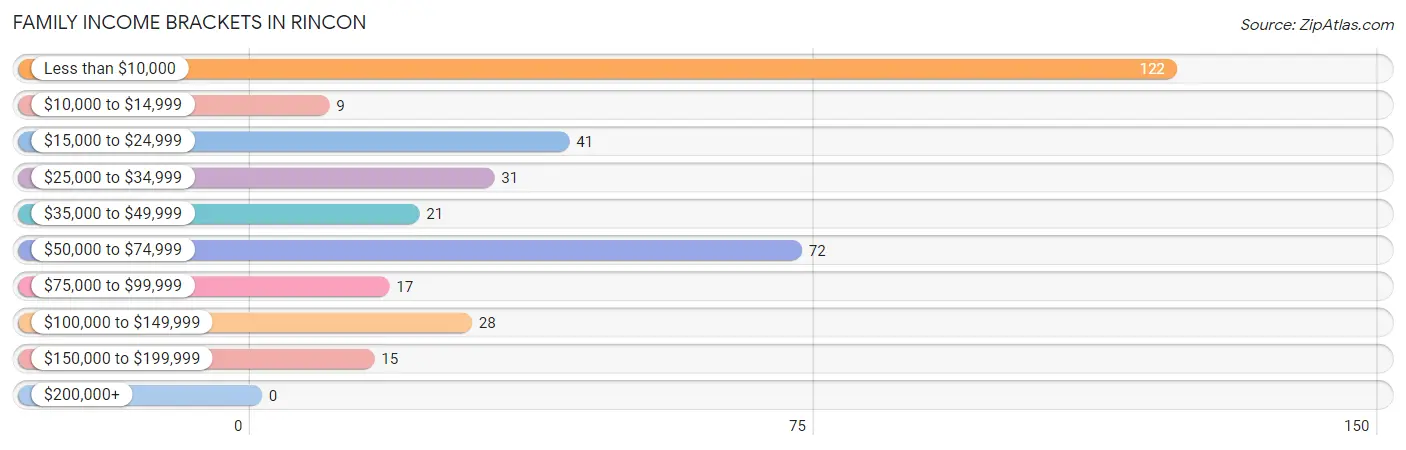
| Income Bracket | # Families | % Families |
| Less than $10,000 | 122 | 34.3% |
| $10,000 to $14,999 | 9 | 2.5% |
| $15,000 to $24,999 | 41 | 11.5% |
| $25,000 to $34,999 | 31 | 8.7% |
| $35,000 to $49,999 | 21 | 5.9% |
| $50,000 to $74,999 | 72 | 20.2% |
| $75,000 to $99,999 | 17 | 4.8% |
| $100,000 to $149,999 | 28 | 7.9% |
| $150,000 to $199,999 | 15 | 4.2% |
| $200,000+ | 0 | 0.0% |
Family Income by Famaliy Size in Rincon
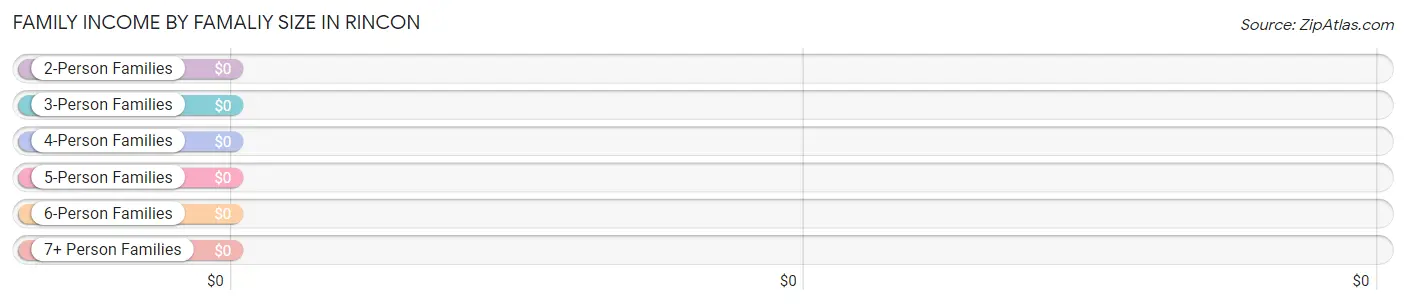
| Income Bracket | # Families | Median Income |
| 2-Person Families | 207 (58.2%) | $0 |
| 3-Person Families | 125 (35.1%) | $0 |
| 4-Person Families | 11 (3.1%) | $0 |
| 5-Person Families | 13 (3.6%) | $0 |
| 6-Person Families | 0 (0.0%) | $0 |
| 7+ Person Families | 0 (0.0%) | $0 |
| Total | 356 (100.0%) | $0 |
Family Income by Number of Earners in Rincon
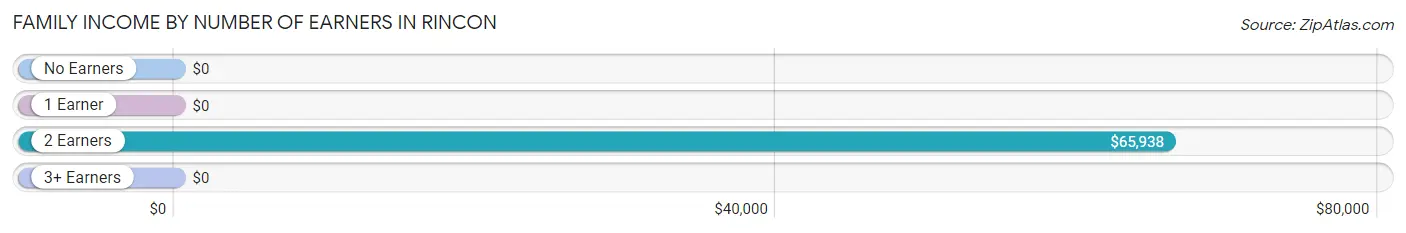
| Number of Earners | # Families | Median Income |
| No Earners | 178 (50.0%) | $0 |
| 1 Earner | 104 (29.2%) | $0 |
| 2 Earners | 67 (18.8%) | $65,938 |
| 3+ Earners | 7 (2.0%) | $0 |
| Total | 356 (100.0%) | $0 |
Household Income in Rincon
Household Income Brackets in Rincon
With 194 households falling in the category, the less than $10,000 income range is the most frequent in Rincon, accounting for 29.7% of all households.
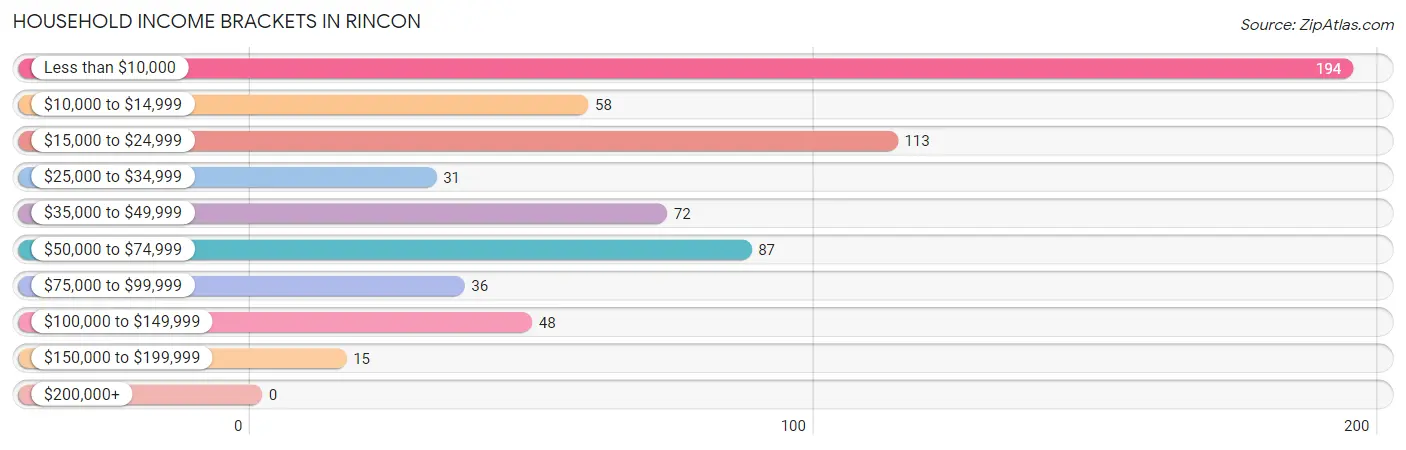
| Income Bracket | # Households | % Households |
| Less than $10,000 | 194 | 29.7% |
| $10,000 to $14,999 | 58 | 8.9% |
| $15,000 to $24,999 | 113 | 17.3% |
| $25,000 to $34,999 | 31 | 4.7% |
| $35,000 to $49,999 | 72 | 11.0% |
| $50,000 to $74,999 | 87 | 13.3% |
| $75,000 to $99,999 | 36 | 5.5% |
| $100,000 to $149,999 | 48 | 7.3% |
| $150,000 to $199,999 | 15 | 2.3% |
| $200,000+ | 0 | 0.0% |
Household Income by Householder Age in Rincon
The median household income in Rincon is $0, with the highest median household income of $30,069 found in the 65+ years age bracket for the primary householder. A total of 313 households (47.9%) fall into this category. Meanwhile, the 15 to 24 years age bracket for the primary householder has the lowest median household income of $0, with 7 households (1.1%) in this group.
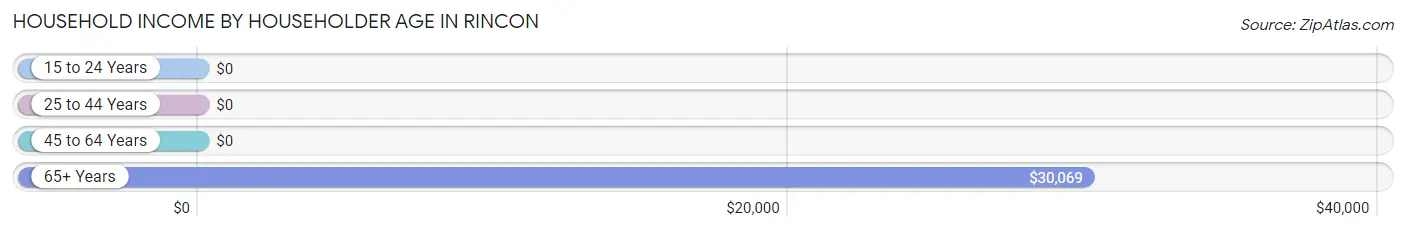
| Income Bracket | # Households | Median Income |
| 15 to 24 Years | 7 (1.1%) | $0 |
| 25 to 44 Years | 135 (20.6%) | $0 |
| 45 to 64 Years | 199 (30.4%) | $0 |
| 65+ Years | 313 (47.9%) | $30,069 |
| Total | 654 (100.0%) | $0 |
Poverty in Rincon
Income Below Poverty by Sex and Age in Rincon
With 38.9% poverty level for males and 54.4% for females among the residents of Rincon, 12 to 14 year old males and under 5 year old females are the most vulnerable to poverty, with 16 males (100.0%) and 16 females (100.0%) in their respective age groups living below the poverty level.
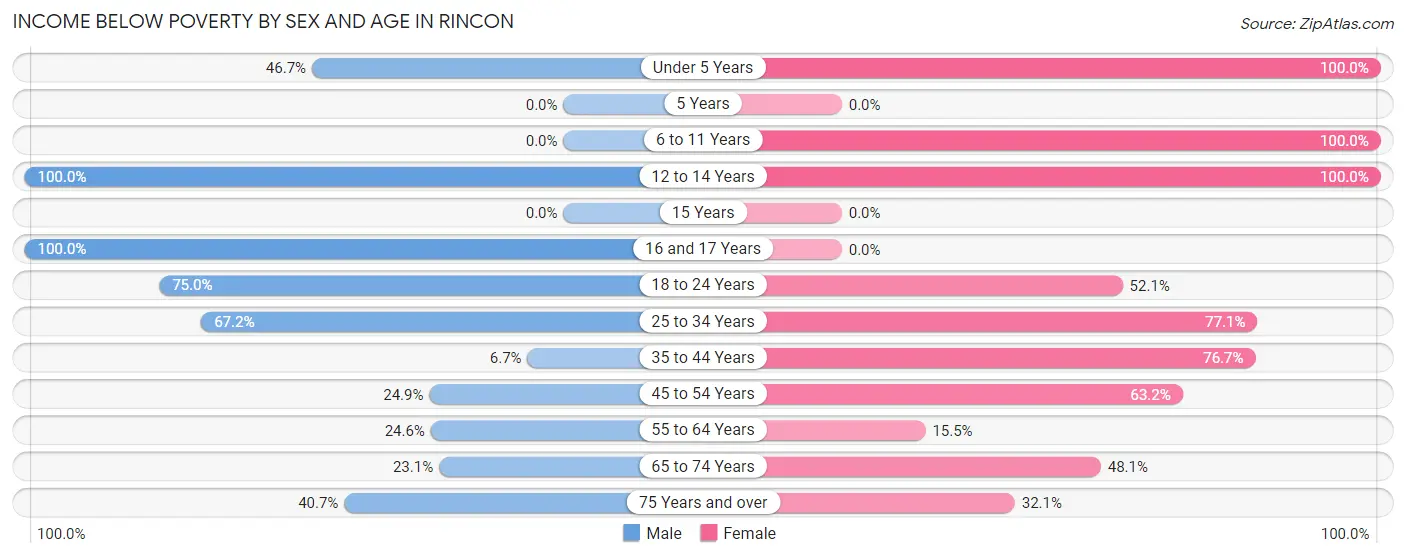
| Age Bracket | Male | Female |
| Under 5 Years | 14 (46.7%) | 16 (100.0%) |
| 5 Years | 0 (0.0%) | 0 (0.0%) |
| 6 to 11 Years | 0 (0.0%) | 50 (100.0%) |
| 12 to 14 Years | 16 (100.0%) | 21 (100.0%) |
| 15 Years | 0 (0.0%) | 0 (0.0%) |
| 16 and 17 Years | 21 (100.0%) | 0 (0.0%) |
| 18 to 24 Years | 33 (75.0%) | 49 (52.1%) |
| 25 to 34 Years | 41 (67.2%) | 91 (77.1%) |
| 35 to 44 Years | 1 (6.7%) | 33 (76.7%) |
| 45 to 54 Years | 56 (24.9%) | 43 (63.2%) |
| 55 to 64 Years | 32 (24.6%) | 16 (15.5%) |
| 65 to 74 Years | 9 (23.1%) | 25 (48.1%) |
| 75 Years and over | 72 (40.7%) | 53 (32.1%) |
| Total | 295 (38.9%) | 397 (54.4%) |
Income Above Poverty by Sex and Age in Rincon
According to the poverty statistics in Rincon, males aged 35 to 44 years and females aged 55 to 64 years are the age groups that are most secure financially, with 93.3% of males and 84.5% of females in these age groups living above the poverty line.
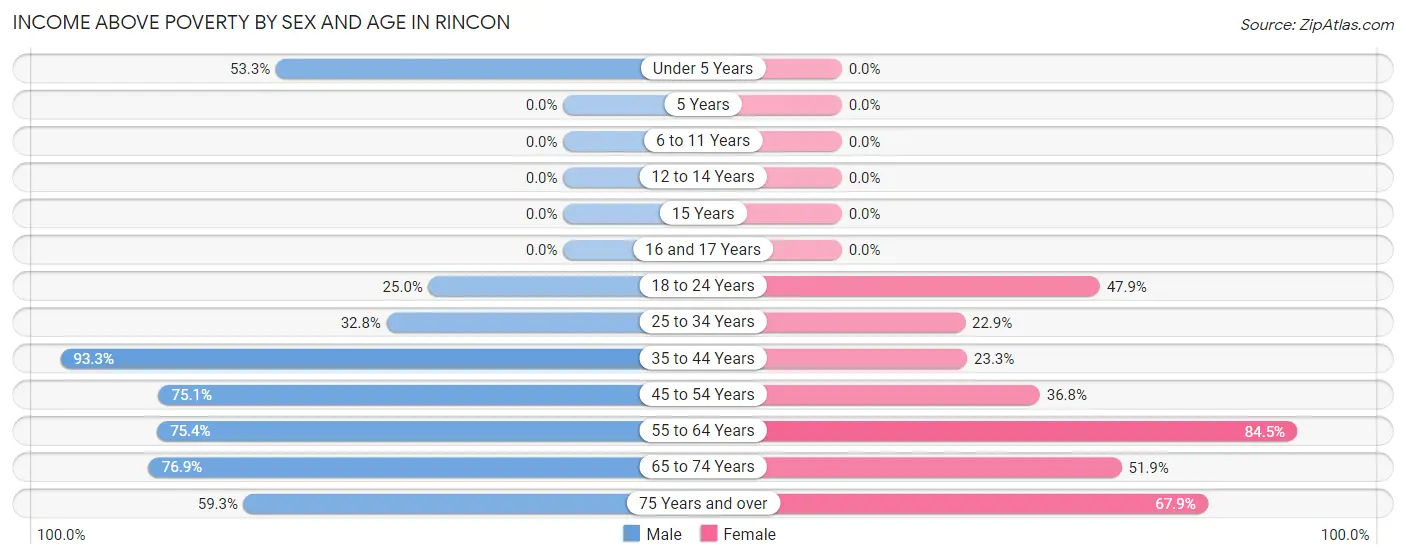
| Age Bracket | Male | Female |
| Under 5 Years | 16 (53.3%) | 0 (0.0%) |
| 5 Years | 0 (0.0%) | 0 (0.0%) |
| 6 to 11 Years | 0 (0.0%) | 0 (0.0%) |
| 12 to 14 Years | 0 (0.0%) | 0 (0.0%) |
| 15 Years | 0 (0.0%) | 0 (0.0%) |
| 16 and 17 Years | 0 (0.0%) | 0 (0.0%) |
| 18 to 24 Years | 11 (25.0%) | 45 (47.9%) |
| 25 to 34 Years | 20 (32.8%) | 27 (22.9%) |
| 35 to 44 Years | 14 (93.3%) | 10 (23.3%) |
| 45 to 54 Years | 169 (75.1%) | 25 (36.8%) |
| 55 to 64 Years | 98 (75.4%) | 87 (84.5%) |
| 65 to 74 Years | 30 (76.9%) | 27 (51.9%) |
| 75 Years and over | 105 (59.3%) | 112 (67.9%) |
| Total | 463 (61.1%) | 333 (45.6%) |
Income Below Poverty Among Married-Couple Families in Rincon
The poverty statistics for married-couple families in Rincon show that 15.4% or 31 of the total 201 families live below the poverty line. Families with 1 or 2 children have the highest poverty rate of 45.8%, comprising of 11 families. On the other hand, families with no children have the lowest poverty rate of 11.3%, which includes 20 families.
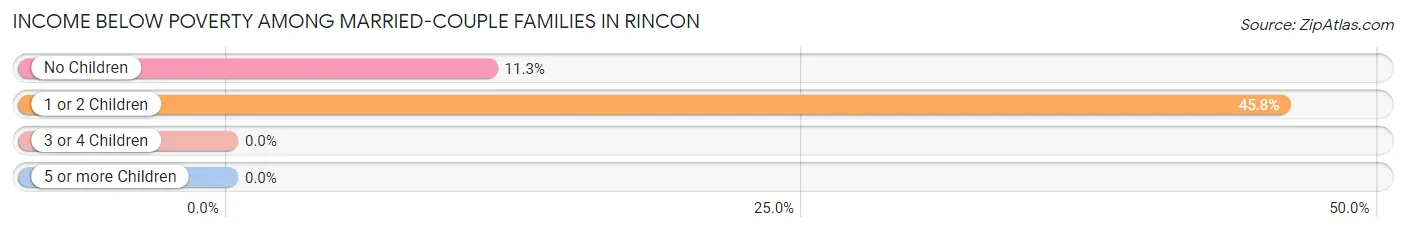
| Children | Above Poverty | Below Poverty |
| No Children | 157 (88.7%) | 20 (11.3%) |
| 1 or 2 Children | 13 (54.2%) | 11 (45.8%) |
| 3 or 4 Children | 0 (0.0%) | 0 (0.0%) |
| 5 or more Children | 0 (0.0%) | 0 (0.0%) |
| Total | 170 (84.6%) | 31 (15.4%) |
Income Below Poverty Among Single-Parent Households in Rincon
According to the poverty data in Rincon, 100.0% or 17 single-father households and 89.9% or 124 single-mother households are living below the poverty line. Among single-father households, those with 1 or 2 children have the highest poverty rate, with 17 households (100.0%) experiencing poverty. Likewise, among single-mother households, those with 1 or 2 children have the highest poverty rate, with 69 households (100.0%) falling below the poverty line.
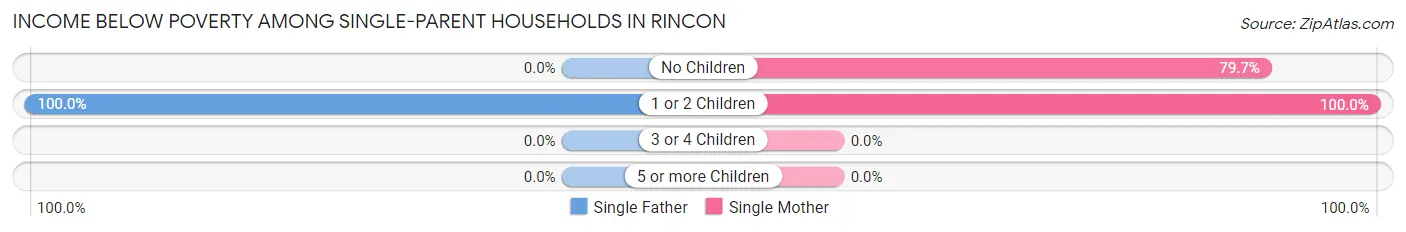
| Children | Single Father | Single Mother |
| No Children | 0 (0.0%) | 55 (79.7%) |
| 1 or 2 Children | 17 (100.0%) | 69 (100.0%) |
| 3 or 4 Children | 0 (0.0%) | 0 (0.0%) |
| 5 or more Children | 0 (0.0%) | 0 (0.0%) |
| Total | 17 (100.0%) | 124 (89.9%) |
Income Below Poverty Among Married-Couple vs Single-Parent Households in Rincon
The poverty data for Rincon shows that 31 of the married-couple family households (15.4%) and 141 of the single-parent households (91.0%) are living below the poverty level. Within the married-couple family households, those with 1 or 2 children have the highest poverty rate, with 11 households (45.8%) falling below the poverty line. Among the single-parent households, those with 1 or 2 children have the highest poverty rate, with 86 household (100.0%) living below poverty.
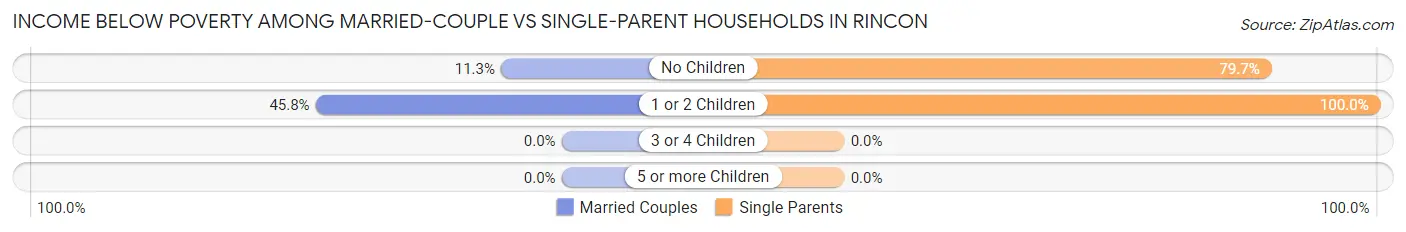
| Children | Married-Couple Families | Single-Parent Households |
| No Children | 20 (11.3%) | 55 (79.7%) |
| 1 or 2 Children | 11 (45.8%) | 86 (100.0%) |
| 3 or 4 Children | 0 (0.0%) | 0 (0.0%) |
| 5 or more Children | 0 (0.0%) | 0 (0.0%) |
| Total | 31 (15.4%) | 141 (91.0%) |
Race in Rincon
The most populous races in Rincon are Hispanic or Latino (1,402 | 94.2%), Two or more Races (681 | 45.8%), and White / Caucasian (614 | 41.3%).
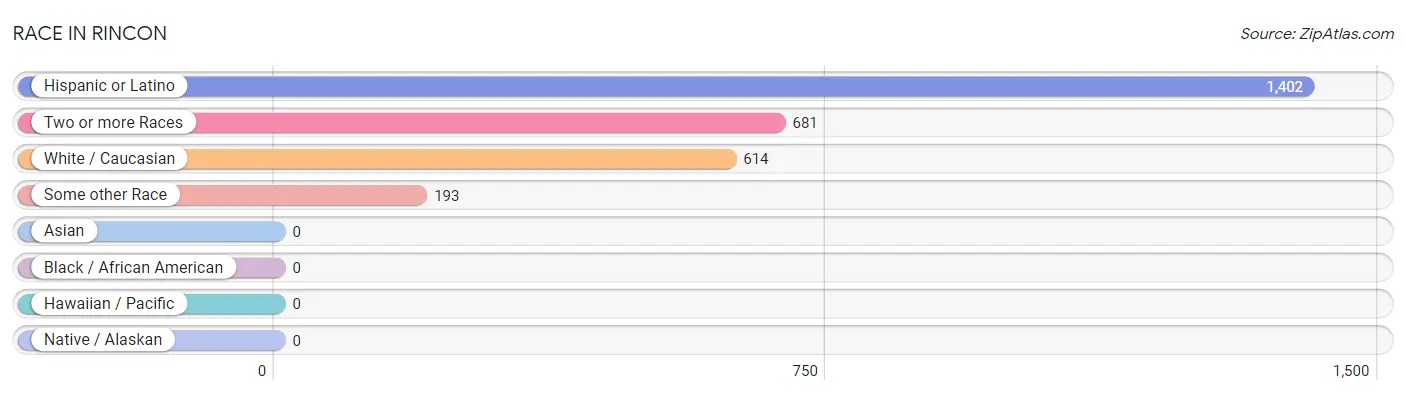
| Race | # Population | % Population |
| Asian | 0 | 0.0% |
| Black / African American | 0 | 0.0% |
| Hawaiian / Pacific | 0 | 0.0% |
| Hispanic or Latino | 1,402 | 94.2% |
| Native / Alaskan | 0 | 0.0% |
| White / Caucasian | 614 | 41.3% |
| Two or more Races | 681 | 45.8% |
| Some other Race | 193 | 13.0% |
| Total | 1,488 | 100.0% |
Ancestry in Rincon
The most populous ancestries reported in Rincon are Puerto Rican (1,387 | 93.2%), Central American Indian (497 | 33.4%), American (61 | 4.1%), Irish (22 | 1.5%), and Austrian (18 | 1.2%), together accounting for 133.4% of all Rincon residents.
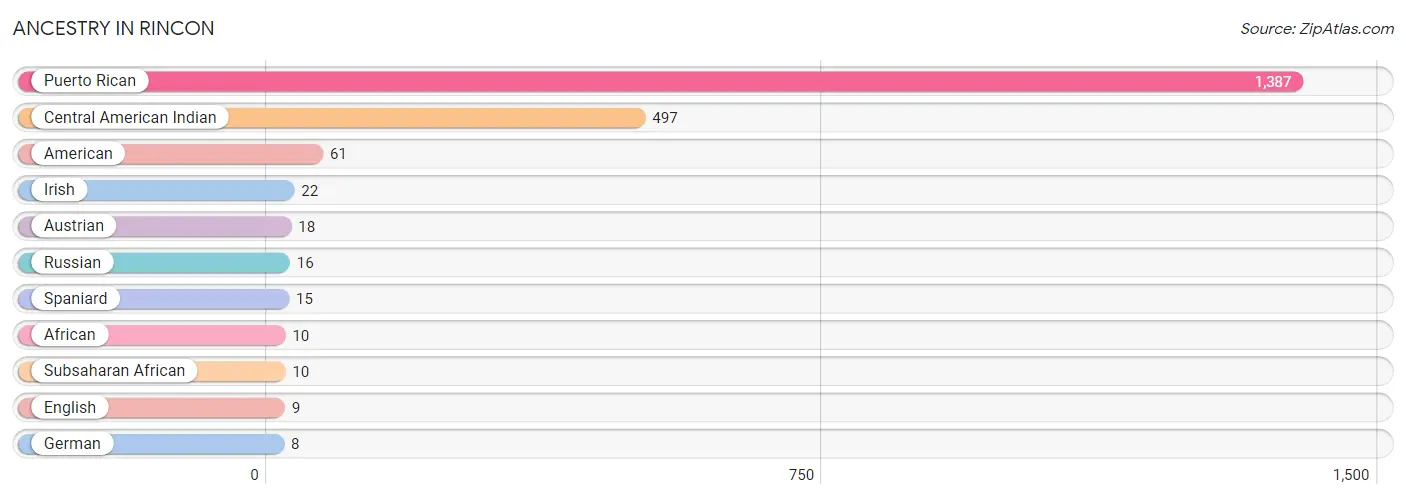
| Ancestry | # Population | % Population |
| African | 10 | 0.7% |
| American | 61 | 4.1% |
| Austrian | 18 | 1.2% |
| Central American Indian | 497 | 33.4% |
| English | 9 | 0.6% |
| German | 8 | 0.5% |
| Irish | 22 | 1.5% |
| Puerto Rican | 1,387 | 93.2% |
| Russian | 16 | 1.1% |
| Spaniard | 15 | 1.0% |
| Subsaharan African | 10 | 0.7% | View All 11 Rows |
Immigrants in Rincon

| Immigration Origin | # Population | % Population | View All 0 Rows |
Sex and Age in Rincon
Sex and Age in Rincon
The most populous age groups in Rincon are 45 to 49 Years (187 | 24.7%) for men and 55 to 59 Years (102 | 14.0%) for women.
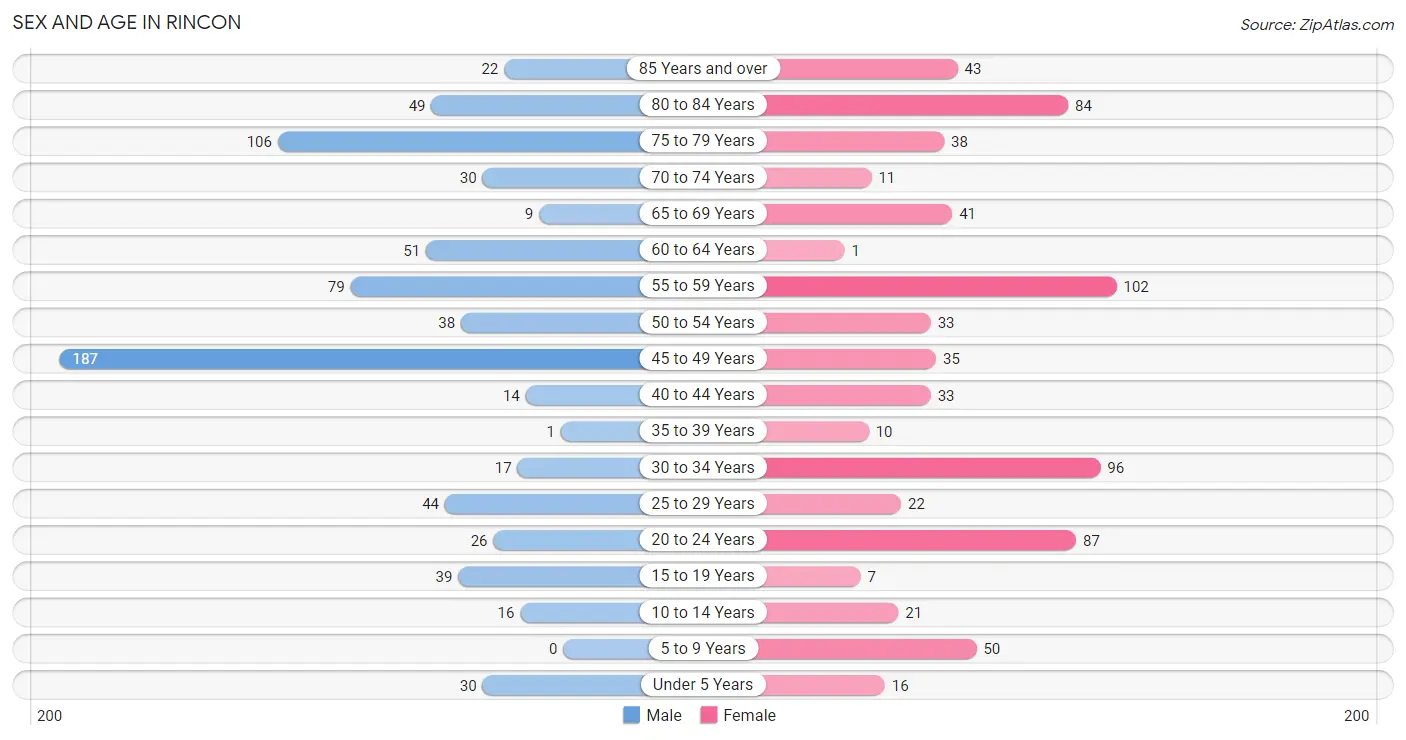
| Age Bracket | Male | Female |
| Under 5 Years | 30 (4.0%) | 16 (2.2%) |
| 5 to 9 Years | 0 (0.0%) | 50 (6.9%) |
| 10 to 14 Years | 16 (2.1%) | 21 (2.9%) |
| 15 to 19 Years | 39 (5.1%) | 7 (1.0%) |
| 20 to 24 Years | 26 (3.4%) | 87 (11.9%) |
| 25 to 29 Years | 44 (5.8%) | 22 (3.0%) |
| 30 to 34 Years | 17 (2.2%) | 96 (13.2%) |
| 35 to 39 Years | 1 (0.1%) | 10 (1.4%) |
| 40 to 44 Years | 14 (1.8%) | 33 (4.5%) |
| 45 to 49 Years | 187 (24.7%) | 35 (4.8%) |
| 50 to 54 Years | 38 (5.0%) | 33 (4.5%) |
| 55 to 59 Years | 79 (10.4%) | 102 (14.0%) |
| 60 to 64 Years | 51 (6.7%) | 1 (0.1%) |
| 65 to 69 Years | 9 (1.2%) | 41 (5.6%) |
| 70 to 74 Years | 30 (4.0%) | 11 (1.5%) |
| 75 to 79 Years | 106 (14.0%) | 38 (5.2%) |
| 80 to 84 Years | 49 (6.5%) | 84 (11.5%) |
| 85 Years and over | 22 (2.9%) | 43 (5.9%) |
| Total | 758 (100.0%) | 730 (100.0%) |
Families and Households in Rincon
Median Family Size in Rincon
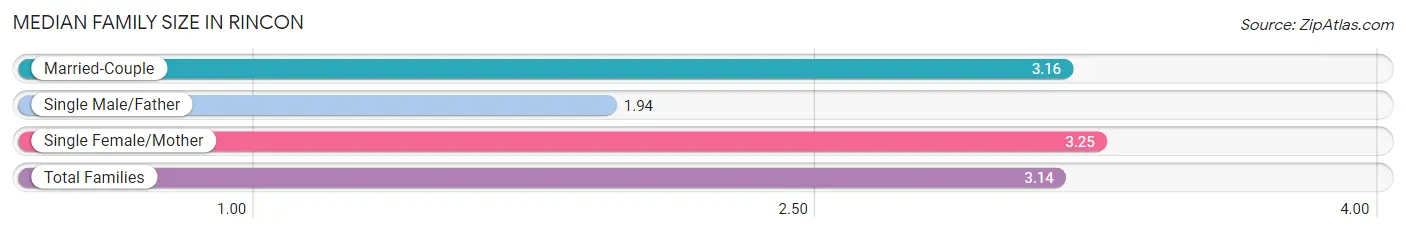
The median family size in Rincon is 3.14 persons per family, with single female/mother families (138 | 38.8%) accounting for the largest median family size of 3.25 persons per family. On the other hand, single male/father families (17 | 4.8%) represent the smallest median family size with 1.94 persons per family.
| Family Type | # Families | Family Size |
| Married-Couple | 201 (56.5%) | 3.16 |
| Single Male/Father | 17 (4.8%) | 1.94 |
| Single Female/Mother | 138 (38.8%) | 3.25 |
| Total Families | 356 (100.0%) | 3.14 |
Median Household Size in Rincon
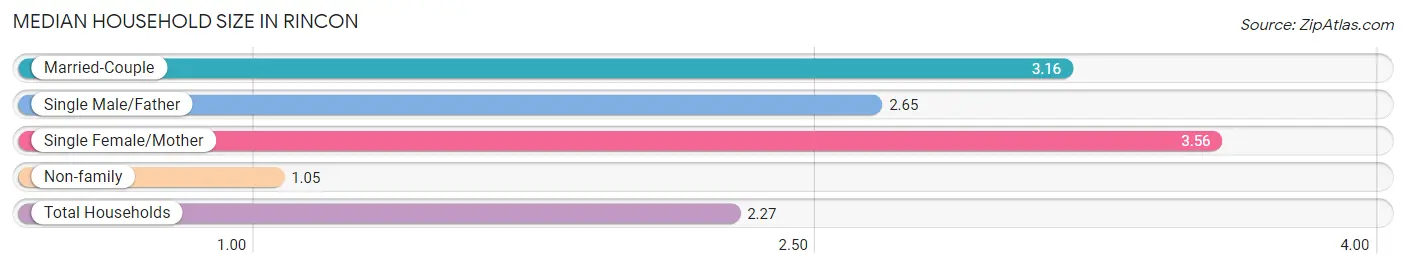
The median household size in Rincon is 2.27 persons per household, with single female/mother households (138 | 21.1%) accounting for the largest median household size of 3.56 persons per household. non-family households (298 | 45.6%) represent the smallest median household size with 1.05 persons per household.
| Household Type | # Households | Household Size |
| Married-Couple | 201 (30.7%) | 3.16 |
| Single Male/Father | 17 (2.6%) | 2.65 |
| Single Female/Mother | 138 (21.1%) | 3.56 |
| Non-family | 298 (45.6%) | 1.05 |
| Total Households | 654 (100.0%) | 2.27 |
Household Size by Marriage Status in Rincon
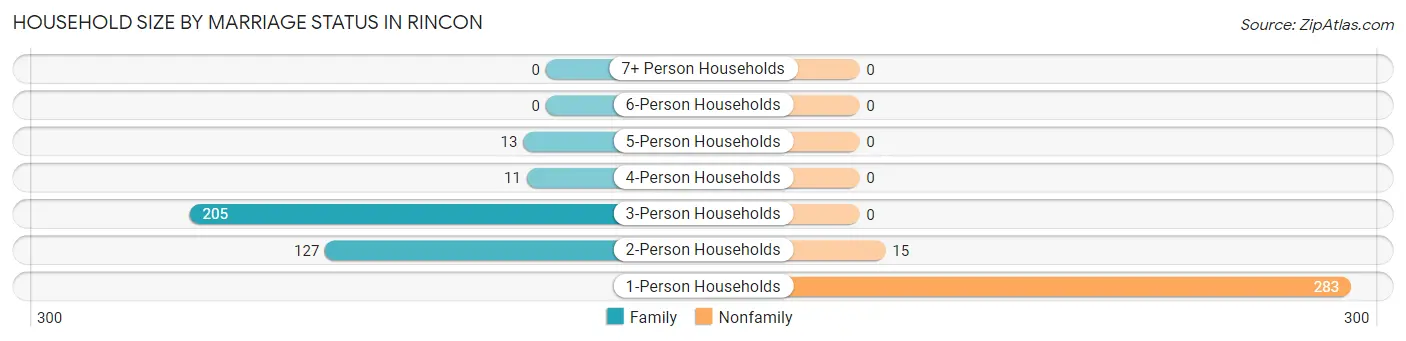
Out of a total of 654 households in Rincon, 356 (54.4%) are family households, while 298 (45.6%) are nonfamily households. The most numerous type of family households are 3-person households, comprising 205, and the most common type of nonfamily households are 1-person households, comprising 283.
| Household Size | Family Households | Nonfamily Households |
| 1-Person Households | - | 283 (43.3%) |
| 2-Person Households | 127 (19.4%) | 15 (2.3%) |
| 3-Person Households | 205 (31.4%) | 0 (0.0%) |
| 4-Person Households | 11 (1.7%) | 0 (0.0%) |
| 5-Person Households | 13 (2.0%) | 0 (0.0%) |
| 6-Person Households | 0 (0.0%) | 0 (0.0%) |
| 7+ Person Households | 0 (0.0%) | 0 (0.0%) |
| Total | 356 (54.4%) | 298 (45.6%) |
Female Fertility in Rincon
Fertility by Age in Rincon
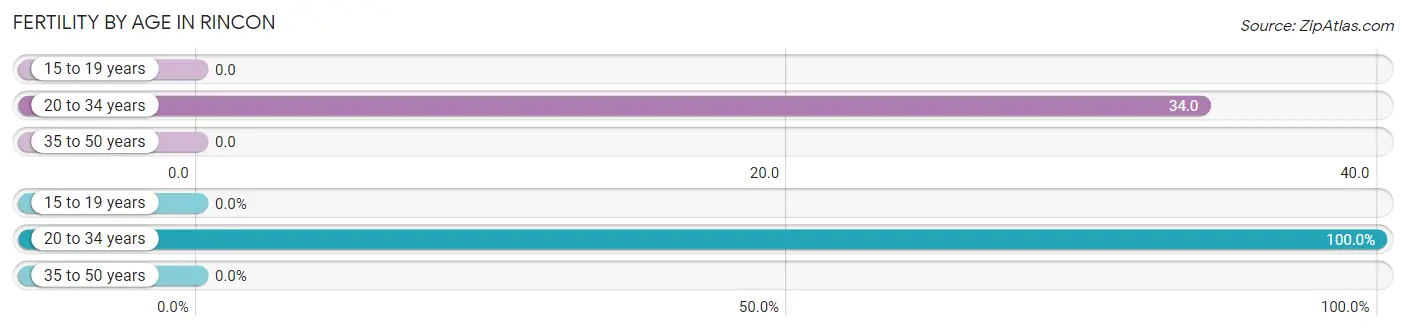
Average fertility rate in Rincon is 24.0 births per 1,000 women. Women in the age bracket of 20 to 34 years have the highest fertility rate with 34.0 births per 1,000 women. Women in the age bracket of 20 to 34 years acount for 100.0% of all women with births.
| Age Bracket | Women with Births | Births / 1,000 Women |
| 15 to 19 years | 0 (0.0%) | 0.0 |
| 20 to 34 years | 7 (100.0%) | 34.0 |
| 35 to 50 years | 0 (0.0%) | 0.0 |
| Total | 7 (100.0%) | 24.0 |
Fertility by Age by Marriage Status in Rincon
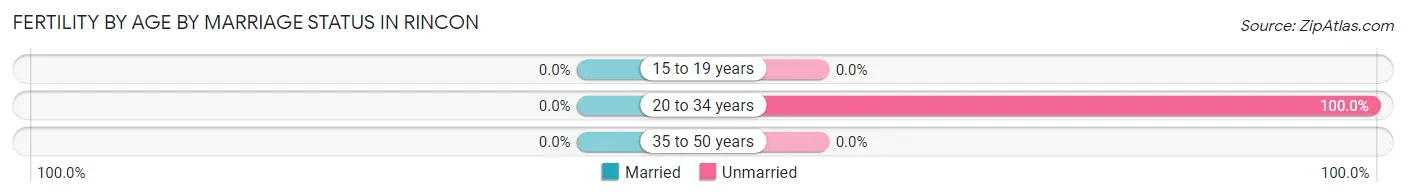
| Age Bracket | Married | Unmarried |
| 15 to 19 years | 0 (0.0%) | 0 (0.0%) |
| 20 to 34 years | 0 (0.0%) | 7 (100.0%) |
| 35 to 50 years | 0 (0.0%) | 0 (0.0%) |
| Total | 0 (0.0%) | 7 (100.0%) |
Fertility by Education in Rincon
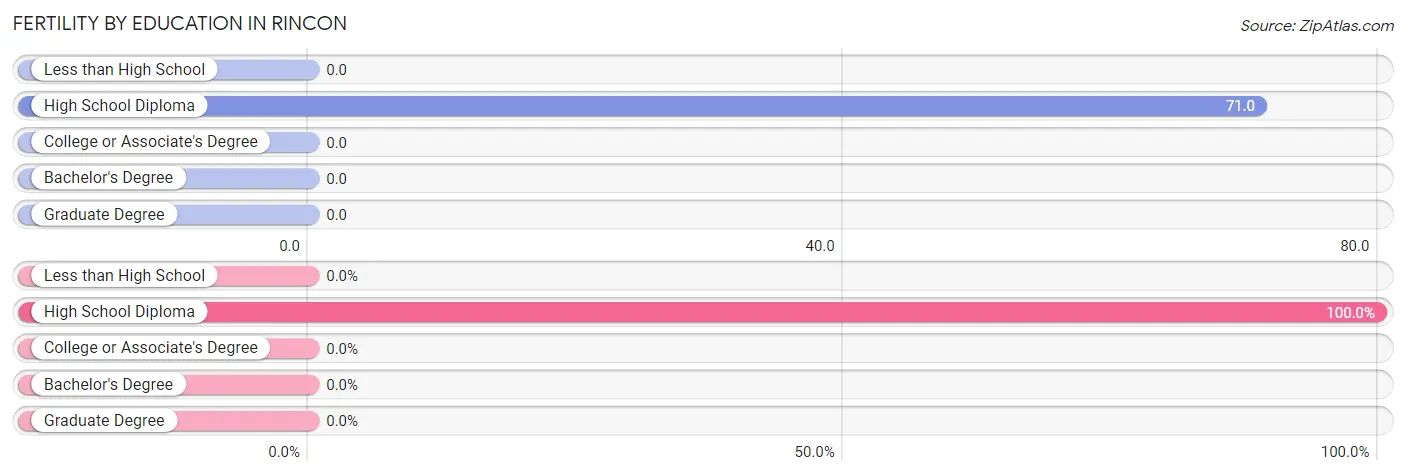
| Educational Attainment | Women with Births | Births / 1,000 Women |
| Less than High School | 0 (0.0%) | 0.0 |
| High School Diploma | 7 (100.0%) | 71.0 |
| College or Associate's Degree | 0 (0.0%) | 0.0 |
| Bachelor's Degree | 0 (0.0%) | 0.0 |
| Graduate Degree | 0 (0.0%) | 0.0 |
| Total | 7 (100.0%) | 24.0 |
Fertility by Education by Marriage Status in Rincon
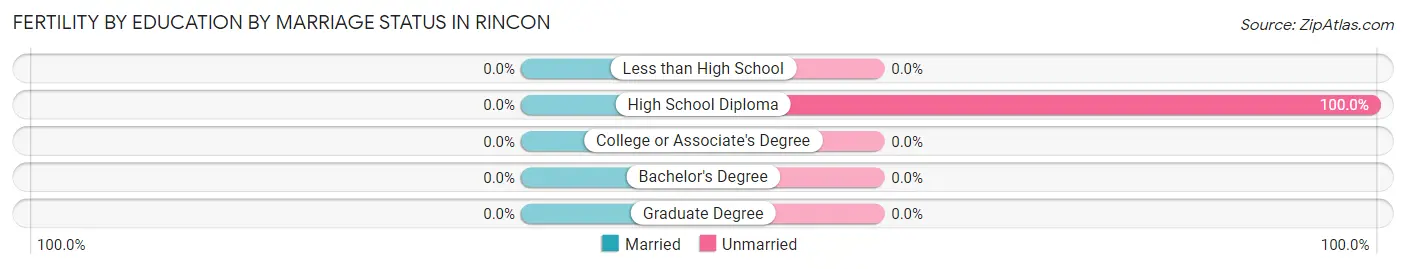
| Educational Attainment | Married | Unmarried |
| Less than High School | 0 (0.0%) | 0 (0.0%) |
| High School Diploma | 0 (0.0%) | 7 (100.0%) |
| College or Associate's Degree | 0 (0.0%) | 0 (0.0%) |
| Bachelor's Degree | 0 (0.0%) | 0 (0.0%) |
| Graduate Degree | 0 (0.0%) | 0 (0.0%) |
| Total | 0 (0.0%) | 7 (100.0%) |
Employment Characteristics in Rincon
Employment by Class of Employer in Rincon
Among the 500 employed individuals in Rincon, private company employees (399 | 79.8%), self-employed (not incorporated) (45 | 9.0%), and state government employees (38 | 7.6%) make up the most common classes of employment.
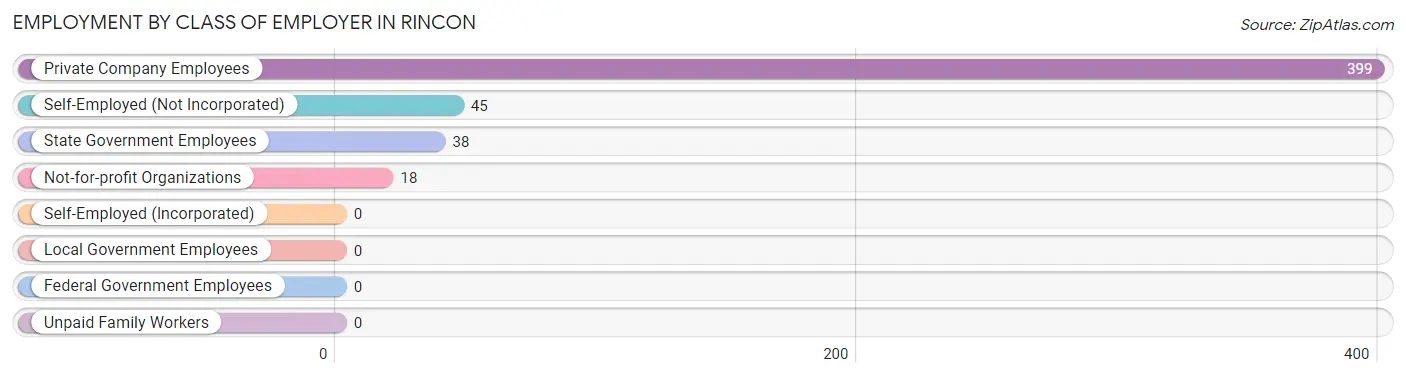
| Employer Class | # Employees | % Employees |
| Private Company Employees | 399 | 79.8% |
| Self-Employed (Incorporated) | 0 | 0.0% |
| Self-Employed (Not Incorporated) | 45 | 9.0% |
| Not-for-profit Organizations | 18 | 3.6% |
| Local Government Employees | 0 | 0.0% |
| State Government Employees | 38 | 7.6% |
| Federal Government Employees | 0 | 0.0% |
| Unpaid Family Workers | 0 | 0.0% |
| Total | 500 | 100.0% |
Employment Status by Age in Rincon
According to the labor force statistics for Rincon, out of the total population over 16 years of age (1,355), 42.5% or 576 individuals are in the labor force, with 13.2% or 76 of them unemployed. The age group with the highest labor force participation rate is 45 to 54 years, with 85.7% or 251 individuals in the labor force. Within the labor force, the 45 to 54 years age range has the highest percentage of unemployed individuals, with 30.3% or 76 of them being unemployed.
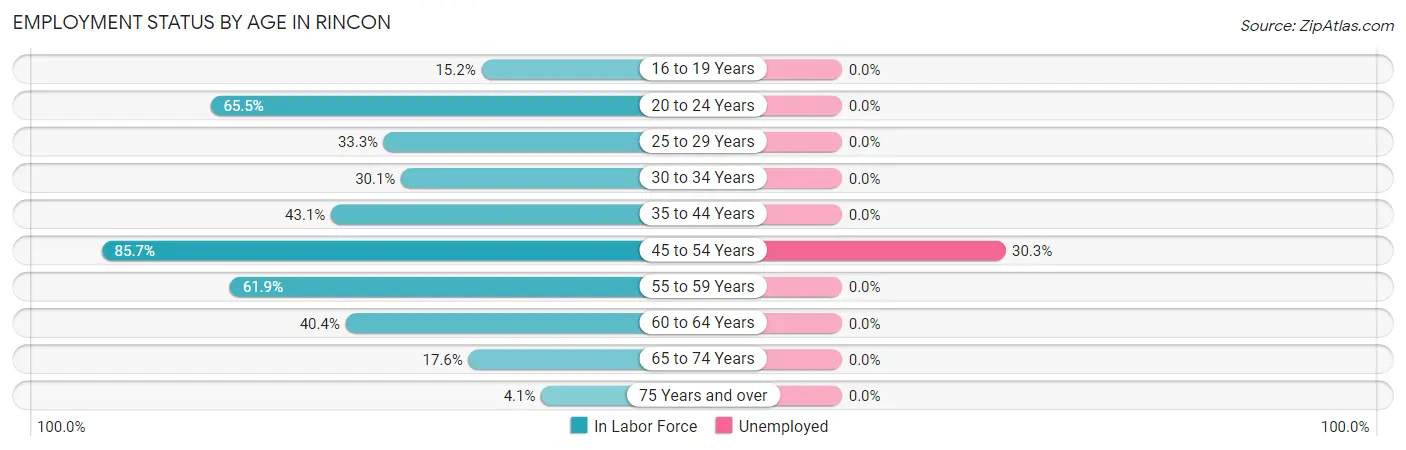
| Age Bracket | In Labor Force | Unemployed |
| 16 to 19 Years | 7 (15.2%) | 0 (0.0%) |
| 20 to 24 Years | 74 (65.5%) | 0 (0.0%) |
| 25 to 29 Years | 22 (33.3%) | 0 (0.0%) |
| 30 to 34 Years | 34 (30.1%) | 0 (0.0%) |
| 35 to 44 Years | 25 (43.1%) | 0 (0.0%) |
| 45 to 54 Years | 251 (85.7%) | 76 (30.3%) |
| 55 to 59 Years | 112 (61.9%) | 0 (0.0%) |
| 60 to 64 Years | 21 (40.4%) | 0 (0.0%) |
| 65 to 74 Years | 16 (17.6%) | 0 (0.0%) |
| 75 Years and over | 14 (4.1%) | 0 (0.0%) |
| Total | 576 (42.5%) | 76 (13.2%) |
Employment Status by Educational Attainment in Rincon
According to labor force statistics for Rincon, 60.9% of individuals (465) out of the total population between 25 and 64 years of age (763) are in the labor force, with 16.3% or 76 of them being unemployed. The group with the highest labor force participation rate are those with the educational attainment of less than high school, with 100.0% or 82 individuals in the labor force. Within the labor force, individuals with college / associate degree education have the highest percentage of unemployment, with 45.8% or 76 of them being unemployed.
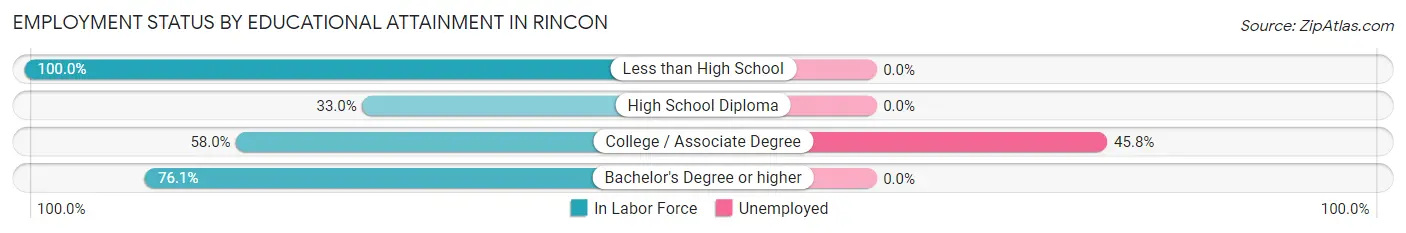
| Educational Attainment | In Labor Force | Unemployed |
| Less than High School | 82 (100.0%) | 0 (0.0%) |
| High School Diploma | 64 (33.0%) | 0 (0.0%) |
| College / Associate Degree | 166 (58.0%) | 131 (45.8%) |
| Bachelor's Degree or higher | 153 (76.1%) | 0 (0.0%) |
| Total | 465 (60.9%) | 124 (16.3%) |
Employment Occupations by Sex in Rincon
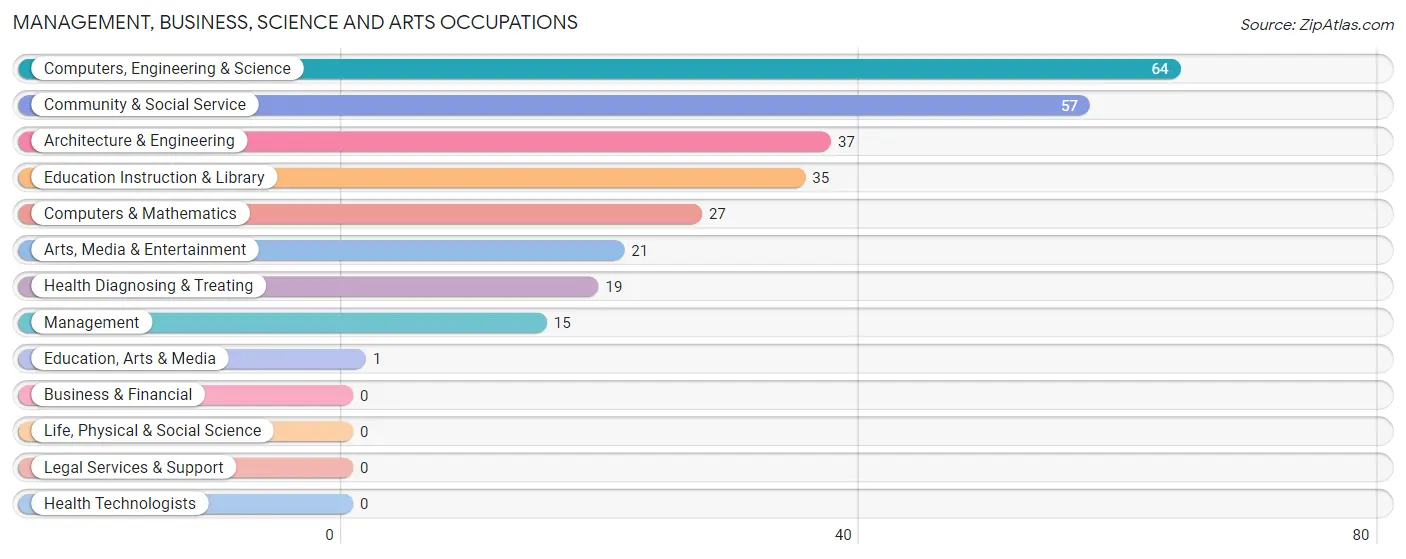
Management, Business, Science and Arts Occupations
The most common Management, Business, Science and Arts occupations in Rincon are Computers, Engineering & Science (64 | 12.8%), Community & Social Service (57 | 11.4%), Architecture & Engineering (37 | 7.4%), Education Instruction & Library (35 | 7.0%), and Computers & Mathematics (27 | 5.4%).
Management, Business, Science and Arts Occupations by Sex
Within the Management, Business, Science and Arts occupations in Rincon, the most male-oriented occupations are Computers & Mathematics (100.0%), Education, Arts & Media (100.0%), and Arts, Media & Entertainment (100.0%), while the most female-oriented occupations are Management (100.0%), Architecture & Engineering (46.0%), and Education Instruction & Library (31.4%).
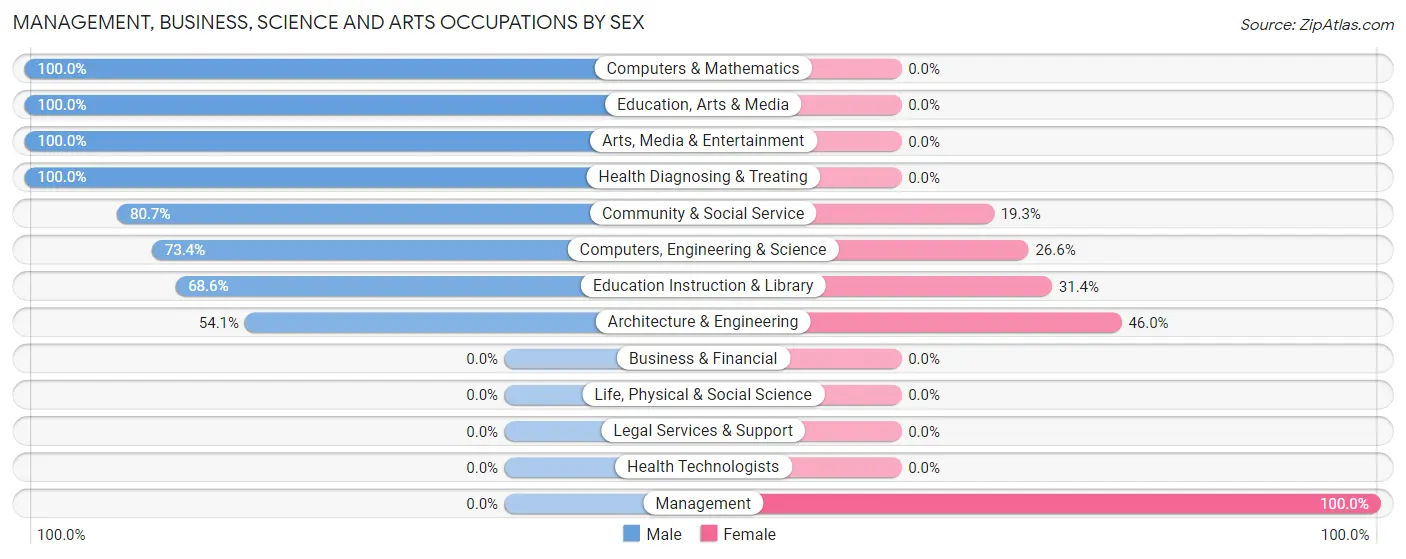
| Occupation | Male | Female |
| Management | 0 (0.0%) | 15 (100.0%) |
| Business & Financial | 0 (0.0%) | 0 (0.0%) |
| Computers, Engineering & Science | 47 (73.4%) | 17 (26.6%) |
| Computers & Mathematics | 27 (100.0%) | 0 (0.0%) |
| Architecture & Engineering | 20 (54.0%) | 17 (46.0%) |
| Life, Physical & Social Science | 0 (0.0%) | 0 (0.0%) |
| Community & Social Service | 46 (80.7%) | 11 (19.3%) |
| Education, Arts & Media | 1 (100.0%) | 0 (0.0%) |
| Legal Services & Support | 0 (0.0%) | 0 (0.0%) |
| Education Instruction & Library | 24 (68.6%) | 11 (31.4%) |
| Arts, Media & Entertainment | 21 (100.0%) | 0 (0.0%) |
| Health Diagnosing & Treating | 19 (100.0%) | 0 (0.0%) |
| Health Technologists | 0 (0.0%) | 0 (0.0%) |
| Total (Category) | 112 (72.3%) | 43 (27.7%) |
| Total (Overall) | 308 (61.6%) | 192 (38.4%) |
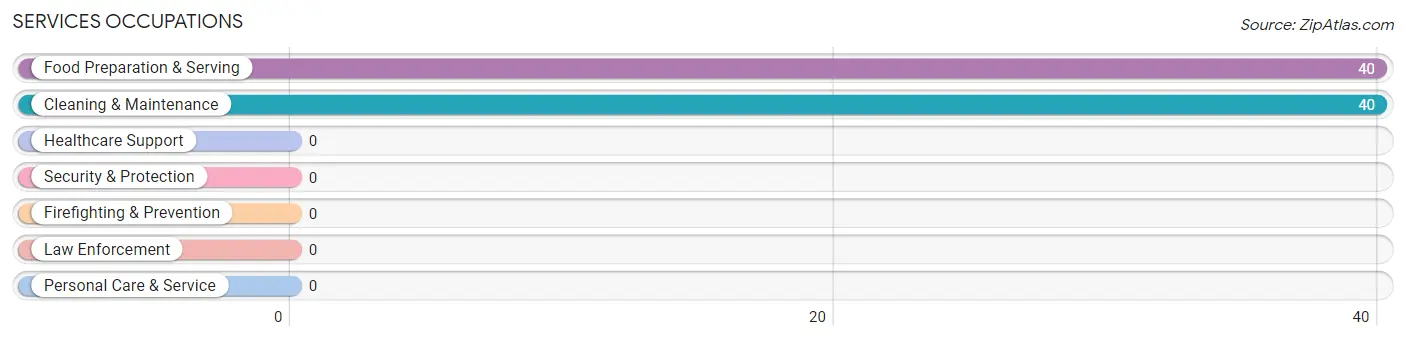
Services Occupations
The most common Services occupations in Rincon are Food Preparation & Serving (40 | 8.0%), and Cleaning & Maintenance (40 | 8.0%).
Services Occupations by Sex
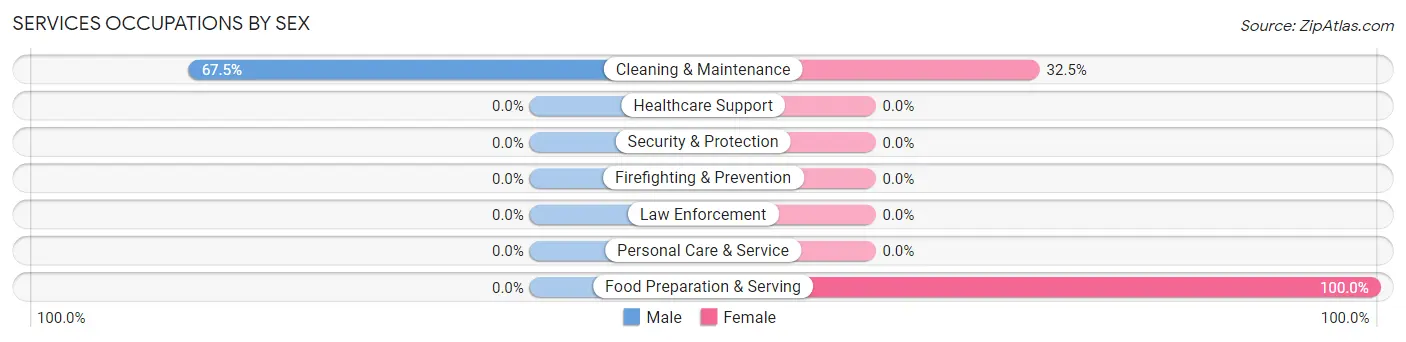
| Occupation | Male | Female |
| Healthcare Support | 0 (0.0%) | 0 (0.0%) |
| Security & Protection | 0 (0.0%) | 0 (0.0%) |
| Firefighting & Prevention | 0 (0.0%) | 0 (0.0%) |
| Law Enforcement | 0 (0.0%) | 0 (0.0%) |
| Food Preparation & Serving | 0 (0.0%) | 40 (100.0%) |
| Cleaning & Maintenance | 27 (67.5%) | 13 (32.5%) |
| Personal Care & Service | 0 (0.0%) | 0 (0.0%) |
| Total (Category) | 27 (33.8%) | 53 (66.2%) |
| Total (Overall) | 308 (61.6%) | 192 (38.4%) |
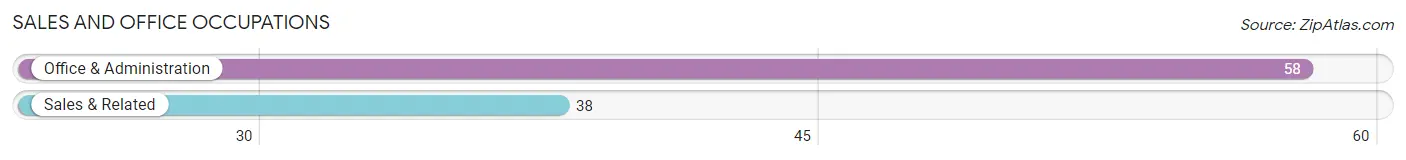
Sales and Office Occupations
The most common Sales and Office occupations in Rincon are Office & Administration (58 | 11.6%), and Sales & Related (38 | 7.6%).
Sales and Office Occupations by Sex
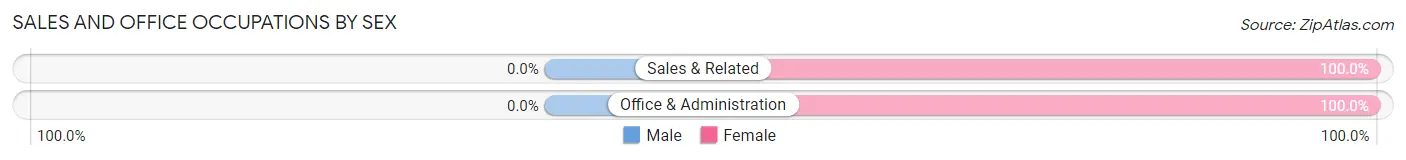
| Occupation | Male | Female |
| Sales & Related | 0 (0.0%) | 38 (100.0%) |
| Office & Administration | 0 (0.0%) | 58 (100.0%) |
| Total (Category) | 0 (0.0%) | 96 (100.0%) |
| Total (Overall) | 308 (61.6%) | 192 (38.4%) |
Natural Resources, Construction and Maintenance Occupations
The most common Natural Resources, Construction and Maintenance occupations in Rincon are , and Construction & Extraction (39 | 7.8%).
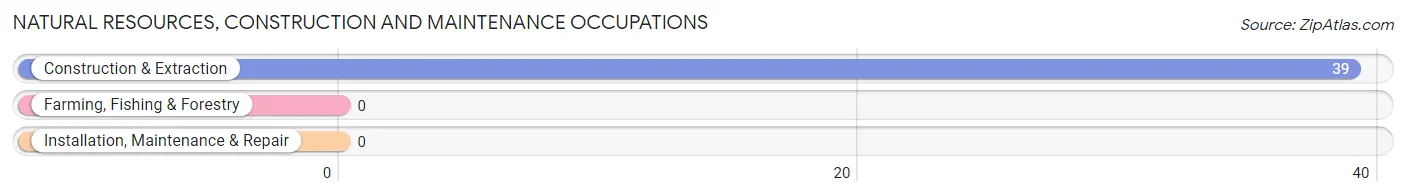
Natural Resources, Construction and Maintenance Occupations by Sex
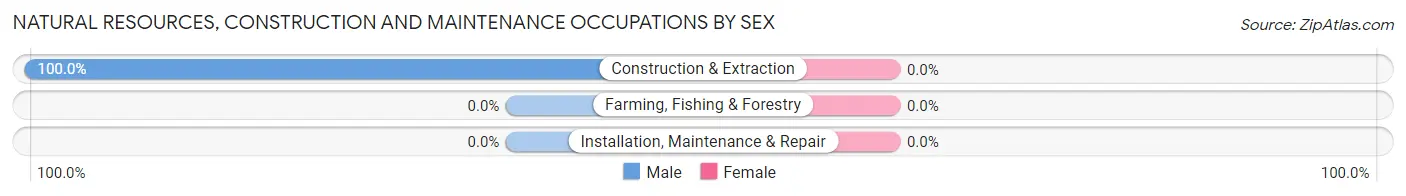
| Occupation | Male | Female |
| Farming, Fishing & Forestry | 0 (0.0%) | 0 (0.0%) |
| Construction & Extraction | 39 (100.0%) | 0 (0.0%) |
| Installation, Maintenance & Repair | 0 (0.0%) | 0 (0.0%) |
| Total (Category) | 39 (100.0%) | 0 (0.0%) |
| Total (Overall) | 308 (61.6%) | 192 (38.4%) |
Production, Transportation and Moving Occupations
The most common Production, Transportation and Moving occupations in Rincon are , and Production (130 | 26.0%).
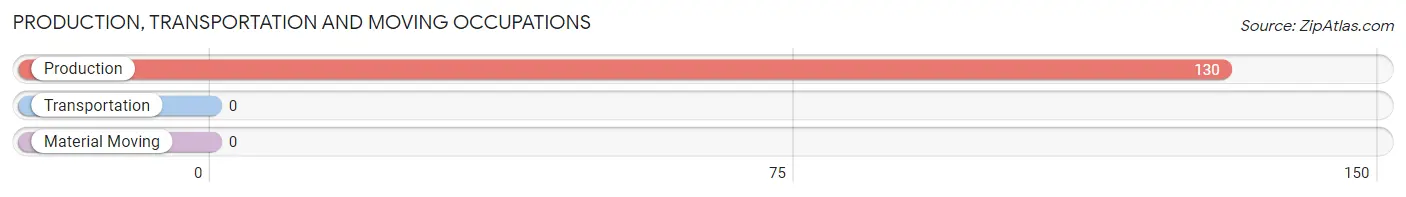
Production, Transportation and Moving Occupations by Sex
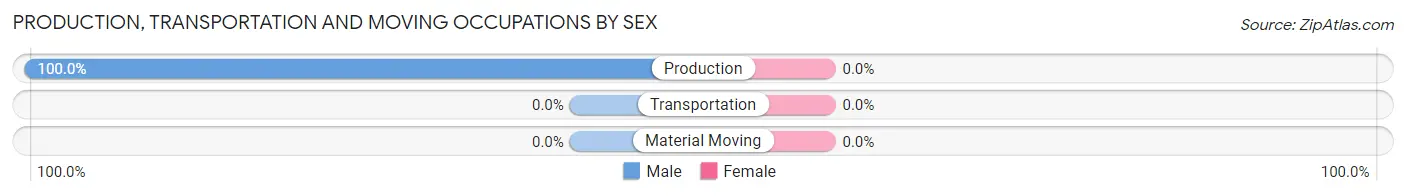
| Occupation | Male | Female |
| Production | 130 (100.0%) | 0 (0.0%) |
| Transportation | 0 (0.0%) | 0 (0.0%) |
| Material Moving | 0 (0.0%) | 0 (0.0%) |
| Total (Category) | 130 (100.0%) | 0 (0.0%) |
| Total (Overall) | 308 (61.6%) | 192 (38.4%) |
Employment Industries by Sex in Rincon
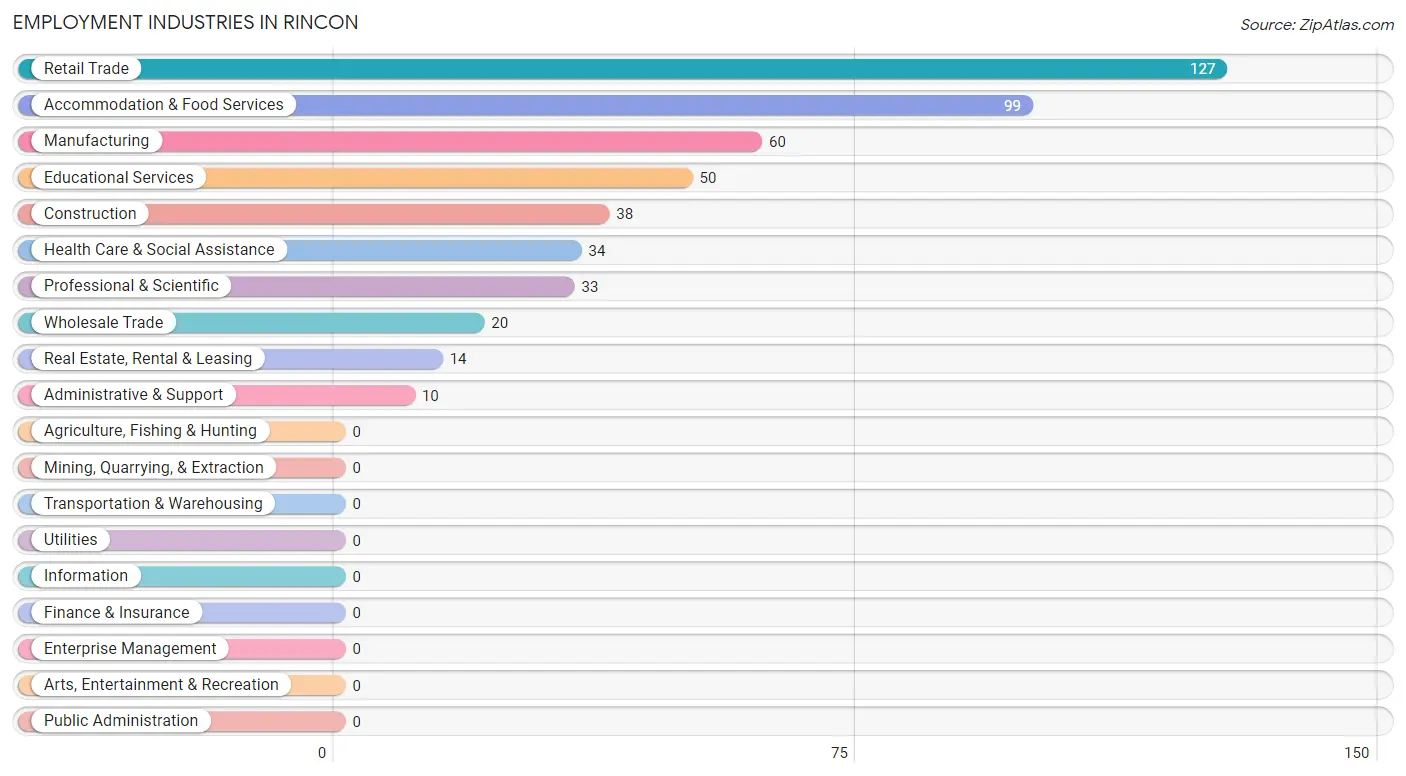
Employment Industries in Rincon
The major employment industries in Rincon include Retail Trade (127 | 25.4%), Accommodation & Food Services (99 | 19.8%), Manufacturing (60 | 12.0%), Educational Services (50 | 10.0%), and Construction (38 | 7.6%).
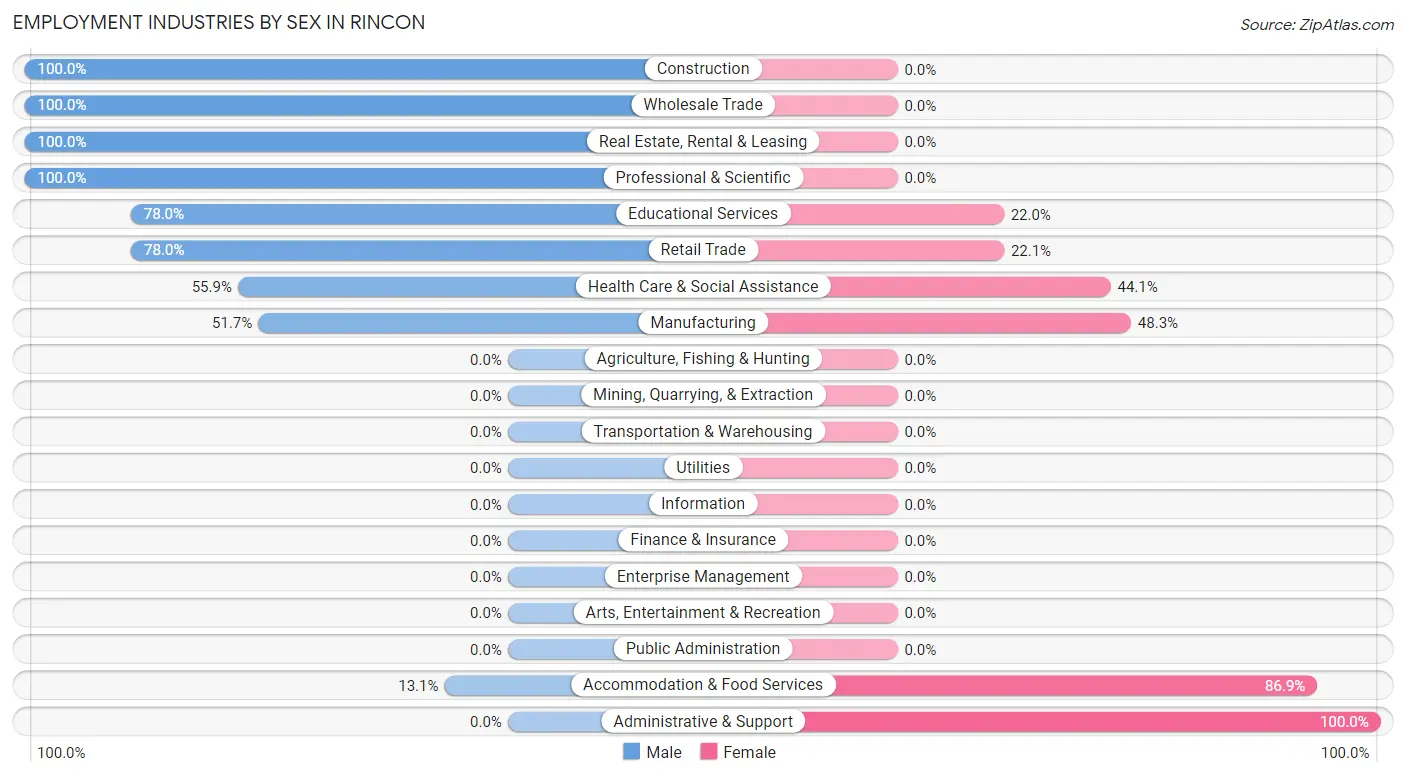
Employment Industries by Sex in Rincon
The Rincon industries that see more men than women are Construction (100.0%), Wholesale Trade (100.0%), and Real Estate, Rental & Leasing (100.0%), whereas the industries that tend to have a higher number of women are Administrative & Support (100.0%), Accommodation & Food Services (86.9%), and Manufacturing (48.3%).
| Industry | Male | Female |
| Agriculture, Fishing & Hunting | 0 (0.0%) | 0 (0.0%) |
| Mining, Quarrying, & Extraction | 0 (0.0%) | 0 (0.0%) |
| Construction | 38 (100.0%) | 0 (0.0%) |
| Manufacturing | 31 (51.7%) | 29 (48.3%) |
| Wholesale Trade | 20 (100.0%) | 0 (0.0%) |
| Retail Trade | 99 (77.9%) | 28 (22.1%) |
| Transportation & Warehousing | 0 (0.0%) | 0 (0.0%) |
| Utilities | 0 (0.0%) | 0 (0.0%) |
| Information | 0 (0.0%) | 0 (0.0%) |
| Finance & Insurance | 0 (0.0%) | 0 (0.0%) |
| Real Estate, Rental & Leasing | 14 (100.0%) | 0 (0.0%) |
| Professional & Scientific | 33 (100.0%) | 0 (0.0%) |
| Enterprise Management | 0 (0.0%) | 0 (0.0%) |
| Administrative & Support | 0 (0.0%) | 10 (100.0%) |
| Educational Services | 39 (78.0%) | 11 (22.0%) |
| Health Care & Social Assistance | 19 (55.9%) | 15 (44.1%) |
| Arts, Entertainment & Recreation | 0 (0.0%) | 0 (0.0%) |
| Accommodation & Food Services | 13 (13.1%) | 86 (86.9%) |
| Public Administration | 0 (0.0%) | 0 (0.0%) |
| Total | 308 (61.6%) | 192 (38.4%) |
Education in Rincon
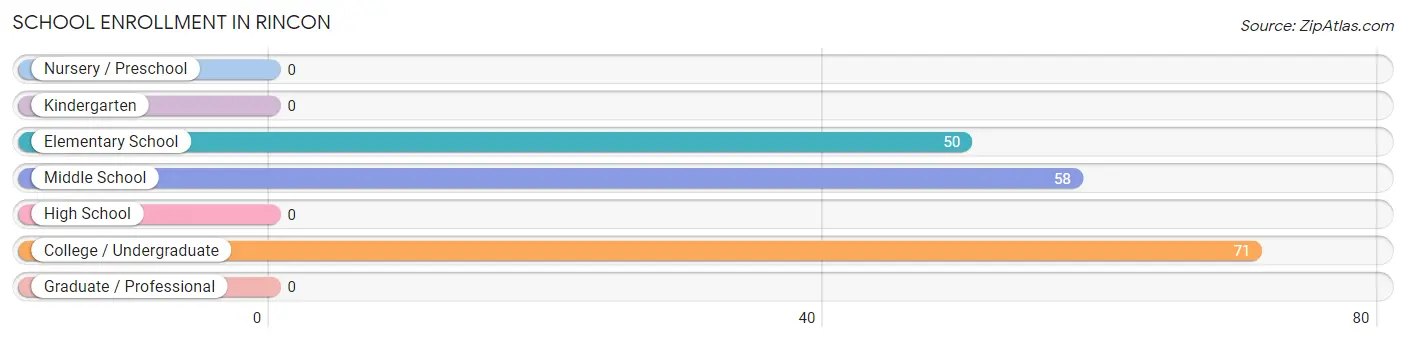
School Enrollment in Rincon
The most common levels of schooling among the 179 students in Rincon are college / undergraduate (71 | 39.7%), middle school (58 | 32.4%), and elementary school (50 | 27.9%).
| School Level | # Students | % Students |
| Nursery / Preschool | 0 | 0.0% |
| Kindergarten | 0 | 0.0% |
| Elementary School | 50 | 27.9% |
| Middle School | 58 | 32.4% |
| High School | 0 | 0.0% |
| College / Undergraduate | 71 | 39.7% |
| Graduate / Professional | 0 | 0.0% |
| Total | 179 | 100.0% |
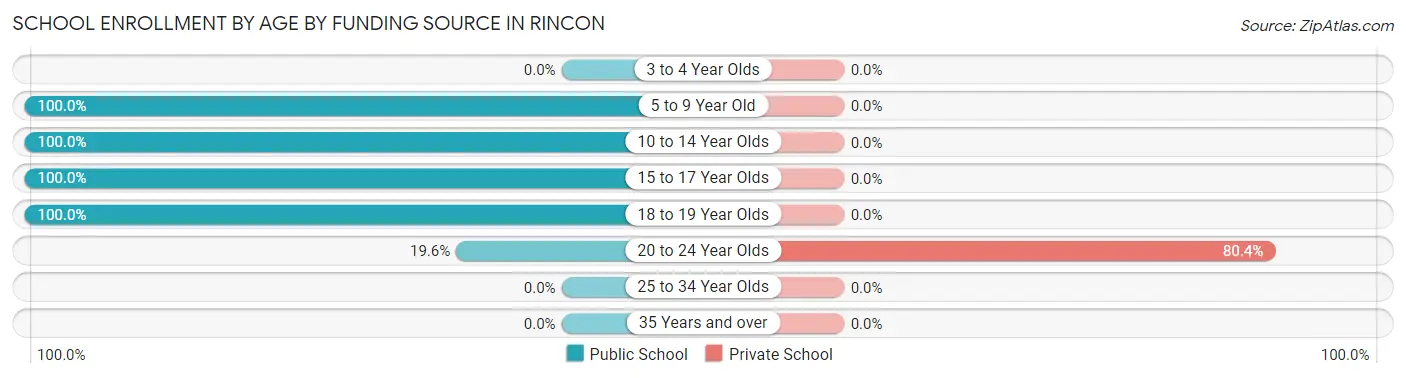
School Enrollment by Age by Funding Source in Rincon
Out of a total of 179 students who are enrolled in schools in Rincon, 45 (25.1%) attend a private institution, while the remaining 134 (74.9%) are enrolled in public schools. The age group of 20 to 24 year olds has the highest likelihood of being enrolled in private schools, with 45 (80.4% in the age bracket) enrolled. Conversely, the age group of 5 to 9 year old has the lowest likelihood of being enrolled in a private school, with 50 (100.0% in the age bracket) attending a public institution.
| Age Bracket | Public School | Private School |
| 3 to 4 Year Olds | 0 (0.0%) | 0 (0.0%) |
| 5 to 9 Year Old | 50 (100.0%) | 0 (0.0%) |
| 10 to 14 Year Olds | 37 (100.0%) | 0 (0.0%) |
| 15 to 17 Year Olds | 21 (100.0%) | 0 (0.0%) |
| 18 to 19 Year Olds | 15 (100.0%) | 0 (0.0%) |
| 20 to 24 Year Olds | 11 (19.6%) | 45 (80.4%) |
| 25 to 34 Year Olds | 0 (0.0%) | 0 (0.0%) |
| 35 Years and over | 0 (0.0%) | 0 (0.0%) |
| Total | 134 (74.9%) | 45 (25.1%) |
Educational Attainment by Field of Study in Rincon
Business (85 | 22.7%), education (85 | 22.7%), engineering (38 | 10.2%), science & technology (38 | 10.2%), and computers & mathematics (37 | 9.9%) are the most common fields of study among 374 individuals in Rincon who have obtained a bachelor's degree or higher.
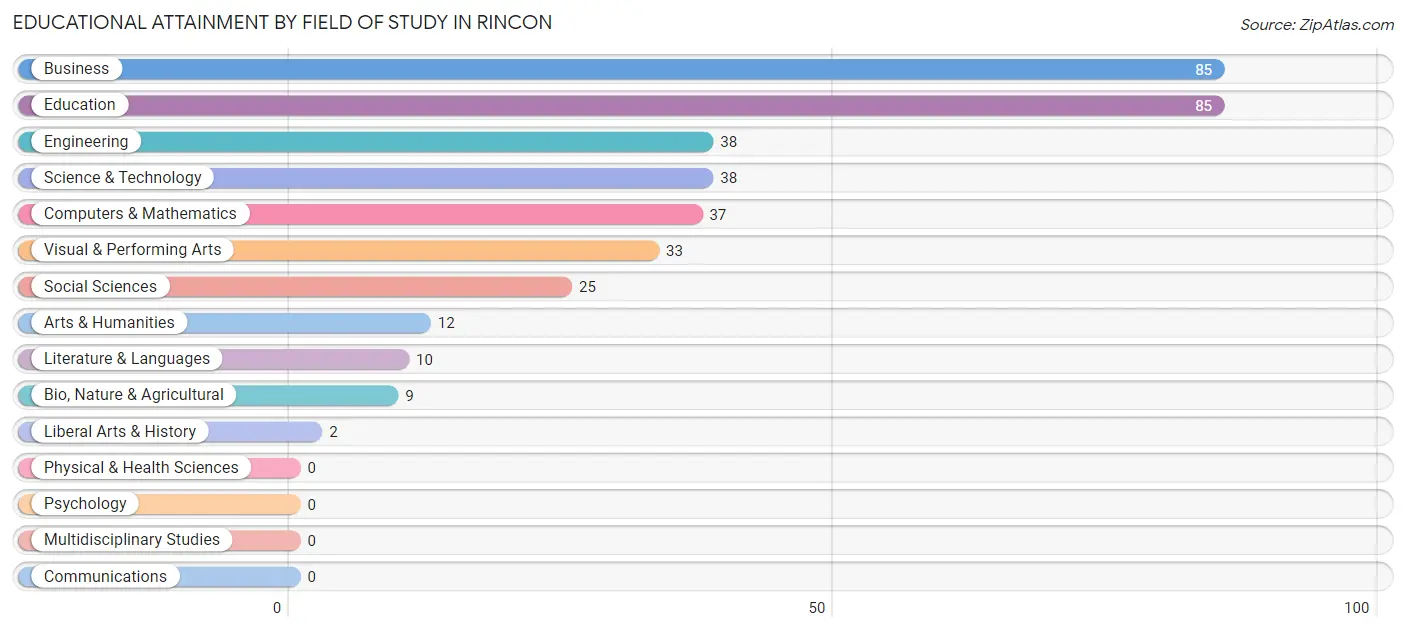
| Field of Study | # Graduates | % Graduates |
| Computers & Mathematics | 37 | 9.9% |
| Bio, Nature & Agricultural | 9 | 2.4% |
| Physical & Health Sciences | 0 | 0.0% |
| Psychology | 0 | 0.0% |
| Social Sciences | 25 | 6.7% |
| Engineering | 38 | 10.2% |
| Multidisciplinary Studies | 0 | 0.0% |
| Science & Technology | 38 | 10.2% |
| Business | 85 | 22.7% |
| Education | 85 | 22.7% |
| Literature & Languages | 10 | 2.7% |
| Liberal Arts & History | 2 | 0.5% |
| Visual & Performing Arts | 33 | 8.8% |
| Communications | 0 | 0.0% |
| Arts & Humanities | 12 | 3.2% |
| Total | 374 | 100.0% |
Transportation & Commute in Rincon
Vehicle Availability by Sex in Rincon
The most prevalent vehicle ownership categories in Rincon are males with 2 vehicles (123, accounting for 40.3%) and females with 2 vehicles (98, making up 64.4%).
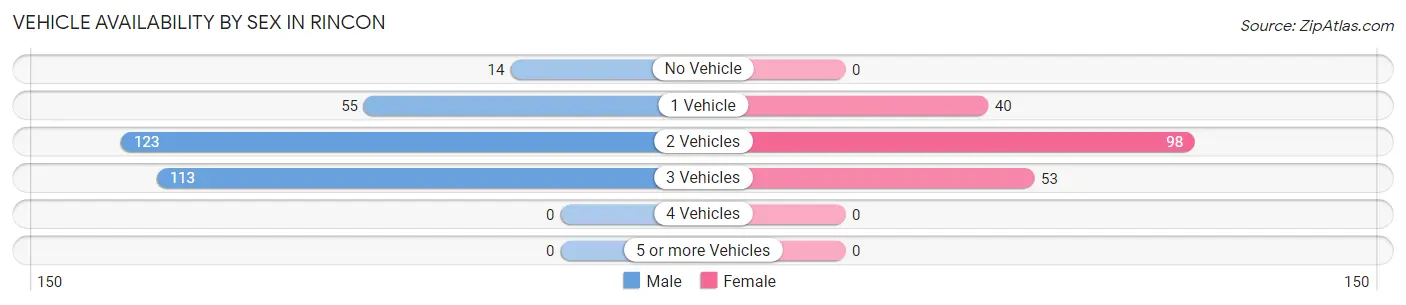
| Vehicles Available | Male | Female |
| No Vehicle | 14 (4.6%) | 0 (0.0%) |
| 1 Vehicle | 55 (18.0%) | 40 (20.9%) |
| 2 Vehicles | 123 (40.3%) | 98 (51.3%) |
| 3 Vehicles | 113 (37.0%) | 53 (27.8%) |
| 4 Vehicles | 0 (0.0%) | 0 (0.0%) |
| 5 or more Vehicles | 0 (0.0%) | 0 (0.0%) |
| Total | 305 (100.0%) | 191 (100.0%) |
Commute Time in Rincon
The most frequently occuring commute durations in Rincon are 5 to 9 minutes (152 commuters, 36.1%), 15 to 19 minutes (103 commuters, 24.5%), and 35 to 39 minutes (41 commuters, 9.7%).
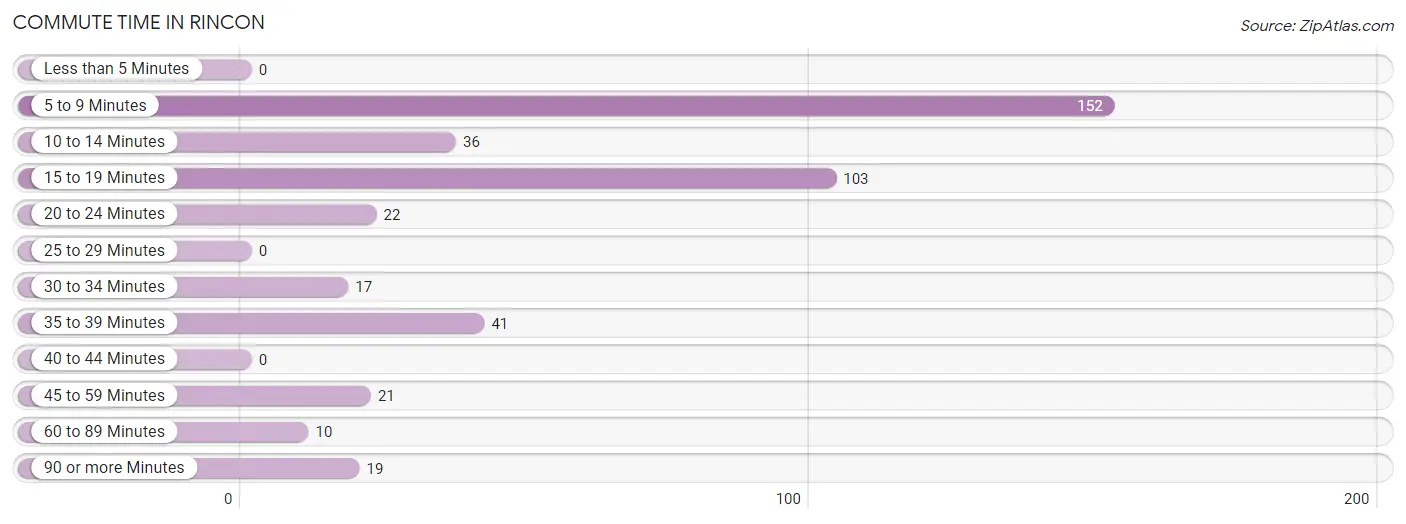
| Commute Time | # Commuters | % Commuters |
| Less than 5 Minutes | 0 | 0.0% |
| 5 to 9 Minutes | 152 | 36.1% |
| 10 to 14 Minutes | 36 | 8.6% |
| 15 to 19 Minutes | 103 | 24.5% |
| 20 to 24 Minutes | 22 | 5.2% |
| 25 to 29 Minutes | 0 | 0.0% |
| 30 to 34 Minutes | 17 | 4.0% |
| 35 to 39 Minutes | 41 | 9.7% |
| 40 to 44 Minutes | 0 | 0.0% |
| 45 to 59 Minutes | 21 | 5.0% |
| 60 to 89 Minutes | 10 | 2.4% |
| 90 or more Minutes | 19 | 4.5% |
Commute Time by Sex in Rincon
The most common commute times in Rincon are 15 to 19 minutes (102 commuters, 42.7%) for males and 5 to 9 minutes (89 commuters, 48.9%) for females.
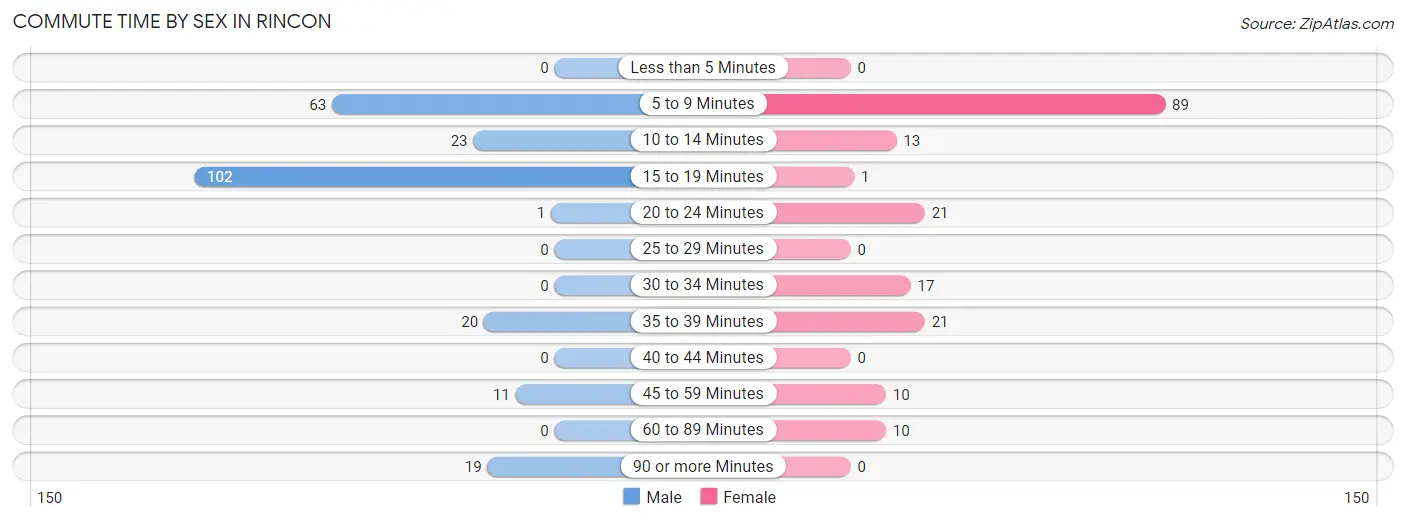
| Commute Time | Male | Female |
| Less than 5 Minutes | 0 (0.0%) | 0 (0.0%) |
| 5 to 9 Minutes | 63 (26.4%) | 89 (48.9%) |
| 10 to 14 Minutes | 23 (9.6%) | 13 (7.1%) |
| 15 to 19 Minutes | 102 (42.7%) | 1 (0.5%) |
| 20 to 24 Minutes | 1 (0.4%) | 21 (11.5%) |
| 25 to 29 Minutes | 0 (0.0%) | 0 (0.0%) |
| 30 to 34 Minutes | 0 (0.0%) | 17 (9.3%) |
| 35 to 39 Minutes | 20 (8.4%) | 21 (11.5%) |
| 40 to 44 Minutes | 0 (0.0%) | 0 (0.0%) |
| 45 to 59 Minutes | 11 (4.6%) | 10 (5.5%) |
| 60 to 89 Minutes | 0 (0.0%) | 10 (5.5%) |
| 90 or more Minutes | 19 (8.0%) | 0 (0.0%) |
Time of Departure to Work by Sex in Rincon
The most frequent times of departure to work in Rincon are 6:00 AM to 6:29 AM (100, 41.8%) for males and 7:00 AM to 7:29 AM (93, 51.1%) for females.
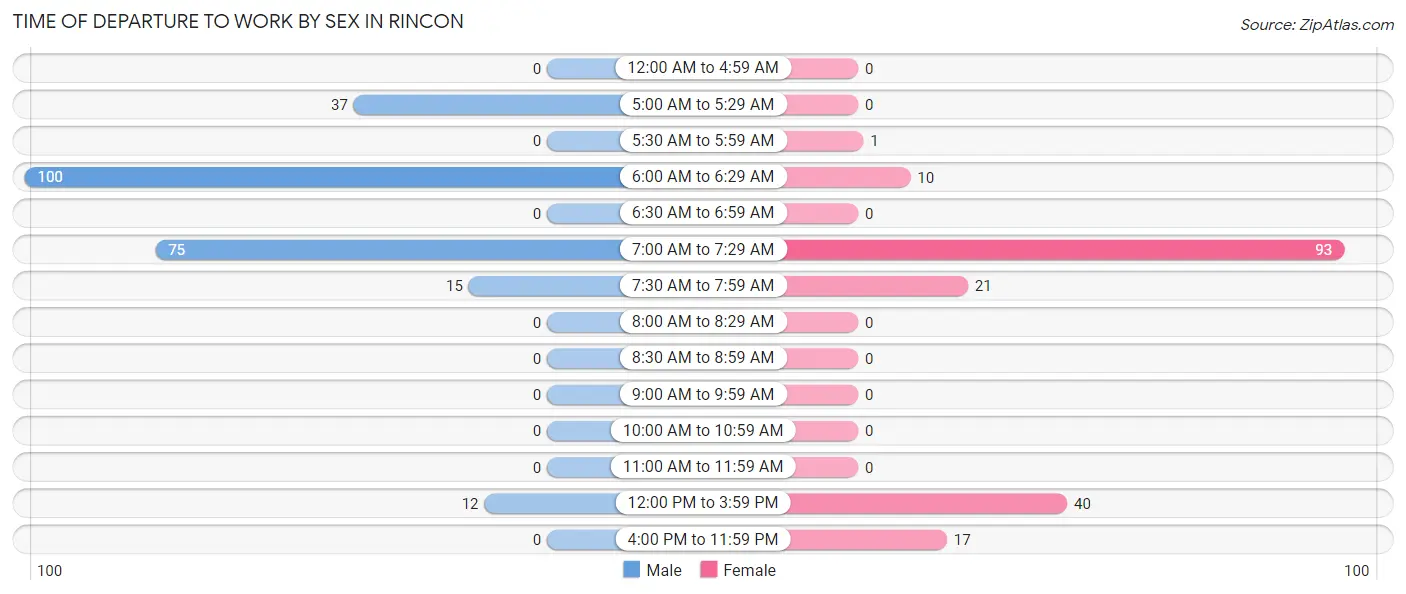
| Time of Departure | Male | Female |
| 12:00 AM to 4:59 AM | 0 (0.0%) | 0 (0.0%) |
| 5:00 AM to 5:29 AM | 37 (15.5%) | 0 (0.0%) |
| 5:30 AM to 5:59 AM | 0 (0.0%) | 1 (0.5%) |
| 6:00 AM to 6:29 AM | 100 (41.8%) | 10 (5.5%) |
| 6:30 AM to 6:59 AM | 0 (0.0%) | 0 (0.0%) |
| 7:00 AM to 7:29 AM | 75 (31.4%) | 93 (51.1%) |
| 7:30 AM to 7:59 AM | 15 (6.3%) | 21 (11.5%) |
| 8:00 AM to 8:29 AM | 0 (0.0%) | 0 (0.0%) |
| 8:30 AM to 8:59 AM | 0 (0.0%) | 0 (0.0%) |
| 9:00 AM to 9:59 AM | 0 (0.0%) | 0 (0.0%) |
| 10:00 AM to 10:59 AM | 0 (0.0%) | 0 (0.0%) |
| 11:00 AM to 11:59 AM | 0 (0.0%) | 0 (0.0%) |
| 12:00 PM to 3:59 PM | 12 (5.0%) | 40 (22.0%) |
| 4:00 PM to 11:59 PM | 0 (0.0%) | 17 (9.3%) |
| Total | 239 (100.0%) | 182 (100.0%) |
Housing Occupancy in Rincon
Occupancy by Ownership in Rincon
Of the total 654 dwellings in Rincon, owner-occupied units account for 327 (50.0%), while renter-occupied units make up 327 (50.0%).
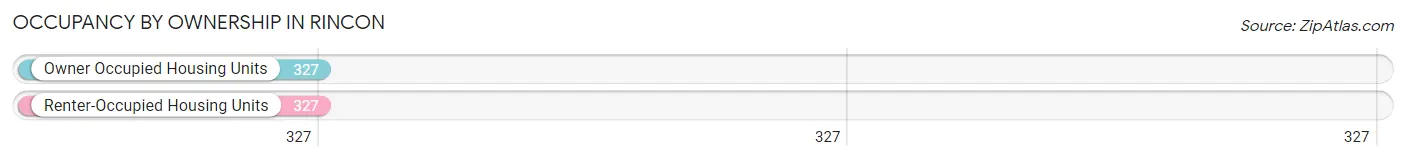
| Occupancy | # Housing Units | % Housing Units |
| Owner Occupied Housing Units | 327 | 50.0% |
| Renter-Occupied Housing Units | 327 | 50.0% |
| Total Occupied Housing Units | 654 | 100.0% |
Occupancy by Household Size in Rincon
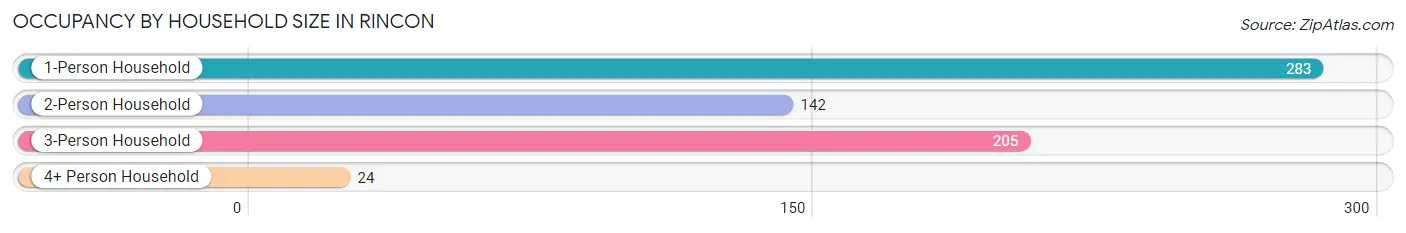
| Household Size | # Housing Units | % Housing Units |
| 1-Person Household | 283 | 43.3% |
| 2-Person Household | 142 | 21.7% |
| 3-Person Household | 205 | 31.4% |
| 4+ Person Household | 24 | 3.7% |
| Total Housing Units | 654 | 100.0% |
Occupancy by Ownership by Household Size in Rincon
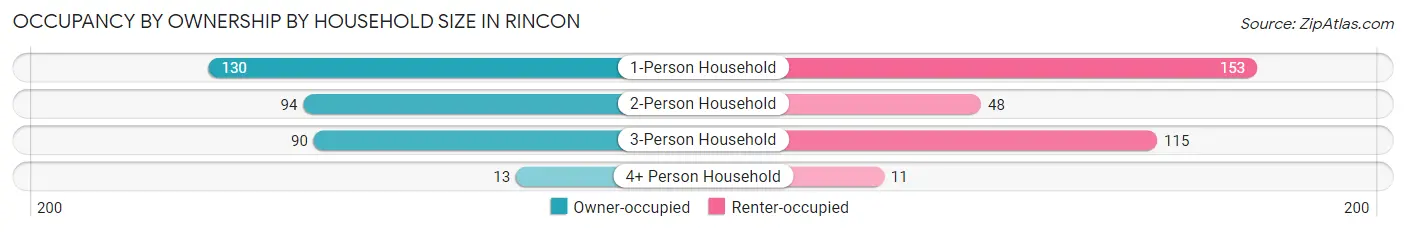
| Household Size | Owner-occupied | Renter-occupied |
| 1-Person Household | 130 (45.9%) | 153 (54.1%) |
| 2-Person Household | 94 (66.2%) | 48 (33.8%) |
| 3-Person Household | 90 (43.9%) | 115 (56.1%) |
| 4+ Person Household | 13 (54.2%) | 11 (45.8%) |
| Total Housing Units | 327 (50.0%) | 327 (50.0%) |
Occupancy by Educational Attainment in Rincon
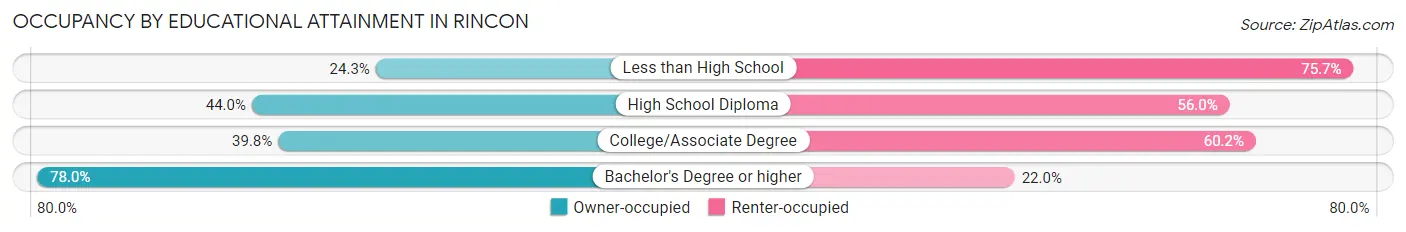
| Household Size | Owner-occupied | Renter-occupied |
| Less than High School | 18 (24.3%) | 56 (75.7%) |
| High School Diploma | 91 (44.0%) | 116 (56.0%) |
| College/Associate Degree | 76 (39.8%) | 115 (60.2%) |
| Bachelor's Degree or higher | 142 (78.0%) | 40 (22.0%) |
Occupancy by Age of Householder in Rincon
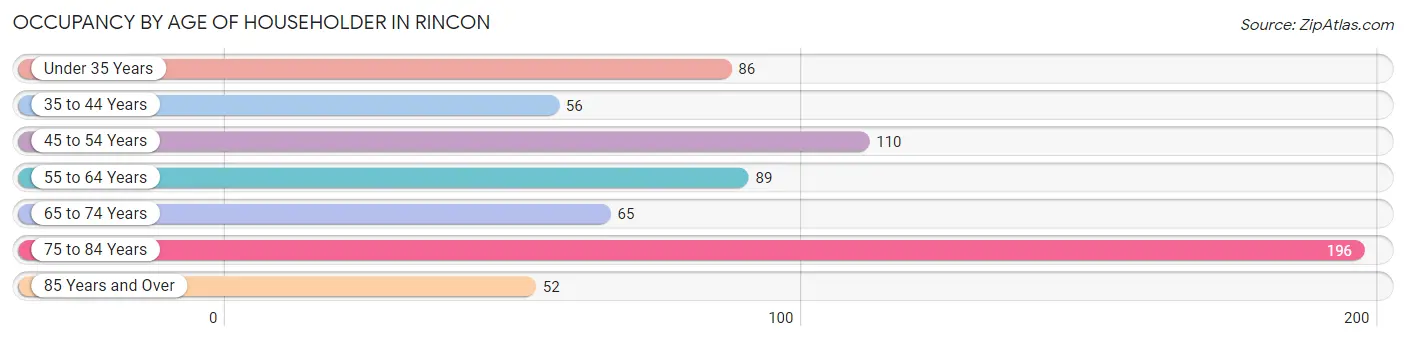
| Age Bracket | # Households | % Households |
| Under 35 Years | 86 | 13.2% |
| 35 to 44 Years | 56 | 8.6% |
| 45 to 54 Years | 110 | 16.8% |
| 55 to 64 Years | 89 | 13.6% |
| 65 to 74 Years | 65 | 9.9% |
| 75 to 84 Years | 196 | 30.0% |
| 85 Years and Over | 52 | 8.0% |
| Total | 654 | 100.0% |
Housing Finances in Rincon
Median Income by Occupancy in Rincon
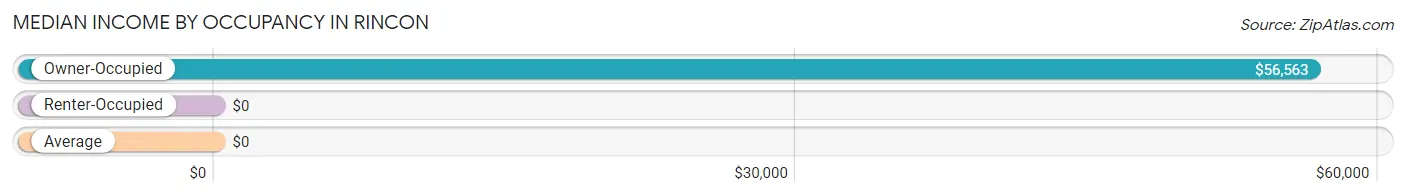
| Occupancy Type | # Households | Median Income |
| Owner-Occupied | 327 (50.0%) | $56,563 |
| Renter-Occupied | 327 (50.0%) | $0 |
| Average | 654 (100.0%) | $0 |
Occupancy by Householder Income Bracket in Rincon
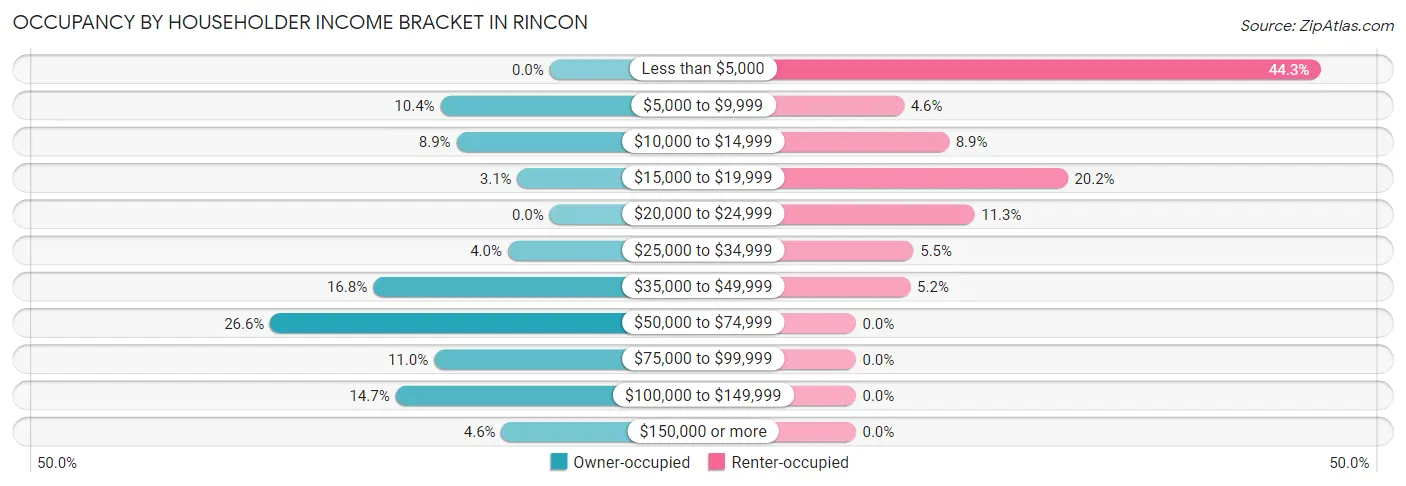
| Income Bracket | Owner-occupied | Renter-occupied |
| Less than $5,000 | 0 (0.0%) | 145 (44.3%) |
| $5,000 to $9,999 | 34 (10.4%) | 15 (4.6%) |
| $10,000 to $14,999 | 29 (8.9%) | 29 (8.9%) |
| $15,000 to $19,999 | 10 (3.1%) | 66 (20.2%) |
| $20,000 to $24,999 | 0 (0.0%) | 37 (11.3%) |
| $25,000 to $34,999 | 13 (4.0%) | 18 (5.5%) |
| $35,000 to $49,999 | 55 (16.8%) | 17 (5.2%) |
| $50,000 to $74,999 | 87 (26.6%) | 0 (0.0%) |
| $75,000 to $99,999 | 36 (11.0%) | 0 (0.0%) |
| $100,000 to $149,999 | 48 (14.7%) | 0 (0.0%) |
| $150,000 or more | 15 (4.6%) | 0 (0.0%) |
| Total | 327 (100.0%) | 327 (100.0%) |
Monthly Housing Cost Tiers in Rincon
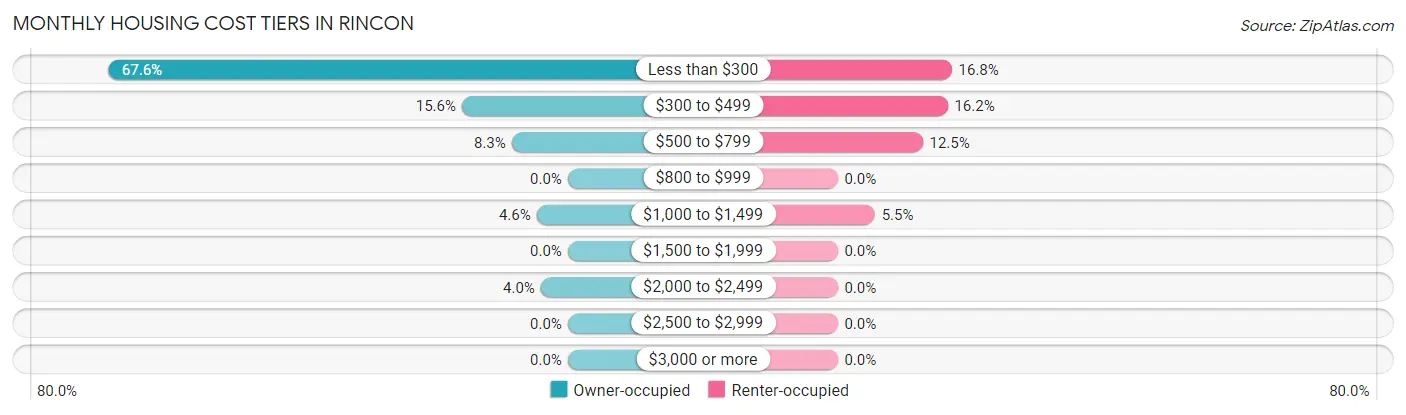
| Monthly Cost | Owner-occupied | Renter-occupied |
| Less than $300 | 221 (67.6%) | 55 (16.8%) |
| $300 to $499 | 51 (15.6%) | 53 (16.2%) |
| $500 to $799 | 27 (8.3%) | 41 (12.5%) |
| $800 to $999 | 0 (0.0%) | 0 (0.0%) |
| $1,000 to $1,499 | 15 (4.6%) | 18 (5.5%) |
| $1,500 to $1,999 | 0 (0.0%) | 0 (0.0%) |
| $2,000 to $2,499 | 13 (4.0%) | 0 (0.0%) |
| $2,500 to $2,999 | 0 (0.0%) | 0 (0.0%) |
| $3,000 or more | 0 (0.0%) | 0 (0.0%) |
| Total | 327 (100.0%) | 327 (100.0%) |
Physical Housing Characteristics in Rincon
Housing Structures in Rincon
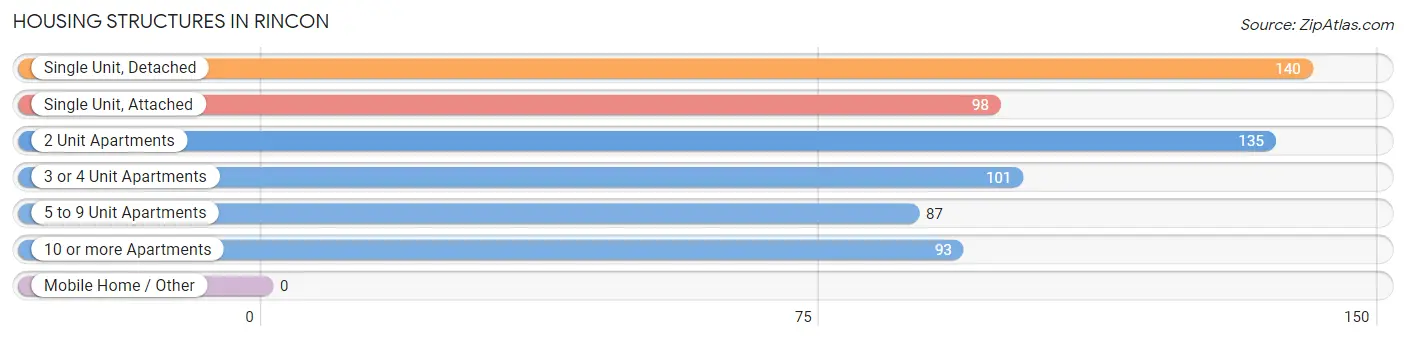
| Structure Type | # Housing Units | % Housing Units |
| Single Unit, Detached | 140 | 21.4% |
| Single Unit, Attached | 98 | 15.0% |
| 2 Unit Apartments | 135 | 20.6% |
| 3 or 4 Unit Apartments | 101 | 15.4% |
| 5 to 9 Unit Apartments | 87 | 13.3% |
| 10 or more Apartments | 93 | 14.2% |
| Mobile Home / Other | 0 | 0.0% |
| Total | 654 | 100.0% |
Housing Structures by Occupancy in Rincon
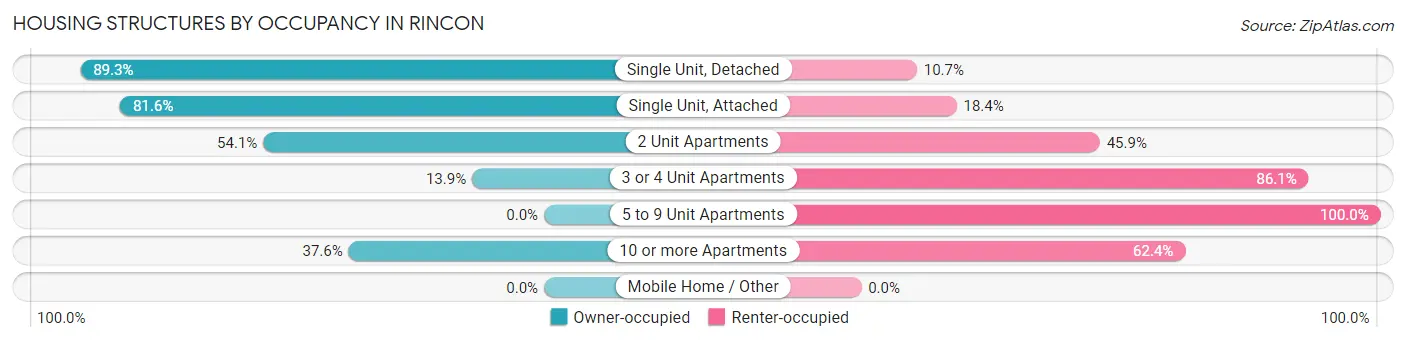
| Structure Type | Owner-occupied | Renter-occupied |
| Single Unit, Detached | 125 (89.3%) | 15 (10.7%) |
| Single Unit, Attached | 80 (81.6%) | 18 (18.4%) |
| 2 Unit Apartments | 73 (54.1%) | 62 (45.9%) |
| 3 or 4 Unit Apartments | 14 (13.9%) | 87 (86.1%) |
| 5 to 9 Unit Apartments | 0 (0.0%) | 87 (100.0%) |
| 10 or more Apartments | 35 (37.6%) | 58 (62.4%) |
| Mobile Home / Other | 0 (0.0%) | 0 (0.0%) |
| Total | 327 (50.0%) | 327 (50.0%) |
Housing Structures by Number of Rooms in Rincon
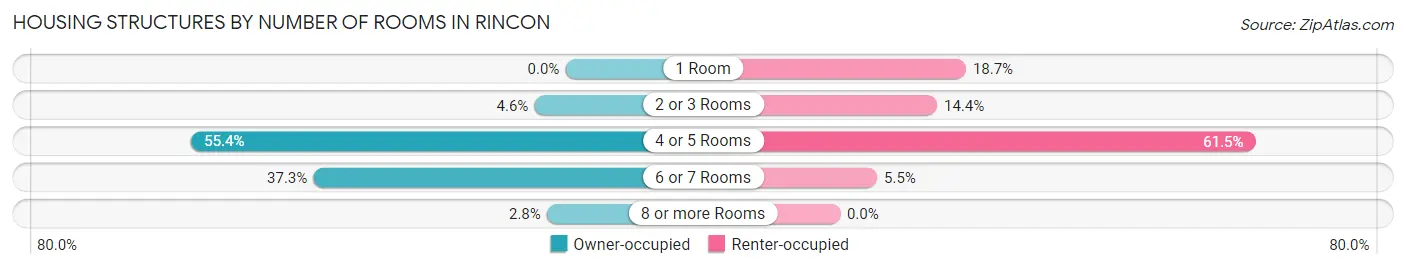
| Number of Rooms | Owner-occupied | Renter-occupied |
| 1 Room | 0 (0.0%) | 61 (18.6%) |
| 2 or 3 Rooms | 15 (4.6%) | 47 (14.4%) |
| 4 or 5 Rooms | 181 (55.3%) | 201 (61.5%) |
| 6 or 7 Rooms | 122 (37.3%) | 18 (5.5%) |
| 8 or more Rooms | 9 (2.8%) | 0 (0.0%) |
| Total | 327 (100.0%) | 327 (100.0%) |
Housing Structure by Heating Type in Rincon
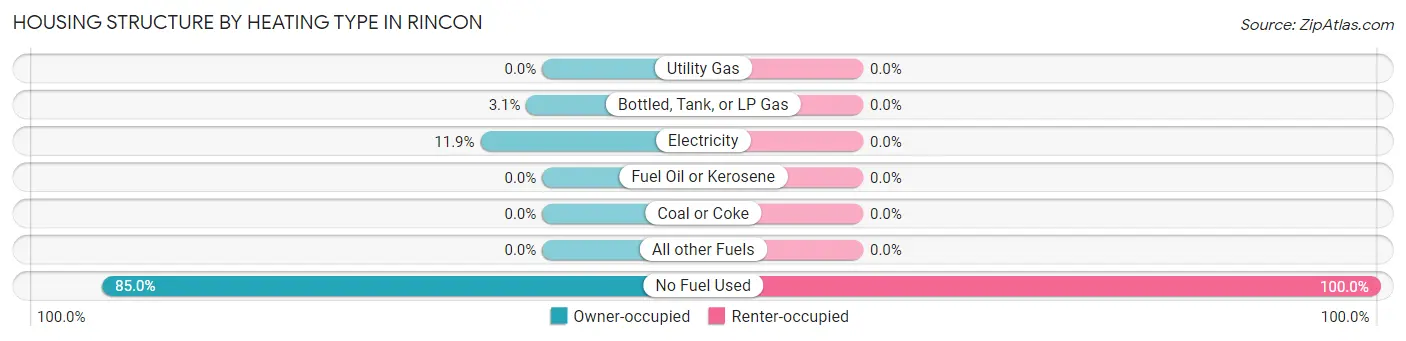
| Heating Type | Owner-occupied | Renter-occupied |
| Utility Gas | 0 (0.0%) | 0 (0.0%) |
| Bottled, Tank, or LP Gas | 10 (3.1%) | 0 (0.0%) |
| Electricity | 39 (11.9%) | 0 (0.0%) |
| Fuel Oil or Kerosene | 0 (0.0%) | 0 (0.0%) |
| Coal or Coke | 0 (0.0%) | 0 (0.0%) |
| All other Fuels | 0 (0.0%) | 0 (0.0%) |
| No Fuel Used | 278 (85.0%) | 327 (100.0%) |
| Total | 327 (100.0%) | 327 (100.0%) |
Household Vehicle Usage in Rincon
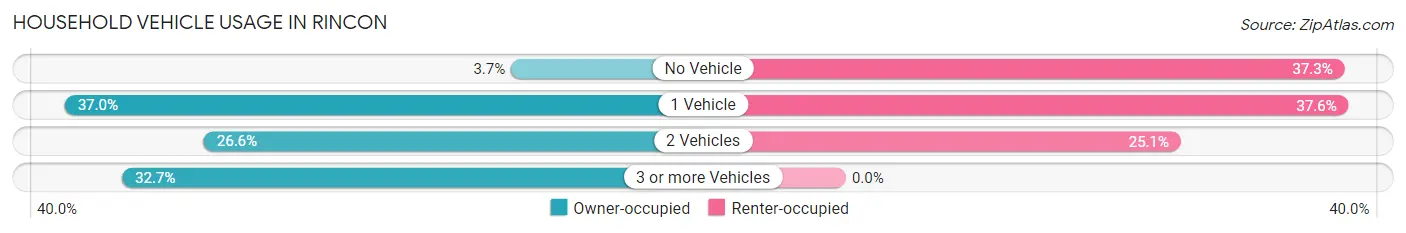
| Vehicles per Household | Owner-occupied | Renter-occupied |
| No Vehicle | 12 (3.7%) | 122 (37.3%) |
| 1 Vehicle | 121 (37.0%) | 123 (37.6%) |
| 2 Vehicles | 87 (26.6%) | 82 (25.1%) |
| 3 or more Vehicles | 107 (32.7%) | 0 (0.0%) |
| Total | 327 (100.0%) | 327 (100.0%) |
Real Estate & Mortgages in Rincon
Real Estate and Mortgage Overview in Rincon
| Characteristic | Without Mortgage | With Mortgage |
| Housing Units | 279 | 48 |
| Median Property Value | $234,000 | $263,300 |
| Median Household Income | $42,321 | $0 |
| Monthly Housing Costs | $215 | $0 |
| Real Estate Taxes | $1,138 | $33 |
Property Value by Mortgage Status in Rincon
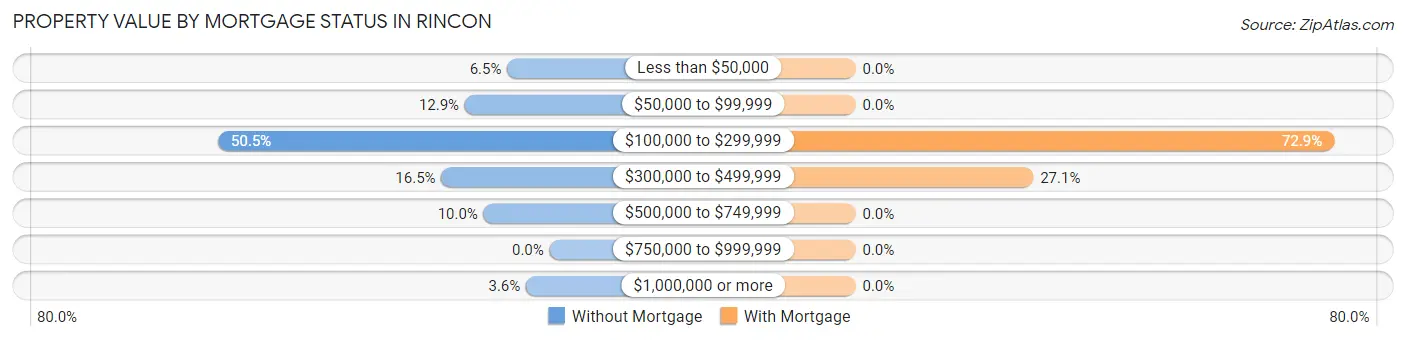
| Property Value | Without Mortgage | With Mortgage |
| Less than $50,000 | 18 (6.5%) | 0 (0.0%) |
| $50,000 to $99,999 | 36 (12.9%) | 0 (0.0%) |
| $100,000 to $299,999 | 141 (50.5%) | 35 (72.9%) |
| $300,000 to $499,999 | 46 (16.5%) | 13 (27.1%) |
| $500,000 to $749,999 | 28 (10.0%) | 0 (0.0%) |
| $750,000 to $999,999 | 0 (0.0%) | 0 (0.0%) |
| $1,000,000 or more | 10 (3.6%) | 0 (0.0%) |
| Total | 279 (100.0%) | 48 (100.0%) |
Household Income by Mortgage Status in Rincon
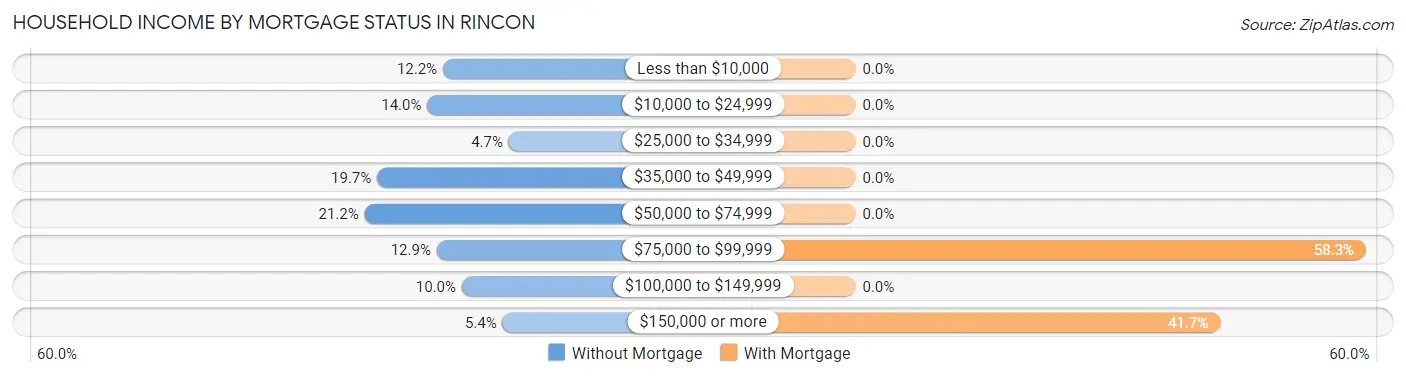
| Household Income | Without Mortgage | With Mortgage |
| Less than $10,000 | 34 (12.2%) | 0 (0.0%) |
| $10,000 to $24,999 | 39 (14.0%) | 0 (0.0%) |
| $25,000 to $34,999 | 13 (4.7%) | 0 (0.0%) |
| $35,000 to $49,999 | 55 (19.7%) | 0 (0.0%) |
| $50,000 to $74,999 | 59 (21.1%) | 0 (0.0%) |
| $75,000 to $99,999 | 36 (12.9%) | 28 (58.3%) |
| $100,000 to $149,999 | 28 (10.0%) | 0 (0.0%) |
| $150,000 or more | 15 (5.4%) | 20 (41.7%) |
| Total | 279 (100.0%) | 48 (100.0%) |
Property Value to Household Income Ratio in Rincon
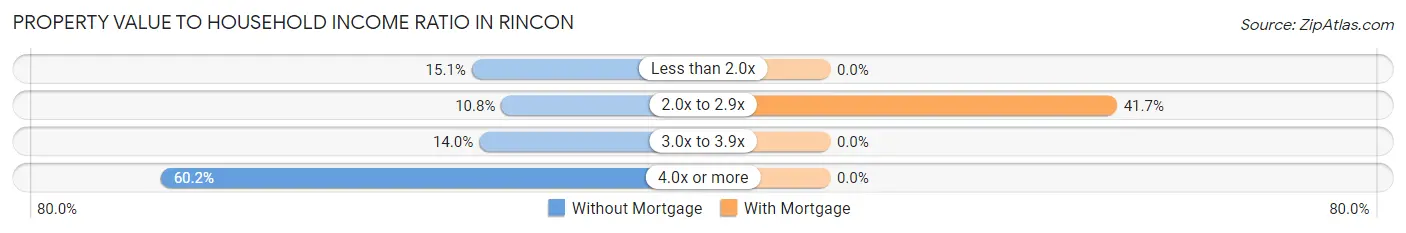
| Value-to-Income Ratio | Without Mortgage | With Mortgage |
| Less than 2.0x | 42 (15.0%) | 0 (0.0%) |
| 2.0x to 2.9x | 30 (10.7%) | 20 (41.7%) |
| 3.0x to 3.9x | 39 (14.0%) | 0 (0.0%) |
| 4.0x or more | 168 (60.2%) | 0 (0.0%) |
| Total | 279 (100.0%) | 48 (100.0%) |
Real Estate Taxes by Mortgage Status in Rincon
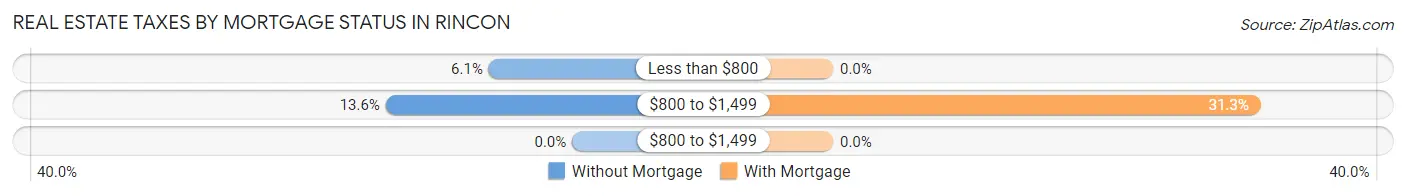
| Property Taxes | Without Mortgage | With Mortgage |
| Less than $800 | 17 (6.1%) | 0 (0.0%) |
| $800 to $1,499 | 38 (13.6%) | 15 (31.2%) |
| $800 to $1,499 | 0 (0.0%) | 0 (0.0%) |
| Total | 279 (100.0%) | 48 (100.0%) |
Health & Disability in Rincon
Health Insurance Coverage by Age in Rincon
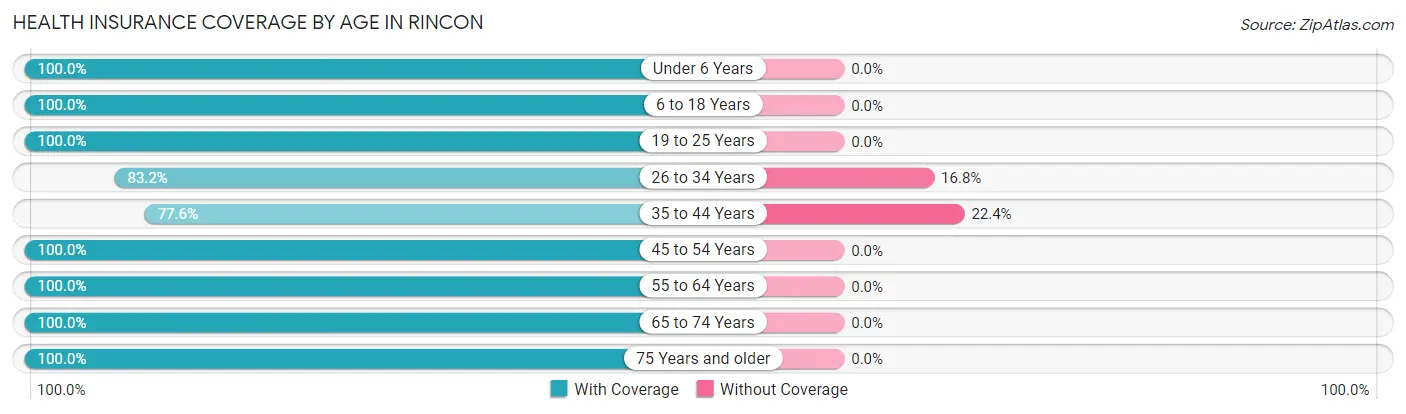
| Age Bracket | With Coverage | Without Coverage |
| Under 6 Years | 46 (100.0%) | 0 (0.0%) |
| 6 to 18 Years | 118 (100.0%) | 0 (0.0%) |
| 19 to 25 Years | 128 (100.0%) | 0 (0.0%) |
| 26 to 34 Years | 149 (83.2%) | 30 (16.8%) |
| 35 to 44 Years | 45 (77.6%) | 13 (22.4%) |
| 45 to 54 Years | 293 (100.0%) | 0 (0.0%) |
| 55 to 64 Years | 233 (100.0%) | 0 (0.0%) |
| 65 to 74 Years | 91 (100.0%) | 0 (0.0%) |
| 75 Years and older | 342 (100.0%) | 0 (0.0%) |
| Total | 1,445 (97.1%) | 43 (2.9%) |
Health Insurance Coverage by Citizenship Status in Rincon
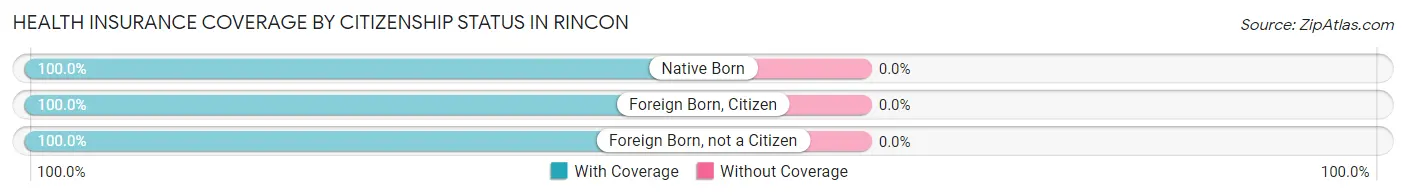
| Citizenship Status | With Coverage | Without Coverage |
| Native Born | 46 (100.0%) | 0 (0.0%) |
| Foreign Born, Citizen | 118 (100.0%) | 0 (0.0%) |
| Foreign Born, not a Citizen | 128 (100.0%) | 0 (0.0%) |
Health Insurance Coverage by Household Income in Rincon
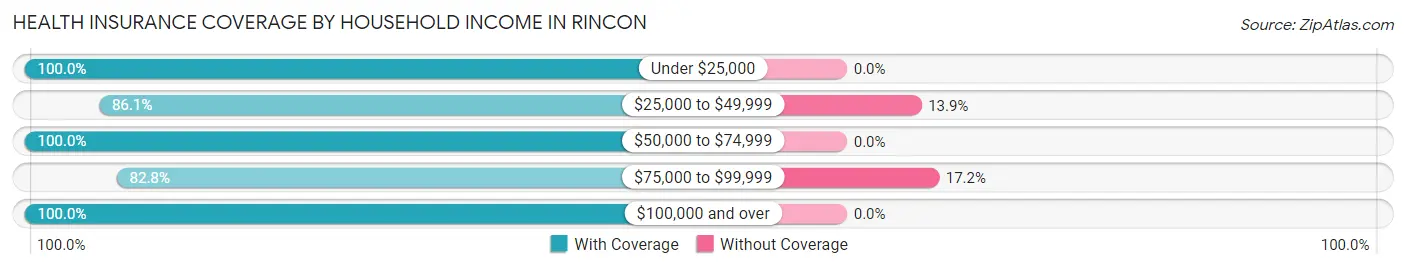
| Household Income | With Coverage | Without Coverage |
| Under $25,000 | 761 (100.0%) | 0 (0.0%) |
| $25,000 to $49,999 | 142 (86.1%) | 23 (13.9%) |
| $50,000 to $74,999 | 251 (100.0%) | 0 (0.0%) |
| $75,000 to $99,999 | 96 (82.8%) | 20 (17.2%) |
| $100,000 and over | 190 (100.0%) | 0 (0.0%) |
Public vs Private Health Insurance Coverage by Age in Rincon
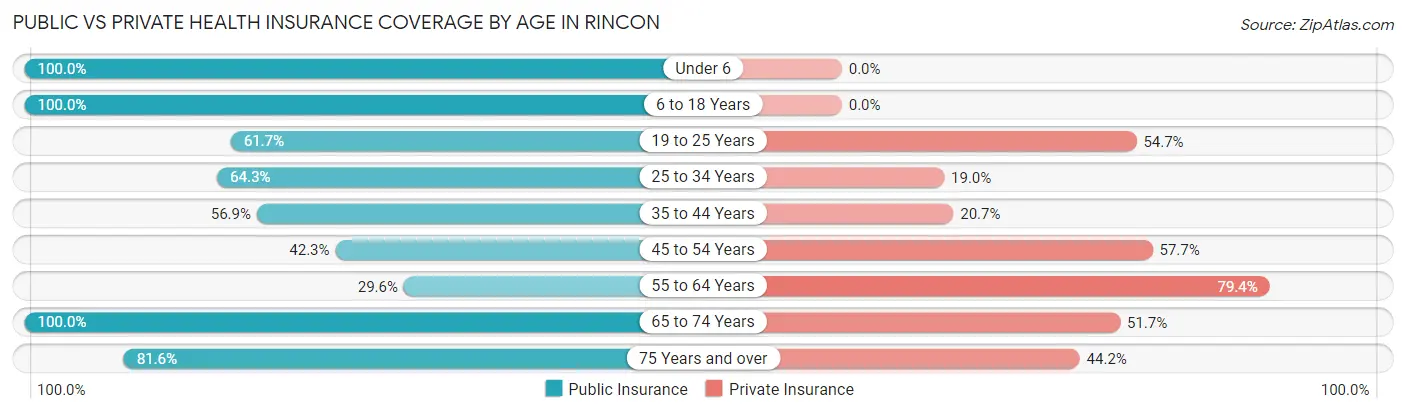
| Age Bracket | Public Insurance | Private Insurance |
| Under 6 | 46 (100.0%) | 0 (0.0%) |
| 6 to 18 Years | 118 (100.0%) | 0 (0.0%) |
| 19 to 25 Years | 79 (61.7%) | 70 (54.7%) |
| 25 to 34 Years | 115 (64.2%) | 34 (19.0%) |
| 35 to 44 Years | 33 (56.9%) | 12 (20.7%) |
| 45 to 54 Years | 124 (42.3%) | 169 (57.7%) |
| 55 to 64 Years | 69 (29.6%) | 185 (79.4%) |
| 65 to 74 Years | 91 (100.0%) | 47 (51.6%) |
| 75 Years and over | 279 (81.6%) | 151 (44.2%) |
| Total | 954 (64.1%) | 668 (44.9%) |
Disability Status by Sex by Age in Rincon
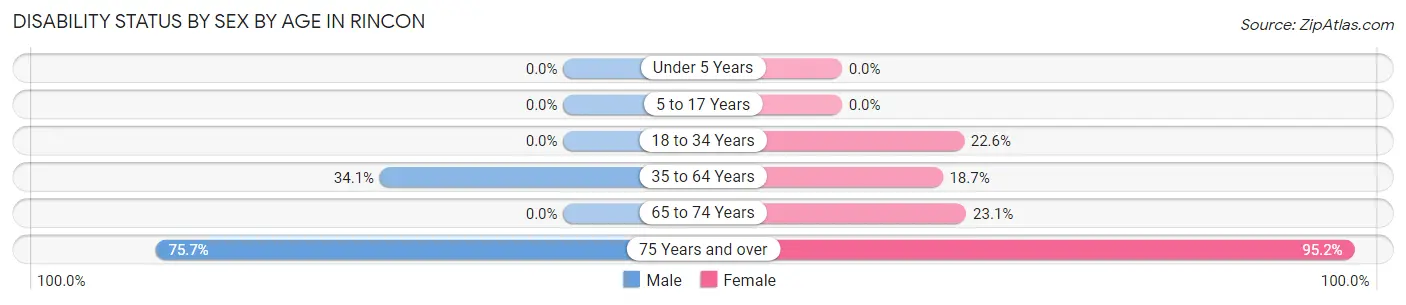
| Age Bracket | Male | Female |
| Under 5 Years | 0 (0.0%) | 0 (0.0%) |
| 5 to 17 Years | 0 (0.0%) | 0 (0.0%) |
| 18 to 34 Years | 0 (0.0%) | 48 (22.6%) |
| 35 to 64 Years | 126 (34.1%) | 40 (18.7%) |
| 65 to 74 Years | 0 (0.0%) | 12 (23.1%) |
| 75 Years and over | 134 (75.7%) | 157 (95.2%) |
Disability Class by Sex by Age in Rincon
Disability Class: Hearing Difficulty
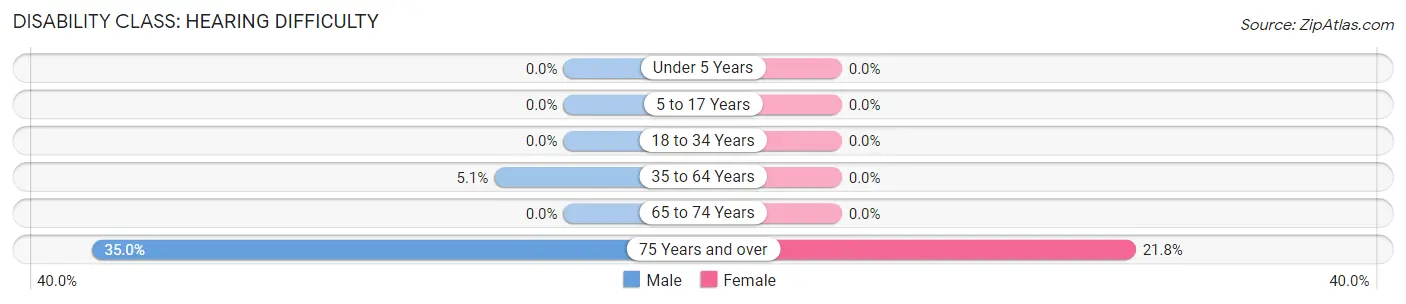
| Age Bracket | Male | Female |
| Under 5 Years | 0 (0.0%) | 0 (0.0%) |
| 5 to 17 Years | 0 (0.0%) | 0 (0.0%) |
| 18 to 34 Years | 0 (0.0%) | 0 (0.0%) |
| 35 to 64 Years | 19 (5.1%) | 0 (0.0%) |
| 65 to 74 Years | 0 (0.0%) | 0 (0.0%) |
| 75 Years and over | 62 (35.0%) | 36 (21.8%) |
Disability Class: Vision Difficulty
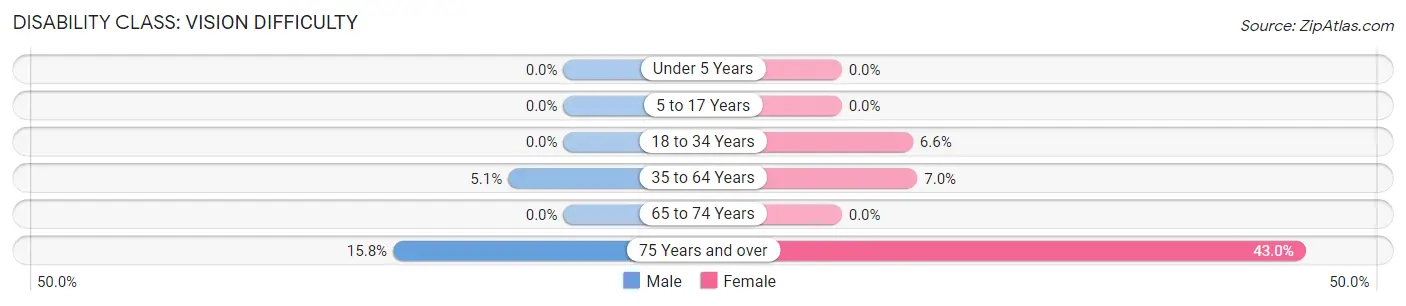
| Age Bracket | Male | Female |
| Under 5 Years | 0 (0.0%) | 0 (0.0%) |
| 5 to 17 Years | 0 (0.0%) | 0 (0.0%) |
| 18 to 34 Years | 0 (0.0%) | 14 (6.6%) |
| 35 to 64 Years | 19 (5.1%) | 15 (7.0%) |
| 65 to 74 Years | 0 (0.0%) | 0 (0.0%) |
| 75 Years and over | 28 (15.8%) | 71 (43.0%) |
Disability Class: Cognitive Difficulty
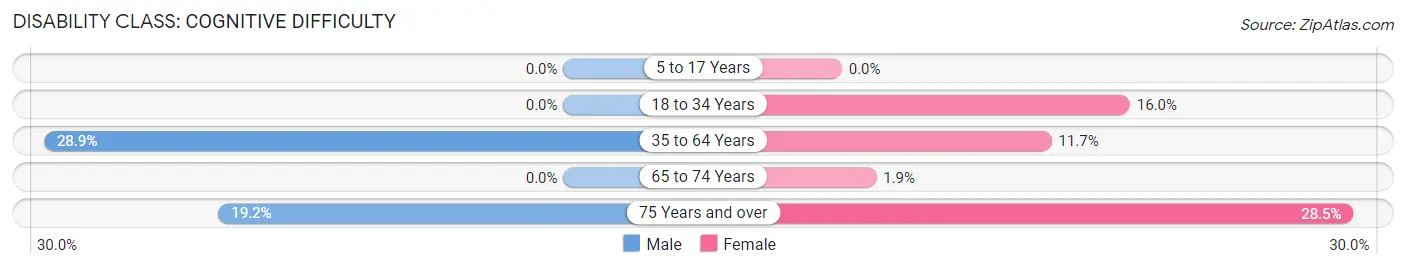
| Age Bracket | Male | Female |
| 5 to 17 Years | 0 (0.0%) | 0 (0.0%) |
| 18 to 34 Years | 0 (0.0%) | 34 (16.0%) |
| 35 to 64 Years | 107 (28.9%) | 25 (11.7%) |
| 65 to 74 Years | 0 (0.0%) | 1 (1.9%) |
| 75 Years and over | 34 (19.2%) | 47 (28.5%) |
Disability Class: Ambulatory Difficulty
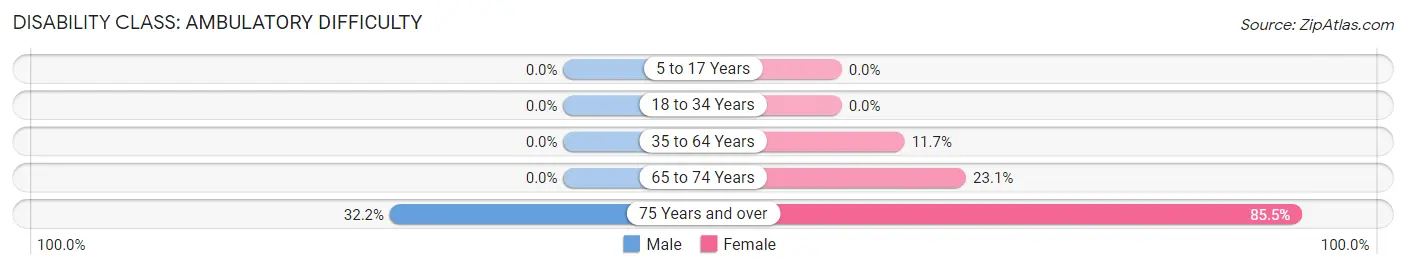
| Age Bracket | Male | Female |
| 5 to 17 Years | 0 (0.0%) | 0 (0.0%) |
| 18 to 34 Years | 0 (0.0%) | 0 (0.0%) |
| 35 to 64 Years | 0 (0.0%) | 25 (11.7%) |
| 65 to 74 Years | 0 (0.0%) | 12 (23.1%) |
| 75 Years and over | 57 (32.2%) | 141 (85.5%) |
Disability Class: Self-Care Difficulty
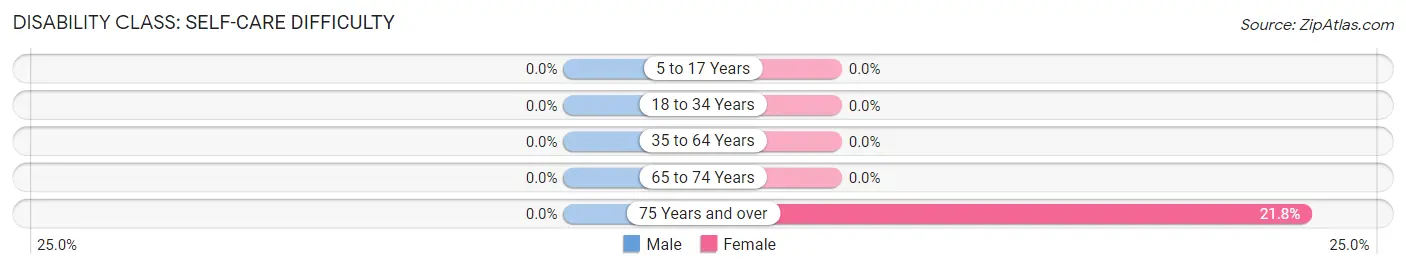
| Age Bracket | Male | Female |
| 5 to 17 Years | 0 (0.0%) | 0 (0.0%) |
| 18 to 34 Years | 0 (0.0%) | 0 (0.0%) |
| 35 to 64 Years | 0 (0.0%) | 0 (0.0%) |
| 65 to 74 Years | 0 (0.0%) | 0 (0.0%) |
| 75 Years and over | 0 (0.0%) | 36 (21.8%) |
Technology Access in Rincon
Computing Device Access in Rincon
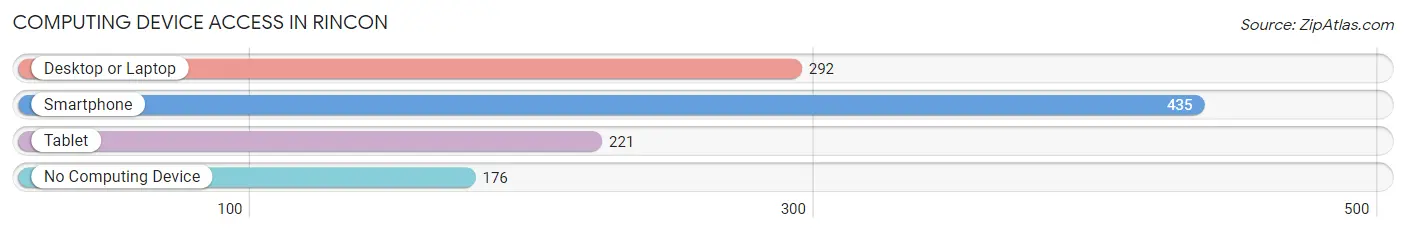
| Device Type | # Households | % Households |
| Desktop or Laptop | 292 | 44.7% |
| Smartphone | 435 | 66.5% |
| Tablet | 221 | 33.8% |
| No Computing Device | 176 | 26.9% |
| Total | 654 | 100.0% |
Internet Access in Rincon
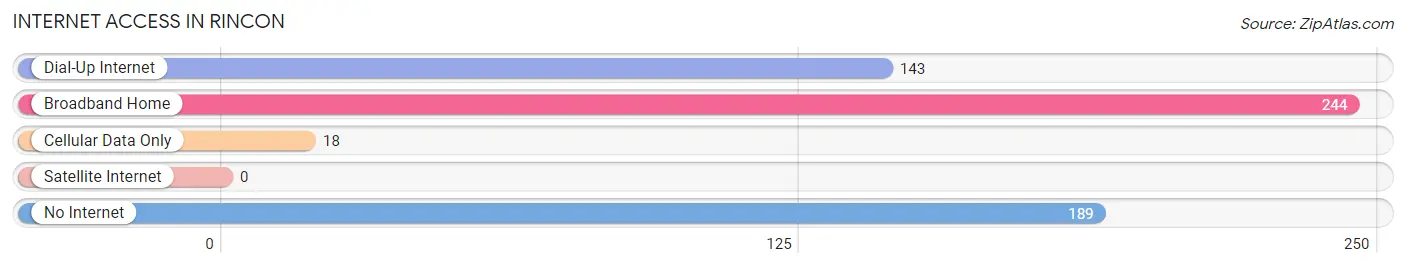
| Internet Type | # Households | % Households |
| Dial-Up Internet | 143 | 21.9% |
| Broadband Home | 244 | 37.3% |
| Cellular Data Only | 18 | 2.8% |
| Satellite Internet | 0 | 0.0% |
| No Internet | 189 | 28.9% |
| Total | 654 | 100.0% |
Rincon Summary
Rincon is a municipality located in the western part of Puerto Rico, on the island’s northwest coast. It is bordered by the municipalities of Aguada and Mayaguez to the east, and by the Atlantic Ocean to the north and west. The municipality of Rincon is part of the Mayaguez Metropolitan Statistical Area.
History
Rincon was founded in 1771 by Don Francisco de los Olivos, who was granted the land by the Spanish Crown. The town was originally called “Rincón de los Olivos”, which translates to “Corner of the Olives”. The name was later shortened to Rincon.
In the 19th century, Rincon was a major port for the export of sugar and coffee. The town was also a popular destination for whalers, who hunted whales in the nearby waters.
In the early 20th century, Rincon was a popular tourist destination for wealthy Americans. The town was known for its beautiful beaches and its laid-back atmosphere.
Geography
Rincon is located on the northwest coast of Puerto Rico, on the island’s western side. The municipality covers an area of approximately 33 square miles (85 km2). The terrain is mostly flat, with some hills in the northern part of the municipality.
The climate in Rincon is tropical, with average temperatures ranging from 75°F (24°C) in the winter to 85°F (29°C) in the summer. The average annual rainfall is approximately 50 inches (127 cm).
Economy
Rincon’s economy is largely based on tourism. The town is a popular destination for surfers, who come to take advantage of the excellent waves. The town is also known for its beautiful beaches, which attract visitors from all over the world.
In addition to tourism, Rincon’s economy is also based on agriculture. The municipality is known for its production of coffee, sugar cane, and other crops.
Demographics
As of the 2010 census, Rincon had a population of 16,719. The population is mostly of Puerto Rican descent, with a small minority of African and European descent. The median age is 38.5 years, and the median household income is $20,845.
Rincon is a predominantly Catholic town, with approximately 85% of the population identifying as Catholic. The town is also home to a small Protestant community.
Conclusion
Rincon is a municipality located in the western part of Puerto Rico, on the island’s northwest coast. The town was founded in 1771 and has a rich history of whaling, sugar and coffee production, and tourism. The economy of Rincon is largely based on tourism and agriculture, and the population is mostly of Puerto Rican descent. Rincon is a popular destination for surfers and beachgoers, and is known for its beautiful beaches and laid-back atmosphere.
Common Questions
What is Per Capita Income in Rincon?
Per Capita income in Rincon is $18,544.
What is Inequality or Gini Index in Rincon?
Inequality or Gini Index in Rincon is 0.56.
What is the Total Population of Rincon?
Total Population of Rincon is 1,488.
What is the Total Male Population of Rincon?
Total Male Population of Rincon is 758.
What is the Total Female Population of Rincon?
Total Female Population of Rincon is 730.
What is the Ratio of Males per 100 Females in Rincon?
There are 103.84 Males per 100 Females in Rincon.
What is the Ratio of Females per 100 Males in Rincon?
There are 96.31 Females per 100 Males in Rincon.
What is the Median Population Age in Rincon?
Median Population Age in Rincon is 49.7 Years.
What is the Average Family Size in Rincon
Average Family Size in Rincon is 3.1 People.
What is the Average Household Size in Rincon
Average Household Size in Rincon is 2.3 People.
How Large is the Labor Force in Rincon?
There are 576 People in the Labor Forcein in Rincon.
What is the Percentage of People in the Labor Force in Rincon?
42.5% of People are in the Labor Force in Rincon.
What is the Unemployment Rate in Rincon?
Unemployment Rate in Rincon is 13.2%.