Quebradillas, PR Map & Demographics
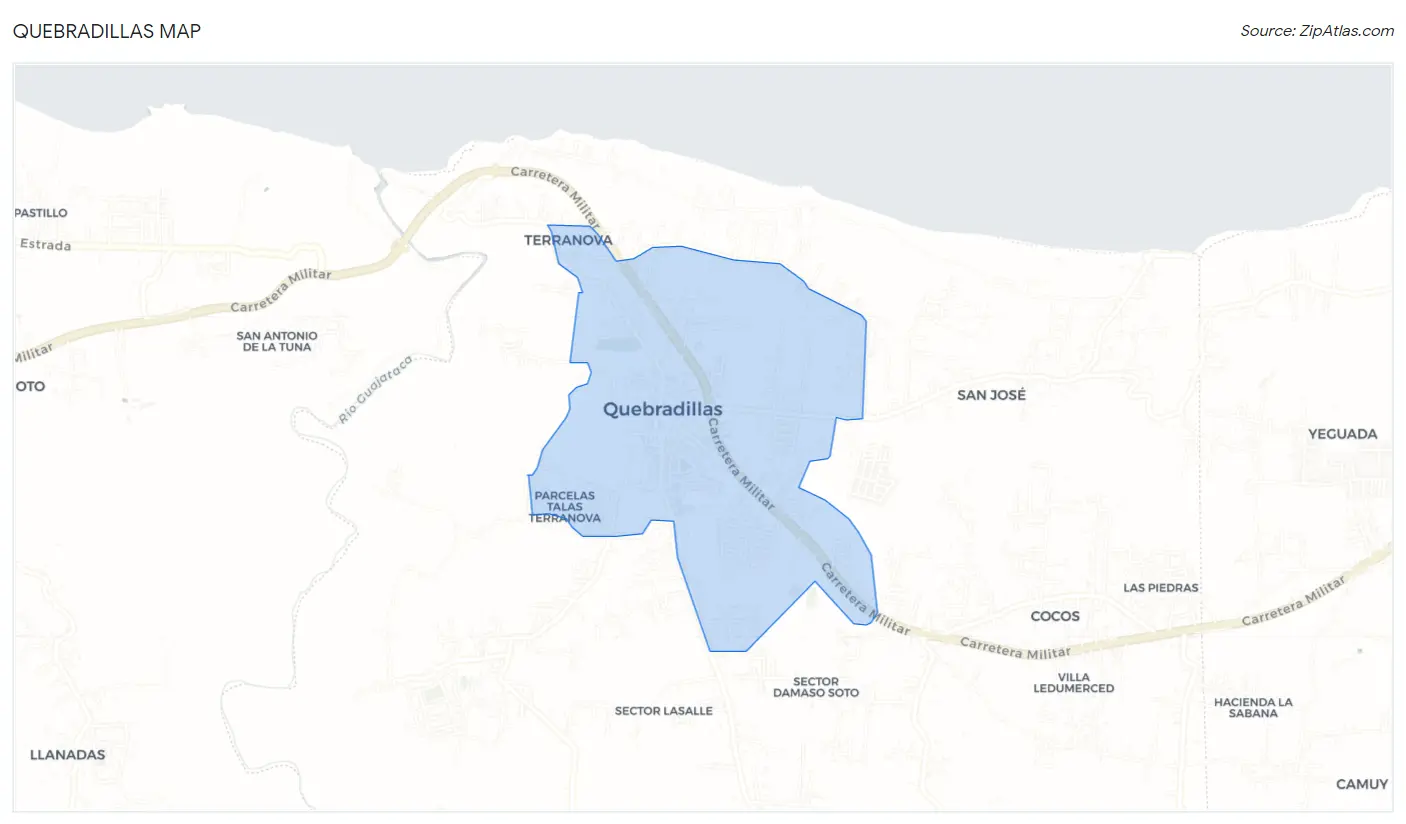
Quebradillas Map
Quebradillas Overview
$11,049
PER CAPITA INCOME
$26,542
AVG FAMILY INCOME
$18,981
AVG HOUSEHOLD INCOME
20.2%
WAGE / INCOME GAP [ % ]
79.8¢/ $1
WAGE / INCOME GAP [ $ ]
0.51
INEQUALITY / GINI INDEX
6,165
TOTAL POPULATION
2,898
MALE POPULATION
3,267
FEMALE POPULATION
88.71
MALES / 100 FEMALES
112.73
FEMALES / 100 MALES
42.2
MEDIAN AGE
3.5
AVG FAMILY SIZE
3.0
AVG HOUSEHOLD SIZE
2,254
LABOR FORCE [ PEOPLE ]
43.7%
PERCENT IN LABOR FORCE
6.3%
UNEMPLOYMENT RATE
Quebradillas Zip Codes
Quebradillas Area Codes
Income in Quebradillas
Income Overview in Quebradillas
Per Capita Income in Quebradillas is $11,049, while median incomes of families and households are $26,542 and $18,981 respectively.
| Characteristic | Number | Measure |
| Per Capita Income | 6,165 | $11,049 |
| Median Family Income | 1,429 | $26,542 |
| Mean Family Income | 1,429 | $28,652 |
| Median Household Income | 2,040 | $18,981 |
| Mean Household Income | 2,040 | $25,766 |
| Income Deficit | 1,429 | $0 |
| Wage / Income Gap (%) | 6,165 | 20.20% |
| Wage / Income Gap ($) | 6,165 | 79.80¢ per $1 |
| Gini / Inequality Index | 6,165 | 0.51 |
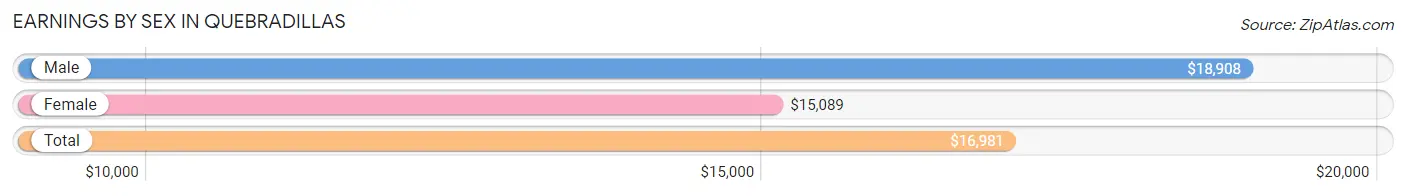
Earnings by Sex in Quebradillas
Average Earnings in Quebradillas are $16,981, $18,908 for men and $15,089 for women, a difference of 20.2%.
| Sex | Number | Average Earnings |
| Male | 1,308 (60.1%) | $18,908 |
| Female | 870 (39.9%) | $15,089 |
| Total | 2,178 (100.0%) | $16,981 |
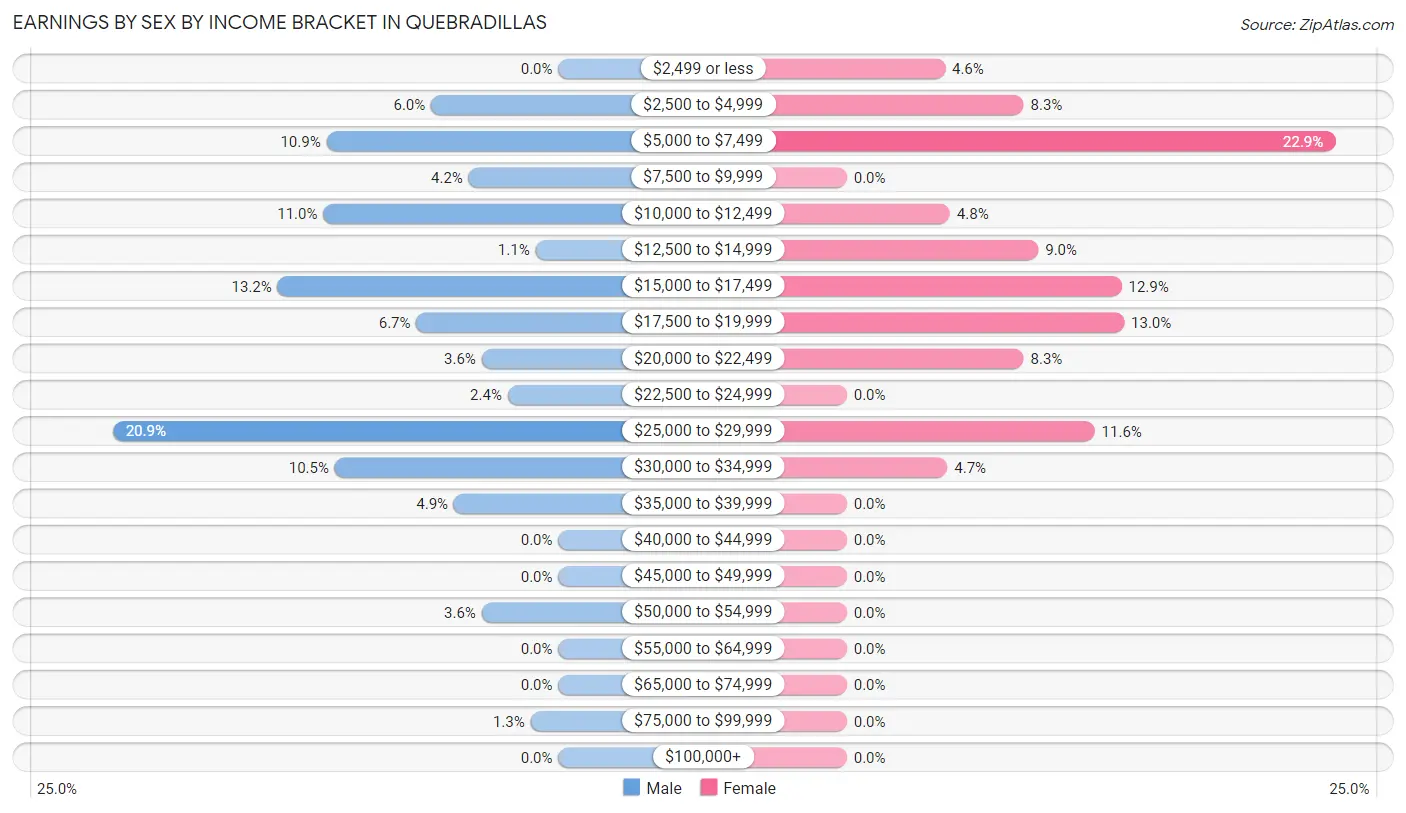
Earnings by Sex by Income Bracket in Quebradillas
The most common earnings brackets in Quebradillas are $25,000 to $29,999 for men (273 | 20.9%) and $5,000 to $7,499 for women (199 | 22.9%).
| Income | Male | Female |
| $2,499 or less | 0 (0.0%) | 40 (4.6%) |
| $2,500 to $4,999 | 78 (6.0%) | 72 (8.3%) |
| $5,000 to $7,499 | 142 (10.9%) | 199 (22.9%) |
| $7,500 to $9,999 | 55 (4.2%) | 0 (0.0%) |
| $10,000 to $12,499 | 144 (11.0%) | 42 (4.8%) |
| $12,500 to $14,999 | 14 (1.1%) | 78 (9.0%) |
| $15,000 to $17,499 | 172 (13.2%) | 112 (12.9%) |
| $17,500 to $19,999 | 87 (6.7%) | 113 (13.0%) |
| $20,000 to $22,499 | 47 (3.6%) | 72 (8.3%) |
| $22,500 to $24,999 | 31 (2.4%) | 0 (0.0%) |
| $25,000 to $29,999 | 273 (20.9%) | 101 (11.6%) |
| $30,000 to $34,999 | 137 (10.5%) | 41 (4.7%) |
| $35,000 to $39,999 | 64 (4.9%) | 0 (0.0%) |
| $40,000 to $44,999 | 0 (0.0%) | 0 (0.0%) |
| $45,000 to $49,999 | 0 (0.0%) | 0 (0.0%) |
| $50,000 to $54,999 | 47 (3.6%) | 0 (0.0%) |
| $55,000 to $64,999 | 0 (0.0%) | 0 (0.0%) |
| $65,000 to $74,999 | 0 (0.0%) | 0 (0.0%) |
| $75,000 to $99,999 | 17 (1.3%) | 0 (0.0%) |
| $100,000+ | 0 (0.0%) | 0 (0.0%) |
| Total | 1,308 (100.0%) | 870 (100.0%) |
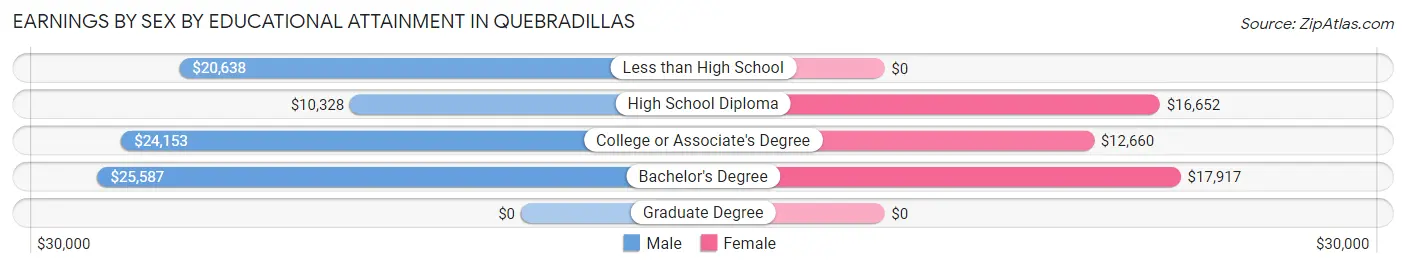
Earnings by Sex by Educational Attainment in Quebradillas
Average earnings in Quebradillas are $19,985 for men and $15,536 for women, a difference of 22.3%. Men with an educational attainment of bachelor's degree enjoy the highest average annual earnings of $25,587, while those with high school diploma education earn the least with $10,328. Women with an educational attainment of bachelor's degree earn the most with the average annual earnings of $17,917, while those with college or associate's degree education have the smallest earnings of $12,660.
| Educational Attainment | Male Income | Female Income |
| Less than High School | $20,638 | $0 |
| High School Diploma | $10,328 | $16,652 |
| College or Associate's Degree | $24,153 | $12,660 |
| Bachelor's Degree | $25,587 | $17,917 |
| Graduate Degree | - | - |
| Total | $19,985 | $15,536 |
Family Income in Quebradillas
Family Income Brackets in Quebradillas
According to the Quebradillas family income data, there are 407 families falling into the less than $10,000 income range, which is the most common income bracket and makes up 28.5% of all families.
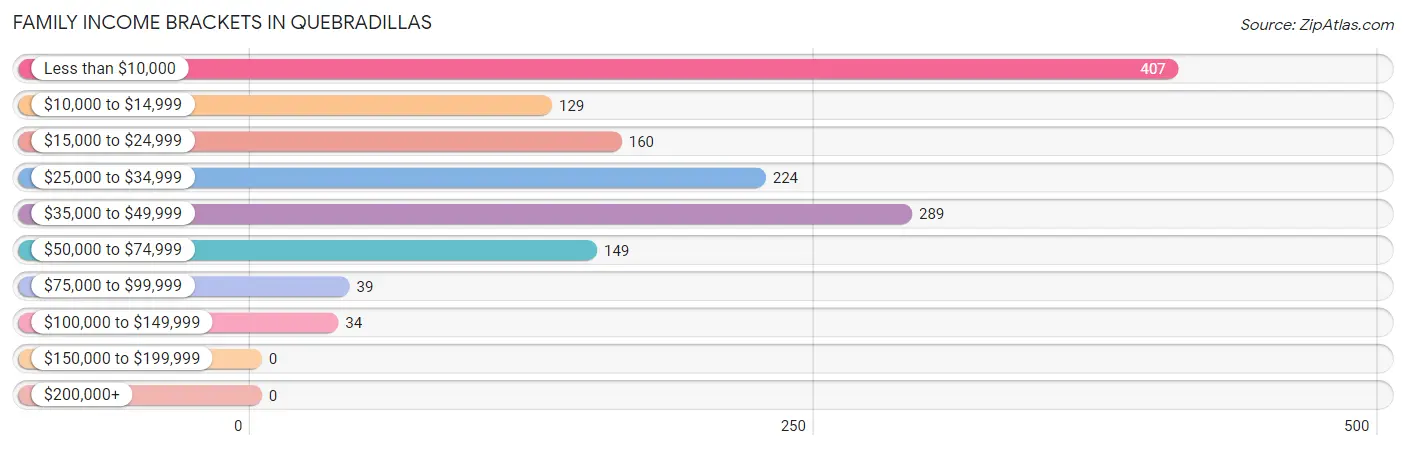
| Income Bracket | # Families | % Families |
| Less than $10,000 | 407 | 28.5% |
| $10,000 to $14,999 | 129 | 9.0% |
| $15,000 to $24,999 | 160 | 11.2% |
| $25,000 to $34,999 | 224 | 15.7% |
| $35,000 to $49,999 | 289 | 20.2% |
| $50,000 to $74,999 | 149 | 10.4% |
| $75,000 to $99,999 | 39 | 2.7% |
| $100,000 to $149,999 | 34 | 2.4% |
| $150,000 to $199,999 | 0 | 0.0% |
| $200,000+ | 0 | 0.0% |
Family Income by Famaliy Size in Quebradillas
4-person families (328 | 23.0%) account for the highest median family income in Quebradillas with $34,881 per family, while 2-person families (630 | 44.1%) have the highest median income of $10,104 per family member.
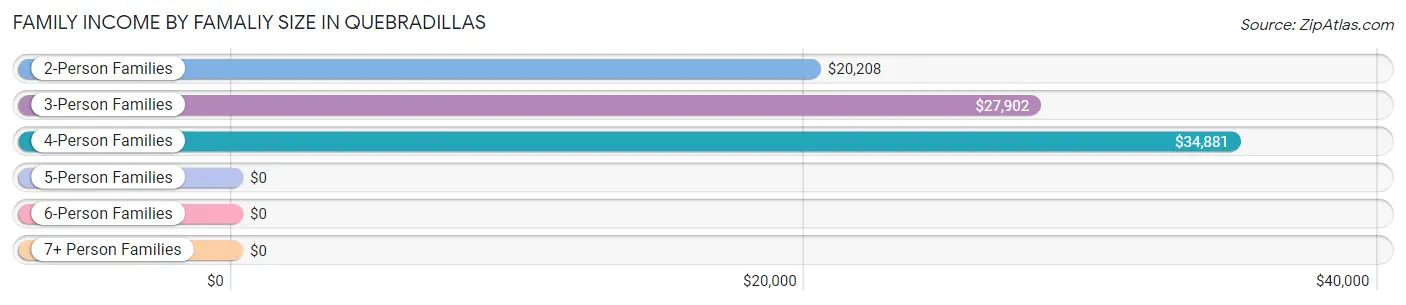
| Income Bracket | # Families | Median Income |
| 2-Person Families | 630 (44.1%) | $20,208 |
| 3-Person Families | 453 (31.7%) | $27,902 |
| 4-Person Families | 328 (23.0%) | $34,881 |
| 5-Person Families | 0 (0.0%) | $0 |
| 6-Person Families | 18 (1.3%) | $0 |
| 7+ Person Families | 0 (0.0%) | $0 |
| Total | 1,429 (100.0%) | $26,542 |
Family Income by Number of Earners in Quebradillas
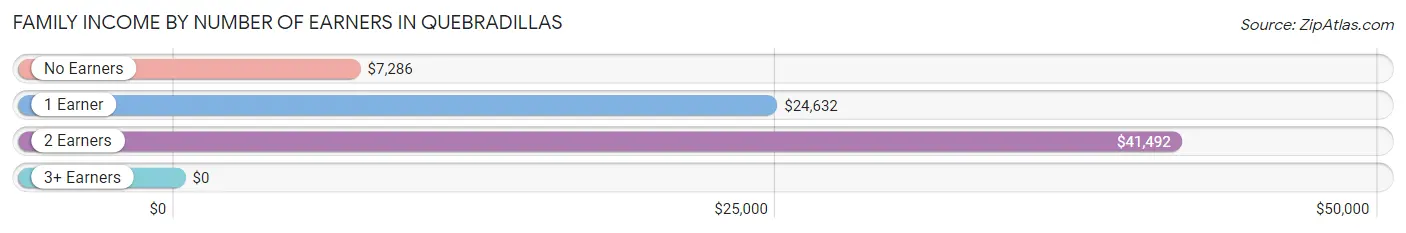
| Number of Earners | # Families | Median Income |
| No Earners | 546 (38.2%) | $7,286 |
| 1 Earner | 574 (40.2%) | $24,632 |
| 2 Earners | 269 (18.8%) | $41,492 |
| 3+ Earners | 40 (2.8%) | $0 |
| Total | 1,429 (100.0%) | $26,542 |
Household Income in Quebradillas
Household Income Brackets in Quebradillas
With 738 households falling in the category, the less than $10,000 income range is the most frequent in Quebradillas, accounting for 36.2% of all households.
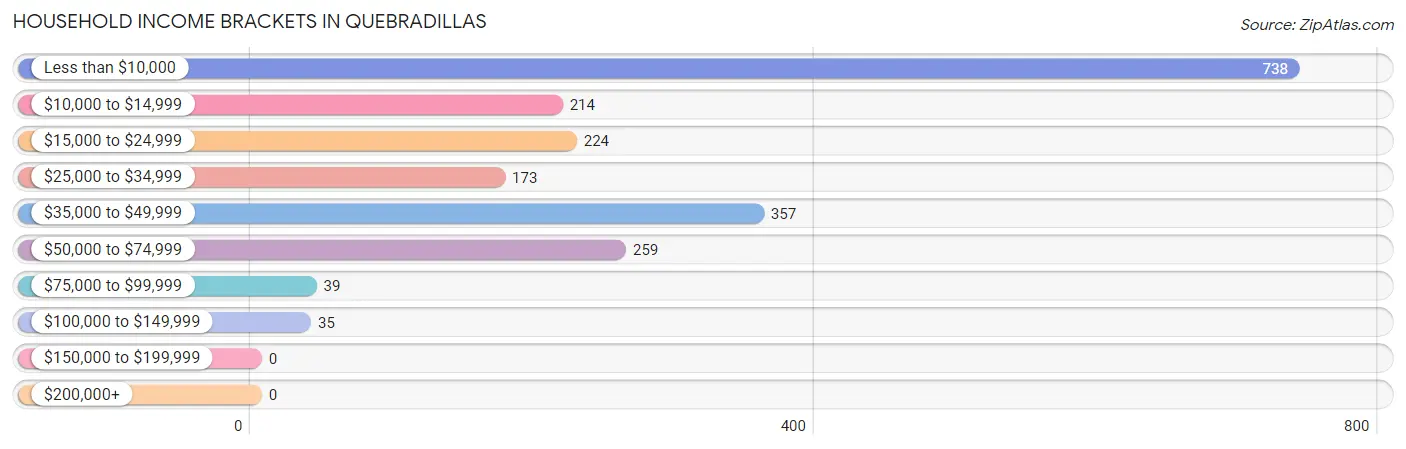
| Income Bracket | # Households | % Households |
| Less than $10,000 | 738 | 36.2% |
| $10,000 to $14,999 | 214 | 10.5% |
| $15,000 to $24,999 | 224 | 11.0% |
| $25,000 to $34,999 | 173 | 8.5% |
| $35,000 to $49,999 | 357 | 17.5% |
| $50,000 to $74,999 | 259 | 12.7% |
| $75,000 to $99,999 | 39 | 1.9% |
| $100,000 to $149,999 | 35 | 1.7% |
| $150,000 to $199,999 | 0 | 0.0% |
| $200,000+ | 0 | 0.0% |
Household Income by Householder Age in Quebradillas
The median household income in Quebradillas is $18,981, with the highest median household income of $29,318 found in the 45 to 64 years age bracket for the primary householder. A total of 670 households (32.8%) fall into this category. Meanwhile, the 15 to 24 years age bracket for the primary householder has the lowest median household income of $0, with 26 households (1.3%) in this group.
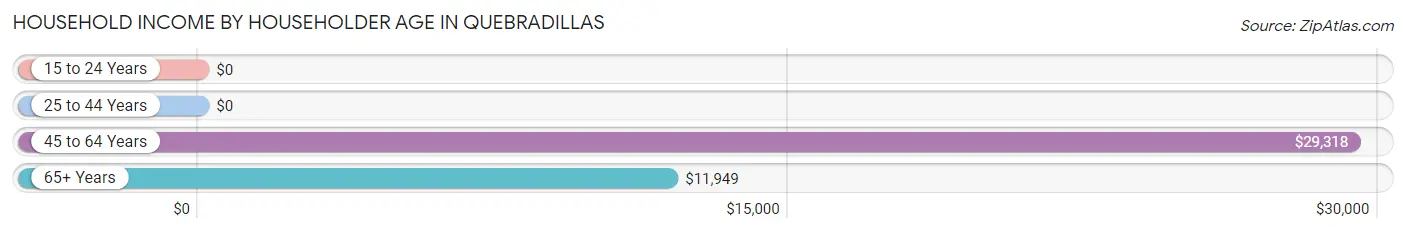
| Income Bracket | # Households | Median Income |
| 15 to 24 Years | 26 (1.3%) | $0 |
| 25 to 44 Years | 594 (29.1%) | $0 |
| 45 to 64 Years | 670 (32.8%) | $29,318 |
| 65+ Years | 750 (36.8%) | $11,949 |
| Total | 2,040 (100.0%) | $18,981 |
Poverty in Quebradillas
Income Below Poverty by Sex and Age in Quebradillas
With 37.2% poverty level for males and 45.9% for females among the residents of Quebradillas, under 5 year old males and 15 year old females are the most vulnerable to poverty, with 31 males (100.0%) and 22 females (100.0%) in their respective age groups living below the poverty level.
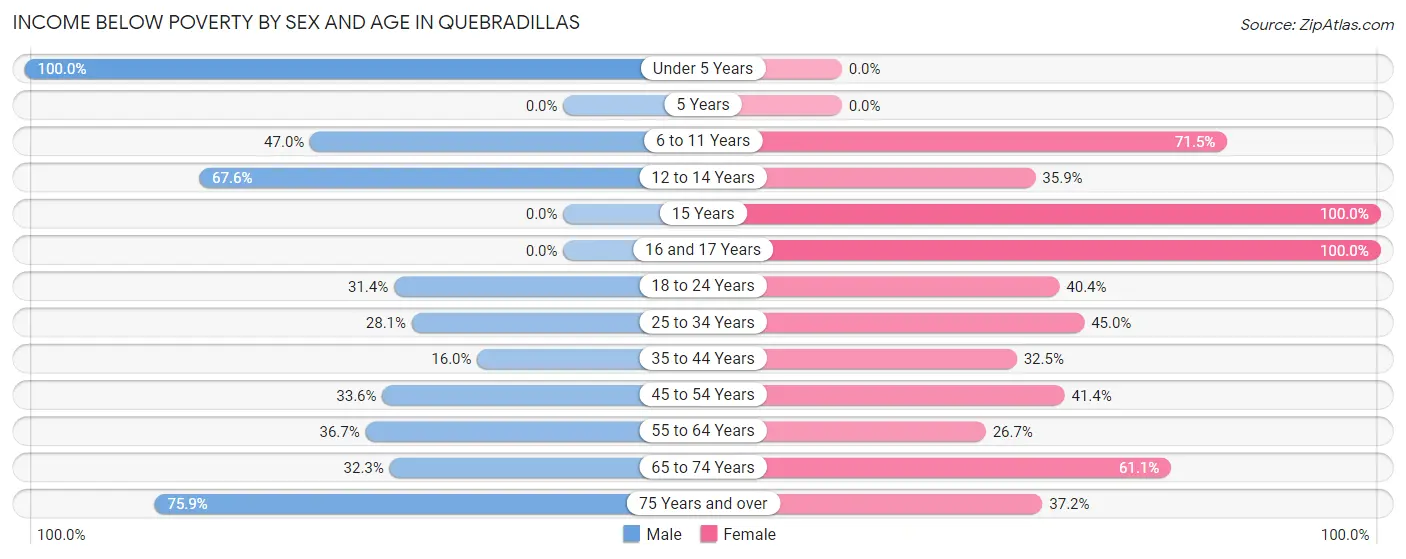
| Age Bracket | Male | Female |
| Under 5 Years | 31 (100.0%) | 0 (0.0%) |
| 5 Years | 0 (0.0%) | 0 (0.0%) |
| 6 to 11 Years | 149 (47.0%) | 216 (71.5%) |
| 12 to 14 Years | 73 (67.6%) | 46 (35.9%) |
| 15 Years | 0 (0.0%) | 22 (100.0%) |
| 16 and 17 Years | 0 (0.0%) | 22 (100.0%) |
| 18 to 24 Years | 55 (31.4%) | 128 (40.4%) |
| 25 to 34 Years | 153 (28.1%) | 211 (45.0%) |
| 35 to 44 Years | 49 (16.0%) | 88 (32.5%) |
| 45 to 54 Years | 129 (33.6%) | 227 (41.3%) |
| 55 to 64 Years | 87 (36.7%) | 74 (26.7%) |
| 65 to 74 Years | 99 (32.3%) | 316 (61.1%) |
| 75 Years and over | 252 (75.9%) | 140 (37.2%) |
| Total | 1,077 (37.2%) | 1,490 (45.9%) |
Income Above Poverty by Sex and Age in Quebradillas
According to the poverty statistics in Quebradillas, males aged 15 years and females aged 55 to 64 years are the age groups that are most secure financially, with 100.0% of males and 73.3% of females in these age groups living above the poverty line.
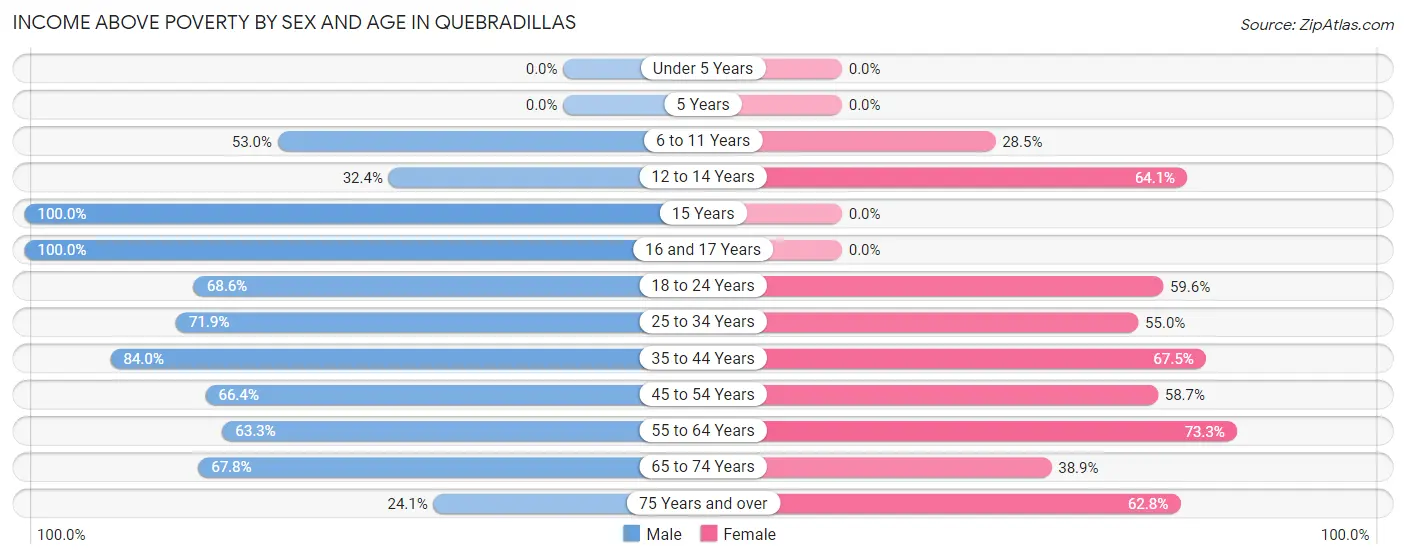
| Age Bracket | Male | Female |
| Under 5 Years | 0 (0.0%) | 0 (0.0%) |
| 5 Years | 0 (0.0%) | 0 (0.0%) |
| 6 to 11 Years | 168 (53.0%) | 86 (28.5%) |
| 12 to 14 Years | 35 (32.4%) | 82 (64.1%) |
| 15 Years | 82 (100.0%) | 0 (0.0%) |
| 16 and 17 Years | 73 (100.0%) | 0 (0.0%) |
| 18 to 24 Years | 120 (68.6%) | 189 (59.6%) |
| 25 to 34 Years | 391 (71.9%) | 258 (55.0%) |
| 35 to 44 Years | 258 (84.0%) | 183 (67.5%) |
| 45 to 54 Years | 255 (66.4%) | 322 (58.7%) |
| 55 to 64 Years | 150 (63.3%) | 203 (73.3%) |
| 65 to 74 Years | 208 (67.7%) | 201 (38.9%) |
| 75 Years and over | 80 (24.1%) | 236 (62.8%) |
| Total | 1,820 (62.8%) | 1,760 (54.1%) |
Income Below Poverty Among Married-Couple Families in Quebradillas
The poverty statistics for married-couple families in Quebradillas show that 26.5% or 185 of the total 699 families live below the poverty line. Families with 1 or 2 children have the highest poverty rate of 29.1%, comprising of 75 families. On the other hand, families with no children have the lowest poverty rate of 24.9%, which includes 110 families.
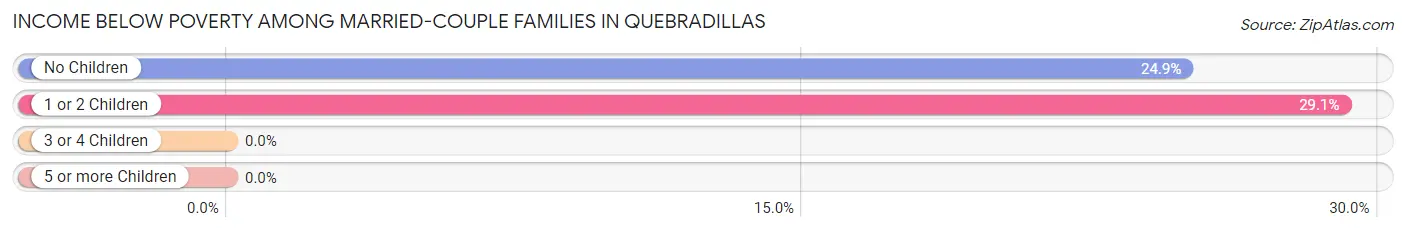
| Children | Above Poverty | Below Poverty |
| No Children | 331 (75.1%) | 110 (24.9%) |
| 1 or 2 Children | 183 (70.9%) | 75 (29.1%) |
| 3 or 4 Children | 0 (0.0%) | 0 (0.0%) |
| 5 or more Children | 0 (0.0%) | 0 (0.0%) |
| Total | 514 (73.5%) | 185 (26.5%) |
Income Below Poverty Among Single-Parent Households in Quebradillas
According to the poverty data in Quebradillas, 33.6% or 72 single-father households and 71.5% or 369 single-mother households are living below the poverty line. Among single-father households, those with no children have the highest poverty rate, with 72 households (43.1%) experiencing poverty. Likewise, among single-mother households, those with 3 or 4 children have the highest poverty rate, with 37 households (100.0%) falling below the poverty line.
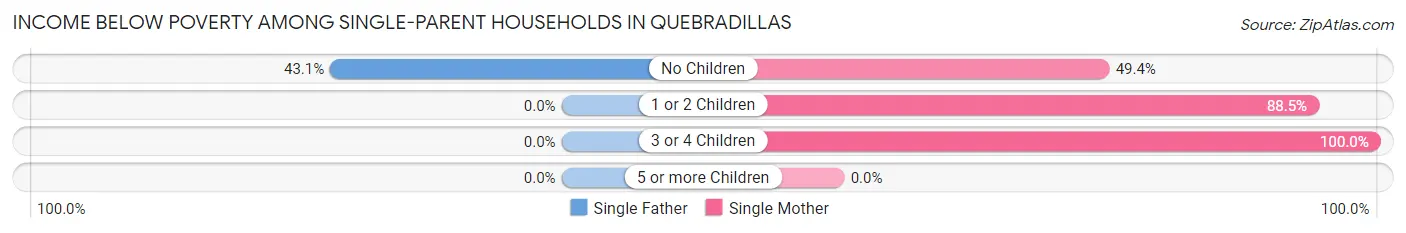
| Children | Single Father | Single Mother |
| No Children | 72 (43.1%) | 116 (49.4%) |
| 1 or 2 Children | 0 (0.0%) | 216 (88.5%) |
| 3 or 4 Children | 0 (0.0%) | 37 (100.0%) |
| 5 or more Children | 0 (0.0%) | 0 (0.0%) |
| Total | 72 (33.6%) | 369 (71.5%) |
Income Below Poverty Among Married-Couple vs Single-Parent Households in Quebradillas
The poverty data for Quebradillas shows that 185 of the married-couple family households (26.5%) and 441 of the single-parent households (60.4%) are living below the poverty level. Within the married-couple family households, those with 1 or 2 children have the highest poverty rate, with 75 households (29.1%) falling below the poverty line. Among the single-parent households, those with 3 or 4 children have the highest poverty rate, with 37 household (100.0%) living below poverty.
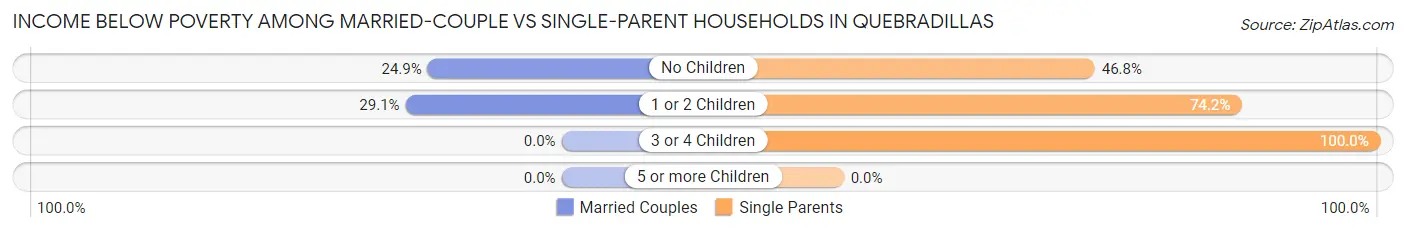
| Children | Married-Couple Families | Single-Parent Households |
| No Children | 110 (24.9%) | 188 (46.8%) |
| 1 or 2 Children | 75 (29.1%) | 216 (74.2%) |
| 3 or 4 Children | 0 (0.0%) | 37 (100.0%) |
| 5 or more Children | 0 (0.0%) | 0 (0.0%) |
| Total | 185 (26.5%) | 441 (60.4%) |
Race in Quebradillas
The most populous races in Quebradillas are Hispanic or Latino (6,015 | 97.6%), White / Caucasian (3,691 | 59.9%), and Some other Race (1,438 | 23.3%).
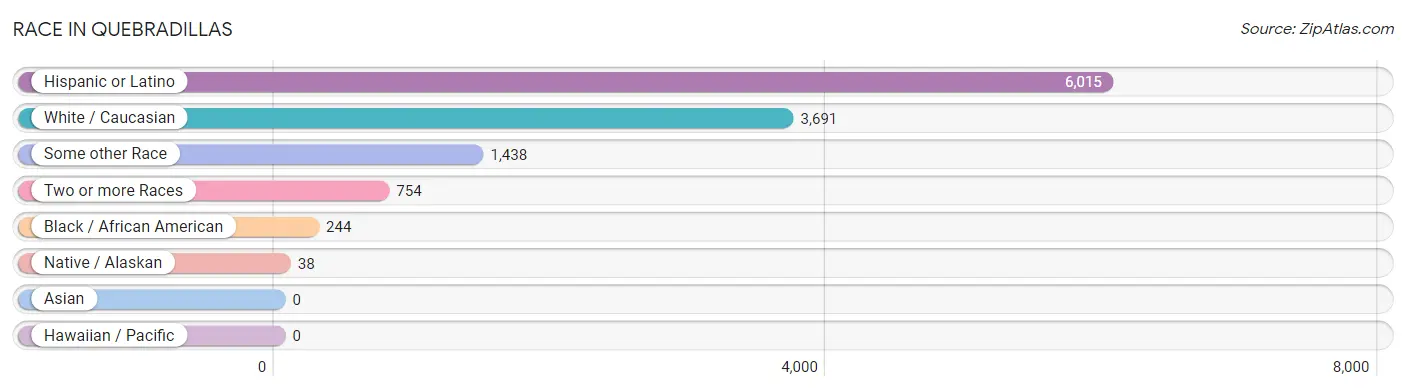
| Race | # Population | % Population |
| Asian | 0 | 0.0% |
| Black / African American | 244 | 4.0% |
| Hawaiian / Pacific | 0 | 0.0% |
| Hispanic or Latino | 6,015 | 97.6% |
| Native / Alaskan | 38 | 0.6% |
| White / Caucasian | 3,691 | 59.9% |
| Two or more Races | 754 | 12.2% |
| Some other Race | 1,438 | 23.3% |
| Total | 6,165 | 100.0% |
Ancestry in Quebradillas
The most populous ancestries reported in Quebradillas are Puerto Rican (5,992 | 97.2%), American (67 | 1.1%), Central American Indian (67 | 1.1%), Dominican (23 | 0.4%), and Irish (23 | 0.4%), together accounting for 100.1% of all Quebradillas residents.
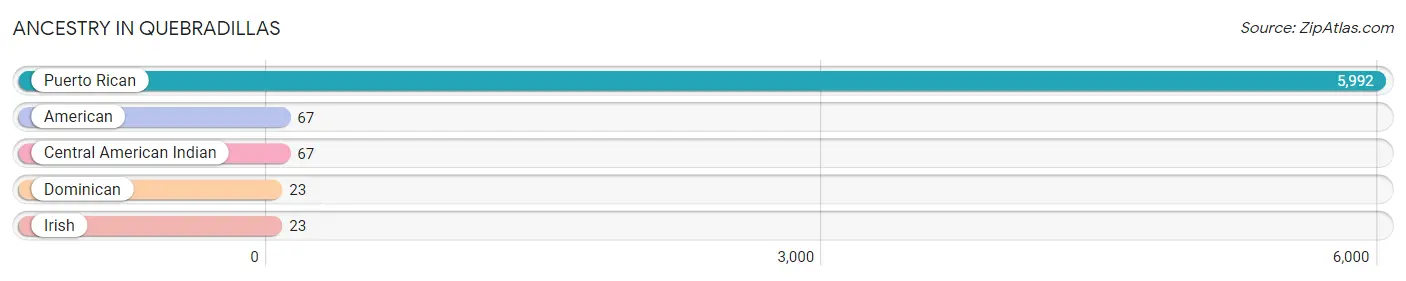
| Ancestry | # Population | % Population |
| American | 67 | 1.1% |
| Central American Indian | 67 | 1.1% |
| Dominican | 23 | 0.4% |
| Irish | 23 | 0.4% |
| Puerto Rican | 5,992 | 97.2% | View All 5 Rows |
Immigrants in Quebradillas

| Immigration Origin | # Population | % Population | View All 0 Rows |
Sex and Age in Quebradillas
Sex and Age in Quebradillas
The most populous age groups in Quebradillas are 25 to 29 Years (423 | 14.6%) for men and 45 to 49 Years (303 | 9.3%) for women.
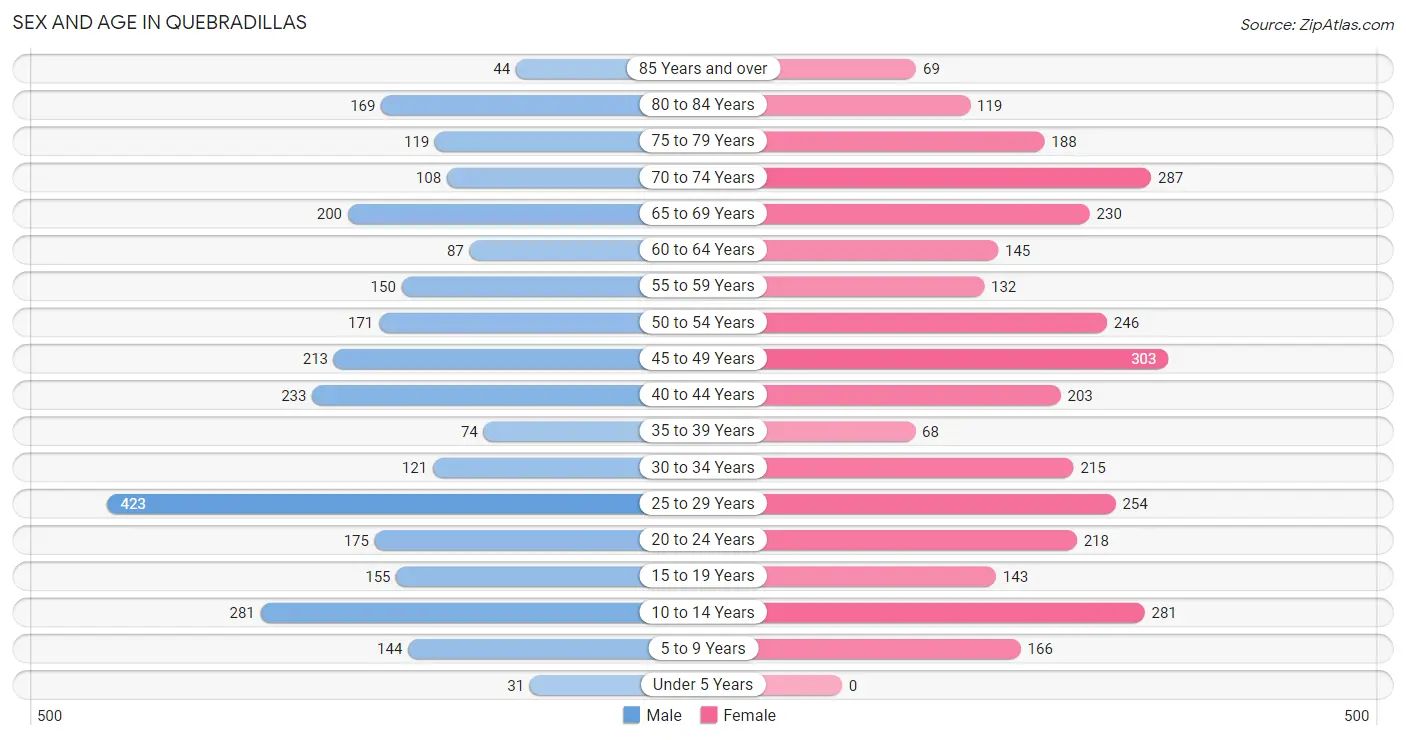
| Age Bracket | Male | Female |
| Under 5 Years | 31 (1.1%) | 0 (0.0%) |
| 5 to 9 Years | 144 (5.0%) | 166 (5.1%) |
| 10 to 14 Years | 281 (9.7%) | 281 (8.6%) |
| 15 to 19 Years | 155 (5.3%) | 143 (4.4%) |
| 20 to 24 Years | 175 (6.0%) | 218 (6.7%) |
| 25 to 29 Years | 423 (14.6%) | 254 (7.8%) |
| 30 to 34 Years | 121 (4.2%) | 215 (6.6%) |
| 35 to 39 Years | 74 (2.5%) | 68 (2.1%) |
| 40 to 44 Years | 233 (8.0%) | 203 (6.2%) |
| 45 to 49 Years | 213 (7.3%) | 303 (9.3%) |
| 50 to 54 Years | 171 (5.9%) | 246 (7.5%) |
| 55 to 59 Years | 150 (5.2%) | 132 (4.0%) |
| 60 to 64 Years | 87 (3.0%) | 145 (4.4%) |
| 65 to 69 Years | 200 (6.9%) | 230 (7.0%) |
| 70 to 74 Years | 108 (3.7%) | 287 (8.8%) |
| 75 to 79 Years | 119 (4.1%) | 188 (5.8%) |
| 80 to 84 Years | 169 (5.8%) | 119 (3.6%) |
| 85 Years and over | 44 (1.5%) | 69 (2.1%) |
| Total | 2,898 (100.0%) | 3,267 (100.0%) |
Families and Households in Quebradillas
Median Family Size in Quebradillas
The median family size in Quebradillas is 3.48 persons per family, with single female/mother families (516 | 36.1%) accounting for the largest median family size of 4.02 persons per family. On the other hand, single male/father families (214 | 15.0%) represent the smallest median family size with 2.73 persons per family.
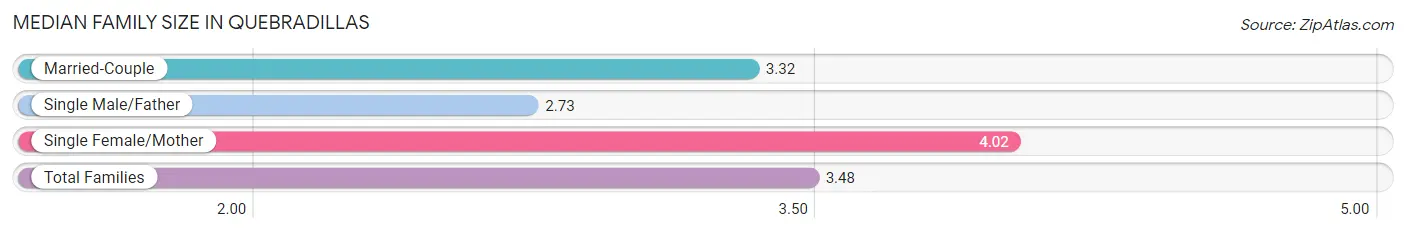
| Family Type | # Families | Family Size |
| Married-Couple | 699 (48.9%) | 3.32 |
| Single Male/Father | 214 (15.0%) | 2.73 |
| Single Female/Mother | 516 (36.1%) | 4.02 |
| Total Families | 1,429 (100.0%) | 3.48 |
Median Household Size in Quebradillas
The median household size in Quebradillas is 2.95 persons per household, with single female/mother households (516 | 25.3%) accounting for the largest median household size of 4.4 persons per household. non-family households (611 | 29.9%) represent the smallest median household size with 1.22 persons per household.
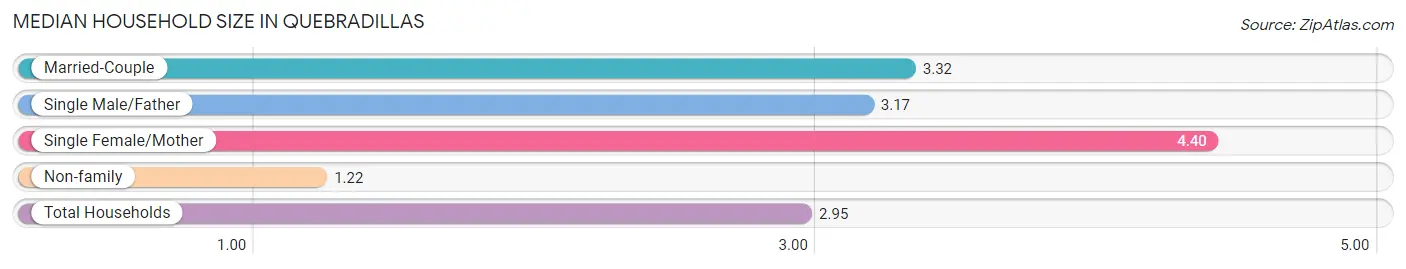
| Household Type | # Households | Household Size |
| Married-Couple | 699 (34.3%) | 3.32 |
| Single Male/Father | 214 (10.5%) | 3.17 |
| Single Female/Mother | 516 (25.3%) | 4.40 |
| Non-family | 611 (29.9%) | 1.22 |
| Total Households | 2,040 (100.0%) | 2.95 |
Household Size by Marriage Status in Quebradillas
Out of a total of 2,040 households in Quebradillas, 1,429 (70.1%) are family households, while 611 (29.9%) are nonfamily households. The most numerous type of family households are 2-person households, comprising 560, and the most common type of nonfamily households are 1-person households, comprising 475.
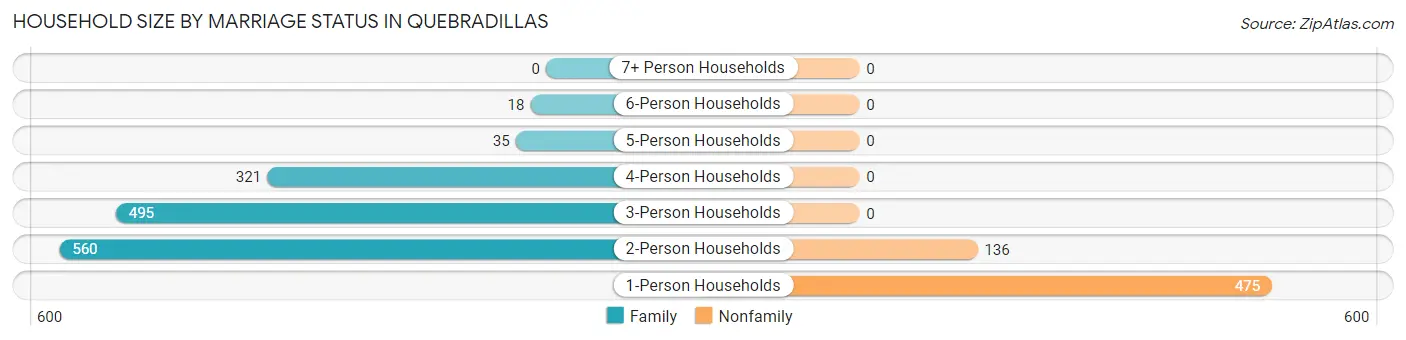
| Household Size | Family Households | Nonfamily Households |
| 1-Person Households | - | 475 (23.3%) |
| 2-Person Households | 560 (27.5%) | 136 (6.7%) |
| 3-Person Households | 495 (24.3%) | 0 (0.0%) |
| 4-Person Households | 321 (15.7%) | 0 (0.0%) |
| 5-Person Households | 35 (1.7%) | 0 (0.0%) |
| 6-Person Households | 18 (0.9%) | 0 (0.0%) |
| 7+ Person Households | 0 (0.0%) | 0 (0.0%) |
| Total | 1,429 (70.1%) | 611 (29.9%) |
Female Fertility in Quebradillas
Fertility by Age in Quebradillas
| Age Bracket | Women with Births | Births / 1,000 Women |
| 15 to 19 years | 0 (0.0%) | 0.0 |
| 20 to 34 years | 0 (0.0%) | 0.0 |
| 35 to 50 years | 0 (0.0%) | 0.0 |
| Total | 0 (0.0%) | 0.0 |
Fertility by Age by Marriage Status in Quebradillas
| Age Bracket | Married | Unmarried |
| 15 to 19 years | 0 (0.0%) | 0 (0.0%) |
| 20 to 34 years | 0 (0.0%) | 0 (0.0%) |
| 35 to 50 years | 0 (0.0%) | 0 (0.0%) |
| Total | 0 (0.0%) | 0 (0.0%) |
Fertility by Education in Quebradillas
| Educational Attainment | Women with Births | Births / 1,000 Women |
| Less than High School | 0 (0.0%) | 0.0 |
| High School Diploma | 0 (0.0%) | 0.0 |
| College or Associate's Degree | 0 (0.0%) | 0.0 |
| Bachelor's Degree | 0 (0.0%) | 0.0 |
| Graduate Degree | 0 (0.0%) | 0.0 |
| Total | 0 (0.0%) | 0.0 |
Fertility by Education by Marriage Status in Quebradillas
| Educational Attainment | Married | Unmarried |
| Less than High School | 0 (0.0%) | 0 (0.0%) |
| High School Diploma | 0 (0.0%) | 0 (0.0%) |
| College or Associate's Degree | 0 (0.0%) | 0 (0.0%) |
| Bachelor's Degree | 0 (0.0%) | 0 (0.0%) |
| Graduate Degree | 0 (0.0%) | 0 (0.0%) |
| Total | 0 (0.0%) | 0 (0.0%) |
Employment Characteristics in Quebradillas
Employment by Class of Employer in Quebradillas
Among the 2,114 employed individuals in Quebradillas, private company employees (1,324 | 62.6%), self-employed (not incorporated) (481 | 22.8%), and state government employees (142 | 6.7%) make up the most common classes of employment.
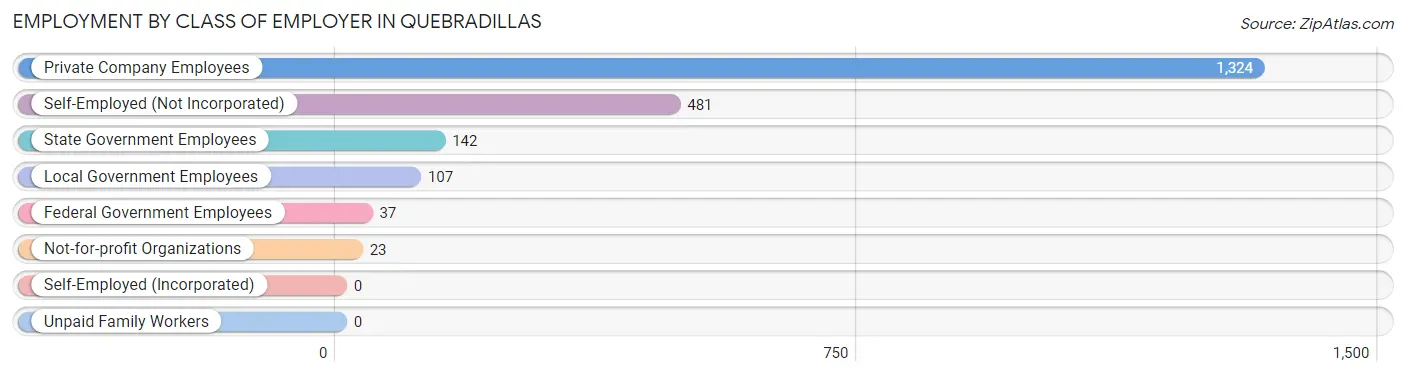
| Employer Class | # Employees | % Employees |
| Private Company Employees | 1,324 | 62.6% |
| Self-Employed (Incorporated) | 0 | 0.0% |
| Self-Employed (Not Incorporated) | 481 | 22.8% |
| Not-for-profit Organizations | 23 | 1.1% |
| Local Government Employees | 107 | 5.1% |
| State Government Employees | 142 | 6.7% |
| Federal Government Employees | 37 | 1.8% |
| Unpaid Family Workers | 0 | 0.0% |
| Total | 2,114 | 100.0% |
Employment Status by Age in Quebradillas
According to the labor force statistics for Quebradillas, out of the total population over 16 years of age (5,158), 43.7% or 2,254 individuals are in the labor force, with 6.3% or 142 of them unemployed. The age group with the highest labor force participation rate is 35 to 44 years, with 81.8% or 473 individuals in the labor force. Within the labor force, the 30 to 34 years age range has the highest percentage of unemployed individuals, with 36.6% or 71 of them being unemployed.
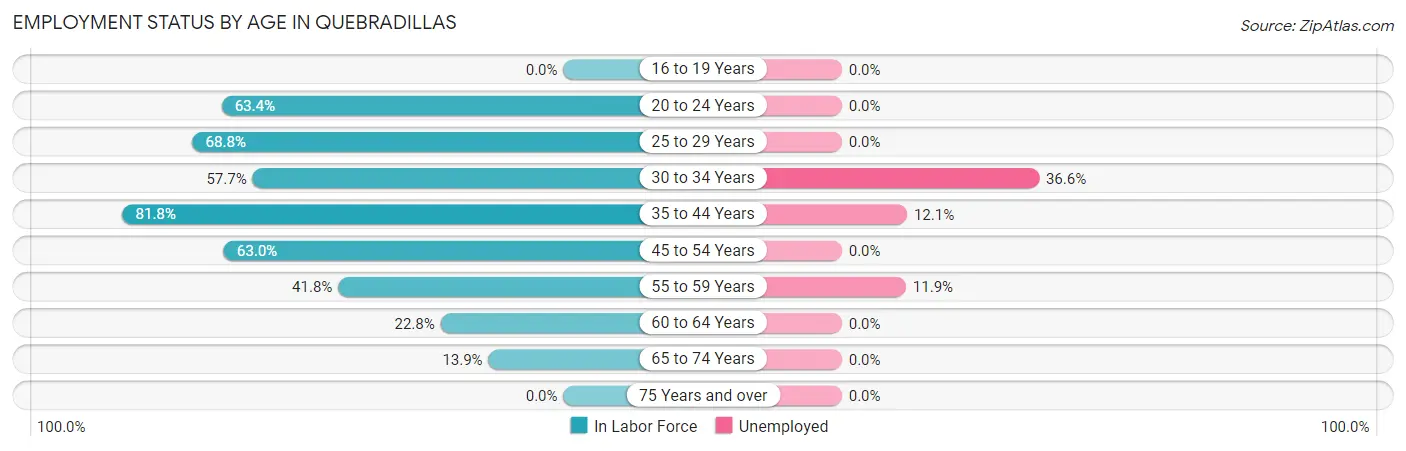
| Age Bracket | In Labor Force | Unemployed |
| 16 to 19 Years | 0 (0.0%) | 0 (0.0%) |
| 20 to 24 Years | 249 (63.4%) | 0 (0.0%) |
| 25 to 29 Years | 466 (68.8%) | 0 (0.0%) |
| 30 to 34 Years | 194 (57.7%) | 71 (36.6%) |
| 35 to 44 Years | 473 (81.8%) | 57 (12.1%) |
| 45 to 54 Years | 588 (63.0%) | 0 (0.0%) |
| 55 to 59 Years | 118 (41.8%) | 14 (11.9%) |
| 60 to 64 Years | 53 (22.8%) | 0 (0.0%) |
| 65 to 74 Years | 115 (13.9%) | 0 (0.0%) |
| 75 Years and over | 0 (0.0%) | 0 (0.0%) |
| Total | 2,254 (43.7%) | 142 (6.3%) |
Employment Status by Educational Attainment in Quebradillas
According to labor force statistics for Quebradillas, 62.3% of individuals (1,893) out of the total population between 25 and 64 years of age (3,038) are in the labor force, with 7.5% or 142 of them being unemployed. The group with the highest labor force participation rate are those with the educational attainment of bachelor's degree or higher, with 80.9% or 666 individuals in the labor force. Within the labor force, individuals with bachelor's degree or higher education have the highest percentage of unemployment, with 16.2% or 108 of them being unemployed.
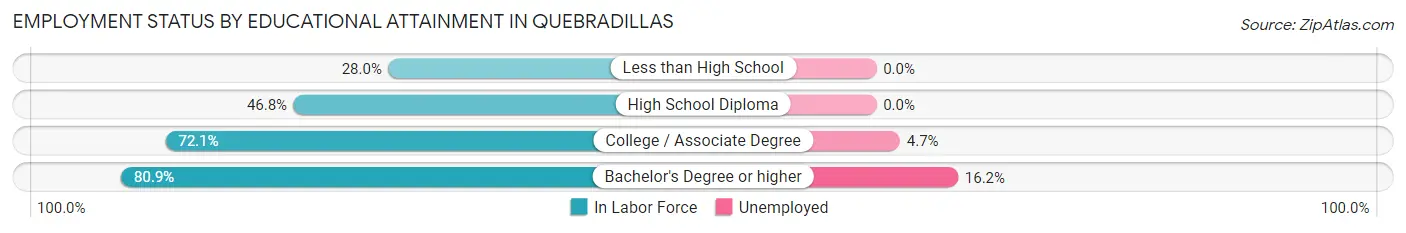
| Educational Attainment | In Labor Force | Unemployed |
| Less than High School | 95 (28.0%) | 0 (0.0%) |
| High School Diploma | 411 (46.8%) | 0 (0.0%) |
| College / Associate Degree | 720 (72.1%) | 47 (4.7%) |
| Bachelor's Degree or higher | 666 (80.9%) | 133 (16.2%) |
| Total | 1,893 (62.3%) | 228 (7.5%) |
Employment Occupations by Sex in Quebradillas
Management, Business, Science and Arts Occupations
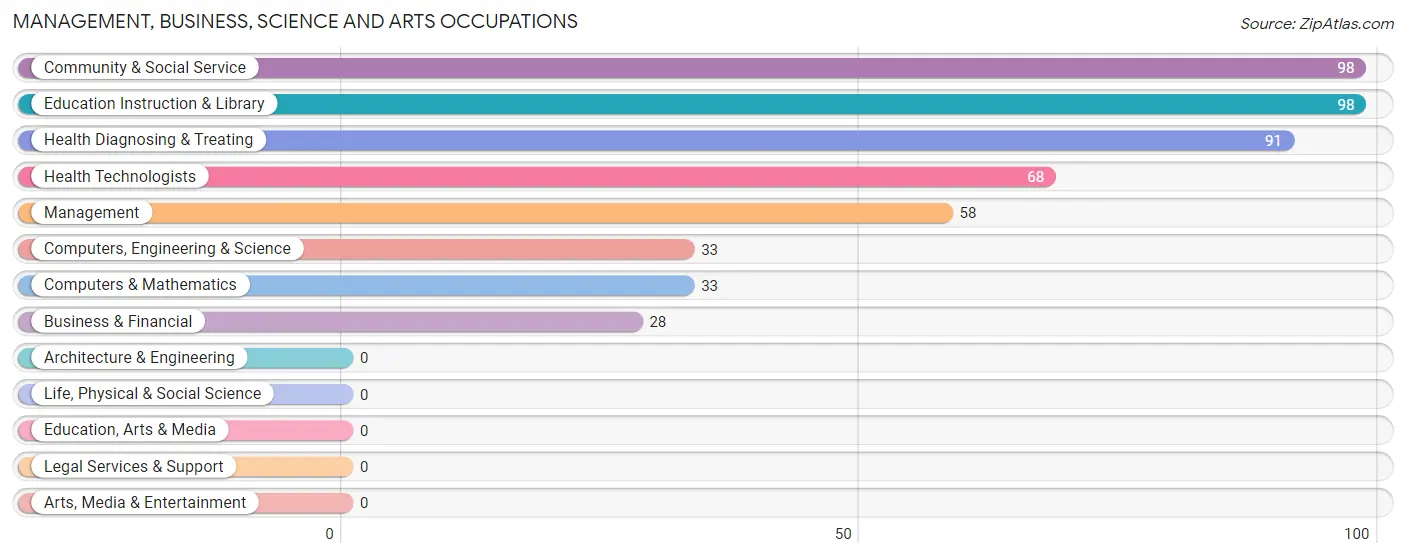
The most common Management, Business, Science and Arts occupations in Quebradillas are Community & Social Service (98 | 4.6%), Education Instruction & Library (98 | 4.6%), Health Diagnosing & Treating (91 | 4.3%), Health Technologists (68 | 3.2%), and Management (58 | 2.7%).
Management, Business, Science and Arts Occupations by Sex
Within the Management, Business, Science and Arts occupations in Quebradillas, the most male-oriented occupations are Computers, Engineering & Science (100.0%), Computers & Mathematics (100.0%), and Management (27.6%), while the most female-oriented occupations are Business & Financial (100.0%), Community & Social Service (100.0%), and Education Instruction & Library (100.0%).
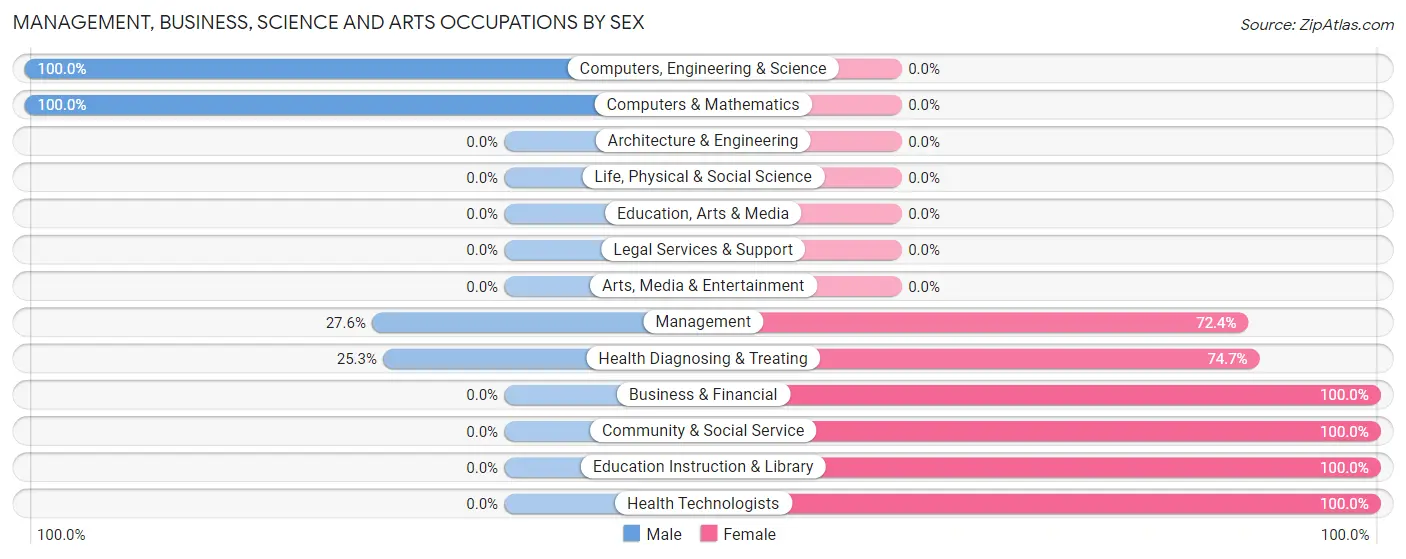
| Occupation | Male | Female |
| Management | 16 (27.6%) | 42 (72.4%) |
| Business & Financial | 0 (0.0%) | 28 (100.0%) |
| Computers, Engineering & Science | 33 (100.0%) | 0 (0.0%) |
| Computers & Mathematics | 33 (100.0%) | 0 (0.0%) |
| Architecture & Engineering | 0 (0.0%) | 0 (0.0%) |
| Life, Physical & Social Science | 0 (0.0%) | 0 (0.0%) |
| Community & Social Service | 0 (0.0%) | 98 (100.0%) |
| Education, Arts & Media | 0 (0.0%) | 0 (0.0%) |
| Legal Services & Support | 0 (0.0%) | 0 (0.0%) |
| Education Instruction & Library | 0 (0.0%) | 98 (100.0%) |
| Arts, Media & Entertainment | 0 (0.0%) | 0 (0.0%) |
| Health Diagnosing & Treating | 23 (25.3%) | 68 (74.7%) |
| Health Technologists | 0 (0.0%) | 68 (100.0%) |
| Total (Category) | 72 (23.4%) | 236 (76.6%) |
| Total (Overall) | 1,272 (60.2%) | 842 (39.8%) |
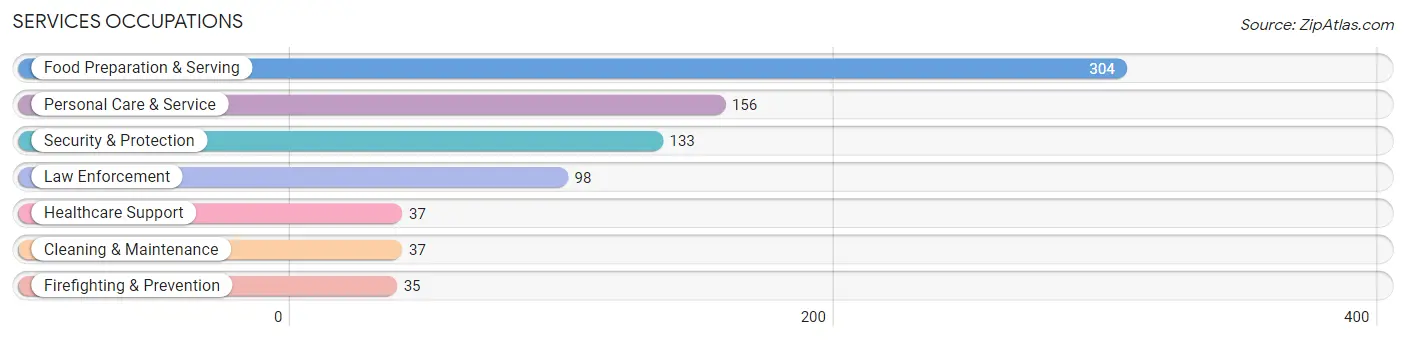
Services Occupations
The most common Services occupations in Quebradillas are Food Preparation & Serving (304 | 14.4%), Personal Care & Service (156 | 7.4%), Security & Protection (133 | 6.3%), Law Enforcement (98 | 4.6%), and Healthcare Support (37 | 1.8%).
Services Occupations by Sex
Within the Services occupations in Quebradillas, the most male-oriented occupations are Firefighting & Prevention (100.0%), Security & Protection (78.9%), and Law Enforcement (71.4%), while the most female-oriented occupations are Healthcare Support (100.0%), Cleaning & Maintenance (100.0%), and Personal Care & Service (78.2%).
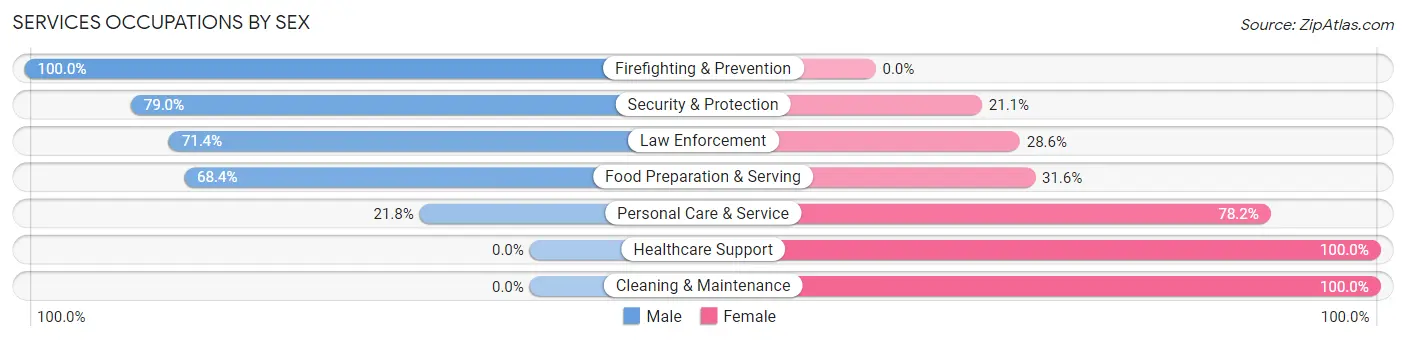
| Occupation | Male | Female |
| Healthcare Support | 0 (0.0%) | 37 (100.0%) |
| Security & Protection | 105 (78.9%) | 28 (21.0%) |
| Firefighting & Prevention | 35 (100.0%) | 0 (0.0%) |
| Law Enforcement | 70 (71.4%) | 28 (28.6%) |
| Food Preparation & Serving | 208 (68.4%) | 96 (31.6%) |
| Cleaning & Maintenance | 0 (0.0%) | 37 (100.0%) |
| Personal Care & Service | 34 (21.8%) | 122 (78.2%) |
| Total (Category) | 347 (52.0%) | 320 (48.0%) |
| Total (Overall) | 1,272 (60.2%) | 842 (39.8%) |
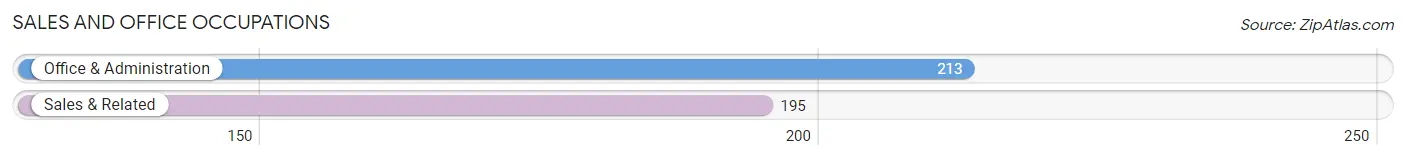
Sales and Office Occupations
The most common Sales and Office occupations in Quebradillas are Office & Administration (213 | 10.1%), and Sales & Related (195 | 9.2%).
Sales and Office Occupations by Sex
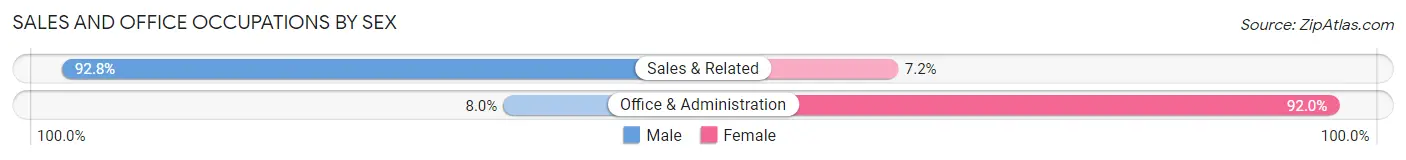
| Occupation | Male | Female |
| Sales & Related | 181 (92.8%) | 14 (7.2%) |
| Office & Administration | 17 (8.0%) | 196 (92.0%) |
| Total (Category) | 198 (48.5%) | 210 (51.5%) |
| Total (Overall) | 1,272 (60.2%) | 842 (39.8%) |
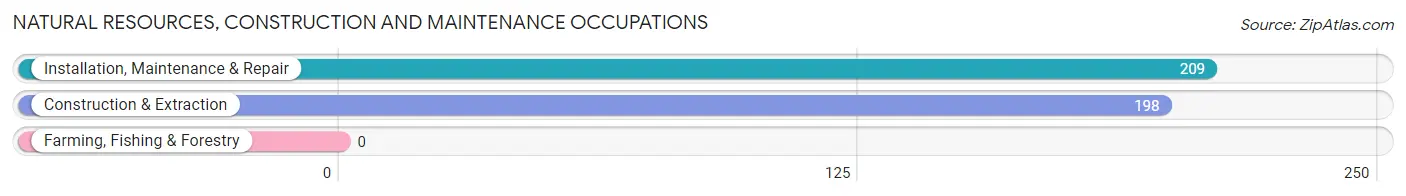
Natural Resources, Construction and Maintenance Occupations
The most common Natural Resources, Construction and Maintenance occupations in Quebradillas are Installation, Maintenance & Repair (209 | 9.9%), and Construction & Extraction (198 | 9.4%).
Natural Resources, Construction and Maintenance Occupations by Sex
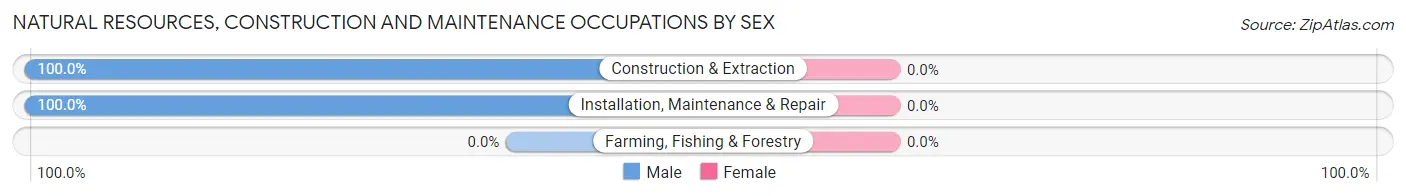
| Occupation | Male | Female |
| Farming, Fishing & Forestry | 0 (0.0%) | 0 (0.0%) |
| Construction & Extraction | 198 (100.0%) | 0 (0.0%) |
| Installation, Maintenance & Repair | 209 (100.0%) | 0 (0.0%) |
| Total (Category) | 407 (100.0%) | 0 (0.0%) |
| Total (Overall) | 1,272 (60.2%) | 842 (39.8%) |
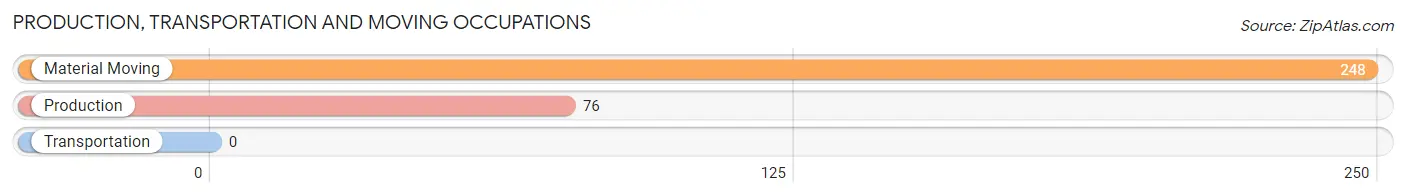
Production, Transportation and Moving Occupations
The most common Production, Transportation and Moving occupations in Quebradillas are Material Moving (248 | 11.7%), and Production (76 | 3.6%).
Production, Transportation and Moving Occupations by Sex
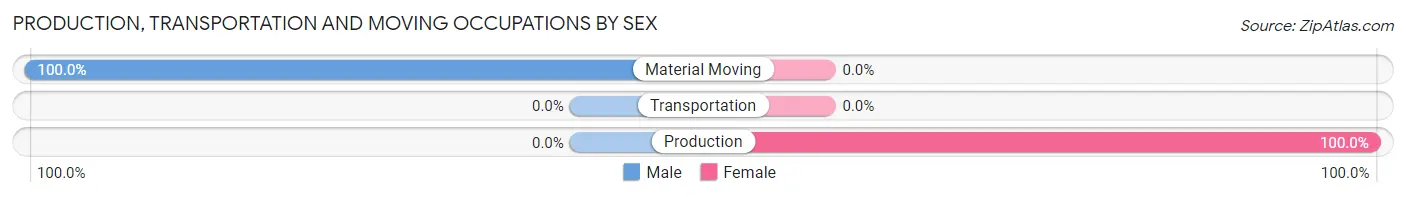
| Occupation | Male | Female |
| Production | 0 (0.0%) | 76 (100.0%) |
| Transportation | 0 (0.0%) | 0 (0.0%) |
| Material Moving | 248 (100.0%) | 0 (0.0%) |
| Total (Category) | 248 (76.5%) | 76 (23.5%) |
| Total (Overall) | 1,272 (60.2%) | 842 (39.8%) |
Employment Industries by Sex in Quebradillas
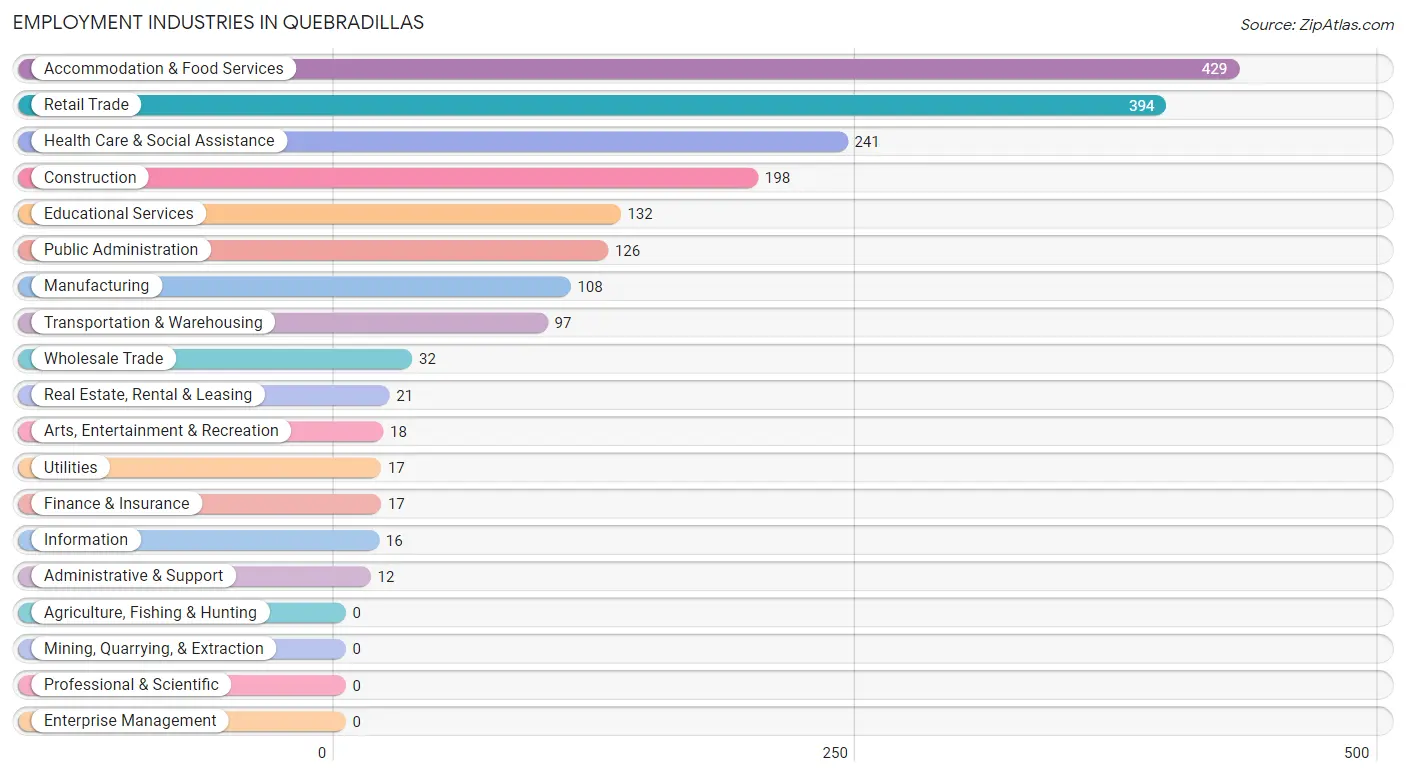
Employment Industries in Quebradillas
The major employment industries in Quebradillas include Accommodation & Food Services (429 | 20.3%), Retail Trade (394 | 18.6%), Health Care & Social Assistance (241 | 11.4%), Construction (198 | 9.4%), and Educational Services (132 | 6.2%).
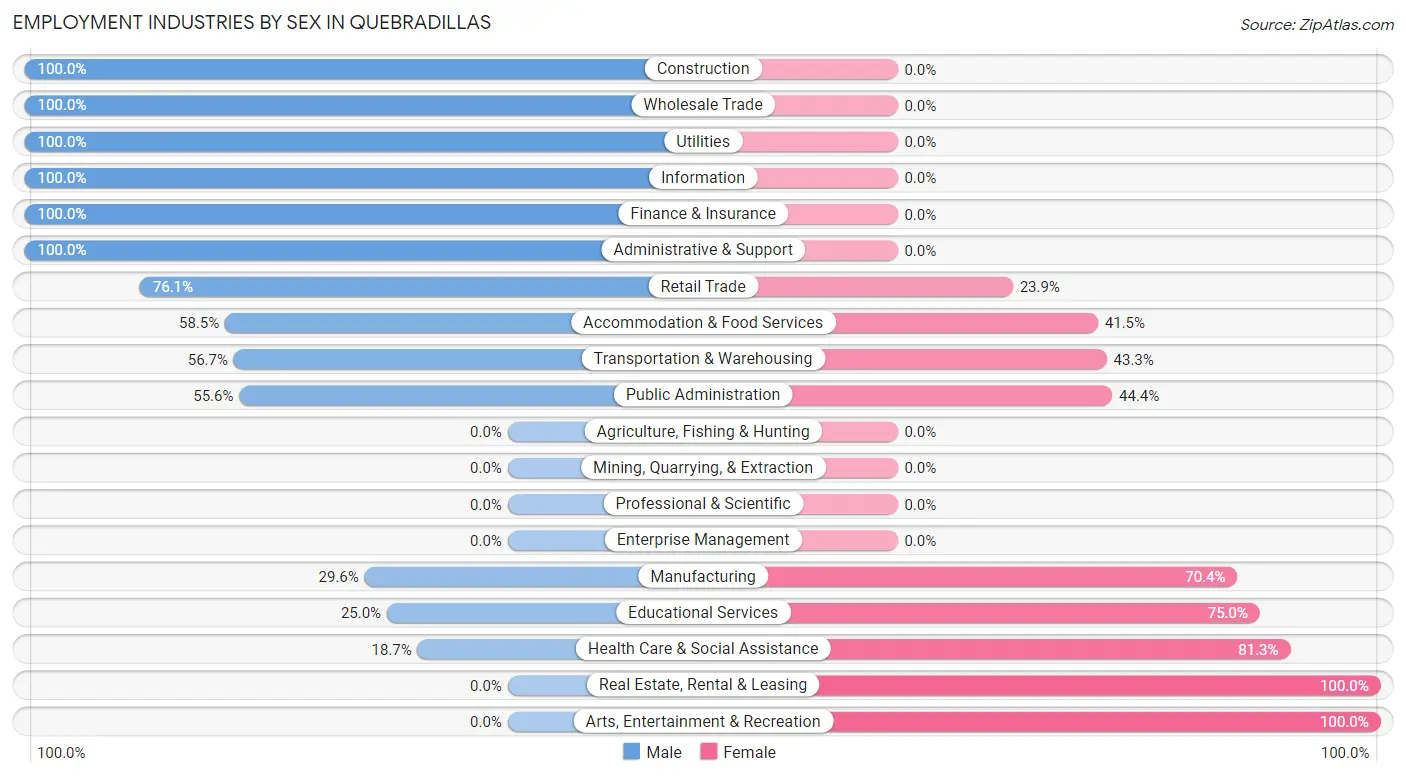
Employment Industries by Sex in Quebradillas
The Quebradillas industries that see more men than women are Construction (100.0%), Wholesale Trade (100.0%), and Utilities (100.0%), whereas the industries that tend to have a higher number of women are Real Estate, Rental & Leasing (100.0%), Arts, Entertainment & Recreation (100.0%), and Health Care & Social Assistance (81.3%).
| Industry | Male | Female |
| Agriculture, Fishing & Hunting | 0 (0.0%) | 0 (0.0%) |
| Mining, Quarrying, & Extraction | 0 (0.0%) | 0 (0.0%) |
| Construction | 198 (100.0%) | 0 (0.0%) |
| Manufacturing | 32 (29.6%) | 76 (70.4%) |
| Wholesale Trade | 32 (100.0%) | 0 (0.0%) |
| Retail Trade | 300 (76.1%) | 94 (23.9%) |
| Transportation & Warehousing | 55 (56.7%) | 42 (43.3%) |
| Utilities | 17 (100.0%) | 0 (0.0%) |
| Information | 16 (100.0%) | 0 (0.0%) |
| Finance & Insurance | 17 (100.0%) | 0 (0.0%) |
| Real Estate, Rental & Leasing | 0 (0.0%) | 21 (100.0%) |
| Professional & Scientific | 0 (0.0%) | 0 (0.0%) |
| Enterprise Management | 0 (0.0%) | 0 (0.0%) |
| Administrative & Support | 12 (100.0%) | 0 (0.0%) |
| Educational Services | 33 (25.0%) | 99 (75.0%) |
| Health Care & Social Assistance | 45 (18.7%) | 196 (81.3%) |
| Arts, Entertainment & Recreation | 0 (0.0%) | 18 (100.0%) |
| Accommodation & Food Services | 251 (58.5%) | 178 (41.5%) |
| Public Administration | 70 (55.6%) | 56 (44.4%) |
| Total | 1,272 (60.2%) | 842 (39.8%) |
Education in Quebradillas
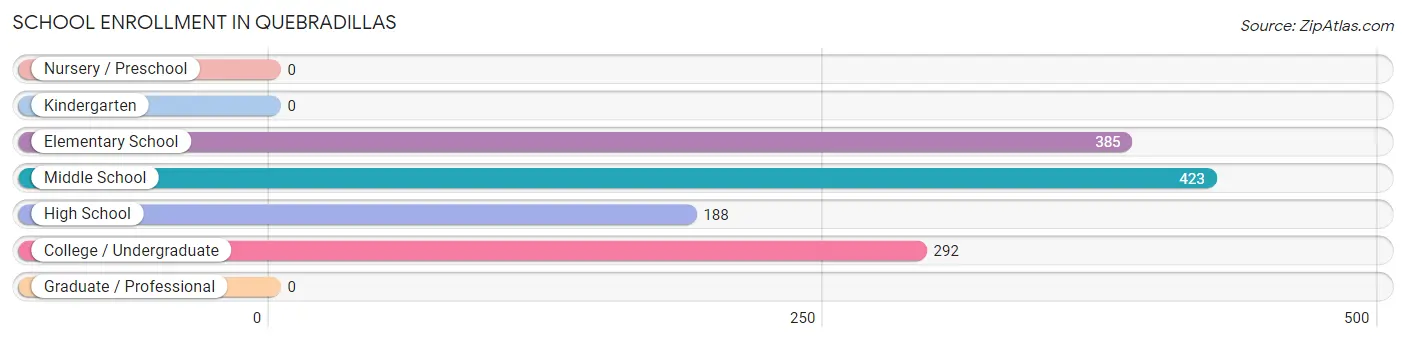
School Enrollment in Quebradillas
The most common levels of schooling among the 1,288 students in Quebradillas are middle school (423 | 32.8%), elementary school (385 | 29.9%), and college / undergraduate (292 | 22.7%).
| School Level | # Students | % Students |
| Nursery / Preschool | 0 | 0.0% |
| Kindergarten | 0 | 0.0% |
| Elementary School | 385 | 29.9% |
| Middle School | 423 | 32.8% |
| High School | 188 | 14.6% |
| College / Undergraduate | 292 | 22.7% |
| Graduate / Professional | 0 | 0.0% |
| Total | 1,288 | 100.0% |
School Enrollment by Age by Funding Source in Quebradillas
Out of a total of 1,288 students who are enrolled in schools in Quebradillas, 213 (16.5%) attend a private institution, while the remaining 1,075 (83.5%) are enrolled in public schools. The age group of 18 to 19 year olds has the highest likelihood of being enrolled in private schools, with 48 (56.5% in the age bracket) enrolled. Conversely, the age group of 10 to 14 year olds has the lowest likelihood of being enrolled in a private school, with 532 (100.0% in the age bracket) attending a public institution.
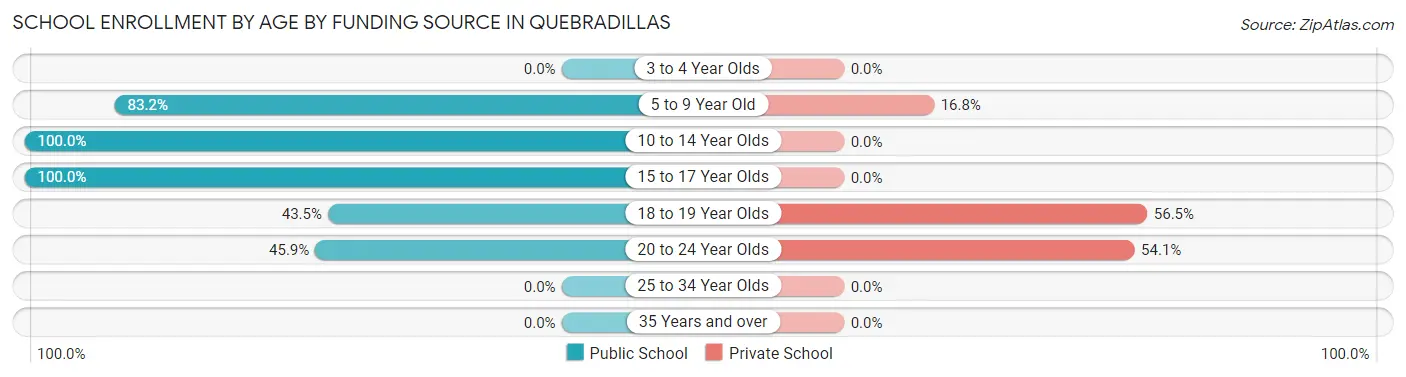
| Age Bracket | Public School | Private School |
| 3 to 4 Year Olds | 0 (0.0%) | 0 (0.0%) |
| 5 to 9 Year Old | 258 (83.2%) | 52 (16.8%) |
| 10 to 14 Year Olds | 532 (100.0%) | 0 (0.0%) |
| 15 to 17 Year Olds | 154 (100.0%) | 0 (0.0%) |
| 18 to 19 Year Olds | 37 (43.5%) | 48 (56.5%) |
| 20 to 24 Year Olds | 95 (45.9%) | 112 (54.1%) |
| 25 to 34 Year Olds | 0 (0.0%) | 0 (0.0%) |
| 35 Years and over | 0 (0.0%) | 0 (0.0%) |
| Total | 1,075 (83.5%) | 213 (16.5%) |
Educational Attainment by Field of Study in Quebradillas
Education (241 | 22.0%), computers & mathematics (197 | 18.0%), science & technology (186 | 17.0%), business (161 | 14.7%), and social sciences (93 | 8.5%) are the most common fields of study among 1,095 individuals in Quebradillas who have obtained a bachelor's degree or higher.
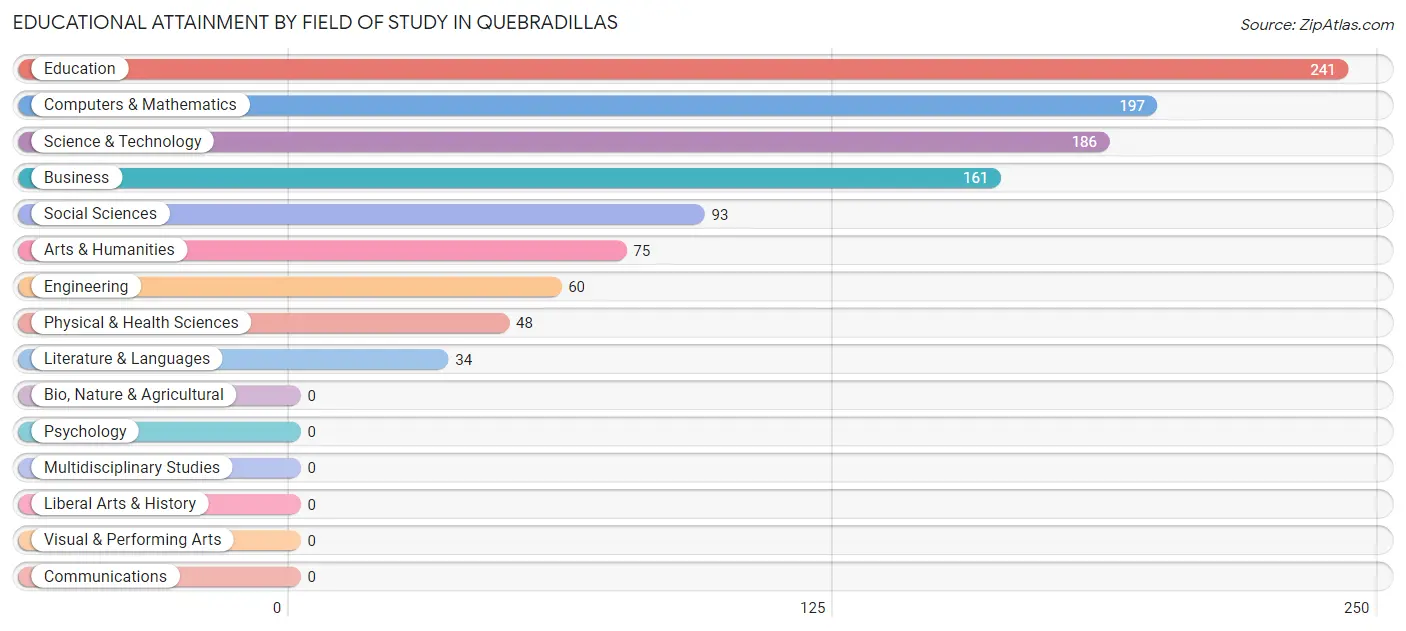
| Field of Study | # Graduates | % Graduates |
| Computers & Mathematics | 197 | 18.0% |
| Bio, Nature & Agricultural | 0 | 0.0% |
| Physical & Health Sciences | 48 | 4.4% |
| Psychology | 0 | 0.0% |
| Social Sciences | 93 | 8.5% |
| Engineering | 60 | 5.5% |
| Multidisciplinary Studies | 0 | 0.0% |
| Science & Technology | 186 | 17.0% |
| Business | 161 | 14.7% |
| Education | 241 | 22.0% |
| Literature & Languages | 34 | 3.1% |
| Liberal Arts & History | 0 | 0.0% |
| Visual & Performing Arts | 0 | 0.0% |
| Communications | 0 | 0.0% |
| Arts & Humanities | 75 | 6.9% |
| Total | 1,095 | 100.0% |
Transportation & Commute in Quebradillas
Vehicle Availability by Sex in Quebradillas
The most prevalent vehicle ownership categories in Quebradillas are males with 2 vehicles (550, accounting for 43.2%) and females with 2 vehicles (393, making up 65.3%).
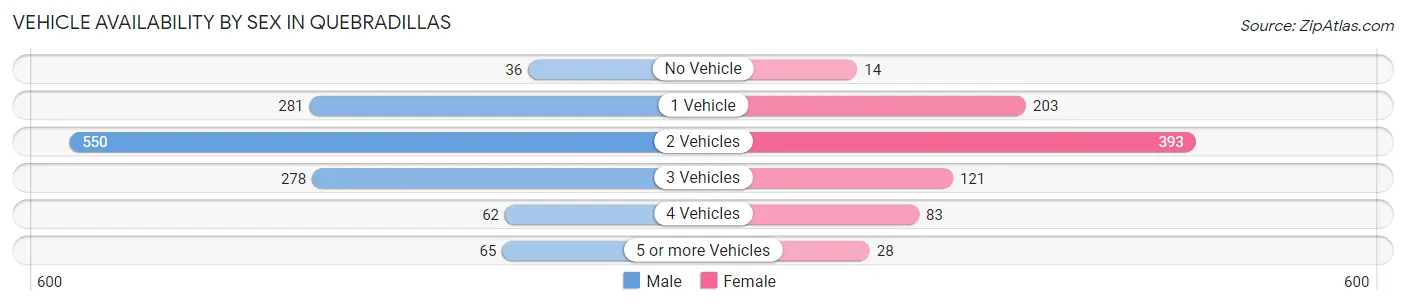
| Vehicles Available | Male | Female |
| No Vehicle | 36 (2.8%) | 14 (1.7%) |
| 1 Vehicle | 281 (22.1%) | 203 (24.1%) |
| 2 Vehicles | 550 (43.2%) | 393 (46.7%) |
| 3 Vehicles | 278 (21.9%) | 121 (14.4%) |
| 4 Vehicles | 62 (4.9%) | 83 (9.9%) |
| 5 or more Vehicles | 65 (5.1%) | 28 (3.3%) |
| Total | 1,272 (100.0%) | 842 (100.0%) |
Commute Time in Quebradillas
The most frequently occuring commute durations in Quebradillas are 20 to 24 minutes (671 commuters, 34.1%), 25 to 29 minutes (324 commuters, 16.5%), and 30 to 34 minutes (259 commuters, 13.2%).
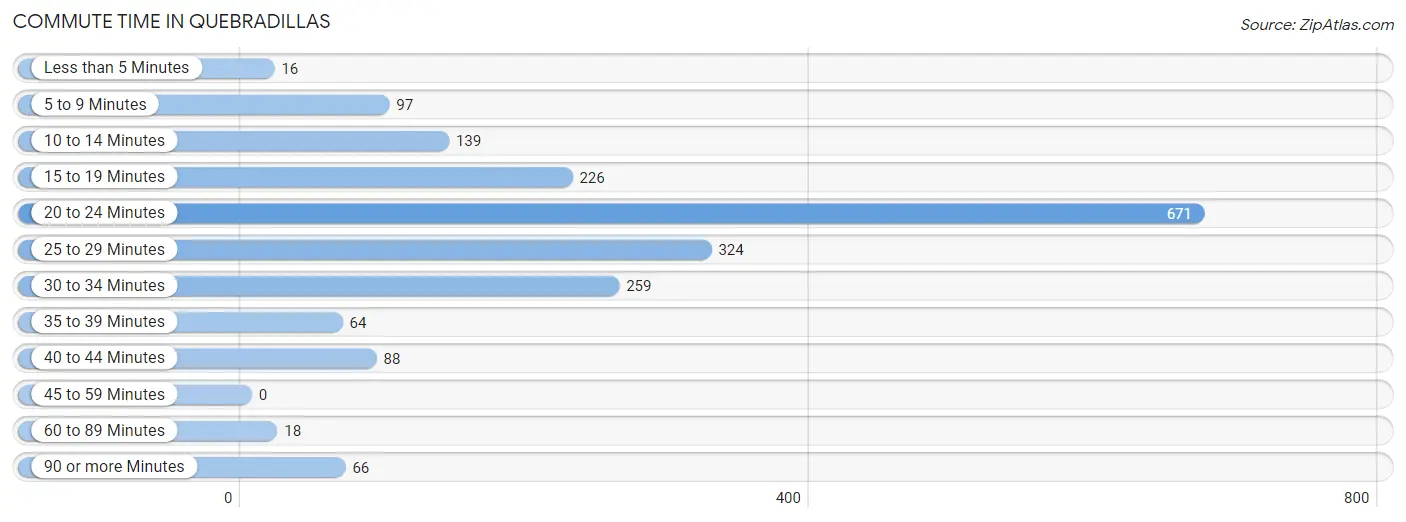
| Commute Time | # Commuters | % Commuters |
| Less than 5 Minutes | 16 | 0.8% |
| 5 to 9 Minutes | 97 | 4.9% |
| 10 to 14 Minutes | 139 | 7.1% |
| 15 to 19 Minutes | 226 | 11.5% |
| 20 to 24 Minutes | 671 | 34.1% |
| 25 to 29 Minutes | 324 | 16.5% |
| 30 to 34 Minutes | 259 | 13.2% |
| 35 to 39 Minutes | 64 | 3.3% |
| 40 to 44 Minutes | 88 | 4.5% |
| 45 to 59 Minutes | 0 | 0.0% |
| 60 to 89 Minutes | 18 | 0.9% |
| 90 or more Minutes | 66 | 3.4% |
Commute Time by Sex in Quebradillas
The most common commute times in Quebradillas are 25 to 29 minutes (273 commuters, 23.8%) for males and 20 to 24 minutes (428 commuters, 52.3%) for females.
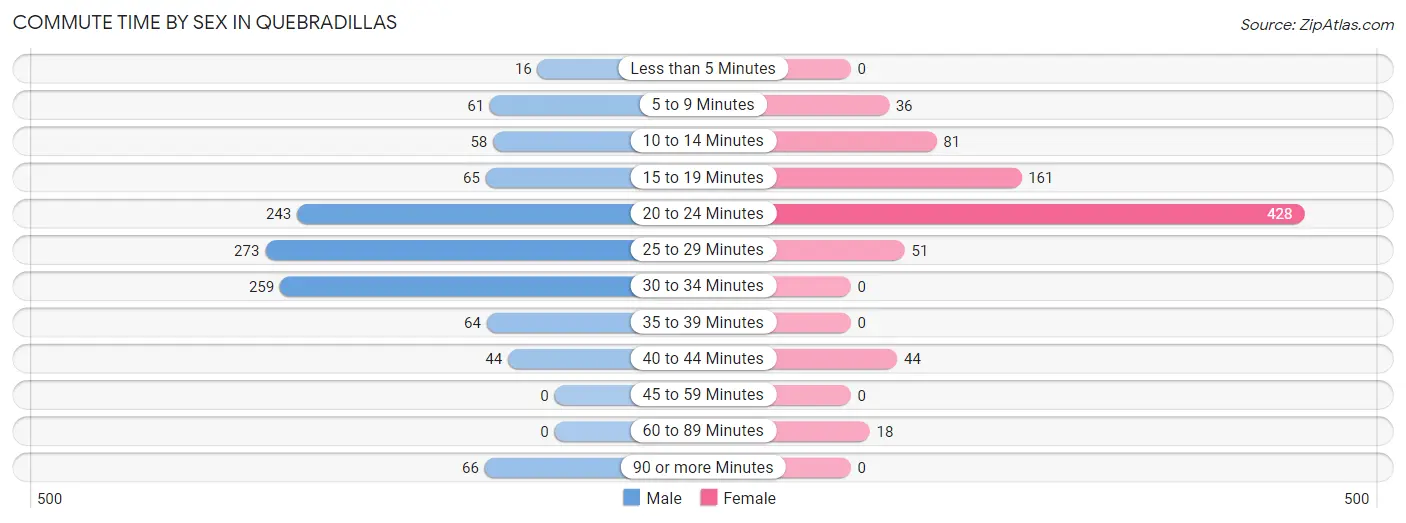
| Commute Time | Male | Female |
| Less than 5 Minutes | 16 (1.4%) | 0 (0.0%) |
| 5 to 9 Minutes | 61 (5.3%) | 36 (4.4%) |
| 10 to 14 Minutes | 58 (5.1%) | 81 (9.9%) |
| 15 to 19 Minutes | 65 (5.7%) | 161 (19.7%) |
| 20 to 24 Minutes | 243 (21.1%) | 428 (52.3%) |
| 25 to 29 Minutes | 273 (23.8%) | 51 (6.2%) |
| 30 to 34 Minutes | 259 (22.5%) | 0 (0.0%) |
| 35 to 39 Minutes | 64 (5.6%) | 0 (0.0%) |
| 40 to 44 Minutes | 44 (3.8%) | 44 (5.4%) |
| 45 to 59 Minutes | 0 (0.0%) | 0 (0.0%) |
| 60 to 89 Minutes | 0 (0.0%) | 18 (2.2%) |
| 90 or more Minutes | 66 (5.7%) | 0 (0.0%) |
Time of Departure to Work by Sex in Quebradillas
The most frequent times of departure to work in Quebradillas are 7:00 AM to 7:29 AM (352, 30.6%) for males and 7:00 AM to 7:29 AM (247, 30.2%) for females.
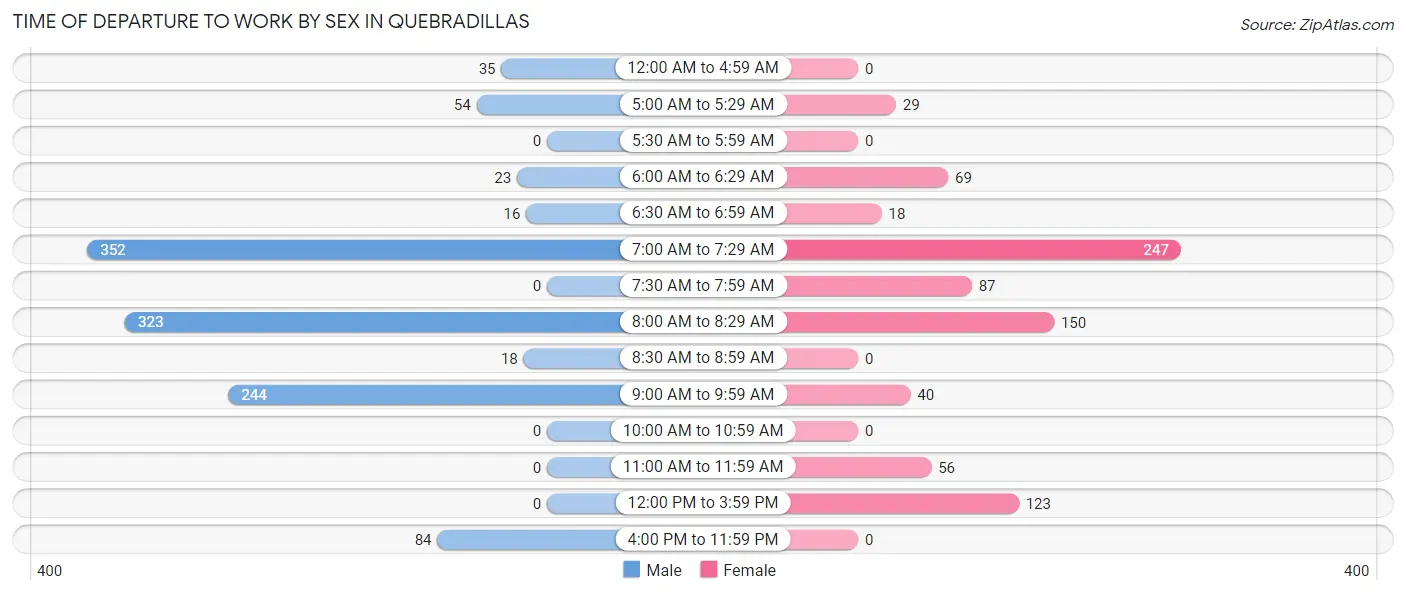
| Time of Departure | Male | Female |
| 12:00 AM to 4:59 AM | 35 (3.0%) | 0 (0.0%) |
| 5:00 AM to 5:29 AM | 54 (4.7%) | 29 (3.5%) |
| 5:30 AM to 5:59 AM | 0 (0.0%) | 0 (0.0%) |
| 6:00 AM to 6:29 AM | 23 (2.0%) | 69 (8.4%) |
| 6:30 AM to 6:59 AM | 16 (1.4%) | 18 (2.2%) |
| 7:00 AM to 7:29 AM | 352 (30.6%) | 247 (30.2%) |
| 7:30 AM to 7:59 AM | 0 (0.0%) | 87 (10.6%) |
| 8:00 AM to 8:29 AM | 323 (28.1%) | 150 (18.3%) |
| 8:30 AM to 8:59 AM | 18 (1.6%) | 0 (0.0%) |
| 9:00 AM to 9:59 AM | 244 (21.2%) | 40 (4.9%) |
| 10:00 AM to 10:59 AM | 0 (0.0%) | 0 (0.0%) |
| 11:00 AM to 11:59 AM | 0 (0.0%) | 56 (6.8%) |
| 12:00 PM to 3:59 PM | 0 (0.0%) | 123 (15.0%) |
| 4:00 PM to 11:59 PM | 84 (7.3%) | 0 (0.0%) |
| Total | 1,149 (100.0%) | 819 (100.0%) |
Housing Occupancy in Quebradillas
Occupancy by Ownership in Quebradillas
Of the total 2,040 dwellings in Quebradillas, owner-occupied units account for 994 (48.7%), while renter-occupied units make up 1,046 (51.3%).
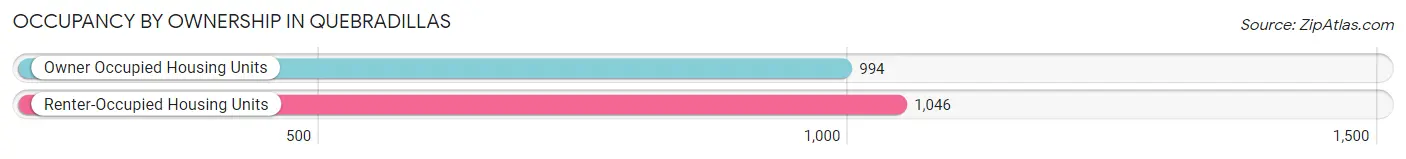
| Occupancy | # Housing Units | % Housing Units |
| Owner Occupied Housing Units | 994 | 48.7% |
| Renter-Occupied Housing Units | 1,046 | 51.3% |
| Total Occupied Housing Units | 2,040 | 100.0% |
Occupancy by Household Size in Quebradillas
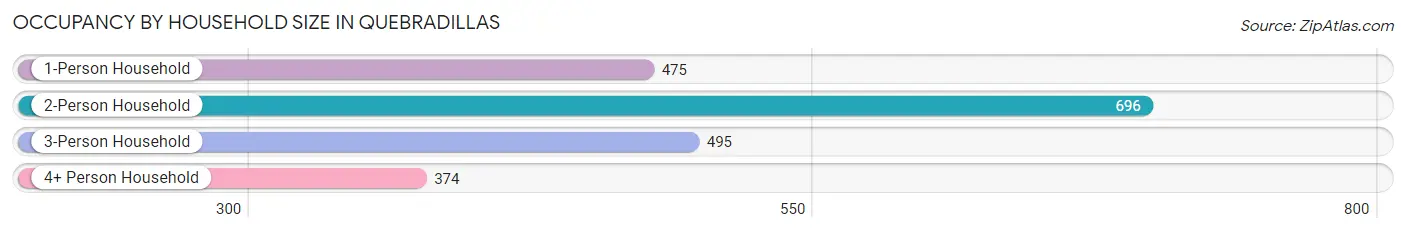
| Household Size | # Housing Units | % Housing Units |
| 1-Person Household | 475 | 23.3% |
| 2-Person Household | 696 | 34.1% |
| 3-Person Household | 495 | 24.3% |
| 4+ Person Household | 374 | 18.3% |
| Total Housing Units | 2,040 | 100.0% |
Occupancy by Ownership by Household Size in Quebradillas
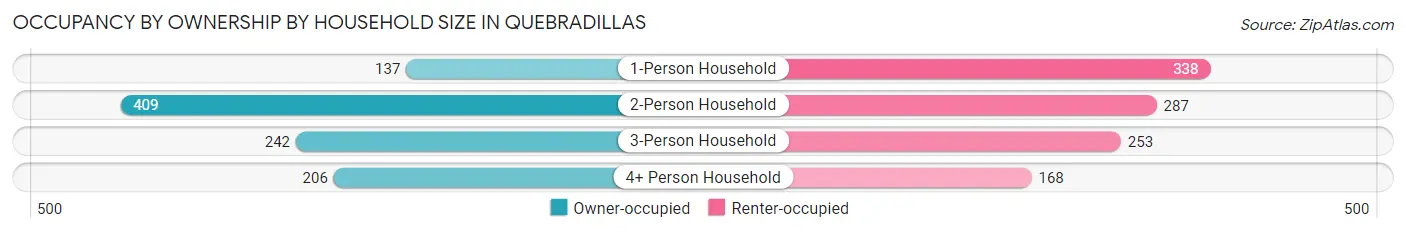
| Household Size | Owner-occupied | Renter-occupied |
| 1-Person Household | 137 (28.8%) | 338 (71.2%) |
| 2-Person Household | 409 (58.8%) | 287 (41.2%) |
| 3-Person Household | 242 (48.9%) | 253 (51.1%) |
| 4+ Person Household | 206 (55.1%) | 168 (44.9%) |
| Total Housing Units | 994 (48.7%) | 1,046 (51.3%) |
Occupancy by Educational Attainment in Quebradillas
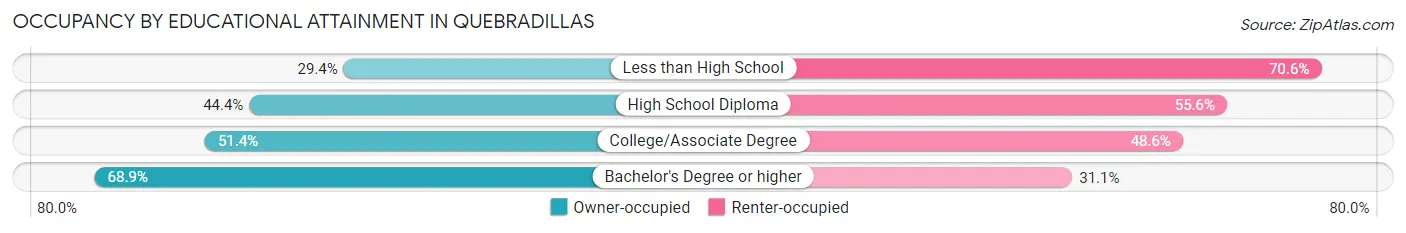
| Household Size | Owner-occupied | Renter-occupied |
| Less than High School | 100 (29.4%) | 240 (70.6%) |
| High School Diploma | 320 (44.4%) | 401 (55.6%) |
| College/Associate Degree | 295 (51.4%) | 279 (48.6%) |
| Bachelor's Degree or higher | 279 (68.9%) | 126 (31.1%) |
Occupancy by Age of Householder in Quebradillas
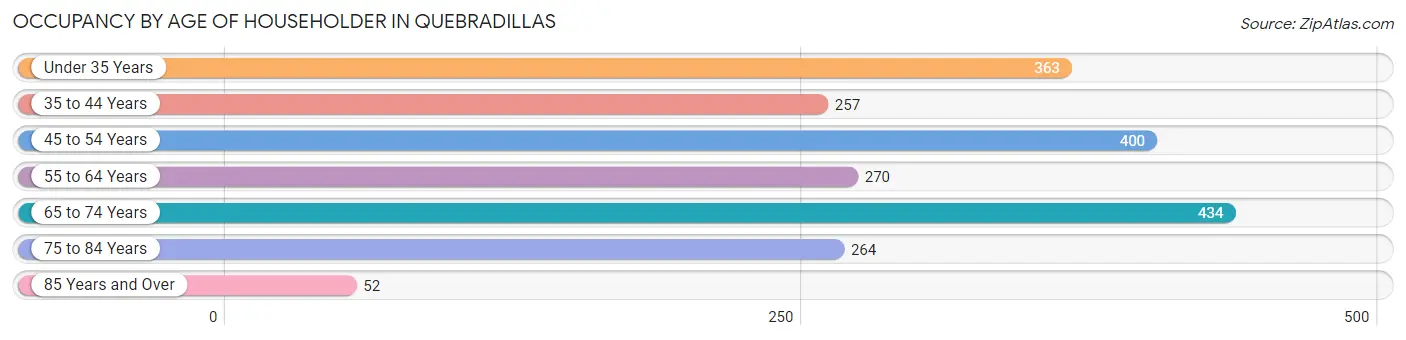
| Age Bracket | # Households | % Households |
| Under 35 Years | 363 | 17.8% |
| 35 to 44 Years | 257 | 12.6% |
| 45 to 54 Years | 400 | 19.6% |
| 55 to 64 Years | 270 | 13.2% |
| 65 to 74 Years | 434 | 21.3% |
| 75 to 84 Years | 264 | 12.9% |
| 85 Years and Over | 52 | 2.5% |
| Total | 2,040 | 100.0% |
Housing Finances in Quebradillas
Median Income by Occupancy in Quebradillas
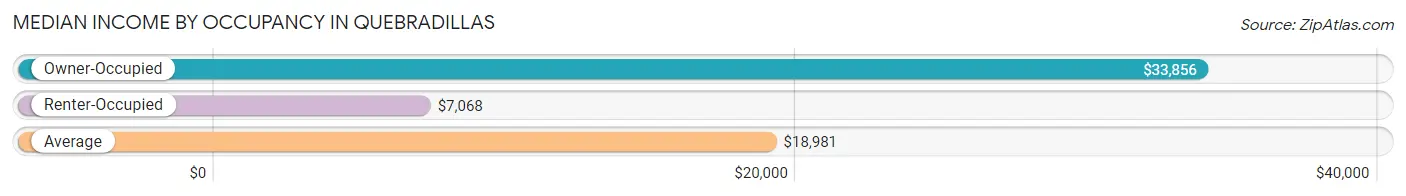
| Occupancy Type | # Households | Median Income |
| Owner-Occupied | 994 (48.7%) | $33,856 |
| Renter-Occupied | 1,046 (51.3%) | $7,068 |
| Average | 2,040 (100.0%) | $18,981 |
Occupancy by Householder Income Bracket in Quebradillas
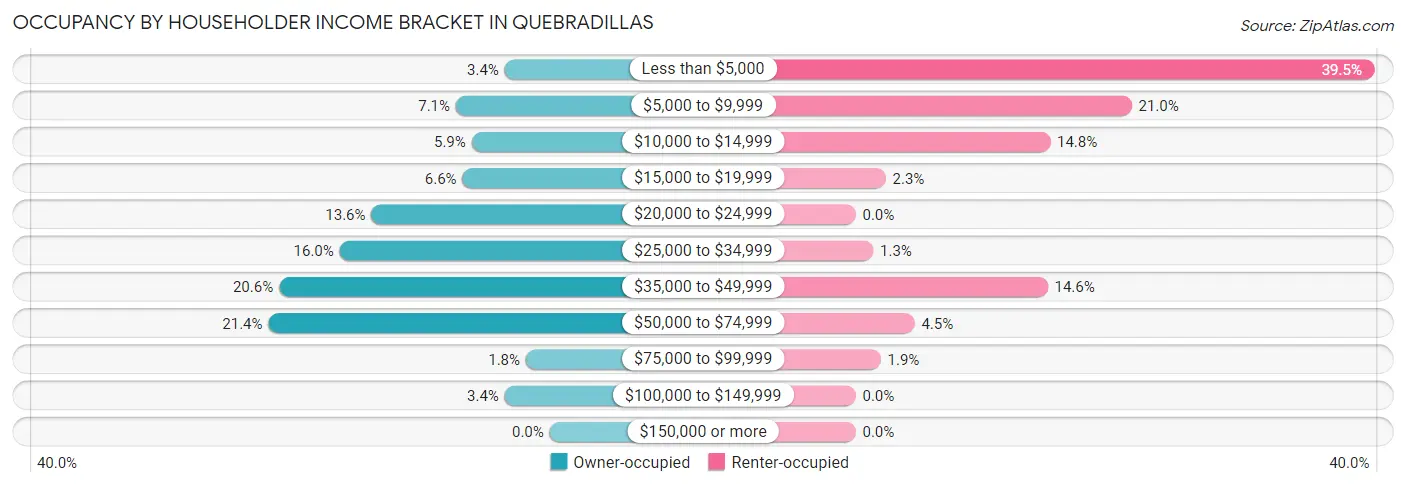
| Income Bracket | Owner-occupied | Renter-occupied |
| Less than $5,000 | 34 (3.4%) | 413 (39.5%) |
| $5,000 to $9,999 | 71 (7.1%) | 220 (21.0%) |
| $10,000 to $14,999 | 59 (5.9%) | 155 (14.8%) |
| $15,000 to $19,999 | 66 (6.6%) | 24 (2.3%) |
| $20,000 to $24,999 | 135 (13.6%) | 0 (0.0%) |
| $25,000 to $34,999 | 159 (16.0%) | 14 (1.3%) |
| $35,000 to $49,999 | 205 (20.6%) | 153 (14.6%) |
| $50,000 to $74,999 | 213 (21.4%) | 47 (4.5%) |
| $75,000 to $99,999 | 18 (1.8%) | 20 (1.9%) |
| $100,000 to $149,999 | 34 (3.4%) | 0 (0.0%) |
| $150,000 or more | 0 (0.0%) | 0 (0.0%) |
| Total | 994 (100.0%) | 1,046 (100.0%) |
Monthly Housing Cost Tiers in Quebradillas
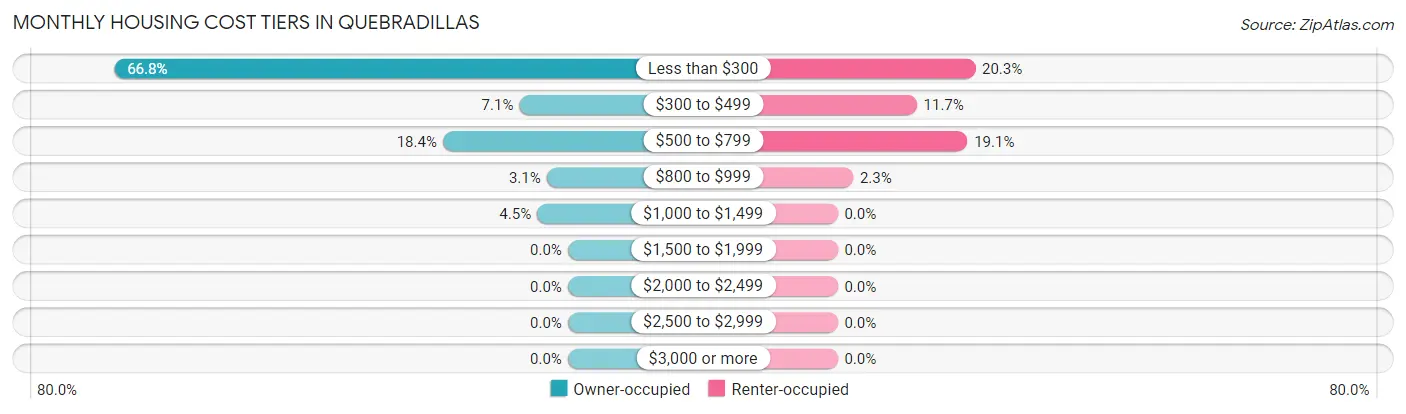
| Monthly Cost | Owner-occupied | Renter-occupied |
| Less than $300 | 664 (66.8%) | 212 (20.3%) |
| $300 to $499 | 71 (7.1%) | 122 (11.7%) |
| $500 to $799 | 183 (18.4%) | 200 (19.1%) |
| $800 to $999 | 31 (3.1%) | 24 (2.3%) |
| $1,000 to $1,499 | 45 (4.5%) | 0 (0.0%) |
| $1,500 to $1,999 | 0 (0.0%) | 0 (0.0%) |
| $2,000 to $2,499 | 0 (0.0%) | 0 (0.0%) |
| $2,500 to $2,999 | 0 (0.0%) | 0 (0.0%) |
| $3,000 or more | 0 (0.0%) | 0 (0.0%) |
| Total | 994 (100.0%) | 1,046 (100.0%) |
Physical Housing Characteristics in Quebradillas
Housing Structures in Quebradillas
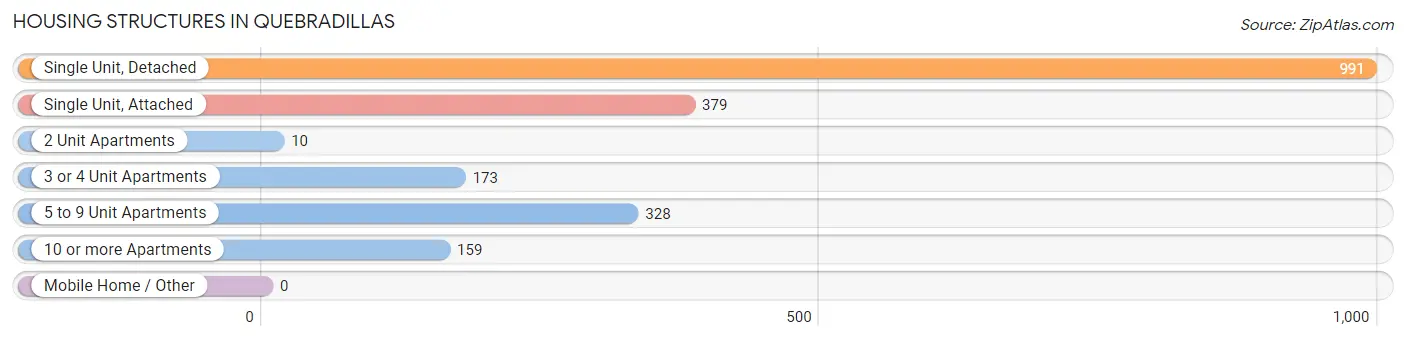
| Structure Type | # Housing Units | % Housing Units |
| Single Unit, Detached | 991 | 48.6% |
| Single Unit, Attached | 379 | 18.6% |
| 2 Unit Apartments | 10 | 0.5% |
| 3 or 4 Unit Apartments | 173 | 8.5% |
| 5 to 9 Unit Apartments | 328 | 16.1% |
| 10 or more Apartments | 159 | 7.8% |
| Mobile Home / Other | 0 | 0.0% |
| Total | 2,040 | 100.0% |
Housing Structures by Occupancy in Quebradillas
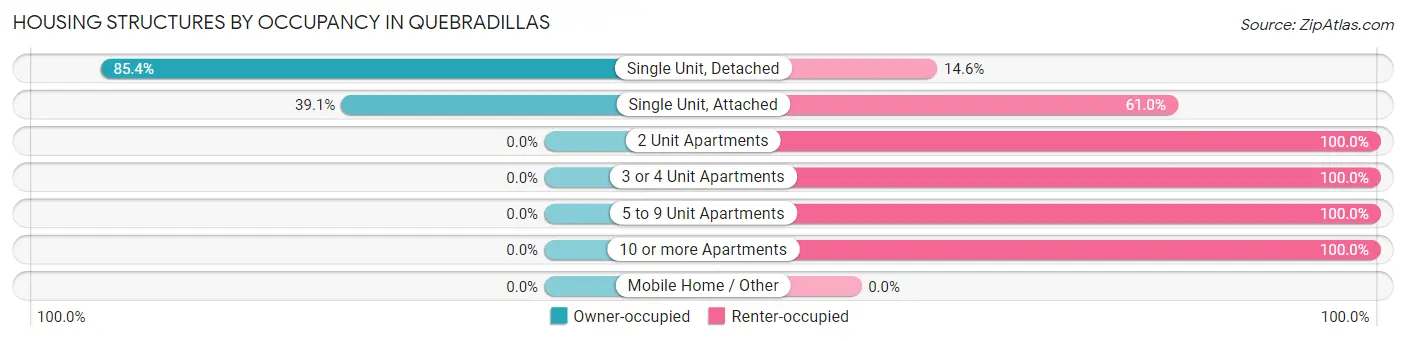
| Structure Type | Owner-occupied | Renter-occupied |
| Single Unit, Detached | 846 (85.4%) | 145 (14.6%) |
| Single Unit, Attached | 148 (39.1%) | 231 (61.0%) |
| 2 Unit Apartments | 0 (0.0%) | 10 (100.0%) |
| 3 or 4 Unit Apartments | 0 (0.0%) | 173 (100.0%) |
| 5 to 9 Unit Apartments | 0 (0.0%) | 328 (100.0%) |
| 10 or more Apartments | 0 (0.0%) | 159 (100.0%) |
| Mobile Home / Other | 0 (0.0%) | 0 (0.0%) |
| Total | 994 (48.7%) | 1,046 (51.3%) |
Housing Structures by Number of Rooms in Quebradillas
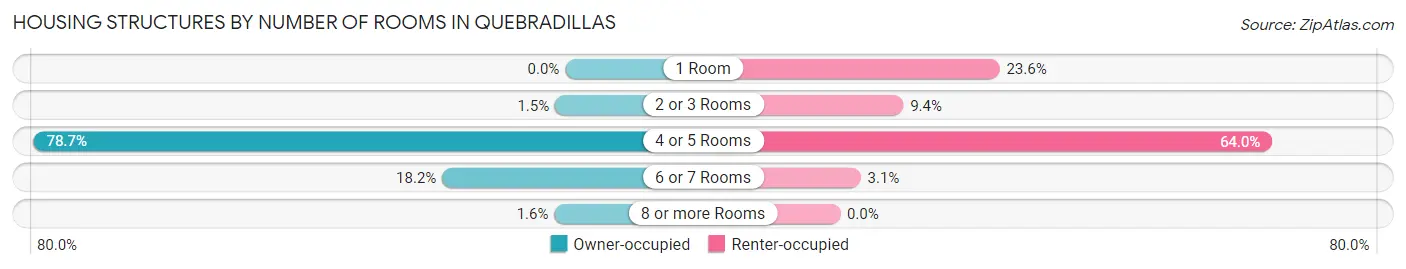
| Number of Rooms | Owner-occupied | Renter-occupied |
| 1 Room | 0 (0.0%) | 247 (23.6%) |
| 2 or 3 Rooms | 15 (1.5%) | 98 (9.4%) |
| 4 or 5 Rooms | 782 (78.7%) | 669 (64.0%) |
| 6 or 7 Rooms | 181 (18.2%) | 32 (3.1%) |
| 8 or more Rooms | 16 (1.6%) | 0 (0.0%) |
| Total | 994 (100.0%) | 1,046 (100.0%) |
Housing Structure by Heating Type in Quebradillas
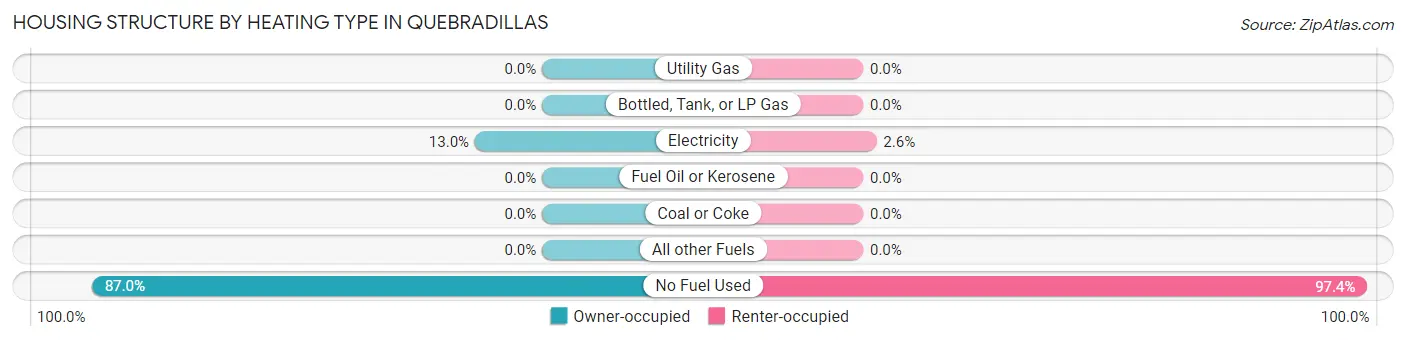
| Heating Type | Owner-occupied | Renter-occupied |
| Utility Gas | 0 (0.0%) | 0 (0.0%) |
| Bottled, Tank, or LP Gas | 0 (0.0%) | 0 (0.0%) |
| Electricity | 129 (13.0%) | 27 (2.6%) |
| Fuel Oil or Kerosene | 0 (0.0%) | 0 (0.0%) |
| Coal or Coke | 0 (0.0%) | 0 (0.0%) |
| All other Fuels | 0 (0.0%) | 0 (0.0%) |
| No Fuel Used | 865 (87.0%) | 1,019 (97.4%) |
| Total | 994 (100.0%) | 1,046 (100.0%) |
Household Vehicle Usage in Quebradillas
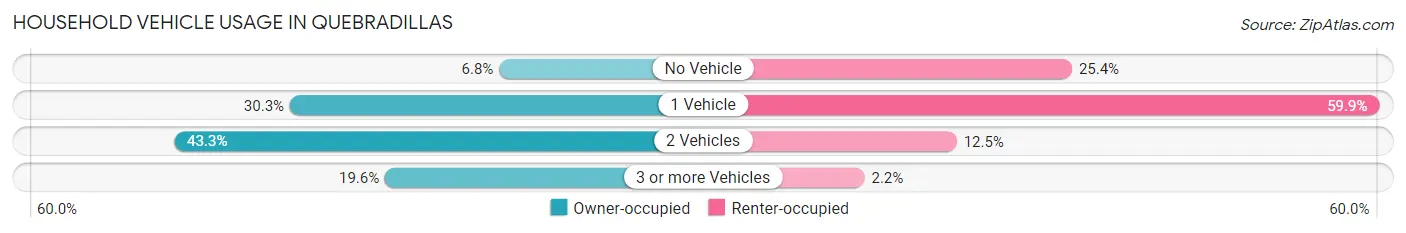
| Vehicles per Household | Owner-occupied | Renter-occupied |
| No Vehicle | 68 (6.8%) | 266 (25.4%) |
| 1 Vehicle | 301 (30.3%) | 626 (59.9%) |
| 2 Vehicles | 430 (43.3%) | 131 (12.5%) |
| 3 or more Vehicles | 195 (19.6%) | 23 (2.2%) |
| Total | 994 (100.0%) | 1,046 (100.0%) |
Real Estate & Mortgages in Quebradillas
Real Estate and Mortgage Overview in Quebradillas
| Characteristic | Without Mortgage | With Mortgage |
| Housing Units | 735 | 259 |
| Median Property Value | $98,200 | $102,600 |
| Median Household Income | $28,902 | $0 |
| Monthly Housing Costs | $178 | $0 |
| Real Estate Taxes | - | - |
Property Value by Mortgage Status in Quebradillas
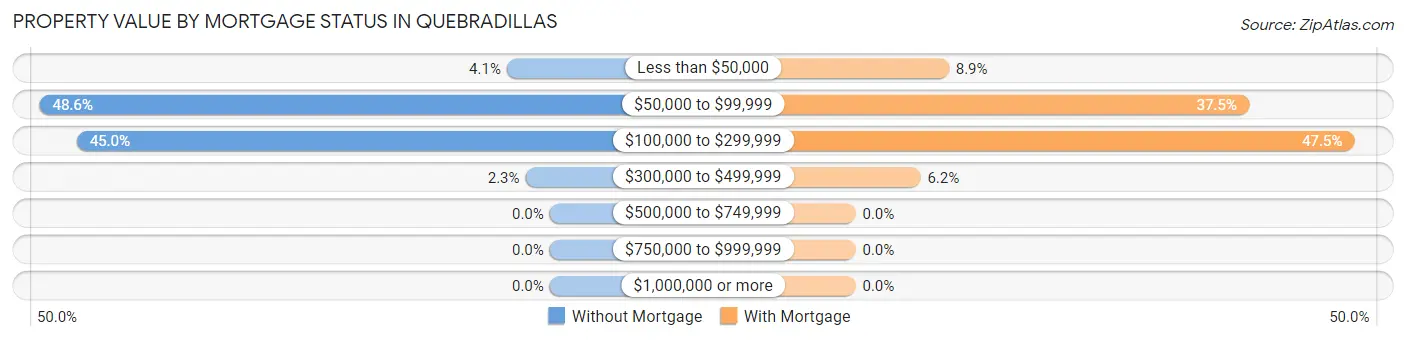
| Property Value | Without Mortgage | With Mortgage |
| Less than $50,000 | 30 (4.1%) | 23 (8.9%) |
| $50,000 to $99,999 | 357 (48.6%) | 97 (37.4%) |
| $100,000 to $299,999 | 331 (45.0%) | 123 (47.5%) |
| $300,000 to $499,999 | 17 (2.3%) | 16 (6.2%) |
| $500,000 to $749,999 | 0 (0.0%) | 0 (0.0%) |
| $750,000 to $999,999 | 0 (0.0%) | 0 (0.0%) |
| $1,000,000 or more | 0 (0.0%) | 0 (0.0%) |
| Total | 735 (100.0%) | 259 (100.0%) |
Household Income by Mortgage Status in Quebradillas
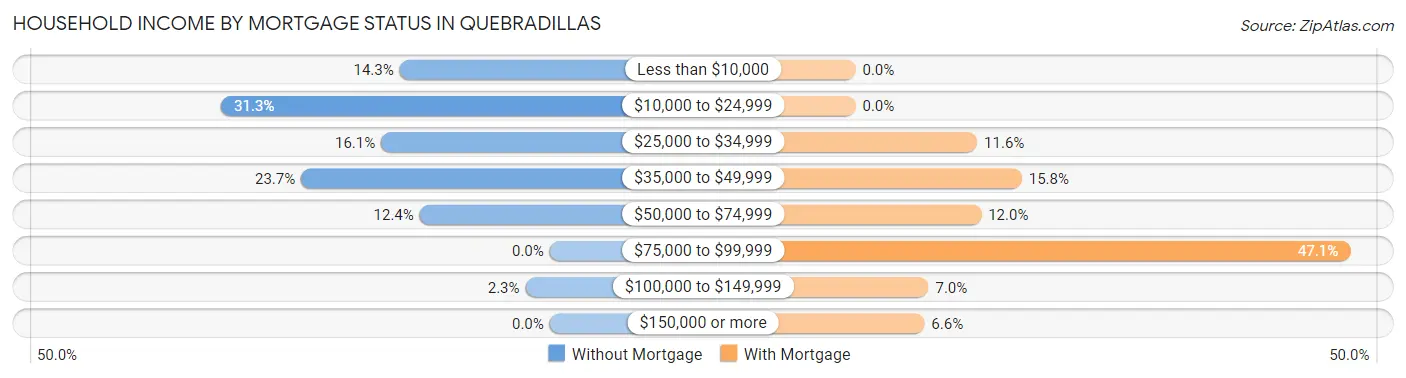
| Household Income | Without Mortgage | With Mortgage |
| Less than $10,000 | 105 (14.3%) | 0 (0.0%) |
| $10,000 to $24,999 | 230 (31.3%) | 0 (0.0%) |
| $25,000 to $34,999 | 118 (16.1%) | 30 (11.6%) |
| $35,000 to $49,999 | 174 (23.7%) | 41 (15.8%) |
| $50,000 to $74,999 | 91 (12.4%) | 31 (12.0%) |
| $75,000 to $99,999 | 0 (0.0%) | 122 (47.1%) |
| $100,000 to $149,999 | 17 (2.3%) | 18 (7.0%) |
| $150,000 or more | 0 (0.0%) | 17 (6.6%) |
| Total | 735 (100.0%) | 259 (100.0%) |
Property Value to Household Income Ratio in Quebradillas
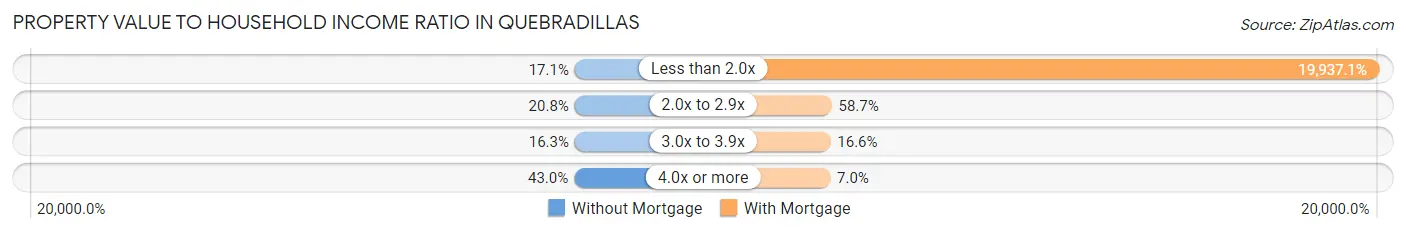
| Value-to-Income Ratio | Without Mortgage | With Mortgage |
| Less than 2.0x | 126 (17.1%) | 51,637 (19,937.1%) |
| 2.0x to 2.9x | 153 (20.8%) | 152 (58.7%) |
| 3.0x to 3.9x | 120 (16.3%) | 43 (16.6%) |
| 4.0x or more | 316 (43.0%) | 18 (7.0%) |
| Total | 735 (100.0%) | 259 (100.0%) |
Real Estate Taxes by Mortgage Status in Quebradillas
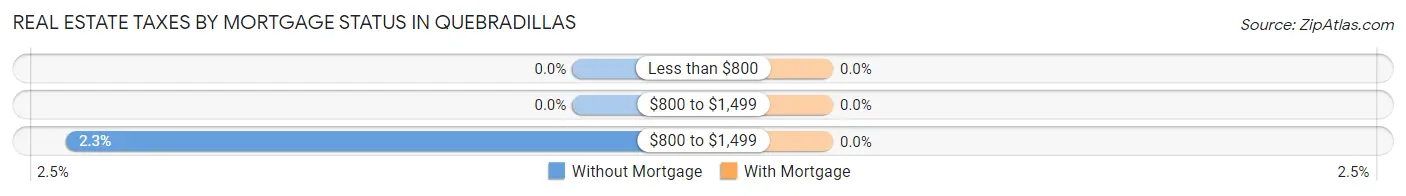
| Property Taxes | Without Mortgage | With Mortgage |
| Less than $800 | 0 (0.0%) | 0 (0.0%) |
| $800 to $1,499 | 0 (0.0%) | 0 (0.0%) |
| $800 to $1,499 | 17 (2.3%) | 0 (0.0%) |
| Total | 735 (100.0%) | 259 (100.0%) |
Health & Disability in Quebradillas
Health Insurance Coverage by Age in Quebradillas
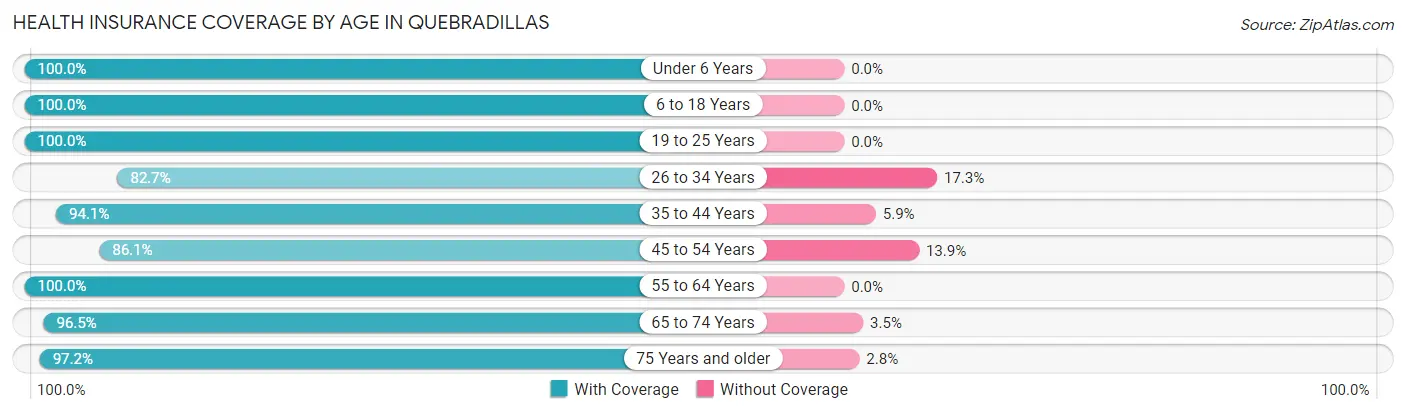
| Age Bracket | With Coverage | Without Coverage |
| Under 6 Years | 31 (100.0%) | 0 (0.0%) |
| 6 to 18 Years | 1,108 (100.0%) | 0 (0.0%) |
| 19 to 25 Years | 618 (100.0%) | 0 (0.0%) |
| 26 to 34 Years | 703 (82.7%) | 147 (17.3%) |
| 35 to 44 Years | 544 (94.1%) | 34 (5.9%) |
| 45 to 54 Years | 803 (86.1%) | 130 (13.9%) |
| 55 to 64 Years | 514 (100.0%) | 0 (0.0%) |
| 65 to 74 Years | 795 (96.5%) | 29 (3.5%) |
| 75 Years and older | 688 (97.2%) | 20 (2.8%) |
| Total | 5,804 (94.2%) | 360 (5.8%) |
Health Insurance Coverage by Citizenship Status in Quebradillas
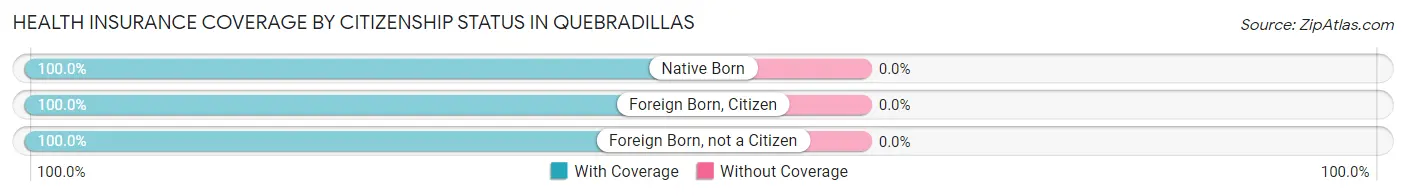
| Citizenship Status | With Coverage | Without Coverage |
| Native Born | 31 (100.0%) | 0 (0.0%) |
| Foreign Born, Citizen | 1,108 (100.0%) | 0 (0.0%) |
| Foreign Born, not a Citizen | 618 (100.0%) | 0 (0.0%) |
Health Insurance Coverage by Household Income in Quebradillas
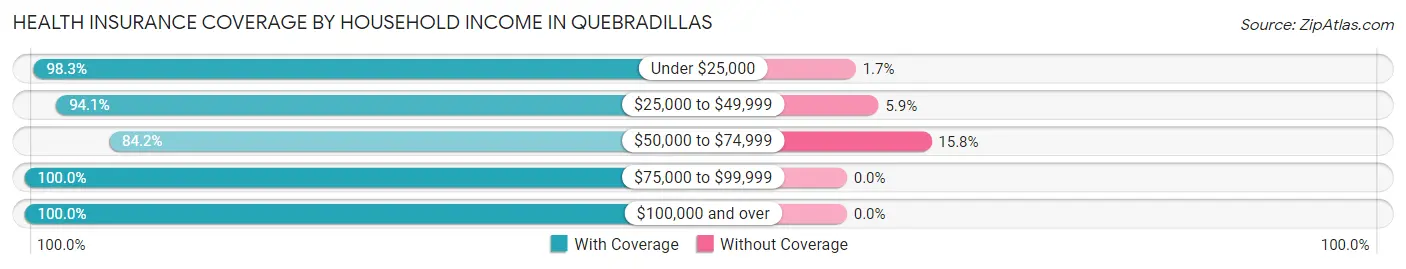
| Household Income | With Coverage | Without Coverage |
| Under $25,000 | 2,526 (98.3%) | 43 (1.7%) |
| $25,000 to $49,999 | 1,778 (94.1%) | 112 (5.9%) |
| $50,000 to $74,999 | 1,089 (84.2%) | 205 (15.8%) |
| $75,000 to $99,999 | 150 (100.0%) | 0 (0.0%) |
| $100,000 and over | 116 (100.0%) | 0 (0.0%) |
Public vs Private Health Insurance Coverage by Age in Quebradillas
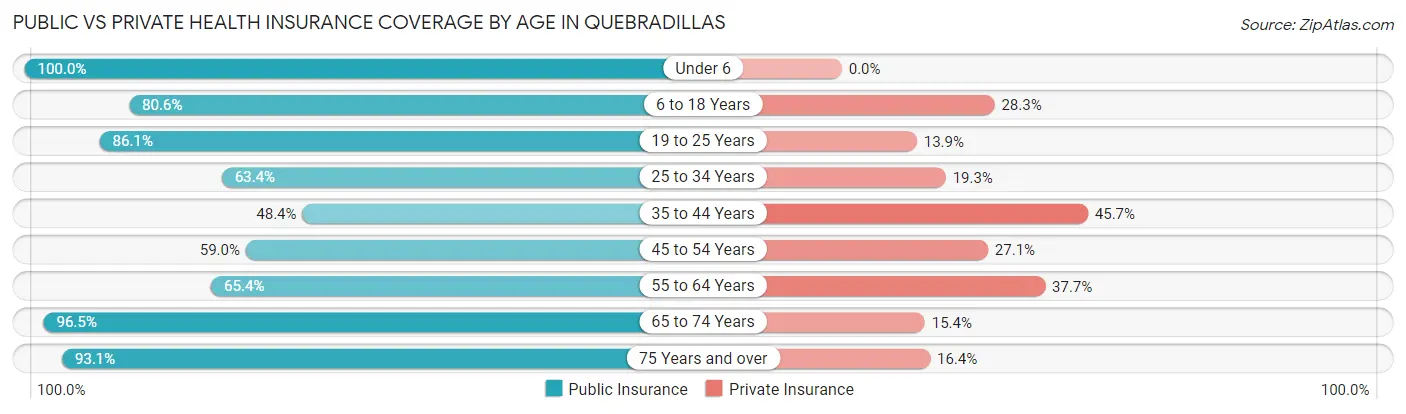
| Age Bracket | Public Insurance | Private Insurance |
| Under 6 | 31 (100.0%) | 0 (0.0%) |
| 6 to 18 Years | 893 (80.6%) | 314 (28.3%) |
| 19 to 25 Years | 532 (86.1%) | 86 (13.9%) |
| 25 to 34 Years | 539 (63.4%) | 164 (19.3%) |
| 35 to 44 Years | 280 (48.4%) | 264 (45.7%) |
| 45 to 54 Years | 550 (59.0%) | 253 (27.1%) |
| 55 to 64 Years | 336 (65.4%) | 194 (37.7%) |
| 65 to 74 Years | 795 (96.5%) | 127 (15.4%) |
| 75 Years and over | 659 (93.1%) | 116 (16.4%) |
| Total | 4,615 (74.9%) | 1,518 (24.6%) |
Disability Status by Sex by Age in Quebradillas
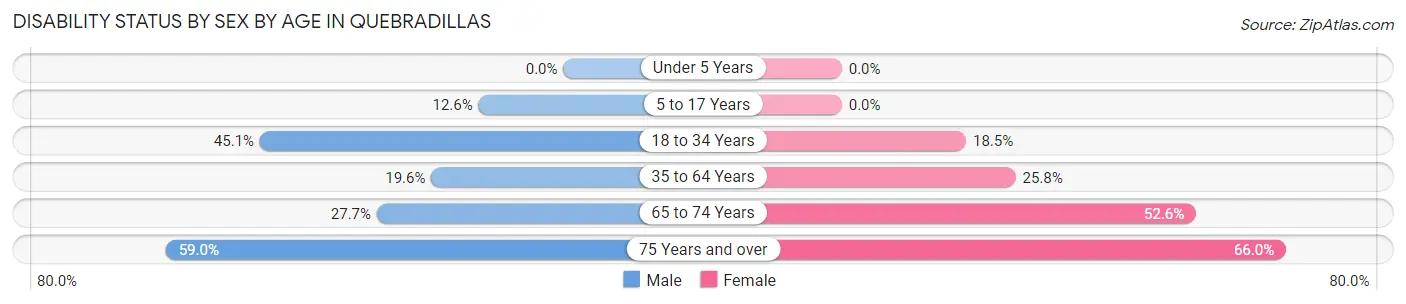
| Age Bracket | Male | Female |
| Under 5 Years | 0 (0.0%) | 0 (0.0%) |
| 5 to 17 Years | 73 (12.6%) | 0 (0.0%) |
| 18 to 34 Years | 324 (45.1%) | 145 (18.4%) |
| 35 to 64 Years | 182 (19.6%) | 283 (25.8%) |
| 65 to 74 Years | 85 (27.7%) | 272 (52.6%) |
| 75 Years and over | 196 (59.0%) | 248 (66.0%) |
Disability Class by Sex by Age in Quebradillas
Disability Class: Hearing Difficulty
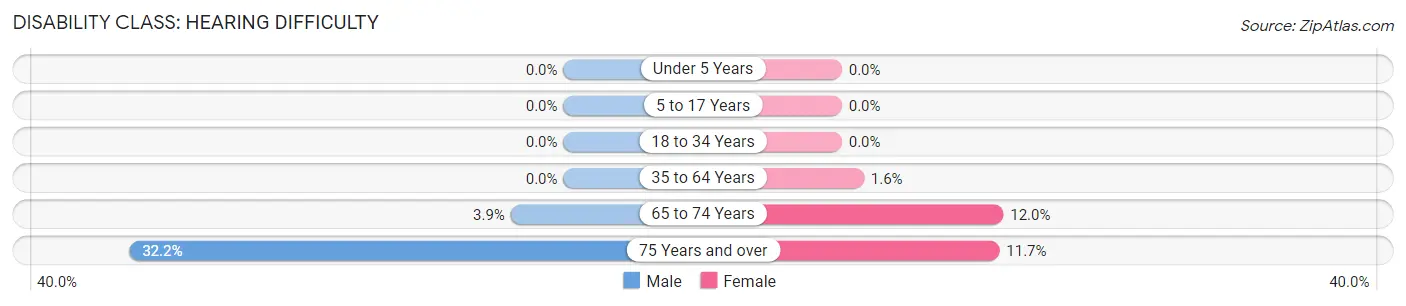
| Age Bracket | Male | Female |
| Under 5 Years | 0 (0.0%) | 0 (0.0%) |
| 5 to 17 Years | 0 (0.0%) | 0 (0.0%) |
| 18 to 34 Years | 0 (0.0%) | 0 (0.0%) |
| 35 to 64 Years | 0 (0.0%) | 18 (1.6%) |
| 65 to 74 Years | 12 (3.9%) | 62 (12.0%) |
| 75 Years and over | 107 (32.2%) | 44 (11.7%) |
Disability Class: Vision Difficulty
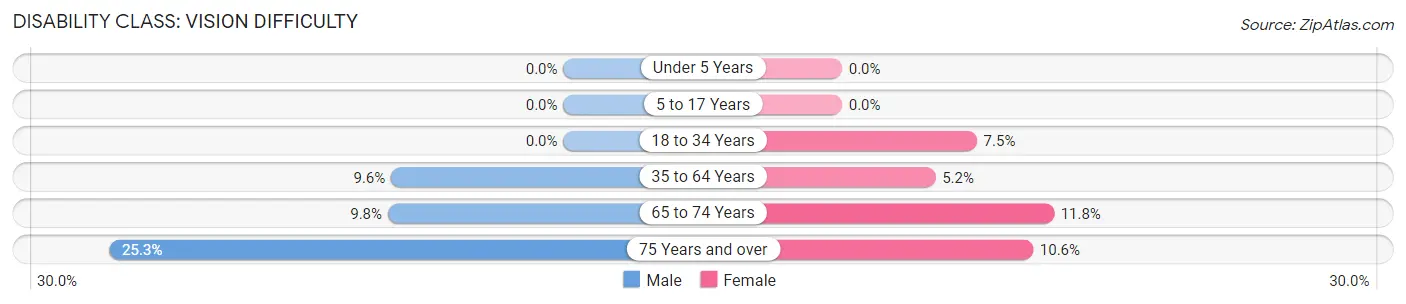
| Age Bracket | Male | Female |
| Under 5 Years | 0 (0.0%) | 0 (0.0%) |
| 5 to 17 Years | 0 (0.0%) | 0 (0.0%) |
| 18 to 34 Years | 0 (0.0%) | 59 (7.5%) |
| 35 to 64 Years | 89 (9.6%) | 57 (5.2%) |
| 65 to 74 Years | 30 (9.8%) | 61 (11.8%) |
| 75 Years and over | 84 (25.3%) | 40 (10.6%) |
Disability Class: Cognitive Difficulty
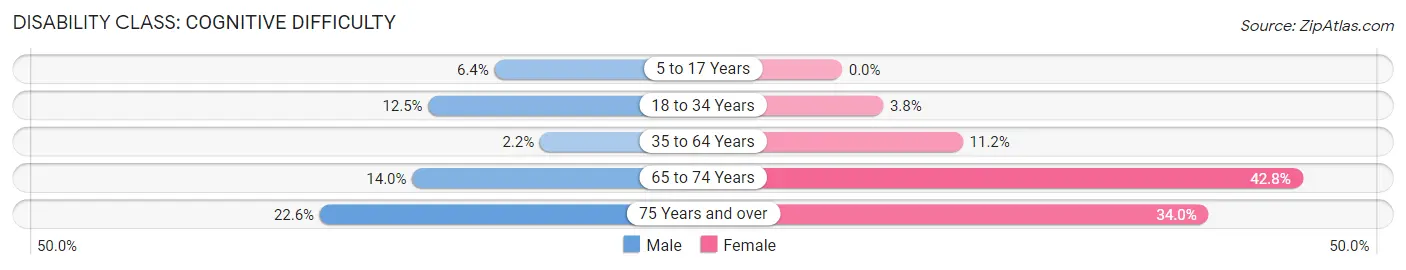
| Age Bracket | Male | Female |
| 5 to 17 Years | 37 (6.4%) | 0 (0.0%) |
| 18 to 34 Years | 90 (12.5%) | 30 (3.8%) |
| 35 to 64 Years | 20 (2.2%) | 123 (11.2%) |
| 65 to 74 Years | 43 (14.0%) | 221 (42.7%) |
| 75 Years and over | 75 (22.6%) | 128 (34.0%) |
Disability Class: Ambulatory Difficulty
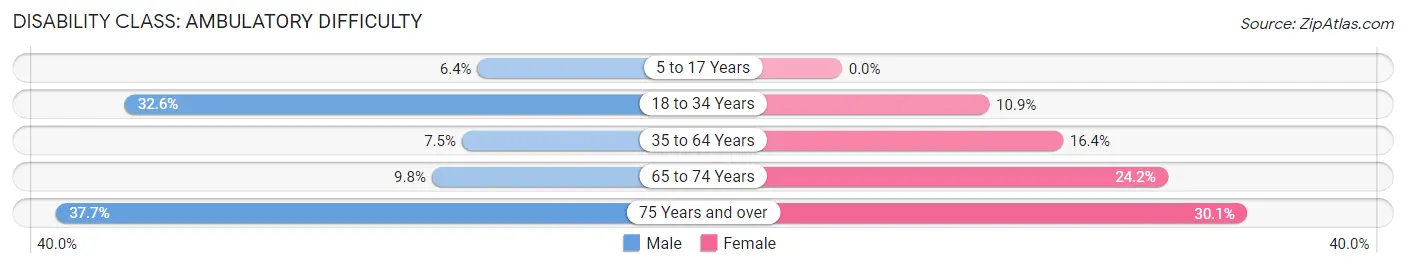
| Age Bracket | Male | Female |
| 5 to 17 Years | 37 (6.4%) | 0 (0.0%) |
| 18 to 34 Years | 234 (32.6%) | 86 (10.9%) |
| 35 to 64 Years | 70 (7.5%) | 180 (16.4%) |
| 65 to 74 Years | 30 (9.8%) | 125 (24.2%) |
| 75 Years and over | 125 (37.7%) | 113 (30.0%) |
Disability Class: Self-Care Difficulty
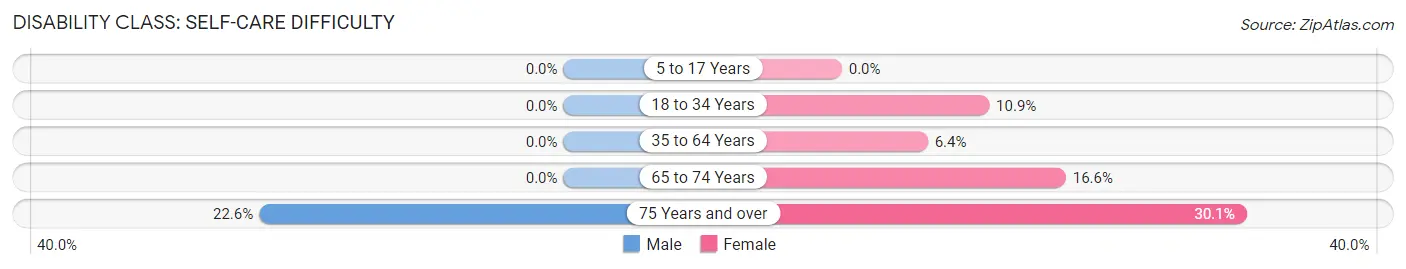
| Age Bracket | Male | Female |
| 5 to 17 Years | 0 (0.0%) | 0 (0.0%) |
| 18 to 34 Years | 0 (0.0%) | 86 (10.9%) |
| 35 to 64 Years | 0 (0.0%) | 70 (6.4%) |
| 65 to 74 Years | 0 (0.0%) | 86 (16.6%) |
| 75 Years and over | 75 (22.6%) | 113 (30.0%) |
Technology Access in Quebradillas
Computing Device Access in Quebradillas
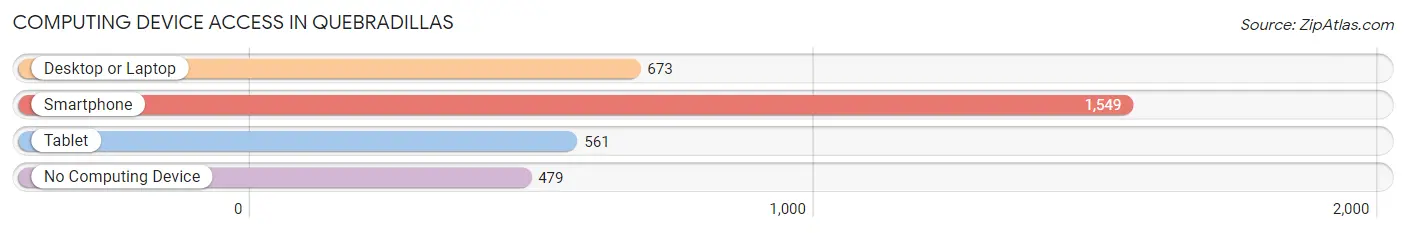
| Device Type | # Households | % Households |
| Desktop or Laptop | 673 | 33.0% |
| Smartphone | 1,549 | 75.9% |
| Tablet | 561 | 27.5% |
| No Computing Device | 479 | 23.5% |
| Total | 2,040 | 100.0% |
Internet Access in Quebradillas
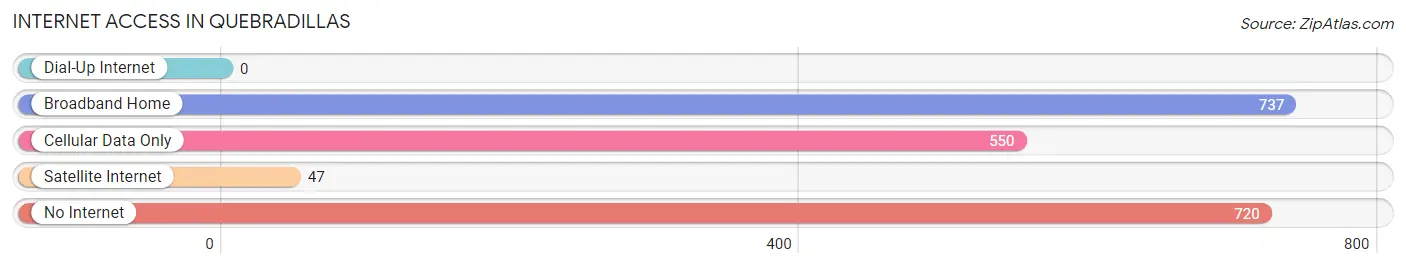
| Internet Type | # Households | % Households |
| Dial-Up Internet | 0 | 0.0% |
| Broadband Home | 737 | 36.1% |
| Cellular Data Only | 550 | 27.0% |
| Satellite Internet | 47 | 2.3% |
| No Internet | 720 | 35.3% |
| Total | 2,040 | 100.0% |
Quebradillas Summary
Quebradillas is a municipality located in the northwest region of Puerto Rico. It is part of the San Juan-Caguas-Guaynabo Metropolitan Statistical Area. The town is bordered by the municipalities of Isabela to the north, San Sebastián to the east, Moca to the south, and Camuy to the west. As of the 2010 census, the population of Quebradillas was 24,818.
History
The area of Quebradillas was originally inhabited by the Taíno Indians. The first Spanish settlers arrived in the area in the early 16th century. The town was founded in 1733 by Don Juan de Aponte y Díaz de Rivera, who named it after the nearby Quebrada de Aponte. The town was officially recognized by the Spanish government in 1739.
During the 19th century, Quebradillas was an important agricultural center, producing coffee, sugar cane, and tobacco. The town was also known for its pottery and ceramics. In 1898, Quebradillas was occupied by the United States during the Spanish-American War.
Geography
Quebradillas is located in the northwest region of Puerto Rico, on the northern coast of the island. It is bordered by the municipalities of Isabela to the north, San Sebastián to the east, Moca to the south, and Camuy to the west. The town covers an area of approximately 33 square miles (85 km2).
The terrain of Quebradillas is mostly flat, with some hills in the northern part of the municipality. The highest point is Cerro de la Cruz, which has an elevation of 1,065 feet (325 m). The town is located in the karst region of Puerto Rico, and is home to several caves, including the Cueva del Viento and the Cueva de los Indios.
Economy
The economy of Quebradillas is largely based on agriculture and tourism. The town is known for its production of coffee, sugar cane, and tobacco. It is also home to several small businesses, including restaurants, shops, and hotels.
Tourism is an important part of the local economy. The town is home to several attractions, including the Cueva del Viento, the Cueva de los Indios, and the Cerro de la Cruz. Quebradillas is also home to several beaches, including Playa de Quebradillas and Playa de Camuy.
Demographics
As of the 2010 census, the population of Quebradillas was 24,818. The population is mostly of mixed European and African descent. The town has a population density of 745 people per square mile (287/km2).
The median household income in Quebradillas is $17,845, and the median family income is $20,945. The unemployment rate is 11.3%. The town has a poverty rate of 44.3%.
Quebradillas is served by the Quebradillas Municipal School District. The town is home to several schools, including the Escuela Superior de Quebradillas, the Escuela Intermedia de Quebradillas, and the Escuela Primaria de Quebradillas. The town is also home to the University of Puerto Rico at Quebradillas.
Common Questions
What is Per Capita Income in Quebradillas?
Per Capita income in Quebradillas is $11,049.
What is the Median Family Income in Quebradillas?
Median Family Income in Quebradillas is $26,542.
What is the Median Household income in Quebradillas?
Median Household Income in Quebradillas is $18,981.
What is Income or Wage Gap in Quebradillas?
Income or Wage Gap in Quebradillas is 20.2%.
Women in Quebradillas earn 79.8 cents for every dollar earned by a man.
What is Inequality or Gini Index in Quebradillas?
Inequality or Gini Index in Quebradillas is 0.51.
What is the Total Population of Quebradillas?
Total Population of Quebradillas is 6,165.
What is the Total Male Population of Quebradillas?
Total Male Population of Quebradillas is 2,898.
What is the Total Female Population of Quebradillas?
Total Female Population of Quebradillas is 3,267.
What is the Ratio of Males per 100 Females in Quebradillas?
There are 88.71 Males per 100 Females in Quebradillas.
What is the Ratio of Females per 100 Males in Quebradillas?
There are 112.73 Females per 100 Males in Quebradillas.
What is the Median Population Age in Quebradillas?
Median Population Age in Quebradillas is 42.2 Years.
What is the Average Family Size in Quebradillas
Average Family Size in Quebradillas is 3.5 People.
What is the Average Household Size in Quebradillas
Average Household Size in Quebradillas is 3.0 People.
How Large is the Labor Force in Quebradillas?
There are 2,254 People in the Labor Forcein in Quebradillas.
What is the Percentage of People in the Labor Force in Quebradillas?
43.7% of People are in the Labor Force in Quebradillas.
What is the Unemployment Rate in Quebradillas?
Unemployment Rate in Quebradillas is 6.3%.