Naranjito, PR Map & Demographics
Naranjito Map
Naranjito Overview
$9,219
PER CAPITA INCOME
$25,823
AVG FAMILY INCOME
$24,044
AVG HOUSEHOLD INCOME
2.5%
WAGE / INCOME GAP [ % ]
97.5¢/ $1
WAGE / INCOME GAP [ $ ]
0.48
INEQUALITY / GINI INDEX
3,443
TOTAL POPULATION
1,909
MALE POPULATION
1,534
FEMALE POPULATION
124.45
MALES / 100 FEMALES
80.36
FEMALES / 100 MALES
34.4
MEDIAN AGE
4.2
AVG FAMILY SIZE
3.4
AVG HOUSEHOLD SIZE
1,245
LABOR FORCE [ PEOPLE ]
48.0%
PERCENT IN LABOR FORCE
32.5%
UNEMPLOYMENT RATE
Naranjito Zip Codes
Naranjito Area Codes
Income in Naranjito
Income Overview in Naranjito
Per Capita Income in Naranjito is $9,219, while median incomes of families and households are $25,823 and $24,044 respectively.
| Characteristic | Number | Measure |
| Per Capita Income | 3,443 | $9,219 |
| Median Family Income | 707 | $25,823 |
| Mean Family Income | 707 | $31,690 |
| Median Household Income | 1,018 | $24,044 |
| Mean Household Income | 1,018 | $27,054 |
| Income Deficit | 707 | $0 |
| Wage / Income Gap (%) | 3,443 | 2.46% |
| Wage / Income Gap ($) | 3,443 | 97.54¢ per $1 |
| Gini / Inequality Index | 3,443 | 0.48 |
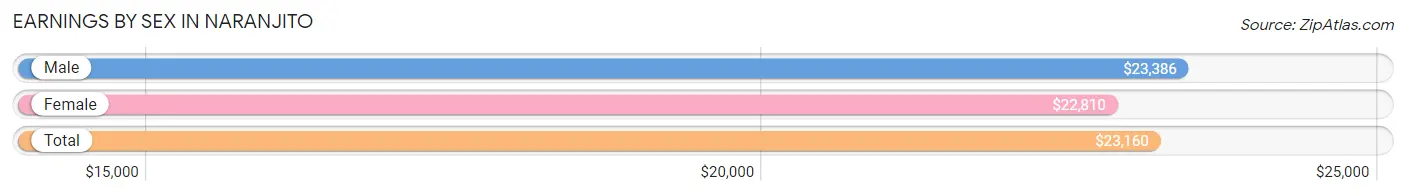
Earnings by Sex in Naranjito
Average Earnings in Naranjito are $23,160, $23,386 for men and $22,810 for women, a difference of 2.5%.
| Sex | Number | Average Earnings |
| Male | 532 (63.3%) | $23,386 |
| Female | 308 (36.7%) | $22,810 |
| Total | 840 (100.0%) | $23,160 |
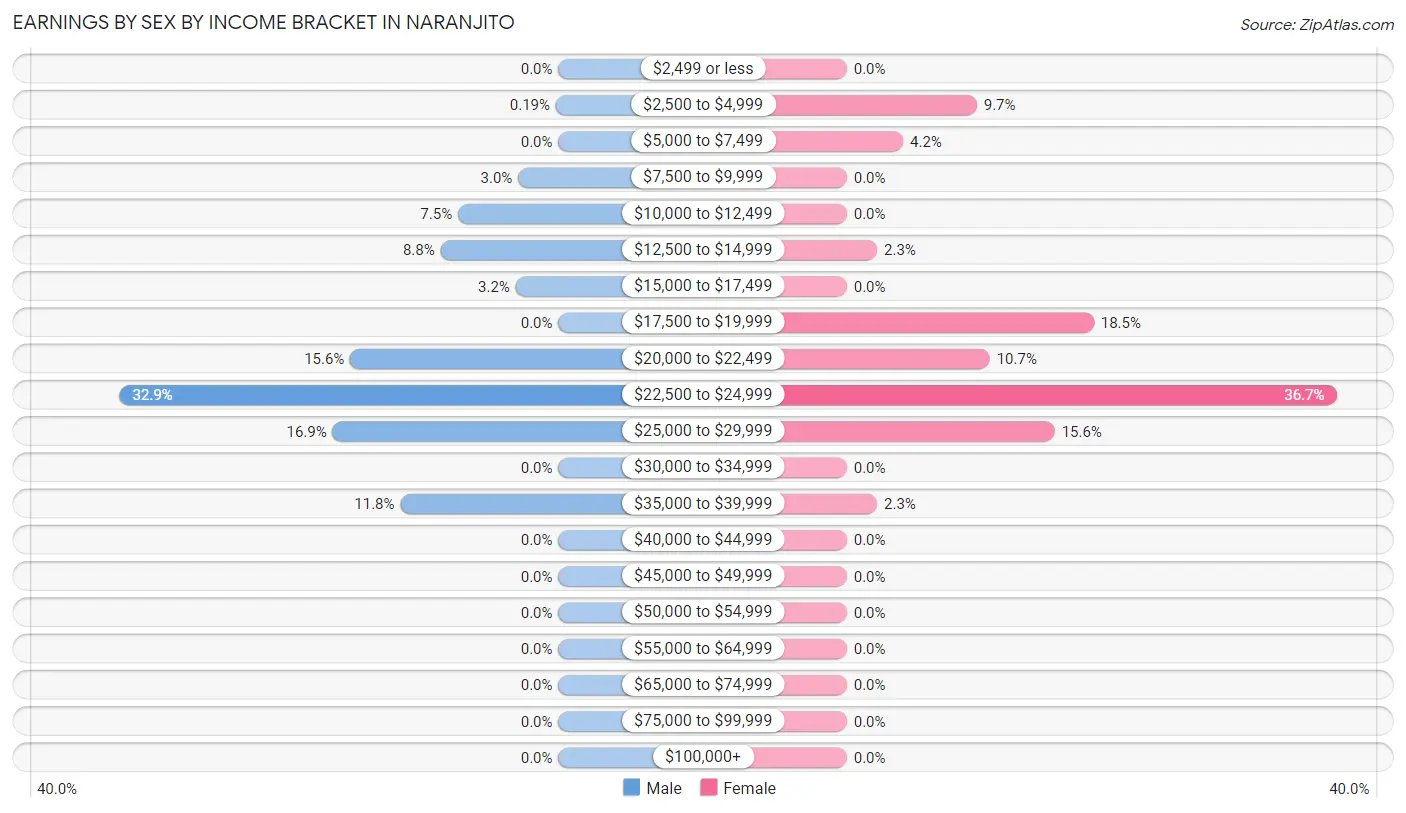
Earnings by Sex by Income Bracket in Naranjito
The most common earnings brackets in Naranjito are $22,500 to $24,999 for men (175 | 32.9%) and $22,500 to $24,999 for women (113 | 36.7%).
| Income | Male | Female |
| $2,499 or less | 0 (0.0%) | 0 (0.0%) |
| $2,500 to $4,999 | 1 (0.2%) | 30 (9.7%) |
| $5,000 to $7,499 | 0 (0.0%) | 13 (4.2%) |
| $7,500 to $9,999 | 16 (3.0%) | 0 (0.0%) |
| $10,000 to $12,499 | 40 (7.5%) | 0 (0.0%) |
| $12,500 to $14,999 | 47 (8.8%) | 7 (2.3%) |
| $15,000 to $17,499 | 17 (3.2%) | 0 (0.0%) |
| $17,500 to $19,999 | 0 (0.0%) | 57 (18.5%) |
| $20,000 to $22,499 | 83 (15.6%) | 33 (10.7%) |
| $22,500 to $24,999 | 175 (32.9%) | 113 (36.7%) |
| $25,000 to $29,999 | 90 (16.9%) | 48 (15.6%) |
| $30,000 to $34,999 | 0 (0.0%) | 0 (0.0%) |
| $35,000 to $39,999 | 63 (11.8%) | 7 (2.3%) |
| $40,000 to $44,999 | 0 (0.0%) | 0 (0.0%) |
| $45,000 to $49,999 | 0 (0.0%) | 0 (0.0%) |
| $50,000 to $54,999 | 0 (0.0%) | 0 (0.0%) |
| $55,000 to $64,999 | 0 (0.0%) | 0 (0.0%) |
| $65,000 to $74,999 | 0 (0.0%) | 0 (0.0%) |
| $75,000 to $99,999 | 0 (0.0%) | 0 (0.0%) |
| $100,000+ | 0 (0.0%) | 0 (0.0%) |
| Total | 532 (100.0%) | 308 (100.0%) |
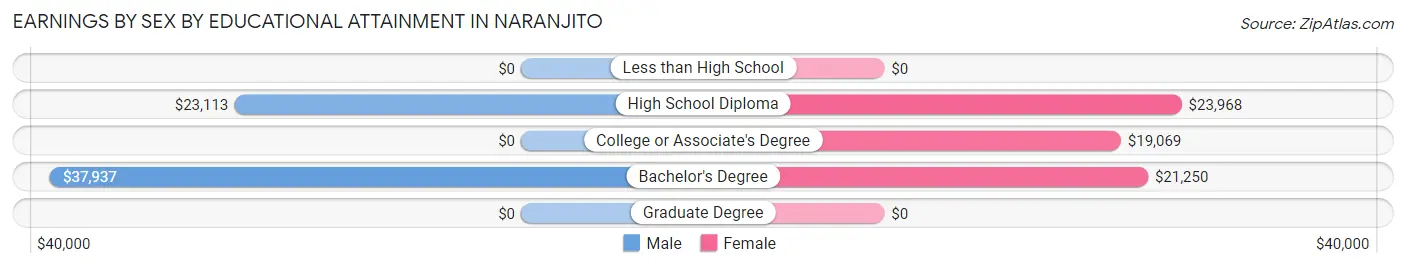
Earnings by Sex by Educational Attainment in Naranjito
Average earnings in Naranjito are $23,379 for men and $22,810 for women, a difference of 2.4%. Men with an educational attainment of bachelor's degree enjoy the highest average annual earnings of $37,937, while those with high school diploma education earn the least with $23,113. Women with an educational attainment of high school diploma earn the most with the average annual earnings of $23,968, while those with college or associate's degree education have the smallest earnings of $19,069.
| Educational Attainment | Male Income | Female Income |
| Less than High School | - | - |
| High School Diploma | $23,113 | $23,968 |
| College or Associate's Degree | - | - |
| Bachelor's Degree | $37,937 | $21,250 |
| Graduate Degree | - | - |
| Total | $23,379 | $22,810 |
Family Income in Naranjito
Family Income Brackets in Naranjito
According to the Naranjito family income data, there are 159 families falling into the $15,000 to $24,999 income range, which is the most common income bracket and makes up 22.5% of all families.
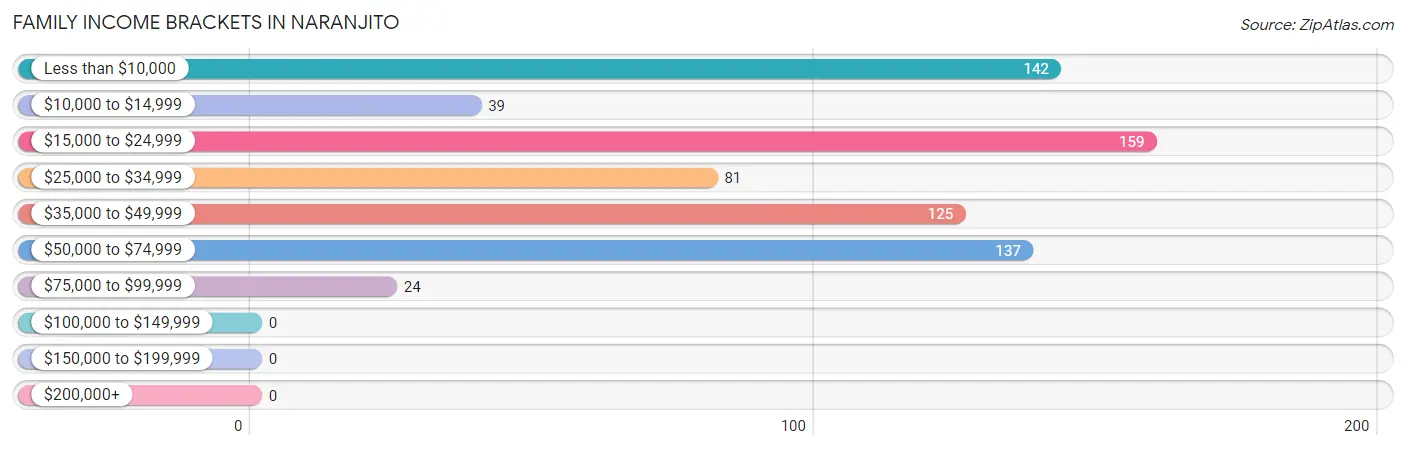
| Income Bracket | # Families | % Families |
| Less than $10,000 | 142 | 20.1% |
| $10,000 to $14,999 | 39 | 5.5% |
| $15,000 to $24,999 | 159 | 22.5% |
| $25,000 to $34,999 | 81 | 11.5% |
| $35,000 to $49,999 | 125 | 17.7% |
| $50,000 to $74,999 | 137 | 19.4% |
| $75,000 to $99,999 | 24 | 3.4% |
| $100,000 to $149,999 | 0 | 0.0% |
| $150,000 to $199,999 | 0 | 0.0% |
| $200,000+ | 0 | 0.0% |
Family Income by Famaliy Size in Naranjito
4-person families (126 | 17.8%) account for the highest median family income in Naranjito with $45,991 per family, while 4-person families (126 | 17.8%) have the highest median income of $11,498 per family member.
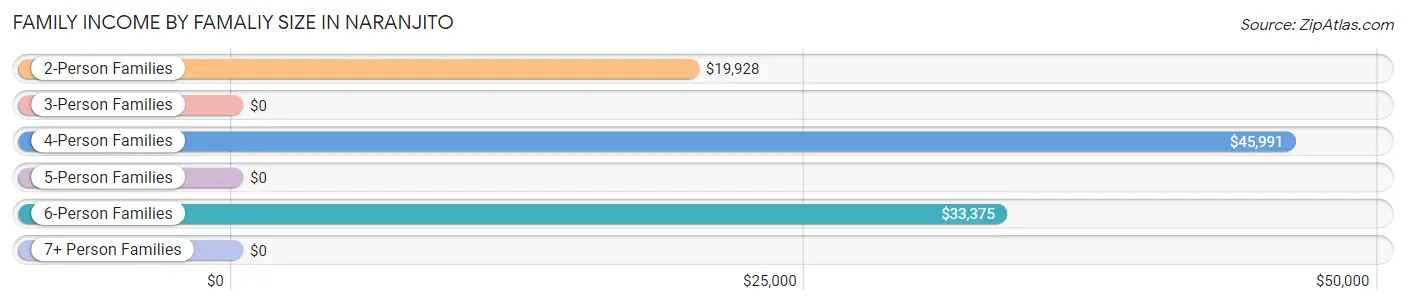
| Income Bracket | # Families | Median Income |
| 2-Person Families | 366 (51.8%) | $19,928 |
| 3-Person Families | 143 (20.2%) | $0 |
| 4-Person Families | 126 (17.8%) | $45,991 |
| 5-Person Families | 33 (4.7%) | $0 |
| 6-Person Families | 39 (5.5%) | $33,375 |
| 7+ Person Families | 0 (0.0%) | $0 |
| Total | 707 (100.0%) | $25,823 |
Family Income by Number of Earners in Naranjito
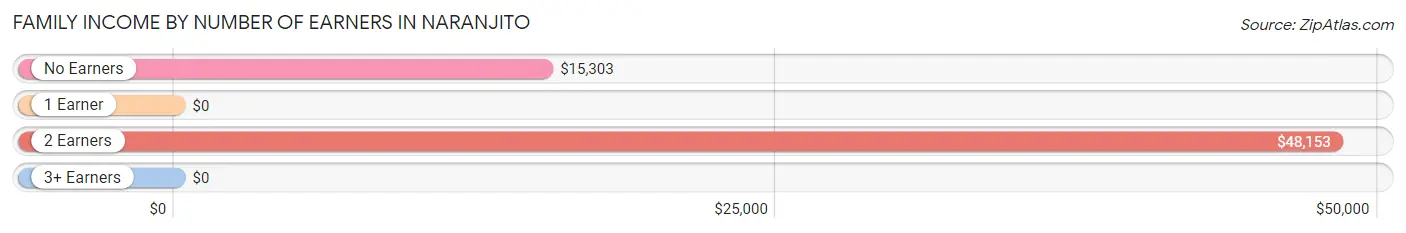
| Number of Earners | # Families | Median Income |
| No Earners | 356 (50.3%) | $15,303 |
| 1 Earner | 164 (23.2%) | $0 |
| 2 Earners | 159 (22.5%) | $48,153 |
| 3+ Earners | 28 (4.0%) | $0 |
| Total | 707 (100.0%) | $25,823 |
Household Income in Naranjito
Household Income Brackets in Naranjito
With 371 households falling in the category, the less than $10,000 income range is the most frequent in Naranjito, accounting for 36.4% of all households.
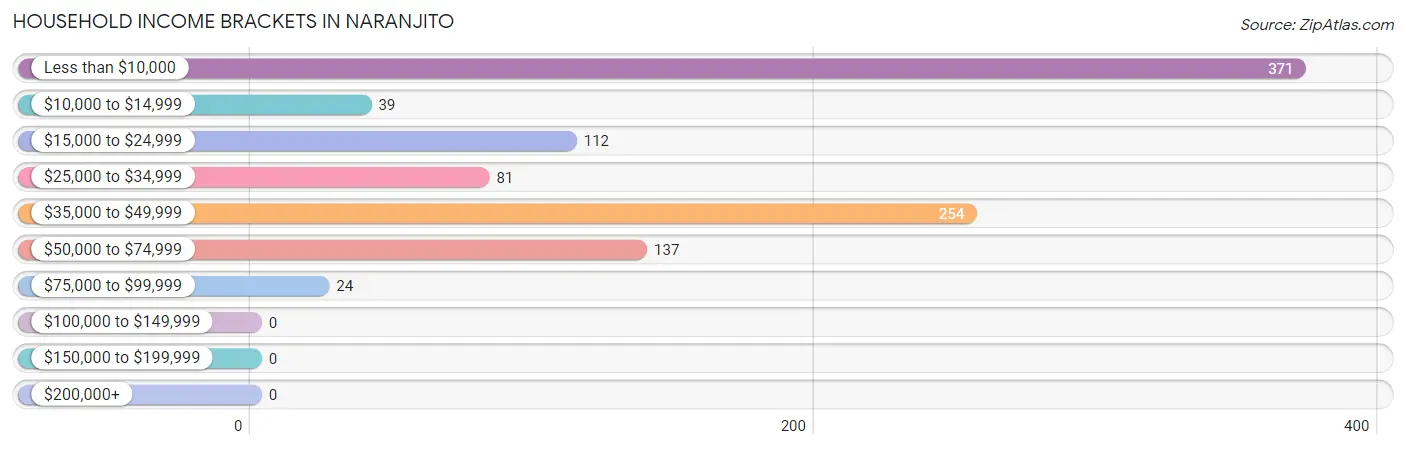
| Income Bracket | # Households | % Households |
| Less than $10,000 | 371 | 36.4% |
| $10,000 to $14,999 | 39 | 3.8% |
| $15,000 to $24,999 | 112 | 11.0% |
| $25,000 to $34,999 | 81 | 8.0% |
| $35,000 to $49,999 | 254 | 25.0% |
| $50,000 to $74,999 | 137 | 13.5% |
| $75,000 to $99,999 | 24 | 2.4% |
| $100,000 to $149,999 | 0 | 0.0% |
| $150,000 to $199,999 | 0 | 0.0% |
| $200,000+ | 0 | 0.0% |
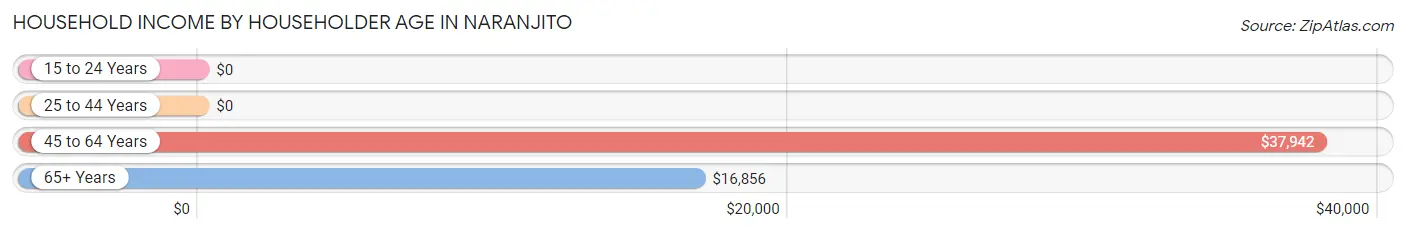
Household Income by Householder Age in Naranjito
The median household income in Naranjito is $24,044, with the highest median household income of $37,942 found in the 45 to 64 years age bracket for the primary householder. A total of 417 households (41.0%) fall into this category.
| Income Bracket | # Households | Median Income |
| 15 to 24 Years | 0 (0.0%) | $0 |
| 25 to 44 Years | 298 (29.3%) | $0 |
| 45 to 64 Years | 417 (41.0%) | $37,942 |
| 65+ Years | 303 (29.8%) | $16,856 |
| Total | 1,018 (100.0%) | $24,044 |
Poverty in Naranjito
Income Below Poverty by Sex and Age in Naranjito
With 41.9% poverty level for males and 60.1% for females among the residents of Naranjito, under 5 year old males and under 5 year old females are the most vulnerable to poverty, with 35 males (100.0%) and 22 females (100.0%) in their respective age groups living below the poverty level.
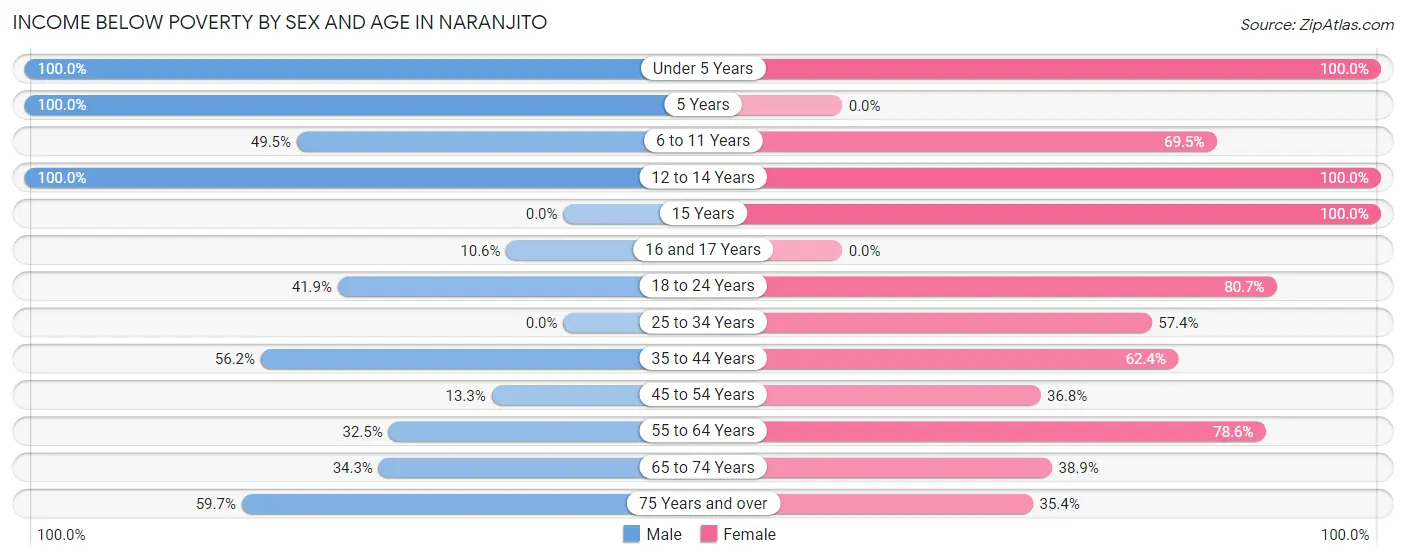
| Age Bracket | Male | Female |
| Under 5 Years | 35 (100.0%) | 22 (100.0%) |
| 5 Years | 77 (100.0%) | 0 (0.0%) |
| 6 to 11 Years | 186 (49.5%) | 73 (69.5%) |
| 12 to 14 Years | 92 (100.0%) | 33 (100.0%) |
| 15 Years | 0 (0.0%) | 109 (100.0%) |
| 16 and 17 Years | 11 (10.6%) | 0 (0.0%) |
| 18 to 24 Years | 90 (41.9%) | 96 (80.7%) |
| 25 to 34 Years | 0 (0.0%) | 139 (57.4%) |
| 35 to 44 Years | 146 (56.1%) | 106 (62.4%) |
| 45 to 54 Years | 22 (13.3%) | 53 (36.8%) |
| 55 to 64 Years | 49 (32.5%) | 136 (78.6%) |
| 65 to 74 Years | 49 (34.3%) | 81 (38.9%) |
| 75 Years and over | 40 (59.7%) | 74 (35.4%) |
| Total | 797 (41.9%) | 922 (60.1%) |
Income Above Poverty by Sex and Age in Naranjito
According to the poverty statistics in Naranjito, males aged 25 to 34 years and females aged 75 years and over are the age groups that are most secure financially, with 100.0% of males and 64.6% of females in these age groups living above the poverty line.
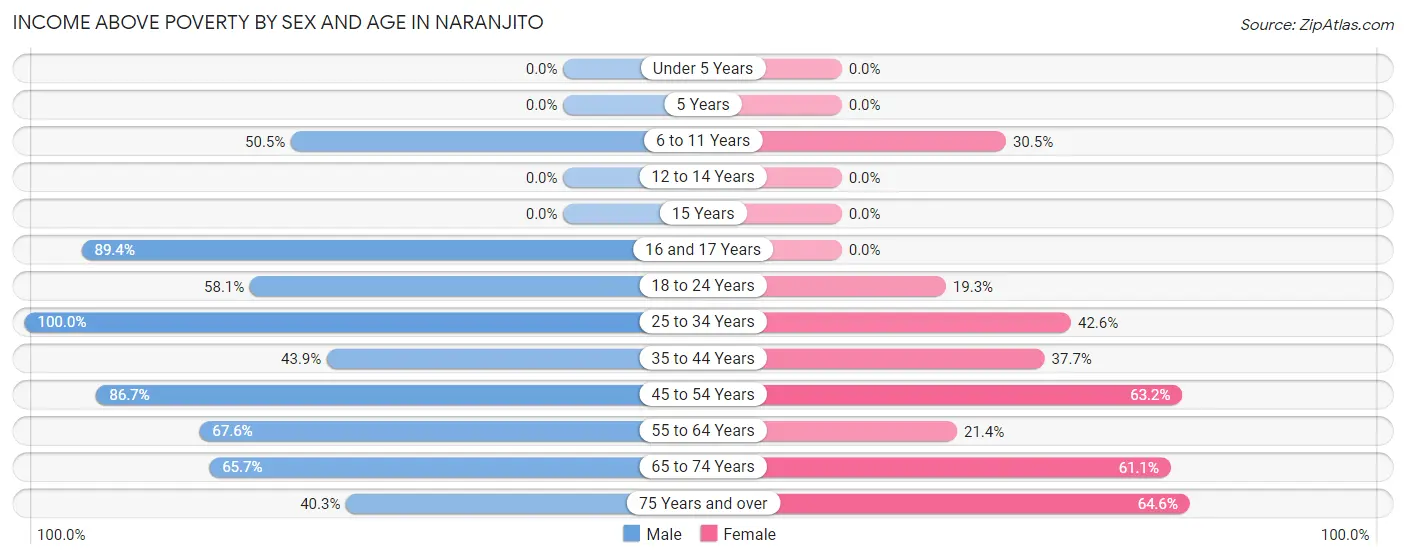
| Age Bracket | Male | Female |
| Under 5 Years | 0 (0.0%) | 0 (0.0%) |
| 5 Years | 0 (0.0%) | 0 (0.0%) |
| 6 to 11 Years | 190 (50.5%) | 32 (30.5%) |
| 12 to 14 Years | 0 (0.0%) | 0 (0.0%) |
| 15 Years | 0 (0.0%) | 0 (0.0%) |
| 16 and 17 Years | 93 (89.4%) | 0 (0.0%) |
| 18 to 24 Years | 125 (58.1%) | 23 (19.3%) |
| 25 to 34 Years | 219 (100.0%) | 103 (42.6%) |
| 35 to 44 Years | 114 (43.9%) | 64 (37.7%) |
| 45 to 54 Years | 143 (86.7%) | 91 (63.2%) |
| 55 to 64 Years | 102 (67.5%) | 37 (21.4%) |
| 65 to 74 Years | 94 (65.7%) | 127 (61.1%) |
| 75 Years and over | 27 (40.3%) | 135 (64.6%) |
| Total | 1,107 (58.1%) | 612 (39.9%) |
Income Below Poverty Among Married-Couple Families in Naranjito
The poverty statistics for married-couple families in Naranjito show that 20.2% or 77 of the total 381 families live below the poverty line. Families with 3 or 4 children have the highest poverty rate of 100.0%, comprising of 10 families. On the other hand, families with no children have the lowest poverty rate of 12.7%, which includes 28 families.
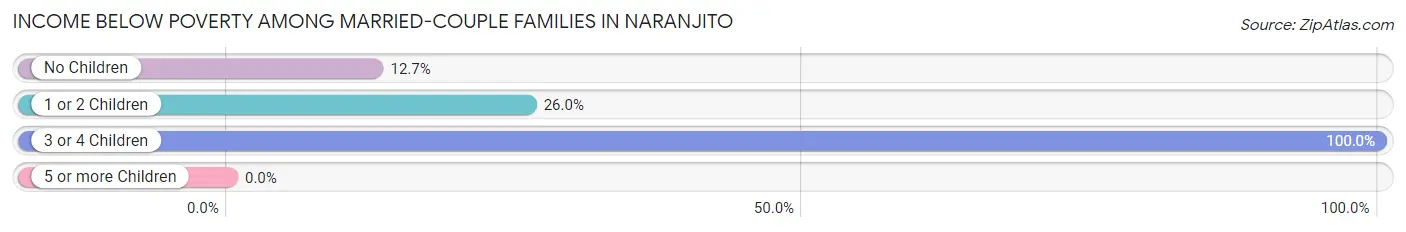
| Children | Above Poverty | Below Poverty |
| No Children | 193 (87.3%) | 28 (12.7%) |
| 1 or 2 Children | 111 (74.0%) | 39 (26.0%) |
| 3 or 4 Children | 0 (0.0%) | 10 (100.0%) |
| 5 or more Children | 0 (0.0%) | 0 (0.0%) |
| Total | 304 (79.8%) | 77 (20.2%) |
Income Below Poverty Among Single-Parent Households in Naranjito
According to the poverty data in Naranjito, 51.8% or 29 single-father households and 79.3% or 214 single-mother households are living below the poverty line. Among single-father households, those with 1 or 2 children have the highest poverty rate, with 29 households (100.0%) experiencing poverty. Likewise, among single-mother households, those with 3 or 4 children have the highest poverty rate, with 7 households (100.0%) falling below the poverty line.
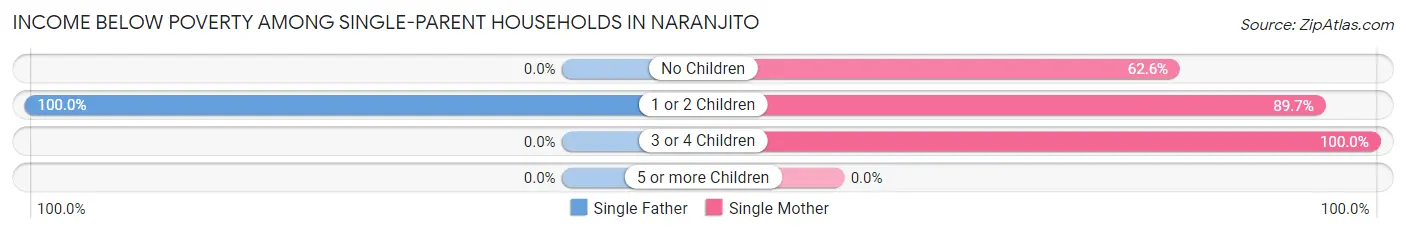
| Children | Single Father | Single Mother |
| No Children | 0 (0.0%) | 67 (62.6%) |
| 1 or 2 Children | 29 (100.0%) | 140 (89.7%) |
| 3 or 4 Children | 0 (0.0%) | 7 (100.0%) |
| 5 or more Children | 0 (0.0%) | 0 (0.0%) |
| Total | 29 (51.8%) | 214 (79.3%) |
Income Below Poverty Among Married-Couple vs Single-Parent Households in Naranjito
The poverty data for Naranjito shows that 77 of the married-couple family households (20.2%) and 243 of the single-parent households (74.5%) are living below the poverty level. Within the married-couple family households, those with 3 or 4 children have the highest poverty rate, with 10 households (100.0%) falling below the poverty line. Among the single-parent households, those with 3 or 4 children have the highest poverty rate, with 7 household (100.0%) living below poverty.
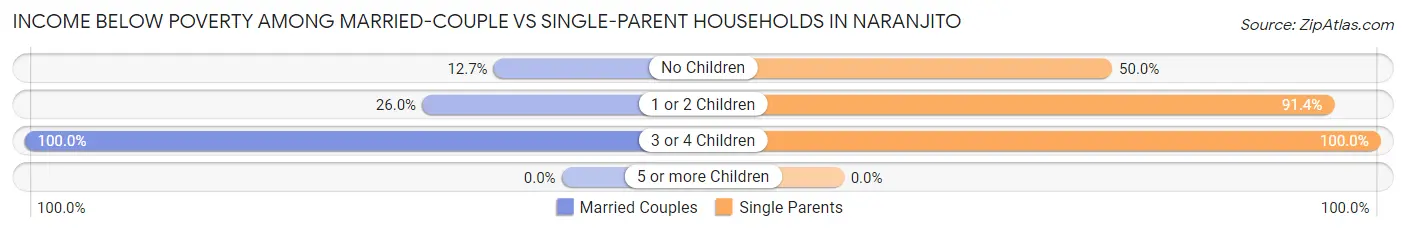
| Children | Married-Couple Families | Single-Parent Households |
| No Children | 28 (12.7%) | 67 (50.0%) |
| 1 or 2 Children | 39 (26.0%) | 169 (91.3%) |
| 3 or 4 Children | 10 (100.0%) | 7 (100.0%) |
| 5 or more Children | 0 (0.0%) | 0 (0.0%) |
| Total | 77 (20.2%) | 243 (74.5%) |
Race in Naranjito
The most populous races in Naranjito are Hispanic or Latino (3,441 | 99.9%), White / Caucasian (1,857 | 53.9%), and Two or more Races (1,189 | 34.5%).
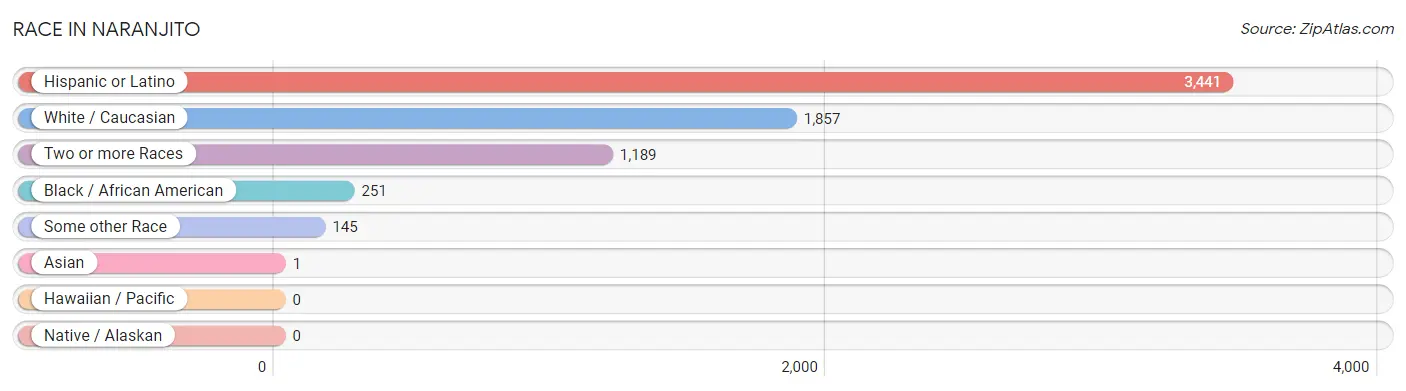
| Race | # Population | % Population |
| Asian | 1 | 0.0% |
| Black / African American | 251 | 7.3% |
| Hawaiian / Pacific | 0 | 0.0% |
| Hispanic or Latino | 3,441 | 99.9% |
| Native / Alaskan | 0 | 0.0% |
| White / Caucasian | 1,857 | 53.9% |
| Two or more Races | 1,189 | 34.5% |
| Some other Race | 145 | 4.2% |
| Total | 3,443 | 100.0% |
Ancestry in Naranjito
The most populous ancestries reported in Naranjito are Puerto Rican (3,439 | 99.9%), American (34 | 1.0%), South American (2 | 0.1%), Venezuelan (2 | 0.1%), and Indian (Asian) (1 | 0.0%), together accounting for 101.0% of all Naranjito residents.
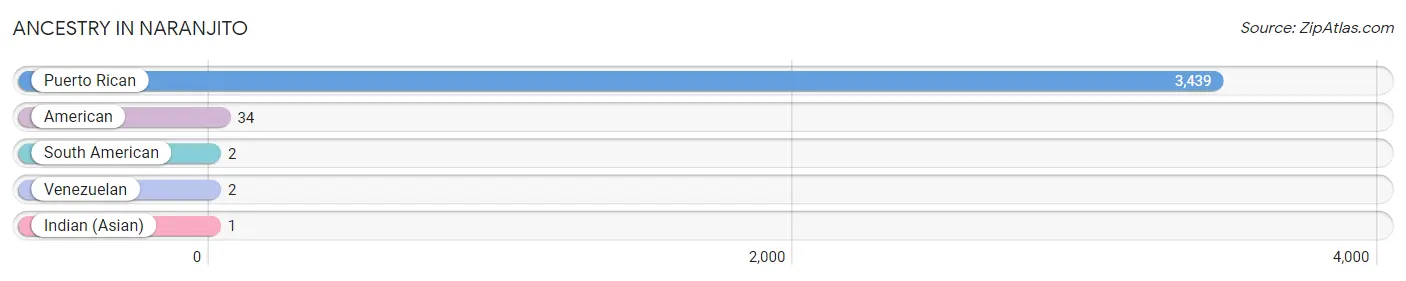
| Ancestry | # Population | % Population |
| American | 34 | 1.0% |
| Indian (Asian) | 1 | 0.0% |
| Puerto Rican | 3,439 | 99.9% |
| South American | 2 | 0.1% |
| Venezuelan | 2 | 0.1% | View All 5 Rows |
Immigrants in Naranjito

| Immigration Origin | # Population | % Population | View All 0 Rows |
Sex and Age in Naranjito
Sex and Age in Naranjito
The most populous age groups in Naranjito are 5 to 9 Years (358 | 18.8%) for men and 30 to 34 Years (218 | 14.2%) for women.
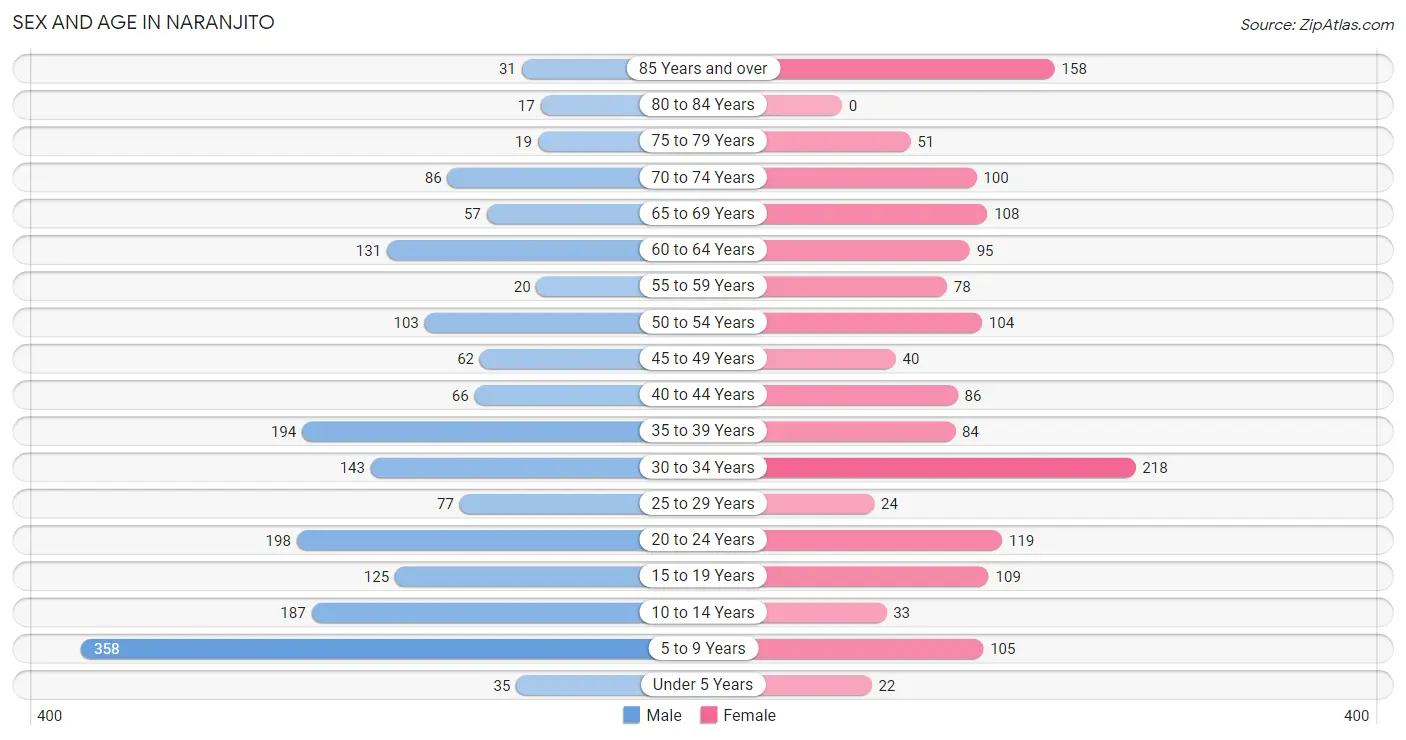
| Age Bracket | Male | Female |
| Under 5 Years | 35 (1.8%) | 22 (1.4%) |
| 5 to 9 Years | 358 (18.8%) | 105 (6.8%) |
| 10 to 14 Years | 187 (9.8%) | 33 (2.1%) |
| 15 to 19 Years | 125 (6.6%) | 109 (7.1%) |
| 20 to 24 Years | 198 (10.4%) | 119 (7.8%) |
| 25 to 29 Years | 77 (4.0%) | 24 (1.6%) |
| 30 to 34 Years | 143 (7.5%) | 218 (14.2%) |
| 35 to 39 Years | 194 (10.2%) | 84 (5.5%) |
| 40 to 44 Years | 66 (3.5%) | 86 (5.6%) |
| 45 to 49 Years | 62 (3.3%) | 40 (2.6%) |
| 50 to 54 Years | 103 (5.4%) | 104 (6.8%) |
| 55 to 59 Years | 20 (1.1%) | 78 (5.1%) |
| 60 to 64 Years | 131 (6.9%) | 95 (6.2%) |
| 65 to 69 Years | 57 (3.0%) | 108 (7.0%) |
| 70 to 74 Years | 86 (4.5%) | 100 (6.5%) |
| 75 to 79 Years | 19 (1.0%) | 51 (3.3%) |
| 80 to 84 Years | 17 (0.9%) | 0 (0.0%) |
| 85 Years and over | 31 (1.6%) | 158 (10.3%) |
| Total | 1,909 (100.0%) | 1,534 (100.0%) |
Families and Households in Naranjito
Median Family Size in Naranjito
The median family size in Naranjito is 4.19 persons per family, with married-couple families (381 | 53.9%) accounting for the largest median family size of 4.57 persons per family. On the other hand, single female/mother families (270 | 38.2%) represent the smallest median family size with 3.74 persons per family.
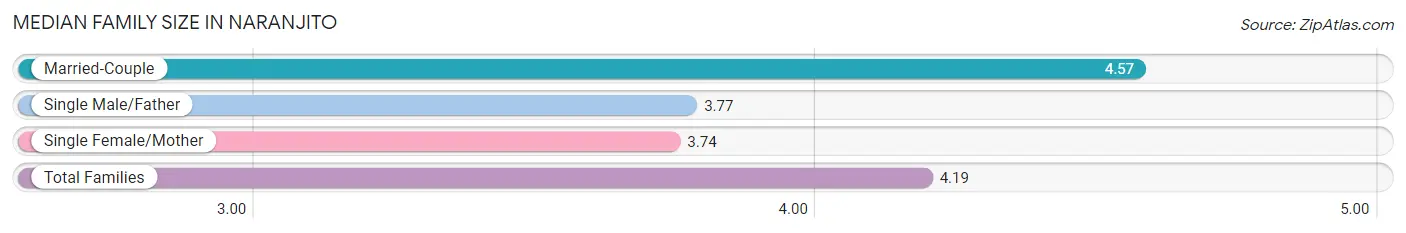
| Family Type | # Families | Family Size |
| Married-Couple | 381 (53.9%) | 4.57 |
| Single Male/Father | 56 (7.9%) | 3.77 |
| Single Female/Mother | 270 (38.2%) | 3.74 |
| Total Families | 707 (100.0%) | 4.19 |
Median Household Size in Naranjito
The median household size in Naranjito is 3.37 persons per household, with married-couple households (381 | 37.4%) accounting for the largest median household size of 4.57 persons per household. non-family households (311 | 30.5%) represent the smallest median household size with 1.22 persons per household.
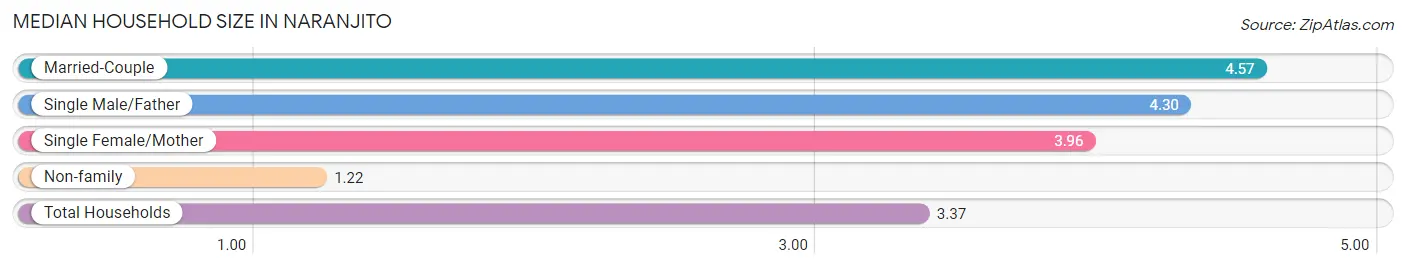
| Household Type | # Households | Household Size |
| Married-Couple | 381 (37.4%) | 4.57 |
| Single Male/Father | 56 (5.5%) | 4.30 |
| Single Female/Mother | 270 (26.5%) | 3.96 |
| Non-family | 311 (30.5%) | 1.22 |
| Total Households | 1,018 (100.0%) | 3.37 |
Household Size by Marriage Status in Naranjito
Out of a total of 1,018 households in Naranjito, 707 (69.5%) are family households, while 311 (30.5%) are nonfamily households. The most numerous type of family households are 2-person households, comprising 299, and the most common type of nonfamily households are 1-person households, comprising 254.
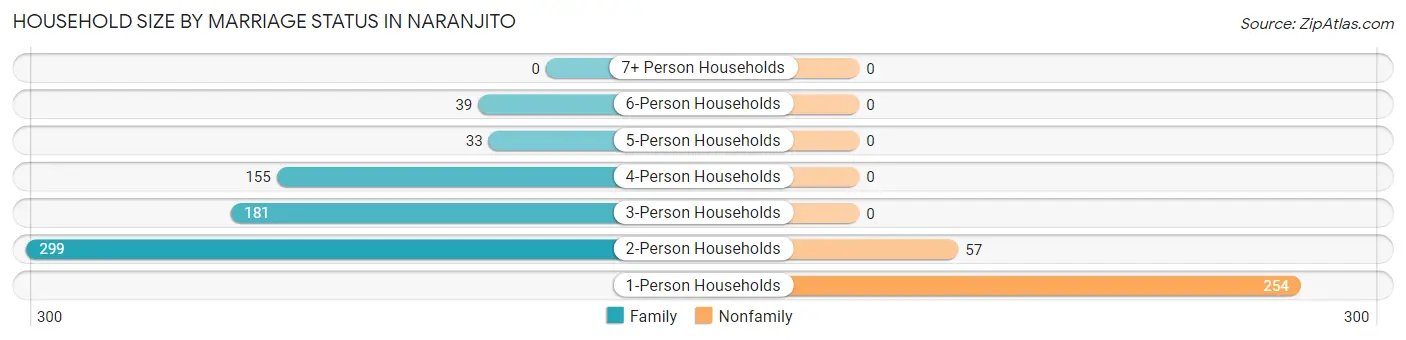
| Household Size | Family Households | Nonfamily Households |
| 1-Person Households | - | 254 (24.9%) |
| 2-Person Households | 299 (29.4%) | 57 (5.6%) |
| 3-Person Households | 181 (17.8%) | 0 (0.0%) |
| 4-Person Households | 155 (15.2%) | 0 (0.0%) |
| 5-Person Households | 33 (3.2%) | 0 (0.0%) |
| 6-Person Households | 39 (3.8%) | 0 (0.0%) |
| 7+ Person Households | 0 (0.0%) | 0 (0.0%) |
| Total | 707 (69.5%) | 311 (30.5%) |
Female Fertility in Naranjito
Fertility by Age in Naranjito
| Age Bracket | Women with Births | Births / 1,000 Women |
| 15 to 19 years | 0 (0.0%) | 0.0 |
| 20 to 34 years | 0 (0.0%) | 0.0 |
| 35 to 50 years | 0 (0.0%) | 0.0 |
| Total | 0 (0.0%) | 0.0 |
Fertility by Age by Marriage Status in Naranjito
| Age Bracket | Married | Unmarried |
| 15 to 19 years | 0 (0.0%) | 0 (0.0%) |
| 20 to 34 years | 0 (0.0%) | 0 (0.0%) |
| 35 to 50 years | 0 (0.0%) | 0 (0.0%) |
| Total | 0 (0.0%) | 0 (0.0%) |
Fertility by Education in Naranjito
| Educational Attainment | Women with Births | Births / 1,000 Women |
| Less than High School | 0 (0.0%) | 0.0 |
| High School Diploma | 0 (0.0%) | 0.0 |
| College or Associate's Degree | 0 (0.0%) | 0.0 |
| Bachelor's Degree | 0 (0.0%) | 0.0 |
| Graduate Degree | 0 (0.0%) | 0.0 |
| Total | 0 (0.0%) | 0.0 |
Fertility by Education by Marriage Status in Naranjito
| Educational Attainment | Married | Unmarried |
| Less than High School | 0 (0.0%) | 0 (0.0%) |
| High School Diploma | 0 (0.0%) | 0 (0.0%) |
| College or Associate's Degree | 0 (0.0%) | 0 (0.0%) |
| Bachelor's Degree | 0 (0.0%) | 0 (0.0%) |
| Graduate Degree | 0 (0.0%) | 0 (0.0%) |
| Total | 0 (0.0%) | 0 (0.0%) |
Employment Characteristics in Naranjito
Employment by Class of Employer in Naranjito
Among the 750 employed individuals in Naranjito, private company employees (541 | 72.1%), state government employees (75 | 10.0%), and local government employees (59 | 7.9%) make up the most common classes of employment.
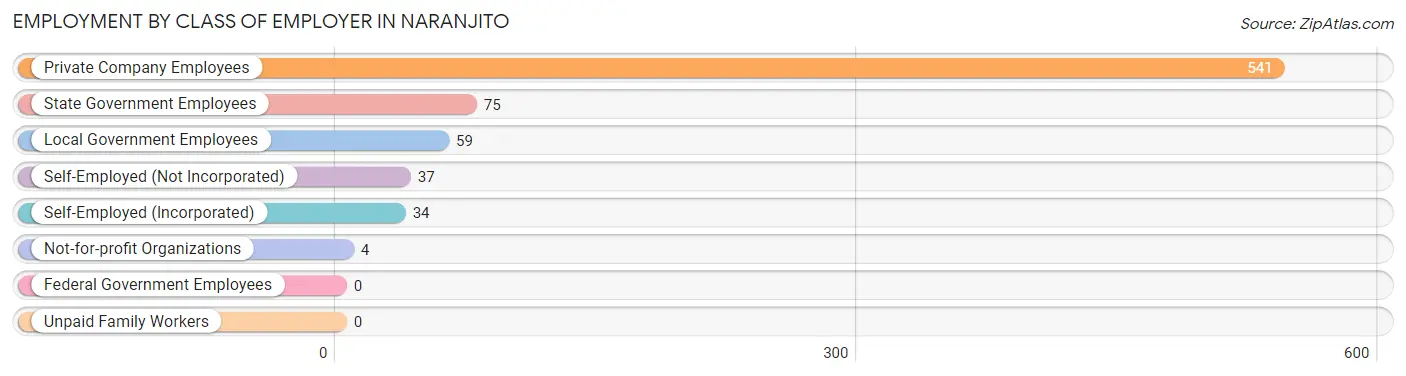
| Employer Class | # Employees | % Employees |
| Private Company Employees | 541 | 72.1% |
| Self-Employed (Incorporated) | 34 | 4.5% |
| Self-Employed (Not Incorporated) | 37 | 4.9% |
| Not-for-profit Organizations | 4 | 0.5% |
| Local Government Employees | 59 | 7.9% |
| State Government Employees | 75 | 10.0% |
| Federal Government Employees | 0 | 0.0% |
| Unpaid Family Workers | 0 | 0.0% |
| Total | 750 | 100.0% |
Employment Status by Age in Naranjito
According to the labor force statistics for Naranjito, out of the total population over 16 years of age (2,594), 48.0% or 1,245 individuals are in the labor force, with 32.5% or 405 of them unemployed. The age group with the highest labor force participation rate is 20 to 24 years, with 89.0% or 282 individuals in the labor force. Within the labor force, the 20 to 24 years age range has the highest percentage of unemployed individuals, with 78.0% or 220 of them being unemployed.
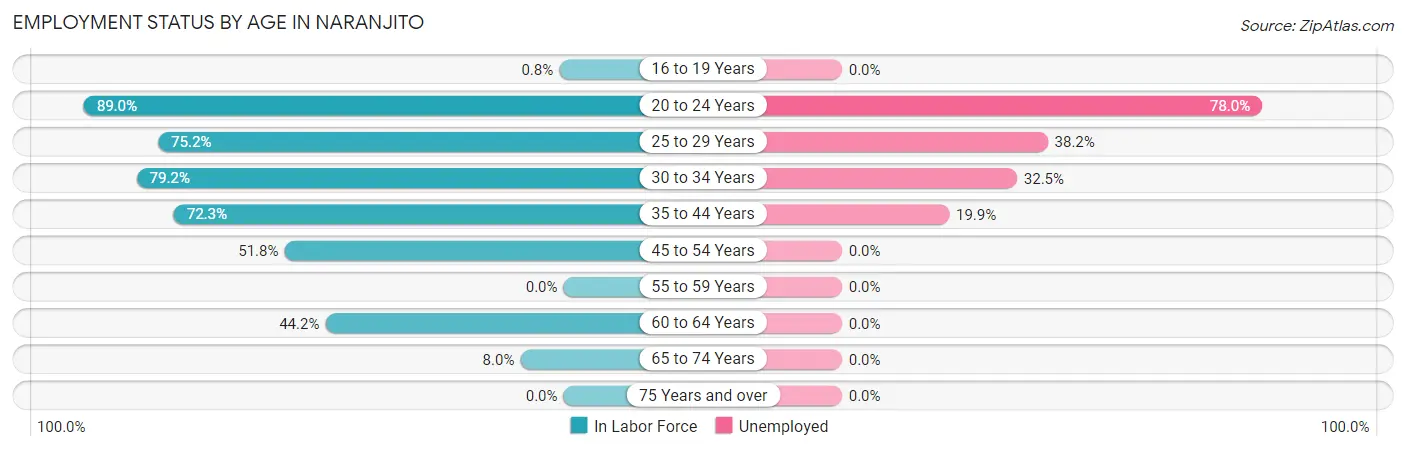
| Age Bracket | In Labor Force | Unemployed |
| 16 to 19 Years | 1 (0.8%) | 0 (0.0%) |
| 20 to 24 Years | 282 (89.0%) | 220 (78.0%) |
| 25 to 29 Years | 76 (75.2%) | 29 (38.2%) |
| 30 to 34 Years | 286 (79.2%) | 93 (32.5%) |
| 35 to 44 Years | 311 (72.3%) | 62 (19.9%) |
| 45 to 54 Years | 160 (51.8%) | 0 (0.0%) |
| 55 to 59 Years | 0 (0.0%) | 0 (0.0%) |
| 60 to 64 Years | 100 (44.2%) | 0 (0.0%) |
| 65 to 74 Years | 28 (8.0%) | 0 (0.0%) |
| 75 Years and over | 0 (0.0%) | 0 (0.0%) |
| Total | 1,245 (48.0%) | 405 (32.5%) |
Employment Status by Educational Attainment in Naranjito
According to labor force statistics for Naranjito, 61.2% of individuals (933) out of the total population between 25 and 64 years of age (1,525) are in the labor force, with 19.7% or 184 of them being unemployed. The group with the highest labor force participation rate are those with the educational attainment of bachelor's degree or higher, with 99.3% or 148 individuals in the labor force. Within the labor force, individuals with less than high school education have the highest percentage of unemployment, with 41.2% or 21 of them being unemployed.
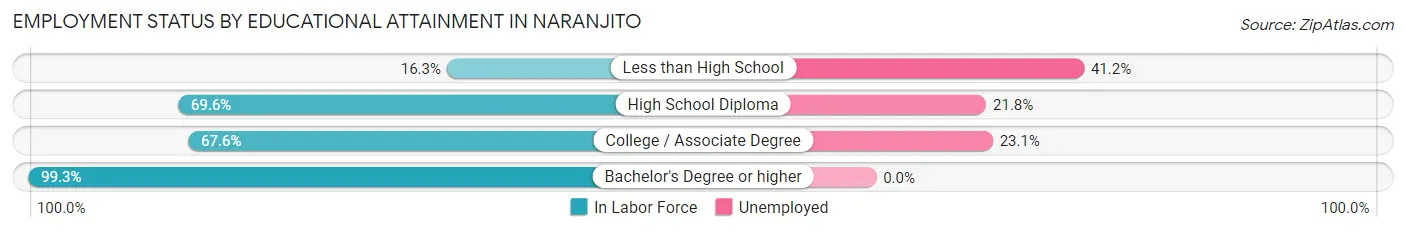
| Educational Attainment | In Labor Force | Unemployed |
| Less than High School | 51 (16.3%) | 129 (41.2%) |
| High School Diploma | 509 (69.6%) | 159 (21.8%) |
| College / Associate Degree | 225 (67.6%) | 77 (23.1%) |
| Bachelor's Degree or higher | 148 (99.3%) | 0 (0.0%) |
| Total | 933 (61.2%) | 300 (19.7%) |
Employment Occupations by Sex in Naranjito
Management, Business, Science and Arts Occupations
The most common Management, Business, Science and Arts occupations in Naranjito are Health Diagnosing & Treating (43 | 5.1%), Health Technologists (36 | 4.3%), Management (27 | 3.2%), Computers, Engineering & Science (27 | 3.2%), and Computers & Mathematics (27 | 3.2%).
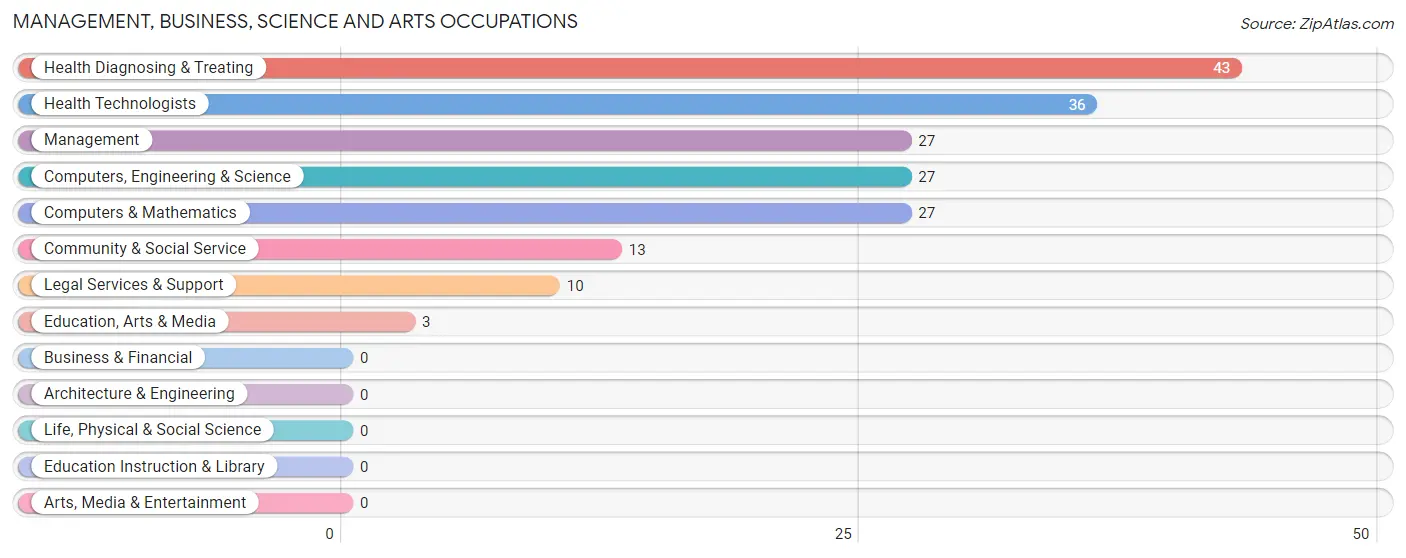
Management, Business, Science and Arts Occupations by Sex
Within the Management, Business, Science and Arts occupations in Naranjito, the most male-oriented occupations are Computers, Engineering & Science (100.0%), Computers & Mathematics (100.0%), and Education, Arts & Media (100.0%), while the most female-oriented occupations are Legal Services & Support (100.0%), Community & Social Service (76.9%), and Management (37.0%).
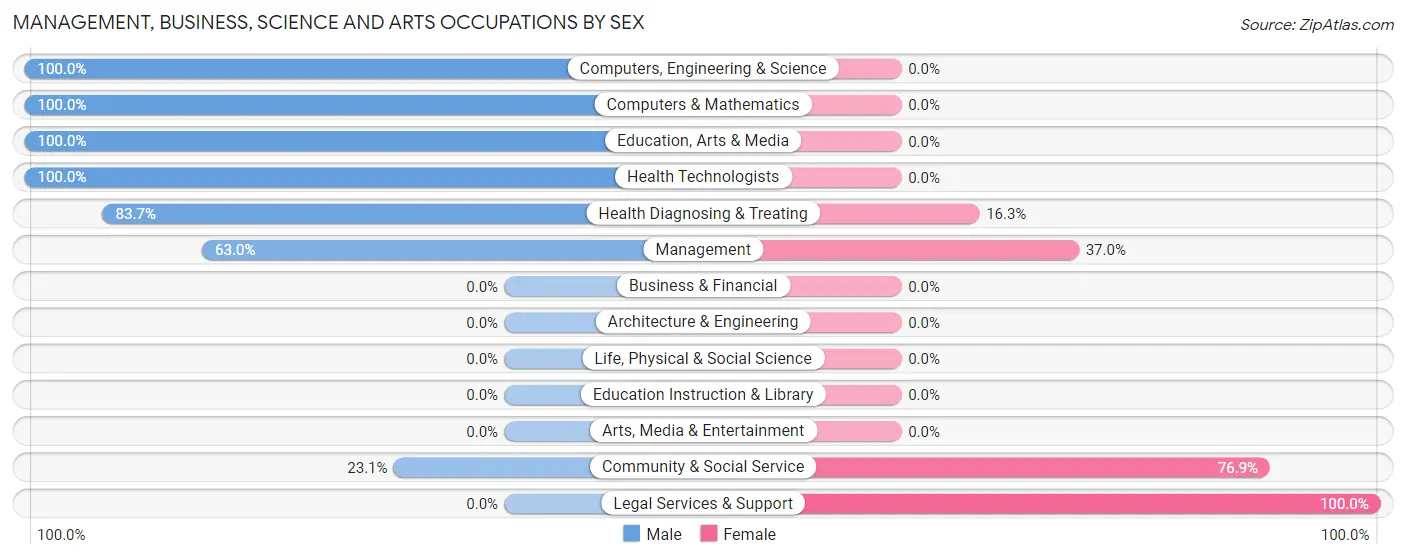
| Occupation | Male | Female |
| Management | 17 (63.0%) | 10 (37.0%) |
| Business & Financial | 0 (0.0%) | 0 (0.0%) |
| Computers, Engineering & Science | 27 (100.0%) | 0 (0.0%) |
| Computers & Mathematics | 27 (100.0%) | 0 (0.0%) |
| Architecture & Engineering | 0 (0.0%) | 0 (0.0%) |
| Life, Physical & Social Science | 0 (0.0%) | 0 (0.0%) |
| Community & Social Service | 3 (23.1%) | 10 (76.9%) |
| Education, Arts & Media | 3 (100.0%) | 0 (0.0%) |
| Legal Services & Support | 0 (0.0%) | 10 (100.0%) |
| Education Instruction & Library | 0 (0.0%) | 0 (0.0%) |
| Arts, Media & Entertainment | 0 (0.0%) | 0 (0.0%) |
| Health Diagnosing & Treating | 36 (83.7%) | 7 (16.3%) |
| Health Technologists | 36 (100.0%) | 0 (0.0%) |
| Total (Category) | 83 (75.4%) | 27 (24.5%) |
| Total (Overall) | 532 (63.3%) | 308 (36.7%) |
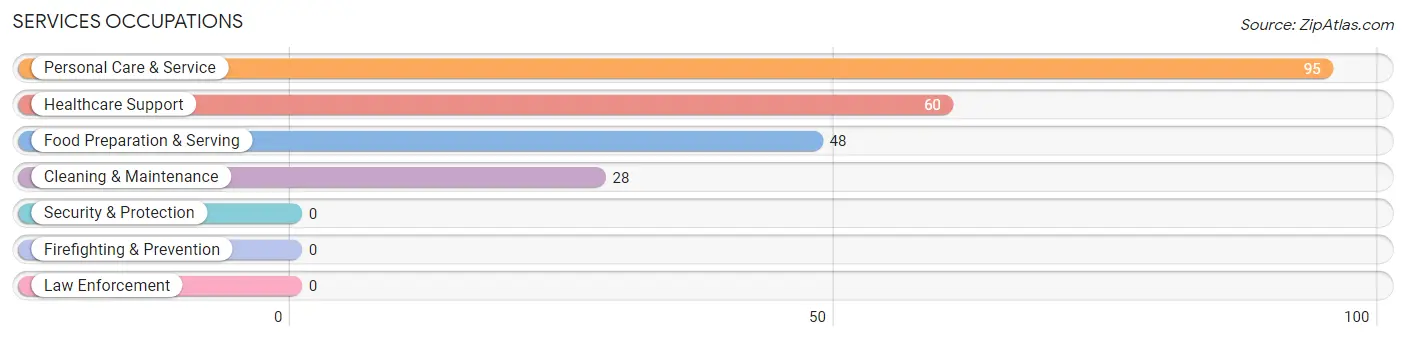
Services Occupations
The most common Services occupations in Naranjito are Personal Care & Service (95 | 11.3%), Healthcare Support (60 | 7.1%), Food Preparation & Serving (48 | 5.7%), and Cleaning & Maintenance (28 | 3.3%).
Services Occupations by Sex
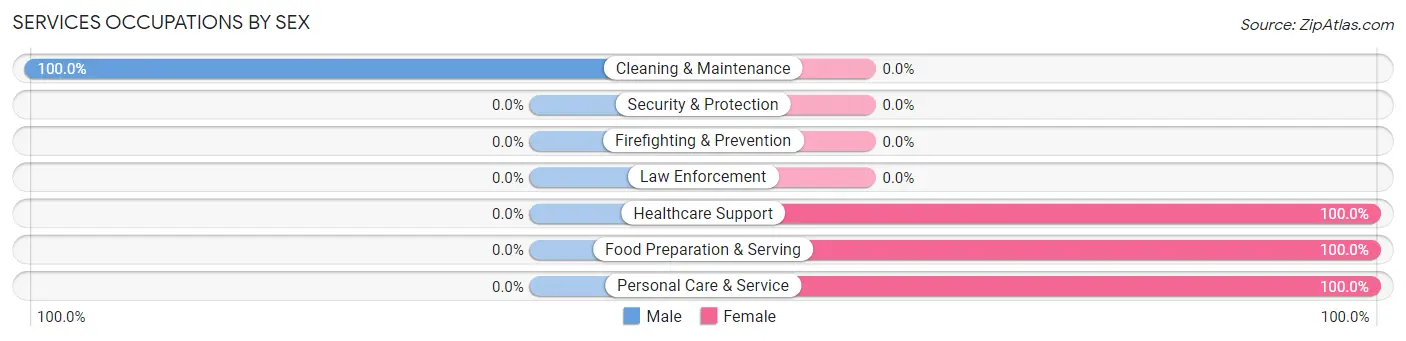
| Occupation | Male | Female |
| Healthcare Support | 0 (0.0%) | 60 (100.0%) |
| Security & Protection | 0 (0.0%) | 0 (0.0%) |
| Firefighting & Prevention | 0 (0.0%) | 0 (0.0%) |
| Law Enforcement | 0 (0.0%) | 0 (0.0%) |
| Food Preparation & Serving | 0 (0.0%) | 48 (100.0%) |
| Cleaning & Maintenance | 28 (100.0%) | 0 (0.0%) |
| Personal Care & Service | 0 (0.0%) | 95 (100.0%) |
| Total (Category) | 28 (12.1%) | 203 (87.9%) |
| Total (Overall) | 532 (63.3%) | 308 (36.7%) |
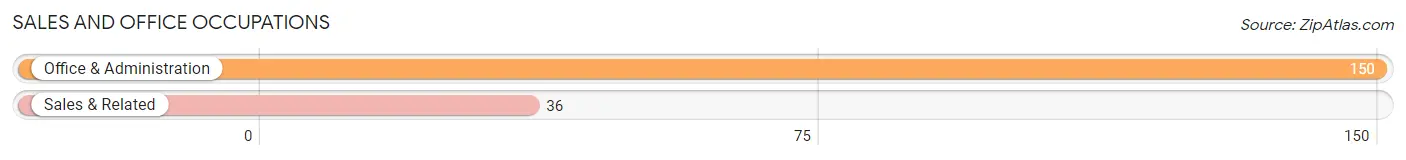
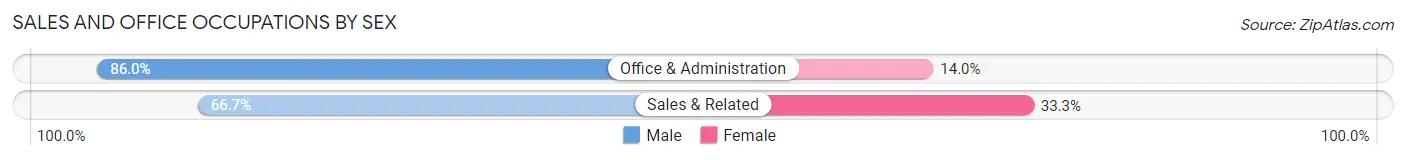
Sales and Office Occupations
The most common Sales and Office occupations in Naranjito are Office & Administration (150 | 17.9%), and Sales & Related (36 | 4.3%).
Sales and Office Occupations by Sex
| Occupation | Male | Female |
| Sales & Related | 24 (66.7%) | 12 (33.3%) |
| Office & Administration | 129 (86.0%) | 21 (14.0%) |
| Total (Category) | 153 (82.3%) | 33 (17.7%) |
| Total (Overall) | 532 (63.3%) | 308 (36.7%) |
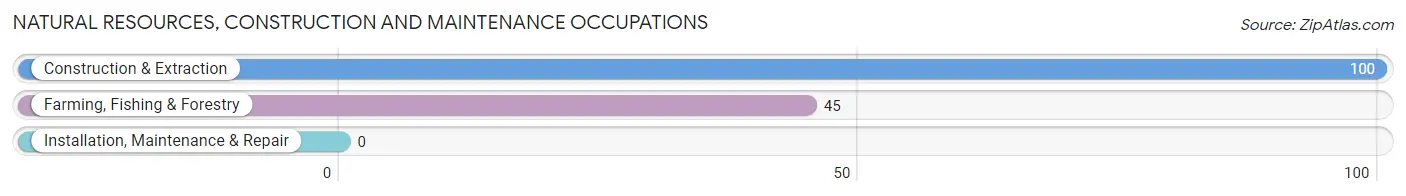
Natural Resources, Construction and Maintenance Occupations
The most common Natural Resources, Construction and Maintenance occupations in Naranjito are Construction & Extraction (100 | 11.9%), and Farming, Fishing & Forestry (45 | 5.4%).
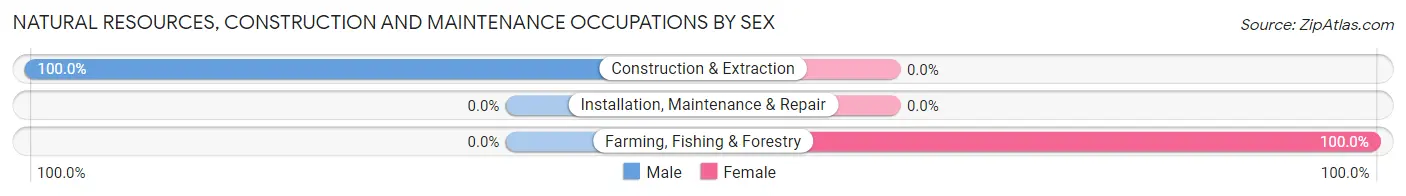
Natural Resources, Construction and Maintenance Occupations by Sex
| Occupation | Male | Female |
| Farming, Fishing & Forestry | 0 (0.0%) | 45 (100.0%) |
| Construction & Extraction | 100 (100.0%) | 0 (0.0%) |
| Installation, Maintenance & Repair | 0 (0.0%) | 0 (0.0%) |
| Total (Category) | 100 (69.0%) | 45 (31.0%) |
| Total (Overall) | 532 (63.3%) | 308 (36.7%) |
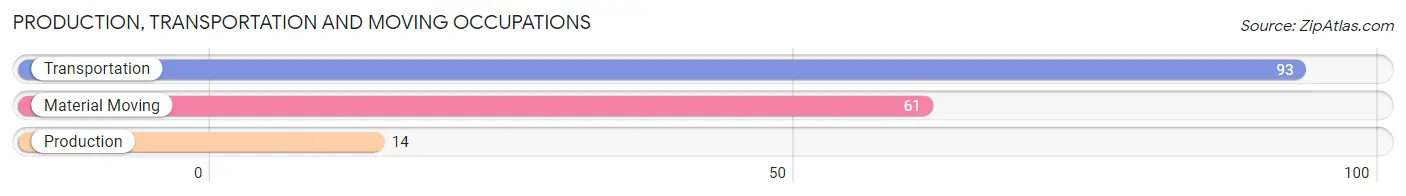
Production, Transportation and Moving Occupations
The most common Production, Transportation and Moving occupations in Naranjito are Transportation (93 | 11.1%), Material Moving (61 | 7.3%), and Production (14 | 1.7%).
Production, Transportation and Moving Occupations by Sex
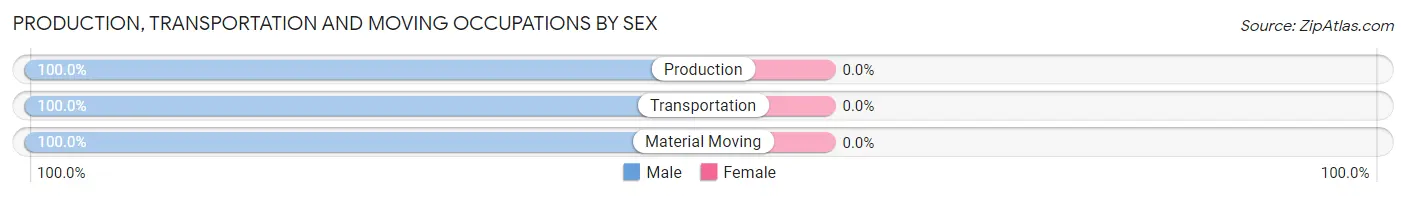
| Occupation | Male | Female |
| Production | 14 (100.0%) | 0 (0.0%) |
| Transportation | 93 (100.0%) | 0 (0.0%) |
| Material Moving | 61 (100.0%) | 0 (0.0%) |
| Total (Category) | 168 (100.0%) | 0 (0.0%) |
| Total (Overall) | 532 (63.3%) | 308 (36.7%) |
Employment Industries by Sex in Naranjito
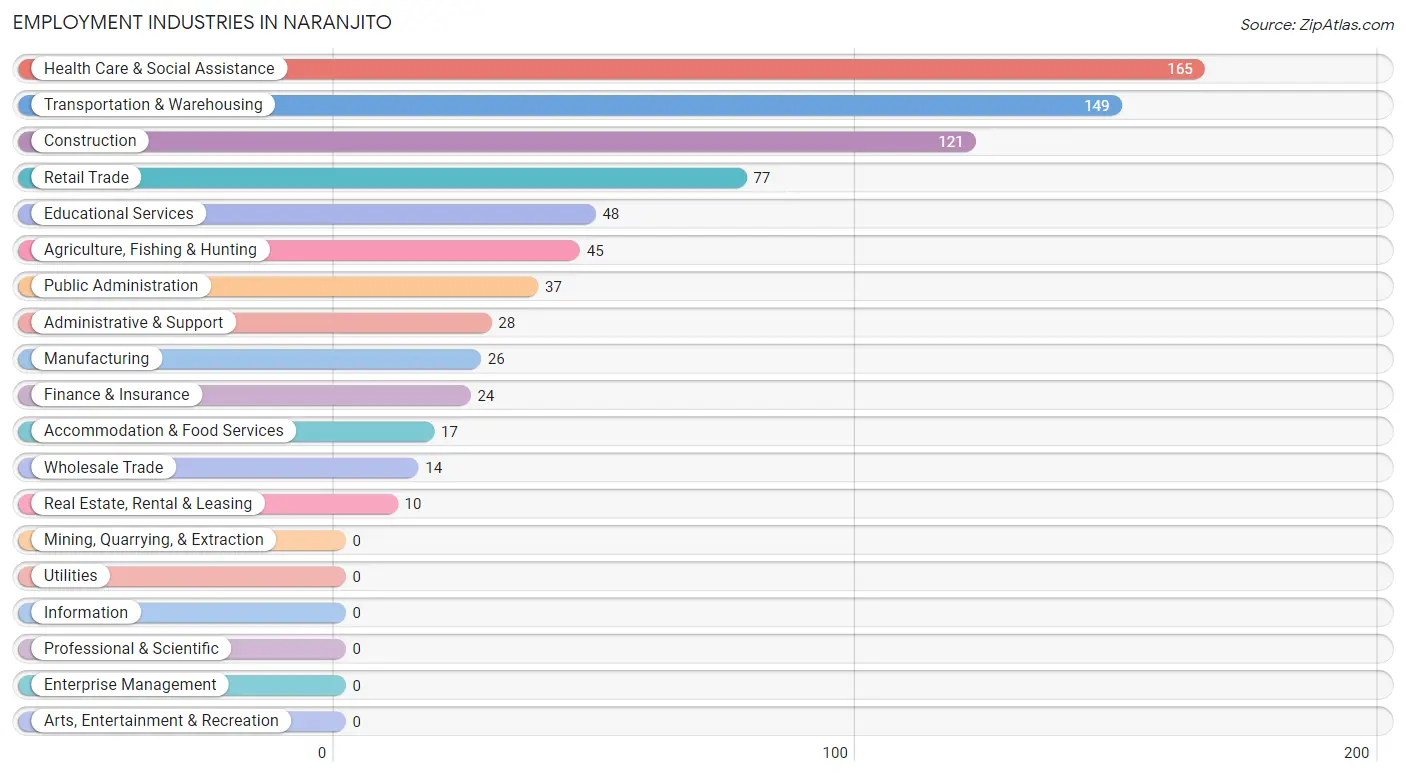
Employment Industries in Naranjito
The major employment industries in Naranjito include Health Care & Social Assistance (165 | 19.6%), Transportation & Warehousing (149 | 17.7%), Construction (121 | 14.4%), Retail Trade (77 | 9.2%), and Educational Services (48 | 5.7%).
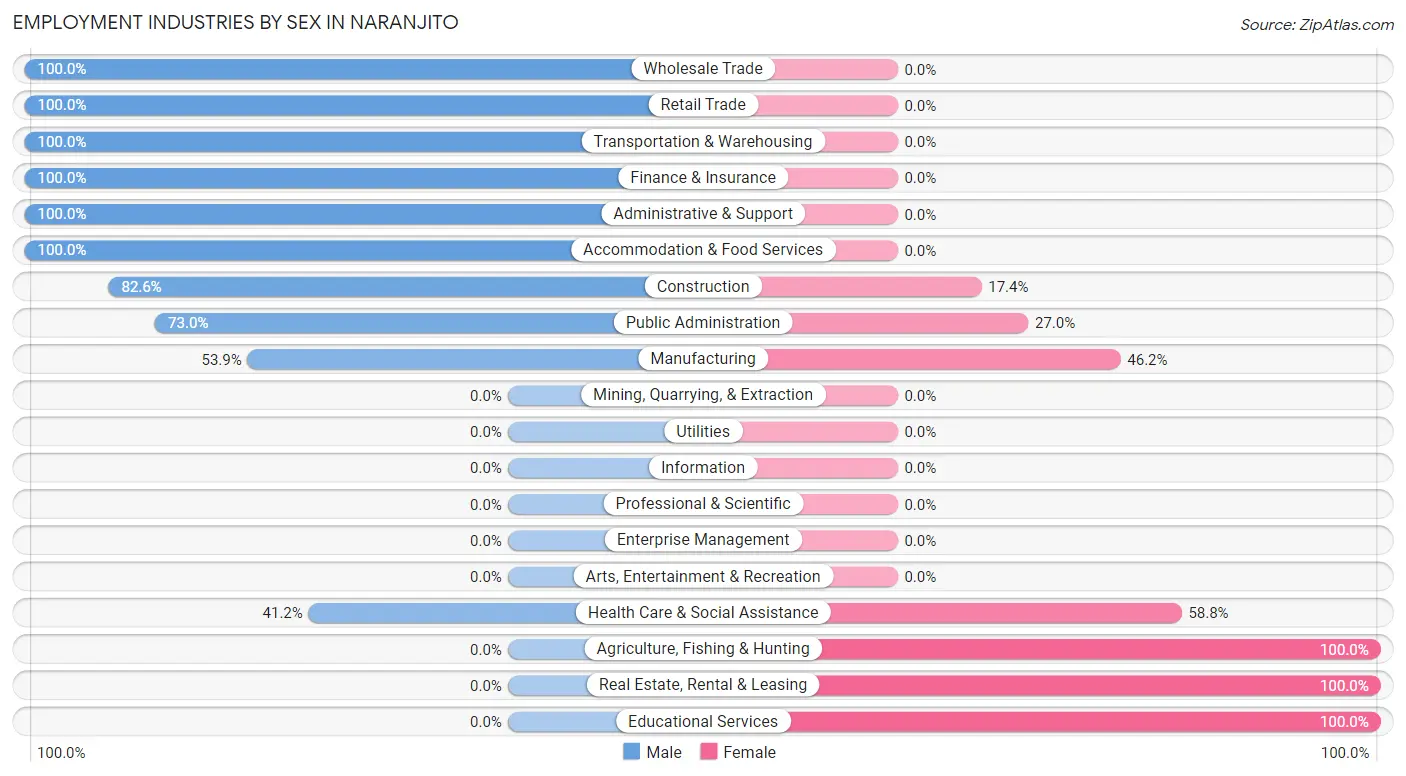
Employment Industries by Sex in Naranjito
The Naranjito industries that see more men than women are Wholesale Trade (100.0%), Retail Trade (100.0%), and Transportation & Warehousing (100.0%), whereas the industries that tend to have a higher number of women are Agriculture, Fishing & Hunting (100.0%), Real Estate, Rental & Leasing (100.0%), and Educational Services (100.0%).
| Industry | Male | Female |
| Agriculture, Fishing & Hunting | 0 (0.0%) | 45 (100.0%) |
| Mining, Quarrying, & Extraction | 0 (0.0%) | 0 (0.0%) |
| Construction | 100 (82.6%) | 21 (17.4%) |
| Manufacturing | 14 (53.8%) | 12 (46.2%) |
| Wholesale Trade | 14 (100.0%) | 0 (0.0%) |
| Retail Trade | 77 (100.0%) | 0 (0.0%) |
| Transportation & Warehousing | 149 (100.0%) | 0 (0.0%) |
| Utilities | 0 (0.0%) | 0 (0.0%) |
| Information | 0 (0.0%) | 0 (0.0%) |
| Finance & Insurance | 24 (100.0%) | 0 (0.0%) |
| Real Estate, Rental & Leasing | 0 (0.0%) | 10 (100.0%) |
| Professional & Scientific | 0 (0.0%) | 0 (0.0%) |
| Enterprise Management | 0 (0.0%) | 0 (0.0%) |
| Administrative & Support | 28 (100.0%) | 0 (0.0%) |
| Educational Services | 0 (0.0%) | 48 (100.0%) |
| Health Care & Social Assistance | 68 (41.2%) | 97 (58.8%) |
| Arts, Entertainment & Recreation | 0 (0.0%) | 0 (0.0%) |
| Accommodation & Food Services | 17 (100.0%) | 0 (0.0%) |
| Public Administration | 27 (73.0%) | 10 (27.0%) |
| Total | 532 (63.3%) | 308 (36.7%) |
Education in Naranjito
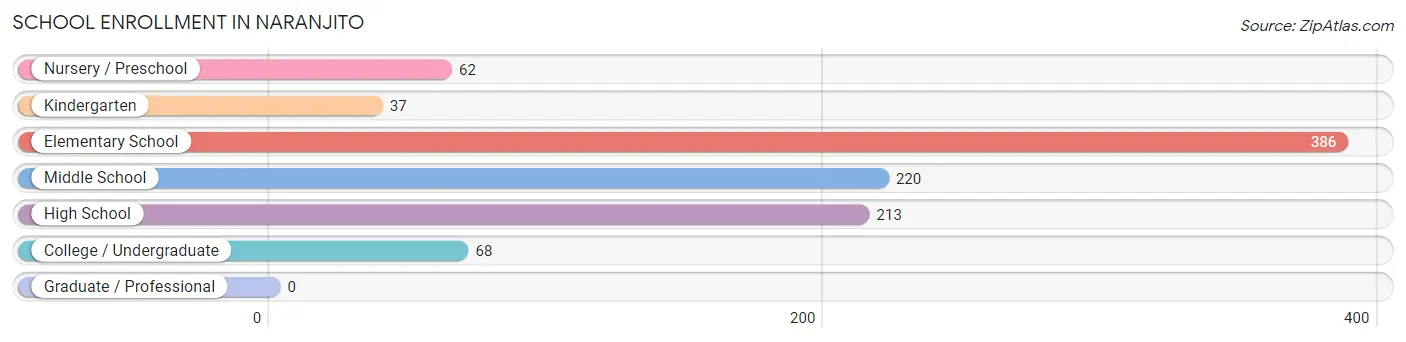
School Enrollment in Naranjito
The most common levels of schooling among the 986 students in Naranjito are elementary school (386 | 39.2%), middle school (220 | 22.3%), and high school (213 | 21.6%).
| School Level | # Students | % Students |
| Nursery / Preschool | 62 | 6.3% |
| Kindergarten | 37 | 3.7% |
| Elementary School | 386 | 39.2% |
| Middle School | 220 | 22.3% |
| High School | 213 | 21.6% |
| College / Undergraduate | 68 | 6.9% |
| Graduate / Professional | 0 | 0.0% |
| Total | 986 | 100.0% |
School Enrollment by Age by Funding Source in Naranjito
Out of a total of 986 students who are enrolled in schools in Naranjito, 34 (3.4%) attend a private institution, while the remaining 952 (96.6%) are enrolled in public schools. The age group of 35 years and over has the highest likelihood of being enrolled in private schools, with 20 (100.0% in the age bracket) enrolled. Conversely, the age group of 3 to 4 year olds has the lowest likelihood of being enrolled in a private school, with 22 (100.0% in the age bracket) attending a public institution.
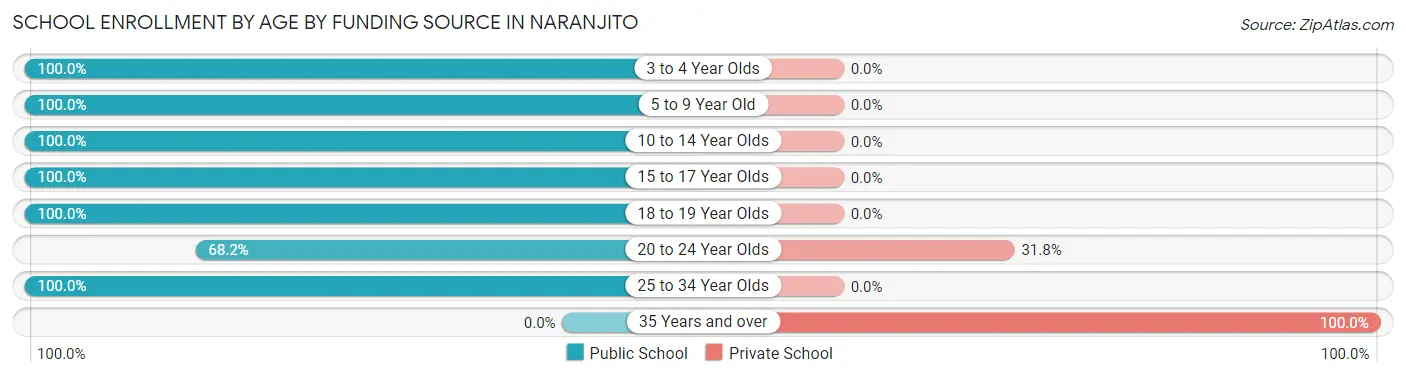
| Age Bracket | Public School | Private School |
| 3 to 4 Year Olds | 22 (100.0%) | 0 (0.0%) |
| 5 to 9 Year Old | 463 (100.0%) | 0 (0.0%) |
| 10 to 14 Year Olds | 220 (100.0%) | 0 (0.0%) |
| 15 to 17 Year Olds | 213 (100.0%) | 0 (0.0%) |
| 18 to 19 Year Olds | 3 (100.0%) | 0 (0.0%) |
| 20 to 24 Year Olds | 30 (68.2%) | 14 (31.8%) |
| 25 to 34 Year Olds | 1 (100.0%) | 0 (0.0%) |
| 35 Years and over | 0 (0.0%) | 20 (100.0%) |
| Total | 952 (96.6%) | 34 (3.4%) |
Educational Attainment by Field of Study in Naranjito
Business (141 | 60.0%), education (46 | 19.6%), science & technology (36 | 15.3%), multidisciplinary studies (8 | 3.4%), and liberal arts & history (3 | 1.3%) are the most common fields of study among 235 individuals in Naranjito who have obtained a bachelor's degree or higher.
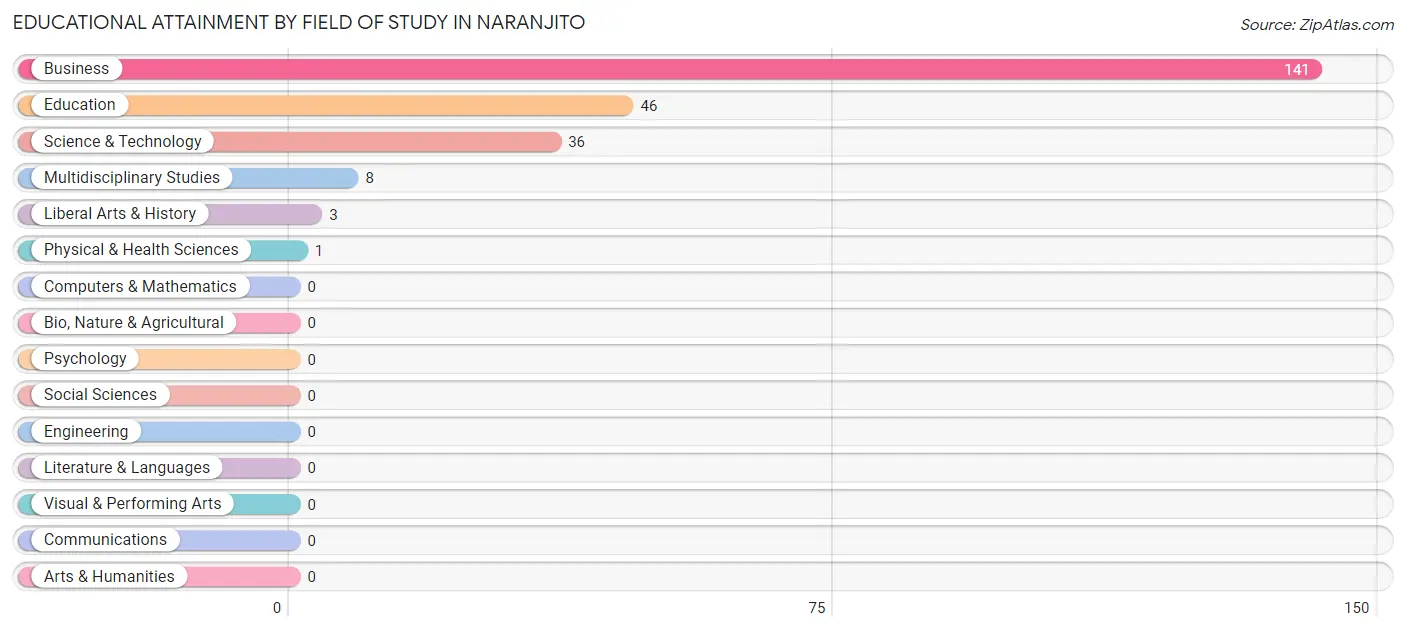
| Field of Study | # Graduates | % Graduates |
| Computers & Mathematics | 0 | 0.0% |
| Bio, Nature & Agricultural | 0 | 0.0% |
| Physical & Health Sciences | 1 | 0.4% |
| Psychology | 0 | 0.0% |
| Social Sciences | 0 | 0.0% |
| Engineering | 0 | 0.0% |
| Multidisciplinary Studies | 8 | 3.4% |
| Science & Technology | 36 | 15.3% |
| Business | 141 | 60.0% |
| Education | 46 | 19.6% |
| Literature & Languages | 0 | 0.0% |
| Liberal Arts & History | 3 | 1.3% |
| Visual & Performing Arts | 0 | 0.0% |
| Communications | 0 | 0.0% |
| Arts & Humanities | 0 | 0.0% |
| Total | 235 | 100.0% |
Transportation & Commute in Naranjito
Vehicle Availability by Sex in Naranjito
The most prevalent vehicle ownership categories in Naranjito are males with 1 vehicle (132, accounting for 27.3%) and females with 1 vehicle (60, making up 50.6%).
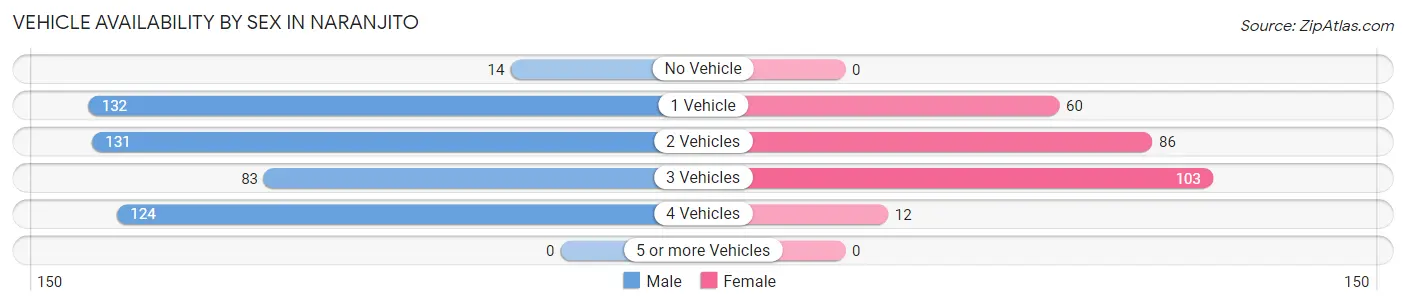
| Vehicles Available | Male | Female |
| No Vehicle | 14 (2.9%) | 0 (0.0%) |
| 1 Vehicle | 132 (27.3%) | 60 (23.0%) |
| 2 Vehicles | 131 (27.1%) | 86 (33.0%) |
| 3 Vehicles | 83 (17.2%) | 103 (39.5%) |
| 4 Vehicles | 124 (25.6%) | 12 (4.6%) |
| 5 or more Vehicles | 0 (0.0%) | 0 (0.0%) |
| Total | 484 (100.0%) | 261 (100.0%) |
Commute Time in Naranjito
The most frequently occuring commute durations in Naranjito are 30 to 34 minutes (144 commuters, 19.3%), 35 to 39 minutes (124 commuters, 16.6%), and 60 to 89 minutes (96 commuters, 12.8%).
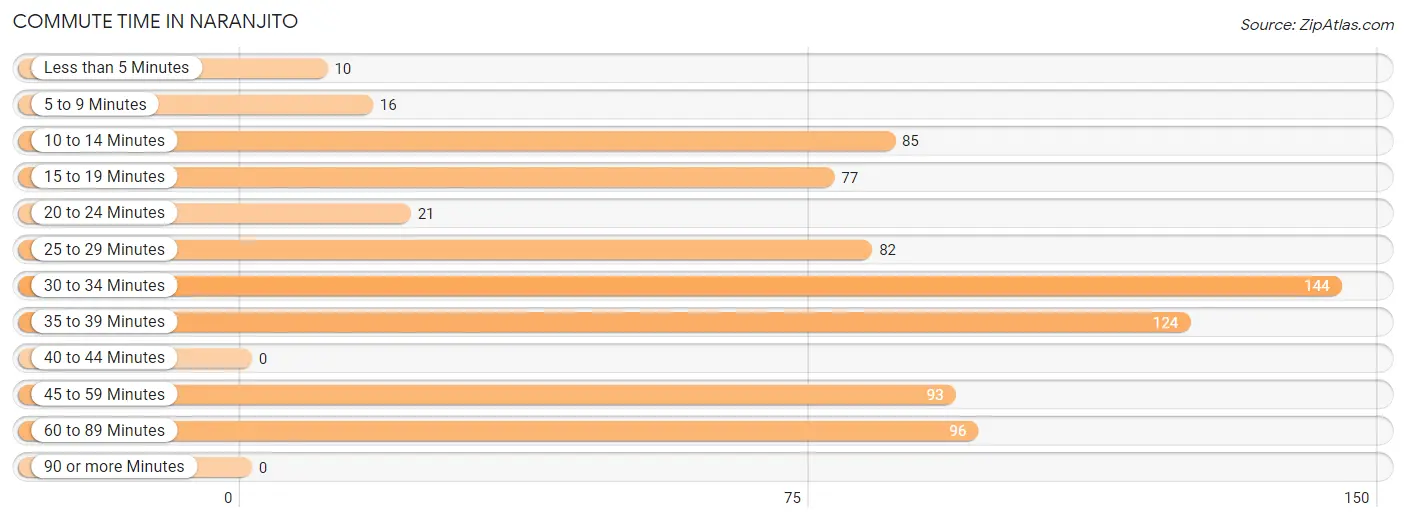
| Commute Time | # Commuters | % Commuters |
| Less than 5 Minutes | 10 | 1.3% |
| 5 to 9 Minutes | 16 | 2.1% |
| 10 to 14 Minutes | 85 | 11.4% |
| 15 to 19 Minutes | 77 | 10.3% |
| 20 to 24 Minutes | 21 | 2.8% |
| 25 to 29 Minutes | 82 | 11.0% |
| 30 to 34 Minutes | 144 | 19.3% |
| 35 to 39 Minutes | 124 | 16.6% |
| 40 to 44 Minutes | 0 | 0.0% |
| 45 to 59 Minutes | 93 | 12.4% |
| 60 to 89 Minutes | 96 | 12.8% |
| 90 or more Minutes | 0 | 0.0% |
Commute Time by Sex in Naranjito
The most common commute times in Naranjito are 30 to 34 minutes (96 commuters, 19.7%) for males and 10 to 14 minutes (70 commuters, 26.8%) for females.
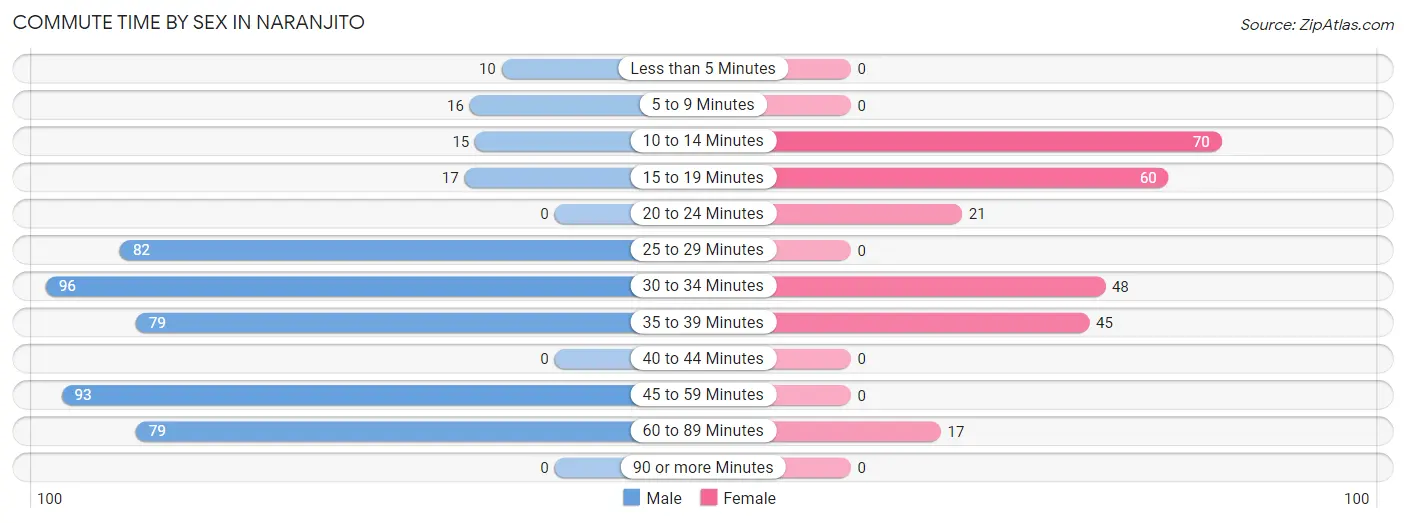
| Commute Time | Male | Female |
| Less than 5 Minutes | 10 (2.1%) | 0 (0.0%) |
| 5 to 9 Minutes | 16 (3.3%) | 0 (0.0%) |
| 10 to 14 Minutes | 15 (3.1%) | 70 (26.8%) |
| 15 to 19 Minutes | 17 (3.5%) | 60 (23.0%) |
| 20 to 24 Minutes | 0 (0.0%) | 21 (8.1%) |
| 25 to 29 Minutes | 82 (16.8%) | 0 (0.0%) |
| 30 to 34 Minutes | 96 (19.7%) | 48 (18.4%) |
| 35 to 39 Minutes | 79 (16.2%) | 45 (17.2%) |
| 40 to 44 Minutes | 0 (0.0%) | 0 (0.0%) |
| 45 to 59 Minutes | 93 (19.1%) | 0 (0.0%) |
| 60 to 89 Minutes | 79 (16.2%) | 17 (6.5%) |
| 90 or more Minutes | 0 (0.0%) | 0 (0.0%) |
Time of Departure to Work by Sex in Naranjito
The most frequent times of departure to work in Naranjito are 5:30 AM to 5:59 AM (181, 37.2%) for males and 7:00 AM to 7:29 AM (79, 30.3%) for females.
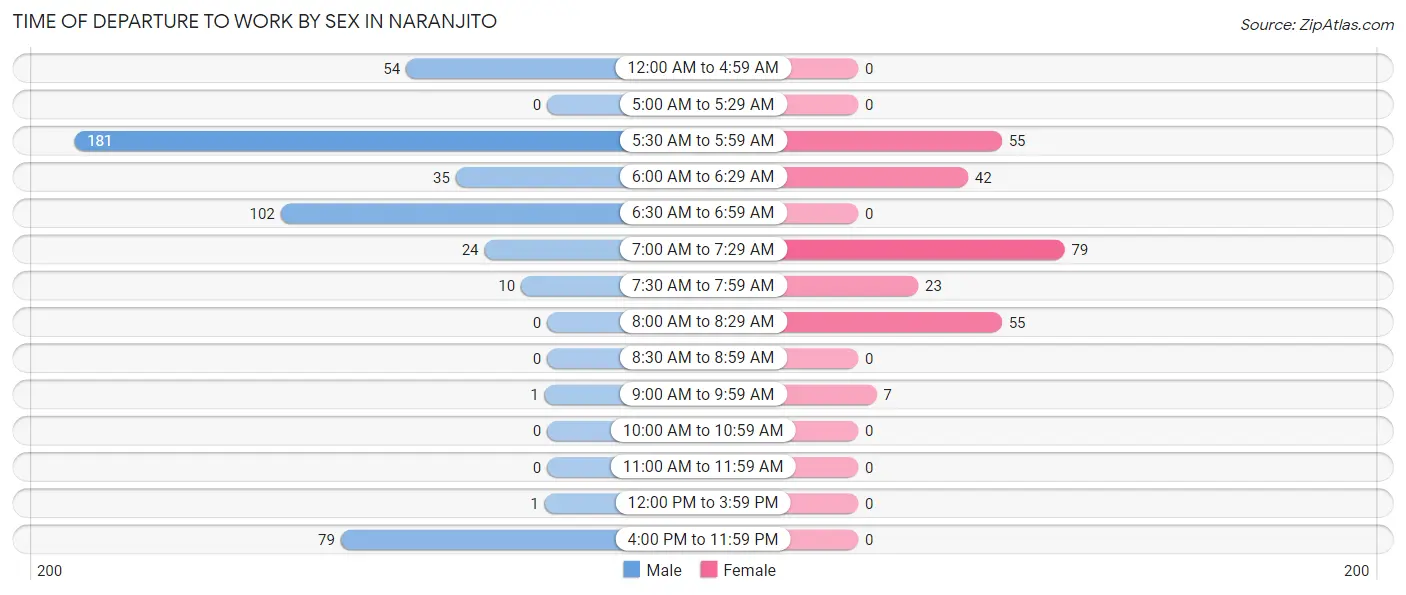
| Time of Departure | Male | Female |
| 12:00 AM to 4:59 AM | 54 (11.1%) | 0 (0.0%) |
| 5:00 AM to 5:29 AM | 0 (0.0%) | 0 (0.0%) |
| 5:30 AM to 5:59 AM | 181 (37.2%) | 55 (21.1%) |
| 6:00 AM to 6:29 AM | 35 (7.2%) | 42 (16.1%) |
| 6:30 AM to 6:59 AM | 102 (20.9%) | 0 (0.0%) |
| 7:00 AM to 7:29 AM | 24 (4.9%) | 79 (30.3%) |
| 7:30 AM to 7:59 AM | 10 (2.1%) | 23 (8.8%) |
| 8:00 AM to 8:29 AM | 0 (0.0%) | 55 (21.1%) |
| 8:30 AM to 8:59 AM | 0 (0.0%) | 0 (0.0%) |
| 9:00 AM to 9:59 AM | 1 (0.2%) | 7 (2.7%) |
| 10:00 AM to 10:59 AM | 0 (0.0%) | 0 (0.0%) |
| 11:00 AM to 11:59 AM | 0 (0.0%) | 0 (0.0%) |
| 12:00 PM to 3:59 PM | 1 (0.2%) | 0 (0.0%) |
| 4:00 PM to 11:59 PM | 79 (16.2%) | 0 (0.0%) |
| Total | 487 (100.0%) | 261 (100.0%) |
Housing Occupancy in Naranjito
Occupancy by Ownership in Naranjito
Of the total 1,018 dwellings in Naranjito, owner-occupied units account for 544 (53.4%), while renter-occupied units make up 474 (46.6%).
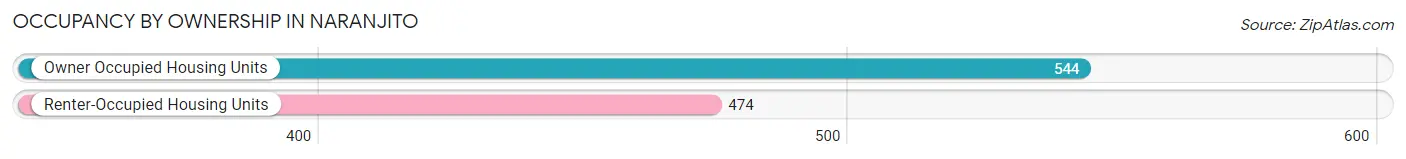
| Occupancy | # Housing Units | % Housing Units |
| Owner Occupied Housing Units | 544 | 53.4% |
| Renter-Occupied Housing Units | 474 | 46.6% |
| Total Occupied Housing Units | 1,018 | 100.0% |
Occupancy by Household Size in Naranjito
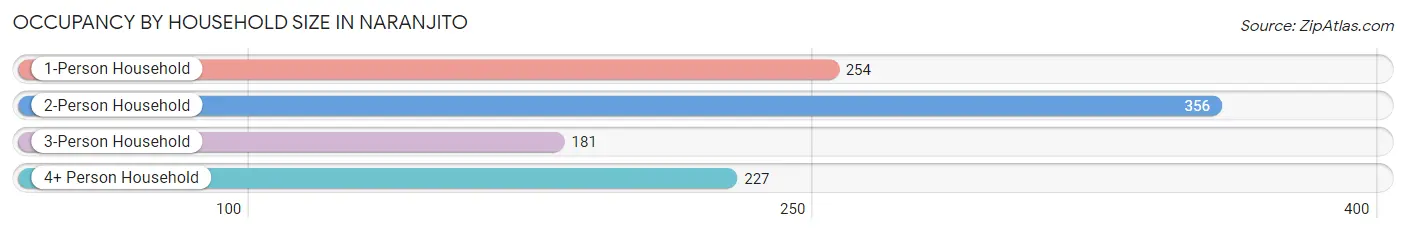
| Household Size | # Housing Units | % Housing Units |
| 1-Person Household | 254 | 24.9% |
| 2-Person Household | 356 | 35.0% |
| 3-Person Household | 181 | 17.8% |
| 4+ Person Household | 227 | 22.3% |
| Total Housing Units | 1,018 | 100.0% |
Occupancy by Ownership by Household Size in Naranjito
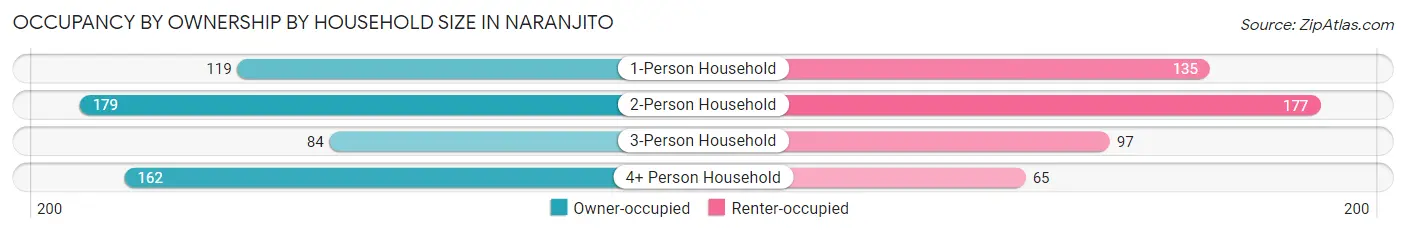
| Household Size | Owner-occupied | Renter-occupied |
| 1-Person Household | 119 (46.9%) | 135 (53.1%) |
| 2-Person Household | 179 (50.3%) | 177 (49.7%) |
| 3-Person Household | 84 (46.4%) | 97 (53.6%) |
| 4+ Person Household | 162 (71.4%) | 65 (28.6%) |
| Total Housing Units | 544 (53.4%) | 474 (46.6%) |
Occupancy by Educational Attainment in Naranjito
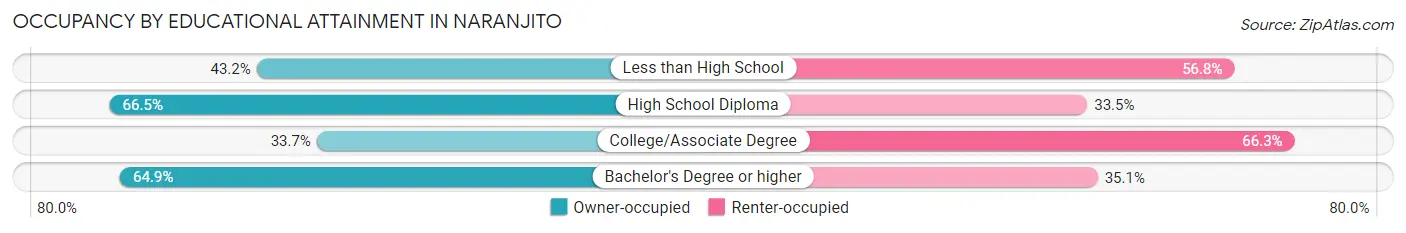
| Household Size | Owner-occupied | Renter-occupied |
| Less than High School | 124 (43.2%) | 163 (56.8%) |
| High School Diploma | 282 (66.5%) | 142 (33.5%) |
| College/Associate Degree | 66 (33.7%) | 130 (66.3%) |
| Bachelor's Degree or higher | 72 (64.9%) | 39 (35.1%) |
Occupancy by Age of Householder in Naranjito
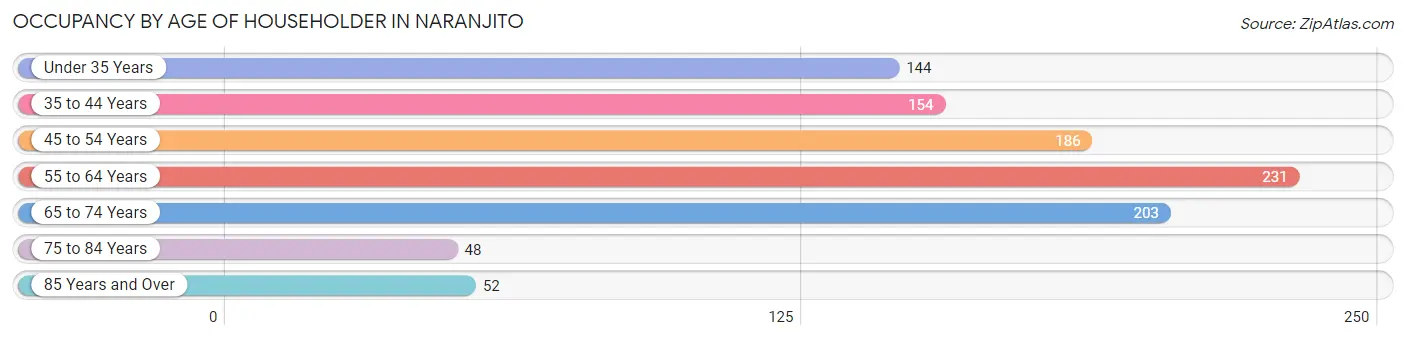
| Age Bracket | # Households | % Households |
| Under 35 Years | 144 | 14.1% |
| 35 to 44 Years | 154 | 15.1% |
| 45 to 54 Years | 186 | 18.3% |
| 55 to 64 Years | 231 | 22.7% |
| 65 to 74 Years | 203 | 19.9% |
| 75 to 84 Years | 48 | 4.7% |
| 85 Years and Over | 52 | 5.1% |
| Total | 1,018 | 100.0% |
Housing Finances in Naranjito
Median Income by Occupancy in Naranjito
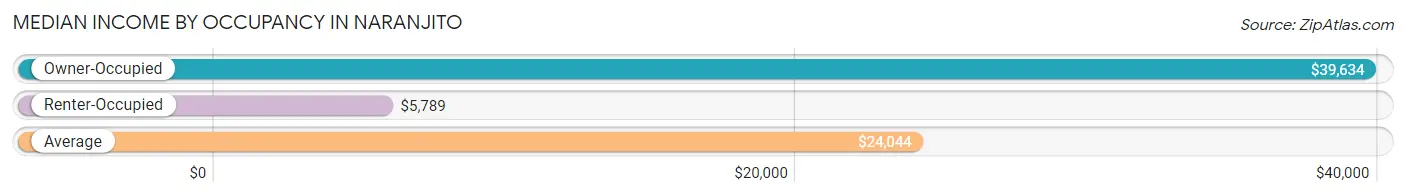
| Occupancy Type | # Households | Median Income |
| Owner-Occupied | 544 (53.4%) | $39,634 |
| Renter-Occupied | 474 (46.6%) | $5,789 |
| Average | 1,018 (100.0%) | $24,044 |
Occupancy by Householder Income Bracket in Naranjito
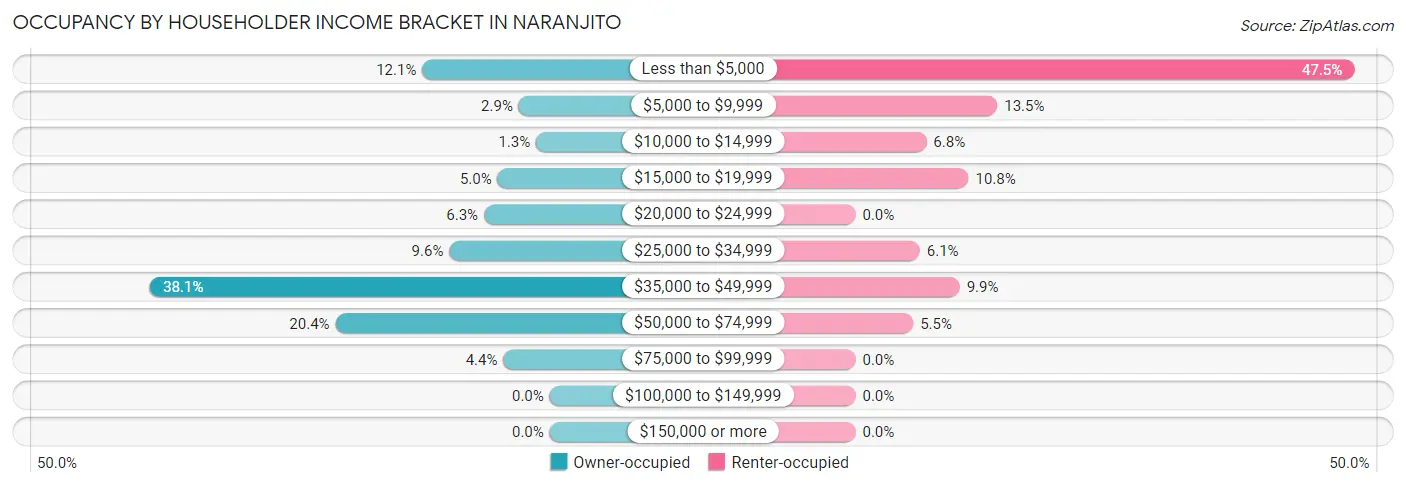
| Income Bracket | Owner-occupied | Renter-occupied |
| Less than $5,000 | 66 (12.1%) | 225 (47.5%) |
| $5,000 to $9,999 | 16 (2.9%) | 64 (13.5%) |
| $10,000 to $14,999 | 7 (1.3%) | 32 (6.8%) |
| $15,000 to $19,999 | 27 (5.0%) | 51 (10.8%) |
| $20,000 to $24,999 | 34 (6.2%) | 0 (0.0%) |
| $25,000 to $34,999 | 52 (9.6%) | 29 (6.1%) |
| $35,000 to $49,999 | 207 (38.1%) | 47 (9.9%) |
| $50,000 to $74,999 | 111 (20.4%) | 26 (5.5%) |
| $75,000 to $99,999 | 24 (4.4%) | 0 (0.0%) |
| $100,000 to $149,999 | 0 (0.0%) | 0 (0.0%) |
| $150,000 or more | 0 (0.0%) | 0 (0.0%) |
| Total | 544 (100.0%) | 474 (100.0%) |
Monthly Housing Cost Tiers in Naranjito
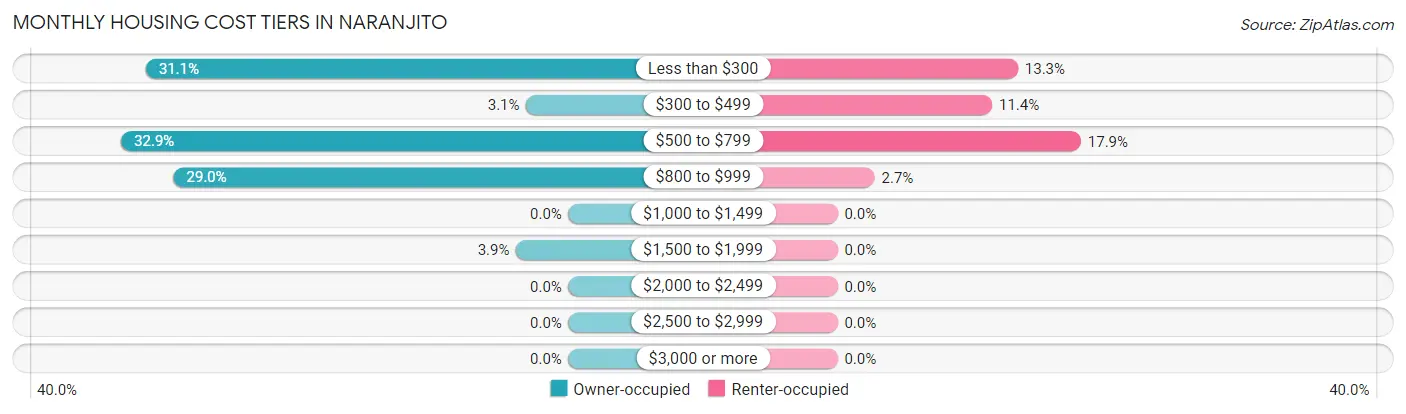
| Monthly Cost | Owner-occupied | Renter-occupied |
| Less than $300 | 169 (31.1%) | 63 (13.3%) |
| $300 to $499 | 17 (3.1%) | 54 (11.4%) |
| $500 to $799 | 179 (32.9%) | 85 (17.9%) |
| $800 to $999 | 158 (29.0%) | 13 (2.7%) |
| $1,000 to $1,499 | 0 (0.0%) | 0 (0.0%) |
| $1,500 to $1,999 | 21 (3.9%) | 0 (0.0%) |
| $2,000 to $2,499 | 0 (0.0%) | 0 (0.0%) |
| $2,500 to $2,999 | 0 (0.0%) | 0 (0.0%) |
| $3,000 or more | 0 (0.0%) | 0 (0.0%) |
| Total | 544 (100.0%) | 474 (100.0%) |
Physical Housing Characteristics in Naranjito
Housing Structures in Naranjito
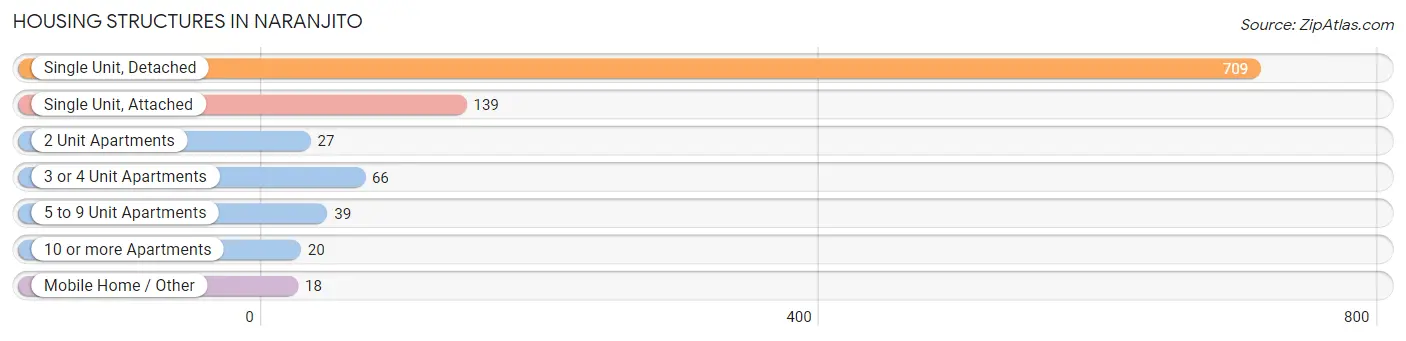
| Structure Type | # Housing Units | % Housing Units |
| Single Unit, Detached | 709 | 69.7% |
| Single Unit, Attached | 139 | 13.7% |
| 2 Unit Apartments | 27 | 2.6% |
| 3 or 4 Unit Apartments | 66 | 6.5% |
| 5 to 9 Unit Apartments | 39 | 3.8% |
| 10 or more Apartments | 20 | 2.0% |
| Mobile Home / Other | 18 | 1.8% |
| Total | 1,018 | 100.0% |
Housing Structures by Occupancy in Naranjito
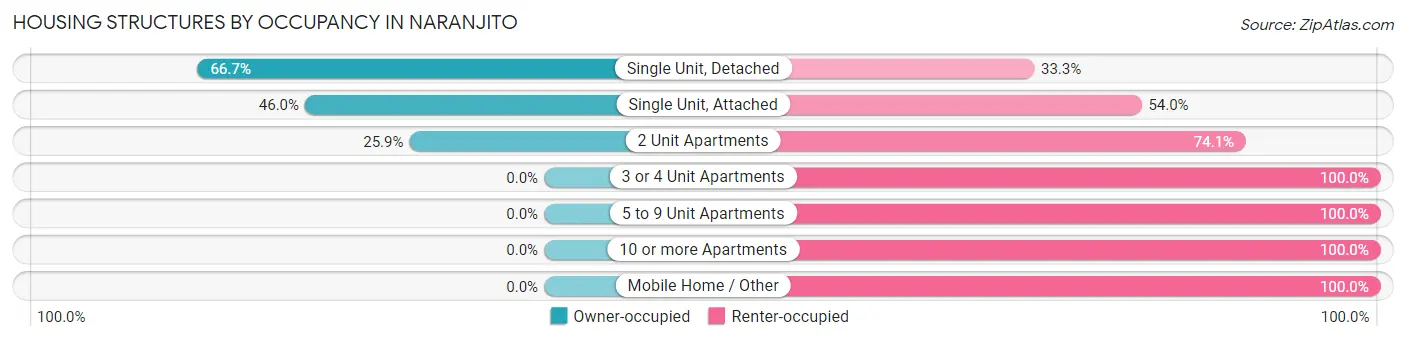
| Structure Type | Owner-occupied | Renter-occupied |
| Single Unit, Detached | 473 (66.7%) | 236 (33.3%) |
| Single Unit, Attached | 64 (46.0%) | 75 (54.0%) |
| 2 Unit Apartments | 7 (25.9%) | 20 (74.1%) |
| 3 or 4 Unit Apartments | 0 (0.0%) | 66 (100.0%) |
| 5 to 9 Unit Apartments | 0 (0.0%) | 39 (100.0%) |
| 10 or more Apartments | 0 (0.0%) | 20 (100.0%) |
| Mobile Home / Other | 0 (0.0%) | 18 (100.0%) |
| Total | 544 (53.4%) | 474 (46.6%) |
Housing Structures by Number of Rooms in Naranjito
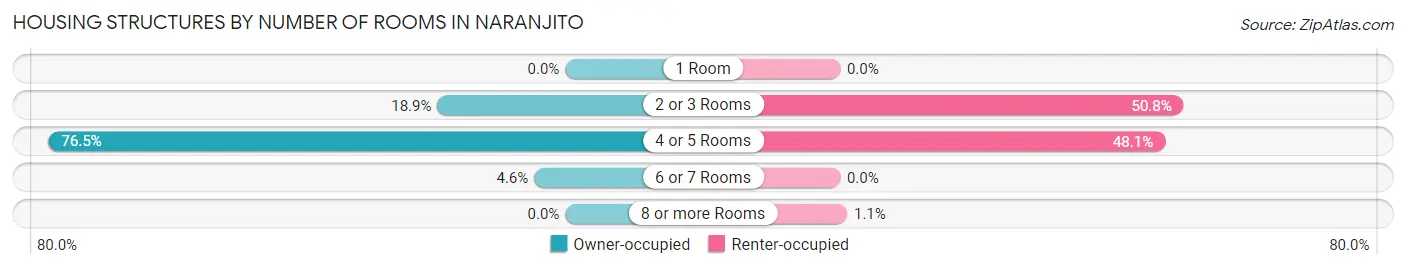
| Number of Rooms | Owner-occupied | Renter-occupied |
| 1 Room | 0 (0.0%) | 0 (0.0%) |
| 2 or 3 Rooms | 103 (18.9%) | 241 (50.8%) |
| 4 or 5 Rooms | 416 (76.5%) | 228 (48.1%) |
| 6 or 7 Rooms | 25 (4.6%) | 0 (0.0%) |
| 8 or more Rooms | 0 (0.0%) | 5 (1.1%) |
| Total | 544 (100.0%) | 474 (100.0%) |
Housing Structure by Heating Type in Naranjito
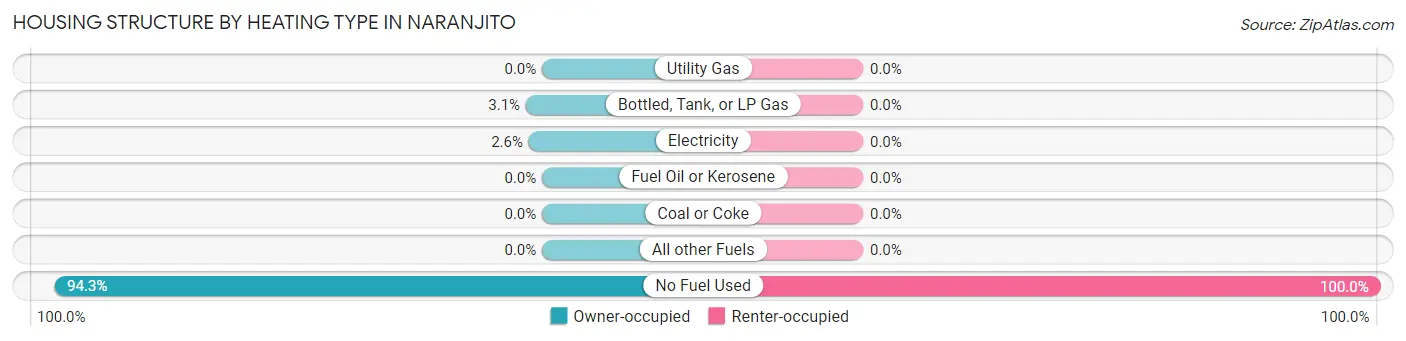
| Heating Type | Owner-occupied | Renter-occupied |
| Utility Gas | 0 (0.0%) | 0 (0.0%) |
| Bottled, Tank, or LP Gas | 17 (3.1%) | 0 (0.0%) |
| Electricity | 14 (2.6%) | 0 (0.0%) |
| Fuel Oil or Kerosene | 0 (0.0%) | 0 (0.0%) |
| Coal or Coke | 0 (0.0%) | 0 (0.0%) |
| All other Fuels | 0 (0.0%) | 0 (0.0%) |
| No Fuel Used | 513 (94.3%) | 474 (100.0%) |
| Total | 544 (100.0%) | 474 (100.0%) |
Household Vehicle Usage in Naranjito
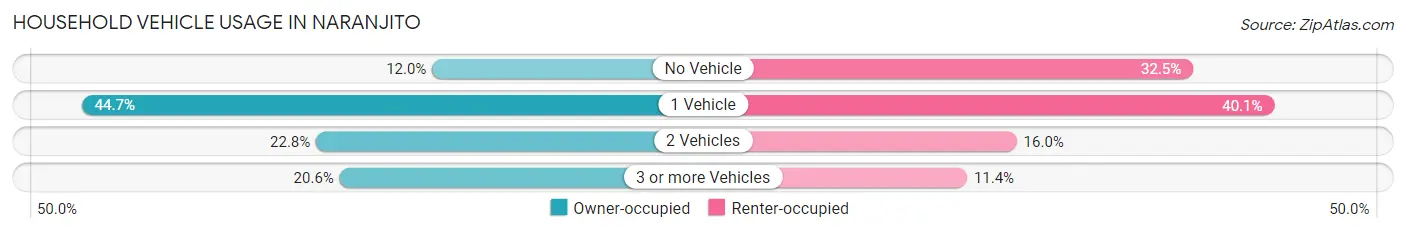
| Vehicles per Household | Owner-occupied | Renter-occupied |
| No Vehicle | 65 (11.9%) | 154 (32.5%) |
| 1 Vehicle | 243 (44.7%) | 190 (40.1%) |
| 2 Vehicles | 124 (22.8%) | 76 (16.0%) |
| 3 or more Vehicles | 112 (20.6%) | 54 (11.4%) |
| Total | 544 (100.0%) | 474 (100.0%) |
Real Estate & Mortgages in Naranjito
Real Estate and Mortgage Overview in Naranjito
| Characteristic | Without Mortgage | With Mortgage |
| Housing Units | 215 | 329 |
| Median Property Value | $94,300 | $124,600 |
| Median Household Income | $27,639 | $0 |
| Monthly Housing Costs | $222 | $0 |
| Real Estate Taxes | - | - |
Property Value by Mortgage Status in Naranjito
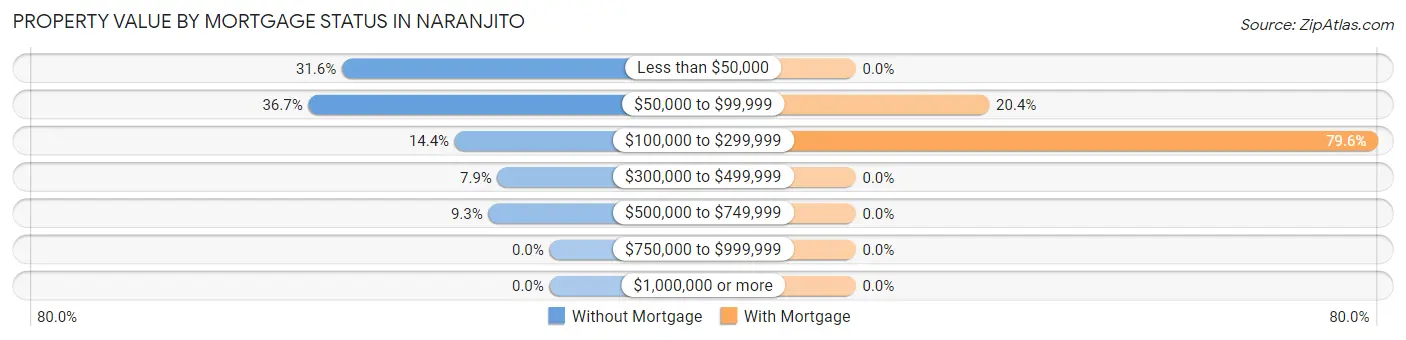
| Property Value | Without Mortgage | With Mortgage |
| Less than $50,000 | 68 (31.6%) | 0 (0.0%) |
| $50,000 to $99,999 | 79 (36.7%) | 67 (20.4%) |
| $100,000 to $299,999 | 31 (14.4%) | 262 (79.6%) |
| $300,000 to $499,999 | 17 (7.9%) | 0 (0.0%) |
| $500,000 to $749,999 | 20 (9.3%) | 0 (0.0%) |
| $750,000 to $999,999 | 0 (0.0%) | 0 (0.0%) |
| $1,000,000 or more | 0 (0.0%) | 0 (0.0%) |
| Total | 215 (100.0%) | 329 (100.0%) |
Household Income by Mortgage Status in Naranjito
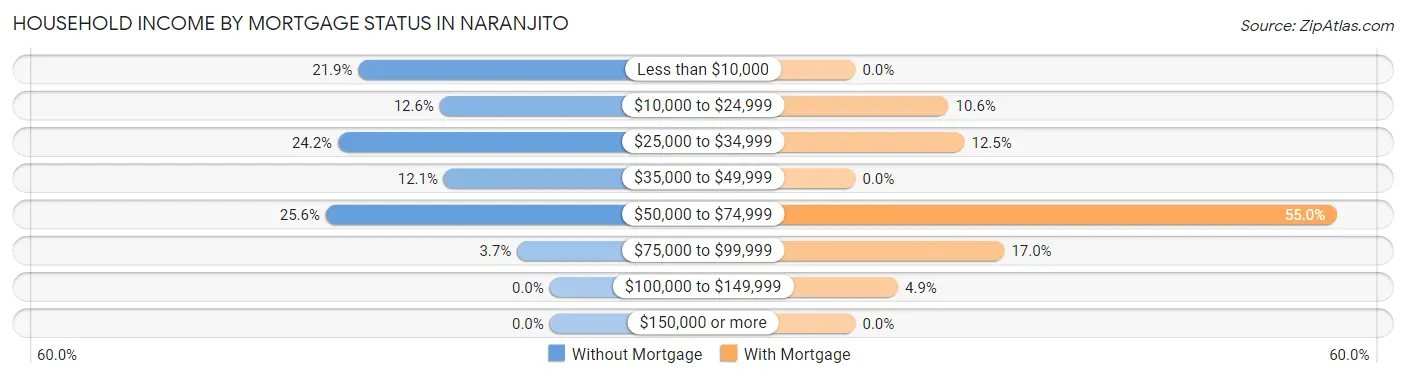
| Household Income | Without Mortgage | With Mortgage |
| Less than $10,000 | 47 (21.9%) | 0 (0.0%) |
| $10,000 to $24,999 | 27 (12.6%) | 35 (10.6%) |
| $25,000 to $34,999 | 52 (24.2%) | 41 (12.5%) |
| $35,000 to $49,999 | 26 (12.1%) | 0 (0.0%) |
| $50,000 to $74,999 | 55 (25.6%) | 181 (55.0%) |
| $75,000 to $99,999 | 8 (3.7%) | 56 (17.0%) |
| $100,000 to $149,999 | 0 (0.0%) | 16 (4.9%) |
| $150,000 or more | 0 (0.0%) | 0 (0.0%) |
| Total | 215 (100.0%) | 329 (100.0%) |
Property Value to Household Income Ratio in Naranjito
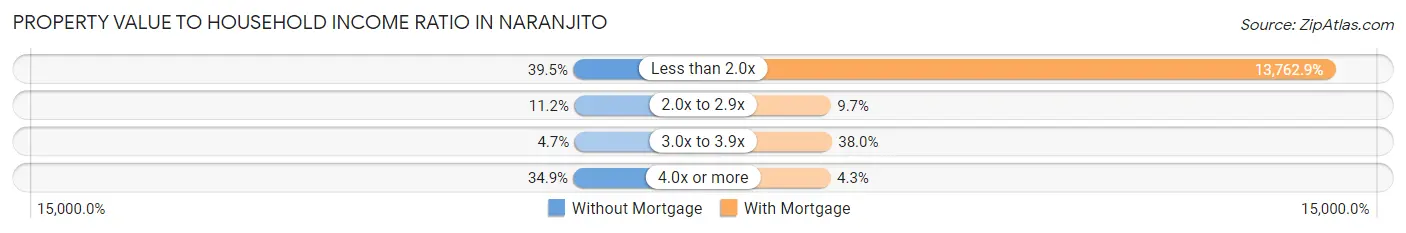
| Value-to-Income Ratio | Without Mortgage | With Mortgage |
| Less than 2.0x | 85 (39.5%) | 45,280 (13,762.9%) |
| 2.0x to 2.9x | 24 (11.2%) | 32 (9.7%) |
| 3.0x to 3.9x | 10 (4.6%) | 125 (38.0%) |
| 4.0x or more | 75 (34.9%) | 14 (4.3%) |
| Total | 215 (100.0%) | 329 (100.0%) |
Real Estate Taxes by Mortgage Status in Naranjito
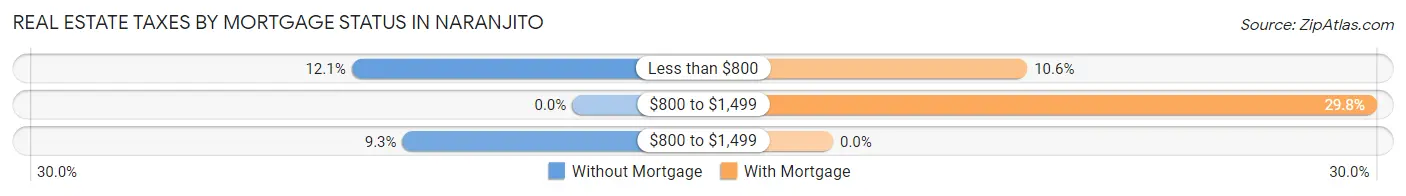
| Property Taxes | Without Mortgage | With Mortgage |
| Less than $800 | 26 (12.1%) | 35 (10.6%) |
| $800 to $1,499 | 0 (0.0%) | 98 (29.8%) |
| $800 to $1,499 | 20 (9.3%) | 0 (0.0%) |
| Total | 215 (100.0%) | 329 (100.0%) |
Health & Disability in Naranjito
Health Insurance Coverage by Age in Naranjito
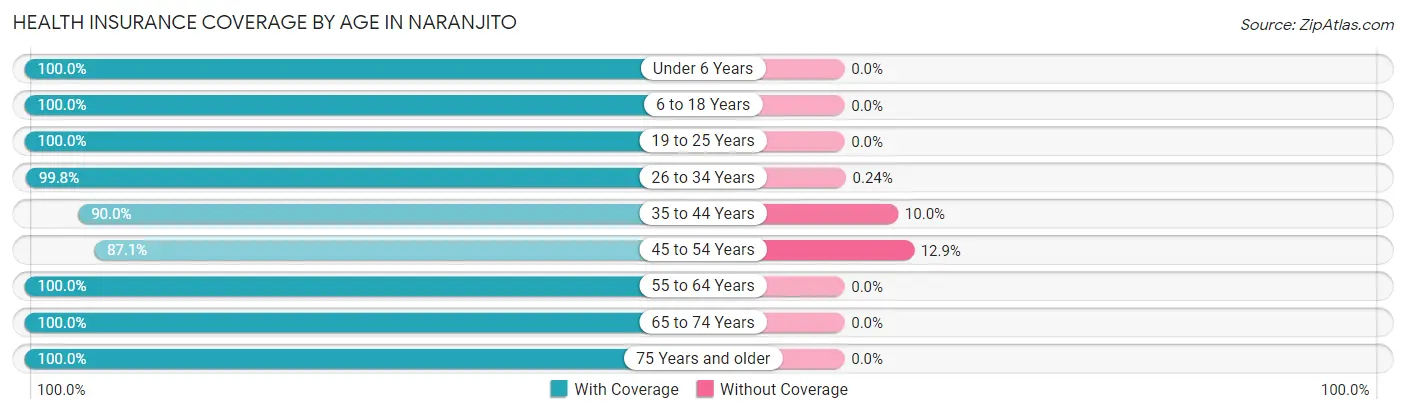
| Age Bracket | With Coverage | Without Coverage |
| Under 6 Years | 134 (100.0%) | 0 (0.0%) |
| 6 to 18 Years | 837 (100.0%) | 0 (0.0%) |
| 19 to 25 Years | 367 (100.0%) | 0 (0.0%) |
| 26 to 34 Years | 414 (99.8%) | 1 (0.2%) |
| 35 to 44 Years | 387 (90.0%) | 43 (10.0%) |
| 45 to 54 Years | 269 (87.1%) | 40 (12.9%) |
| 55 to 64 Years | 324 (100.0%) | 0 (0.0%) |
| 65 to 74 Years | 351 (100.0%) | 0 (0.0%) |
| 75 Years and older | 276 (100.0%) | 0 (0.0%) |
| Total | 3,359 (97.6%) | 84 (2.4%) |
Health Insurance Coverage by Citizenship Status in Naranjito
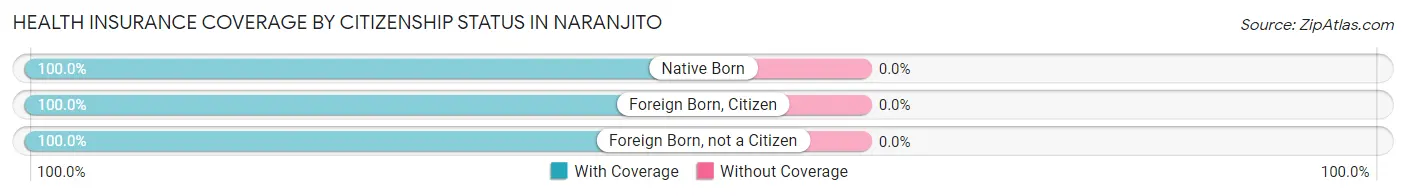
| Citizenship Status | With Coverage | Without Coverage |
| Native Born | 134 (100.0%) | 0 (0.0%) |
| Foreign Born, Citizen | 837 (100.0%) | 0 (0.0%) |
| Foreign Born, not a Citizen | 367 (100.0%) | 0 (0.0%) |
Health Insurance Coverage by Household Income in Naranjito
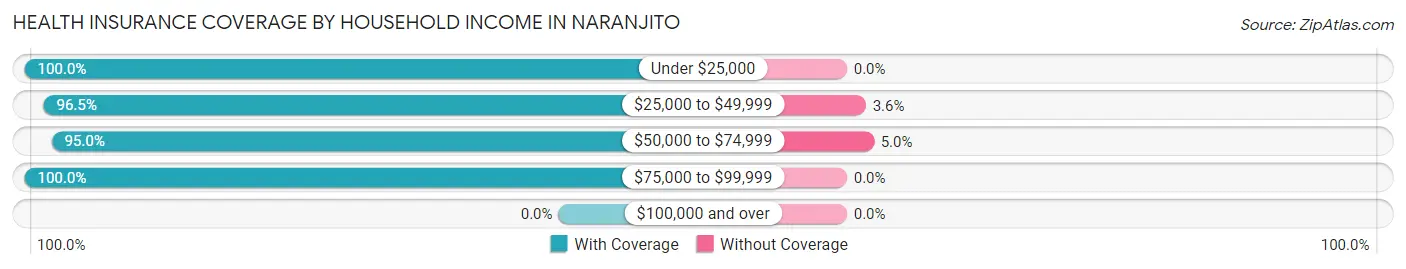
| Household Income | With Coverage | Without Coverage |
| Under $25,000 | 1,379 (100.0%) | 0 (0.0%) |
| $25,000 to $49,999 | 1,167 (96.5%) | 43 (3.5%) |
| $50,000 to $74,999 | 754 (95.0%) | 40 (5.0%) |
| $75,000 to $99,999 | 50 (100.0%) | 0 (0.0%) |
| $100,000 and over | 0 (0.0%) | 0 (0.0%) |
Public vs Private Health Insurance Coverage by Age in Naranjito
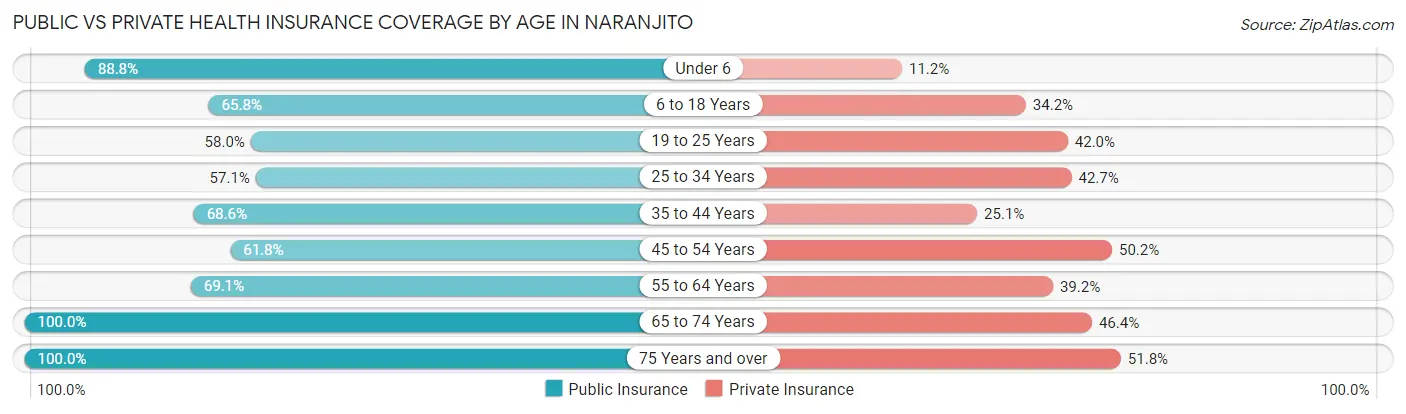
| Age Bracket | Public Insurance | Private Insurance |
| Under 6 | 119 (88.8%) | 15 (11.2%) |
| 6 to 18 Years | 551 (65.8%) | 286 (34.2%) |
| 19 to 25 Years | 213 (58.0%) | 154 (42.0%) |
| 25 to 34 Years | 237 (57.1%) | 177 (42.6%) |
| 35 to 44 Years | 295 (68.6%) | 108 (25.1%) |
| 45 to 54 Years | 191 (61.8%) | 155 (50.2%) |
| 55 to 64 Years | 224 (69.1%) | 127 (39.2%) |
| 65 to 74 Years | 351 (100.0%) | 163 (46.4%) |
| 75 Years and over | 276 (100.0%) | 143 (51.8%) |
| Total | 2,457 (71.4%) | 1,328 (38.6%) |
Disability Status by Sex by Age in Naranjito
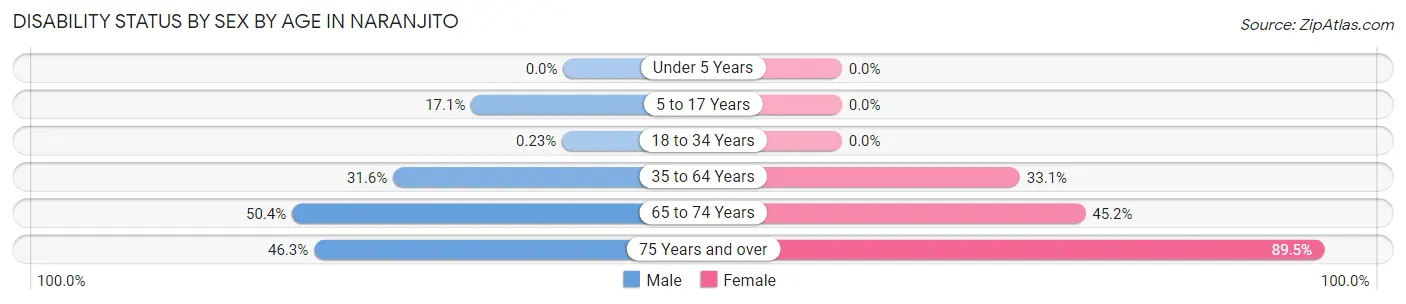
| Age Bracket | Male | Female |
| Under 5 Years | 0 (0.0%) | 0 (0.0%) |
| 5 to 17 Years | 111 (17.1%) | 0 (0.0%) |
| 18 to 34 Years | 1 (0.2%) | 0 (0.0%) |
| 35 to 64 Years | 182 (31.6%) | 161 (33.1%) |
| 65 to 74 Years | 72 (50.3%) | 94 (45.2%) |
| 75 Years and over | 31 (46.3%) | 187 (89.5%) |
Disability Class by Sex by Age in Naranjito
Disability Class: Hearing Difficulty
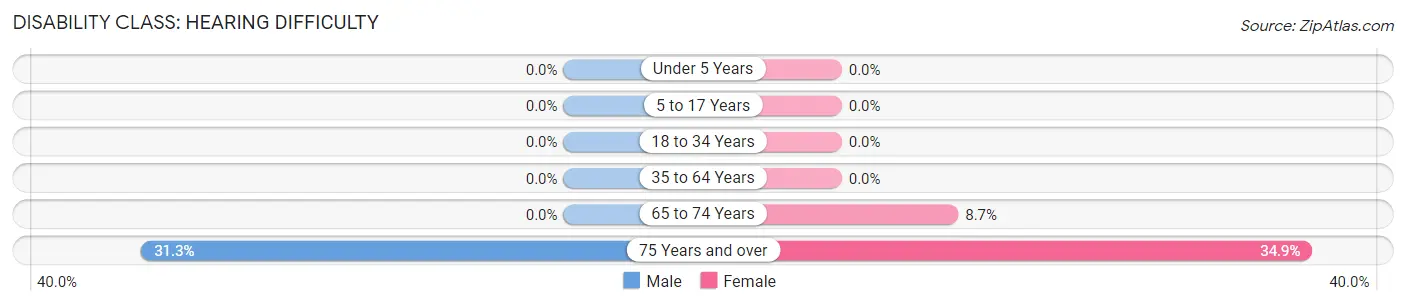
| Age Bracket | Male | Female |
| Under 5 Years | 0 (0.0%) | 0 (0.0%) |
| 5 to 17 Years | 0 (0.0%) | 0 (0.0%) |
| 18 to 34 Years | 0 (0.0%) | 0 (0.0%) |
| 35 to 64 Years | 0 (0.0%) | 0 (0.0%) |
| 65 to 74 Years | 0 (0.0%) | 18 (8.6%) |
| 75 Years and over | 21 (31.3%) | 73 (34.9%) |
Disability Class: Vision Difficulty
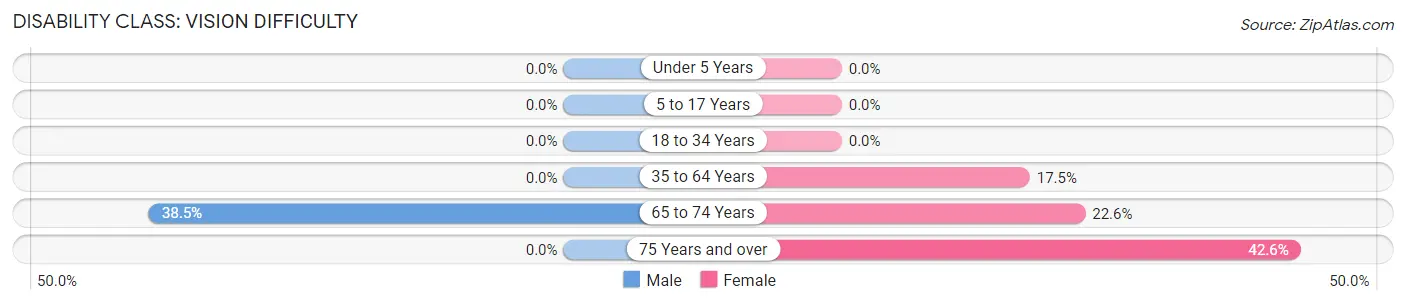
| Age Bracket | Male | Female |
| Under 5 Years | 0 (0.0%) | 0 (0.0%) |
| 5 to 17 Years | 0 (0.0%) | 0 (0.0%) |
| 18 to 34 Years | 0 (0.0%) | 0 (0.0%) |
| 35 to 64 Years | 0 (0.0%) | 85 (17.4%) |
| 65 to 74 Years | 55 (38.5%) | 47 (22.6%) |
| 75 Years and over | 0 (0.0%) | 89 (42.6%) |
Disability Class: Cognitive Difficulty
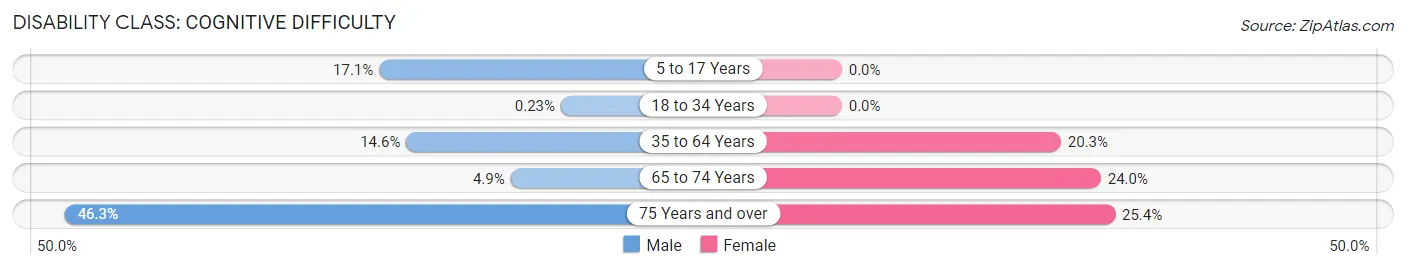
| Age Bracket | Male | Female |
| 5 to 17 Years | 111 (17.1%) | 0 (0.0%) |
| 18 to 34 Years | 1 (0.2%) | 0 (0.0%) |
| 35 to 64 Years | 84 (14.6%) | 99 (20.3%) |
| 65 to 74 Years | 7 (4.9%) | 50 (24.0%) |
| 75 Years and over | 31 (46.3%) | 53 (25.4%) |
Disability Class: Ambulatory Difficulty
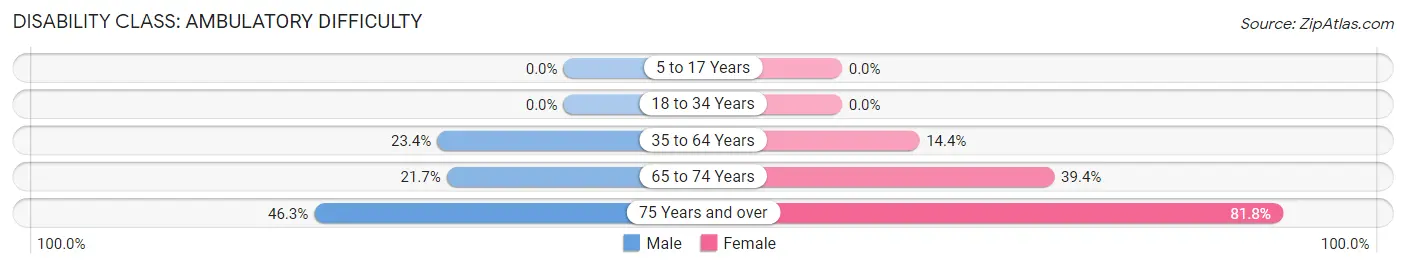
| Age Bracket | Male | Female |
| 5 to 17 Years | 0 (0.0%) | 0 (0.0%) |
| 18 to 34 Years | 0 (0.0%) | 0 (0.0%) |
| 35 to 64 Years | 135 (23.4%) | 70 (14.4%) |
| 65 to 74 Years | 31 (21.7%) | 82 (39.4%) |
| 75 Years and over | 31 (46.3%) | 171 (81.8%) |
Disability Class: Self-Care Difficulty
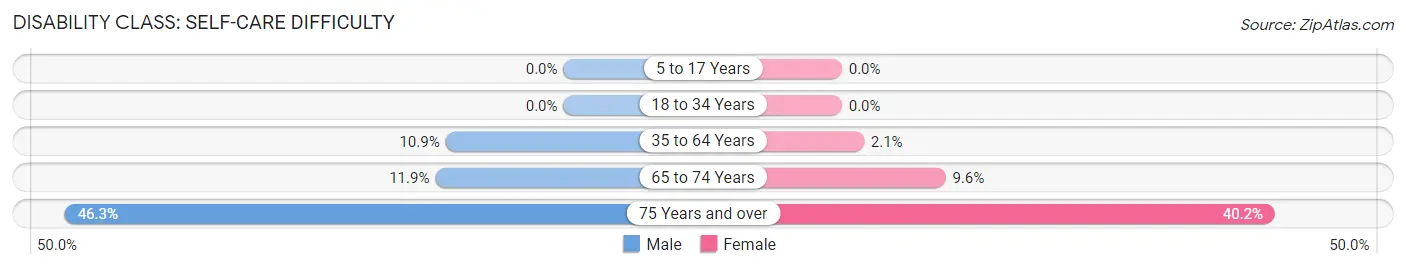
| Age Bracket | Male | Female |
| 5 to 17 Years | 0 (0.0%) | 0 (0.0%) |
| 18 to 34 Years | 0 (0.0%) | 0 (0.0%) |
| 35 to 64 Years | 63 (10.9%) | 10 (2.1%) |
| 65 to 74 Years | 17 (11.9%) | 20 (9.6%) |
| 75 Years and over | 31 (46.3%) | 84 (40.2%) |
Technology Access in Naranjito
Computing Device Access in Naranjito
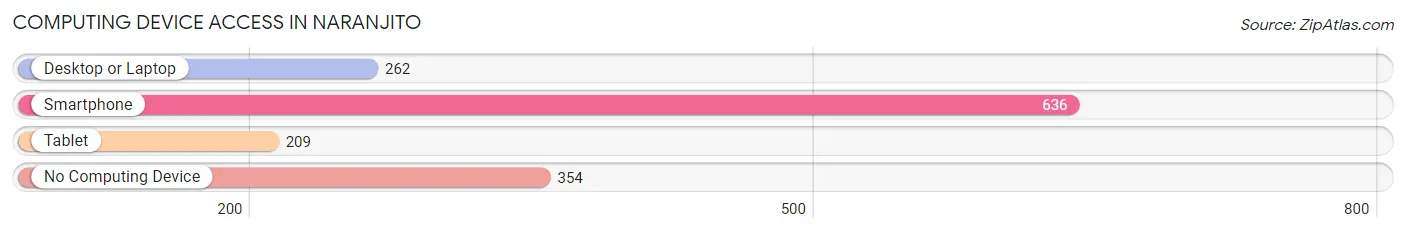
| Device Type | # Households | % Households |
| Desktop or Laptop | 262 | 25.7% |
| Smartphone | 636 | 62.5% |
| Tablet | 209 | 20.5% |
| No Computing Device | 354 | 34.8% |
| Total | 1,018 | 100.0% |
Internet Access in Naranjito
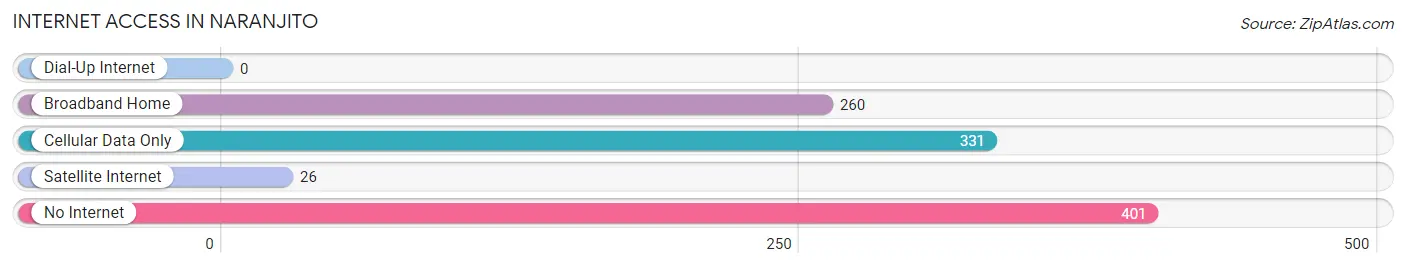
| Internet Type | # Households | % Households |
| Dial-Up Internet | 0 | 0.0% |
| Broadband Home | 260 | 25.5% |
| Cellular Data Only | 331 | 32.5% |
| Satellite Internet | 26 | 2.5% |
| No Internet | 401 | 39.4% |
| Total | 1,018 | 100.0% |
Naranjito Summary
Naranjito is a municipality located in the central region of Puerto Rico. It is part of the San Juan-Caguas-Guaynabo Metropolitan Statistical Area. The town is known for its agricultural production, especially oranges, which gave it its name.
History
Naranjito was founded in 1824 by Don Francisco de los Ríos. It was originally called "Villa de los Ríos" in honor of its founder. The name was changed to Naranjito in 1858, when the town was officially recognized by the government. The name comes from the abundance of orange trees in the area.
Naranjito was an important agricultural center in the 19th century. It was the main producer of oranges in Puerto Rico, and the town was known as the "Orange Capital of Puerto Rico". The town was also known for its production of coffee, tobacco, and other agricultural products.
Geography
Naranjito is located in the central region of Puerto Rico, in the Cordillera Central mountain range. It is bordered by the municipalities of Toa Alta, Bayamón, Comerío, Corozal, and Barranquitas. The town covers an area of 24.7 square miles (63.9 km2).
The terrain of Naranjito is mostly mountainous, with some flat areas in the lower elevations. The highest point in the municipality is Cerro La Punta, which has an elevation of 1,890 feet (576 m). The town is located in the humid subtropical climate zone, with an average annual temperature of 79°F (26°C).
Economy
Naranjito's economy is mainly based on agriculture. The town is known for its production of oranges, coffee, and other agricultural products. It is also home to several manufacturing companies, including a pharmaceutical plant and a plastics factory.
The town also has a growing tourism industry. It is home to several attractions, including the Naranjito Historical Museum, the Naranjito Botanical Garden, and the Naranjito Zoo.
Demographics
As of the 2010 census, Naranjito had a population of 33,845. The population is mostly of Puerto Rican descent, with a small percentage of African and European ancestry. The town has a median household income of $17,845, which is lower than the national average.
The town is predominantly Roman Catholic, with a small percentage of other religious affiliations. Spanish is the primary language spoken in Naranjito, although English is also spoken by some of the population.
Naranjito is a small but vibrant town with a rich history and culture. It is known for its agricultural production and its growing tourism industry. The town is a great place to visit and explore, and it is sure to provide visitors with a unique and memorable experience.
Common Questions
What is Per Capita Income in Naranjito?
Per Capita income in Naranjito is $9,219.
What is the Median Family Income in Naranjito?
Median Family Income in Naranjito is $25,823.
What is the Median Household income in Naranjito?
Median Household Income in Naranjito is $24,044.
What is Income or Wage Gap in Naranjito?
Income or Wage Gap in Naranjito is 2.5%.
Women in Naranjito earn 97.5 cents for every dollar earned by a man.
What is Inequality or Gini Index in Naranjito?
Inequality or Gini Index in Naranjito is 0.48.
What is the Total Population of Naranjito?
Total Population of Naranjito is 3,443.
What is the Total Male Population of Naranjito?
Total Male Population of Naranjito is 1,909.
What is the Total Female Population of Naranjito?
Total Female Population of Naranjito is 1,534.
What is the Ratio of Males per 100 Females in Naranjito?
There are 124.45 Males per 100 Females in Naranjito.
What is the Ratio of Females per 100 Males in Naranjito?
There are 80.36 Females per 100 Males in Naranjito.
What is the Median Population Age in Naranjito?
Median Population Age in Naranjito is 34.4 Years.
What is the Average Family Size in Naranjito
Average Family Size in Naranjito is 4.2 People.
What is the Average Household Size in Naranjito
Average Household Size in Naranjito is 3.4 People.
How Large is the Labor Force in Naranjito?
There are 1,245 People in the Labor Forcein in Naranjito.
What is the Percentage of People in the Labor Force in Naranjito?
48.0% of People are in the Labor Force in Naranjito.
What is the Unemployment Rate in Naranjito?
Unemployment Rate in Naranjito is 32.5%.