Mayaguez, PR Map & Demographics
Mayaguez Overview
$13,853
PER CAPITA INCOME
$23,489
AVG FAMILY INCOME
$16,191
AVG HOUSEHOLD INCOME
5.0%
WAGE / INCOME GAP [ % ]
95.0¢/ $1
WAGE / INCOME GAP [ $ ]
$12,552
FAMILY INCOME DEFICIT
0.64
INEQUALITY / GINI INDEX
60,062
TOTAL POPULATION
28,625
MALE POPULATION
31,437
FEMALE POPULATION
91.06
MALES / 100 FEMALES
109.82
FEMALES / 100 MALES
40.9
MEDIAN AGE
3.2
AVG FAMILY SIZE
2.4
AVG HOUSEHOLD SIZE
21,372
LABOR FORCE [ PEOPLE ]
41.1%
PERCENT IN LABOR FORCE
24.5%
UNEMPLOYMENT RATE
Income in Mayaguez
Income Overview in Mayaguez
Per Capita Income in Mayaguez is $13,853, while median incomes of families and households are $23,489 and $16,191 respectively.
| Characteristic | Number | Measure |
| Per Capita Income | 60,062 | $13,853 |
| Median Family Income | 13,157 | $23,489 |
| Mean Family Income | 13,157 | $43,253 |
| Median Household Income | 24,272 | $16,191 |
| Mean Household Income | 24,272 | $31,788 |
| Income Deficit | 13,157 | $12,552 |
| Wage / Income Gap (%) | 60,062 | 4.96% |
| Wage / Income Gap ($) | 60,062 | 95.04¢ per $1 |
| Gini / Inequality Index | 60,062 | 0.64 |
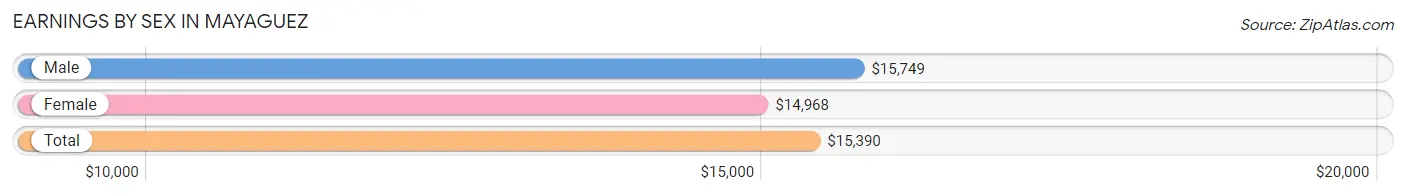
Earnings by Sex in Mayaguez
Average Earnings in Mayaguez are $15,390, $15,749 for men and $14,968 for women, a difference of 5.0%.
| Sex | Number | Average Earnings |
| Male | 10,290 (54.0%) | $15,749 |
| Female | 8,775 (46.0%) | $14,968 |
| Total | 19,065 (100.0%) | $15,390 |
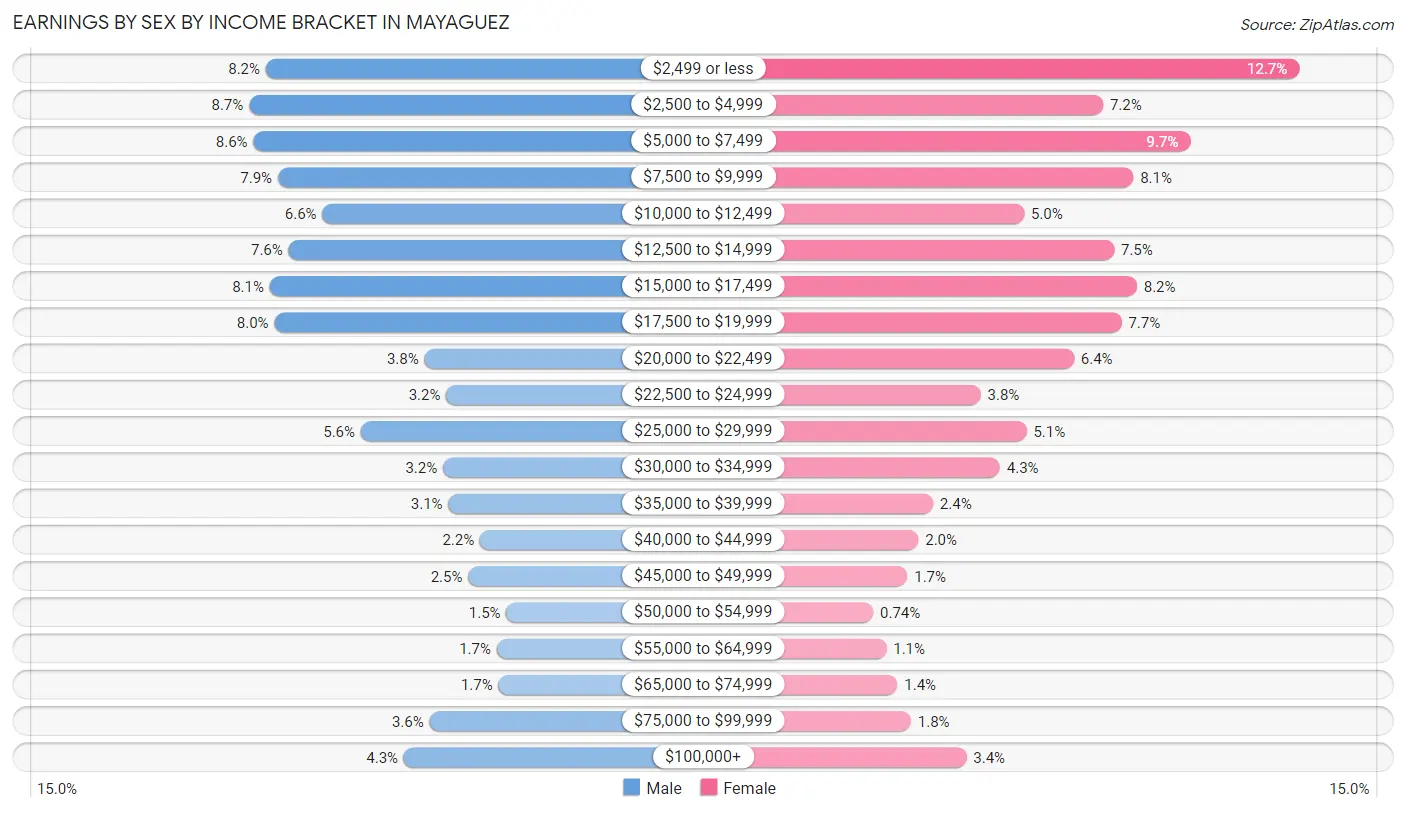
Earnings by Sex by Income Bracket in Mayaguez
The most common earnings brackets in Mayaguez are $2,500 to $4,999 for men (894 | 8.7%) and $2,499 or less for women (1,115 | 12.7%).
| Income | Male | Female |
| $2,499 or less | 846 (8.2%) | 1,115 (12.7%) |
| $2,500 to $4,999 | 894 (8.7%) | 632 (7.2%) |
| $5,000 to $7,499 | 882 (8.6%) | 847 (9.7%) |
| $7,500 to $9,999 | 811 (7.9%) | 706 (8.1%) |
| $10,000 to $12,499 | 682 (6.6%) | 437 (5.0%) |
| $12,500 to $14,999 | 780 (7.6%) | 659 (7.5%) |
| $15,000 to $17,499 | 835 (8.1%) | 715 (8.2%) |
| $17,500 to $19,999 | 821 (8.0%) | 677 (7.7%) |
| $20,000 to $22,499 | 387 (3.8%) | 560 (6.4%) |
| $22,500 to $24,999 | 324 (3.2%) | 330 (3.8%) |
| $25,000 to $29,999 | 571 (5.6%) | 443 (5.1%) |
| $30,000 to $34,999 | 333 (3.2%) | 377 (4.3%) |
| $35,000 to $39,999 | 318 (3.1%) | 212 (2.4%) |
| $40,000 to $44,999 | 226 (2.2%) | 176 (2.0%) |
| $45,000 to $49,999 | 260 (2.5%) | 149 (1.7%) |
| $50,000 to $54,999 | 150 (1.5%) | 65 (0.7%) |
| $55,000 to $64,999 | 178 (1.7%) | 97 (1.1%) |
| $65,000 to $74,999 | 173 (1.7%) | 125 (1.4%) |
| $75,000 to $99,999 | 372 (3.6%) | 158 (1.8%) |
| $100,000+ | 447 (4.3%) | 295 (3.4%) |
| Total | 10,290 (100.0%) | 8,775 (100.0%) |
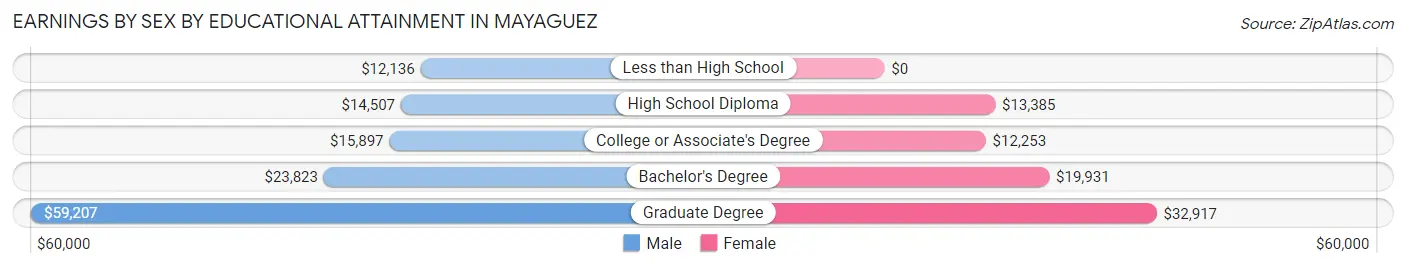
Earnings by Sex by Educational Attainment in Mayaguez
Average earnings in Mayaguez are $17,937 for men and $17,054 for women, a difference of 4.9%. Men with an educational attainment of graduate degree enjoy the highest average annual earnings of $59,207, while those with less than high school education earn the least with $12,136. Women with an educational attainment of graduate degree earn the most with the average annual earnings of $32,917, while those with college or associate's degree education have the smallest earnings of $12,253.
| Educational Attainment | Male Income | Female Income |
| Less than High School | $12,136 | $0 |
| High School Diploma | $14,507 | $13,385 |
| College or Associate's Degree | $15,897 | $12,253 |
| Bachelor's Degree | $23,823 | $19,931 |
| Graduate Degree | $59,207 | $32,917 |
| Total | $17,937 | $17,054 |
Family Income in Mayaguez
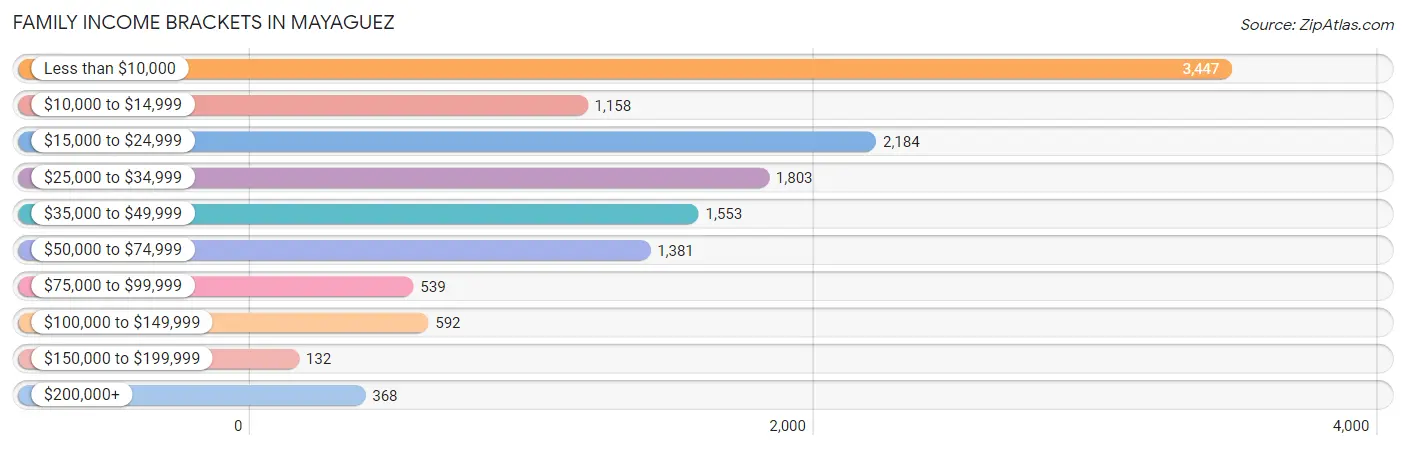
Family Income Brackets in Mayaguez
According to the Mayaguez family income data, there are 3,447 families falling into the less than $10,000 income range, which is the most common income bracket and makes up 26.2% of all families. Conversely, the $150,000 to $199,999 income bracket is the least frequent group with only 132 families (1.0%) belonging to this category.
| Income Bracket | # Families | % Families |
| Less than $10,000 | 3,447 | 26.2% |
| $10,000 to $14,999 | 1,158 | 8.8% |
| $15,000 to $24,999 | 2,184 | 16.6% |
| $25,000 to $34,999 | 1,803 | 13.7% |
| $35,000 to $49,999 | 1,553 | 11.8% |
| $50,000 to $74,999 | 1,381 | 10.5% |
| $75,000 to $99,999 | 539 | 4.1% |
| $100,000 to $149,999 | 592 | 4.5% |
| $150,000 to $199,999 | 132 | 1.0% |
| $200,000+ | 368 | 2.8% |
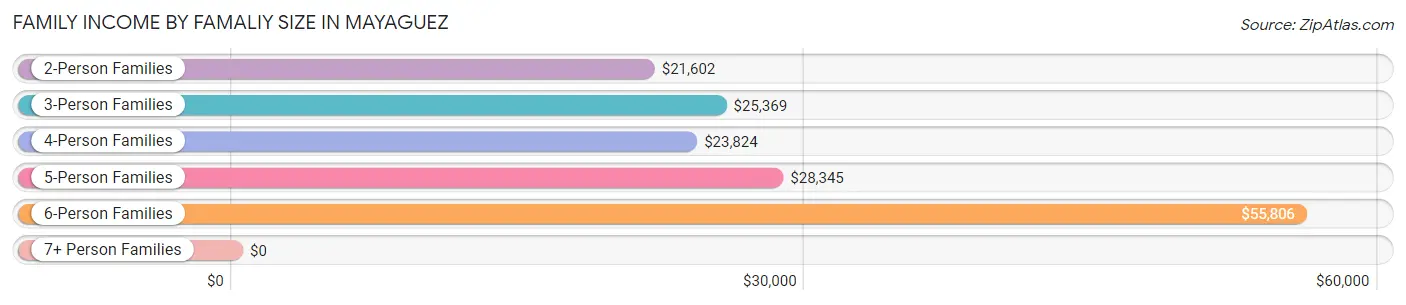
Family Income by Famaliy Size in Mayaguez
6-person families (208 | 1.6%) account for the highest median family income in Mayaguez with $55,806 per family, while 2-person families (6,804 | 51.7%) have the highest median income of $10,801 per family member.
| Income Bracket | # Families | Median Income |
| 2-Person Families | 6,804 (51.7%) | $21,602 |
| 3-Person Families | 3,454 (26.3%) | $25,369 |
| 4-Person Families | 2,078 (15.8%) | $23,824 |
| 5-Person Families | 595 (4.5%) | $28,345 |
| 6-Person Families | 208 (1.6%) | $55,806 |
| 7+ Person Families | 18 (0.1%) | $0 |
| Total | 13,157 (100.0%) | $23,489 |
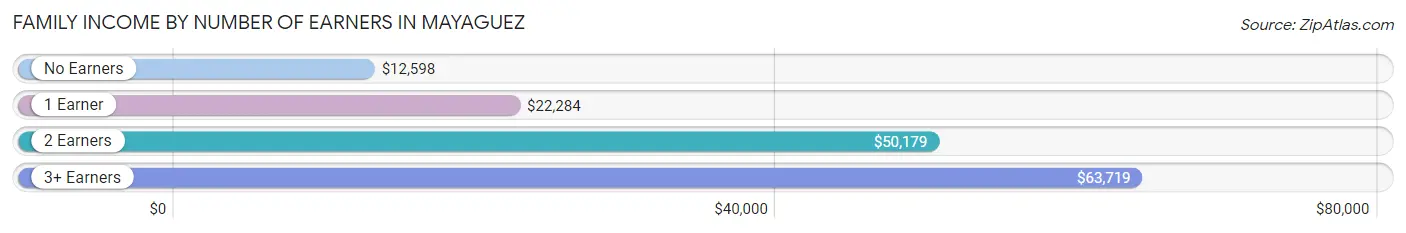
Family Income by Number of Earners in Mayaguez
The median family income in Mayaguez is $23,489, with families comprising 3+ earners (481) having the highest median family income of $63,719, while families with no earners (5,228) have the lowest median family income of $12,598, accounting for 3.7% and 39.7% of families, respectively.
| Number of Earners | # Families | Median Income |
| No Earners | 5,228 (39.7%) | $12,598 |
| 1 Earner | 4,826 (36.7%) | $22,284 |
| 2 Earners | 2,622 (19.9%) | $50,179 |
| 3+ Earners | 481 (3.7%) | $63,719 |
| Total | 13,157 (100.0%) | $23,489 |
Household Income in Mayaguez
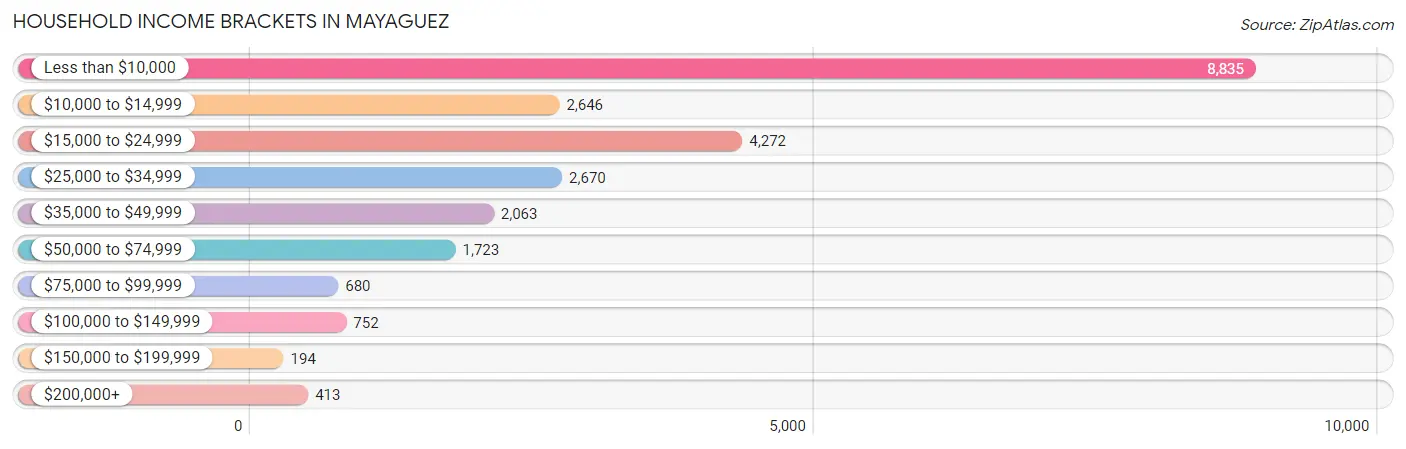
Household Income Brackets in Mayaguez
With 8,835 households falling in the category, the less than $10,000 income range is the most frequent in Mayaguez, accounting for 36.4% of all households. In contrast, only 194 households (0.8%) fall into the $150,000 to $199,999 income bracket, making it the least populous group.
| Income Bracket | # Households | % Households |
| Less than $10,000 | 8,835 | 36.4% |
| $10,000 to $14,999 | 2,646 | 10.9% |
| $15,000 to $24,999 | 4,272 | 17.6% |
| $25,000 to $34,999 | 2,670 | 11.0% |
| $35,000 to $49,999 | 2,063 | 8.5% |
| $50,000 to $74,999 | 1,723 | 7.1% |
| $75,000 to $99,999 | 680 | 2.8% |
| $100,000 to $149,999 | 752 | 3.1% |
| $150,000 to $199,999 | 194 | 0.8% |
| $200,000+ | 413 | 1.7% |
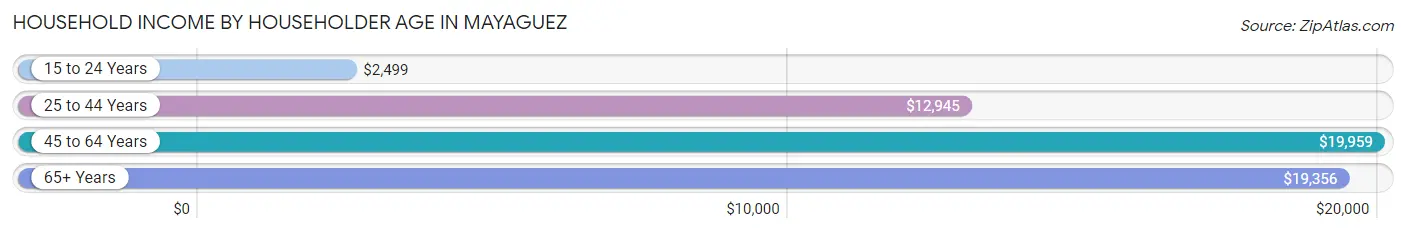
Household Income by Householder Age in Mayaguez
The median household income in Mayaguez is $16,191, with the highest median household income of $19,959 found in the 45 to 64 years age bracket for the primary householder. A total of 7,009 households (28.9%) fall into this category. Meanwhile, the 15 to 24 years age bracket for the primary householder has the lowest median household income of $2,499, with 2,579 households (10.6%) in this group.
| Income Bracket | # Households | Median Income |
| 15 to 24 Years | 2,579 (10.6%) | $2,499 |
| 25 to 44 Years | 5,523 (22.8%) | $12,945 |
| 45 to 64 Years | 7,009 (28.9%) | $19,959 |
| 65+ Years | 9,161 (37.7%) | $19,356 |
| Total | 24,272 (100.0%) | $16,191 |
Poverty in Mayaguez
Income Below Poverty by Sex and Age in Mayaguez
With 53.3% poverty level for males and 55.4% for females among the residents of Mayaguez, 5 year old males and under 5 year old females are the most vulnerable to poverty, with 290 males (100.0%) and 819 females (83.8%) in their respective age groups living below the poverty level.
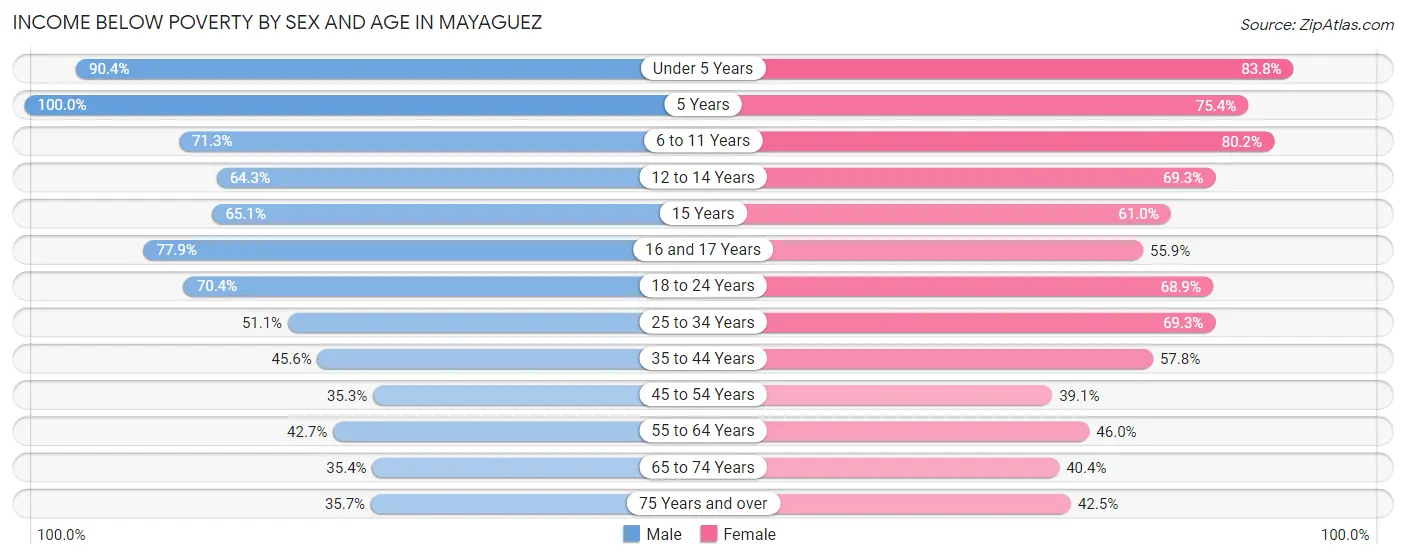
| Age Bracket | Male | Female |
| Under 5 Years | 1,039 (90.4%) | 819 (83.8%) |
| 5 Years | 290 (100.0%) | 190 (75.4%) |
| 6 to 11 Years | 1,174 (71.3%) | 1,331 (80.2%) |
| 12 to 14 Years | 469 (64.3%) | 598 (69.3%) |
| 15 Years | 183 (65.1%) | 119 (61.0%) |
| 16 and 17 Years | 667 (77.9%) | 440 (55.9%) |
| 18 to 24 Years | 3,794 (70.4%) | 3,255 (68.9%) |
| 25 to 34 Years | 1,844 (51.1%) | 2,194 (69.3%) |
| 35 to 44 Years | 1,201 (45.6%) | 1,790 (57.8%) |
| 45 to 54 Years | 942 (35.3%) | 1,203 (39.1%) |
| 55 to 64 Years | 1,360 (42.7%) | 1,815 (46.0%) |
| 65 to 74 Years | 1,090 (35.4%) | 1,493 (40.4%) |
| 75 Years and over | 951 (35.7%) | 1,917 (42.5%) |
| Total | 15,004 (53.3%) | 17,164 (55.4%) |
Income Above Poverty by Sex and Age in Mayaguez
According to the poverty statistics in Mayaguez, males aged 45 to 54 years and females aged 45 to 54 years are the age groups that are most secure financially, with 64.7% of males and 60.9% of females in these age groups living above the poverty line.
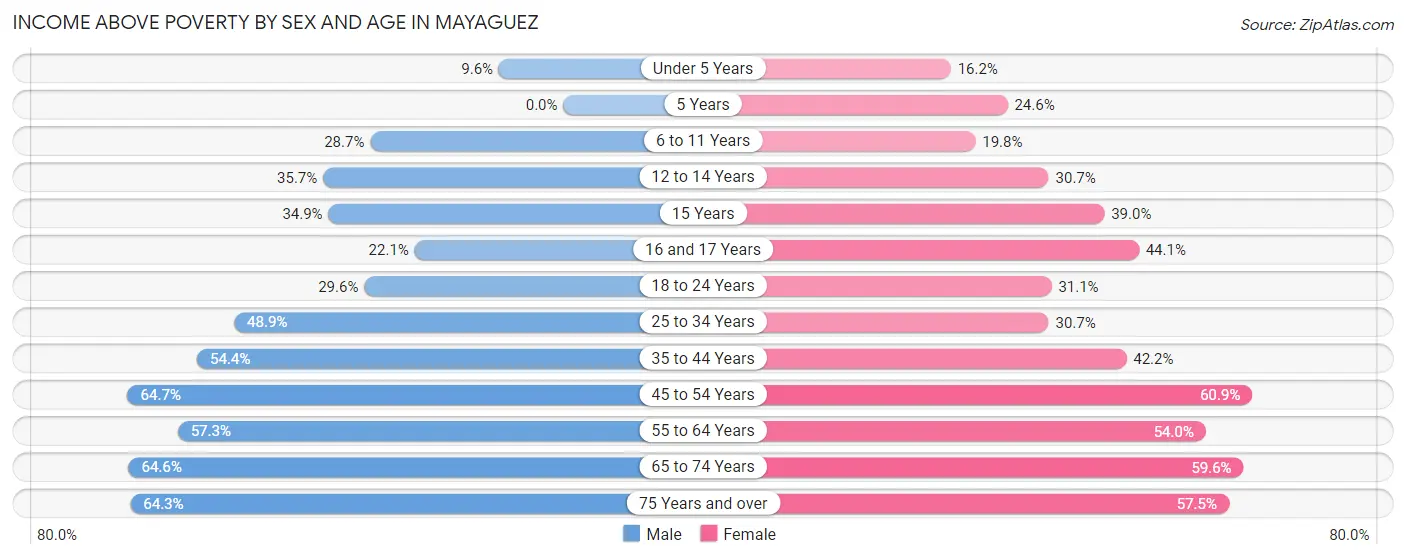
| Age Bracket | Male | Female |
| Under 5 Years | 110 (9.6%) | 158 (16.2%) |
| 5 Years | 0 (0.0%) | 62 (24.6%) |
| 6 to 11 Years | 472 (28.7%) | 329 (19.8%) |
| 12 to 14 Years | 260 (35.7%) | 265 (30.7%) |
| 15 Years | 98 (34.9%) | 76 (39.0%) |
| 16 and 17 Years | 189 (22.1%) | 347 (44.1%) |
| 18 to 24 Years | 1,593 (29.6%) | 1,471 (31.1%) |
| 25 to 34 Years | 1,763 (48.9%) | 972 (30.7%) |
| 35 to 44 Years | 1,432 (54.4%) | 1,309 (42.2%) |
| 45 to 54 Years | 1,726 (64.7%) | 1,877 (60.9%) |
| 55 to 64 Years | 1,822 (57.3%) | 2,134 (54.0%) |
| 65 to 74 Years | 1,986 (64.6%) | 2,206 (59.6%) |
| 75 Years and over | 1,712 (64.3%) | 2,589 (57.5%) |
| Total | 13,163 (46.7%) | 13,795 (44.6%) |
Income Below Poverty Among Married-Couple Families in Mayaguez
The poverty statistics for married-couple families in Mayaguez show that 28.9% or 1,900 of the total 6,566 families live below the poverty line. Families with 3 or 4 children have the highest poverty rate of 51.4%, comprising of 37 families. On the other hand, families with no children have the lowest poverty rate of 25.9%, which includes 1,283 families.
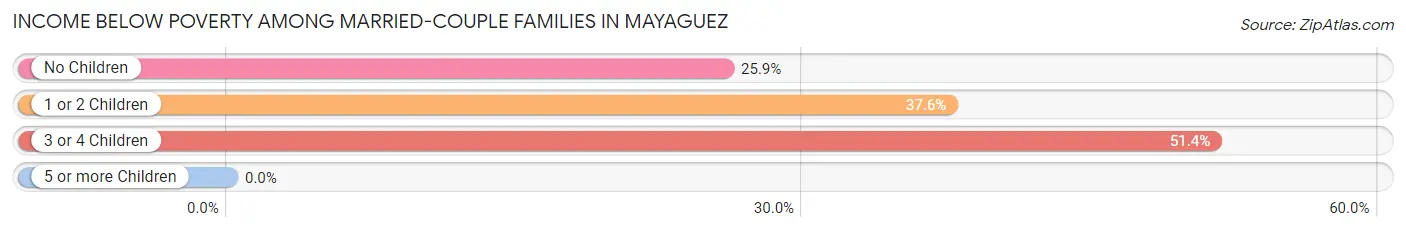
| Children | Above Poverty | Below Poverty |
| No Children | 3,669 (74.1%) | 1,283 (25.9%) |
| 1 or 2 Children | 962 (62.4%) | 580 (37.6%) |
| 3 or 4 Children | 35 (48.6%) | 37 (51.4%) |
| 5 or more Children | 0 (0.0%) | 0 (0.0%) |
| Total | 4,666 (71.1%) | 1,900 (28.9%) |
Income Below Poverty Among Single-Parent Households in Mayaguez
According to the poverty data in Mayaguez, 56.1% or 673 single-father households and 69.4% or 3,741 single-mother households are living below the poverty line. Among single-father households, those with 1 or 2 children have the highest poverty rate, with 297 households (80.0%) experiencing poverty. Likewise, among single-mother households, those with 3 or 4 children have the highest poverty rate, with 743 households (98.3%) falling below the poverty line.
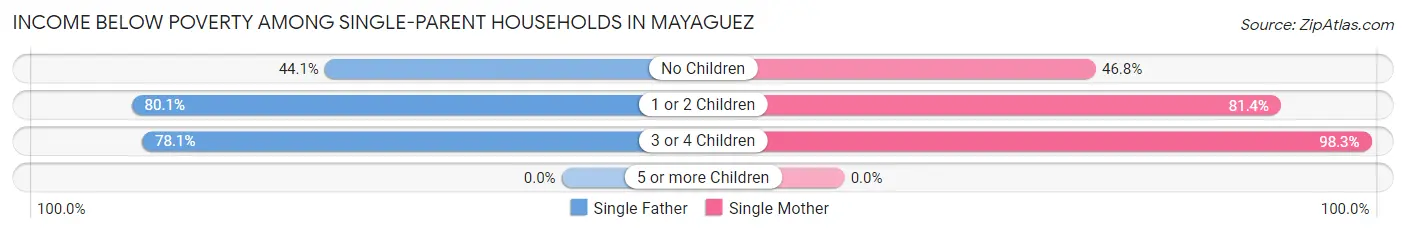
| Children | Single Father | Single Mother |
| No Children | 351 (44.1%) | 1,051 (46.8%) |
| 1 or 2 Children | 297 (80.0%) | 1,947 (81.4%) |
| 3 or 4 Children | 25 (78.1%) | 743 (98.3%) |
| 5 or more Children | 0 (0.0%) | 0 (0.0%) |
| Total | 673 (56.1%) | 3,741 (69.4%) |
Income Below Poverty Among Married-Couple vs Single-Parent Households in Mayaguez
The poverty data for Mayaguez shows that 1,900 of the married-couple family households (28.9%) and 4,414 of the single-parent households (67.0%) are living below the poverty level. Within the married-couple family households, those with 3 or 4 children have the highest poverty rate, with 37 households (51.4%) falling below the poverty line. Among the single-parent households, those with 3 or 4 children have the highest poverty rate, with 768 household (97.5%) living below poverty.
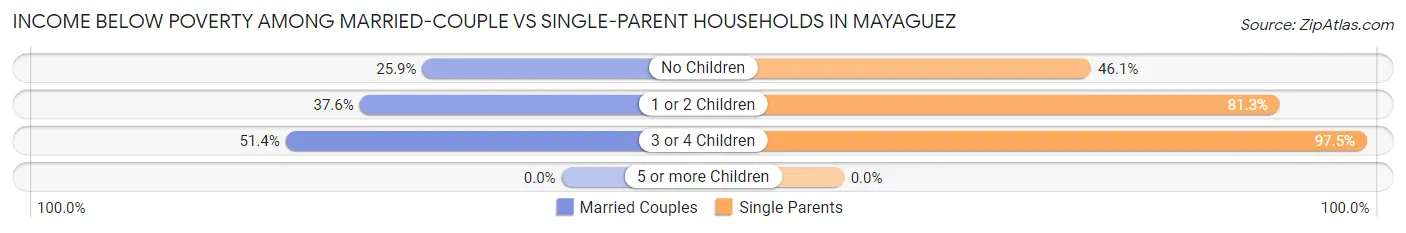
| Children | Married-Couple Families | Single-Parent Households |
| No Children | 1,283 (25.9%) | 1,402 (46.1%) |
| 1 or 2 Children | 580 (37.6%) | 2,244 (81.2%) |
| 3 or 4 Children | 37 (51.4%) | 768 (97.5%) |
| 5 or more Children | 0 (0.0%) | 0 (0.0%) |
| Total | 1,900 (28.9%) | 4,414 (67.0%) |
Race in Mayaguez
The most populous races in Mayaguez are Hispanic or Latino (59,511 | 99.1%), Some other Race (43,564 | 72.5%), and White / Caucasian (10,433 | 17.4%).
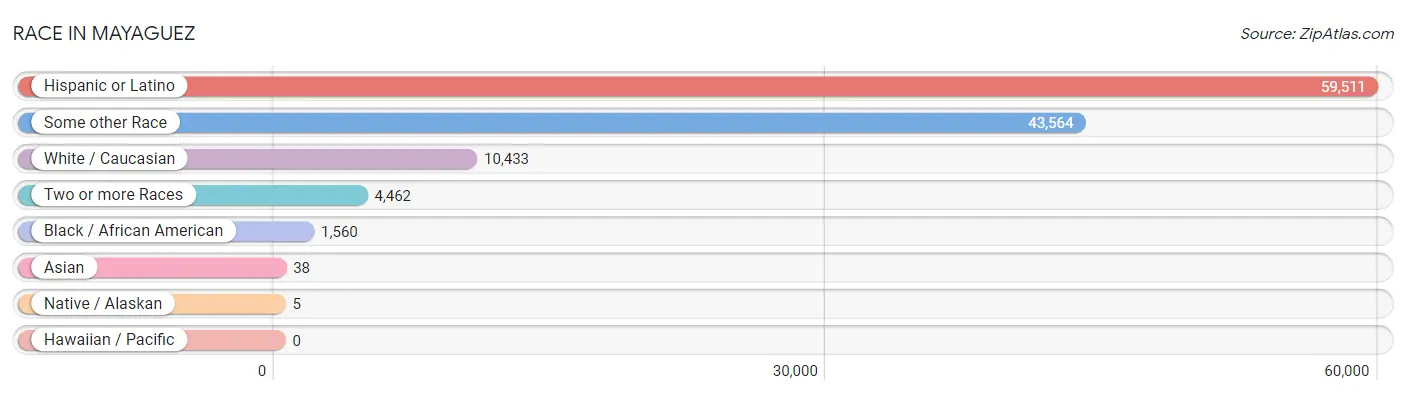
| Race | # Population | % Population |
| Asian | 38 | 0.1% |
| Black / African American | 1,560 | 2.6% |
| Hawaiian / Pacific | 0 | 0.0% |
| Hispanic or Latino | 59,511 | 99.1% |
| Native / Alaskan | 5 | 0.0% |
| White / Caucasian | 10,433 | 17.4% |
| Two or more Races | 4,462 | 7.4% |
| Some other Race | 43,564 | 72.5% |
| Total | 60,062 | 100.0% |
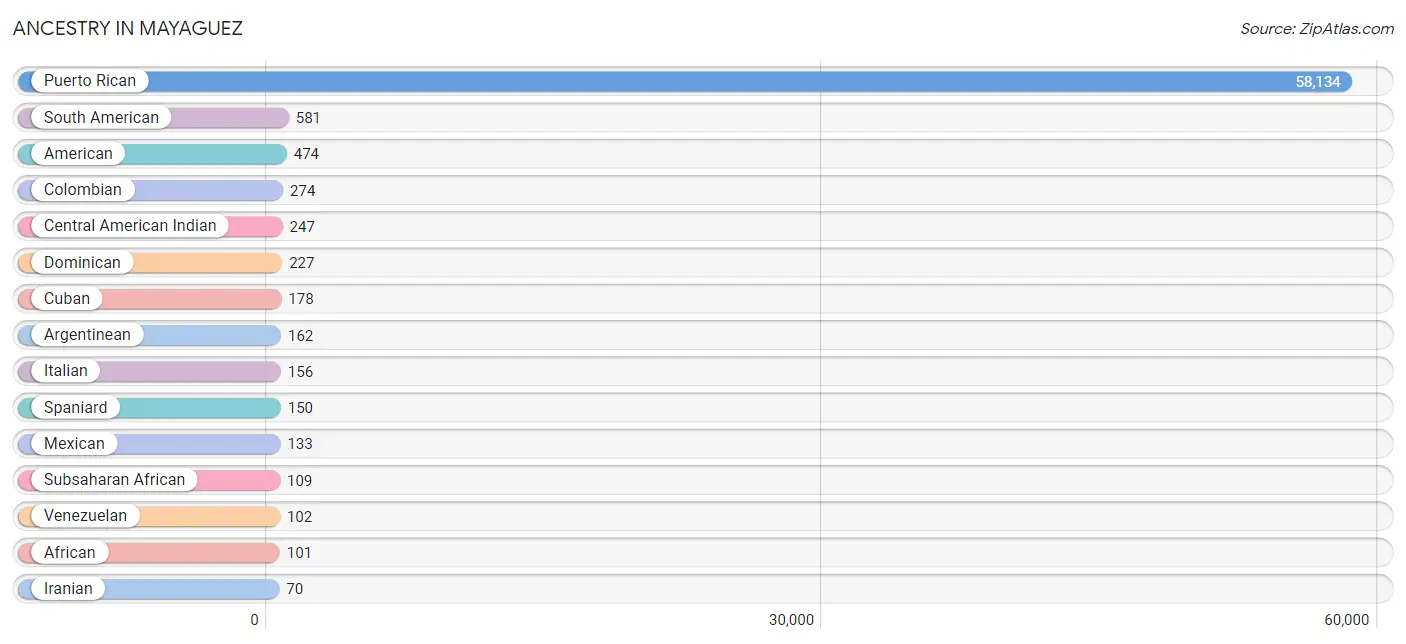
Ancestry in Mayaguez
The most populous ancestries reported in Mayaguez are Puerto Rican (58,134 | 96.8%), South American (581 | 1.0%), American (474 | 0.8%), Colombian (274 | 0.5%), and Central American Indian (247 | 0.4%), together accounting for 99.4% of all Mayaguez residents.
| Ancestry | # Population | % Population |
| African | 101 | 0.2% |
| American | 474 | 0.8% |
| Arab | 23 | 0.0% |
| Argentinean | 162 | 0.3% |
| Basque | 9 | 0.0% |
| British | 33 | 0.1% |
| Burmese | 21 | 0.0% |
| Central American | 35 | 0.1% |
| Central American Indian | 247 | 0.4% |
| Colombian | 274 | 0.5% |
| Costa Rican | 9 | 0.0% |
| Croatian | 9 | 0.0% |
| Cuban | 178 | 0.3% |
| Dominican | 227 | 0.4% |
| English | 8 | 0.0% |
| French | 13 | 0.0% |
| German | 17 | 0.0% |
| Guyanese | 12 | 0.0% |
| Haitian | 32 | 0.1% |
| Indian (Asian) | 10 | 0.0% |
| Iranian | 70 | 0.1% |
| Irish | 29 | 0.1% |
| Israeli | 8 | 0.0% |
| Italian | 156 | 0.3% |
| Lebanese | 5 | 0.0% |
| Mexican | 133 | 0.2% |
| Native Hawaiian | 10 | 0.0% |
| Nigerian | 8 | 0.0% |
| Paraguayan | 16 | 0.0% |
| Peruvian | 27 | 0.0% |
| Portuguese | 7 | 0.0% |
| Puerto Rican | 58,134 | 96.8% |
| Salvadoran | 26 | 0.0% |
| South American | 581 | 1.0% |
| Spaniard | 150 | 0.3% |
| Subsaharan African | 109 | 0.2% |
| Syrian | 18 | 0.0% |
| Thai | 38 | 0.1% |
| U.S. Virgin Islander | 18 | 0.0% |
| Venezuelan | 102 | 0.2% |
| West Indian | 64 | 0.1% | View All 41 Rows |
Immigrants in Mayaguez

| Immigration Origin | # Population | % Population | View All 0 Rows |
Sex and Age in Mayaguez
Sex and Age in Mayaguez
The most populous age groups in Mayaguez are 20 to 24 Years (4,094 | 14.3%) for men and 20 to 24 Years (3,573 | 11.4%) for women.
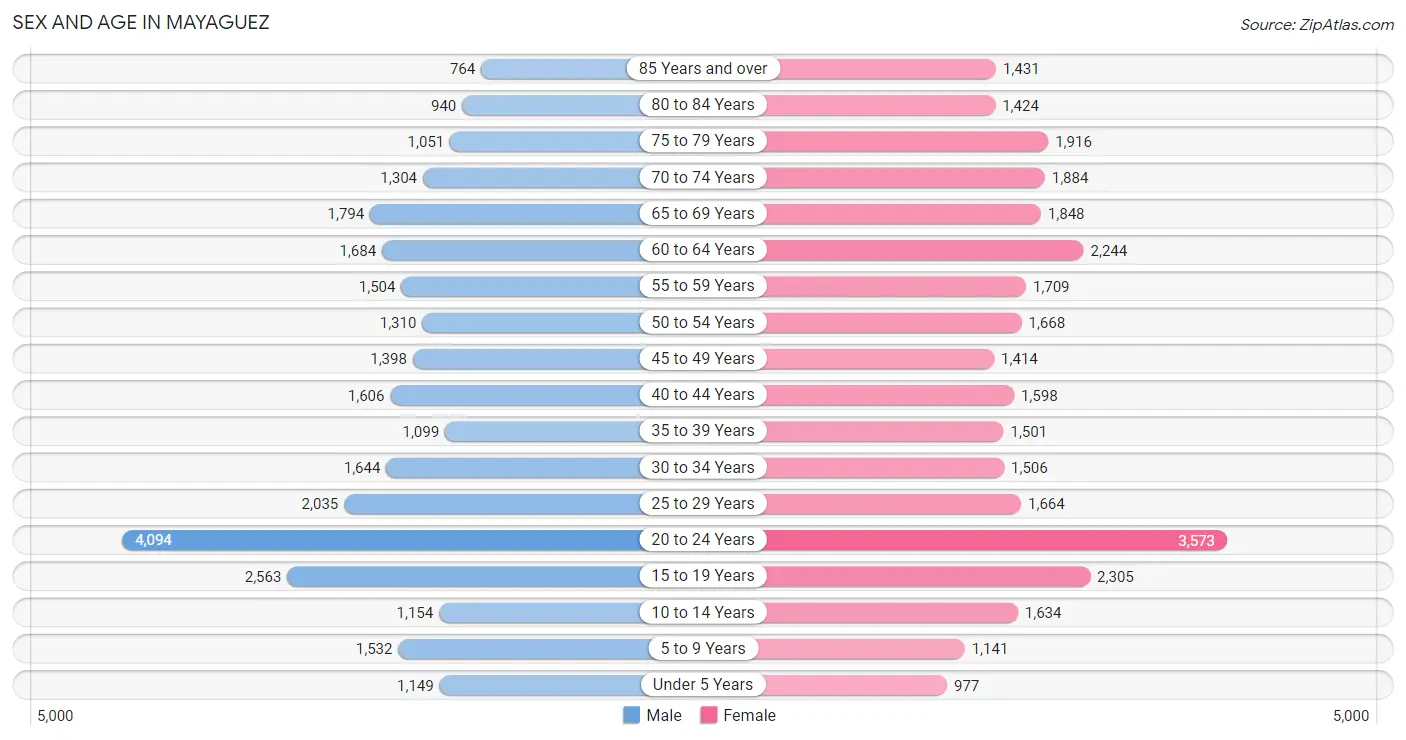
| Age Bracket | Male | Female |
| Under 5 Years | 1,149 (4.0%) | 977 (3.1%) |
| 5 to 9 Years | 1,532 (5.3%) | 1,141 (3.6%) |
| 10 to 14 Years | 1,154 (4.0%) | 1,634 (5.2%) |
| 15 to 19 Years | 2,563 (8.9%) | 2,305 (7.3%) |
| 20 to 24 Years | 4,094 (14.3%) | 3,573 (11.4%) |
| 25 to 29 Years | 2,035 (7.1%) | 1,664 (5.3%) |
| 30 to 34 Years | 1,644 (5.7%) | 1,506 (4.8%) |
| 35 to 39 Years | 1,099 (3.8%) | 1,501 (4.8%) |
| 40 to 44 Years | 1,606 (5.6%) | 1,598 (5.1%) |
| 45 to 49 Years | 1,398 (4.9%) | 1,414 (4.5%) |
| 50 to 54 Years | 1,310 (4.6%) | 1,668 (5.3%) |
| 55 to 59 Years | 1,504 (5.2%) | 1,709 (5.4%) |
| 60 to 64 Years | 1,684 (5.9%) | 2,244 (7.1%) |
| 65 to 69 Years | 1,794 (6.3%) | 1,848 (5.9%) |
| 70 to 74 Years | 1,304 (4.6%) | 1,884 (6.0%) |
| 75 to 79 Years | 1,051 (3.7%) | 1,916 (6.1%) |
| 80 to 84 Years | 940 (3.3%) | 1,424 (4.5%) |
| 85 Years and over | 764 (2.7%) | 1,431 (4.5%) |
| Total | 28,625 (100.0%) | 31,437 (100.0%) |
Families and Households in Mayaguez
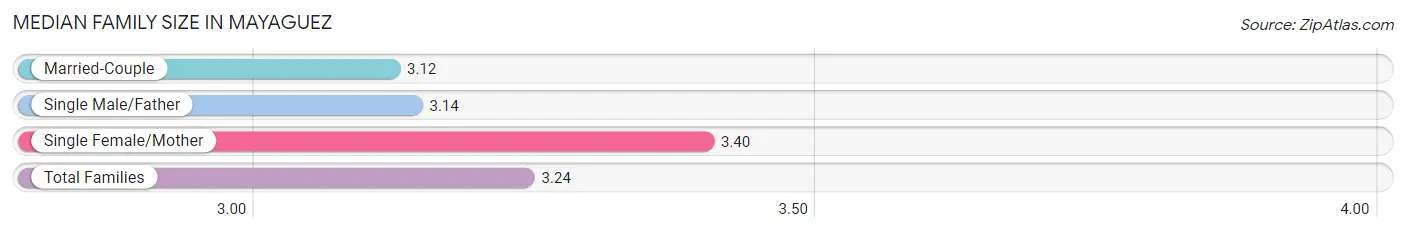
Median Family Size in Mayaguez
The median family size in Mayaguez is 3.24 persons per family, with single female/mother families (5,392 | 41.0%) accounting for the largest median family size of 3.4 persons per family. On the other hand, married-couple families (6,566 | 49.9%) represent the smallest median family size with 3.12 persons per family.
| Family Type | # Families | Family Size |
| Married-Couple | 6,566 (49.9%) | 3.12 |
| Single Male/Father | 1,199 (9.1%) | 3.14 |
| Single Female/Mother | 5,392 (41.0%) | 3.40 |
| Total Families | 13,157 (100.0%) | 3.24 |
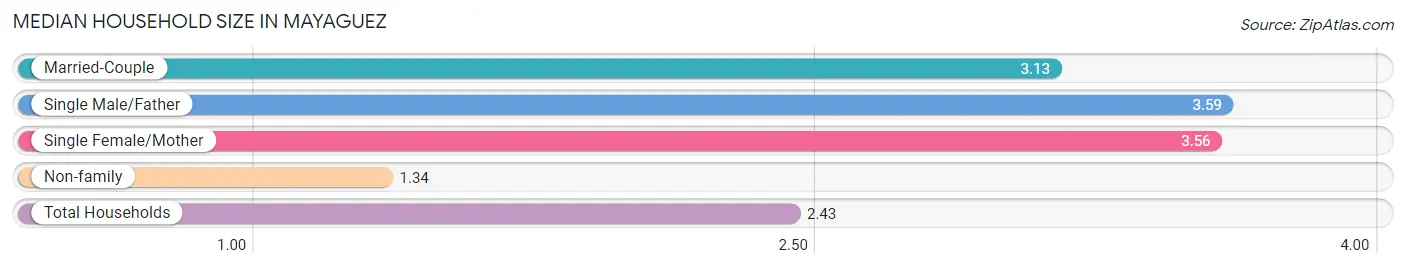
Median Household Size in Mayaguez
The median household size in Mayaguez is 2.43 persons per household, with single male/father households (1,199 | 4.9%) accounting for the largest median household size of 3.59 persons per household. non-family households (11,115 | 45.8%) represent the smallest median household size with 1.34 persons per household.
| Household Type | # Households | Household Size |
| Married-Couple | 6,566 (27.1%) | 3.13 |
| Single Male/Father | 1,199 (4.9%) | 3.59 |
| Single Female/Mother | 5,392 (22.2%) | 3.56 |
| Non-family | 11,115 (45.8%) | 1.34 |
| Total Households | 24,272 (100.0%) | 2.43 |
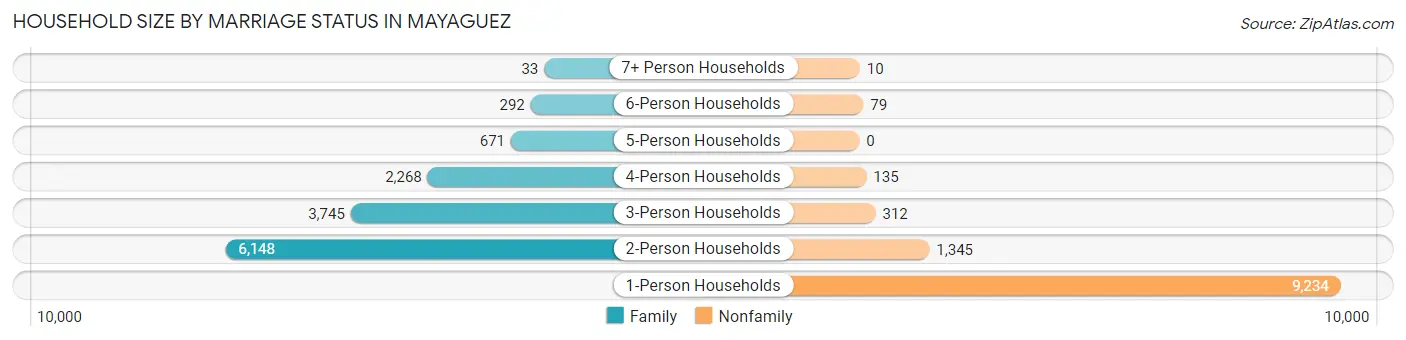
Household Size by Marriage Status in Mayaguez
Out of a total of 24,272 households in Mayaguez, 13,157 (54.2%) are family households, while 11,115 (45.8%) are nonfamily households. The most numerous type of family households are 2-person households, comprising 6,148, and the most common type of nonfamily households are 1-person households, comprising 9,234.
| Household Size | Family Households | Nonfamily Households |
| 1-Person Households | - | 9,234 (38.0%) |
| 2-Person Households | 6,148 (25.3%) | 1,345 (5.5%) |
| 3-Person Households | 3,745 (15.4%) | 312 (1.3%) |
| 4-Person Households | 2,268 (9.3%) | 135 (0.6%) |
| 5-Person Households | 671 (2.8%) | 0 (0.0%) |
| 6-Person Households | 292 (1.2%) | 79 (0.3%) |
| 7+ Person Households | 33 (0.1%) | 10 (0.0%) |
| Total | 13,157 (54.2%) | 11,115 (45.8%) |
Female Fertility in Mayaguez
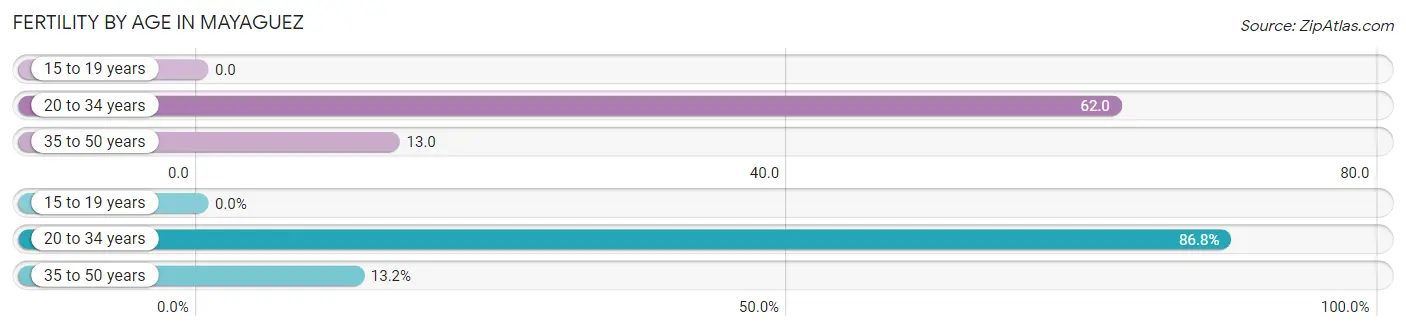
Fertility by Age in Mayaguez
Average fertility rate in Mayaguez is 35.0 births per 1,000 women. Women in the age bracket of 20 to 34 years have the highest fertility rate with 62.0 births per 1,000 women. Women in the age bracket of 20 to 34 years acount for 86.8% of all women with births.
| Age Bracket | Women with Births | Births / 1,000 Women |
| 15 to 19 years | 0 (0.0%) | 0.0 |
| 20 to 34 years | 420 (86.8%) | 62.0 |
| 35 to 50 years | 64 (13.2%) | 13.0 |
| Total | 484 (100.0%) | 35.0 |
Fertility by Age by Marriage Status in Mayaguez
32.4% of women with births (484) in Mayaguez are married. The highest percentage of unmarried women with births falls into 20 to 34 years age bracket with 75.2% of them unmarried at the time of birth, while the lowest percentage of unmarried women with births belong to 35 to 50 years age bracket with 17.2% of them unmarried.
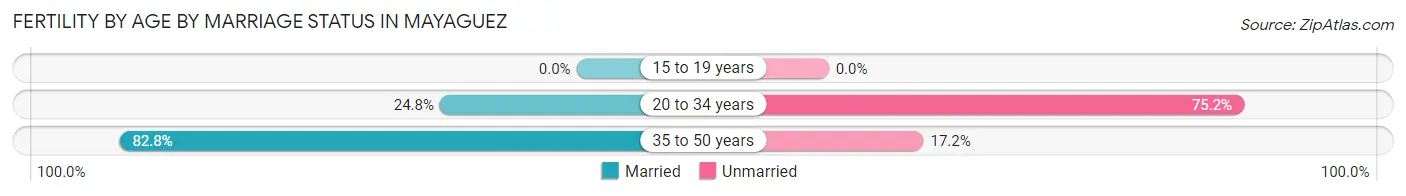
| Age Bracket | Married | Unmarried |
| 15 to 19 years | 0 (0.0%) | 0 (0.0%) |
| 20 to 34 years | 104 (24.8%) | 316 (75.2%) |
| 35 to 50 years | 53 (82.8%) | 11 (17.2%) |
| Total | 157 (32.4%) | 327 (67.6%) |
Fertility by Education in Mayaguez
Average fertility rate in Mayaguez is 35.0 births per 1,000 women. Women with the education attainment of graduate degree have the highest fertility rate of 75.0 births per 1,000 women, while women with the education attainment of high school diploma have the lowest fertility at 26.0 births per 1,000 women. Women with the education attainment of college or associate's degree represent 38.0% of all women with births.
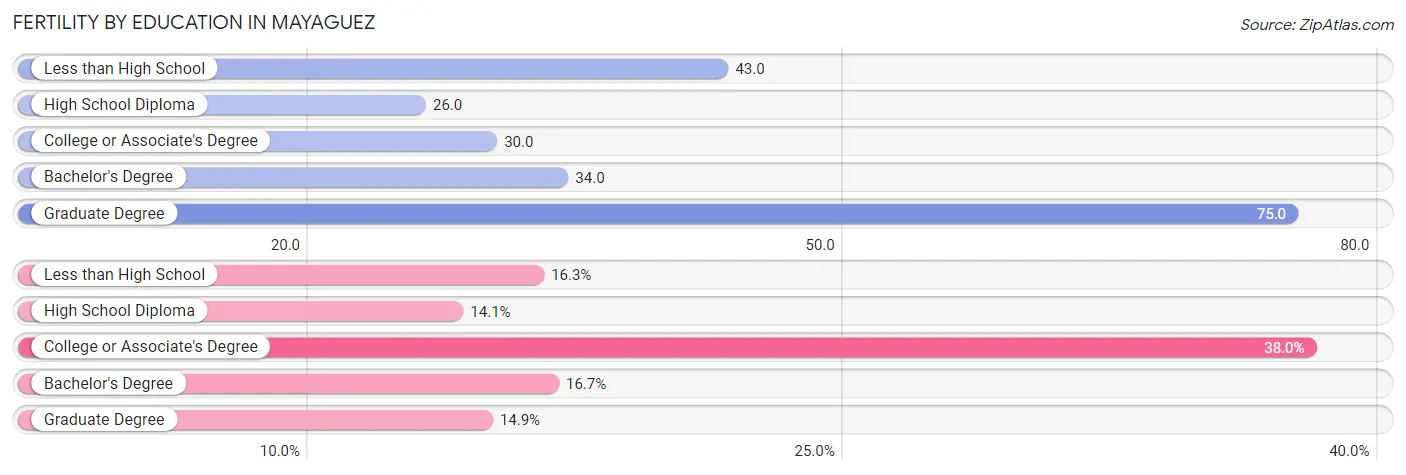
| Educational Attainment | Women with Births | Births / 1,000 Women |
| Less than High School | 79 (16.3%) | 43.0 |
| High School Diploma | 68 (14.1%) | 26.0 |
| College or Associate's Degree | 184 (38.0%) | 30.0 |
| Bachelor's Degree | 81 (16.7%) | 34.0 |
| Graduate Degree | 72 (14.9%) | 75.0 |
| Total | 484 (100.0%) | 35.0 |
Fertility by Education by Marriage Status in Mayaguez
67.6% of women with births in Mayaguez are unmarried. Women with the educational attainment of graduate degree are most likely to be married with 100.0% of them married at childbirth, while women with the educational attainment of less than high school are least likely to be married with 91.1% of them unmarried at childbirth.
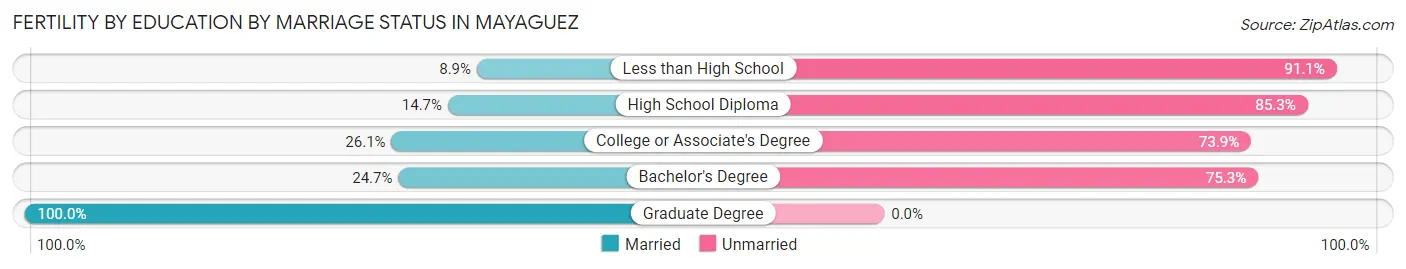
| Educational Attainment | Married | Unmarried |
| Less than High School | 7 (8.9%) | 72 (91.1%) |
| High School Diploma | 10 (14.7%) | 58 (85.3%) |
| College or Associate's Degree | 48 (26.1%) | 136 (73.9%) |
| Bachelor's Degree | 20 (24.7%) | 61 (75.3%) |
| Graduate Degree | 72 (100.0%) | 0 (0.0%) |
| Total | 157 (32.4%) | 327 (67.6%) |
Employment Characteristics in Mayaguez
Employment by Class of Employer in Mayaguez
Among the 15,666 employed individuals in Mayaguez, private company employees (10,343 | 66.0%), state government employees (1,937 | 12.4%), and self-employed (not incorporated) (1,481 | 9.5%) make up the most common classes of employment.
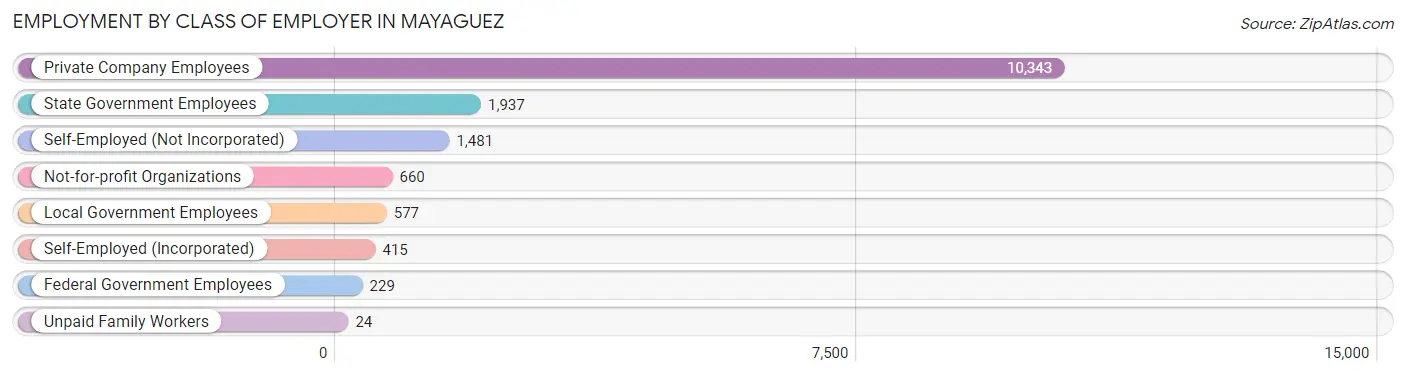
| Employer Class | # Employees | % Employees |
| Private Company Employees | 10,343 | 66.0% |
| Self-Employed (Incorporated) | 415 | 2.6% |
| Self-Employed (Not Incorporated) | 1,481 | 9.5% |
| Not-for-profit Organizations | 660 | 4.2% |
| Local Government Employees | 577 | 3.7% |
| State Government Employees | 1,937 | 12.4% |
| Federal Government Employees | 229 | 1.5% |
| Unpaid Family Workers | 24 | 0.2% |
| Total | 15,666 | 100.0% |
Employment Status by Age in Mayaguez
According to the labor force statistics for Mayaguez, out of the total population over 16 years of age (51,999), 41.1% or 21,372 individuals are in the labor force, with 24.5% or 5,236 of them unemployed. The age group with the highest labor force participation rate is 30 to 34 years, with 74.7% or 2,353 individuals in the labor force. Within the labor force, the 16 to 19 years age range has the highest percentage of unemployed individuals, with 54.7% or 557 of them being unemployed.
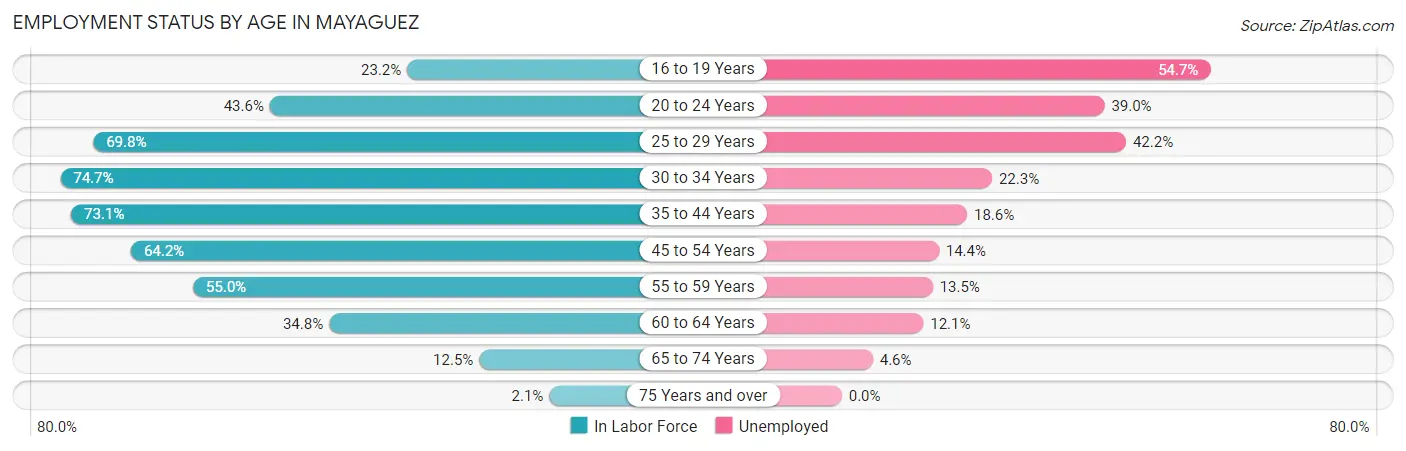
| Age Bracket | In Labor Force | Unemployed |
| 16 to 19 Years | 1,019 (23.2%) | 557 (54.7%) |
| 20 to 24 Years | 3,343 (43.6%) | 1,304 (39.0%) |
| 25 to 29 Years | 2,582 (69.8%) | 1,090 (42.2%) |
| 30 to 34 Years | 2,353 (74.7%) | 525 (22.3%) |
| 35 to 44 Years | 4,243 (73.1%) | 789 (18.6%) |
| 45 to 54 Years | 3,717 (64.2%) | 535 (14.4%) |
| 55 to 59 Years | 1,767 (55.0%) | 239 (13.5%) |
| 60 to 64 Years | 1,367 (34.8%) | 165 (12.1%) |
| 65 to 74 Years | 854 (12.5%) | 39 (4.6%) |
| 75 Years and over | 158 (2.1%) | 0 (0.0%) |
| Total | 21,372 (41.1%) | 5,236 (24.5%) |
Employment Status by Educational Attainment in Mayaguez
According to labor force statistics for Mayaguez, 62.6% of individuals (16,016) out of the total population between 25 and 64 years of age (25,584) are in the labor force, with 20.9% or 3,347 of them being unemployed. The group with the highest labor force participation rate are those with the educational attainment of college / associate degree, with 70.9% or 4,467 individuals in the labor force. Within the labor force, individuals with less than high school education have the highest percentage of unemployment, with 38.4% or 688 of them being unemployed.
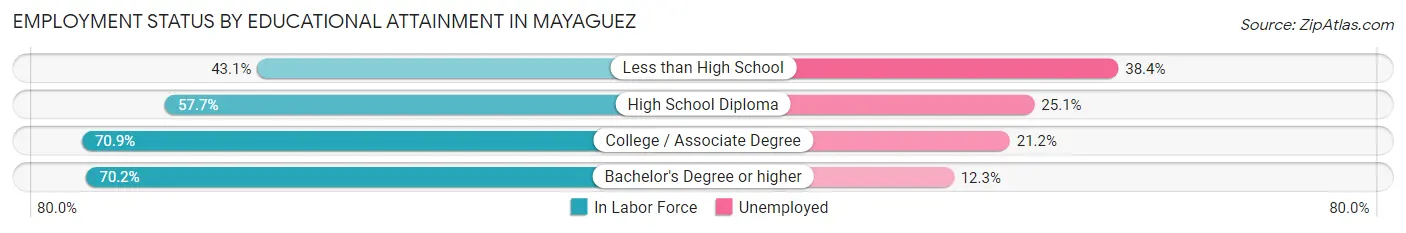
| Educational Attainment | In Labor Force | Unemployed |
| Less than High School | 1,792 (43.1%) | 1,597 (38.4%) |
| High School Diploma | 3,952 (57.7%) | 1,719 (25.1%) |
| College / Associate Degree | 4,467 (70.9%) | 1,336 (21.2%) |
| Bachelor's Degree or higher | 5,809 (70.2%) | 1,018 (12.3%) |
| Total | 16,016 (62.6%) | 5,347 (20.9%) |
Employment Occupations by Sex in Mayaguez
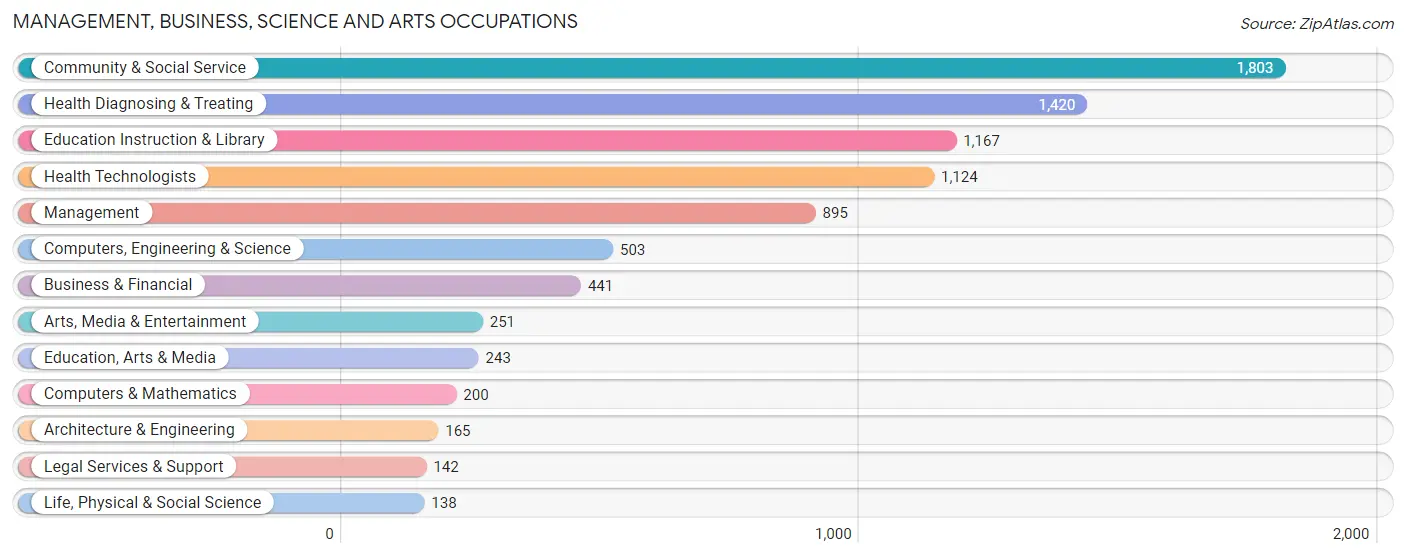
Management, Business, Science and Arts Occupations
The most common Management, Business, Science and Arts occupations in Mayaguez are Community & Social Service (1,803 | 11.2%), Health Diagnosing & Treating (1,420 | 8.8%), Education Instruction & Library (1,167 | 7.2%), Health Technologists (1,124 | 7.0%), and Management (895 | 5.6%).
Management, Business, Science and Arts Occupations by Sex
Within the Management, Business, Science and Arts occupations in Mayaguez, the most male-oriented occupations are Computers & Mathematics (75.0%), Arts, Media & Entertainment (70.1%), and Architecture & Engineering (69.7%), while the most female-oriented occupations are Education, Arts & Media (74.1%), Business & Financial (68.0%), and Health Technologists (62.5%).
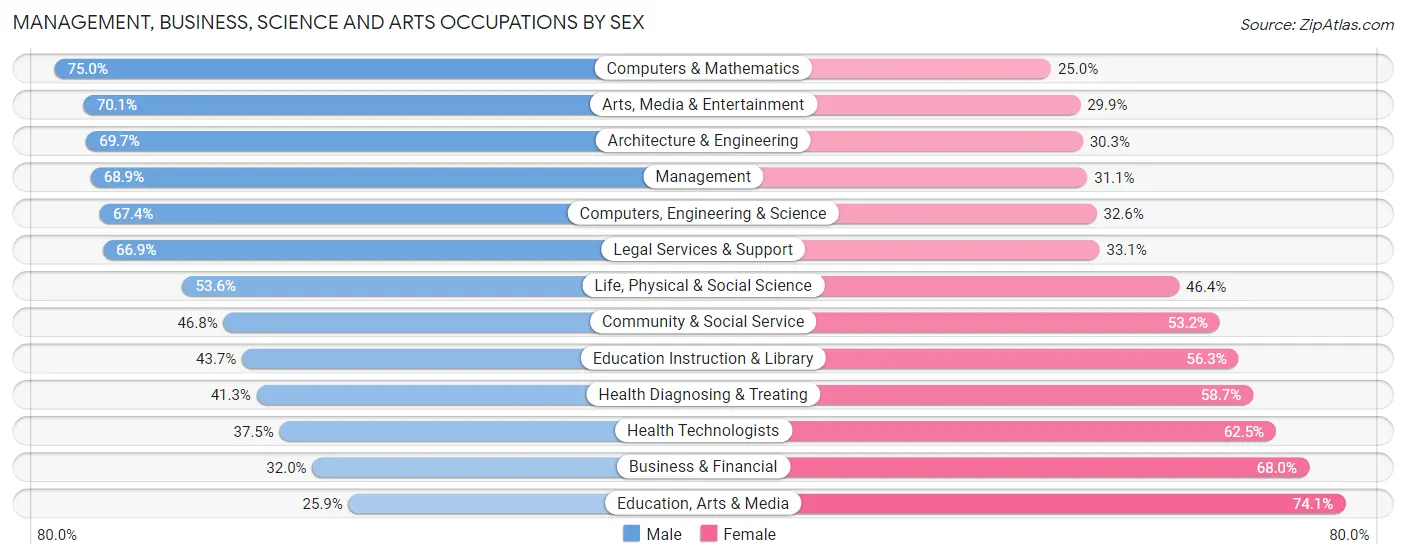
| Occupation | Male | Female |
| Management | 617 (68.9%) | 278 (31.1%) |
| Business & Financial | 141 (32.0%) | 300 (68.0%) |
| Computers, Engineering & Science | 339 (67.4%) | 164 (32.6%) |
| Computers & Mathematics | 150 (75.0%) | 50 (25.0%) |
| Architecture & Engineering | 115 (69.7%) | 50 (30.3%) |
| Life, Physical & Social Science | 74 (53.6%) | 64 (46.4%) |
| Community & Social Service | 844 (46.8%) | 959 (53.2%) |
| Education, Arts & Media | 63 (25.9%) | 180 (74.1%) |
| Legal Services & Support | 95 (66.9%) | 47 (33.1%) |
| Education Instruction & Library | 510 (43.7%) | 657 (56.3%) |
| Arts, Media & Entertainment | 176 (70.1%) | 75 (29.9%) |
| Health Diagnosing & Treating | 586 (41.3%) | 834 (58.7%) |
| Health Technologists | 421 (37.5%) | 703 (62.5%) |
| Total (Category) | 2,527 (49.9%) | 2,535 (50.1%) |
| Total (Overall) | 8,567 (53.1%) | 7,555 (46.9%) |
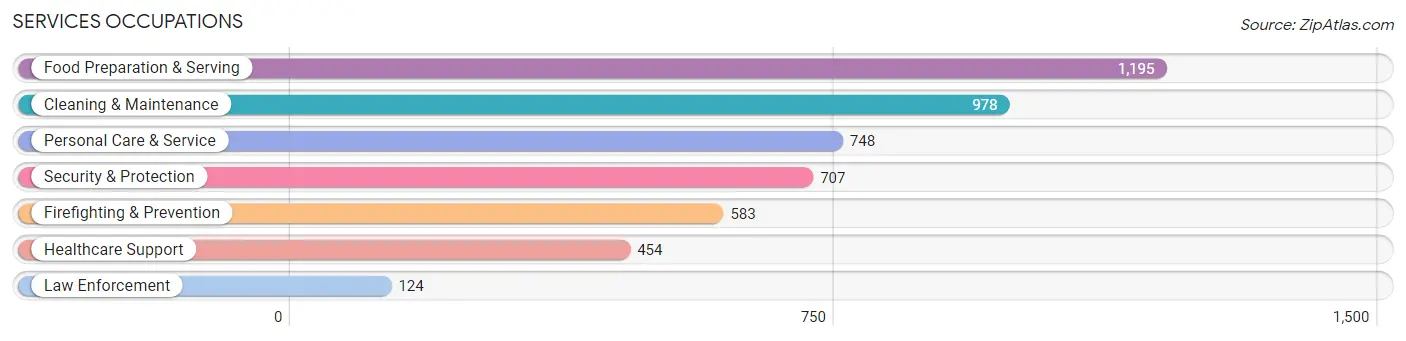
Services Occupations
The most common Services occupations in Mayaguez are Food Preparation & Serving (1,195 | 7.4%), Cleaning & Maintenance (978 | 6.1%), Personal Care & Service (748 | 4.6%), Security & Protection (707 | 4.4%), and Firefighting & Prevention (583 | 3.6%).
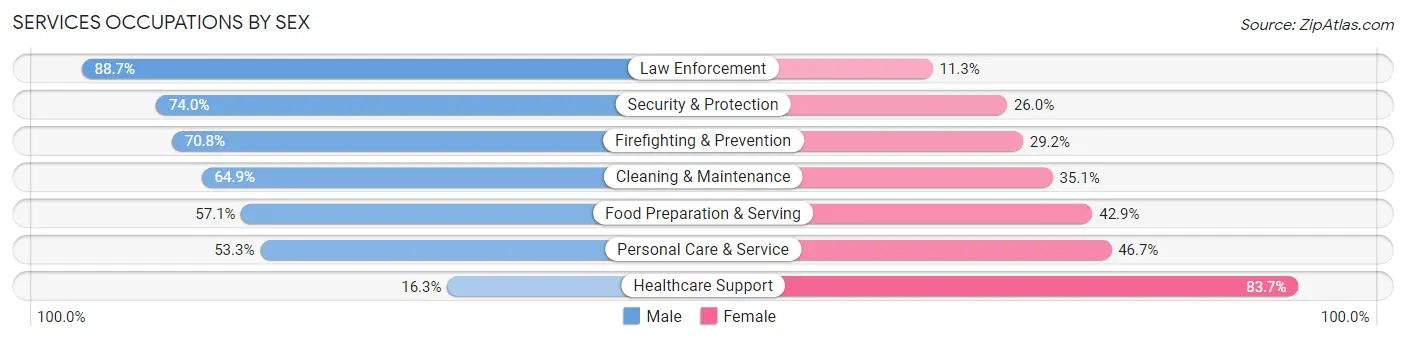
Services Occupations by Sex
Within the Services occupations in Mayaguez, the most male-oriented occupations are Law Enforcement (88.7%), Security & Protection (74.0%), and Firefighting & Prevention (70.8%), while the most female-oriented occupations are Healthcare Support (83.7%), Personal Care & Service (46.7%), and Food Preparation & Serving (42.9%).
| Occupation | Male | Female |
| Healthcare Support | 74 (16.3%) | 380 (83.7%) |
| Security & Protection | 523 (74.0%) | 184 (26.0%) |
| Firefighting & Prevention | 413 (70.8%) | 170 (29.2%) |
| Law Enforcement | 110 (88.7%) | 14 (11.3%) |
| Food Preparation & Serving | 682 (57.1%) | 513 (42.9%) |
| Cleaning & Maintenance | 635 (64.9%) | 343 (35.1%) |
| Personal Care & Service | 399 (53.3%) | 349 (46.7%) |
| Total (Category) | 2,313 (56.7%) | 1,769 (43.3%) |
| Total (Overall) | 8,567 (53.1%) | 7,555 (46.9%) |
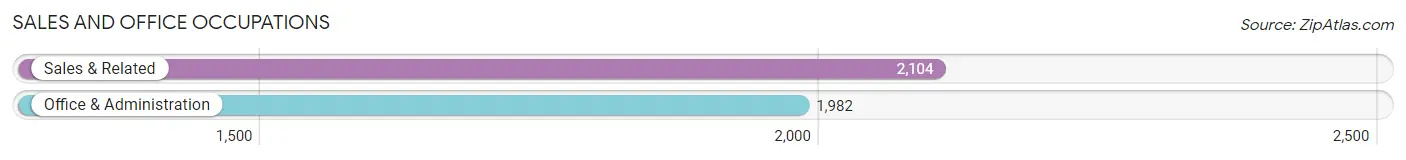
Sales and Office Occupations
The most common Sales and Office occupations in Mayaguez are Sales & Related (2,104 | 13.1%), and Office & Administration (1,982 | 12.3%).
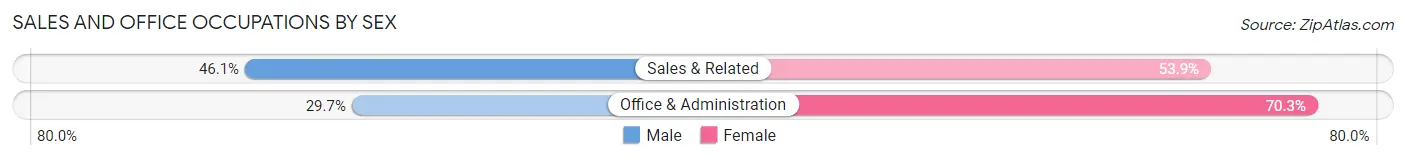
Sales and Office Occupations by Sex
| Occupation | Male | Female |
| Sales & Related | 970 (46.1%) | 1,134 (53.9%) |
| Office & Administration | 588 (29.7%) | 1,394 (70.3%) |
| Total (Category) | 1,558 (38.1%) | 2,528 (61.9%) |
| Total (Overall) | 8,567 (53.1%) | 7,555 (46.9%) |
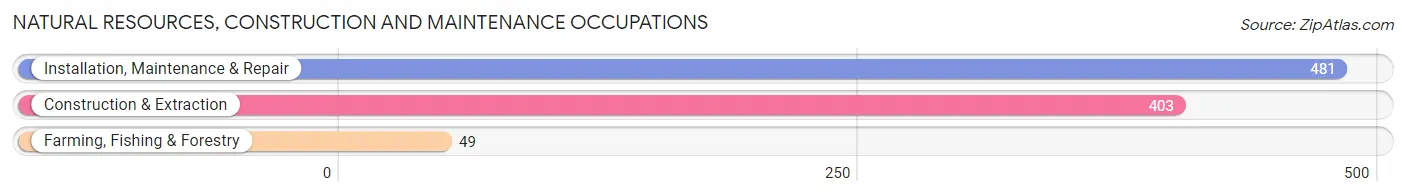
Natural Resources, Construction and Maintenance Occupations
The most common Natural Resources, Construction and Maintenance occupations in Mayaguez are Installation, Maintenance & Repair (481 | 3.0%), Construction & Extraction (403 | 2.5%), and Farming, Fishing & Forestry (49 | 0.3%).
Natural Resources, Construction and Maintenance Occupations by Sex
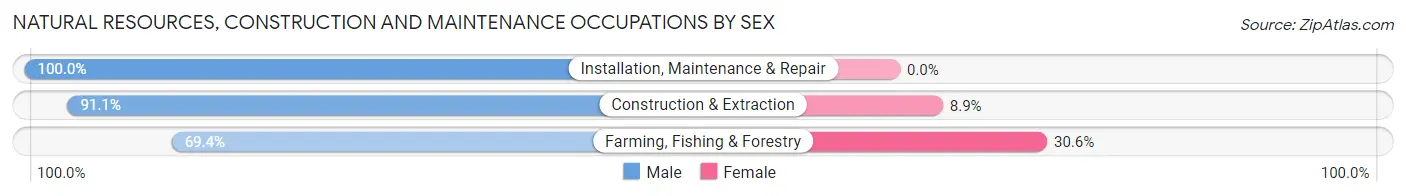
| Occupation | Male | Female |
| Farming, Fishing & Forestry | 34 (69.4%) | 15 (30.6%) |
| Construction & Extraction | 367 (91.1%) | 36 (8.9%) |
| Installation, Maintenance & Repair | 481 (100.0%) | 0 (0.0%) |
| Total (Category) | 882 (94.5%) | 51 (5.5%) |
| Total (Overall) | 8,567 (53.1%) | 7,555 (46.9%) |
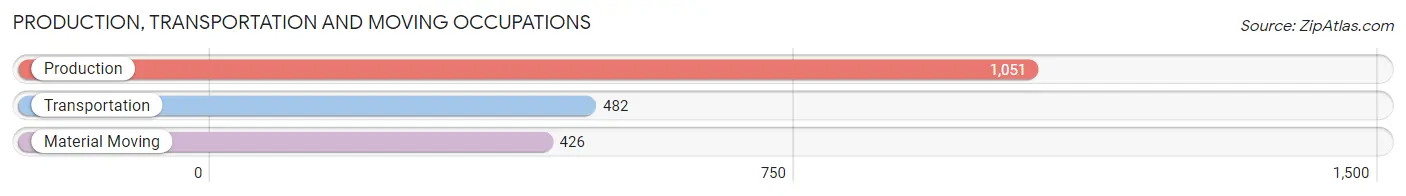
Production, Transportation and Moving Occupations
The most common Production, Transportation and Moving occupations in Mayaguez are Production (1,051 | 6.5%), Transportation (482 | 3.0%), and Material Moving (426 | 2.6%).
Production, Transportation and Moving Occupations by Sex
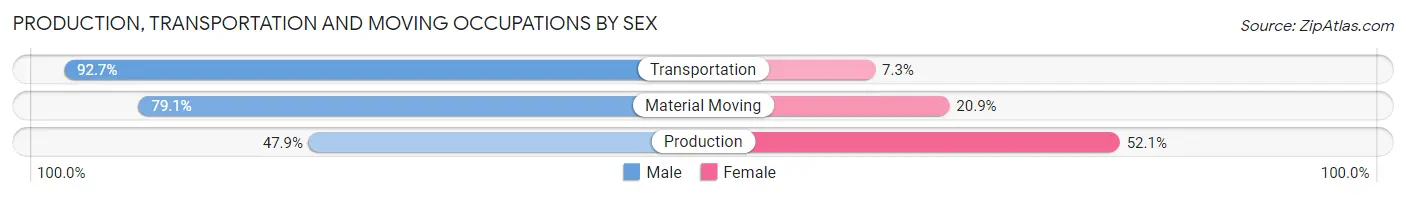
| Occupation | Male | Female |
| Production | 503 (47.9%) | 548 (52.1%) |
| Transportation | 447 (92.7%) | 35 (7.3%) |
| Material Moving | 337 (79.1%) | 89 (20.9%) |
| Total (Category) | 1,287 (65.7%) | 672 (34.3%) |
| Total (Overall) | 8,567 (53.1%) | 7,555 (46.9%) |
Employment Industries by Sex in Mayaguez
Employment Industries in Mayaguez
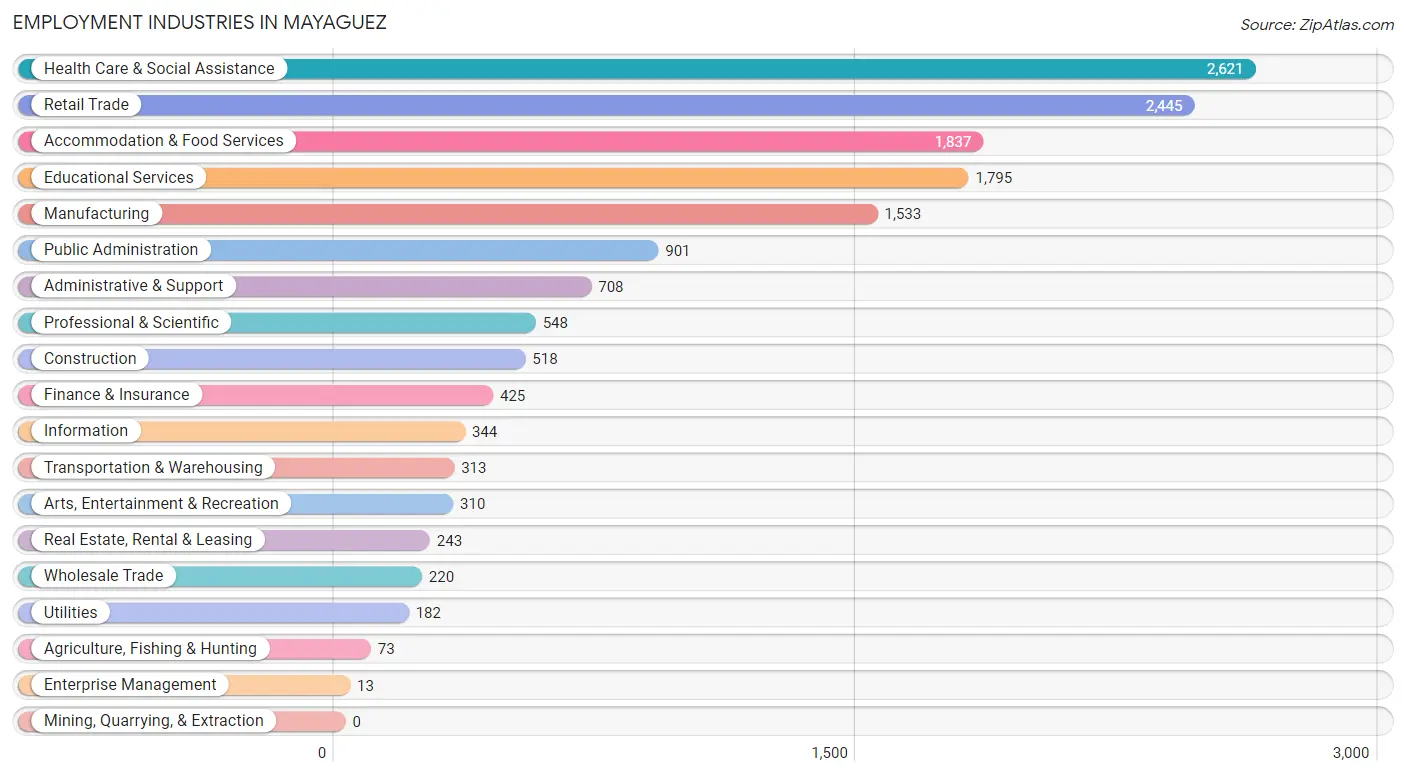
The major employment industries in Mayaguez include Health Care & Social Assistance (2,621 | 16.3%), Retail Trade (2,445 | 15.2%), Accommodation & Food Services (1,837 | 11.4%), Educational Services (1,795 | 11.1%), and Manufacturing (1,533 | 9.5%).
Employment Industries by Sex in Mayaguez
The Mayaguez industries that see more men than women are Construction (95.6%), Wholesale Trade (91.4%), and Arts, Entertainment & Recreation (87.1%), whereas the industries that tend to have a higher number of women are Enterprise Management (100.0%), Health Care & Social Assistance (72.7%), and Educational Services (56.9%).
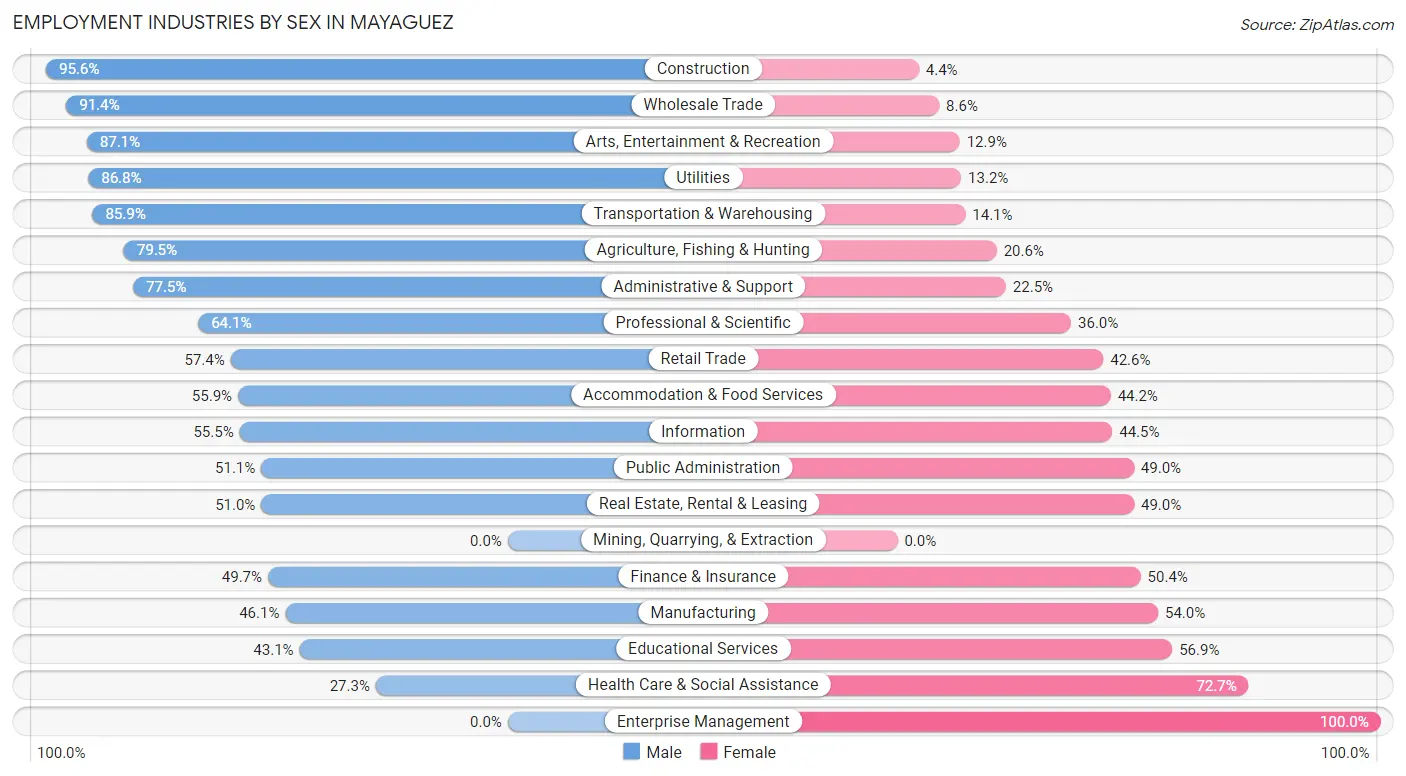
| Industry | Male | Female |
| Agriculture, Fishing & Hunting | 58 (79.4%) | 15 (20.5%) |
| Mining, Quarrying, & Extraction | 0 (0.0%) | 0 (0.0%) |
| Construction | 495 (95.6%) | 23 (4.4%) |
| Manufacturing | 706 (46.1%) | 827 (53.9%) |
| Wholesale Trade | 201 (91.4%) | 19 (8.6%) |
| Retail Trade | 1,403 (57.4%) | 1,042 (42.6%) |
| Transportation & Warehousing | 269 (85.9%) | 44 (14.1%) |
| Utilities | 158 (86.8%) | 24 (13.2%) |
| Information | 191 (55.5%) | 153 (44.5%) |
| Finance & Insurance | 211 (49.6%) | 214 (50.3%) |
| Real Estate, Rental & Leasing | 124 (51.0%) | 119 (49.0%) |
| Professional & Scientific | 351 (64.0%) | 197 (35.9%) |
| Enterprise Management | 0 (0.0%) | 13 (100.0%) |
| Administrative & Support | 549 (77.5%) | 159 (22.5%) |
| Educational Services | 774 (43.1%) | 1,021 (56.9%) |
| Health Care & Social Assistance | 716 (27.3%) | 1,905 (72.7%) |
| Arts, Entertainment & Recreation | 270 (87.1%) | 40 (12.9%) |
| Accommodation & Food Services | 1,026 (55.8%) | 811 (44.2%) |
| Public Administration | 460 (51.0%) | 441 (48.9%) |
| Total | 8,567 (53.1%) | 7,555 (46.9%) |
Education in Mayaguez
School Enrollment in Mayaguez
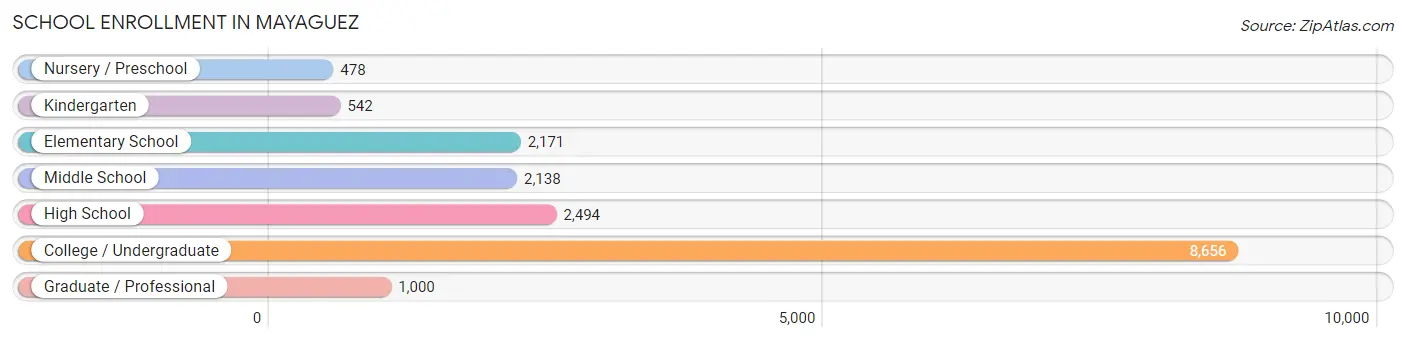
The most common levels of schooling among the 17,479 students in Mayaguez are college / undergraduate (8,656 | 49.5%), high school (2,494 | 14.3%), and elementary school (2,171 | 12.4%).
| School Level | # Students | % Students |
| Nursery / Preschool | 478 | 2.7% |
| Kindergarten | 542 | 3.1% |
| Elementary School | 2,171 | 12.4% |
| Middle School | 2,138 | 12.2% |
| High School | 2,494 | 14.3% |
| College / Undergraduate | 8,656 | 49.5% |
| Graduate / Professional | 1,000 | 5.7% |
| Total | 17,479 | 100.0% |
School Enrollment by Age by Funding Source in Mayaguez
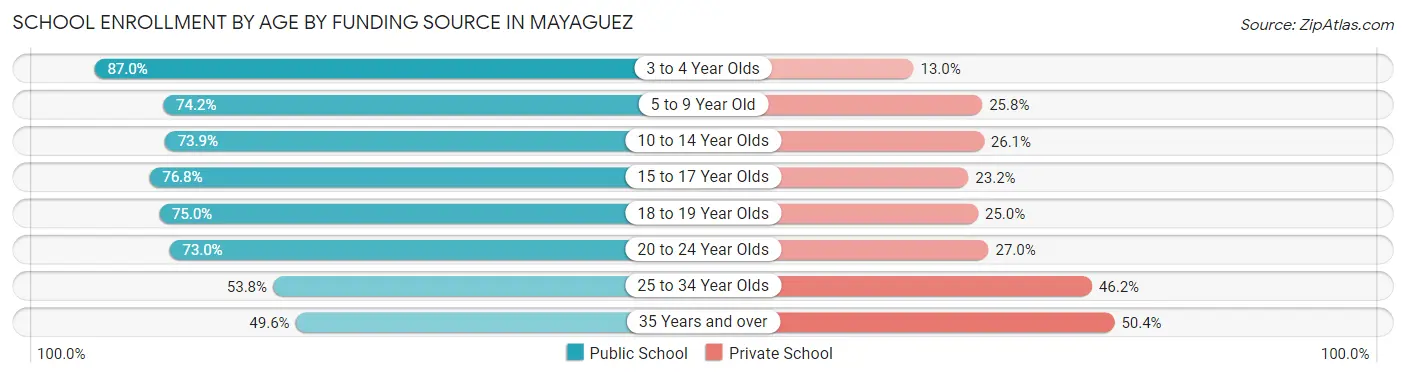
Out of a total of 17,479 students who are enrolled in schools in Mayaguez, 4,912 (28.1%) attend a private institution, while the remaining 12,567 (71.9%) are enrolled in public schools. The age group of 35 years and over has the highest likelihood of being enrolled in private schools, with 346 (50.4% in the age bracket) enrolled. Conversely, the age group of 3 to 4 year olds has the lowest likelihood of being enrolled in a private school, with 441 (87.0% in the age bracket) attending a public institution.
| Age Bracket | Public School | Private School |
| 3 to 4 Year Olds | 441 (87.0%) | 66 (13.0%) |
| 5 to 9 Year Old | 1,886 (74.2%) | 656 (25.8%) |
| 10 to 14 Year Olds | 1,975 (73.9%) | 698 (26.1%) |
| 15 to 17 Year Olds | 1,540 (76.8%) | 466 (23.2%) |
| 18 to 19 Year Olds | 1,707 (75.0%) | 570 (25.0%) |
| 20 to 24 Year Olds | 3,870 (73.0%) | 1,430 (27.0%) |
| 25 to 34 Year Olds | 800 (53.8%) | 688 (46.2%) |
| 35 Years and over | 340 (49.6%) | 346 (50.4%) |
| Total | 12,567 (71.9%) | 4,912 (28.1%) |
Educational Attainment by Field of Study in Mayaguez
Business (2,964 | 25.0%), education (1,644 | 13.9%), science & technology (1,428 | 12.0%), bio, nature & agricultural (1,268 | 10.7%), and engineering (839 | 7.1%) are the most common fields of study among 11,856 individuals in Mayaguez who have obtained a bachelor's degree or higher.
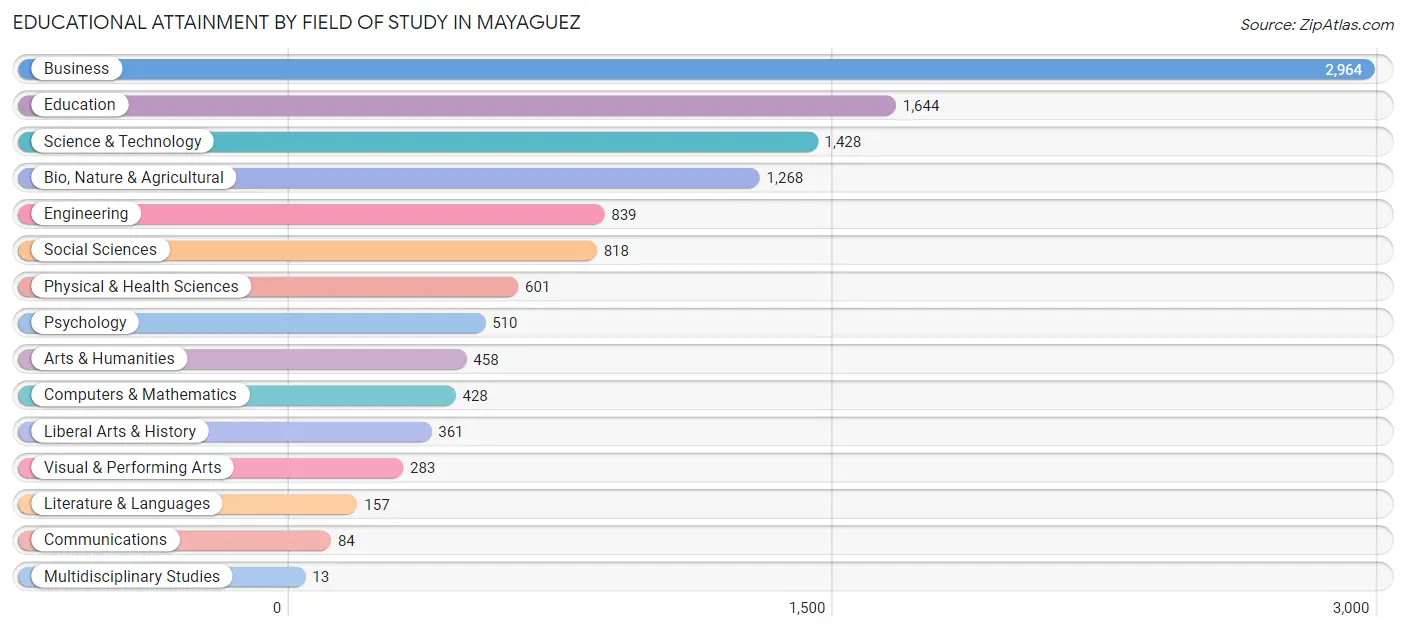
| Field of Study | # Graduates | % Graduates |
| Computers & Mathematics | 428 | 3.6% |
| Bio, Nature & Agricultural | 1,268 | 10.7% |
| Physical & Health Sciences | 601 | 5.1% |
| Psychology | 510 | 4.3% |
| Social Sciences | 818 | 6.9% |
| Engineering | 839 | 7.1% |
| Multidisciplinary Studies | 13 | 0.1% |
| Science & Technology | 1,428 | 12.0% |
| Business | 2,964 | 25.0% |
| Education | 1,644 | 13.9% |
| Literature & Languages | 157 | 1.3% |
| Liberal Arts & History | 361 | 3.0% |
| Visual & Performing Arts | 283 | 2.4% |
| Communications | 84 | 0.7% |
| Arts & Humanities | 458 | 3.9% |
| Total | 11,856 | 100.0% |
Transportation & Commute in Mayaguez
Vehicle Availability by Sex in Mayaguez
The most prevalent vehicle ownership categories in Mayaguez are males with 2 vehicles (3,293, accounting for 39.7%) and females with 2 vehicles (2,490, making up 45.8%).
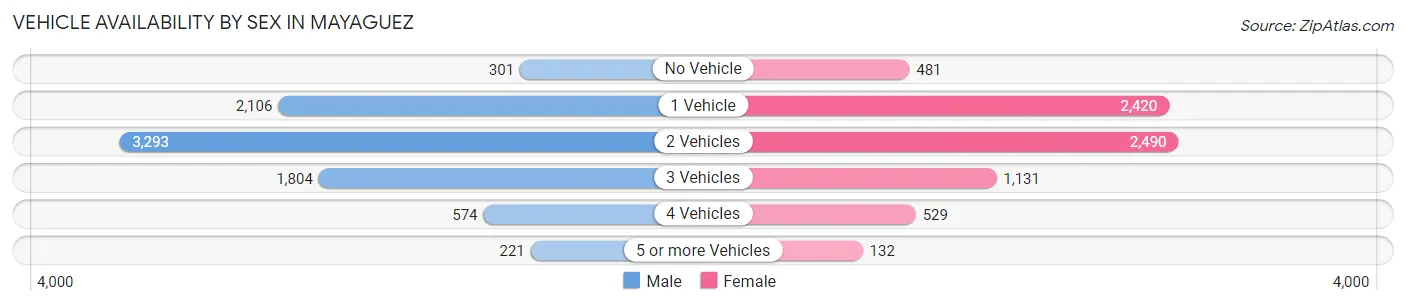
| Vehicles Available | Male | Female |
| No Vehicle | 301 (3.6%) | 481 (6.7%) |
| 1 Vehicle | 2,106 (25.4%) | 2,420 (33.7%) |
| 2 Vehicles | 3,293 (39.7%) | 2,490 (34.7%) |
| 3 Vehicles | 1,804 (21.7%) | 1,131 (15.8%) |
| 4 Vehicles | 574 (6.9%) | 529 (7.4%) |
| 5 or more Vehicles | 221 (2.7%) | 132 (1.8%) |
| Total | 8,299 (100.0%) | 7,183 (100.0%) |
Commute Time in Mayaguez
The most frequently occuring commute durations in Mayaguez are 15 to 19 minutes (3,461 commuters, 22.9%), 10 to 14 minutes (2,934 commuters, 19.4%), and 20 to 24 minutes (2,310 commuters, 15.3%).
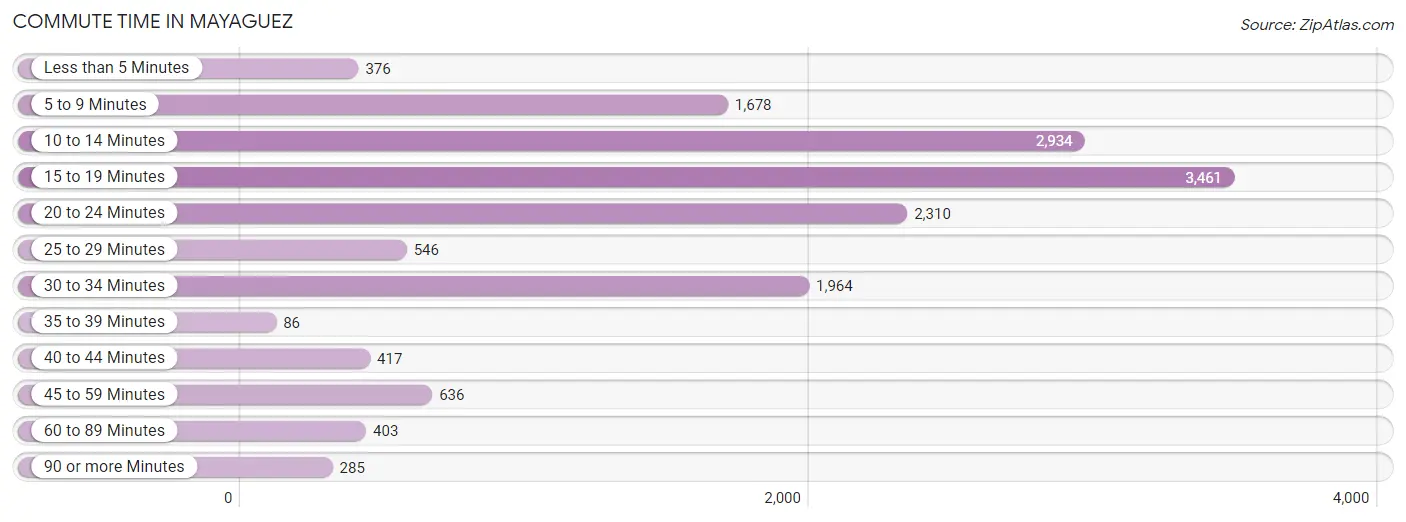
| Commute Time | # Commuters | % Commuters |
| Less than 5 Minutes | 376 | 2.5% |
| 5 to 9 Minutes | 1,678 | 11.1% |
| 10 to 14 Minutes | 2,934 | 19.4% |
| 15 to 19 Minutes | 3,461 | 22.9% |
| 20 to 24 Minutes | 2,310 | 15.3% |
| 25 to 29 Minutes | 546 | 3.6% |
| 30 to 34 Minutes | 1,964 | 13.0% |
| 35 to 39 Minutes | 86 | 0.6% |
| 40 to 44 Minutes | 417 | 2.8% |
| 45 to 59 Minutes | 636 | 4.2% |
| 60 to 89 Minutes | 403 | 2.7% |
| 90 or more Minutes | 285 | 1.9% |
Commute Time by Sex in Mayaguez
The most common commute times in Mayaguez are 15 to 19 minutes (1,750 commuters, 21.5%) for males and 15 to 19 minutes (1,711 commuters, 24.6%) for females.
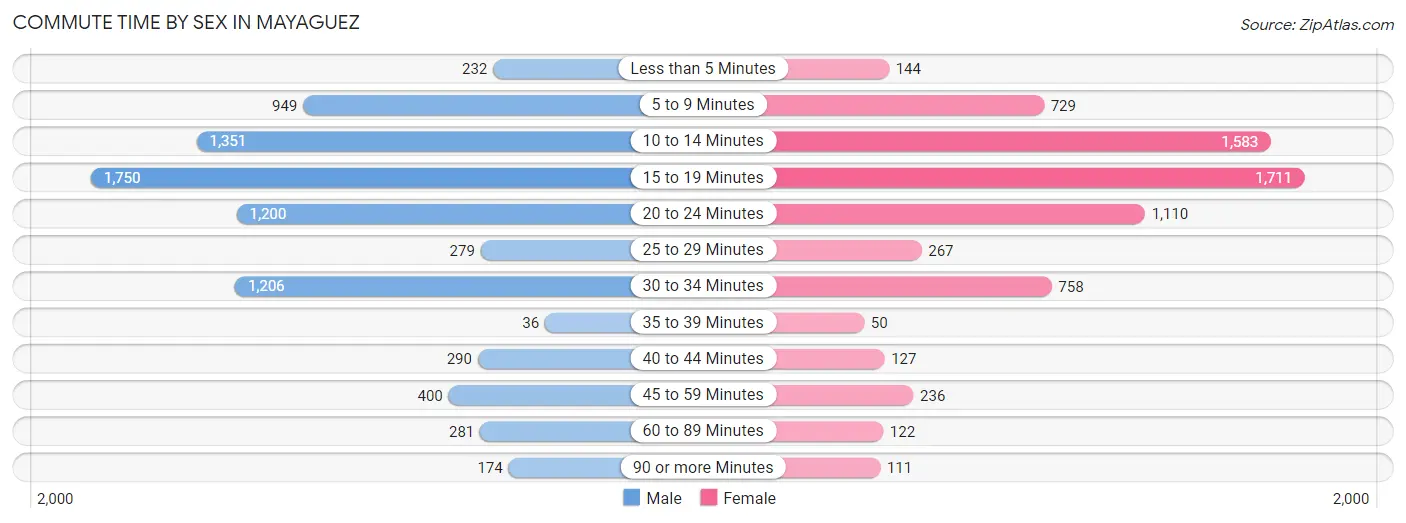
| Commute Time | Male | Female |
| Less than 5 Minutes | 232 (2.9%) | 144 (2.1%) |
| 5 to 9 Minutes | 949 (11.7%) | 729 (10.5%) |
| 10 to 14 Minutes | 1,351 (16.6%) | 1,583 (22.8%) |
| 15 to 19 Minutes | 1,750 (21.5%) | 1,711 (24.6%) |
| 20 to 24 Minutes | 1,200 (14.7%) | 1,110 (16.0%) |
| 25 to 29 Minutes | 279 (3.4%) | 267 (3.8%) |
| 30 to 34 Minutes | 1,206 (14.8%) | 758 (10.9%) |
| 35 to 39 Minutes | 36 (0.4%) | 50 (0.7%) |
| 40 to 44 Minutes | 290 (3.6%) | 127 (1.8%) |
| 45 to 59 Minutes | 400 (4.9%) | 236 (3.4%) |
| 60 to 89 Minutes | 281 (3.5%) | 122 (1.8%) |
| 90 or more Minutes | 174 (2.1%) | 111 (1.6%) |
Time of Departure to Work by Sex in Mayaguez
The most frequent times of departure to work in Mayaguez are 7:30 AM to 7:59 AM (1,133, 13.9%) for males and 7:30 AM to 7:59 AM (1,170, 16.8%) for females.
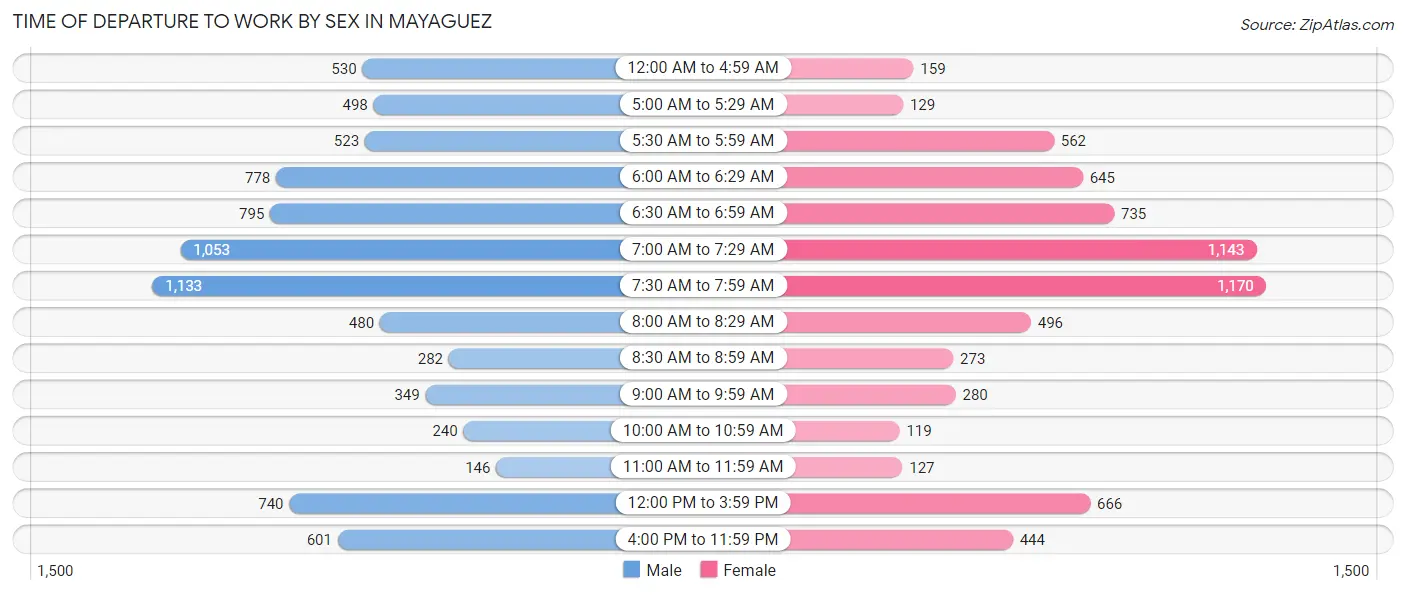
| Time of Departure | Male | Female |
| 12:00 AM to 4:59 AM | 530 (6.5%) | 159 (2.3%) |
| 5:00 AM to 5:29 AM | 498 (6.1%) | 129 (1.9%) |
| 5:30 AM to 5:59 AM | 523 (6.4%) | 562 (8.1%) |
| 6:00 AM to 6:29 AM | 778 (9.6%) | 645 (9.3%) |
| 6:30 AM to 6:59 AM | 795 (9.8%) | 735 (10.6%) |
| 7:00 AM to 7:29 AM | 1,053 (12.9%) | 1,143 (16.5%) |
| 7:30 AM to 7:59 AM | 1,133 (13.9%) | 1,170 (16.8%) |
| 8:00 AM to 8:29 AM | 480 (5.9%) | 496 (7.1%) |
| 8:30 AM to 8:59 AM | 282 (3.5%) | 273 (3.9%) |
| 9:00 AM to 9:59 AM | 349 (4.3%) | 280 (4.0%) |
| 10:00 AM to 10:59 AM | 240 (2.9%) | 119 (1.7%) |
| 11:00 AM to 11:59 AM | 146 (1.8%) | 127 (1.8%) |
| 12:00 PM to 3:59 PM | 740 (9.1%) | 666 (9.6%) |
| 4:00 PM to 11:59 PM | 601 (7.4%) | 444 (6.4%) |
| Total | 8,148 (100.0%) | 6,948 (100.0%) |
Housing Occupancy in Mayaguez
Occupancy by Ownership in Mayaguez
Of the total 24,272 dwellings in Mayaguez, owner-occupied units account for 11,930 (49.1%), while renter-occupied units make up 12,342 (50.8%).
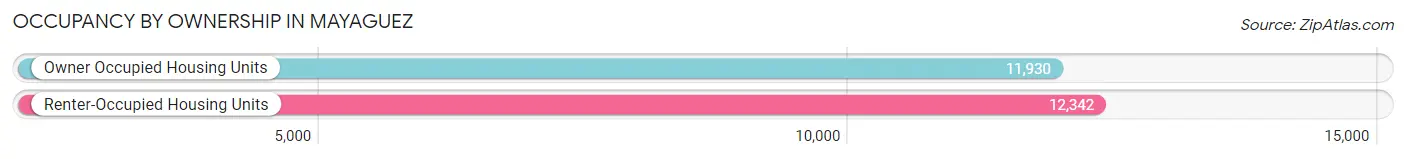
| Occupancy | # Housing Units | % Housing Units |
| Owner Occupied Housing Units | 11,930 | 49.1% |
| Renter-Occupied Housing Units | 12,342 | 50.8% |
| Total Occupied Housing Units | 24,272 | 100.0% |
Occupancy by Household Size in Mayaguez
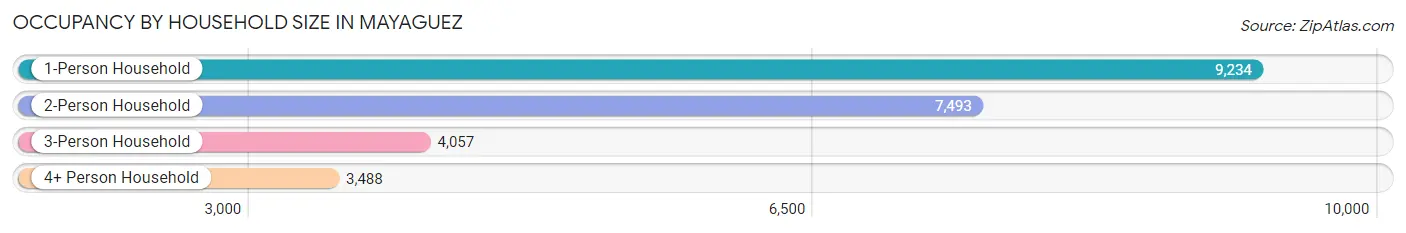
| Household Size | # Housing Units | % Housing Units |
| 1-Person Household | 9,234 | 38.0% |
| 2-Person Household | 7,493 | 30.9% |
| 3-Person Household | 4,057 | 16.7% |
| 4+ Person Household | 3,488 | 14.4% |
| Total Housing Units | 24,272 | 100.0% |
Occupancy by Ownership by Household Size in Mayaguez
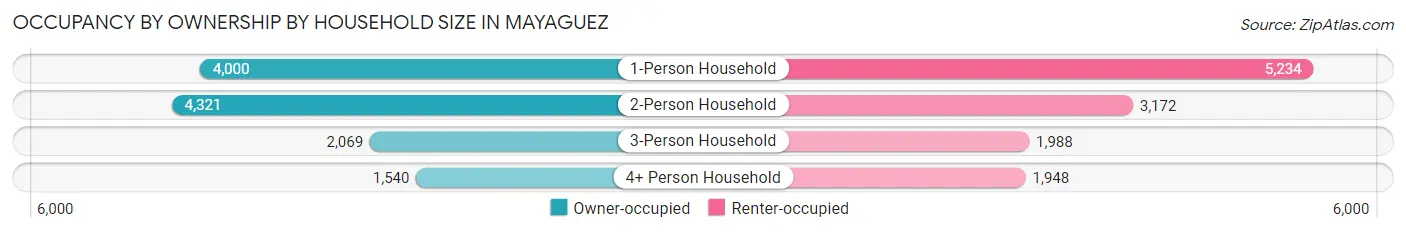
| Household Size | Owner-occupied | Renter-occupied |
| 1-Person Household | 4,000 (43.3%) | 5,234 (56.7%) |
| 2-Person Household | 4,321 (57.7%) | 3,172 (42.3%) |
| 3-Person Household | 2,069 (51.0%) | 1,988 (49.0%) |
| 4+ Person Household | 1,540 (44.2%) | 1,948 (55.8%) |
| Total Housing Units | 11,930 (49.1%) | 12,342 (50.8%) |
Occupancy by Educational Attainment in Mayaguez
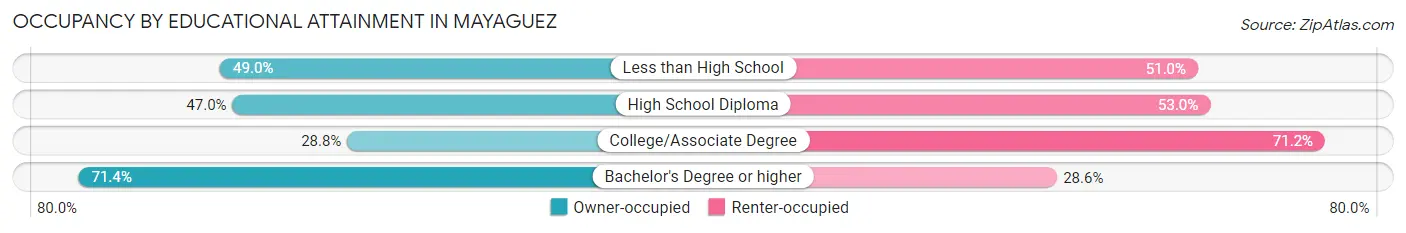
| Household Size | Owner-occupied | Renter-occupied |
| Less than High School | 2,698 (49.0%) | 2,810 (51.0%) |
| High School Diploma | 3,038 (47.0%) | 3,420 (53.0%) |
| College/Associate Degree | 1,758 (28.8%) | 4,339 (71.2%) |
| Bachelor's Degree or higher | 4,436 (71.4%) | 1,773 (28.6%) |
Occupancy by Age of Householder in Mayaguez
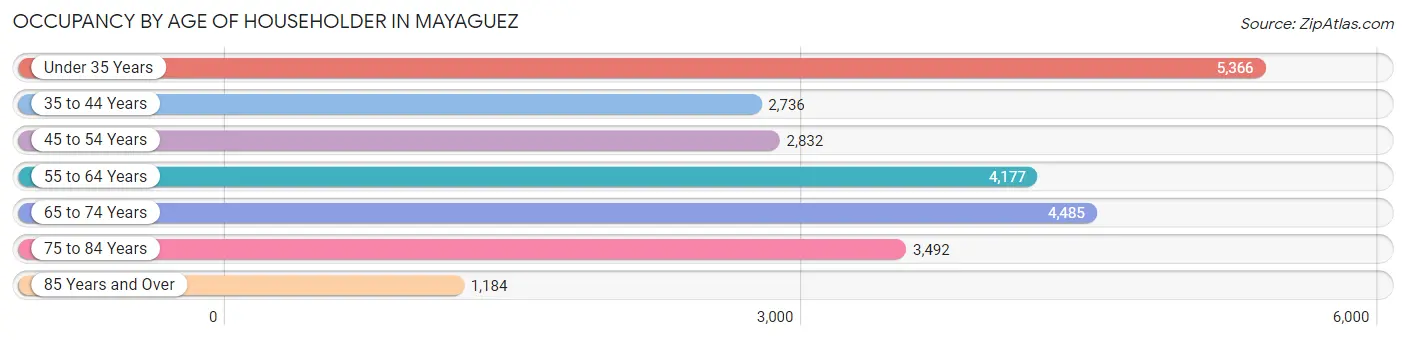
| Age Bracket | # Households | % Households |
| Under 35 Years | 5,366 | 22.1% |
| 35 to 44 Years | 2,736 | 11.3% |
| 45 to 54 Years | 2,832 | 11.7% |
| 55 to 64 Years | 4,177 | 17.2% |
| 65 to 74 Years | 4,485 | 18.5% |
| 75 to 84 Years | 3,492 | 14.4% |
| 85 Years and Over | 1,184 | 4.9% |
| Total | 24,272 | 100.0% |
Housing Finances in Mayaguez
Median Income by Occupancy in Mayaguez
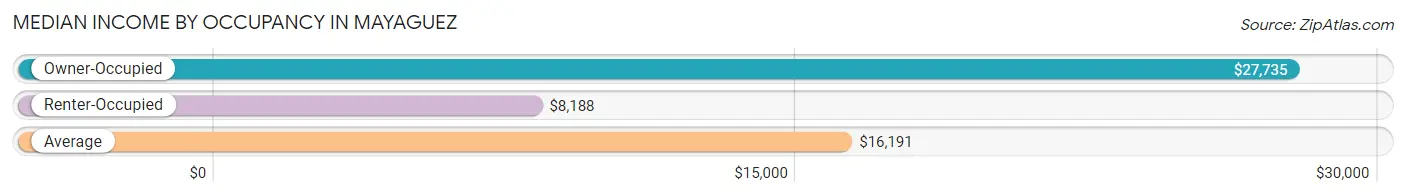
| Occupancy Type | # Households | Median Income |
| Owner-Occupied | 11,930 (49.1%) | $27,735 |
| Renter-Occupied | 12,342 (50.8%) | $8,188 |
| Average | 24,272 (100.0%) | $16,191 |
Occupancy by Householder Income Bracket in Mayaguez
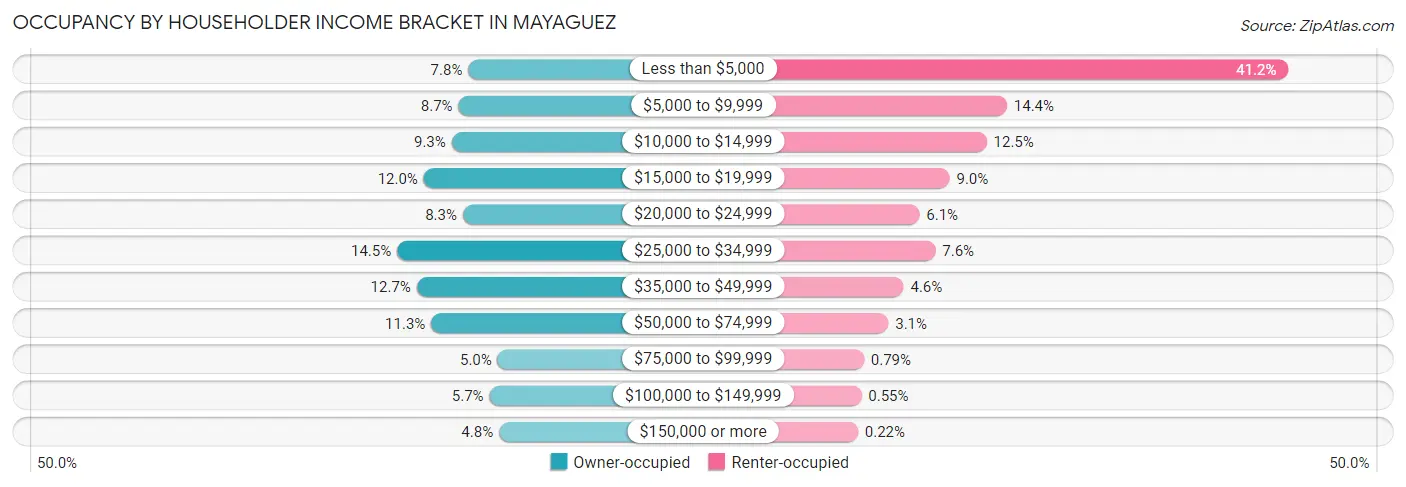
| Income Bracket | Owner-occupied | Renter-occupied |
| Less than $5,000 | 924 (7.7%) | 5,087 (41.2%) |
| $5,000 to $9,999 | 1,036 (8.7%) | 1,779 (14.4%) |
| $10,000 to $14,999 | 1,113 (9.3%) | 1,540 (12.5%) |
| $15,000 to $19,999 | 1,431 (12.0%) | 1,105 (8.9%) |
| $20,000 to $24,999 | 987 (8.3%) | 751 (6.1%) |
| $25,000 to $34,999 | 1,734 (14.5%) | 938 (7.6%) |
| $35,000 to $49,999 | 1,510 (12.7%) | 564 (4.6%) |
| $50,000 to $74,999 | 1,346 (11.3%) | 385 (3.1%) |
| $75,000 to $99,999 | 591 (5.0%) | 98 (0.8%) |
| $100,000 to $149,999 | 683 (5.7%) | 68 (0.5%) |
| $150,000 or more | 575 (4.8%) | 27 (0.2%) |
| Total | 11,930 (100.0%) | 12,342 (100.0%) |
Monthly Housing Cost Tiers in Mayaguez
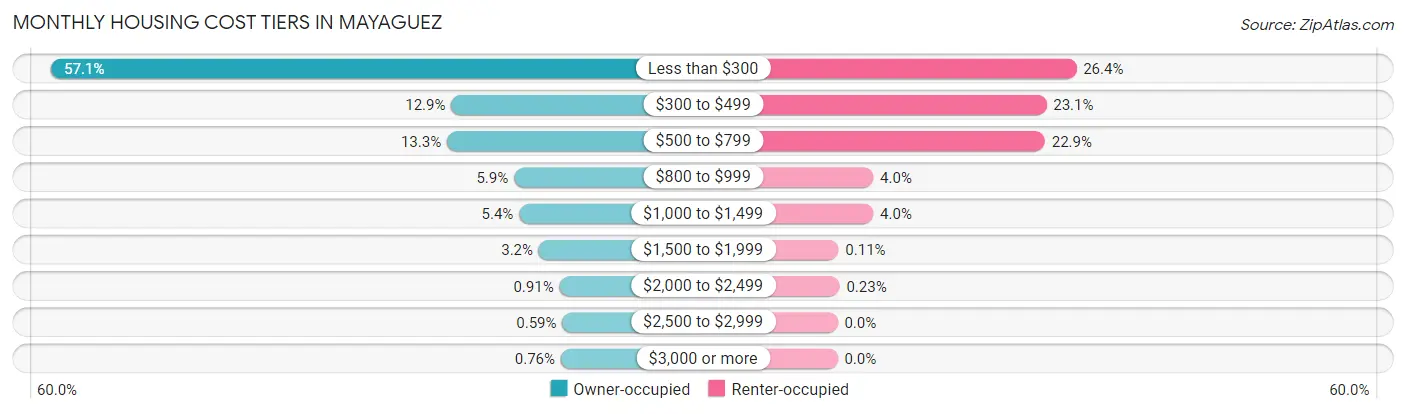
| Monthly Cost | Owner-occupied | Renter-occupied |
| Less than $300 | 6,808 (57.1%) | 3,256 (26.4%) |
| $300 to $499 | 1,534 (12.9%) | 2,847 (23.1%) |
| $500 to $799 | 1,592 (13.3%) | 2,828 (22.9%) |
| $800 to $999 | 707 (5.9%) | 488 (4.0%) |
| $1,000 to $1,499 | 639 (5.4%) | 488 (4.0%) |
| $1,500 to $1,999 | 380 (3.2%) | 14 (0.1%) |
| $2,000 to $2,499 | 109 (0.9%) | 28 (0.2%) |
| $2,500 to $2,999 | 70 (0.6%) | 0 (0.0%) |
| $3,000 or more | 91 (0.8%) | 0 (0.0%) |
| Total | 11,930 (100.0%) | 12,342 (100.0%) |
Physical Housing Characteristics in Mayaguez
Housing Structures in Mayaguez
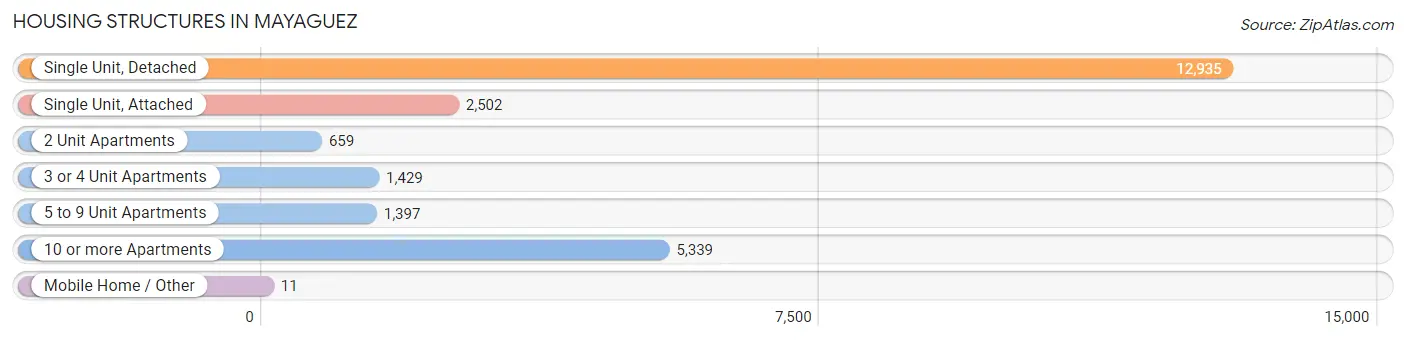
| Structure Type | # Housing Units | % Housing Units |
| Single Unit, Detached | 12,935 | 53.3% |
| Single Unit, Attached | 2,502 | 10.3% |
| 2 Unit Apartments | 659 | 2.7% |
| 3 or 4 Unit Apartments | 1,429 | 5.9% |
| 5 to 9 Unit Apartments | 1,397 | 5.8% |
| 10 or more Apartments | 5,339 | 22.0% |
| Mobile Home / Other | 11 | 0.1% |
| Total | 24,272 | 100.0% |
Housing Structures by Occupancy in Mayaguez
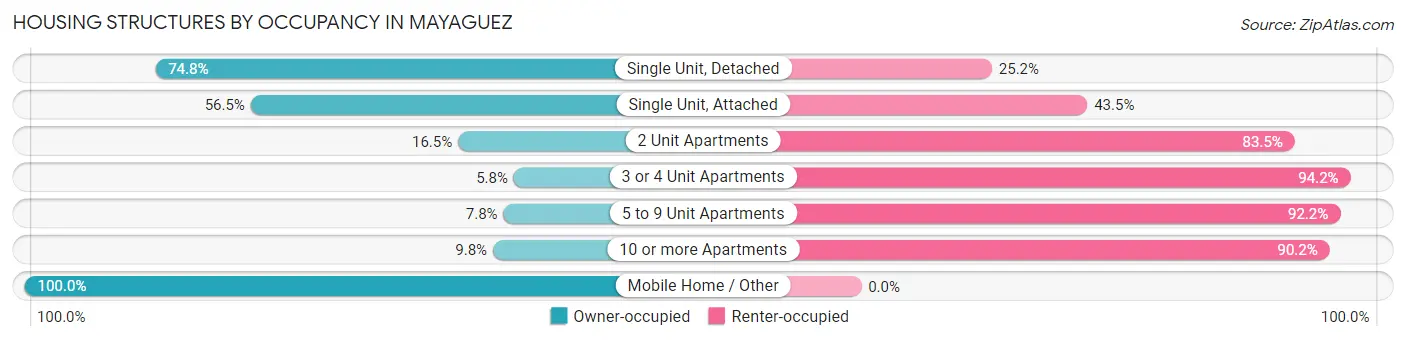
| Structure Type | Owner-occupied | Renter-occupied |
| Single Unit, Detached | 9,680 (74.8%) | 3,255 (25.2%) |
| Single Unit, Attached | 1,413 (56.5%) | 1,089 (43.5%) |
| 2 Unit Apartments | 109 (16.5%) | 550 (83.5%) |
| 3 or 4 Unit Apartments | 83 (5.8%) | 1,346 (94.2%) |
| 5 to 9 Unit Apartments | 109 (7.8%) | 1,288 (92.2%) |
| 10 or more Apartments | 525 (9.8%) | 4,814 (90.2%) |
| Mobile Home / Other | 11 (100.0%) | 0 (0.0%) |
| Total | 11,930 (49.1%) | 12,342 (50.8%) |
Housing Structures by Number of Rooms in Mayaguez
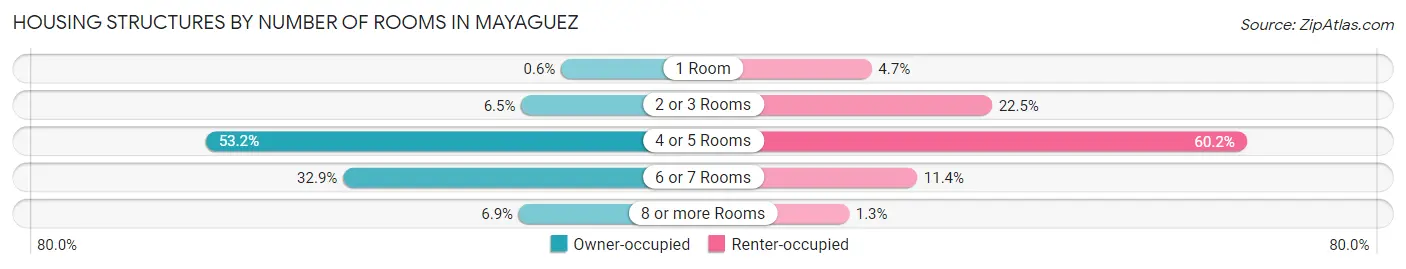
| Number of Rooms | Owner-occupied | Renter-occupied |
| 1 Room | 72 (0.6%) | 575 (4.7%) |
| 2 or 3 Rooms | 776 (6.5%) | 2,772 (22.5%) |
| 4 or 5 Rooms | 6,345 (53.2%) | 7,427 (60.2%) |
| 6 or 7 Rooms | 3,920 (32.9%) | 1,406 (11.4%) |
| 8 or more Rooms | 817 (6.9%) | 162 (1.3%) |
| Total | 11,930 (100.0%) | 12,342 (100.0%) |
Housing Structure by Heating Type in Mayaguez
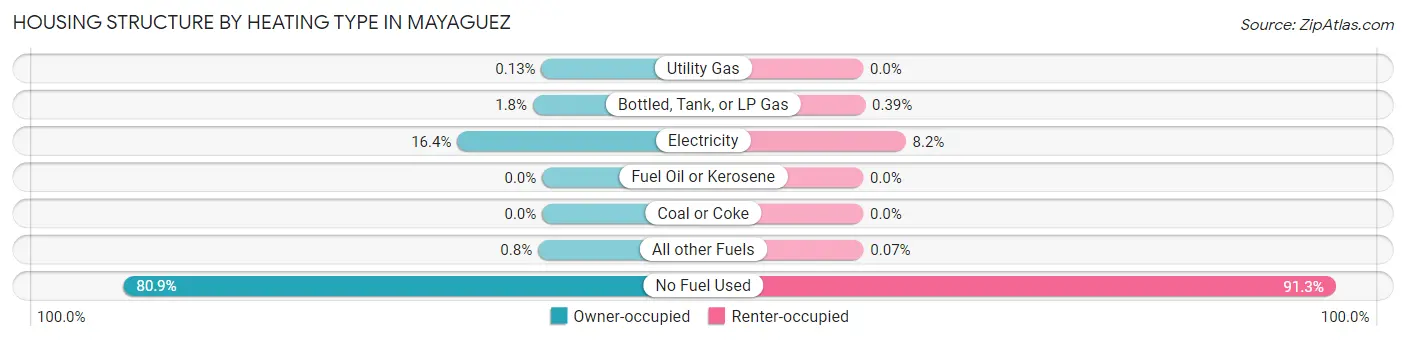
| Heating Type | Owner-occupied | Renter-occupied |
| Utility Gas | 15 (0.1%) | 0 (0.0%) |
| Bottled, Tank, or LP Gas | 212 (1.8%) | 48 (0.4%) |
| Electricity | 1,956 (16.4%) | 1,016 (8.2%) |
| Fuel Oil or Kerosene | 0 (0.0%) | 0 (0.0%) |
| Coal or Coke | 0 (0.0%) | 0 (0.0%) |
| All other Fuels | 95 (0.8%) | 9 (0.1%) |
| No Fuel Used | 9,652 (80.9%) | 11,269 (91.3%) |
| Total | 11,930 (100.0%) | 12,342 (100.0%) |
Household Vehicle Usage in Mayaguez
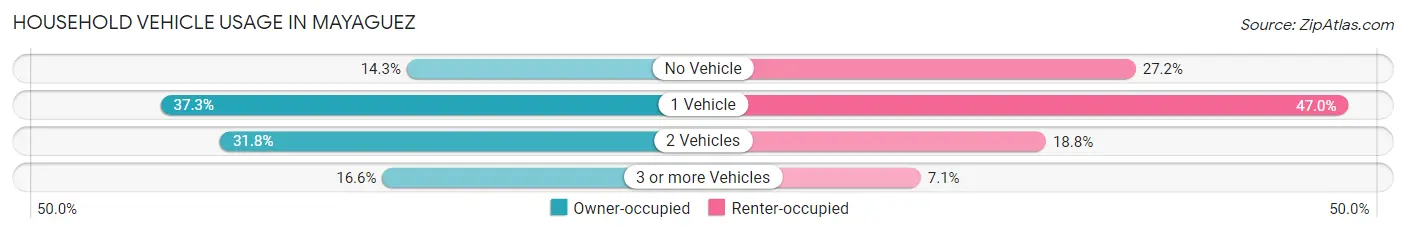
| Vehicles per Household | Owner-occupied | Renter-occupied |
| No Vehicle | 1,710 (14.3%) | 3,351 (27.2%) |
| 1 Vehicle | 4,450 (37.3%) | 5,799 (47.0%) |
| 2 Vehicles | 3,789 (31.8%) | 2,317 (18.8%) |
| 3 or more Vehicles | 1,981 (16.6%) | 875 (7.1%) |
| Total | 11,930 (100.0%) | 12,342 (100.0%) |
Real Estate & Mortgages in Mayaguez
Real Estate and Mortgage Overview in Mayaguez
| Characteristic | Without Mortgage | With Mortgage |
| Housing Units | 8,603 | 3,327 |
| Median Property Value | $100,800 | $140,800 |
| Median Household Income | $22,684 | $238 |
| Monthly Housing Costs | $182 | $85 |
| Real Estate Taxes | $663 | $2,384 |
Property Value by Mortgage Status in Mayaguez
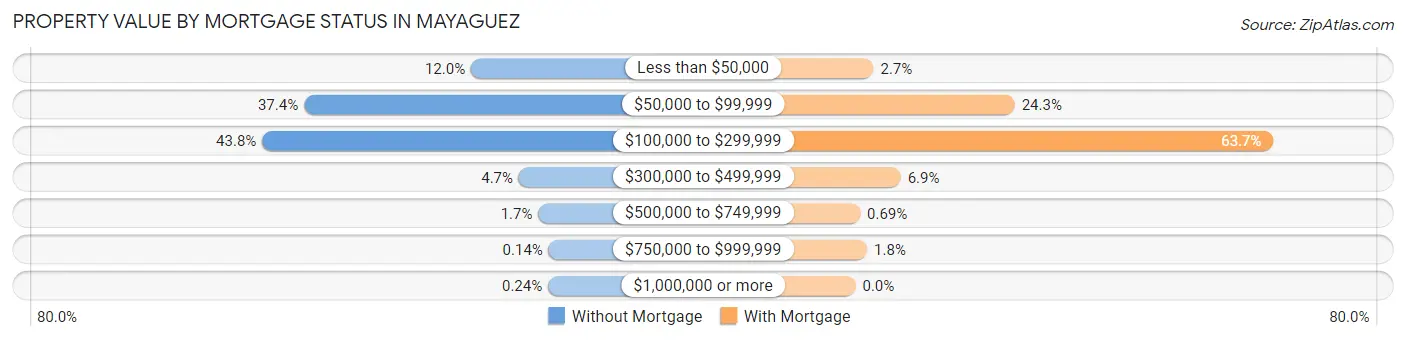
| Property Value | Without Mortgage | With Mortgage |
| Less than $50,000 | 1,031 (12.0%) | 91 (2.7%) |
| $50,000 to $99,999 | 3,220 (37.4%) | 807 (24.3%) |
| $100,000 to $299,999 | 3,768 (43.8%) | 2,118 (63.7%) |
| $300,000 to $499,999 | 403 (4.7%) | 229 (6.9%) |
| $500,000 to $749,999 | 148 (1.7%) | 23 (0.7%) |
| $750,000 to $999,999 | 12 (0.1%) | 59 (1.8%) |
| $1,000,000 or more | 21 (0.2%) | 0 (0.0%) |
| Total | 8,603 (100.0%) | 3,327 (100.0%) |
Household Income by Mortgage Status in Mayaguez
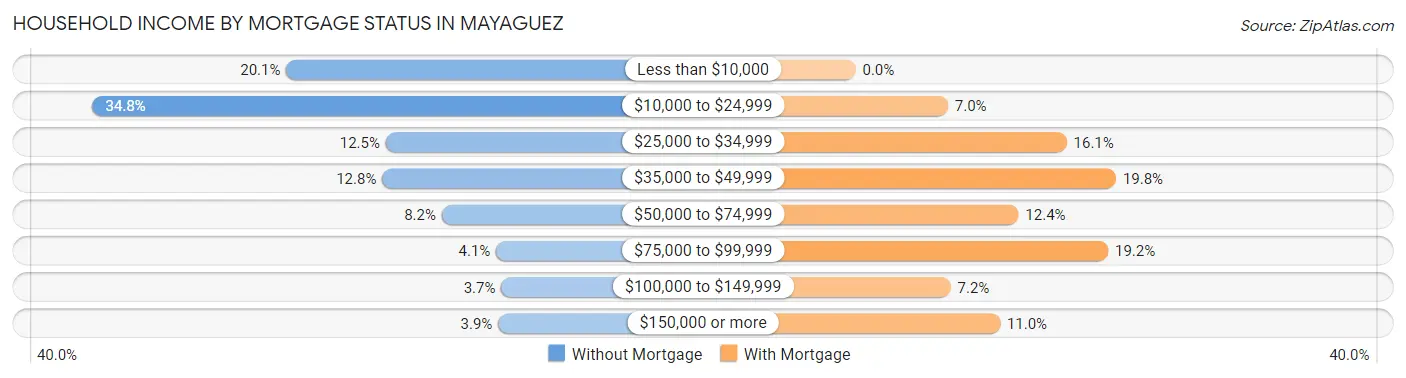
| Household Income | Without Mortgage | With Mortgage |
| Less than $10,000 | 1,726 (20.1%) | 0 (0.0%) |
| $10,000 to $24,999 | 2,996 (34.8%) | 234 (7.0%) |
| $25,000 to $34,999 | 1,074 (12.5%) | 535 (16.1%) |
| $35,000 to $49,999 | 1,097 (12.8%) | 660 (19.8%) |
| $50,000 to $74,999 | 706 (8.2%) | 413 (12.4%) |
| $75,000 to $99,999 | 350 (4.1%) | 640 (19.2%) |
| $100,000 to $149,999 | 317 (3.7%) | 241 (7.2%) |
| $150,000 or more | 337 (3.9%) | 366 (11.0%) |
| Total | 8,603 (100.0%) | 3,327 (100.0%) |
Property Value to Household Income Ratio in Mayaguez
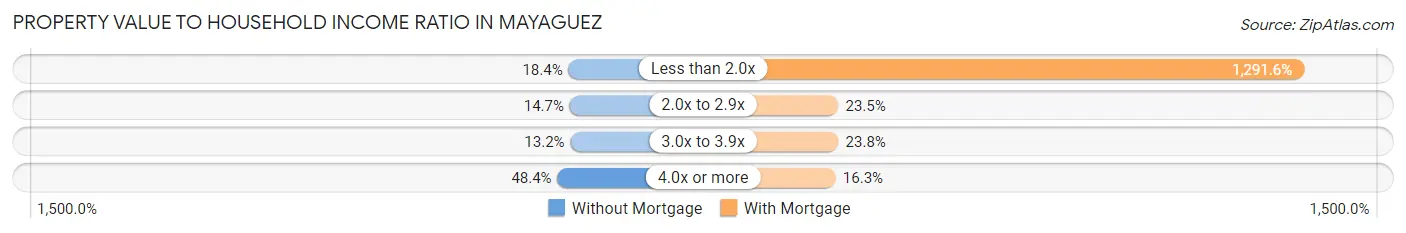
| Value-to-Income Ratio | Without Mortgage | With Mortgage |
| Less than 2.0x | 1,579 (18.3%) | 42,971 (1,291.6%) |
| 2.0x to 2.9x | 1,267 (14.7%) | 781 (23.5%) |
| 3.0x to 3.9x | 1,134 (13.2%) | 790 (23.7%) |
| 4.0x or more | 4,164 (48.4%) | 543 (16.3%) |
| Total | 8,603 (100.0%) | 3,327 (100.0%) |
Real Estate Taxes by Mortgage Status in Mayaguez
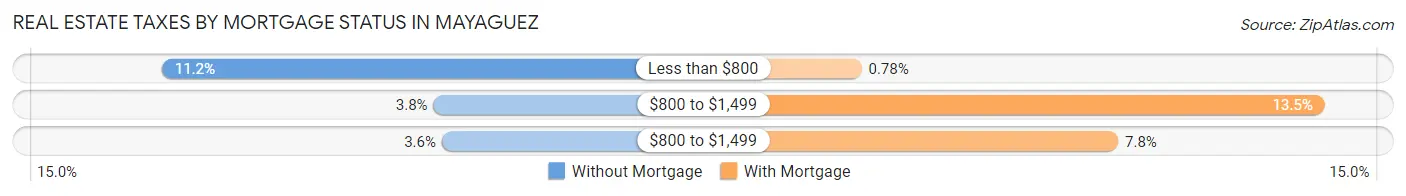
| Property Taxes | Without Mortgage | With Mortgage |
| Less than $800 | 967 (11.2%) | 26 (0.8%) |
| $800 to $1,499 | 327 (3.8%) | 448 (13.5%) |
| $800 to $1,499 | 307 (3.6%) | 260 (7.8%) |
| Total | 8,603 (100.0%) | 3,327 (100.0%) |
Health & Disability in Mayaguez
Health Insurance Coverage by Age in Mayaguez
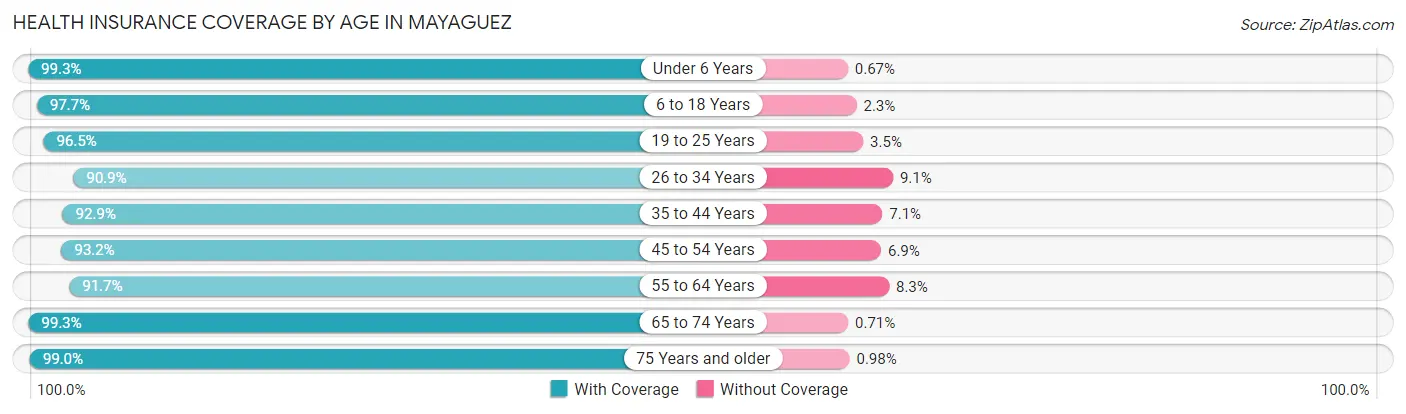
| Age Bracket | With Coverage | Without Coverage |
| Under 6 Years | 2,650 (99.3%) | 18 (0.7%) |
| 6 to 18 Years | 8,060 (97.7%) | 188 (2.3%) |
| 19 to 25 Years | 9,787 (96.5%) | 357 (3.5%) |
| 26 to 34 Years | 5,285 (90.9%) | 528 (9.1%) |
| 35 to 44 Years | 5,307 (92.9%) | 405 (7.1%) |
| 45 to 54 Years | 5,354 (93.1%) | 394 (6.9%) |
| 55 to 64 Years | 6,536 (91.7%) | 595 (8.3%) |
| 65 to 74 Years | 6,727 (99.3%) | 48 (0.7%) |
| 75 Years and older | 7,099 (99.0%) | 70 (1.0%) |
| Total | 56,805 (95.6%) | 2,603 (4.4%) |
Health Insurance Coverage by Citizenship Status in Mayaguez
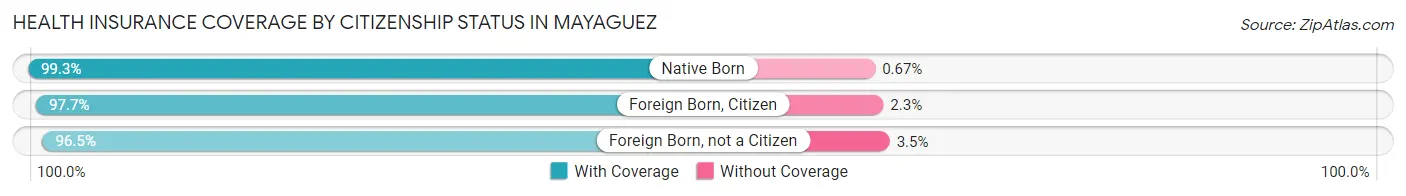
| Citizenship Status | With Coverage | Without Coverage |
| Native Born | 2,650 (99.3%) | 18 (0.7%) |
| Foreign Born, Citizen | 8,060 (97.7%) | 188 (2.3%) |
| Foreign Born, not a Citizen | 9,787 (96.5%) | 357 (3.5%) |
Health Insurance Coverage by Household Income in Mayaguez
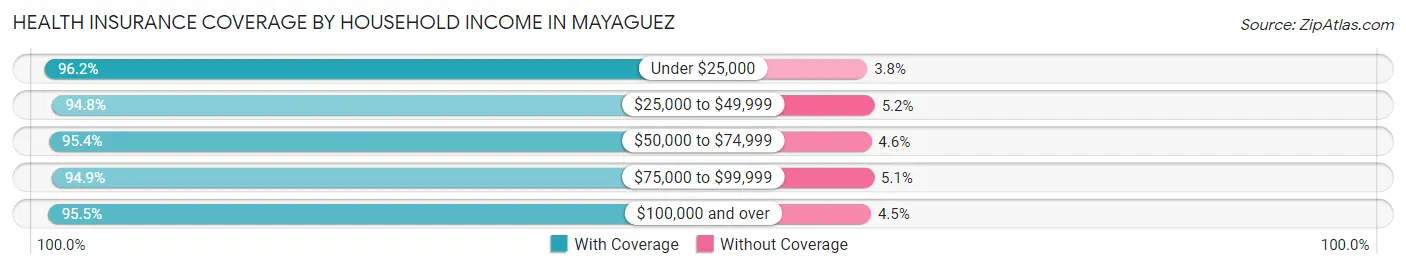
| Household Income | With Coverage | Without Coverage |
| Under $25,000 | 31,497 (96.2%) | 1,254 (3.8%) |
| $25,000 to $49,999 | 12,580 (94.8%) | 694 (5.2%) |
| $50,000 to $74,999 | 5,735 (95.4%) | 277 (4.6%) |
| $75,000 to $99,999 | 2,283 (94.9%) | 123 (5.1%) |
| $100,000 and over | 4,193 (95.5%) | 199 (4.5%) |
Public vs Private Health Insurance Coverage by Age in Mayaguez
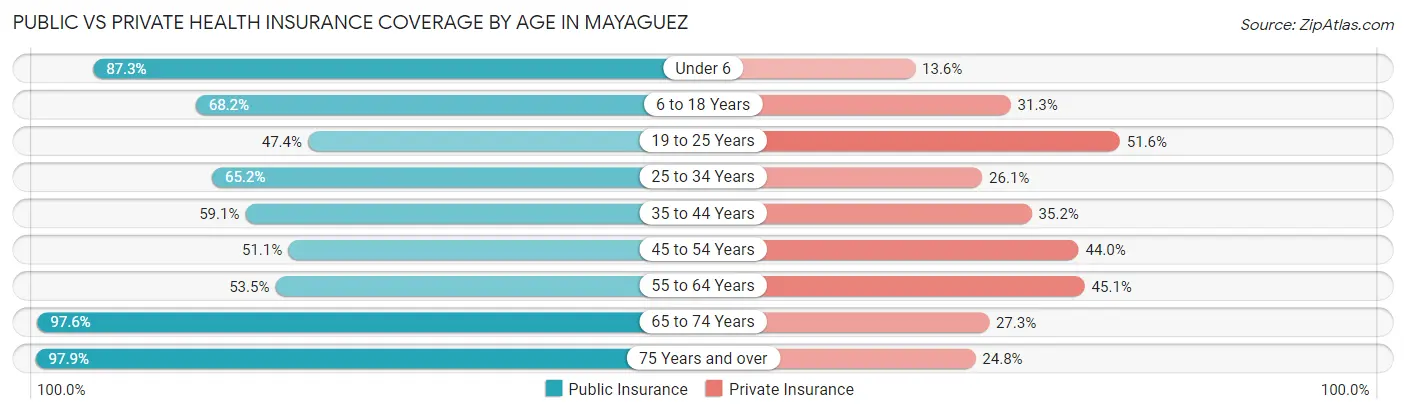
| Age Bracket | Public Insurance | Private Insurance |
| Under 6 | 2,328 (87.3%) | 363 (13.6%) |
| 6 to 18 Years | 5,627 (68.2%) | 2,584 (31.3%) |
| 19 to 25 Years | 4,811 (47.4%) | 5,235 (51.6%) |
| 25 to 34 Years | 3,790 (65.2%) | 1,514 (26.1%) |
| 35 to 44 Years | 3,373 (59.1%) | 2,013 (35.2%) |
| 45 to 54 Years | 2,937 (51.1%) | 2,526 (44.0%) |
| 55 to 64 Years | 3,814 (53.5%) | 3,215 (45.1%) |
| 65 to 74 Years | 6,614 (97.6%) | 1,851 (27.3%) |
| 75 Years and over | 7,021 (97.9%) | 1,778 (24.8%) |
| Total | 40,315 (67.9%) | 21,079 (35.5%) |
Disability Status by Sex by Age in Mayaguez
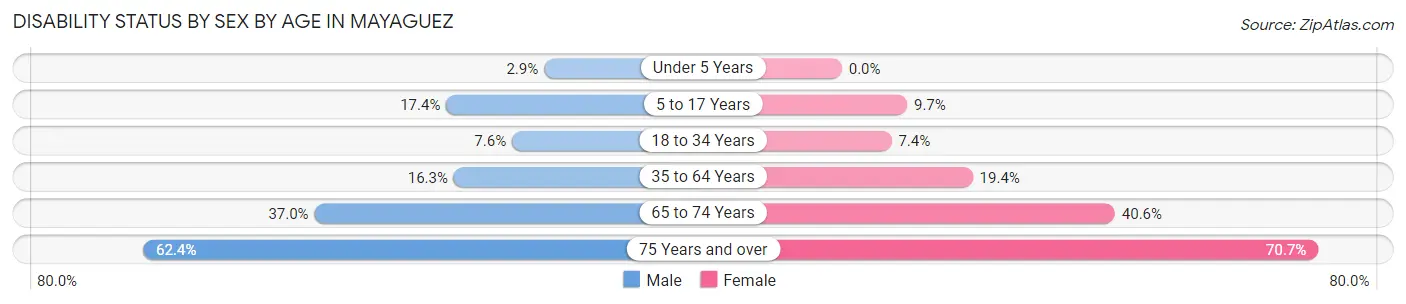
| Age Bracket | Male | Female |
| Under 5 Years | 33 (2.9%) | 0 (0.0%) |
| 5 to 17 Years | 665 (17.4%) | 364 (9.7%) |
| 18 to 34 Years | 695 (7.6%) | 594 (7.4%) |
| 35 to 64 Years | 1,377 (16.3%) | 1,968 (19.4%) |
| 65 to 74 Years | 1,137 (37.0%) | 1,500 (40.6%) |
| 75 Years and over | 1,662 (62.4%) | 3,187 (70.7%) |
Disability Class by Sex by Age in Mayaguez
Disability Class: Hearing Difficulty
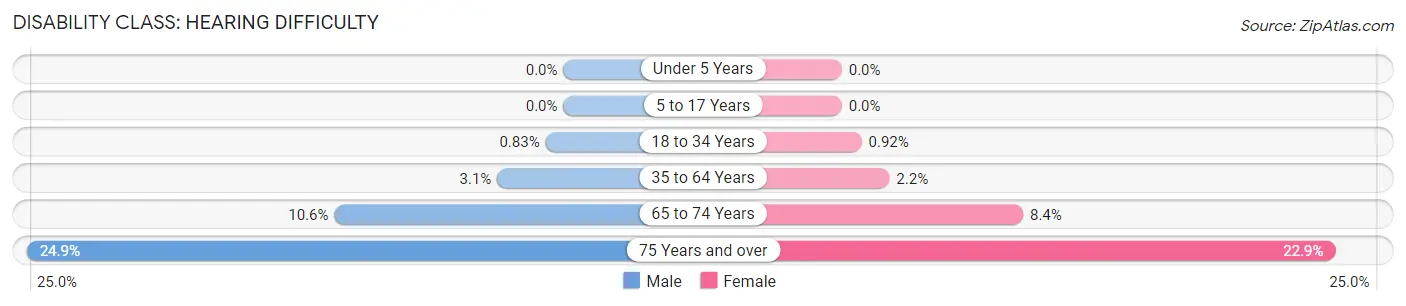
| Age Bracket | Male | Female |
| Under 5 Years | 0 (0.0%) | 0 (0.0%) |
| 5 to 17 Years | 0 (0.0%) | 0 (0.0%) |
| 18 to 34 Years | 76 (0.8%) | 74 (0.9%) |
| 35 to 64 Years | 260 (3.1%) | 224 (2.2%) |
| 65 to 74 Years | 327 (10.6%) | 311 (8.4%) |
| 75 Years and over | 663 (24.9%) | 1,032 (22.9%) |
Disability Class: Vision Difficulty
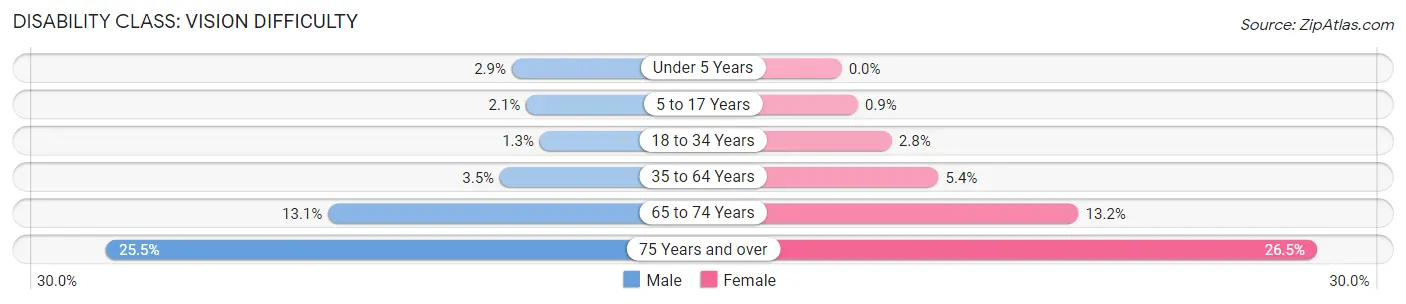
| Age Bracket | Male | Female |
| Under 5 Years | 33 (2.9%) | 0 (0.0%) |
| 5 to 17 Years | 79 (2.1%) | 34 (0.9%) |
| 18 to 34 Years | 119 (1.3%) | 225 (2.8%) |
| 35 to 64 Years | 299 (3.5%) | 546 (5.4%) |
| 65 to 74 Years | 403 (13.1%) | 488 (13.2%) |
| 75 Years and over | 678 (25.5%) | 1,192 (26.5%) |
Disability Class: Cognitive Difficulty
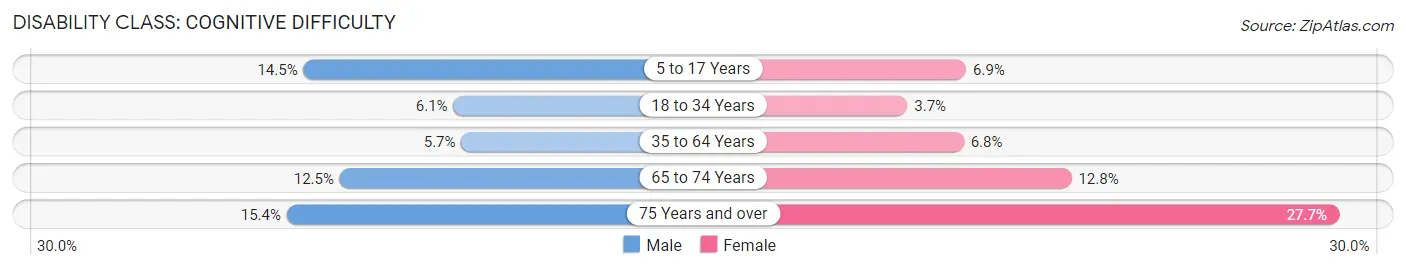
| Age Bracket | Male | Female |
| 5 to 17 Years | 553 (14.5%) | 260 (6.9%) |
| 18 to 34 Years | 557 (6.1%) | 294 (3.6%) |
| 35 to 64 Years | 481 (5.7%) | 688 (6.8%) |
| 65 to 74 Years | 383 (12.4%) | 473 (12.8%) |
| 75 Years and over | 410 (15.4%) | 1,247 (27.7%) |
Disability Class: Ambulatory Difficulty
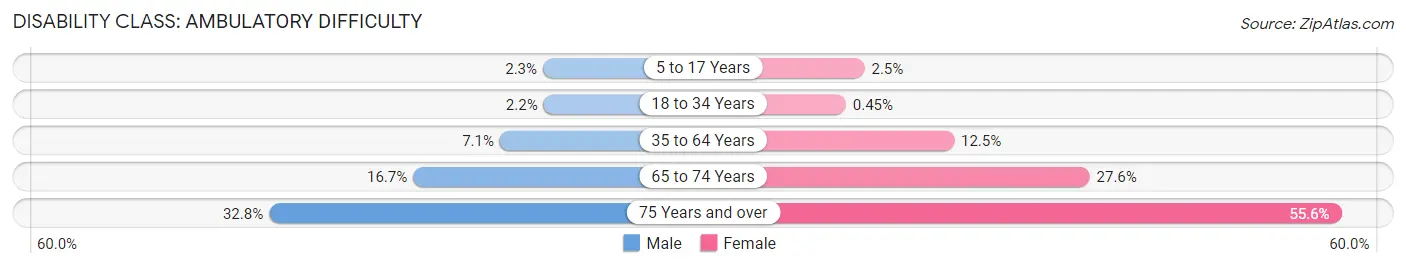
| Age Bracket | Male | Female |
| 5 to 17 Years | 87 (2.3%) | 95 (2.5%) |
| 18 to 34 Years | 201 (2.2%) | 36 (0.4%) |
| 35 to 64 Years | 599 (7.1%) | 1,266 (12.5%) |
| 65 to 74 Years | 515 (16.7%) | 1,021 (27.6%) |
| 75 Years and over | 873 (32.8%) | 2,507 (55.6%) |
Disability Class: Self-Care Difficulty
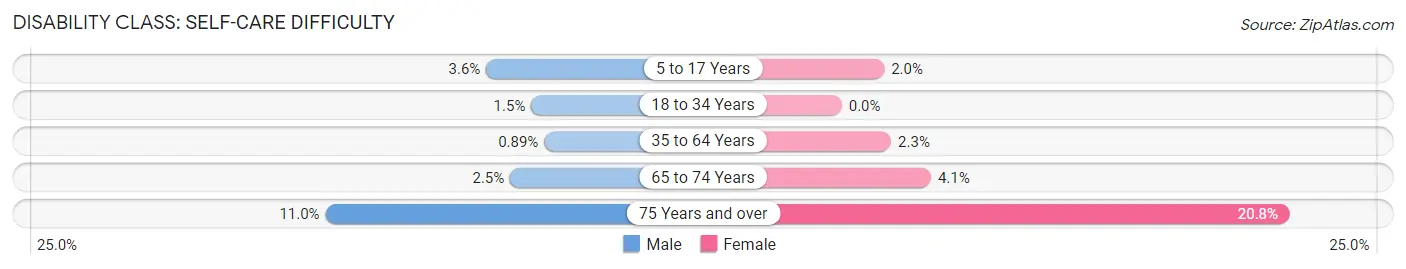
| Age Bracket | Male | Female |
| 5 to 17 Years | 137 (3.6%) | 74 (2.0%) |
| 18 to 34 Years | 136 (1.5%) | 0 (0.0%) |
| 35 to 64 Years | 75 (0.9%) | 232 (2.3%) |
| 65 to 74 Years | 76 (2.5%) | 153 (4.1%) |
| 75 Years and over | 294 (11.0%) | 937 (20.8%) |
Technology Access in Mayaguez
Computing Device Access in Mayaguez
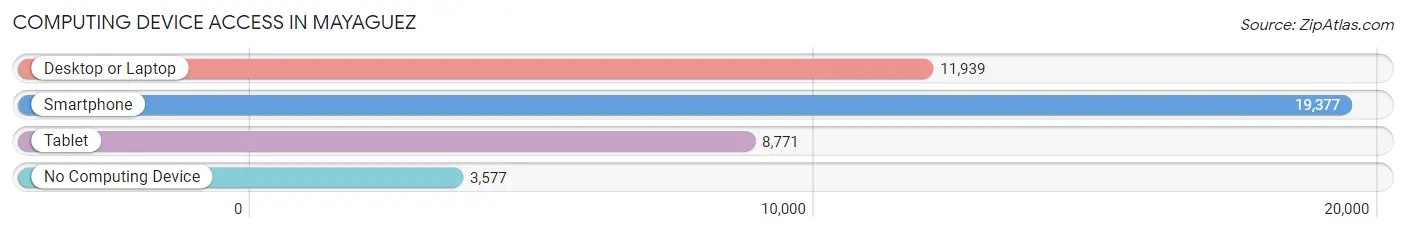
| Device Type | # Households | % Households |
| Desktop or Laptop | 11,939 | 49.2% |
| Smartphone | 19,377 | 79.8% |
| Tablet | 8,771 | 36.1% |
| No Computing Device | 3,577 | 14.7% |
| Total | 24,272 | 100.0% |
Internet Access in Mayaguez
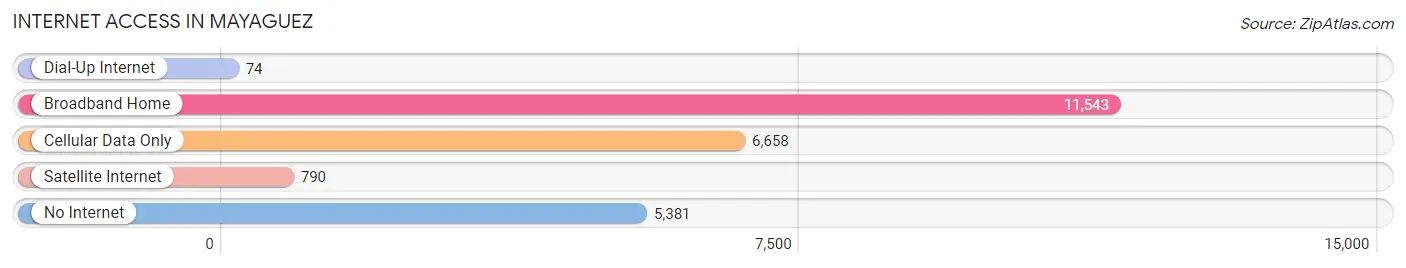
| Internet Type | # Households | % Households |
| Dial-Up Internet | 74 | 0.3% |
| Broadband Home | 11,543 | 47.6% |
| Cellular Data Only | 6,658 | 27.4% |
| Satellite Internet | 790 | 3.3% |
| No Internet | 5,381 | 22.2% |
| Total | 24,272 | 100.0% |
Mayaguez Summary
Mayaguez, Puerto Rico is a city located on the western coast of the island of Puerto Rico. It is the third-largest city in the country, with a population of approximately 100,000 people. The city is known for its vibrant culture, beautiful beaches, and rich history.
History
Mayaguez was founded in 1760 by Don Miguel de Muesas, a Spanish military officer. The city was named after the Mayaguez River, which runs through the city. The city was originally a small fishing village, but it quickly grew in size and importance. By the late 19th century, Mayaguez had become an important port city, and it was the site of the first sugar mill in Puerto Rico.
In 1898, the United States invaded Puerto Rico during the Spanish-American War. Mayaguez was the site of a major battle between the US and Spanish forces. The US forces were victorious, and the city was occupied by the US military until 1902.
In the early 20th century, Mayaguez experienced a period of rapid growth and development. The city became an important center for the sugar industry, and it was also home to several large factories. The city was also the site of the first public university in Puerto Rico, the University of Puerto Rico at Mayaguez.
Geography
Mayaguez is located on the western coast of Puerto Rico, about halfway between the capital city of San Juan and the city of Ponce. The city is situated on the Mayaguez River, which runs through the city and empties into the Caribbean Sea. The city is surrounded by lush tropical forests and mountains, and it is known for its beautiful beaches.
Economy
Mayaguez is an important economic center in Puerto Rico. The city is home to several large factories, including a Coca-Cola bottling plant and a pharmaceutical plant. The city is also home to several large shopping malls, and it is a popular tourist destination. The city is also home to the University of Puerto Rico at Mayaguez, which is an important source of employment and economic activity.
Demographics
As of the 2010 census, the population of Mayaguez was approximately 100,000 people. The city is predominantly Hispanic, with a large majority of the population being of Puerto Rican descent. The city also has a significant African-American population, as well as a small but growing population of immigrants from other countries. The city is also home to a large number of students, as the University of Puerto Rico at Mayaguez is located in the city.
Common Questions
What is Per Capita Income in Mayaguez?
Per Capita income in Mayaguez is $13,853.
What is the Median Family Income in Mayaguez?
Median Family Income in Mayaguez is $23,489.
What is the Median Household income in Mayaguez?
Median Household Income in Mayaguez is $16,191.
What is Income or Wage Gap in Mayaguez?
Income or Wage Gap in Mayaguez is 5.0%.
Women in Mayaguez earn 95.0 cents for every dollar earned by a man.
What is Family Income Deficit in Mayaguez?
Family Income Deficit in Mayaguez is $12,552.
Families that are below poverty line in Mayaguez earn $12,552 less on average than the poverty threshold level.
What is Inequality or Gini Index in Mayaguez?
Inequality or Gini Index in Mayaguez is 0.64.
What is the Total Population of Mayaguez?
Total Population of Mayaguez is 60,062.
What is the Total Male Population of Mayaguez?
Total Male Population of Mayaguez is 28,625.
What is the Total Female Population of Mayaguez?
Total Female Population of Mayaguez is 31,437.
What is the Ratio of Males per 100 Females in Mayaguez?
There are 91.06 Males per 100 Females in Mayaguez.
What is the Ratio of Females per 100 Males in Mayaguez?
There are 109.82 Females per 100 Males in Mayaguez.
What is the Median Population Age in Mayaguez?
Median Population Age in Mayaguez is 40.9 Years.
What is the Average Family Size in Mayaguez
Average Family Size in Mayaguez is 3.2 People.
What is the Average Household Size in Mayaguez
Average Household Size in Mayaguez is 2.4 People.
How Large is the Labor Force in Mayaguez?
There are 21,372 People in the Labor Forcein in Mayaguez.
What is the Percentage of People in the Labor Force in Mayaguez?
41.1% of People are in the Labor Force in Mayaguez.
What is the Unemployment Rate in Mayaguez?
Unemployment Rate in Mayaguez is 24.5%.