Arroyo, PR Map & Demographics
Arroyo Map
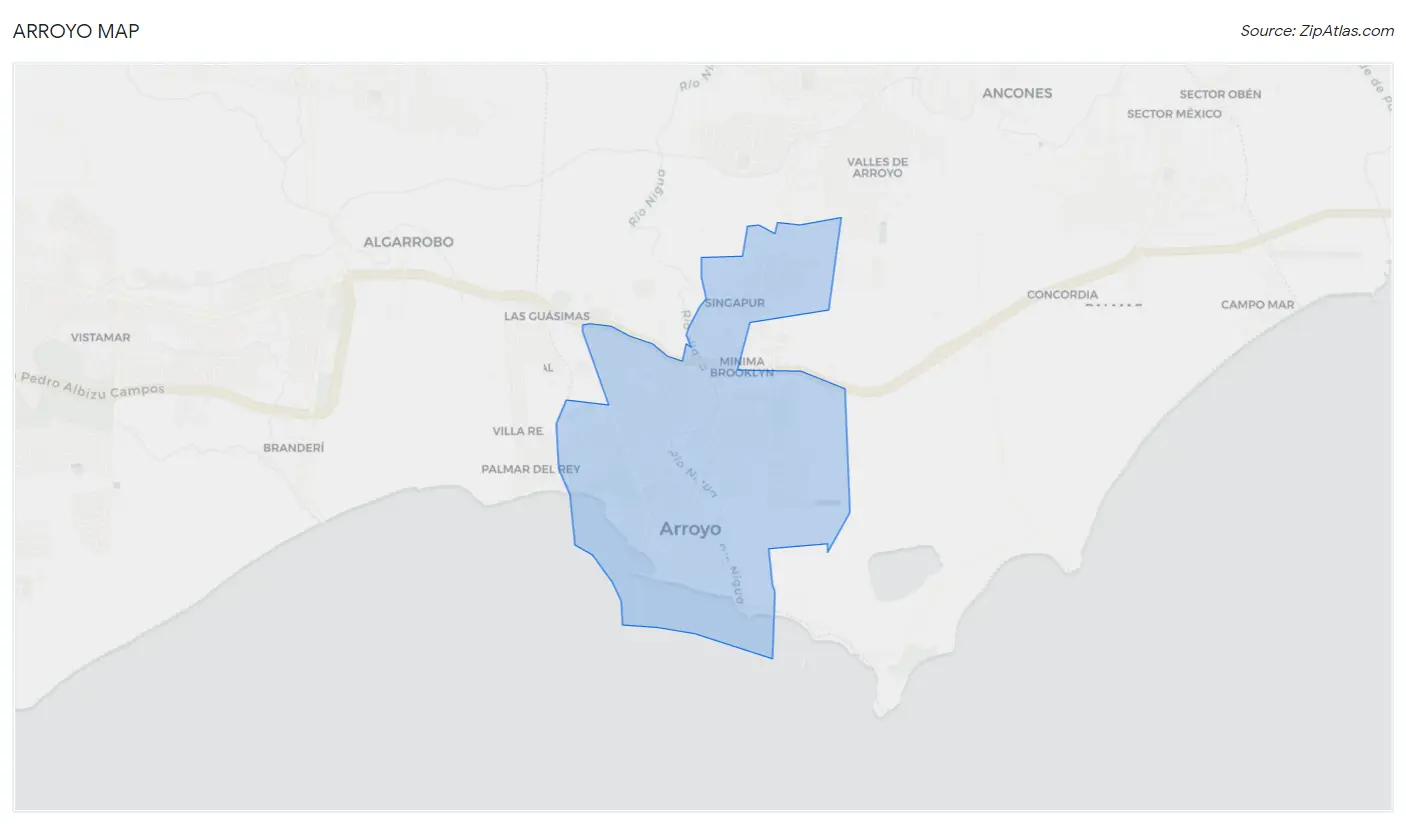
Arroyo Overview
$13,943
PER CAPITA INCOME
$19,335
AVG FAMILY INCOME
$17,090
AVG HOUSEHOLD INCOME
22.4%
WAGE / INCOME GAP [ % ]
77.6¢/ $1
WAGE / INCOME GAP [ $ ]
$13,045
FAMILY INCOME DEFICIT
0.65
INEQUALITY / GINI INDEX
7,818
TOTAL POPULATION
3,631
MALE POPULATION
4,187
FEMALE POPULATION
86.72
MALES / 100 FEMALES
115.31
FEMALES / 100 MALES
40.5
MEDIAN AGE
3.1
AVG FAMILY SIZE
2.6
AVG HOUSEHOLD SIZE
2,166
LABOR FORCE [ PEOPLE ]
32.9%
PERCENT IN LABOR FORCE
18.5%
UNEMPLOYMENT RATE
Arroyo Zip Codes
Income in Arroyo
Income Overview in Arroyo
Per Capita Income in Arroyo is $13,943, while median incomes of families and households are $19,335 and $17,090 respectively.
| Characteristic | Number | Measure |
| Per Capita Income | 7,818 | $13,943 |
| Median Family Income | 2,077 | $19,335 |
| Mean Family Income | 2,077 | $29,862 |
| Median Household Income | 3,019 | $17,090 |
| Mean Household Income | 3,019 | $34,457 |
| Income Deficit | 2,077 | $13,045 |
| Wage / Income Gap (%) | 7,818 | 22.35% |
| Wage / Income Gap ($) | 7,818 | 77.65¢ per $1 |
| Gini / Inequality Index | 7,818 | 0.65 |
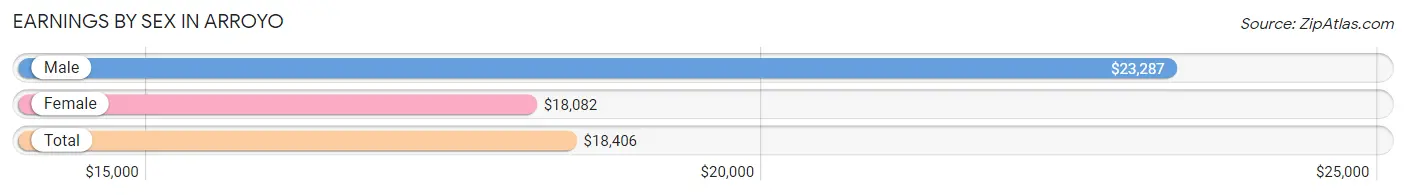
Earnings by Sex in Arroyo
Average Earnings in Arroyo are $18,406, $23,287 for men and $18,082 for women, a difference of 22.4%.
| Sex | Number | Average Earnings |
| Male | 810 (41.2%) | $23,287 |
| Female | 1,155 (58.8%) | $18,082 |
| Total | 1,965 (100.0%) | $18,406 |
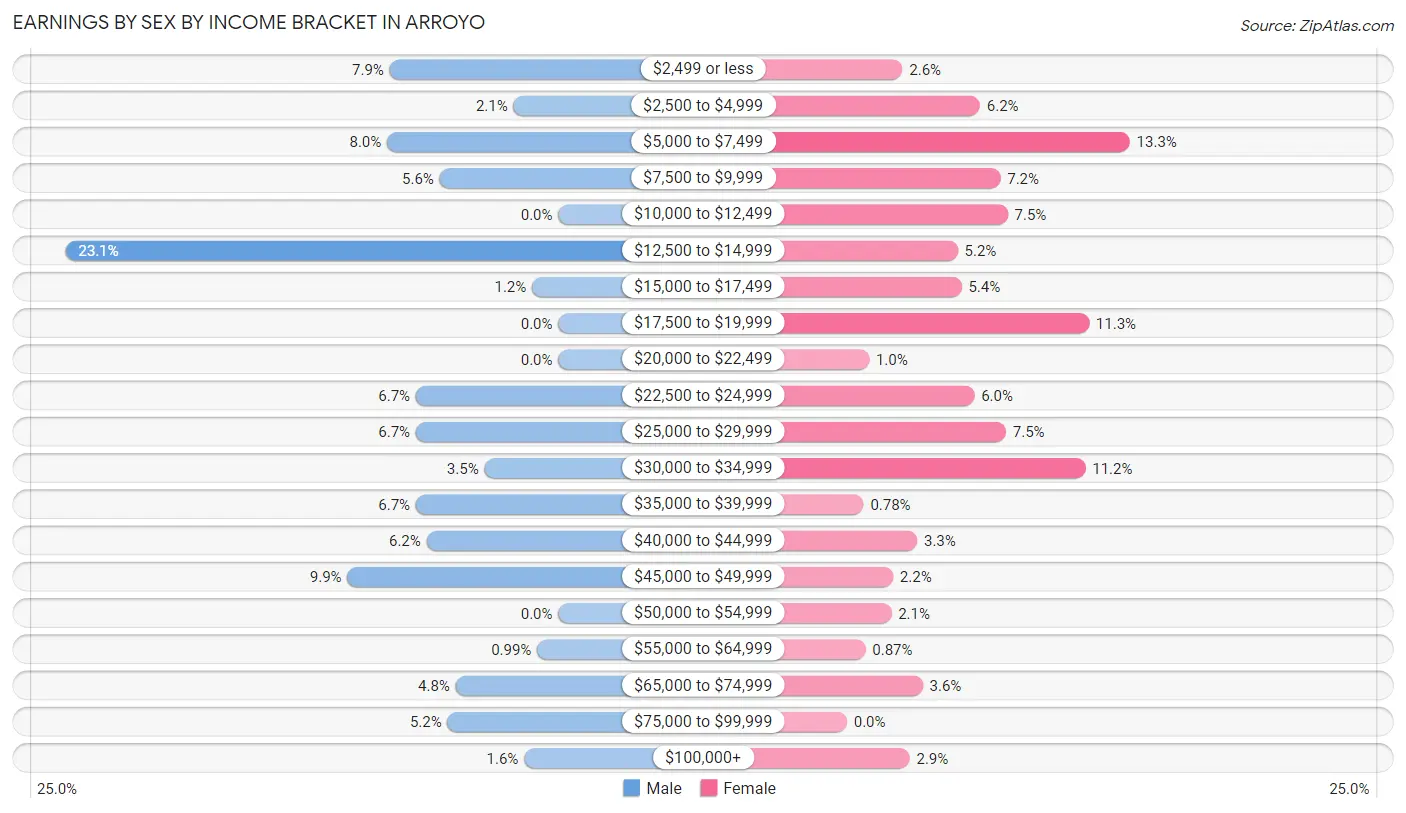
Earnings by Sex by Income Bracket in Arroyo
The most common earnings brackets in Arroyo are $12,500 to $14,999 for men (187 | 23.1%) and $5,000 to $7,499 for women (153 | 13.3%).
| Income | Male | Female |
| $2,499 or less | 64 (7.9%) | 30 (2.6%) |
| $2,500 to $4,999 | 17 (2.1%) | 72 (6.2%) |
| $5,000 to $7,499 | 65 (8.0%) | 153 (13.3%) |
| $7,500 to $9,999 | 45 (5.6%) | 83 (7.2%) |
| $10,000 to $12,499 | 0 (0.0%) | 87 (7.5%) |
| $12,500 to $14,999 | 187 (23.1%) | 60 (5.2%) |
| $15,000 to $17,499 | 10 (1.2%) | 62 (5.4%) |
| $17,500 to $19,999 | 0 (0.0%) | 131 (11.3%) |
| $20,000 to $22,499 | 0 (0.0%) | 12 (1.0%) |
| $22,500 to $24,999 | 54 (6.7%) | 69 (6.0%) |
| $25,000 to $29,999 | 54 (6.7%) | 86 (7.4%) |
| $30,000 to $34,999 | 28 (3.5%) | 129 (11.2%) |
| $35,000 to $39,999 | 54 (6.7%) | 9 (0.8%) |
| $40,000 to $44,999 | 50 (6.2%) | 38 (3.3%) |
| $45,000 to $49,999 | 80 (9.9%) | 25 (2.2%) |
| $50,000 to $54,999 | 0 (0.0%) | 24 (2.1%) |
| $55,000 to $64,999 | 8 (1.0%) | 10 (0.9%) |
| $65,000 to $74,999 | 39 (4.8%) | 41 (3.5%) |
| $75,000 to $99,999 | 42 (5.2%) | 0 (0.0%) |
| $100,000+ | 13 (1.6%) | 34 (2.9%) |
| Total | 810 (100.0%) | 1,155 (100.0%) |
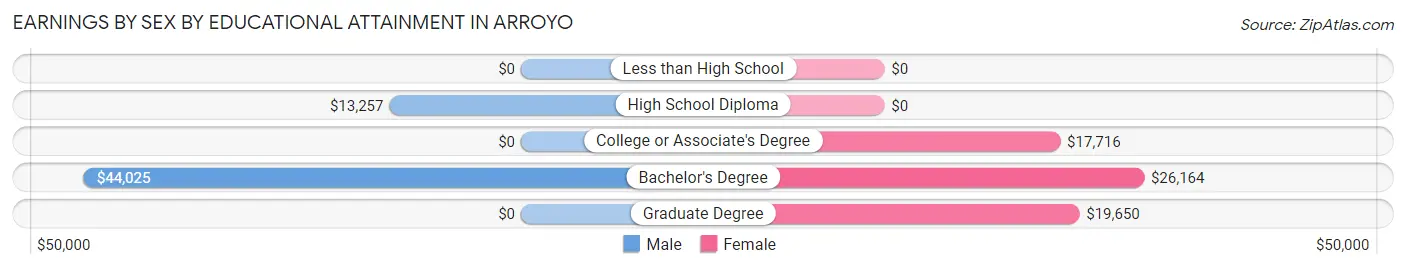
Earnings by Sex by Educational Attainment in Arroyo
Average earnings in Arroyo are $24,745 for men and $18,235 for women, a difference of 26.3%. Men with an educational attainment of bachelor's degree enjoy the highest average annual earnings of $44,025, while those with high school diploma education earn the least with $13,257. Women with an educational attainment of bachelor's degree earn the most with the average annual earnings of $26,164, while those with college or associate's degree education have the smallest earnings of $17,716.
| Educational Attainment | Male Income | Female Income |
| Less than High School | - | - |
| High School Diploma | $13,257 | $0 |
| College or Associate's Degree | - | - |
| Bachelor's Degree | $44,025 | $26,164 |
| Graduate Degree | - | - |
| Total | $24,745 | $18,235 |
Family Income in Arroyo
Family Income Brackets in Arroyo
According to the Arroyo family income data, there are 594 families falling into the less than $10,000 income range, which is the most common income bracket and makes up 28.6% of all families.
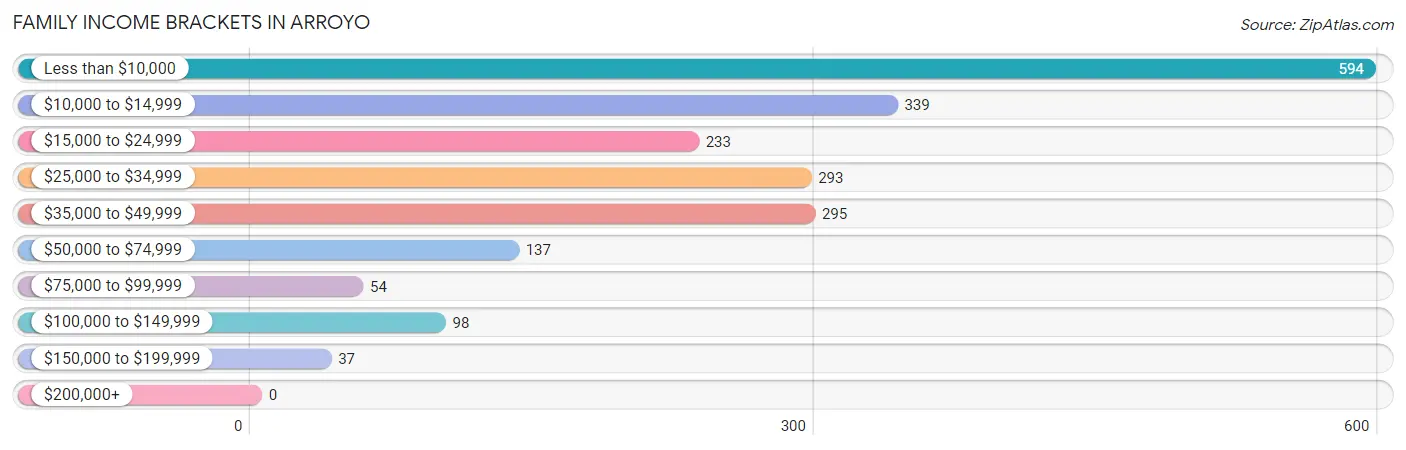
| Income Bracket | # Families | % Families |
| Less than $10,000 | 594 | 28.6% |
| $10,000 to $14,999 | 339 | 16.3% |
| $15,000 to $24,999 | 233 | 11.2% |
| $25,000 to $34,999 | 293 | 14.1% |
| $35,000 to $49,999 | 295 | 14.2% |
| $50,000 to $74,999 | 137 | 6.6% |
| $75,000 to $99,999 | 54 | 2.6% |
| $100,000 to $149,999 | 98 | 4.7% |
| $150,000 to $199,999 | 37 | 1.8% |
| $200,000+ | 0 | 0.0% |
Family Income by Famaliy Size in Arroyo
4-person families (272 | 13.1%) account for the highest median family income in Arroyo with $51,447 per family, while 4-person families (272 | 13.1%) have the highest median income of $12,862 per family member.
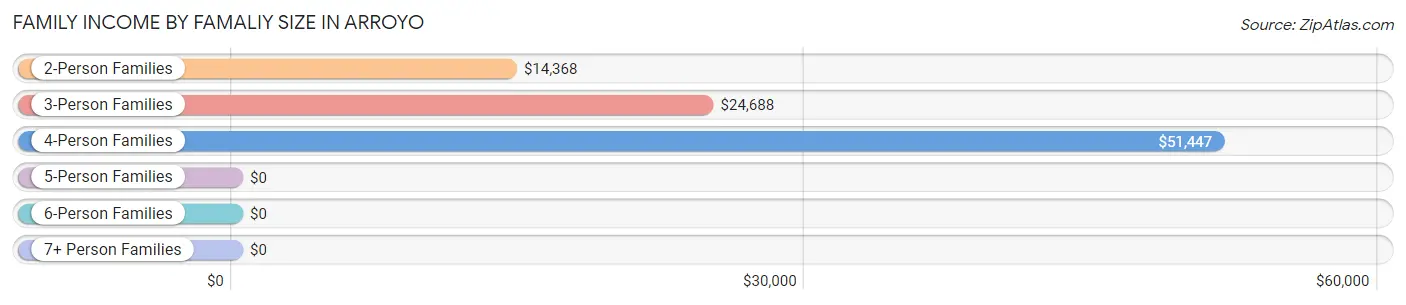
| Income Bracket | # Families | Median Income |
| 2-Person Families | 1,022 (49.2%) | $14,368 |
| 3-Person Families | 656 (31.6%) | $24,688 |
| 4-Person Families | 272 (13.1%) | $51,447 |
| 5-Person Families | 75 (3.6%) | $0 |
| 6-Person Families | 31 (1.5%) | $0 |
| 7+ Person Families | 21 (1.0%) | $0 |
| Total | 2,077 (100.0%) | $19,335 |
Family Income by Number of Earners in Arroyo
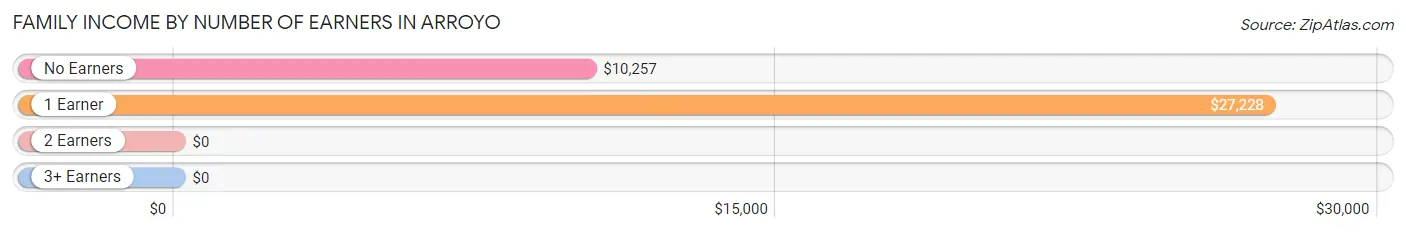
| Number of Earners | # Families | Median Income |
| No Earners | 940 (45.3%) | $10,257 |
| 1 Earner | 877 (42.2%) | $27,228 |
| 2 Earners | 260 (12.5%) | $0 |
| 3+ Earners | 0 (0.0%) | $0 |
| Total | 2,077 (100.0%) | $19,335 |
Household Income in Arroyo
Household Income Brackets in Arroyo
With 987 households falling in the category, the less than $10,000 income range is the most frequent in Arroyo, accounting for 32.7% of all households. In contrast, only 21 households (0.7%) fall into the $200,000+ income bracket, making it the least populous group.
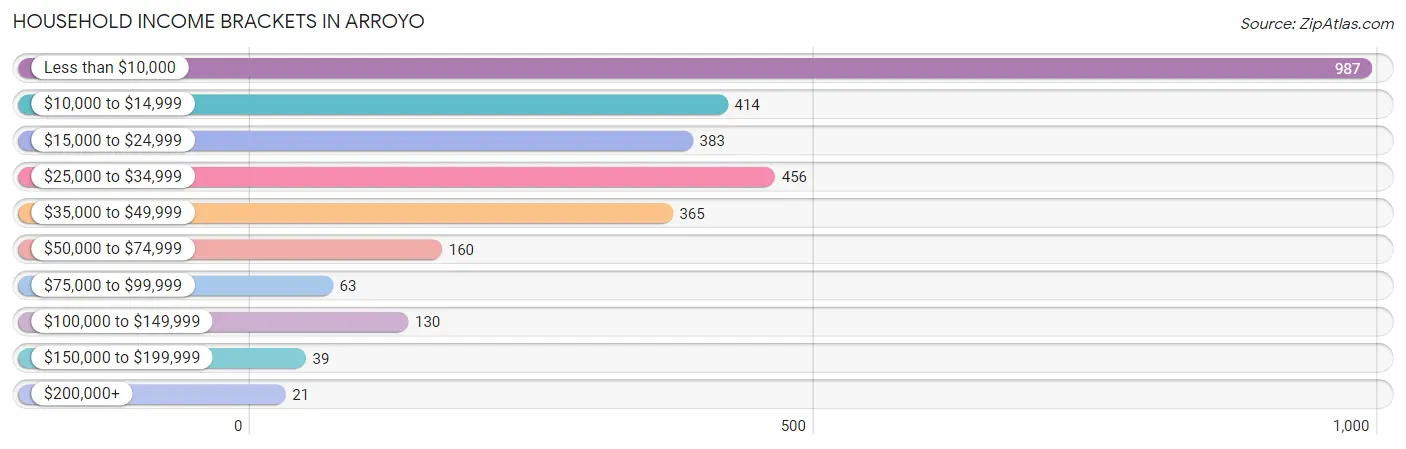
| Income Bracket | # Households | % Households |
| Less than $10,000 | 987 | 32.7% |
| $10,000 to $14,999 | 414 | 13.7% |
| $15,000 to $24,999 | 383 | 12.7% |
| $25,000 to $34,999 | 456 | 15.1% |
| $35,000 to $49,999 | 365 | 12.1% |
| $50,000 to $74,999 | 160 | 5.3% |
| $75,000 to $99,999 | 63 | 2.1% |
| $100,000 to $149,999 | 130 | 4.3% |
| $150,000 to $199,999 | 39 | 1.3% |
| $200,000+ | 21 | 0.7% |
Household Income by Householder Age in Arroyo
The median household income in Arroyo is $17,090, with the highest median household income of $18,703 found in the 25 to 44 years age bracket for the primary householder. A total of 810 households (26.8%) fall into this category. Meanwhile, the 15 to 24 years age bracket for the primary householder has the lowest median household income of $2,499, with 80 households (2.6%) in this group.
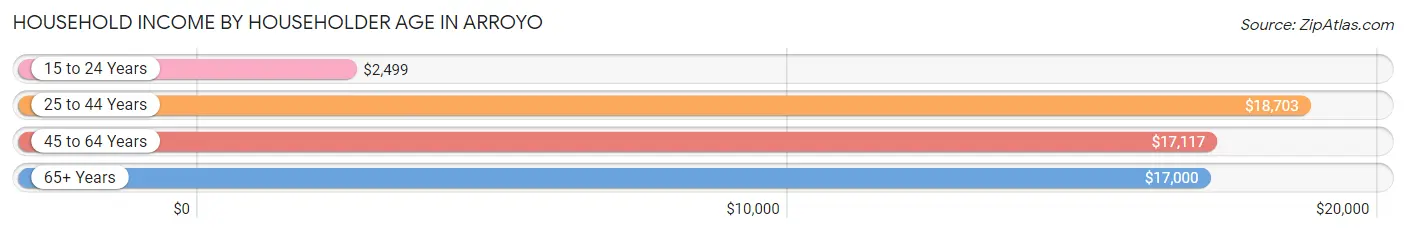
| Income Bracket | # Households | Median Income |
| 15 to 24 Years | 80 (2.6%) | $2,499 |
| 25 to 44 Years | 810 (26.8%) | $18,703 |
| 45 to 64 Years | 945 (31.3%) | $17,117 |
| 65+ Years | 1,184 (39.2%) | $17,000 |
| Total | 3,019 (100.0%) | $17,090 |
Poverty in Arroyo
Income Below Poverty by Sex and Age in Arroyo
With 55.4% poverty level for males and 57.9% for females among the residents of Arroyo, 5 year old males and under 5 year old females are the most vulnerable to poverty, with 34 males (100.0%) and 123 females (100.0%) in their respective age groups living below the poverty level.
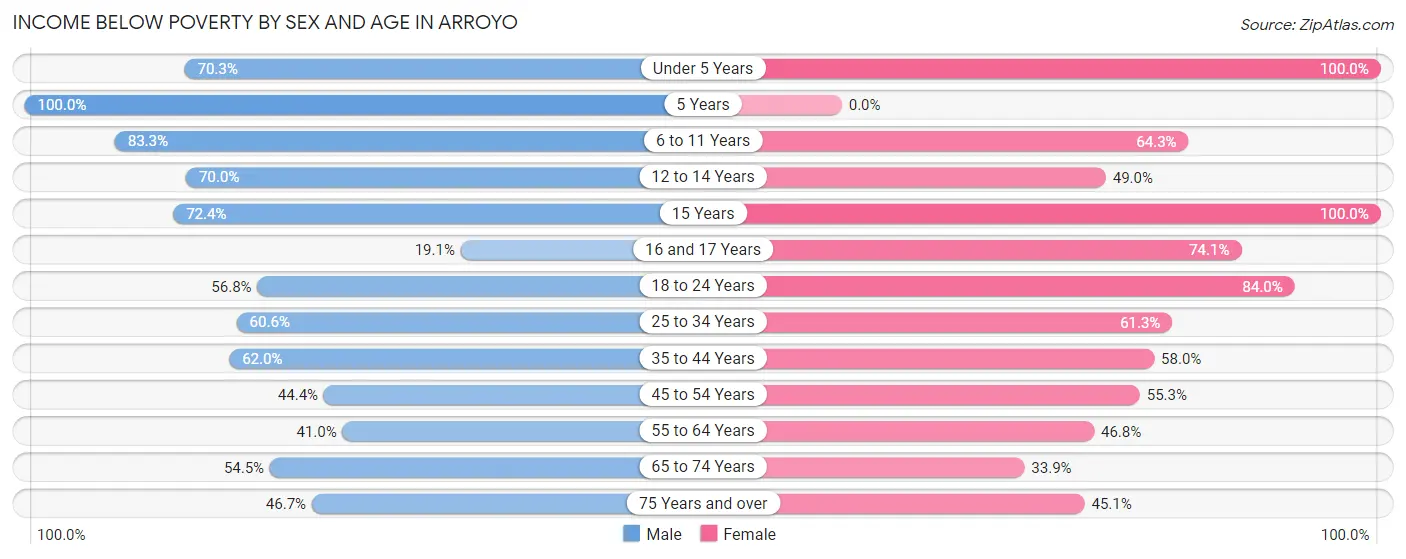
| Age Bracket | Male | Female |
| Under 5 Years | 116 (70.3%) | 123 (100.0%) |
| 5 Years | 34 (100.0%) | 0 (0.0%) |
| 6 to 11 Years | 174 (83.3%) | 166 (64.3%) |
| 12 to 14 Years | 180 (70.0%) | 49 (49.0%) |
| 15 Years | 21 (72.4%) | 46 (100.0%) |
| 16 and 17 Years | 28 (19.1%) | 86 (74.1%) |
| 18 to 24 Years | 255 (56.8%) | 358 (84.0%) |
| 25 to 34 Years | 271 (60.6%) | 371 (61.3%) |
| 35 to 44 Years | 258 (62.0%) | 374 (58.0%) |
| 45 to 54 Years | 244 (44.4%) | 302 (55.3%) |
| 55 to 64 Years | 132 (41.0%) | 184 (46.8%) |
| 65 to 74 Years | 110 (54.5%) | 139 (33.9%) |
| 75 Years and over | 189 (46.7%) | 228 (45.1%) |
| Total | 2,012 (55.4%) | 2,426 (57.9%) |
Income Above Poverty by Sex and Age in Arroyo
According to the poverty statistics in Arroyo, males aged 16 and 17 years and females aged 5 years are the age groups that are most secure financially, with 80.9% of males and 100.0% of females in these age groups living above the poverty line.
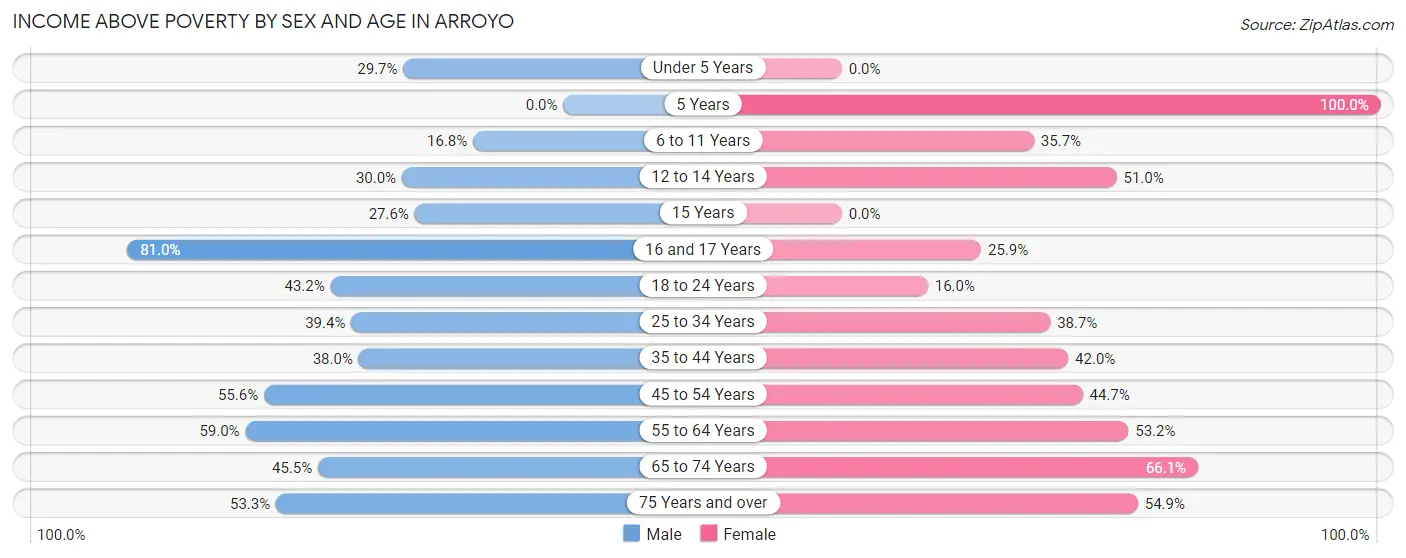
| Age Bracket | Male | Female |
| Under 5 Years | 49 (29.7%) | 0 (0.0%) |
| 5 Years | 0 (0.0%) | 13 (100.0%) |
| 6 to 11 Years | 35 (16.8%) | 92 (35.7%) |
| 12 to 14 Years | 77 (30.0%) | 51 (51.0%) |
| 15 Years | 8 (27.6%) | 0 (0.0%) |
| 16 and 17 Years | 119 (80.9%) | 30 (25.9%) |
| 18 to 24 Years | 194 (43.2%) | 68 (16.0%) |
| 25 to 34 Years | 176 (39.4%) | 234 (38.7%) |
| 35 to 44 Years | 158 (38.0%) | 271 (42.0%) |
| 45 to 54 Years | 305 (55.6%) | 244 (44.7%) |
| 55 to 64 Years | 190 (59.0%) | 209 (53.2%) |
| 65 to 74 Years | 92 (45.5%) | 271 (66.1%) |
| 75 Years and over | 216 (53.3%) | 278 (54.9%) |
| Total | 1,619 (44.6%) | 1,761 (42.1%) |
Income Below Poverty Among Married-Couple Families in Arroyo
The poverty statistics for married-couple families in Arroyo show that 29.2% or 265 of the total 908 families live below the poverty line. Families with 3 or 4 children have the highest poverty rate of 100.0%, comprising of 21 families. On the other hand, families with 1 or 2 children have the lowest poverty rate of 15.5%, which includes 51 families.
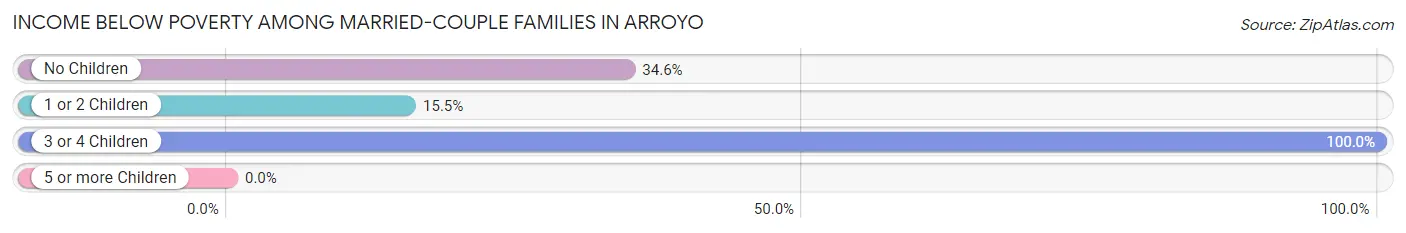
| Children | Above Poverty | Below Poverty |
| No Children | 365 (65.4%) | 193 (34.6%) |
| 1 or 2 Children | 278 (84.5%) | 51 (15.5%) |
| 3 or 4 Children | 0 (0.0%) | 21 (100.0%) |
| 5 or more Children | 0 (0.0%) | 0 (0.0%) |
| Total | 643 (70.8%) | 265 (29.2%) |
Income Below Poverty Among Single-Parent Households in Arroyo
According to the poverty data in Arroyo, 63.2% or 129 single-father households and 76.4% or 737 single-mother households are living below the poverty line. Among single-father households, those with 1 or 2 children have the highest poverty rate, with 75 households (100.0%) experiencing poverty. Likewise, among single-mother households, those with 3 or 4 children have the highest poverty rate, with 35 households (100.0%) falling below the poverty line.
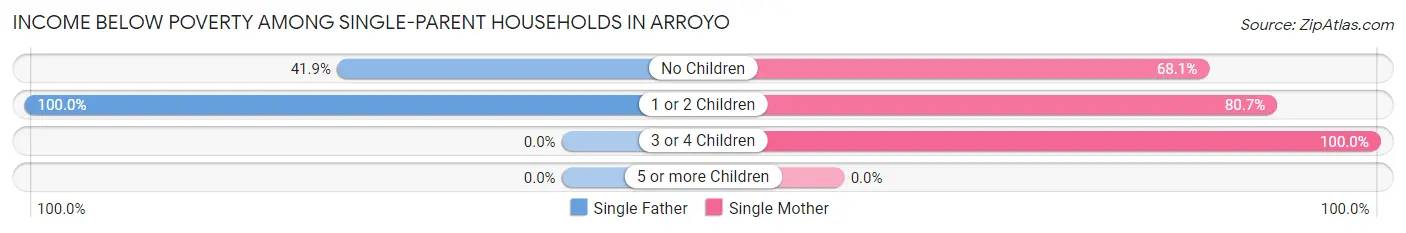
| Children | Single Father | Single Mother |
| No Children | 54 (41.9%) | 262 (68.0%) |
| 1 or 2 Children | 75 (100.0%) | 440 (80.7%) |
| 3 or 4 Children | 0 (0.0%) | 35 (100.0%) |
| 5 or more Children | 0 (0.0%) | 0 (0.0%) |
| Total | 129 (63.2%) | 737 (76.4%) |
Income Below Poverty Among Married-Couple vs Single-Parent Households in Arroyo
The poverty data for Arroyo shows that 265 of the married-couple family households (29.2%) and 866 of the single-parent households (74.1%) are living below the poverty level. Within the married-couple family households, those with 3 or 4 children have the highest poverty rate, with 21 households (100.0%) falling below the poverty line. Among the single-parent households, those with 3 or 4 children have the highest poverty rate, with 35 household (100.0%) living below poverty.
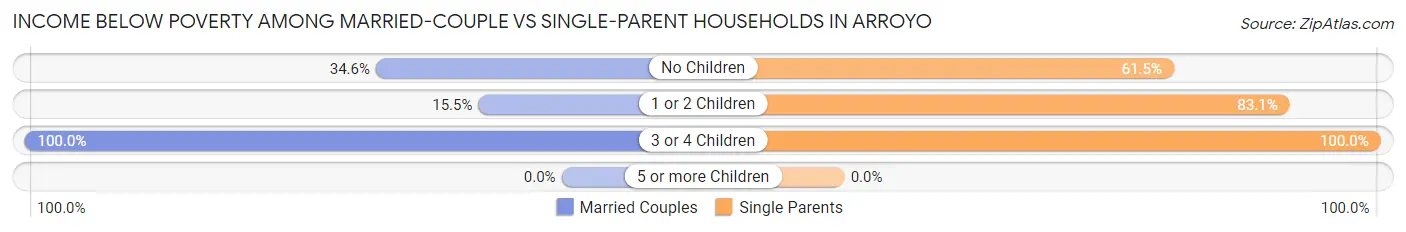
| Children | Married-Couple Families | Single-Parent Households |
| No Children | 193 (34.6%) | 316 (61.5%) |
| 1 or 2 Children | 51 (15.5%) | 515 (83.1%) |
| 3 or 4 Children | 21 (100.0%) | 35 (100.0%) |
| 5 or more Children | 0 (0.0%) | 0 (0.0%) |
| Total | 265 (29.2%) | 866 (74.1%) |
Race in Arroyo
The most populous races in Arroyo are Hispanic or Latino (7,746 | 99.1%), White / Caucasian (3,931 | 50.3%), and Black / African American (1,628 | 20.8%).
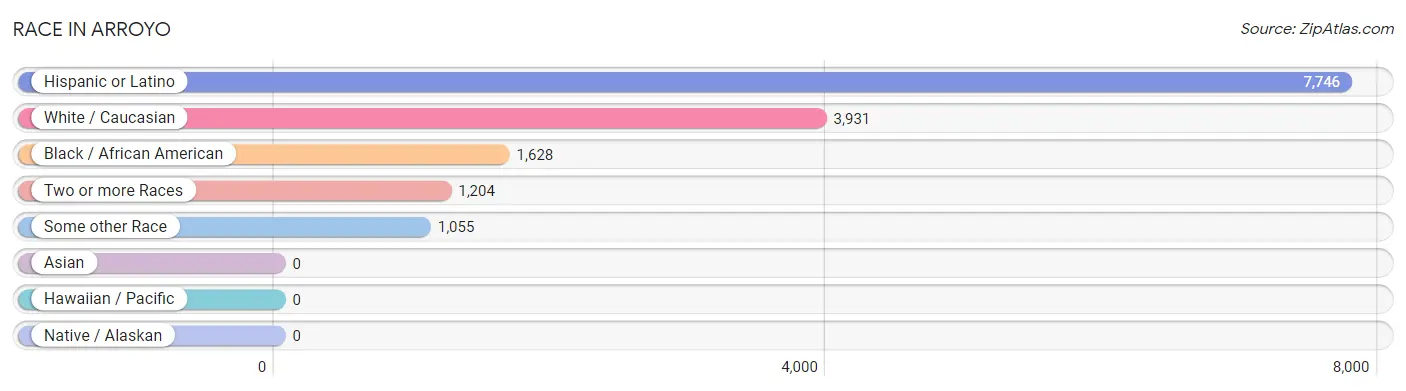
| Race | # Population | % Population |
| Asian | 0 | 0.0% |
| Black / African American | 1,628 | 20.8% |
| Hawaiian / Pacific | 0 | 0.0% |
| Hispanic or Latino | 7,746 | 99.1% |
| Native / Alaskan | 0 | 0.0% |
| White / Caucasian | 3,931 | 50.3% |
| Two or more Races | 1,204 | 15.4% |
| Some other Race | 1,055 | 13.5% |
| Total | 7,818 | 100.0% |
Ancestry in Arroyo
The most populous ancestries reported in Arroyo are Puerto Rican (7,711 | 98.6%), American (48 | 0.6%), Mexican American Indian (38 | 0.5%), Colombian (17 | 0.2%), and Mexican (17 | 0.2%), together accounting for 100.2% of all Arroyo residents.
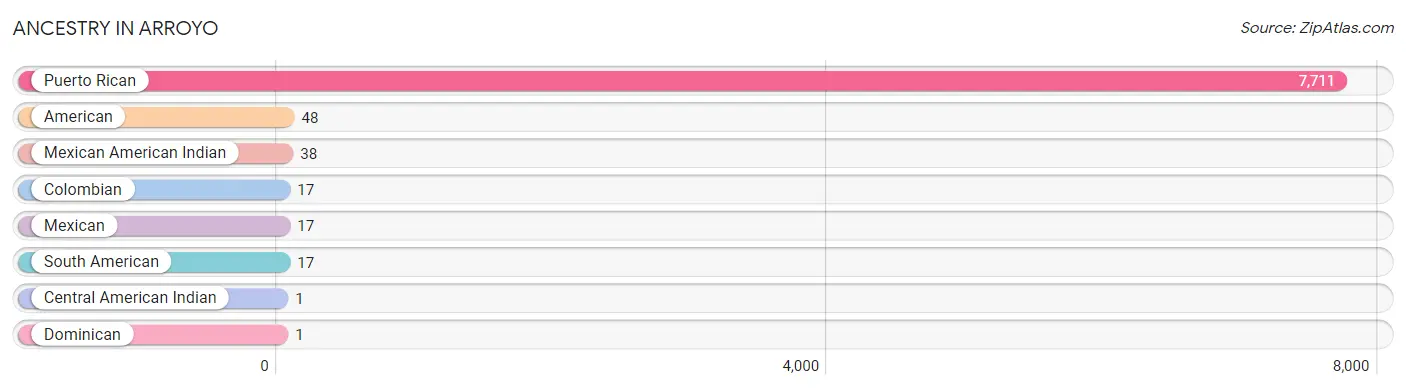
| Ancestry | # Population | % Population |
| American | 48 | 0.6% |
| Central American Indian | 1 | 0.0% |
| Colombian | 17 | 0.2% |
| Dominican | 1 | 0.0% |
| Mexican | 17 | 0.2% |
| Mexican American Indian | 38 | 0.5% |
| Puerto Rican | 7,711 | 98.6% |
| South American | 17 | 0.2% | View All 8 Rows |
Immigrants in Arroyo

| Immigration Origin | # Population | % Population | View All 0 Rows |
Sex and Age in Arroyo
Sex and Age in Arroyo
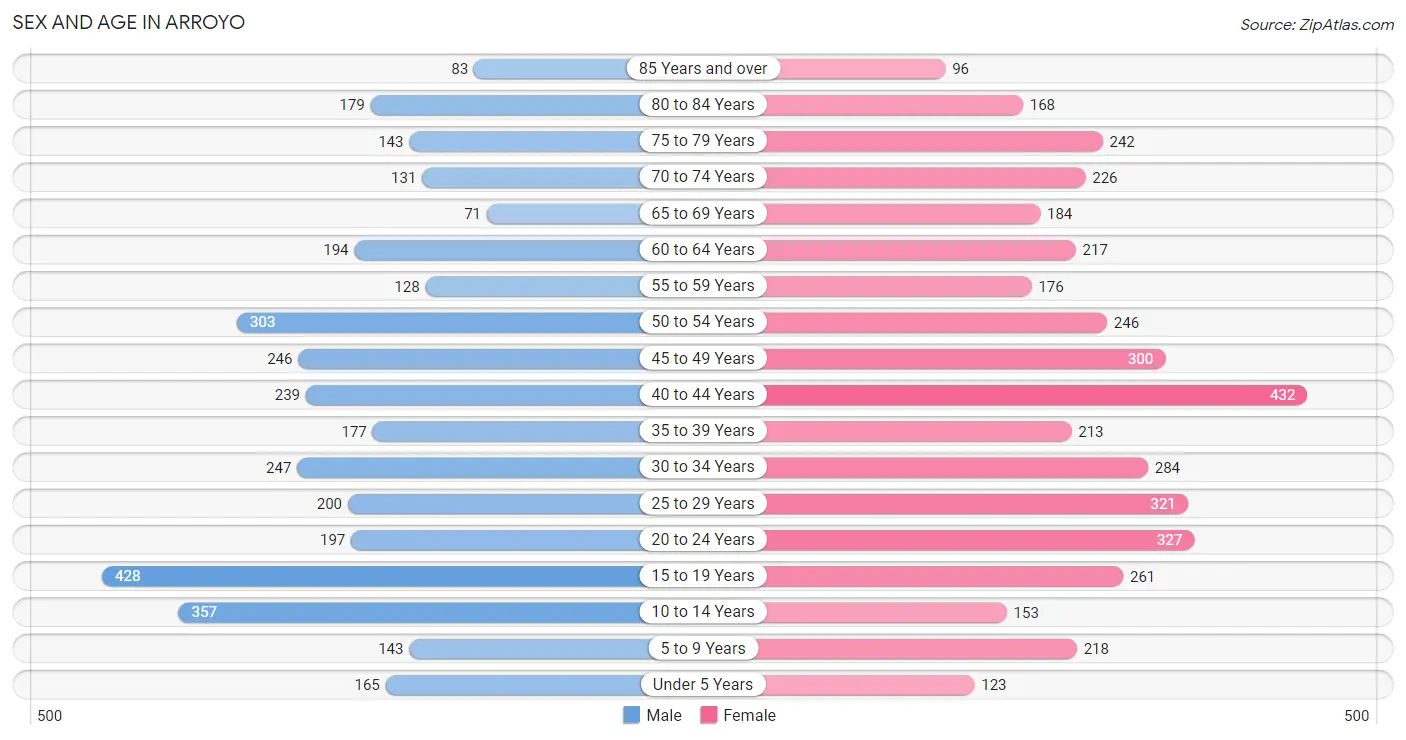
The most populous age groups in Arroyo are 15 to 19 Years (428 | 11.8%) for men and 40 to 44 Years (432 | 10.3%) for women.
| Age Bracket | Male | Female |
| Under 5 Years | 165 (4.5%) | 123 (2.9%) |
| 5 to 9 Years | 143 (3.9%) | 218 (5.2%) |
| 10 to 14 Years | 357 (9.8%) | 153 (3.6%) |
| 15 to 19 Years | 428 (11.8%) | 261 (6.2%) |
| 20 to 24 Years | 197 (5.4%) | 327 (7.8%) |
| 25 to 29 Years | 200 (5.5%) | 321 (7.7%) |
| 30 to 34 Years | 247 (6.8%) | 284 (6.8%) |
| 35 to 39 Years | 177 (4.9%) | 213 (5.1%) |
| 40 to 44 Years | 239 (6.6%) | 432 (10.3%) |
| 45 to 49 Years | 246 (6.8%) | 300 (7.2%) |
| 50 to 54 Years | 303 (8.3%) | 246 (5.9%) |
| 55 to 59 Years | 128 (3.5%) | 176 (4.2%) |
| 60 to 64 Years | 194 (5.3%) | 217 (5.2%) |
| 65 to 69 Years | 71 (2.0%) | 184 (4.4%) |
| 70 to 74 Years | 131 (3.6%) | 226 (5.4%) |
| 75 to 79 Years | 143 (3.9%) | 242 (5.8%) |
| 80 to 84 Years | 179 (4.9%) | 168 (4.0%) |
| 85 Years and over | 83 (2.3%) | 96 (2.3%) |
| Total | 3,631 (100.0%) | 4,187 (100.0%) |
Families and Households in Arroyo
Median Family Size in Arroyo
The median family size in Arroyo is 3.15 persons per family, with married-couple families (908 | 43.7%) accounting for the largest median family size of 3.36 persons per family. On the other hand, single male/father families (204 | 9.8%) represent the smallest median family size with 2.54 persons per family.
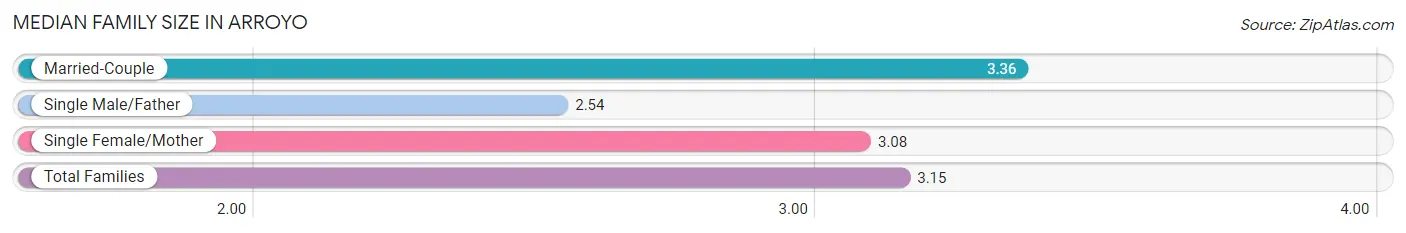
| Family Type | # Families | Family Size |
| Married-Couple | 908 (43.7%) | 3.36 |
| Single Male/Father | 204 (9.8%) | 2.54 |
| Single Female/Mother | 965 (46.5%) | 3.08 |
| Total Families | 2,077 (100.0%) | 3.15 |
Median Household Size in Arroyo
The median household size in Arroyo is 2.59 persons per household, with married-couple households (908 | 30.1%) accounting for the largest median household size of 3.36 persons per household. non-family households (942 | 31.2%) represent the smallest median household size with 1.06 persons per household.
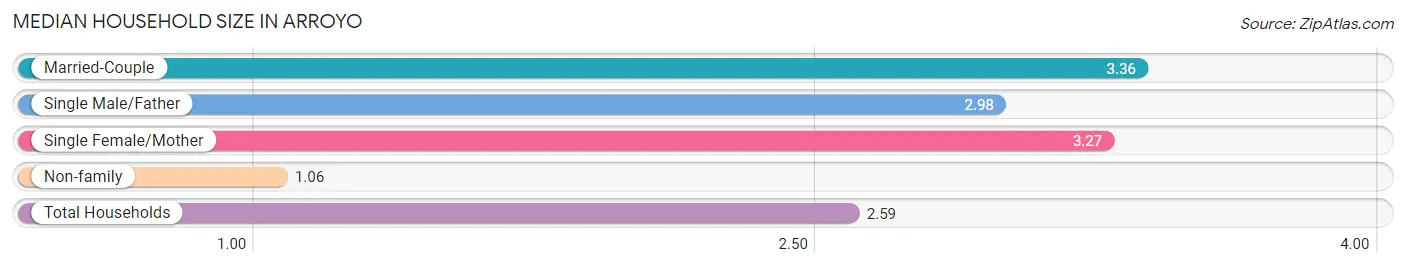
| Household Type | # Households | Household Size |
| Married-Couple | 908 (30.1%) | 3.36 |
| Single Male/Father | 204 (6.8%) | 2.98 |
| Single Female/Mother | 965 (32.0%) | 3.27 |
| Non-family | 942 (31.2%) | 1.06 |
| Total Households | 3,019 (100.0%) | 2.59 |
Household Size by Marriage Status in Arroyo
Out of a total of 3,019 households in Arroyo, 2,077 (68.8%) are family households, while 942 (31.2%) are nonfamily households. The most numerous type of family households are 2-person households, comprising 914, and the most common type of nonfamily households are 1-person households, comprising 892.
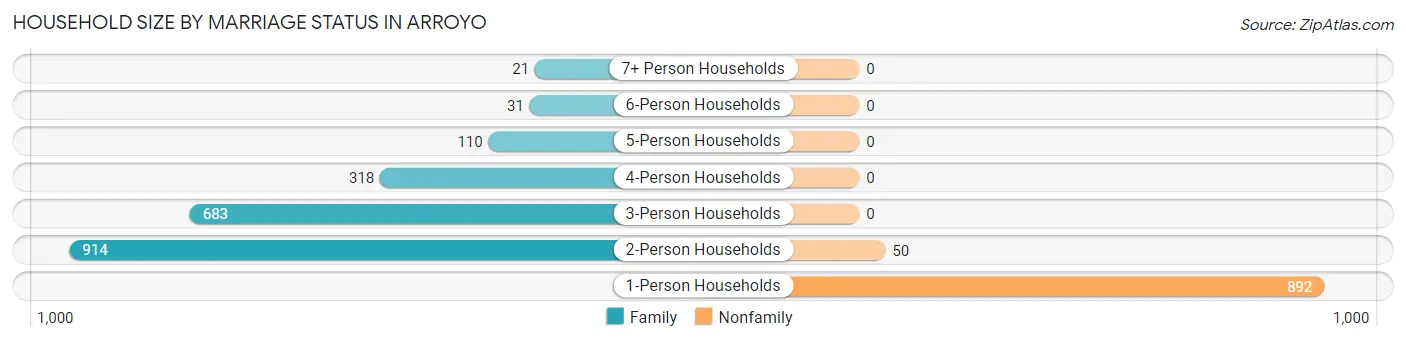
| Household Size | Family Households | Nonfamily Households |
| 1-Person Households | - | 892 (29.5%) |
| 2-Person Households | 914 (30.3%) | 50 (1.7%) |
| 3-Person Households | 683 (22.6%) | 0 (0.0%) |
| 4-Person Households | 318 (10.5%) | 0 (0.0%) |
| 5-Person Households | 110 (3.6%) | 0 (0.0%) |
| 6-Person Households | 31 (1.0%) | 0 (0.0%) |
| 7+ Person Households | 21 (0.7%) | 0 (0.0%) |
| Total | 2,077 (68.8%) | 942 (31.2%) |
Female Fertility in Arroyo
Fertility by Age in Arroyo
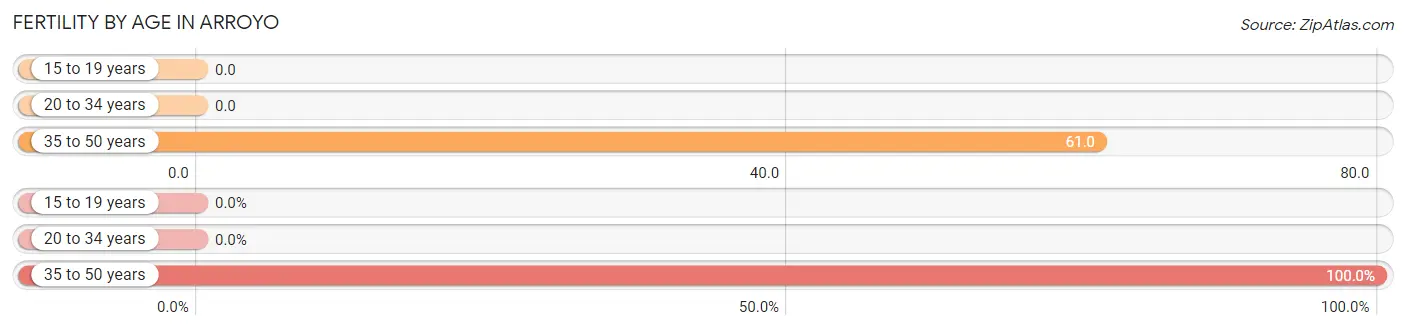
Average fertility rate in Arroyo is 27.0 births per 1,000 women. Women in the age bracket of 35 to 50 years have the highest fertility rate with 61.0 births per 1,000 women. Women in the age bracket of 35 to 50 years acount for 100.0% of all women with births.
| Age Bracket | Women with Births | Births / 1,000 Women |
| 15 to 19 years | 0 (0.0%) | 0.0 |
| 20 to 34 years | 0 (0.0%) | 0.0 |
| 35 to 50 years | 59 (100.0%) | 61.0 |
| Total | 59 (100.0%) | 27.0 |
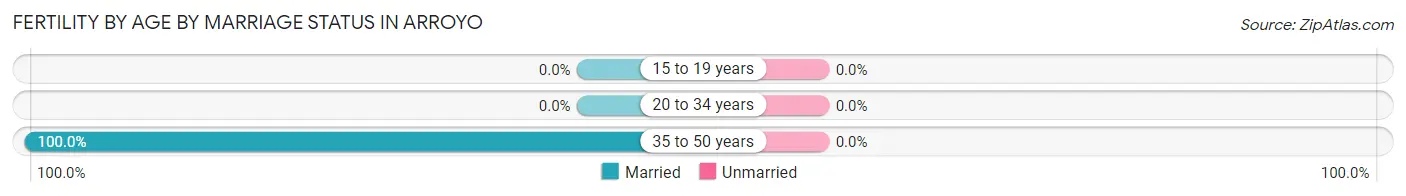
Fertility by Age by Marriage Status in Arroyo
| Age Bracket | Married | Unmarried |
| 15 to 19 years | 0 (0.0%) | 0 (0.0%) |
| 20 to 34 years | 0 (0.0%) | 0 (0.0%) |
| 35 to 50 years | 59 (100.0%) | 0 (0.0%) |
| Total | 59 (100.0%) | 0 (0.0%) |
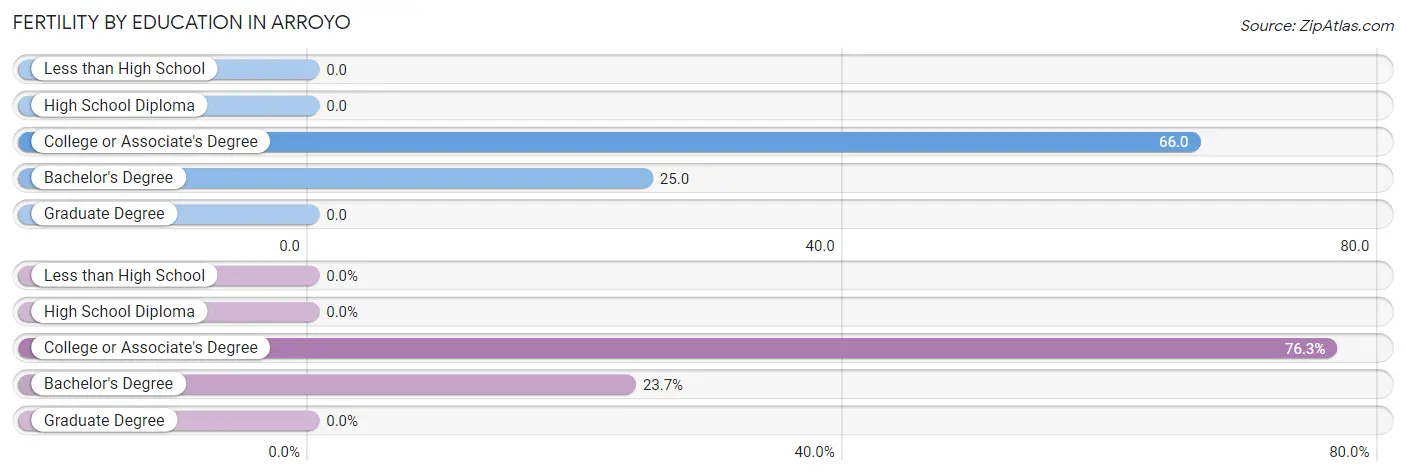
Fertility by Education in Arroyo
| Educational Attainment | Women with Births | Births / 1,000 Women |
| Less than High School | 0 (0.0%) | 0.0 |
| High School Diploma | 0 (0.0%) | 0.0 |
| College or Associate's Degree | 45 (76.3%) | 66.0 |
| Bachelor's Degree | 14 (23.7%) | 25.0 |
| Graduate Degree | 0 (0.0%) | 0.0 |
| Total | 59 (100.0%) | 27.0 |
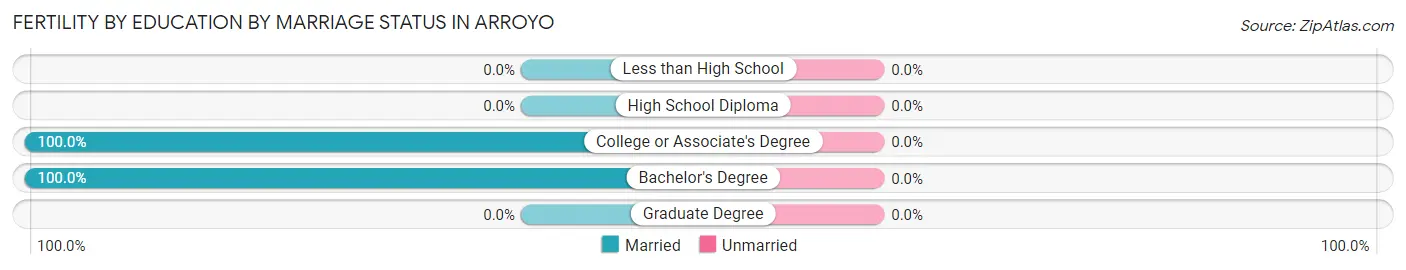
Fertility by Education by Marriage Status in Arroyo
| Educational Attainment | Married | Unmarried |
| Less than High School | 0 (0.0%) | 0 (0.0%) |
| High School Diploma | 0 (0.0%) | 0 (0.0%) |
| College or Associate's Degree | 45 (100.0%) | 0 (0.0%) |
| Bachelor's Degree | 14 (100.0%) | 0 (0.0%) |
| Graduate Degree | 0 (0.0%) | 0 (0.0%) |
| Total | 59 (100.0%) | 0 (0.0%) |
Employment Characteristics in Arroyo
Employment by Class of Employer in Arroyo
Among the 1,715 employed individuals in Arroyo, private company employees (995 | 58.0%), state government employees (362 | 21.1%), and local government employees (166 | 9.7%) make up the most common classes of employment.
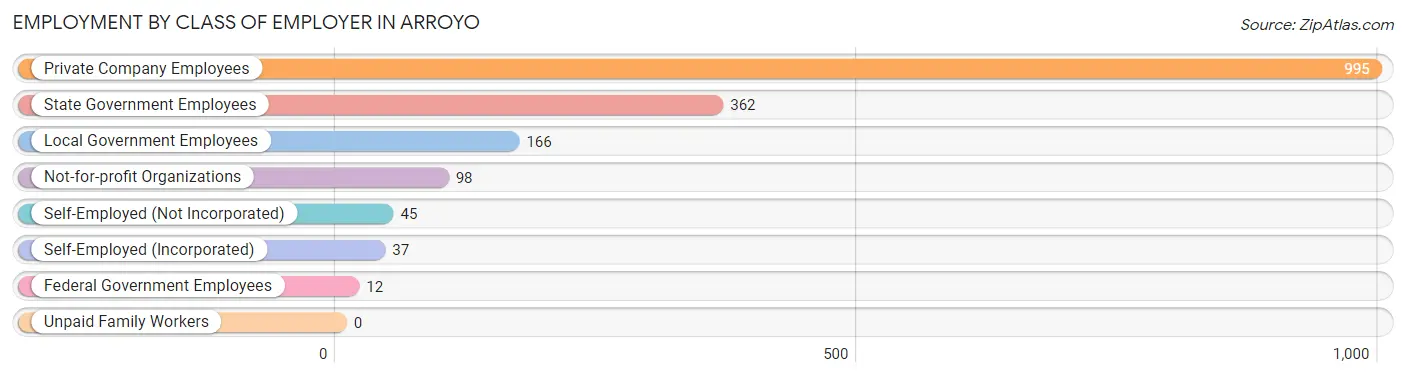
| Employer Class | # Employees | % Employees |
| Private Company Employees | 995 | 58.0% |
| Self-Employed (Incorporated) | 37 | 2.2% |
| Self-Employed (Not Incorporated) | 45 | 2.6% |
| Not-for-profit Organizations | 98 | 5.7% |
| Local Government Employees | 166 | 9.7% |
| State Government Employees | 362 | 21.1% |
| Federal Government Employees | 12 | 0.7% |
| Unpaid Family Workers | 0 | 0.0% |
| Total | 1,715 | 100.0% |
Employment Status by Age in Arroyo
According to the labor force statistics for Arroyo, out of the total population over 16 years of age (6,584), 32.9% or 2,166 individuals are in the labor force, with 18.5% or 401 of them unemployed. The age group with the highest labor force participation rate is 30 to 34 years, with 79.3% or 421 individuals in the labor force. Within the labor force, the 20 to 24 years age range has the highest percentage of unemployed individuals, with 52.7% or 59 of them being unemployed.
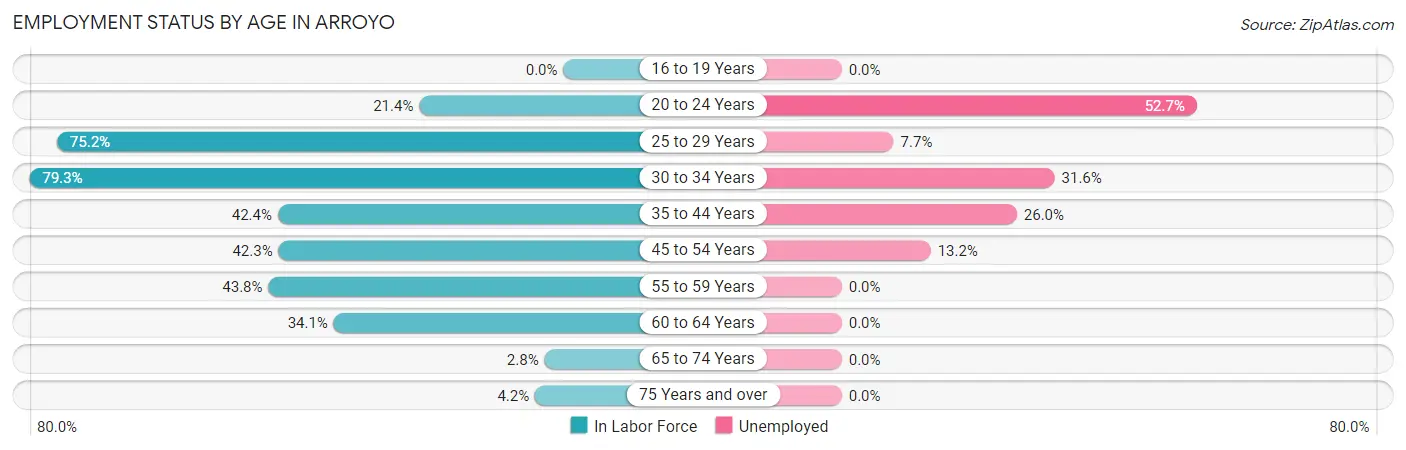
| Age Bracket | In Labor Force | Unemployed |
| 16 to 19 Years | 0 (0.0%) | 0 (0.0%) |
| 20 to 24 Years | 112 (21.4%) | 59 (52.7%) |
| 25 to 29 Years | 392 (75.2%) | 30 (7.7%) |
| 30 to 34 Years | 421 (79.3%) | 133 (31.6%) |
| 35 to 44 Years | 450 (42.4%) | 117 (26.0%) |
| 45 to 54 Years | 463 (42.3%) | 61 (13.2%) |
| 55 to 59 Years | 133 (43.8%) | 0 (0.0%) |
| 60 to 64 Years | 140 (34.1%) | 0 (0.0%) |
| 65 to 74 Years | 17 (2.8%) | 0 (0.0%) |
| 75 Years and over | 38 (4.2%) | 0 (0.0%) |
| Total | 2,166 (32.9%) | 401 (18.5%) |
Employment Status by Educational Attainment in Arroyo
According to labor force statistics for Arroyo, 51.0% of individuals (2,001) out of the total population between 25 and 64 years of age (3,923) are in the labor force, with 17.1% or 342 of them being unemployed. The group with the highest labor force participation rate are those with the educational attainment of bachelor's degree or higher, with 77.1% or 906 individuals in the labor force. Within the labor force, individuals with less than high school education have the highest percentage of unemployment, with 62.3% or 86 of them being unemployed.
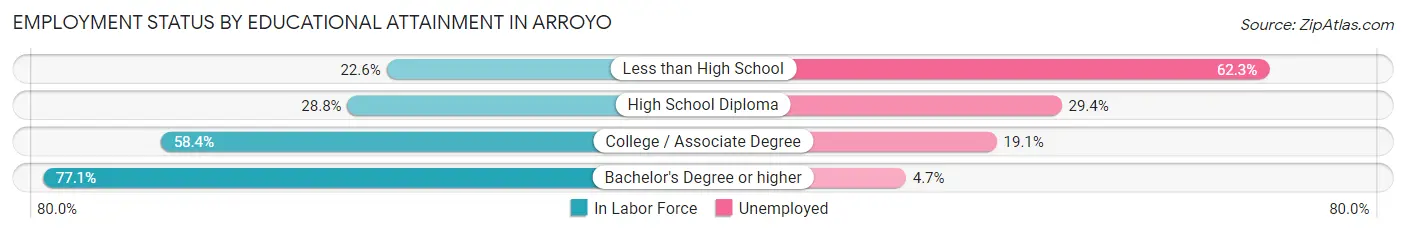
| Educational Attainment | In Labor Force | Unemployed |
| Less than High School | 138 (22.6%) | 381 (62.3%) |
| High School Diploma | 286 (28.8%) | 292 (29.4%) |
| College / Associate Degree | 669 (58.4%) | 219 (19.1%) |
| Bachelor's Degree or higher | 906 (77.1%) | 55 (4.7%) |
| Total | 2,001 (51.0%) | 671 (17.1%) |
Employment Occupations by Sex in Arroyo
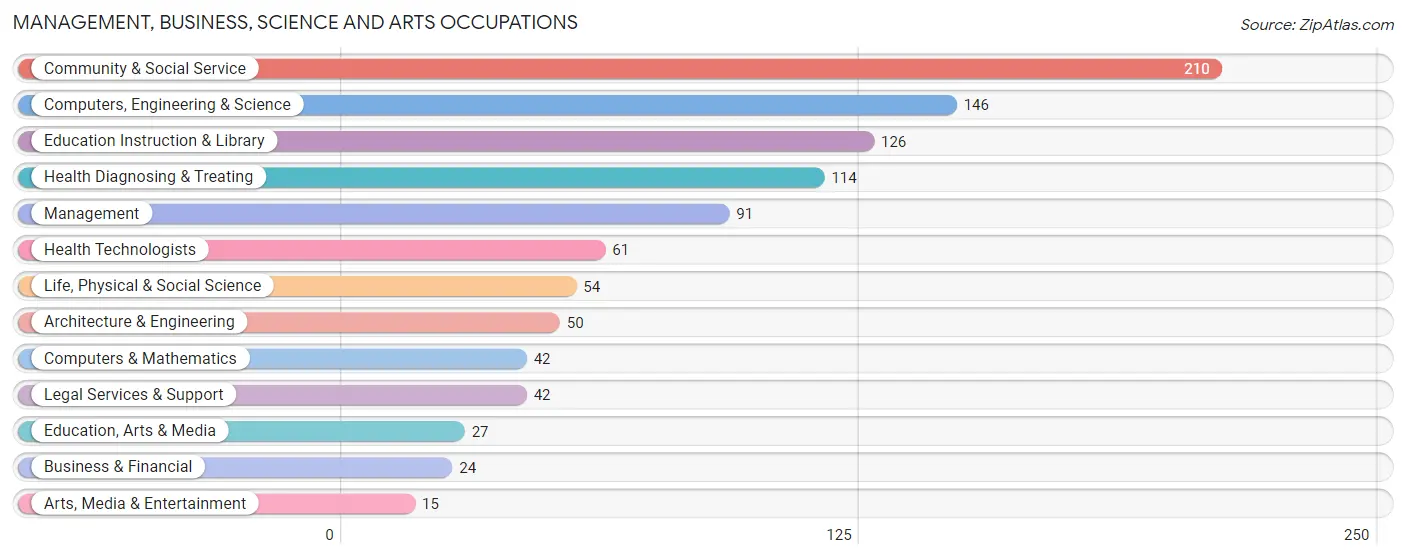
Management, Business, Science and Arts Occupations
The most common Management, Business, Science and Arts occupations in Arroyo are Community & Social Service (210 | 11.9%), Computers, Engineering & Science (146 | 8.3%), Education Instruction & Library (126 | 7.1%), Health Diagnosing & Treating (114 | 6.5%), and Management (91 | 5.1%).
Management, Business, Science and Arts Occupations by Sex
Within the Management, Business, Science and Arts occupations in Arroyo, the most male-oriented occupations are Computers & Mathematics (100.0%), Legal Services & Support (100.0%), and Arts, Media & Entertainment (100.0%), while the most female-oriented occupations are Business & Financial (100.0%), Health Technologists (100.0%), and Education, Arts & Media (96.3%).
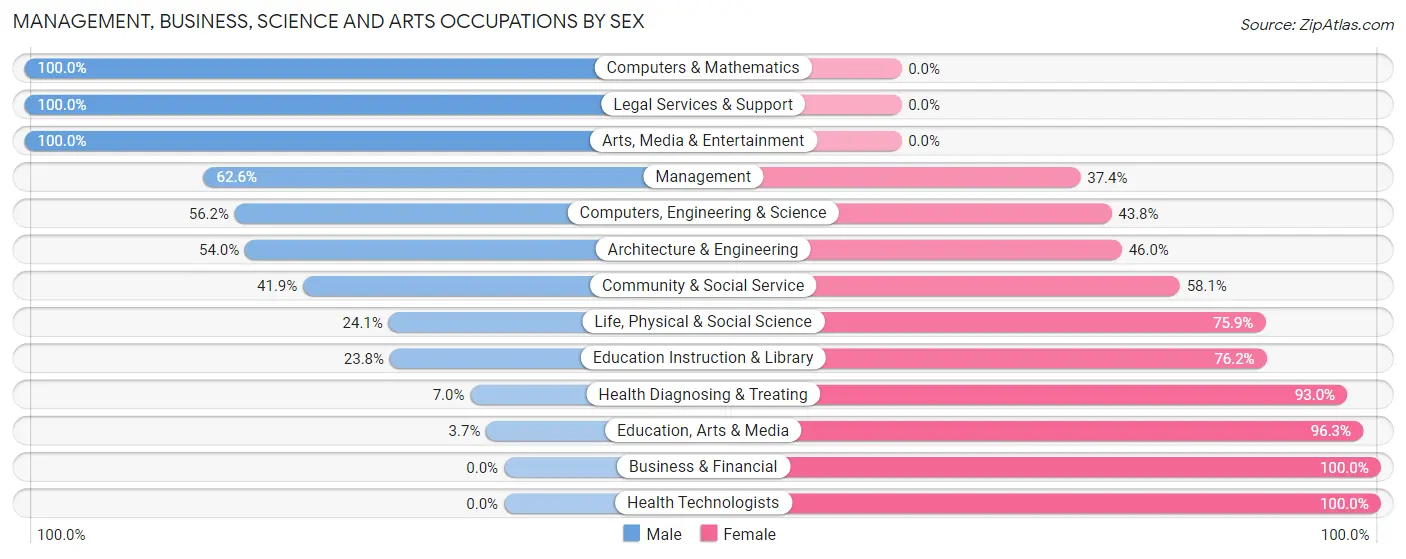
| Occupation | Male | Female |
| Management | 57 (62.6%) | 34 (37.4%) |
| Business & Financial | 0 (0.0%) | 24 (100.0%) |
| Computers, Engineering & Science | 82 (56.2%) | 64 (43.8%) |
| Computers & Mathematics | 42 (100.0%) | 0 (0.0%) |
| Architecture & Engineering | 27 (54.0%) | 23 (46.0%) |
| Life, Physical & Social Science | 13 (24.1%) | 41 (75.9%) |
| Community & Social Service | 88 (41.9%) | 122 (58.1%) |
| Education, Arts & Media | 1 (3.7%) | 26 (96.3%) |
| Legal Services & Support | 42 (100.0%) | 0 (0.0%) |
| Education Instruction & Library | 30 (23.8%) | 96 (76.2%) |
| Arts, Media & Entertainment | 15 (100.0%) | 0 (0.0%) |
| Health Diagnosing & Treating | 8 (7.0%) | 106 (93.0%) |
| Health Technologists | 0 (0.0%) | 61 (100.0%) |
| Total (Category) | 235 (40.2%) | 350 (59.8%) |
| Total (Overall) | 753 (42.6%) | 1,013 (57.4%) |
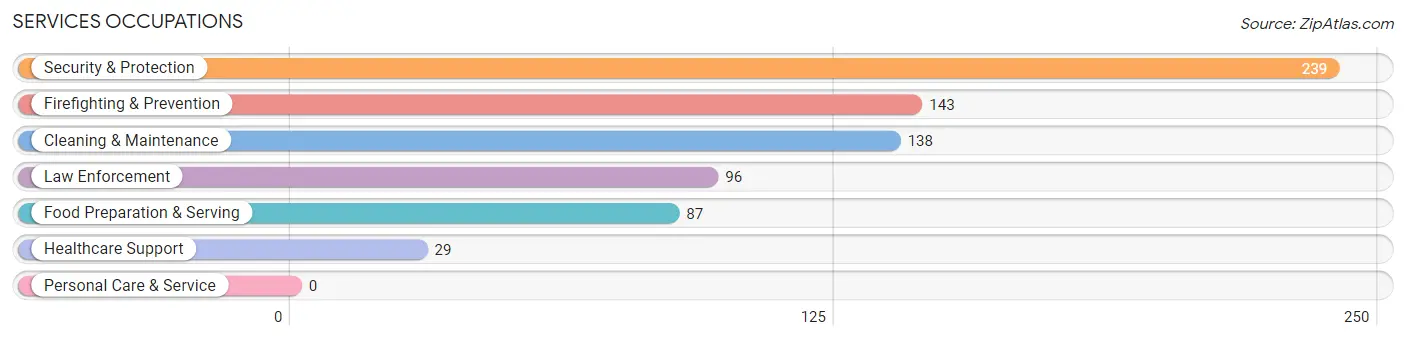
Services Occupations
The most common Services occupations in Arroyo are Security & Protection (239 | 13.5%), Firefighting & Prevention (143 | 8.1%), Cleaning & Maintenance (138 | 7.8%), Law Enforcement (96 | 5.4%), and Food Preparation & Serving (87 | 4.9%).
Services Occupations by Sex
Within the Services occupations in Arroyo, the most male-oriented occupations are Firefighting & Prevention (100.0%), Security & Protection (82.9%), and Cleaning & Maintenance (62.3%), while the most female-oriented occupations are Healthcare Support (100.0%), Food Preparation & Serving (100.0%), and Law Enforcement (42.7%).
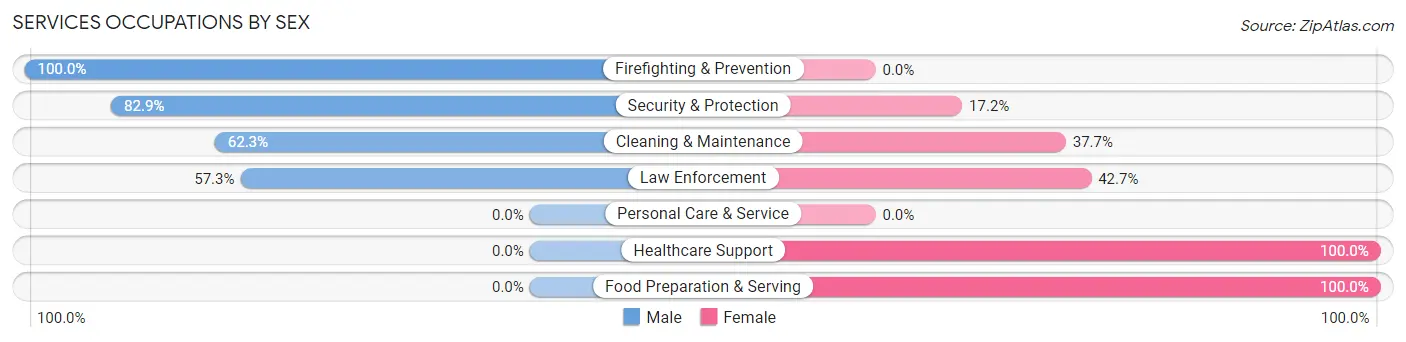
| Occupation | Male | Female |
| Healthcare Support | 0 (0.0%) | 29 (100.0%) |
| Security & Protection | 198 (82.9%) | 41 (17.2%) |
| Firefighting & Prevention | 143 (100.0%) | 0 (0.0%) |
| Law Enforcement | 55 (57.3%) | 41 (42.7%) |
| Food Preparation & Serving | 0 (0.0%) | 87 (100.0%) |
| Cleaning & Maintenance | 86 (62.3%) | 52 (37.7%) |
| Personal Care & Service | 0 (0.0%) | 0 (0.0%) |
| Total (Category) | 284 (57.6%) | 209 (42.4%) |
| Total (Overall) | 753 (42.6%) | 1,013 (57.4%) |
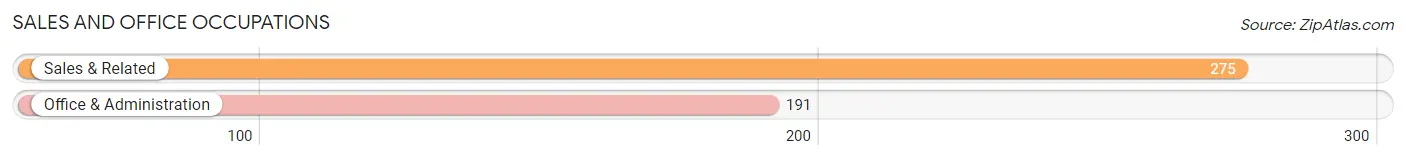
Sales and Office Occupations
The most common Sales and Office occupations in Arroyo are Sales & Related (275 | 15.6%), and Office & Administration (191 | 10.8%).
Sales and Office Occupations by Sex
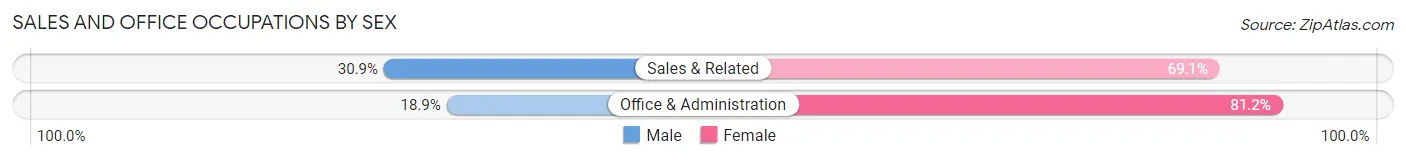
| Occupation | Male | Female |
| Sales & Related | 85 (30.9%) | 190 (69.1%) |
| Office & Administration | 36 (18.9%) | 155 (81.1%) |
| Total (Category) | 121 (26.0%) | 345 (74.0%) |
| Total (Overall) | 753 (42.6%) | 1,013 (57.4%) |
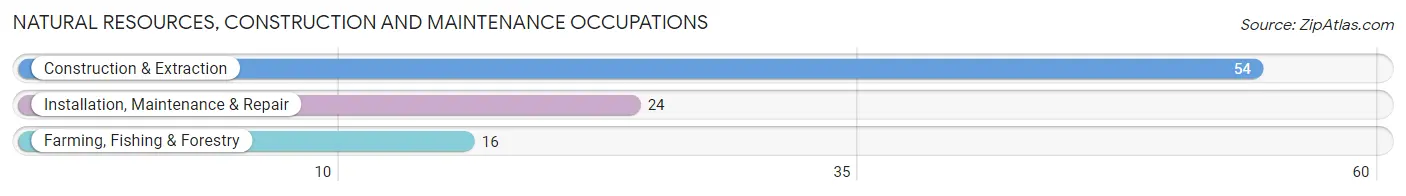
Natural Resources, Construction and Maintenance Occupations
The most common Natural Resources, Construction and Maintenance occupations in Arroyo are Construction & Extraction (54 | 3.1%), Installation, Maintenance & Repair (24 | 1.4%), and Farming, Fishing & Forestry (16 | 0.9%).
Natural Resources, Construction and Maintenance Occupations by Sex
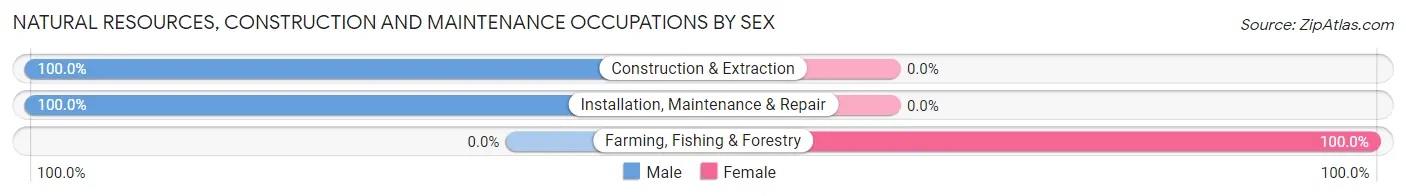
| Occupation | Male | Female |
| Farming, Fishing & Forestry | 0 (0.0%) | 16 (100.0%) |
| Construction & Extraction | 54 (100.0%) | 0 (0.0%) |
| Installation, Maintenance & Repair | 24 (100.0%) | 0 (0.0%) |
| Total (Category) | 78 (83.0%) | 16 (17.0%) |
| Total (Overall) | 753 (42.6%) | 1,013 (57.4%) |
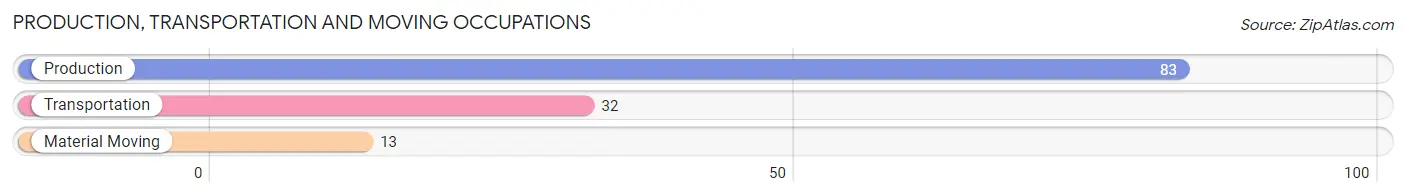
Production, Transportation and Moving Occupations
The most common Production, Transportation and Moving occupations in Arroyo are Production (83 | 4.7%), Transportation (32 | 1.8%), and Material Moving (13 | 0.7%).
Production, Transportation and Moving Occupations by Sex
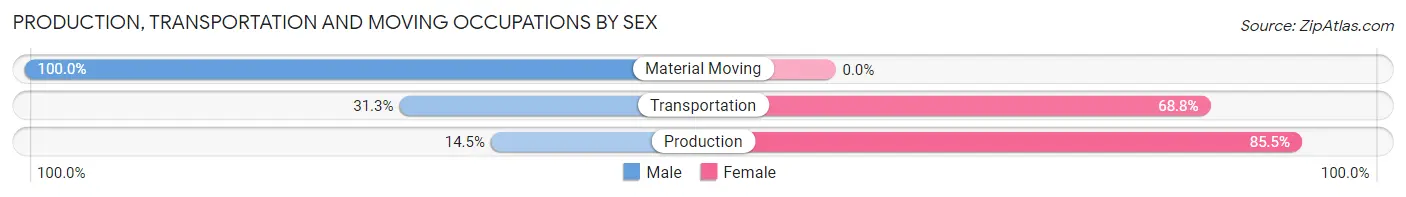
| Occupation | Male | Female |
| Production | 12 (14.5%) | 71 (85.5%) |
| Transportation | 10 (31.2%) | 22 (68.8%) |
| Material Moving | 13 (100.0%) | 0 (0.0%) |
| Total (Category) | 35 (27.3%) | 93 (72.7%) |
| Total (Overall) | 753 (42.6%) | 1,013 (57.4%) |
Employment Industries by Sex in Arroyo
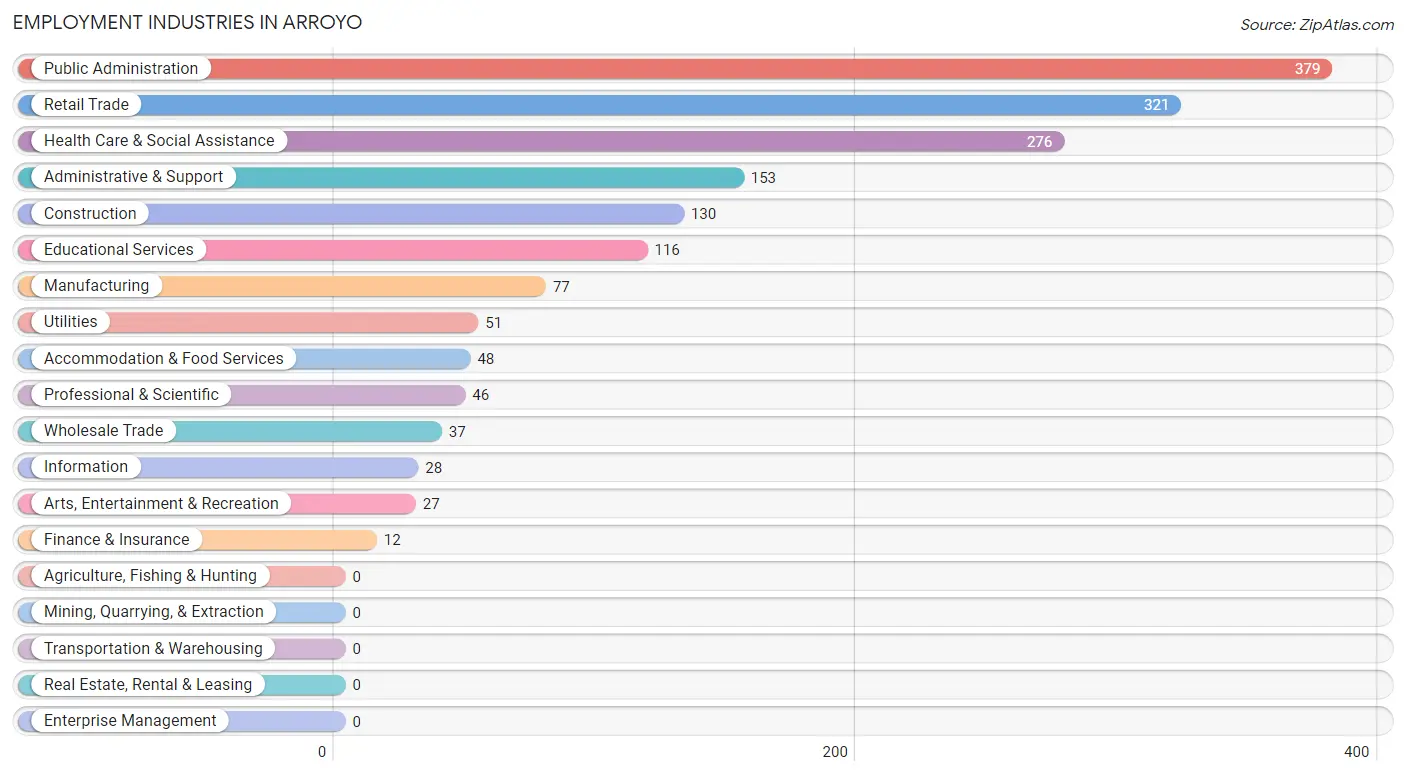
Employment Industries in Arroyo
The major employment industries in Arroyo include Public Administration (379 | 21.5%), Retail Trade (321 | 18.2%), Health Care & Social Assistance (276 | 15.6%), Administrative & Support (153 | 8.7%), and Construction (130 | 7.4%).
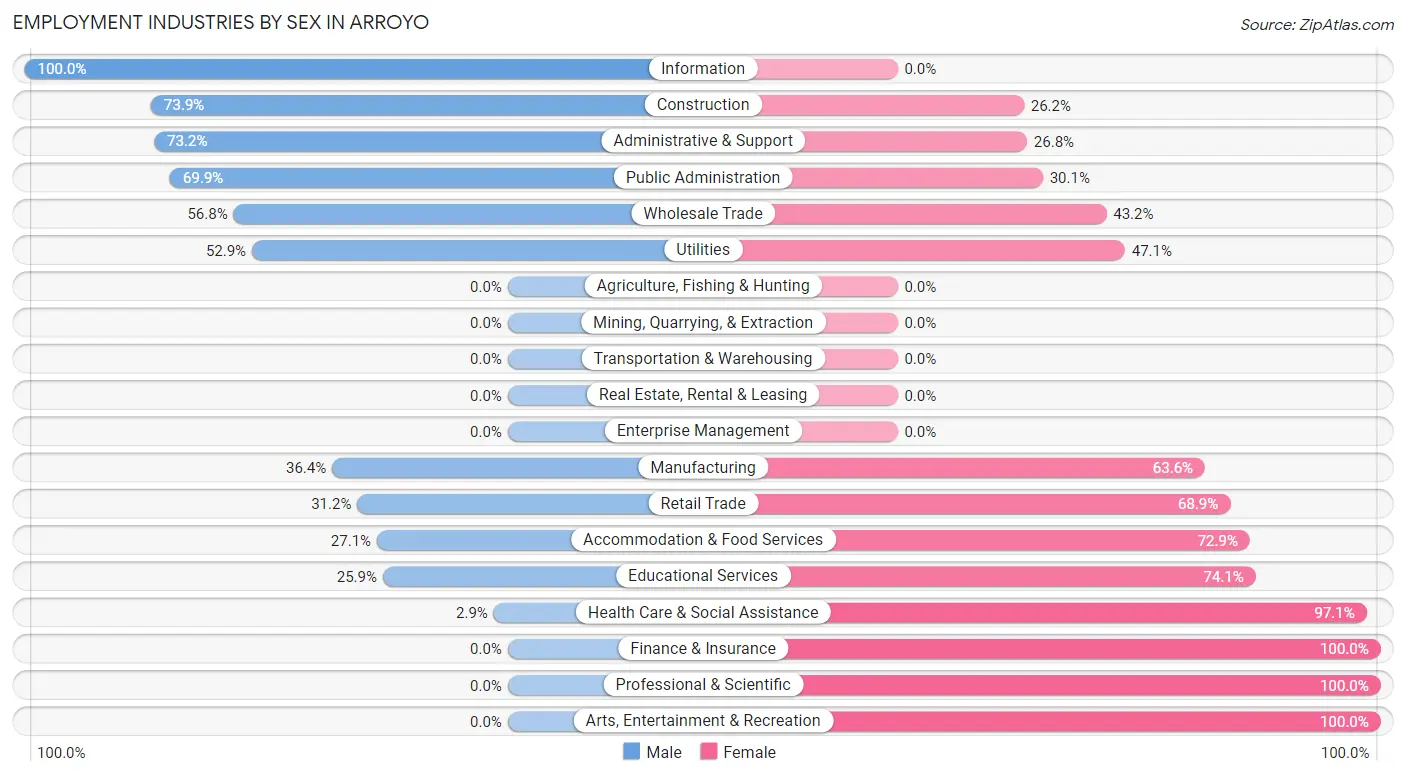
Employment Industries by Sex in Arroyo
The Arroyo industries that see more men than women are Information (100.0%), Construction (73.9%), and Administrative & Support (73.2%), whereas the industries that tend to have a higher number of women are Finance & Insurance (100.0%), Professional & Scientific (100.0%), and Arts, Entertainment & Recreation (100.0%).
| Industry | Male | Female |
| Agriculture, Fishing & Hunting | 0 (0.0%) | 0 (0.0%) |
| Mining, Quarrying, & Extraction | 0 (0.0%) | 0 (0.0%) |
| Construction | 96 (73.9%) | 34 (26.2%) |
| Manufacturing | 28 (36.4%) | 49 (63.6%) |
| Wholesale Trade | 21 (56.8%) | 16 (43.2%) |
| Retail Trade | 100 (31.1%) | 221 (68.9%) |
| Transportation & Warehousing | 0 (0.0%) | 0 (0.0%) |
| Utilities | 27 (52.9%) | 24 (47.1%) |
| Information | 28 (100.0%) | 0 (0.0%) |
| Finance & Insurance | 0 (0.0%) | 12 (100.0%) |
| Real Estate, Rental & Leasing | 0 (0.0%) | 0 (0.0%) |
| Professional & Scientific | 0 (0.0%) | 46 (100.0%) |
| Enterprise Management | 0 (0.0%) | 0 (0.0%) |
| Administrative & Support | 112 (73.2%) | 41 (26.8%) |
| Educational Services | 30 (25.9%) | 86 (74.1%) |
| Health Care & Social Assistance | 8 (2.9%) | 268 (97.1%) |
| Arts, Entertainment & Recreation | 0 (0.0%) | 27 (100.0%) |
| Accommodation & Food Services | 13 (27.1%) | 35 (72.9%) |
| Public Administration | 265 (69.9%) | 114 (30.1%) |
| Total | 753 (42.6%) | 1,013 (57.4%) |
Education in Arroyo
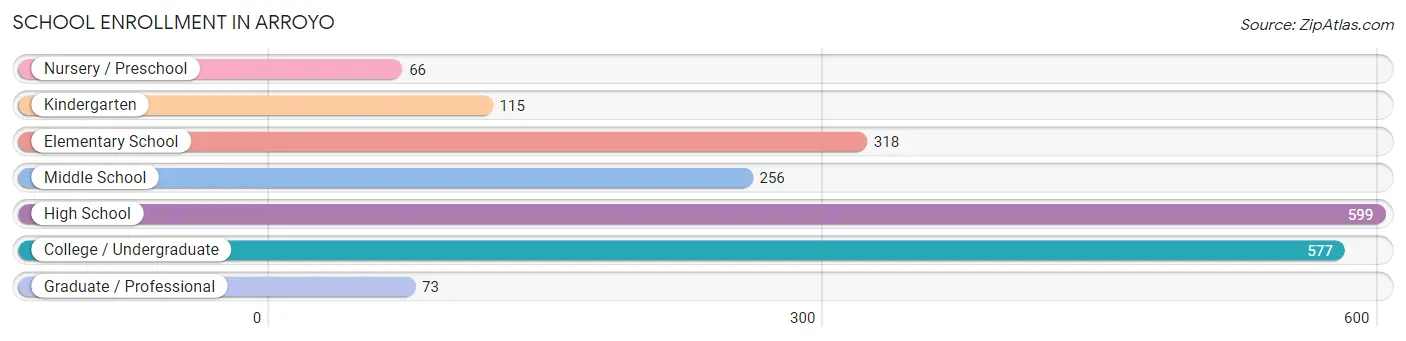
School Enrollment in Arroyo
The most common levels of schooling among the 2,004 students in Arroyo are high school (599 | 29.9%), college / undergraduate (577 | 28.8%), and elementary school (318 | 15.9%).
| School Level | # Students | % Students |
| Nursery / Preschool | 66 | 3.3% |
| Kindergarten | 115 | 5.7% |
| Elementary School | 318 | 15.9% |
| Middle School | 256 | 12.8% |
| High School | 599 | 29.9% |
| College / Undergraduate | 577 | 28.8% |
| Graduate / Professional | 73 | 3.6% |
| Total | 2,004 | 100.0% |
School Enrollment by Age by Funding Source in Arroyo
Out of a total of 2,004 students who are enrolled in schools in Arroyo, 240 (12.0%) attend a private institution, while the remaining 1,764 (88.0%) are enrolled in public schools. The age group of 35 years and over has the highest likelihood of being enrolled in private schools, with 35 (64.8% in the age bracket) enrolled. Conversely, the age group of 3 to 4 year olds has the lowest likelihood of being enrolled in a private school, with 102 (100.0% in the age bracket) attending a public institution.
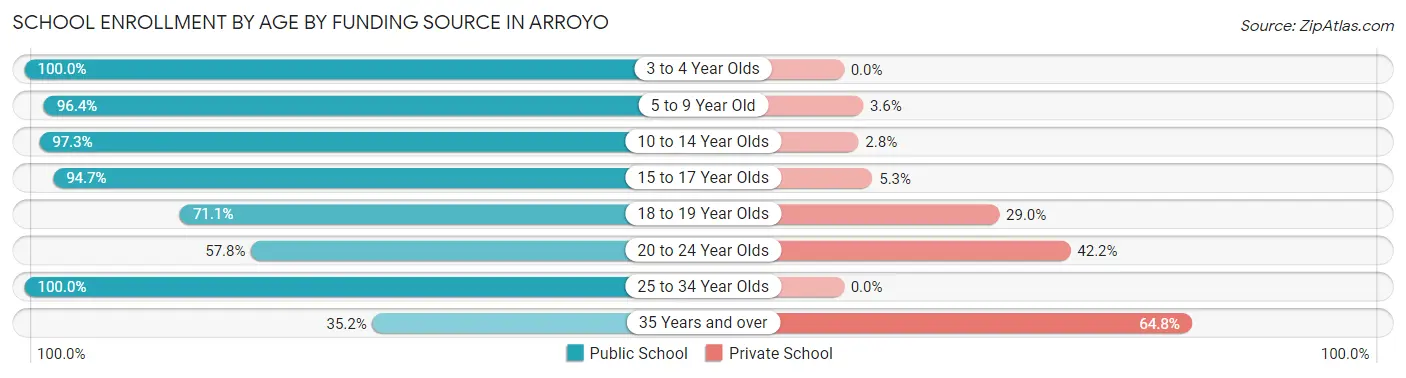
| Age Bracket | Public School | Private School |
| 3 to 4 Year Olds | 102 (100.0%) | 0 (0.0%) |
| 5 to 9 Year Old | 348 (96.4%) | 13 (3.6%) |
| 10 to 14 Year Olds | 496 (97.3%) | 14 (2.8%) |
| 15 to 17 Year Olds | 320 (94.7%) | 18 (5.3%) |
| 18 to 19 Year Olds | 162 (71.1%) | 66 (28.9%) |
| 20 to 24 Year Olds | 130 (57.8%) | 95 (42.2%) |
| 25 to 34 Year Olds | 186 (100.0%) | 0 (0.0%) |
| 35 Years and over | 19 (35.2%) | 35 (64.8%) |
| Total | 1,764 (88.0%) | 240 (12.0%) |
Educational Attainment by Field of Study in Arroyo
Business (370 | 24.3%), education (319 | 20.9%), arts & humanities (232 | 15.2%), science & technology (210 | 13.8%), and engineering (95 | 6.2%) are the most common fields of study among 1,523 individuals in Arroyo who have obtained a bachelor's degree or higher.
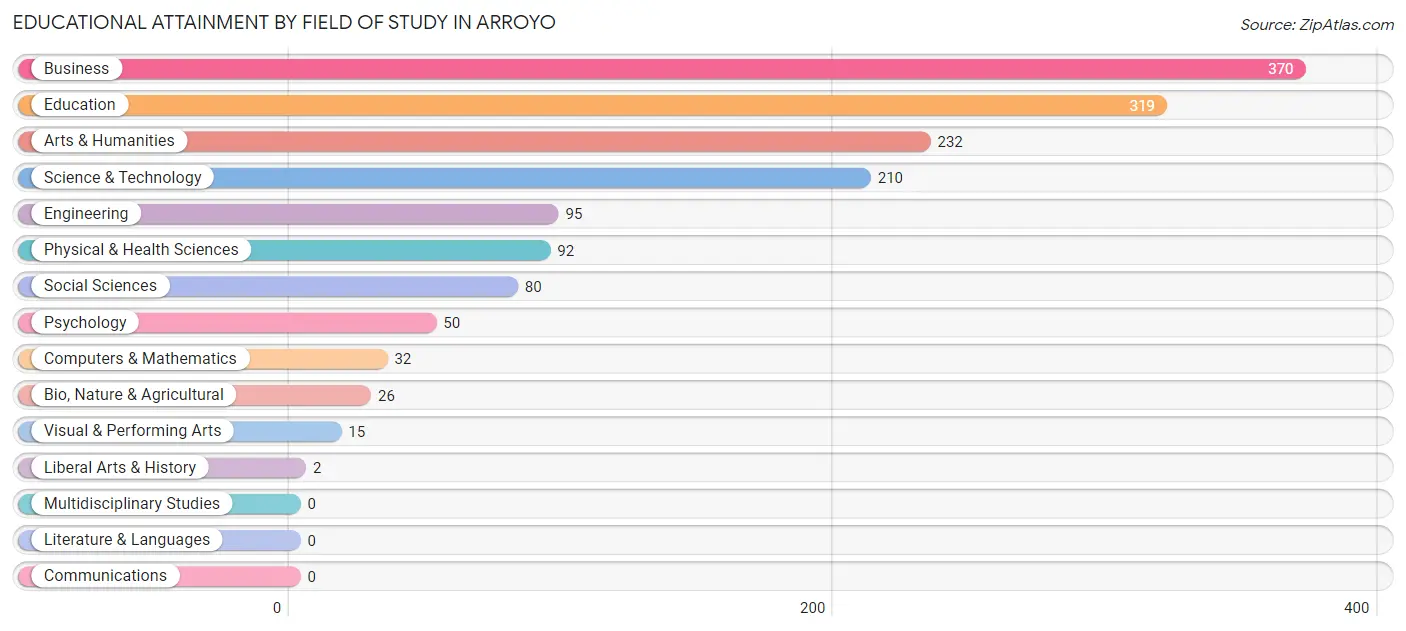
| Field of Study | # Graduates | % Graduates |
| Computers & Mathematics | 32 | 2.1% |
| Bio, Nature & Agricultural | 26 | 1.7% |
| Physical & Health Sciences | 92 | 6.0% |
| Psychology | 50 | 3.3% |
| Social Sciences | 80 | 5.2% |
| Engineering | 95 | 6.2% |
| Multidisciplinary Studies | 0 | 0.0% |
| Science & Technology | 210 | 13.8% |
| Business | 370 | 24.3% |
| Education | 319 | 20.9% |
| Literature & Languages | 0 | 0.0% |
| Liberal Arts & History | 2 | 0.1% |
| Visual & Performing Arts | 15 | 1.0% |
| Communications | 0 | 0.0% |
| Arts & Humanities | 232 | 15.2% |
| Total | 1,523 | 100.0% |
Transportation & Commute in Arroyo
Vehicle Availability by Sex in Arroyo
The most prevalent vehicle ownership categories in Arroyo are males with 2 vehicles (266, accounting for 35.4%) and females with 2 vehicles (281, making up 27.7%).
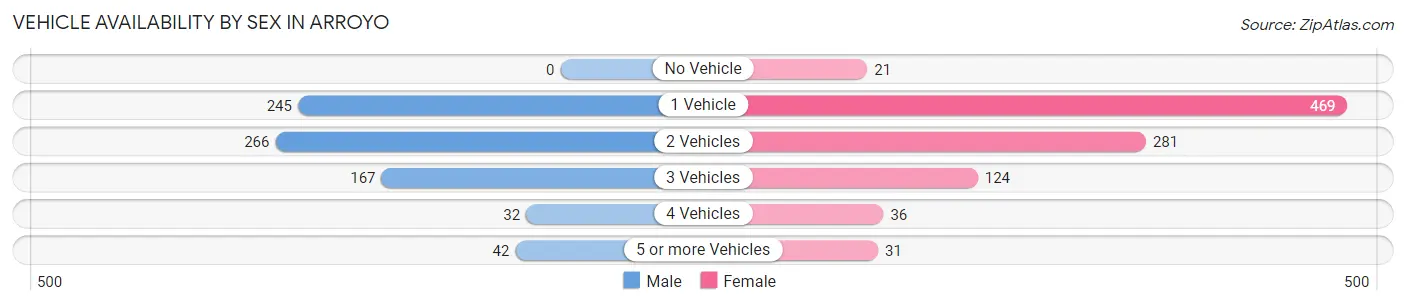
| Vehicles Available | Male | Female |
| No Vehicle | 0 (0.0%) | 21 (2.2%) |
| 1 Vehicle | 245 (32.6%) | 469 (48.7%) |
| 2 Vehicles | 266 (35.4%) | 281 (29.2%) |
| 3 Vehicles | 167 (22.2%) | 124 (12.9%) |
| 4 Vehicles | 32 (4.3%) | 36 (3.7%) |
| 5 or more Vehicles | 42 (5.6%) | 31 (3.2%) |
| Total | 752 (100.0%) | 962 (100.0%) |
Commute Time in Arroyo
The most frequently occuring commute durations in Arroyo are 15 to 19 minutes (570 commuters, 33.6%), 30 to 34 minutes (286 commuters, 16.9%), and 45 to 59 minutes (233 commuters, 13.7%).
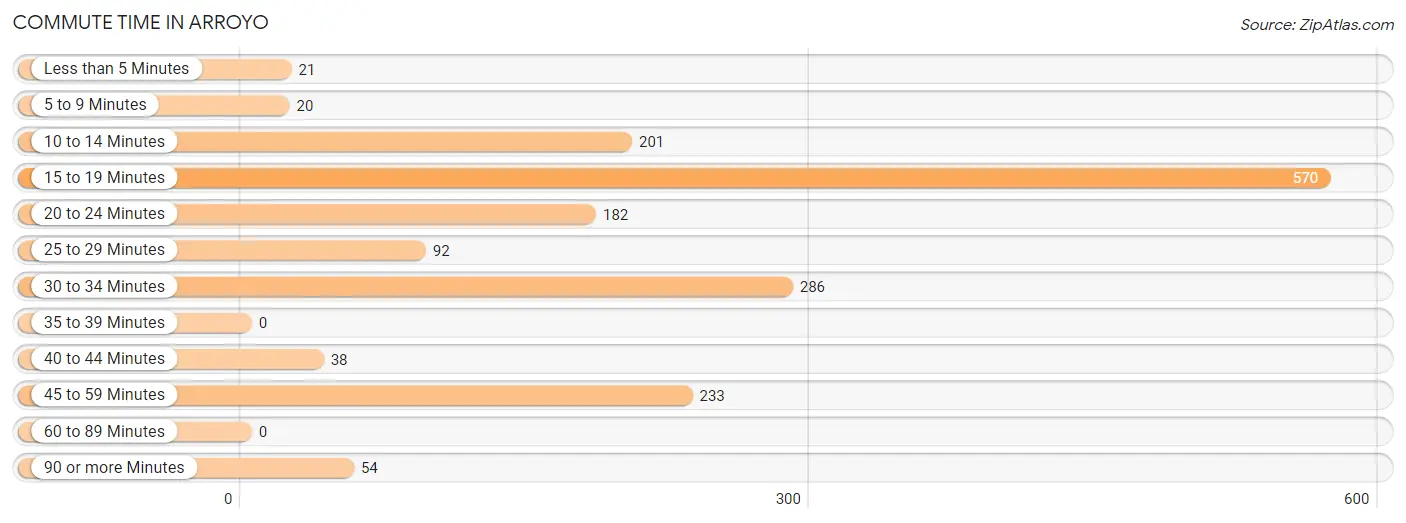
| Commute Time | # Commuters | % Commuters |
| Less than 5 Minutes | 21 | 1.2% |
| 5 to 9 Minutes | 20 | 1.2% |
| 10 to 14 Minutes | 201 | 11.8% |
| 15 to 19 Minutes | 570 | 33.6% |
| 20 to 24 Minutes | 182 | 10.7% |
| 25 to 29 Minutes | 92 | 5.4% |
| 30 to 34 Minutes | 286 | 16.9% |
| 35 to 39 Minutes | 0 | 0.0% |
| 40 to 44 Minutes | 38 | 2.2% |
| 45 to 59 Minutes | 233 | 13.7% |
| 60 to 89 Minutes | 0 | 0.0% |
| 90 or more Minutes | 54 | 3.2% |
Commute Time by Sex in Arroyo
The most common commute times in Arroyo are 45 to 59 minutes (169 commuters, 22.7%) for males and 15 to 19 minutes (418 commuters, 43.9%) for females.
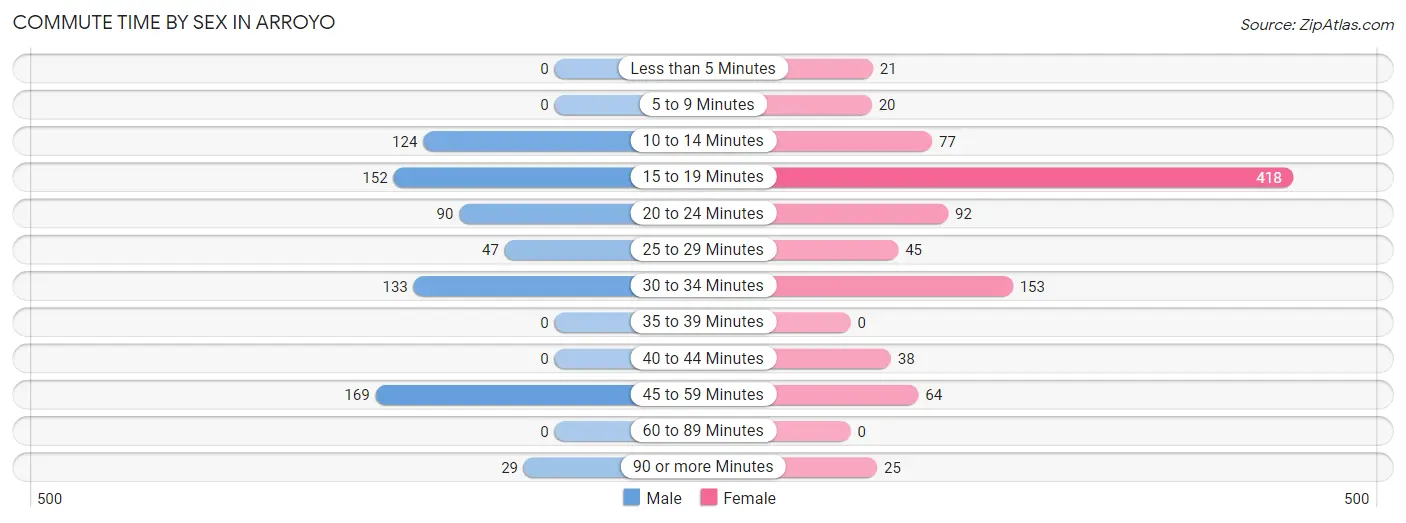
| Commute Time | Male | Female |
| Less than 5 Minutes | 0 (0.0%) | 21 (2.2%) |
| 5 to 9 Minutes | 0 (0.0%) | 20 (2.1%) |
| 10 to 14 Minutes | 124 (16.7%) | 77 (8.1%) |
| 15 to 19 Minutes | 152 (20.4%) | 418 (43.9%) |
| 20 to 24 Minutes | 90 (12.1%) | 92 (9.7%) |
| 25 to 29 Minutes | 47 (6.3%) | 45 (4.7%) |
| 30 to 34 Minutes | 133 (17.9%) | 153 (16.1%) |
| 35 to 39 Minutes | 0 (0.0%) | 0 (0.0%) |
| 40 to 44 Minutes | 0 (0.0%) | 38 (4.0%) |
| 45 to 59 Minutes | 169 (22.7%) | 64 (6.7%) |
| 60 to 89 Minutes | 0 (0.0%) | 0 (0.0%) |
| 90 or more Minutes | 29 (3.9%) | 25 (2.6%) |
Time of Departure to Work by Sex in Arroyo
The most frequent times of departure to work in Arroyo are 7:00 AM to 7:29 AM (190, 25.5%) for males and 7:00 AM to 7:29 AM (199, 20.9%) for females.
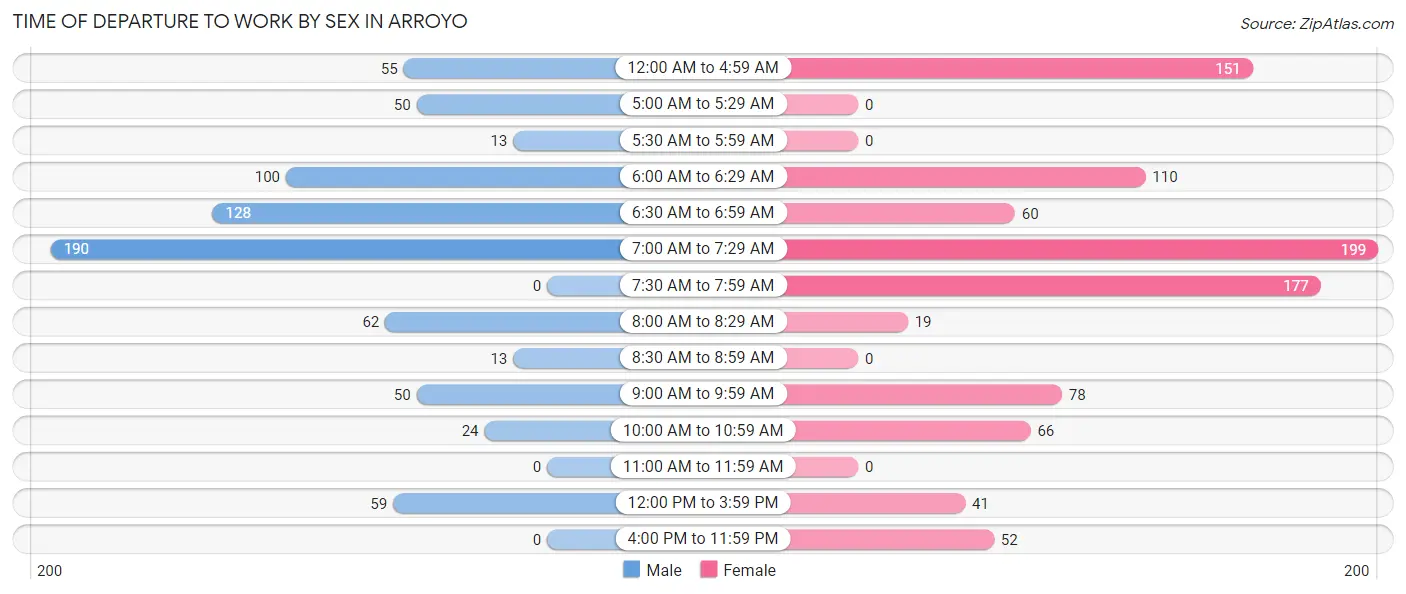
| Time of Departure | Male | Female |
| 12:00 AM to 4:59 AM | 55 (7.4%) | 151 (15.8%) |
| 5:00 AM to 5:29 AM | 50 (6.7%) | 0 (0.0%) |
| 5:30 AM to 5:59 AM | 13 (1.8%) | 0 (0.0%) |
| 6:00 AM to 6:29 AM | 100 (13.4%) | 110 (11.5%) |
| 6:30 AM to 6:59 AM | 128 (17.2%) | 60 (6.3%) |
| 7:00 AM to 7:29 AM | 190 (25.5%) | 199 (20.9%) |
| 7:30 AM to 7:59 AM | 0 (0.0%) | 177 (18.6%) |
| 8:00 AM to 8:29 AM | 62 (8.3%) | 19 (2.0%) |
| 8:30 AM to 8:59 AM | 13 (1.8%) | 0 (0.0%) |
| 9:00 AM to 9:59 AM | 50 (6.7%) | 78 (8.2%) |
| 10:00 AM to 10:59 AM | 24 (3.2%) | 66 (6.9%) |
| 11:00 AM to 11:59 AM | 0 (0.0%) | 0 (0.0%) |
| 12:00 PM to 3:59 PM | 59 (7.9%) | 41 (4.3%) |
| 4:00 PM to 11:59 PM | 0 (0.0%) | 52 (5.5%) |
| Total | 744 (100.0%) | 953 (100.0%) |
Housing Occupancy in Arroyo
Occupancy by Ownership in Arroyo
Of the total 3,019 dwellings in Arroyo, owner-occupied units account for 2,079 (68.9%), while renter-occupied units make up 940 (31.1%).
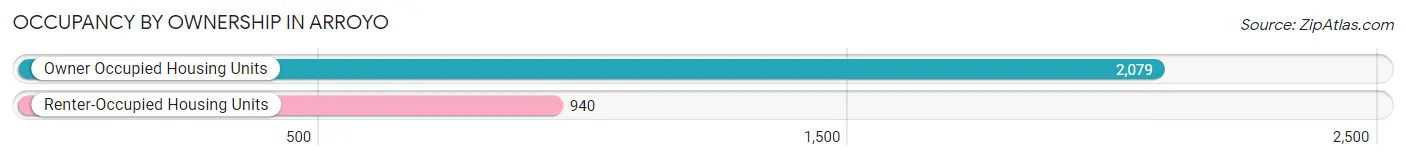
| Occupancy | # Housing Units | % Housing Units |
| Owner Occupied Housing Units | 2,079 | 68.9% |
| Renter-Occupied Housing Units | 940 | 31.1% |
| Total Occupied Housing Units | 3,019 | 100.0% |
Occupancy by Household Size in Arroyo
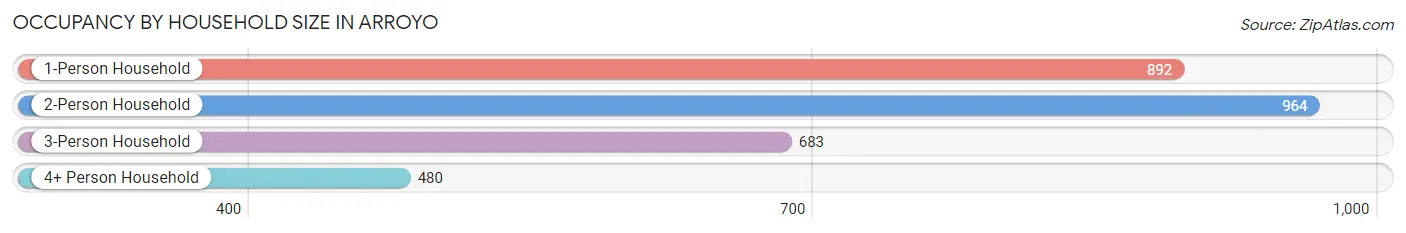
| Household Size | # Housing Units | % Housing Units |
| 1-Person Household | 892 | 29.5% |
| 2-Person Household | 964 | 31.9% |
| 3-Person Household | 683 | 22.6% |
| 4+ Person Household | 480 | 15.9% |
| Total Housing Units | 3,019 | 100.0% |
Occupancy by Ownership by Household Size in Arroyo
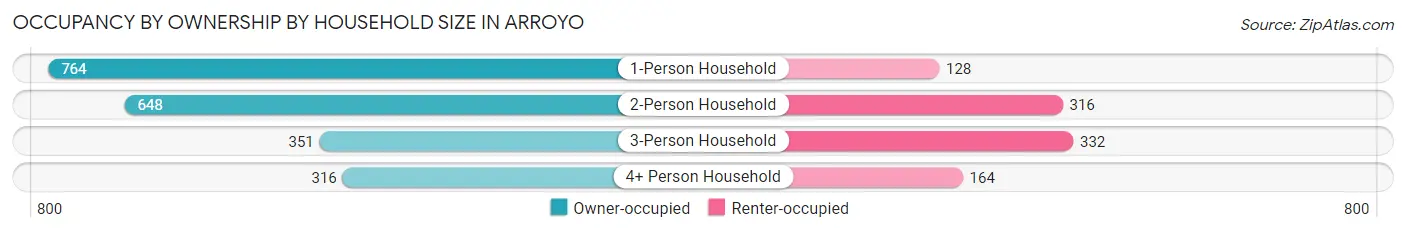
| Household Size | Owner-occupied | Renter-occupied |
| 1-Person Household | 764 (85.7%) | 128 (14.3%) |
| 2-Person Household | 648 (67.2%) | 316 (32.8%) |
| 3-Person Household | 351 (51.4%) | 332 (48.6%) |
| 4+ Person Household | 316 (65.8%) | 164 (34.2%) |
| Total Housing Units | 2,079 (68.9%) | 940 (31.1%) |
Occupancy by Educational Attainment in Arroyo
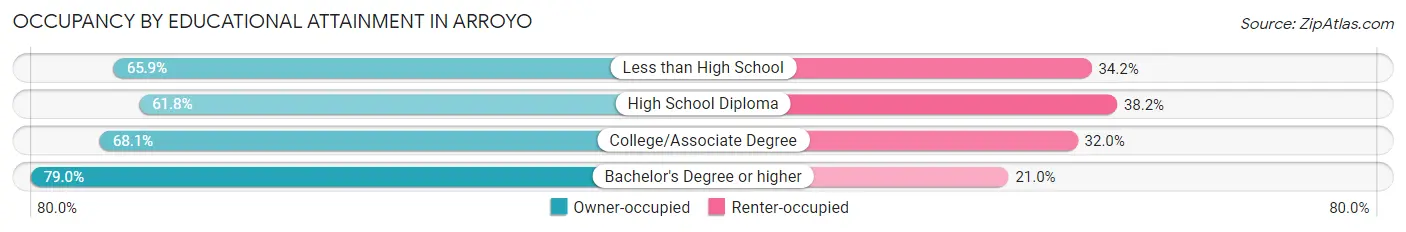
| Household Size | Owner-occupied | Renter-occupied |
| Less than High School | 270 (65.8%) | 140 (34.2%) |
| High School Diploma | 594 (61.8%) | 367 (38.2%) |
| College/Associate Degree | 541 (68.0%) | 254 (32.0%) |
| Bachelor's Degree or higher | 674 (79.0%) | 179 (21.0%) |
Occupancy by Age of Householder in Arroyo
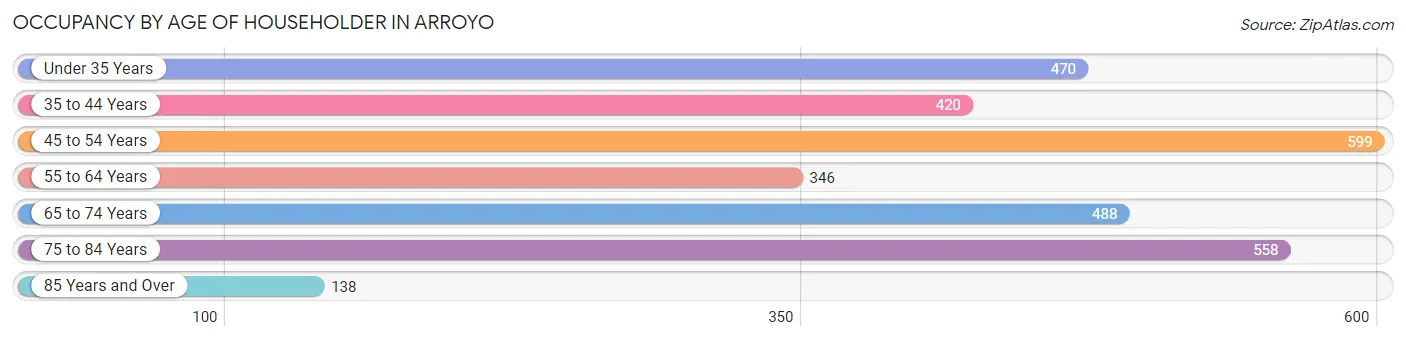
| Age Bracket | # Households | % Households |
| Under 35 Years | 470 | 15.6% |
| 35 to 44 Years | 420 | 13.9% |
| 45 to 54 Years | 599 | 19.8% |
| 55 to 64 Years | 346 | 11.5% |
| 65 to 74 Years | 488 | 16.2% |
| 75 to 84 Years | 558 | 18.5% |
| 85 Years and Over | 138 | 4.6% |
| Total | 3,019 | 100.0% |
Housing Finances in Arroyo
Median Income by Occupancy in Arroyo
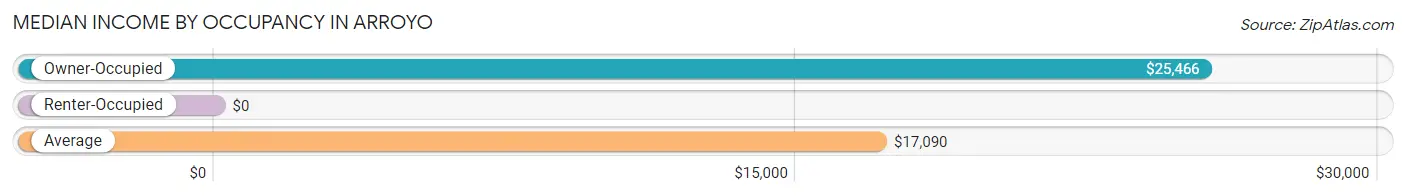
| Occupancy Type | # Households | Median Income |
| Owner-Occupied | 2,079 (68.9%) | $25,466 |
| Renter-Occupied | 940 (31.1%) | $0 |
| Average | 3,019 (100.0%) | $17,090 |
Occupancy by Householder Income Bracket in Arroyo
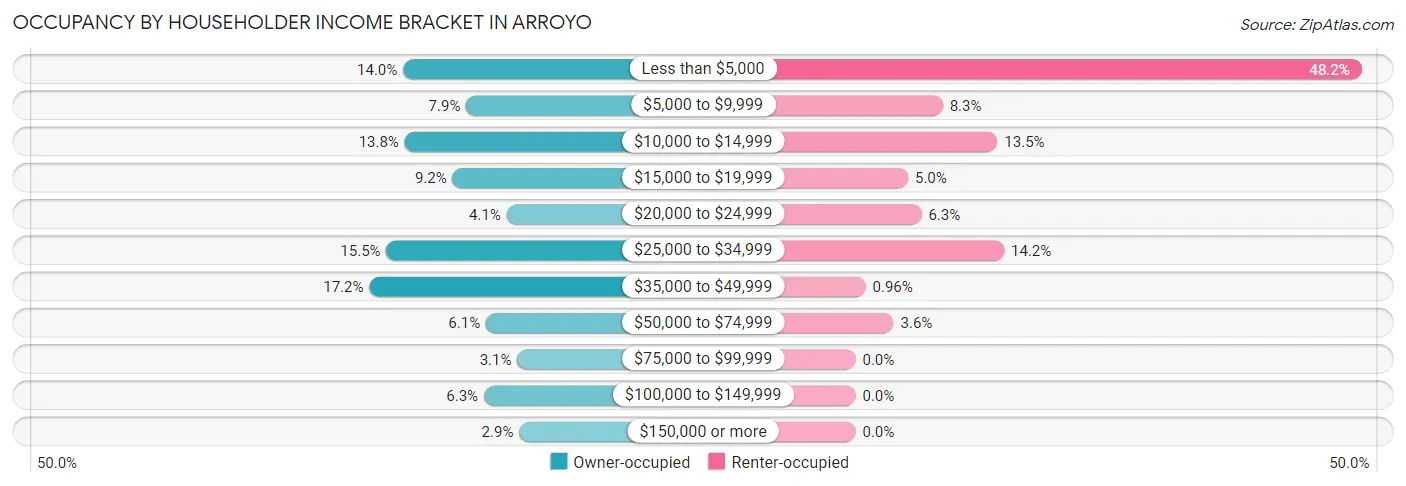
| Income Bracket | Owner-occupied | Renter-occupied |
| Less than $5,000 | 290 (14.0%) | 453 (48.2%) |
| $5,000 to $9,999 | 165 (7.9%) | 78 (8.3%) |
| $10,000 to $14,999 | 287 (13.8%) | 127 (13.5%) |
| $15,000 to $19,999 | 192 (9.2%) | 47 (5.0%) |
| $20,000 to $24,999 | 85 (4.1%) | 59 (6.3%) |
| $25,000 to $34,999 | 323 (15.5%) | 133 (14.1%) |
| $35,000 to $49,999 | 357 (17.2%) | 9 (1.0%) |
| $50,000 to $74,999 | 126 (6.1%) | 34 (3.6%) |
| $75,000 to $99,999 | 64 (3.1%) | 0 (0.0%) |
| $100,000 to $149,999 | 130 (6.2%) | 0 (0.0%) |
| $150,000 or more | 60 (2.9%) | 0 (0.0%) |
| Total | 2,079 (100.0%) | 940 (100.0%) |
Monthly Housing Cost Tiers in Arroyo
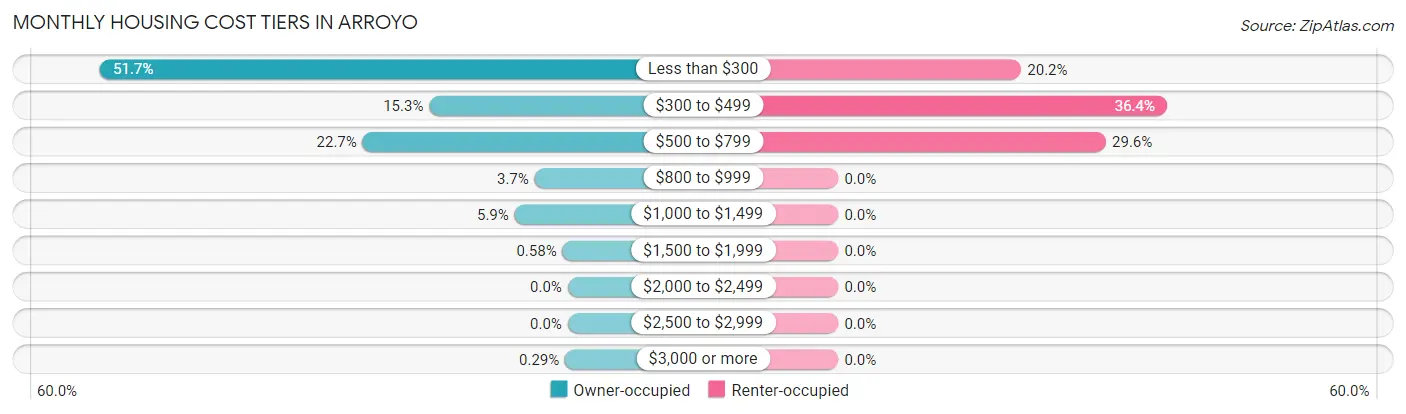
| Monthly Cost | Owner-occupied | Renter-occupied |
| Less than $300 | 1,074 (51.7%) | 190 (20.2%) |
| $300 to $499 | 318 (15.3%) | 342 (36.4%) |
| $500 to $799 | 471 (22.7%) | 278 (29.6%) |
| $800 to $999 | 76 (3.7%) | 0 (0.0%) |
| $1,000 to $1,499 | 122 (5.9%) | 0 (0.0%) |
| $1,500 to $1,999 | 12 (0.6%) | 0 (0.0%) |
| $2,000 to $2,499 | 0 (0.0%) | 0 (0.0%) |
| $2,500 to $2,999 | 0 (0.0%) | 0 (0.0%) |
| $3,000 or more | 6 (0.3%) | 0 (0.0%) |
| Total | 2,079 (100.0%) | 940 (100.0%) |
Physical Housing Characteristics in Arroyo
Housing Structures in Arroyo
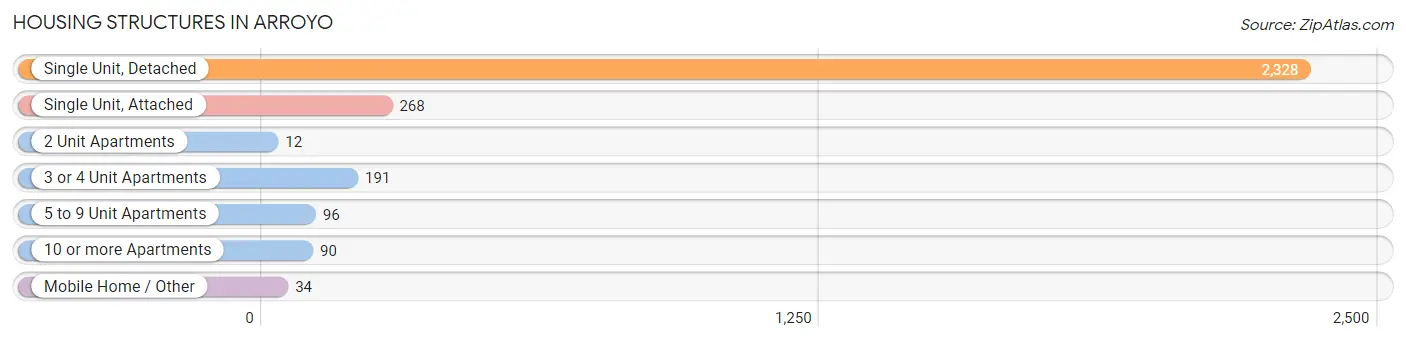
| Structure Type | # Housing Units | % Housing Units |
| Single Unit, Detached | 2,328 | 77.1% |
| Single Unit, Attached | 268 | 8.9% |
| 2 Unit Apartments | 12 | 0.4% |
| 3 or 4 Unit Apartments | 191 | 6.3% |
| 5 to 9 Unit Apartments | 96 | 3.2% |
| 10 or more Apartments | 90 | 3.0% |
| Mobile Home / Other | 34 | 1.1% |
| Total | 3,019 | 100.0% |
Housing Structures by Occupancy in Arroyo
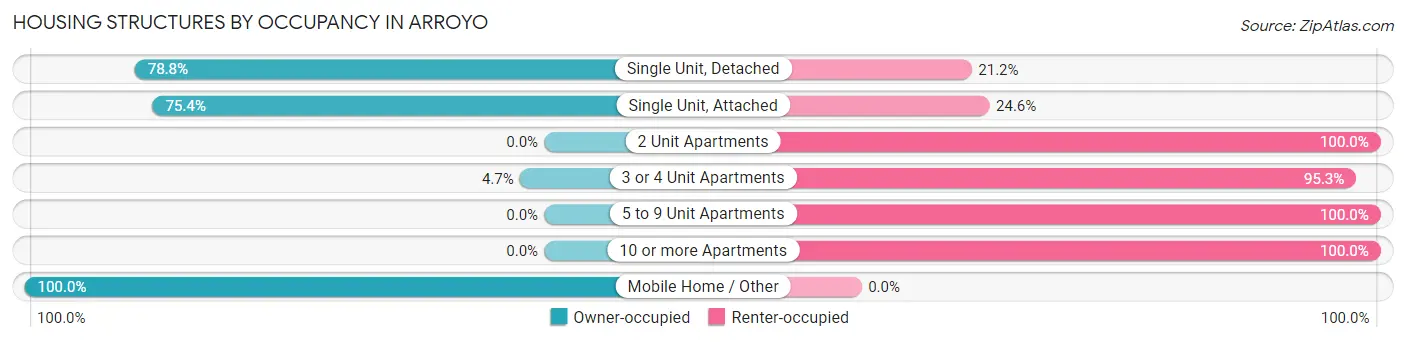
| Structure Type | Owner-occupied | Renter-occupied |
| Single Unit, Detached | 1,834 (78.8%) | 494 (21.2%) |
| Single Unit, Attached | 202 (75.4%) | 66 (24.6%) |
| 2 Unit Apartments | 0 (0.0%) | 12 (100.0%) |
| 3 or 4 Unit Apartments | 9 (4.7%) | 182 (95.3%) |
| 5 to 9 Unit Apartments | 0 (0.0%) | 96 (100.0%) |
| 10 or more Apartments | 0 (0.0%) | 90 (100.0%) |
| Mobile Home / Other | 34 (100.0%) | 0 (0.0%) |
| Total | 2,079 (68.9%) | 940 (31.1%) |
Housing Structures by Number of Rooms in Arroyo
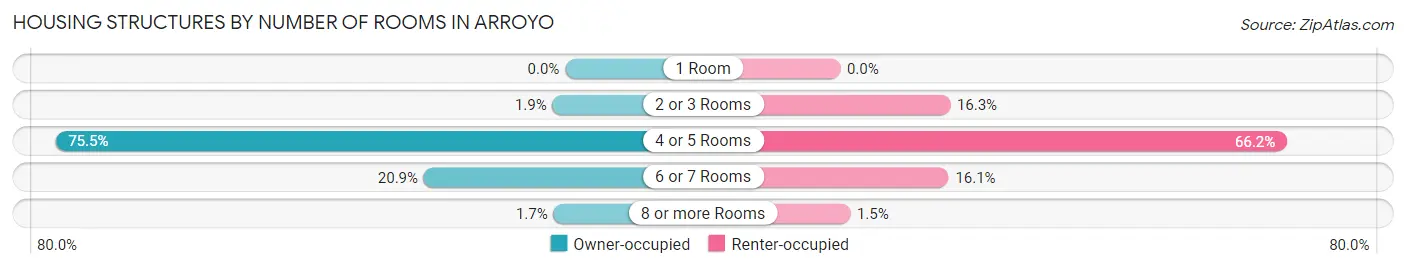
| Number of Rooms | Owner-occupied | Renter-occupied |
| 1 Room | 0 (0.0%) | 0 (0.0%) |
| 2 or 3 Rooms | 39 (1.9%) | 153 (16.3%) |
| 4 or 5 Rooms | 1,569 (75.5%) | 622 (66.2%) |
| 6 or 7 Rooms | 435 (20.9%) | 151 (16.1%) |
| 8 or more Rooms | 36 (1.7%) | 14 (1.5%) |
| Total | 2,079 (100.0%) | 940 (100.0%) |
Housing Structure by Heating Type in Arroyo
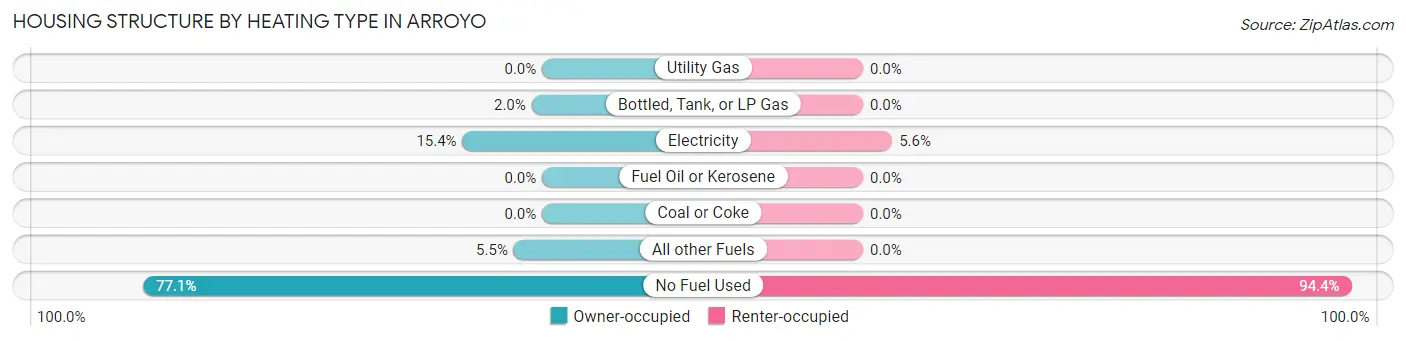
| Heating Type | Owner-occupied | Renter-occupied |
| Utility Gas | 0 (0.0%) | 0 (0.0%) |
| Bottled, Tank, or LP Gas | 42 (2.0%) | 0 (0.0%) |
| Electricity | 320 (15.4%) | 53 (5.6%) |
| Fuel Oil or Kerosene | 0 (0.0%) | 0 (0.0%) |
| Coal or Coke | 0 (0.0%) | 0 (0.0%) |
| All other Fuels | 114 (5.5%) | 0 (0.0%) |
| No Fuel Used | 1,603 (77.1%) | 887 (94.4%) |
| Total | 2,079 (100.0%) | 940 (100.0%) |
Household Vehicle Usage in Arroyo
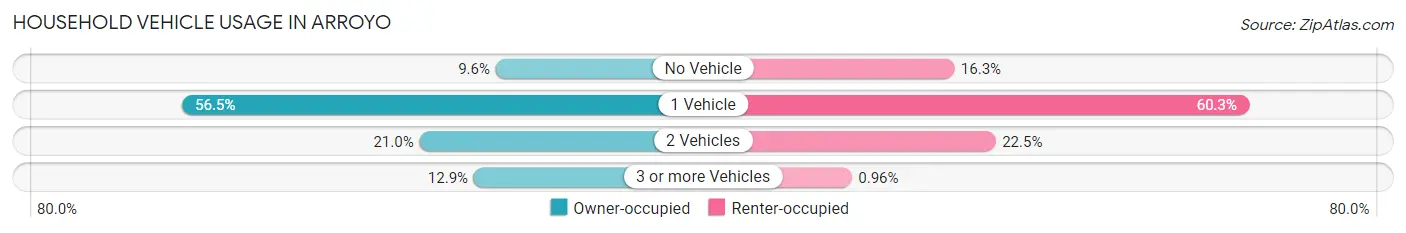
| Vehicles per Household | Owner-occupied | Renter-occupied |
| No Vehicle | 200 (9.6%) | 153 (16.3%) |
| 1 Vehicle | 1,174 (56.5%) | 567 (60.3%) |
| 2 Vehicles | 437 (21.0%) | 211 (22.5%) |
| 3 or more Vehicles | 268 (12.9%) | 9 (1.0%) |
| Total | 2,079 (100.0%) | 940 (100.0%) |
Real Estate & Mortgages in Arroyo
Real Estate and Mortgage Overview in Arroyo
| Characteristic | Without Mortgage | With Mortgage |
| Housing Units | 1,338 | 741 |
| Median Property Value | $82,600 | $109,700 |
| Median Household Income | $15,529 | $42 |
| Monthly Housing Costs | $170 | $0 |
| Real Estate Taxes | - | - |
Property Value by Mortgage Status in Arroyo
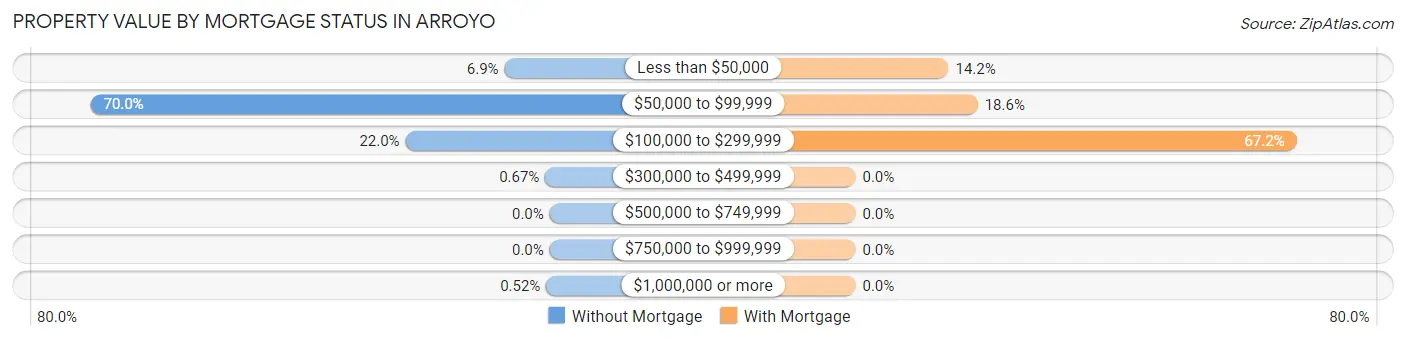
| Property Value | Without Mortgage | With Mortgage |
| Less than $50,000 | 92 (6.9%) | 105 (14.2%) |
| $50,000 to $99,999 | 936 (70.0%) | 138 (18.6%) |
| $100,000 to $299,999 | 294 (22.0%) | 498 (67.2%) |
| $300,000 to $499,999 | 9 (0.7%) | 0 (0.0%) |
| $500,000 to $749,999 | 0 (0.0%) | 0 (0.0%) |
| $750,000 to $999,999 | 0 (0.0%) | 0 (0.0%) |
| $1,000,000 or more | 7 (0.5%) | 0 (0.0%) |
| Total | 1,338 (100.0%) | 741 (100.0%) |
Household Income by Mortgage Status in Arroyo
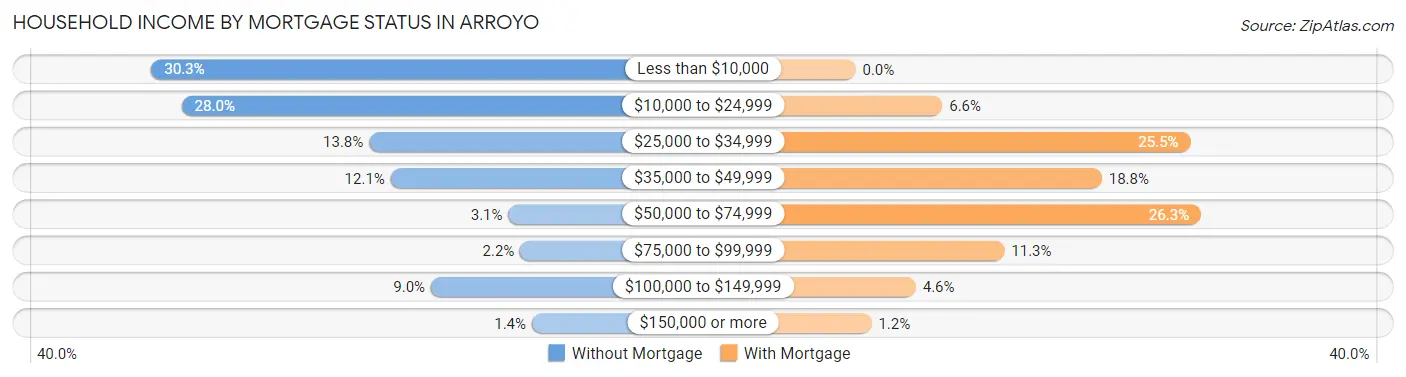
| Household Income | Without Mortgage | With Mortgage |
| Less than $10,000 | 406 (30.3%) | 0 (0.0%) |
| $10,000 to $24,999 | 375 (28.0%) | 49 (6.6%) |
| $25,000 to $34,999 | 184 (13.8%) | 189 (25.5%) |
| $35,000 to $49,999 | 162 (12.1%) | 139 (18.8%) |
| $50,000 to $74,999 | 42 (3.1%) | 195 (26.3%) |
| $75,000 to $99,999 | 30 (2.2%) | 84 (11.3%) |
| $100,000 to $149,999 | 121 (9.0%) | 34 (4.6%) |
| $150,000 or more | 18 (1.3%) | 9 (1.2%) |
| Total | 1,338 (100.0%) | 741 (100.0%) |
Property Value to Household Income Ratio in Arroyo
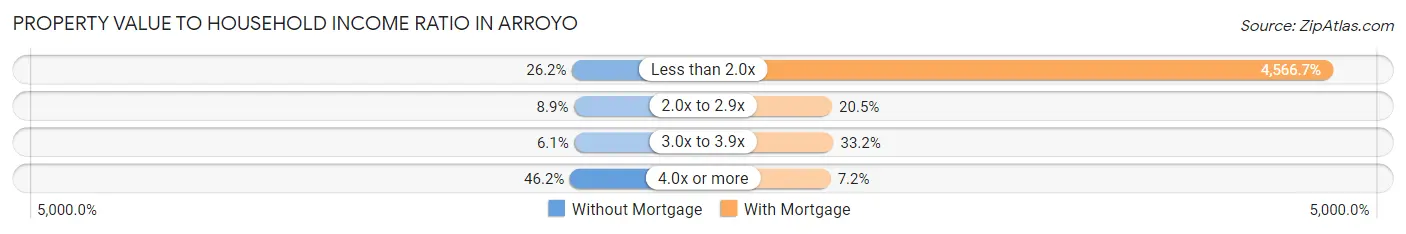
| Value-to-Income Ratio | Without Mortgage | With Mortgage |
| Less than 2.0x | 351 (26.2%) | 33,839 (4,566.7%) |
| 2.0x to 2.9x | 119 (8.9%) | 152 (20.5%) |
| 3.0x to 3.9x | 81 (6.0%) | 246 (33.2%) |
| 4.0x or more | 618 (46.2%) | 53 (7.1%) |
| Total | 1,338 (100.0%) | 741 (100.0%) |
Real Estate Taxes by Mortgage Status in Arroyo
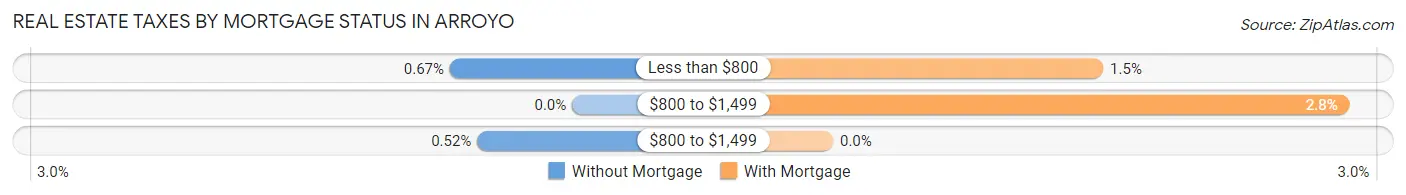
| Property Taxes | Without Mortgage | With Mortgage |
| Less than $800 | 9 (0.7%) | 11 (1.5%) |
| $800 to $1,499 | 0 (0.0%) | 21 (2.8%) |
| $800 to $1,499 | 7 (0.5%) | 0 (0.0%) |
| Total | 1,338 (100.0%) | 741 (100.0%) |
Health & Disability in Arroyo
Health Insurance Coverage by Age in Arroyo
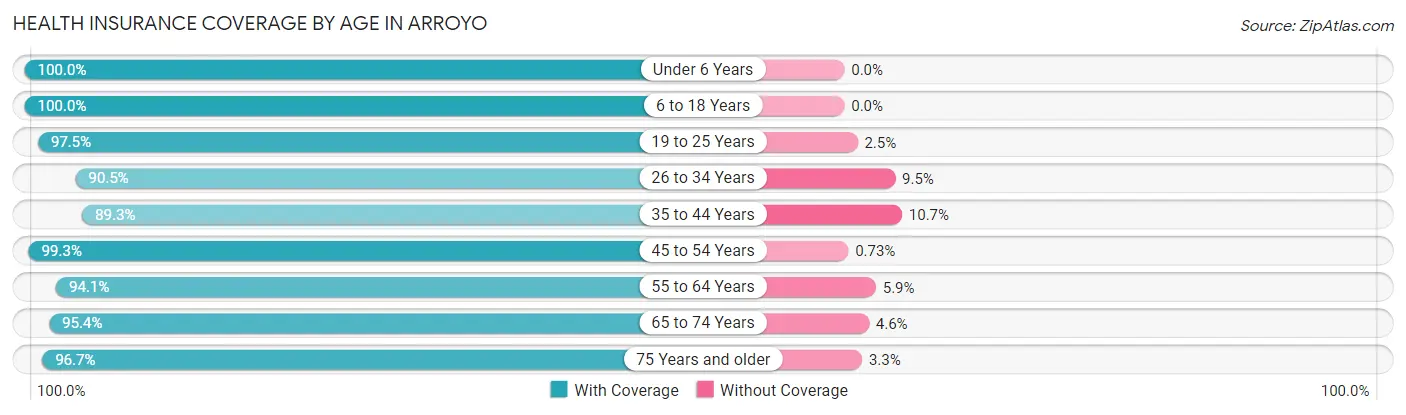
| Age Bracket | With Coverage | Without Coverage |
| Under 6 Years | 335 (100.0%) | 0 (0.0%) |
| 6 to 18 Years | 1,375 (100.0%) | 0 (0.0%) |
| 19 to 25 Years | 674 (97.5%) | 17 (2.5%) |
| 26 to 34 Years | 926 (90.5%) | 97 (9.5%) |
| 35 to 44 Years | 947 (89.3%) | 114 (10.7%) |
| 45 to 54 Years | 1,087 (99.3%) | 8 (0.7%) |
| 55 to 64 Years | 673 (94.1%) | 42 (5.9%) |
| 65 to 74 Years | 584 (95.4%) | 28 (4.6%) |
| 75 Years and older | 881 (96.7%) | 30 (3.3%) |
| Total | 7,482 (95.7%) | 336 (4.3%) |
Health Insurance Coverage by Citizenship Status in Arroyo
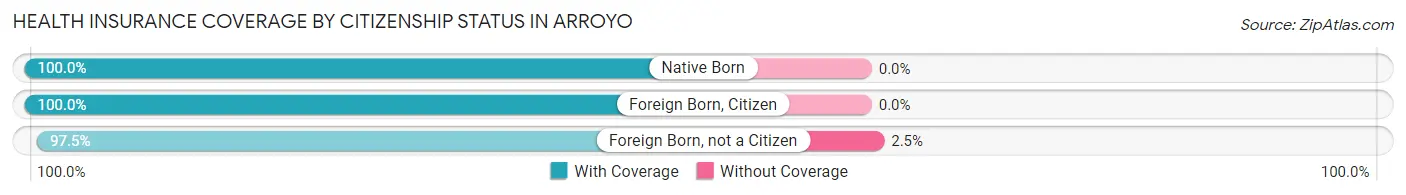
| Citizenship Status | With Coverage | Without Coverage |
| Native Born | 335 (100.0%) | 0 (0.0%) |
| Foreign Born, Citizen | 1,375 (100.0%) | 0 (0.0%) |
| Foreign Born, not a Citizen | 674 (97.5%) | 17 (2.5%) |
Health Insurance Coverage by Household Income in Arroyo
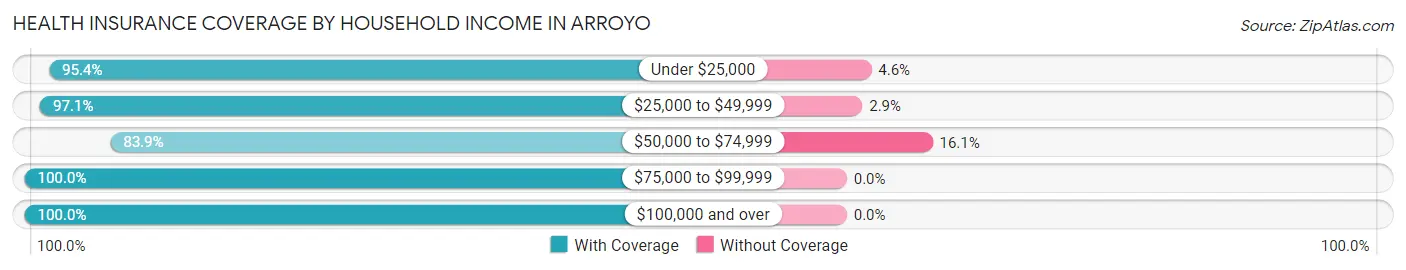
| Household Income | With Coverage | Without Coverage |
| Under $25,000 | 4,147 (95.4%) | 200 (4.6%) |
| $25,000 to $49,999 | 2,045 (97.1%) | 61 (2.9%) |
| $50,000 to $74,999 | 392 (83.9%) | 75 (16.1%) |
| $75,000 to $99,999 | 281 (100.0%) | 0 (0.0%) |
| $100,000 and over | 611 (100.0%) | 0 (0.0%) |
Public vs Private Health Insurance Coverage by Age in Arroyo
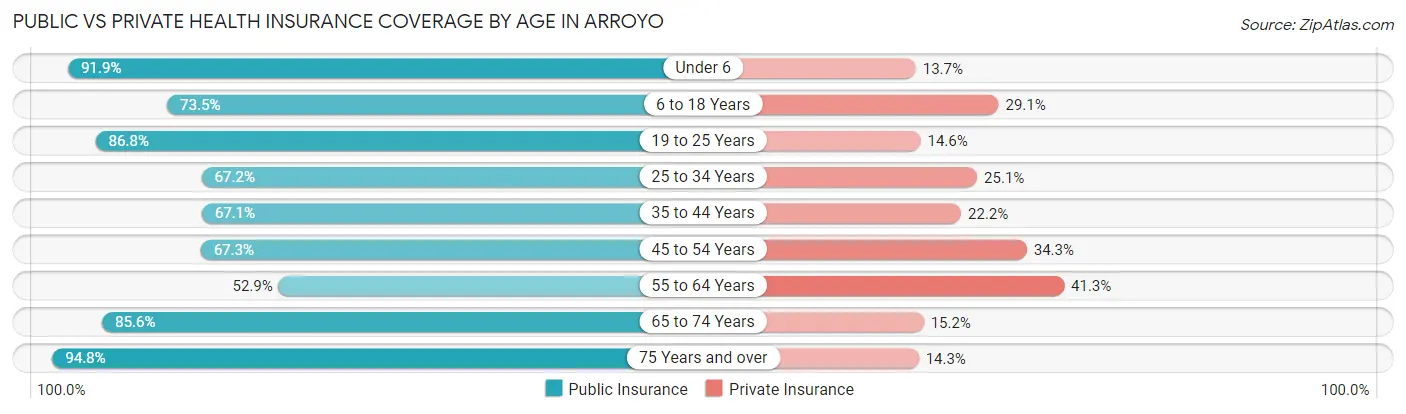
| Age Bracket | Public Insurance | Private Insurance |
| Under 6 | 308 (91.9%) | 46 (13.7%) |
| 6 to 18 Years | 1,011 (73.5%) | 400 (29.1%) |
| 19 to 25 Years | 600 (86.8%) | 101 (14.6%) |
| 25 to 34 Years | 687 (67.2%) | 257 (25.1%) |
| 35 to 44 Years | 712 (67.1%) | 235 (22.2%) |
| 45 to 54 Years | 737 (67.3%) | 376 (34.3%) |
| 55 to 64 Years | 378 (52.9%) | 295 (41.3%) |
| 65 to 74 Years | 524 (85.6%) | 93 (15.2%) |
| 75 Years and over | 864 (94.8%) | 130 (14.3%) |
| Total | 5,821 (74.5%) | 1,933 (24.7%) |
Disability Status by Sex by Age in Arroyo
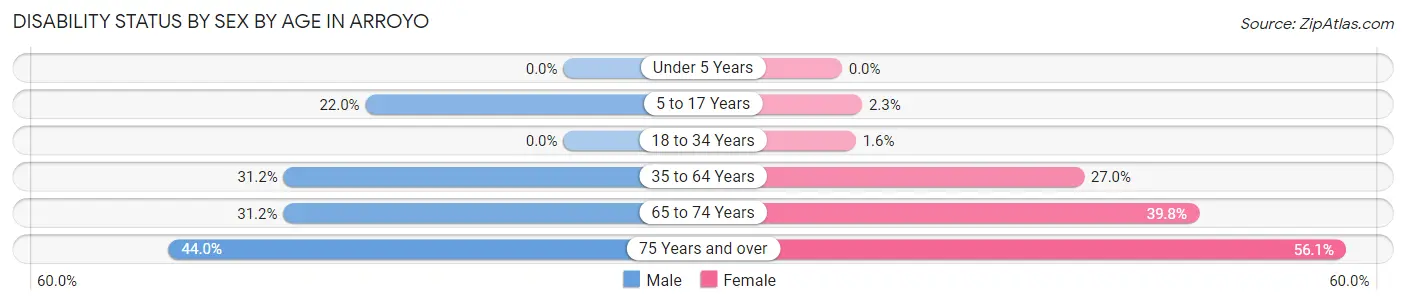
| Age Bracket | Male | Female |
| Under 5 Years | 0 (0.0%) | 0 (0.0%) |
| 5 to 17 Years | 149 (22.0%) | 12 (2.2%) |
| 18 to 34 Years | 0 (0.0%) | 16 (1.5%) |
| 35 to 64 Years | 401 (31.2%) | 427 (27.0%) |
| 65 to 74 Years | 63 (31.2%) | 163 (39.8%) |
| 75 Years and over | 178 (44.0%) | 284 (56.1%) |
Disability Class by Sex by Age in Arroyo
Disability Class: Hearing Difficulty
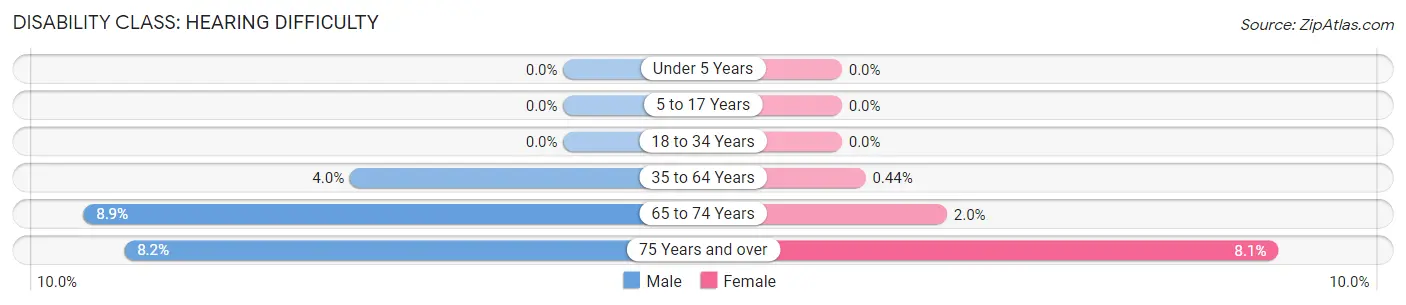
| Age Bracket | Male | Female |
| Under 5 Years | 0 (0.0%) | 0 (0.0%) |
| 5 to 17 Years | 0 (0.0%) | 0 (0.0%) |
| 18 to 34 Years | 0 (0.0%) | 0 (0.0%) |
| 35 to 64 Years | 51 (4.0%) | 7 (0.4%) |
| 65 to 74 Years | 18 (8.9%) | 8 (1.9%) |
| 75 Years and over | 33 (8.2%) | 41 (8.1%) |
Disability Class: Vision Difficulty
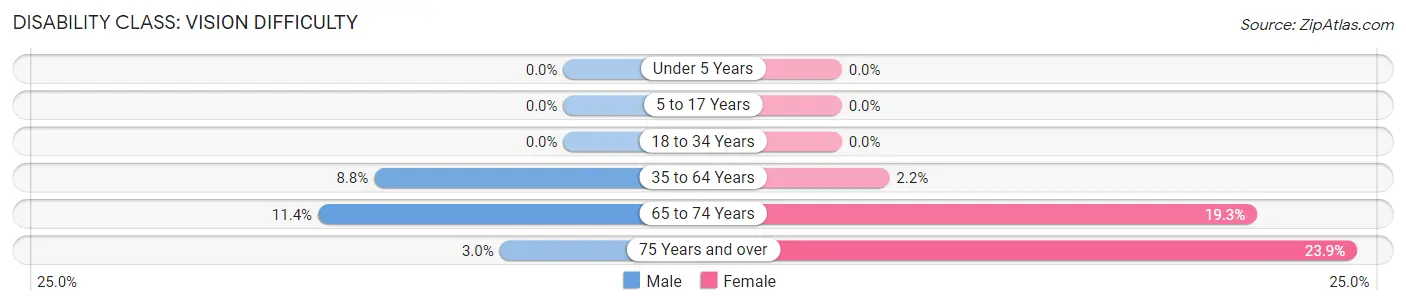
| Age Bracket | Male | Female |
| Under 5 Years | 0 (0.0%) | 0 (0.0%) |
| 5 to 17 Years | 0 (0.0%) | 0 (0.0%) |
| 18 to 34 Years | 0 (0.0%) | 0 (0.0%) |
| 35 to 64 Years | 113 (8.8%) | 35 (2.2%) |
| 65 to 74 Years | 23 (11.4%) | 79 (19.3%) |
| 75 Years and over | 12 (3.0%) | 121 (23.9%) |
Disability Class: Cognitive Difficulty
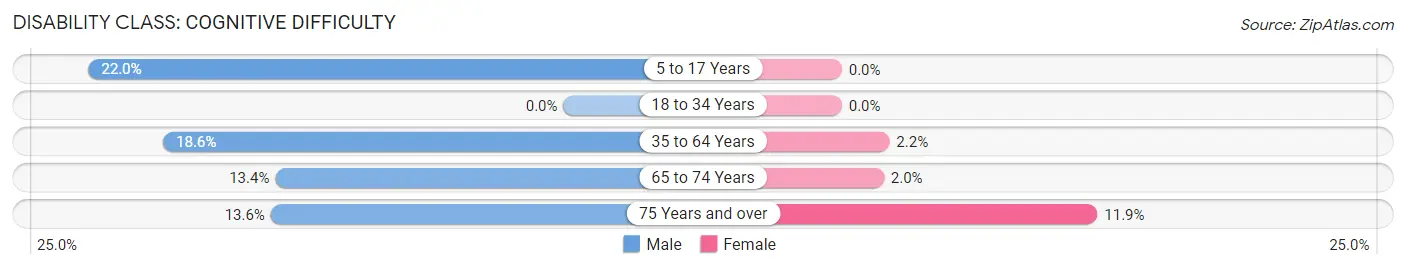
| Age Bracket | Male | Female |
| 5 to 17 Years | 149 (22.0%) | 0 (0.0%) |
| 18 to 34 Years | 0 (0.0%) | 0 (0.0%) |
| 35 to 64 Years | 239 (18.6%) | 35 (2.2%) |
| 65 to 74 Years | 27 (13.4%) | 8 (1.9%) |
| 75 Years and over | 55 (13.6%) | 60 (11.9%) |
Disability Class: Ambulatory Difficulty
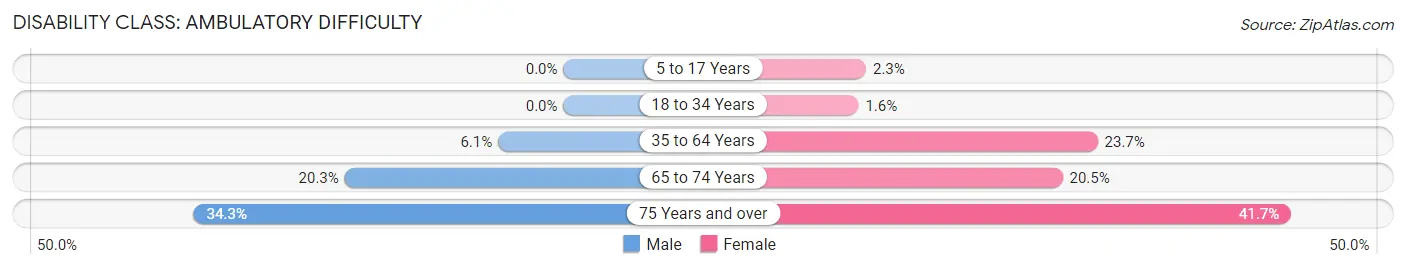
| Age Bracket | Male | Female |
| 5 to 17 Years | 0 (0.0%) | 12 (2.2%) |
| 18 to 34 Years | 0 (0.0%) | 16 (1.5%) |
| 35 to 64 Years | 78 (6.1%) | 376 (23.7%) |
| 65 to 74 Years | 41 (20.3%) | 84 (20.5%) |
| 75 Years and over | 139 (34.3%) | 211 (41.7%) |
Disability Class: Self-Care Difficulty
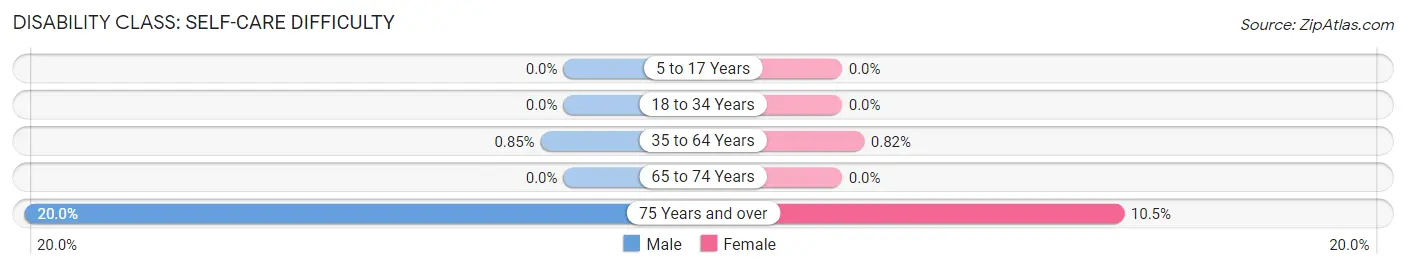
| Age Bracket | Male | Female |
| 5 to 17 Years | 0 (0.0%) | 0 (0.0%) |
| 18 to 34 Years | 0 (0.0%) | 0 (0.0%) |
| 35 to 64 Years | 11 (0.9%) | 13 (0.8%) |
| 65 to 74 Years | 0 (0.0%) | 0 (0.0%) |
| 75 Years and over | 81 (20.0%) | 53 (10.5%) |
Technology Access in Arroyo
Computing Device Access in Arroyo
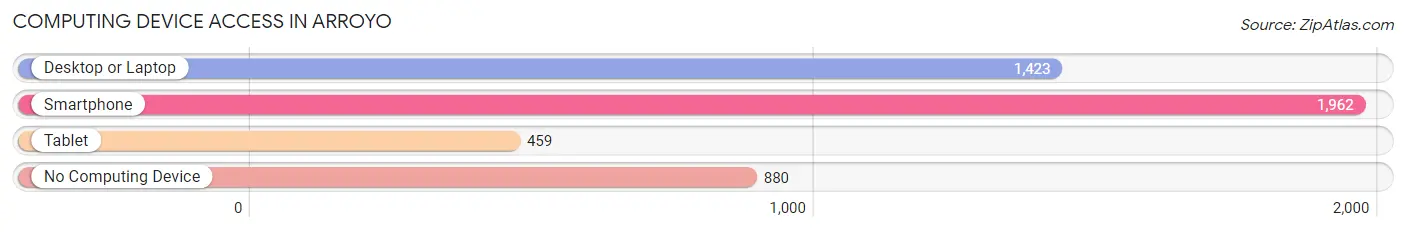
| Device Type | # Households | % Households |
| Desktop or Laptop | 1,423 | 47.1% |
| Smartphone | 1,962 | 65.0% |
| Tablet | 459 | 15.2% |
| No Computing Device | 880 | 29.1% |
| Total | 3,019 | 100.0% |
Internet Access in Arroyo
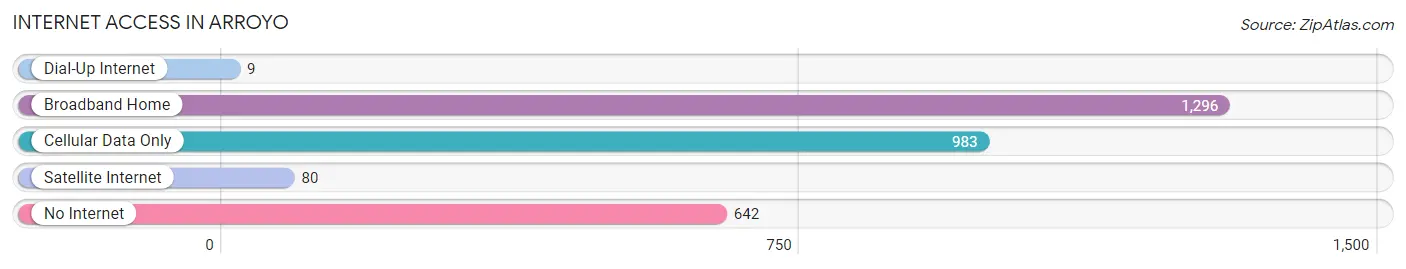
| Internet Type | # Households | % Households |
| Dial-Up Internet | 9 | 0.3% |
| Broadband Home | 1,296 | 42.9% |
| Cellular Data Only | 983 | 32.6% |
| Satellite Internet | 80 | 2.6% |
| No Internet | 642 | 21.3% |
| Total | 3,019 | 100.0% |
Arroyo Summary
Arroyo is a municipality located in the southern coast of Puerto Rico, in the region known as the Southern Coastal Plain. It is bordered by the municipalities of Patillas, Salinas, and Guayama. The municipality of Arroyo is part of the Guayama Metropolitan Statistical Area.
History
Arroyo was founded in 1803 by Don Juan de la Cruz. The name of the town was derived from the Arroyo de la Torrecilla, a stream that runs through the area. The town was originally part of the municipality of Patillas, but was separated in 1855.
Geography
Arroyo is located in the southern coast of Puerto Rico, in the region known as the Southern Coastal Plain. It is bordered by the municipalities of Patillas, Salinas, and Guayama. The municipality of Arroyo is part of the Guayama Metropolitan Statistical Area.
The municipality of Arroyo is located in the southern coast of Puerto Rico, in the region known as the Southern Coastal Plain. It is bordered by the municipalities of Patillas, Salinas, and Guayama. The municipality of Arroyo is part of the Guayama Metropolitan Statistical Area.
The municipality of Arroyo is located in the southern coast of Puerto Rico, in the region known as the Southern Coastal Plain. It is bordered by the municipalities of Patillas, Salinas, and Guayama. The municipality of Arroyo is part of the Guayama Metropolitan Statistical Area.
The municipality of Arroyo is located in the southern coast of Puerto Rico, in the region known as the Southern Coastal Plain. It is bordered by the municipalities of Patillas, Salinas, and Guayama. The municipality of Arroyo is part of the Guayama Metropolitan Statistical Area.
The municipality of Arroyo is located in the southern coast of Puerto Rico, in the region known as the Southern Coastal Plain. It is bordered by the municipalities of Patillas, Salinas, and Guayama. The municipality of Arroyo is part of the Guayama Metropolitan Statistical Area.
The municipality of Arroyo is located in the southern coast of Puerto Rico, in the region known as the Southern Coastal Plain. It is bordered by the municipalities of Patillas, Salinas, and Guayama. The municipality of Arroyo is part of the Guayama Metropolitan Statistical Area.
The municipality of Arroyo is located in the southern coast of Puerto Rico, in the region known as the Southern Coastal Plain. It is bordered by the municipalities of Patillas, Salinas, and Guayama. The municipality of Arroyo is part of the Guayama Metropolitan Statistical Area.
The municipality of Arroyo is located in the southern coast of Puerto Rico, in the region known as the Southern Coastal Plain. It is bordered by the municipalities of Patillas, Salinas, and Guayama. The municipality of Arroyo is part of the Guayama Metropolitan Statistical Area.
The municipality of Arroyo is located in the southern coast of Puerto Rico, in the region known as the Southern Coastal Plain. It is bordered by the municipalities of Patillas, Salinas, and Guayama. The municipality of Arroyo is part of the Guayama Metropolitan Statistical Area.
The municipality of Arroyo is located in the southern coast of Puerto Rico, in the region known as the Southern Coastal Plain. It is bordered by the municipalities of Patillas, Salinas, and Guayama. The municipality of Arroyo is part of the Guayama Metropolitan Statistical Area.
Economy
The economy of Arroyo is mainly based on agriculture and fishing. The main crops grown in the area are sugarcane, plantains, and bananas. The fishing industry is also important, with the main catches being shrimp, lobster, and conch.
The municipality also has a small manufacturing sector, with the main industries being food processing, textiles, and electronics.
Demographics
As of the 2000 census, the population of Arroyo was 24,845. The racial makeup of the municipality was 79.2% White, 0.3% African American, 0.2% Native American, 0.2% Asian, 0.1% Pacific Islander, 19.2% from other races, and 0.9% from two or more races. Hispanic or Latino of any race were 98.2% of the population.
The median household income in Arroyo was $13,945, and the median family income was $15,945. The per capita income was $6,845. About 33.2% of the population was below the poverty line.
Common Questions
What is Per Capita Income in Arroyo?
Per Capita income in Arroyo is $13,943.
What is the Median Family Income in Arroyo?
Median Family Income in Arroyo is $19,335.
What is the Median Household income in Arroyo?
Median Household Income in Arroyo is $17,090.
What is Income or Wage Gap in Arroyo?
Income or Wage Gap in Arroyo is 22.4%.
Women in Arroyo earn 77.6 cents for every dollar earned by a man.
What is Family Income Deficit in Arroyo?
Family Income Deficit in Arroyo is $13,045.
Families that are below poverty line in Arroyo earn $13,045 less on average than the poverty threshold level.
What is Inequality or Gini Index in Arroyo?
Inequality or Gini Index in Arroyo is 0.65.
What is the Total Population of Arroyo?
Total Population of Arroyo is 7,818.
What is the Total Male Population of Arroyo?
Total Male Population of Arroyo is 3,631.
What is the Total Female Population of Arroyo?
Total Female Population of Arroyo is 4,187.
What is the Ratio of Males per 100 Females in Arroyo?
There are 86.72 Males per 100 Females in Arroyo.
What is the Ratio of Females per 100 Males in Arroyo?
There are 115.31 Females per 100 Males in Arroyo.
What is the Median Population Age in Arroyo?
Median Population Age in Arroyo is 40.5 Years.
What is the Average Family Size in Arroyo
Average Family Size in Arroyo is 3.1 People.
What is the Average Household Size in Arroyo
Average Household Size in Arroyo is 2.6 People.
How Large is the Labor Force in Arroyo?
There are 2,166 People in the Labor Forcein in Arroyo.
What is the Percentage of People in the Labor Force in Arroyo?
32.9% of People are in the Labor Force in Arroyo.
What is the Unemployment Rate in Arroyo?
Unemployment Rate in Arroyo is 18.5%.