Catano, PR Map & Demographics
Catano Overview
$14,094
PER CAPITA INCOME
$26,691
AVG FAMILY INCOME
$22,407
AVG HOUSEHOLD INCOME
4.6%
WAGE / INCOME GAP [ % ]
95.4¢/ $1
WAGE / INCOME GAP [ $ ]
$12,344
FAMILY INCOME DEFICIT
0.55
INEQUALITY / GINI INDEX
23,060
TOTAL POPULATION
10,835
MALE POPULATION
12,225
FEMALE POPULATION
88.63
MALES / 100 FEMALES
112.83
FEMALES / 100 MALES
42.9
MEDIAN AGE
3.2
AVG FAMILY SIZE
2.6
AVG HOUSEHOLD SIZE
8,477
LABOR FORCE [ PEOPLE ]
43.6%
PERCENT IN LABOR FORCE
13.7%
UNEMPLOYMENT RATE
Catano Zip Codes
Catano Area Codes
Income in Catano
Income Overview in Catano
Per Capita Income in Catano is $14,094, while median incomes of families and households are $26,691 and $22,407 respectively.
| Characteristic | Number | Measure |
| Per Capita Income | 23,060 | $14,094 |
| Median Family Income | 6,046 | $26,691 |
| Mean Family Income | 6,046 | $40,004 |
| Median Household Income | 8,794 | $22,407 |
| Mean Household Income | 8,794 | $34,146 |
| Income Deficit | 6,046 | $12,344 |
| Wage / Income Gap (%) | 23,060 | 4.59% |
| Wage / Income Gap ($) | 23,060 | 95.41¢ per $1 |
| Gini / Inequality Index | 23,060 | 0.55 |
Earnings by Sex in Catano
Average Earnings in Catano are $21,497, $21,919 for men and $20,912 for women, a difference of 4.6%.
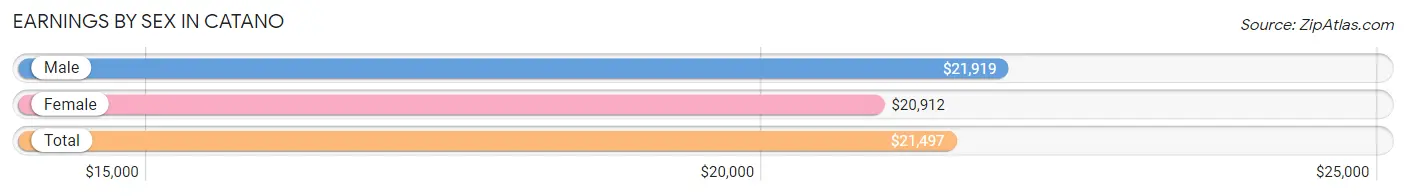
| Sex | Number | Average Earnings |
| Male | 4,127 (53.3%) | $21,919 |
| Female | 3,617 (46.7%) | $20,912 |
| Total | 7,744 (100.0%) | $21,497 |
Earnings by Sex by Income Bracket in Catano
The most common earnings brackets in Catano are $15,000 to $17,499 for men (468 | 11.3%) and $25,000 to $29,999 for women (474 | 13.1%).
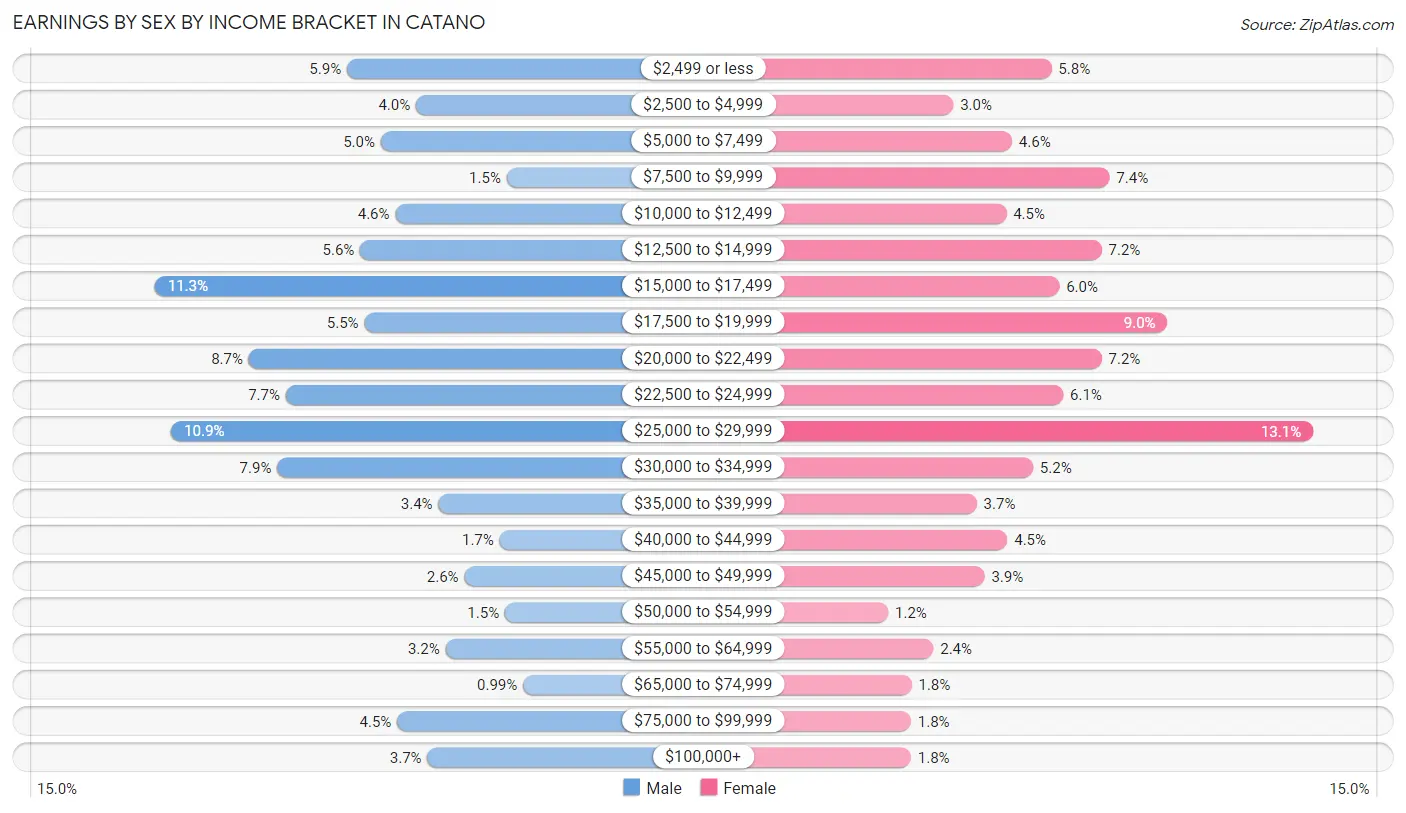
| Income | Male | Female |
| $2,499 or less | 245 (5.9%) | 208 (5.8%) |
| $2,500 to $4,999 | 165 (4.0%) | 108 (3.0%) |
| $5,000 to $7,499 | 206 (5.0%) | 168 (4.6%) |
| $7,500 to $9,999 | 60 (1.5%) | 267 (7.4%) |
| $10,000 to $12,499 | 189 (4.6%) | 162 (4.5%) |
| $12,500 to $14,999 | 230 (5.6%) | 259 (7.2%) |
| $15,000 to $17,499 | 468 (11.3%) | 216 (6.0%) |
| $17,500 to $19,999 | 225 (5.4%) | 326 (9.0%) |
| $20,000 to $22,499 | 359 (8.7%) | 259 (7.2%) |
| $22,500 to $24,999 | 316 (7.7%) | 220 (6.1%) |
| $25,000 to $29,999 | 449 (10.9%) | 474 (13.1%) |
| $30,000 to $34,999 | 326 (7.9%) | 189 (5.2%) |
| $35,000 to $39,999 | 139 (3.4%) | 132 (3.6%) |
| $40,000 to $44,999 | 68 (1.7%) | 163 (4.5%) |
| $45,000 to $49,999 | 109 (2.6%) | 140 (3.9%) |
| $50,000 to $54,999 | 62 (1.5%) | 42 (1.2%) |
| $55,000 to $64,999 | 131 (3.2%) | 88 (2.4%) |
| $65,000 to $74,999 | 41 (1.0%) | 66 (1.8%) |
| $75,000 to $99,999 | 187 (4.5%) | 65 (1.8%) |
| $100,000+ | 152 (3.7%) | 65 (1.8%) |
| Total | 4,127 (100.0%) | 3,617 (100.0%) |
Earnings by Sex by Educational Attainment in Catano
Average earnings in Catano are $23,252 for men and $22,046 for women, a difference of 5.2%. Men with an educational attainment of graduate degree enjoy the highest average annual earnings of $83,194, while those with less than high school education earn the least with $16,946. Women with an educational attainment of graduate degree earn the most with the average annual earnings of $29,836, while those with less than high school education have the smallest earnings of $12,333.
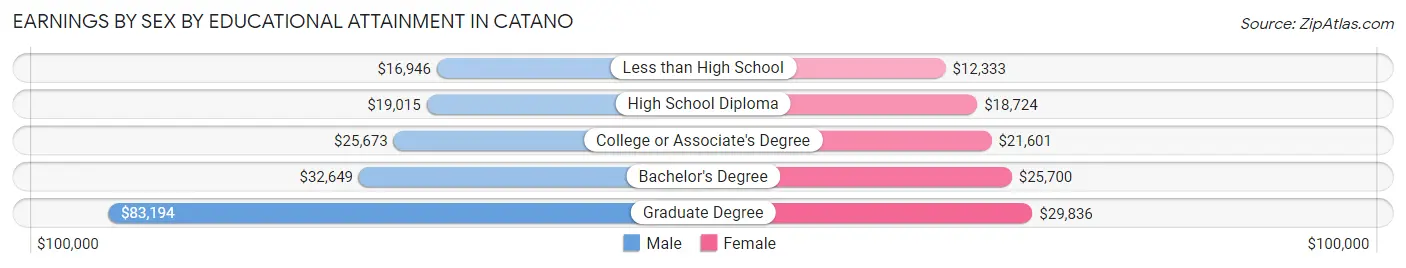
| Educational Attainment | Male Income | Female Income |
| Less than High School | $16,946 | $12,333 |
| High School Diploma | $19,015 | $18,724 |
| College or Associate's Degree | $25,673 | $21,601 |
| Bachelor's Degree | $32,649 | $25,700 |
| Graduate Degree | $83,194 | $29,836 |
| Total | $23,252 | $22,046 |
Family Income in Catano
Family Income Brackets in Catano
According to the Catano family income data, there are 1,288 families falling into the less than $10,000 income range, which is the most common income bracket and makes up 21.3% of all families. Conversely, the $200,000+ income bracket is the least frequent group with only 48 families (0.8%) belonging to this category.
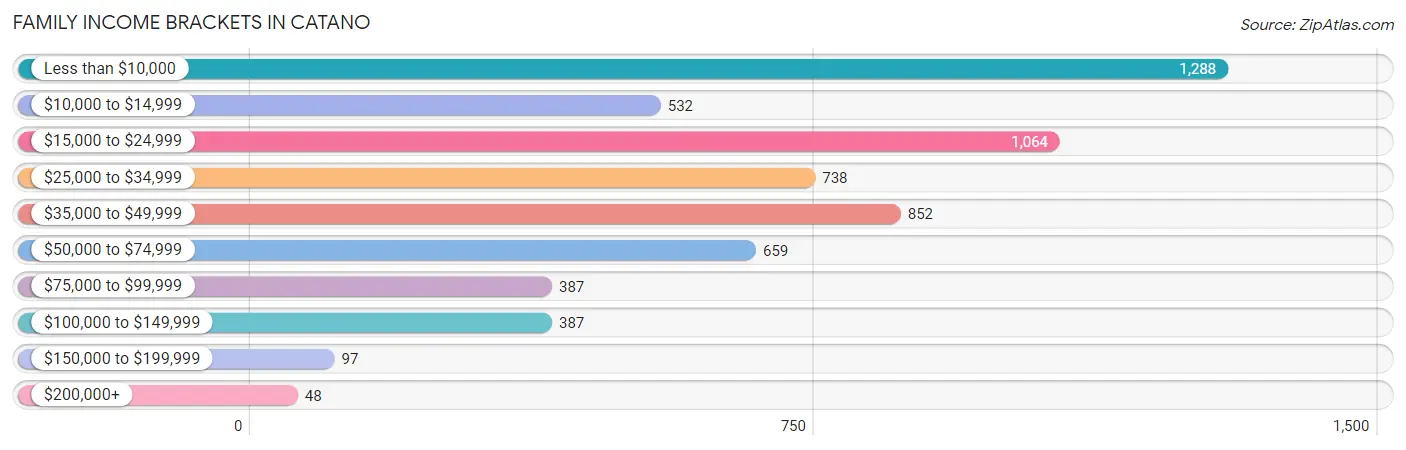
| Income Bracket | # Families | % Families |
| Less than $10,000 | 1,288 | 21.3% |
| $10,000 to $14,999 | 532 | 8.8% |
| $15,000 to $24,999 | 1,064 | 17.6% |
| $25,000 to $34,999 | 738 | 12.2% |
| $35,000 to $49,999 | 852 | 14.1% |
| $50,000 to $74,999 | 659 | 10.9% |
| $75,000 to $99,999 | 387 | 6.4% |
| $100,000 to $149,999 | 387 | 6.4% |
| $150,000 to $199,999 | 97 | 1.6% |
| $200,000+ | 48 | 0.8% |
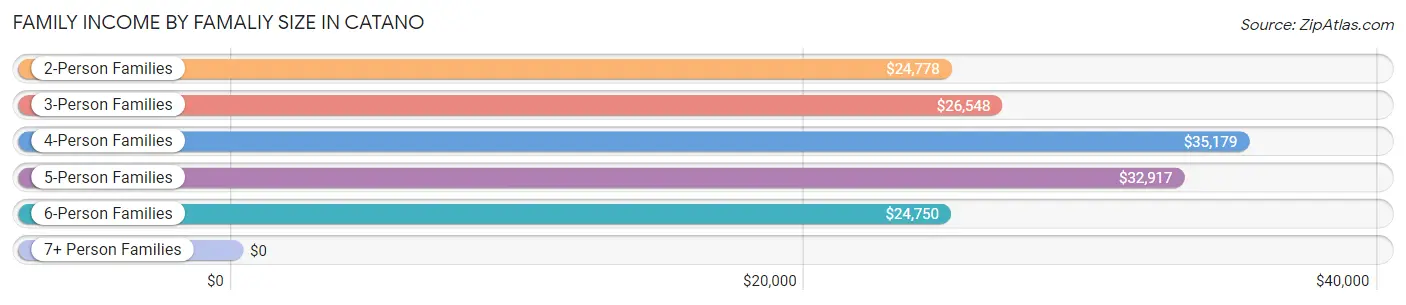
Family Income by Famaliy Size in Catano
4-person families (943 | 15.6%) account for the highest median family income in Catano with $35,179 per family, while 2-person families (3,109 | 51.4%) have the highest median income of $12,389 per family member.
| Income Bracket | # Families | Median Income |
| 2-Person Families | 3,109 (51.4%) | $24,778 |
| 3-Person Families | 1,624 (26.9%) | $26,548 |
| 4-Person Families | 943 (15.6%) | $35,179 |
| 5-Person Families | 248 (4.1%) | $32,917 |
| 6-Person Families | 60 (1.0%) | $24,750 |
| 7+ Person Families | 62 (1.0%) | $0 |
| Total | 6,046 (100.0%) | $26,691 |
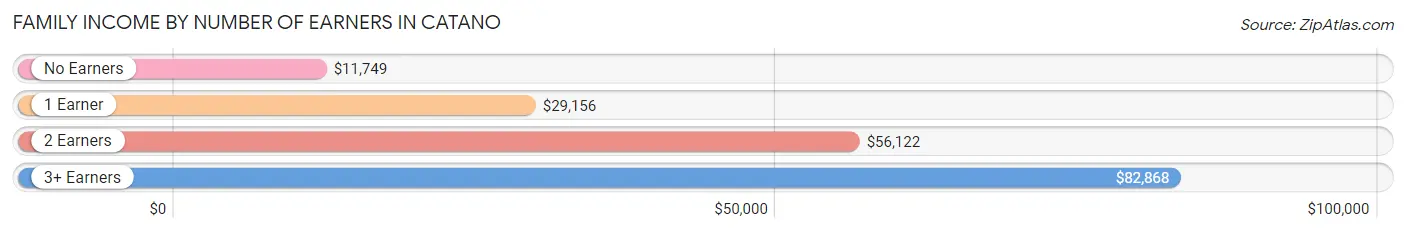
Family Income by Number of Earners in Catano
The median family income in Catano is $26,691, with families comprising 3+ earners (177) having the highest median family income of $82,868, while families with no earners (2,397) have the lowest median family income of $11,749, accounting for 2.9% and 39.7% of families, respectively.
| Number of Earners | # Families | Median Income |
| No Earners | 2,397 (39.7%) | $11,749 |
| 1 Earner | 2,085 (34.5%) | $29,156 |
| 2 Earners | 1,387 (22.9%) | $56,122 |
| 3+ Earners | 177 (2.9%) | $82,868 |
| Total | 6,046 (100.0%) | $26,691 |
Household Income in Catano
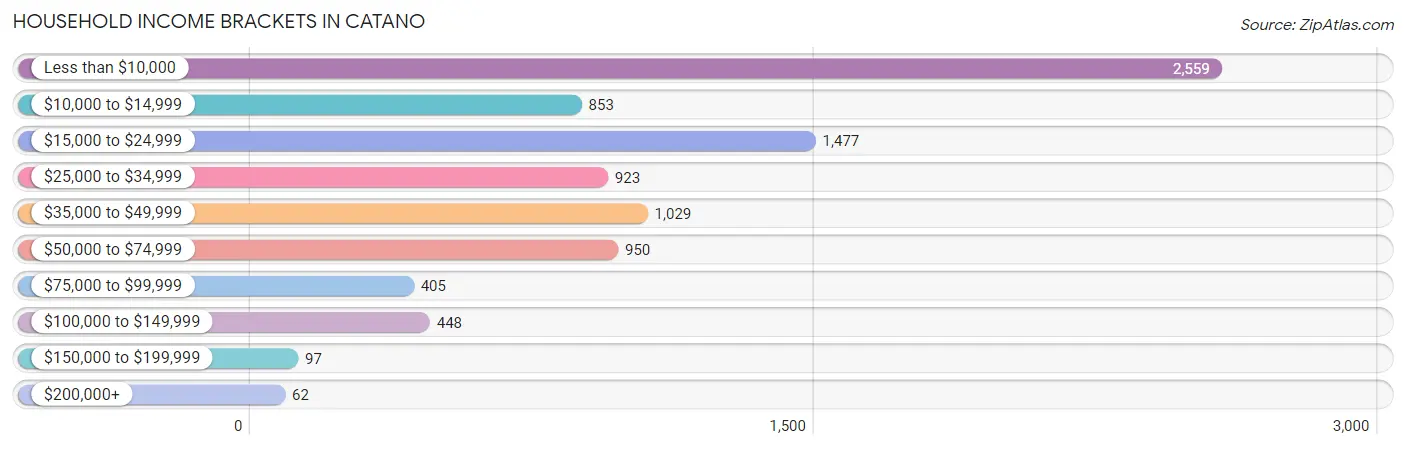
Household Income Brackets in Catano
With 2,559 households falling in the category, the less than $10,000 income range is the most frequent in Catano, accounting for 29.1% of all households. In contrast, only 62 households (0.7%) fall into the $200,000+ income bracket, making it the least populous group.
| Income Bracket | # Households | % Households |
| Less than $10,000 | 2,559 | 29.1% |
| $10,000 to $14,999 | 853 | 9.7% |
| $15,000 to $24,999 | 1,477 | 16.8% |
| $25,000 to $34,999 | 923 | 10.5% |
| $35,000 to $49,999 | 1,029 | 11.7% |
| $50,000 to $74,999 | 950 | 10.8% |
| $75,000 to $99,999 | 405 | 4.6% |
| $100,000 to $149,999 | 448 | 5.1% |
| $150,000 to $199,999 | 97 | 1.1% |
| $200,000+ | 62 | 0.7% |
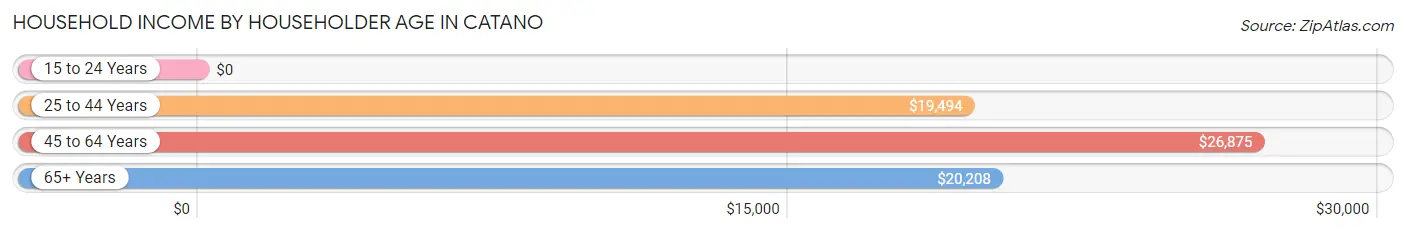
Household Income by Householder Age in Catano
The median household income in Catano is $22,407, with the highest median household income of $26,875 found in the 45 to 64 years age bracket for the primary householder. A total of 3,255 households (37.0%) fall into this category. Meanwhile, the 15 to 24 years age bracket for the primary householder has the lowest median household income of $0, with 109 households (1.2%) in this group.
| Income Bracket | # Households | Median Income |
| 15 to 24 Years | 109 (1.2%) | $0 |
| 25 to 44 Years | 2,314 (26.3%) | $19,494 |
| 45 to 64 Years | 3,255 (37.0%) | $26,875 |
| 65+ Years | 3,116 (35.4%) | $20,208 |
| Total | 8,794 (100.0%) | $22,407 |
Poverty in Catano
Income Below Poverty by Sex and Age in Catano
With 43.7% poverty level for males and 47.3% for females among the residents of Catano, 15 year old males and 5 year old females are the most vulnerable to poverty, with 114 males (87.0%) and 40 females (100.0%) in their respective age groups living below the poverty level.
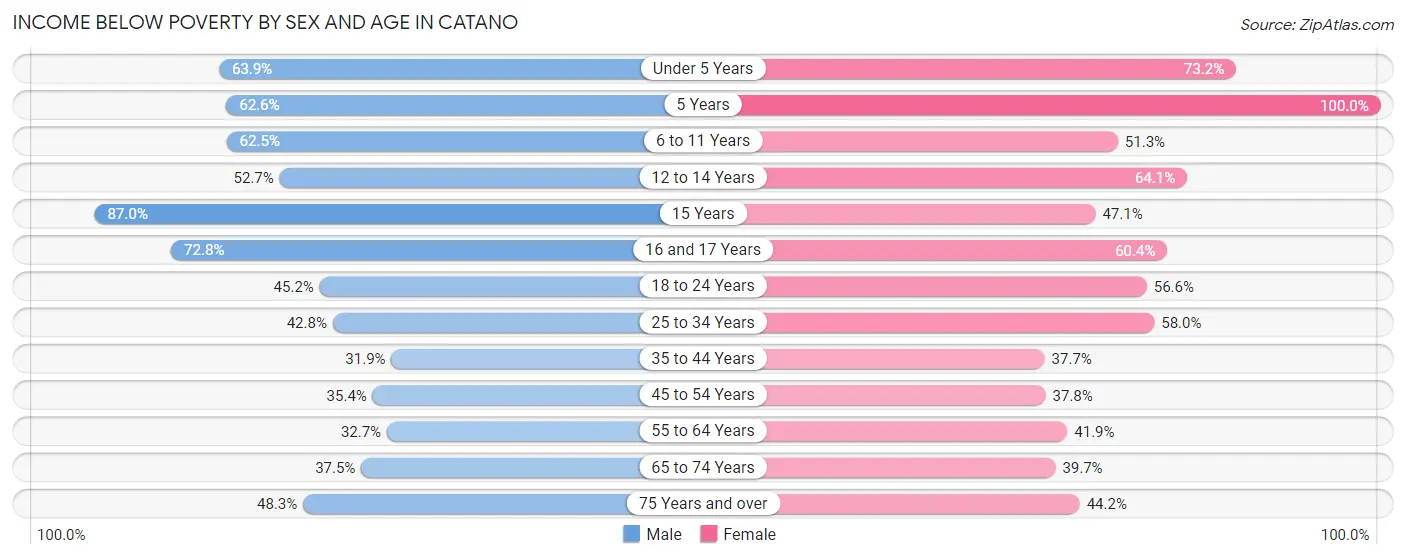
| Age Bracket | Male | Female |
| Under 5 Years | 264 (63.9%) | 292 (73.2%) |
| 5 Years | 122 (62.6%) | 40 (100.0%) |
| 6 to 11 Years | 528 (62.5%) | 368 (51.2%) |
| 12 to 14 Years | 128 (52.7%) | 273 (64.1%) |
| 15 Years | 114 (87.0%) | 81 (47.1%) |
| 16 and 17 Years | 206 (72.8%) | 151 (60.4%) |
| 18 to 24 Years | 469 (45.2%) | 617 (56.6%) |
| 25 to 34 Years | 634 (42.8%) | 909 (58.0%) |
| 35 to 44 Years | 429 (31.9%) | 550 (37.7%) |
| 45 to 54 Years | 440 (35.4%) | 522 (37.8%) |
| 55 to 64 Years | 457 (32.7%) | 734 (41.9%) |
| 65 to 74 Years | 451 (37.5%) | 587 (39.7%) |
| 75 Years and over | 485 (48.3%) | 650 (44.2%) |
| Total | 4,727 (43.7%) | 5,774 (47.3%) |
Income Above Poverty by Sex and Age in Catano
According to the poverty statistics in Catano, males aged 35 to 44 years and females aged 35 to 44 years are the age groups that are most secure financially, with 68.1% of males and 62.4% of females in these age groups living above the poverty line.
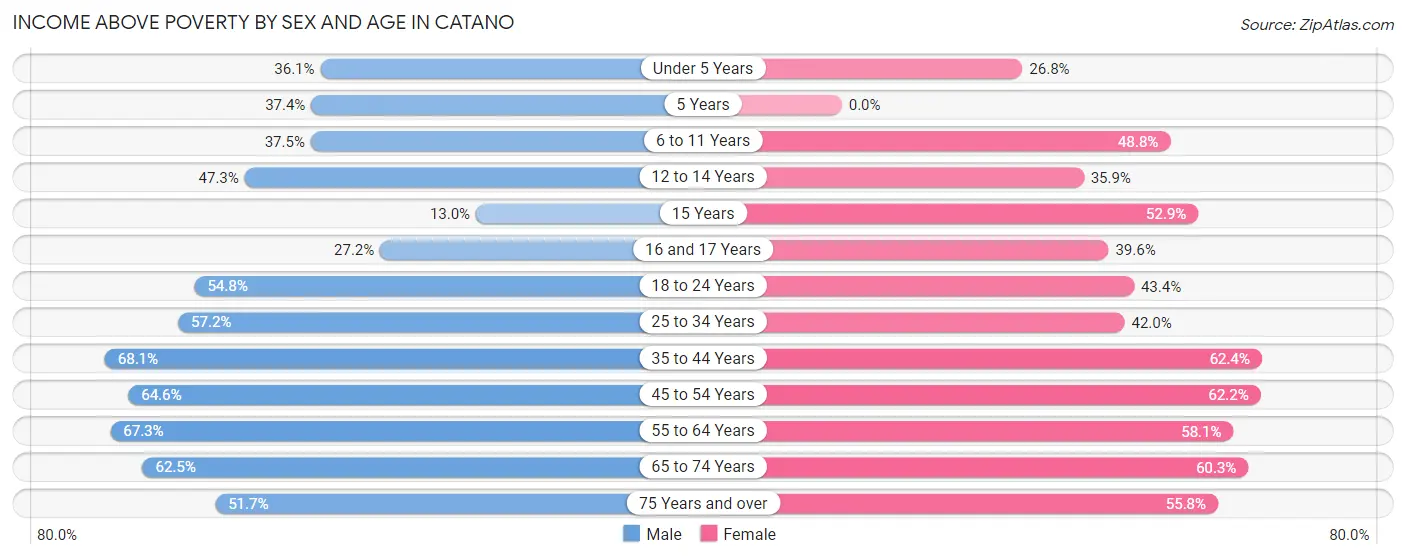
| Age Bracket | Male | Female |
| Under 5 Years | 149 (36.1%) | 107 (26.8%) |
| 5 Years | 73 (37.4%) | 0 (0.0%) |
| 6 to 11 Years | 317 (37.5%) | 350 (48.7%) |
| 12 to 14 Years | 115 (47.3%) | 153 (35.9%) |
| 15 Years | 17 (13.0%) | 91 (52.9%) |
| 16 and 17 Years | 77 (27.2%) | 99 (39.6%) |
| 18 to 24 Years | 568 (54.8%) | 473 (43.4%) |
| 25 to 34 Years | 847 (57.2%) | 658 (42.0%) |
| 35 to 44 Years | 915 (68.1%) | 911 (62.4%) |
| 45 to 54 Years | 803 (64.6%) | 858 (62.2%) |
| 55 to 64 Years | 939 (67.3%) | 1,019 (58.1%) |
| 65 to 74 Years | 751 (62.5%) | 893 (60.3%) |
| 75 Years and over | 519 (51.7%) | 822 (55.8%) |
| Total | 6,090 (56.3%) | 6,434 (52.7%) |
Income Below Poverty Among Married-Couple Families in Catano
The poverty statistics for married-couple families in Catano show that 23.7% or 706 of the total 2,973 families live below the poverty line. Families with 3 or 4 children have the highest poverty rate of 55.2%, comprising of 53 families. On the other hand, families with 1 or 2 children have the lowest poverty rate of 22.3%, which includes 148 families.
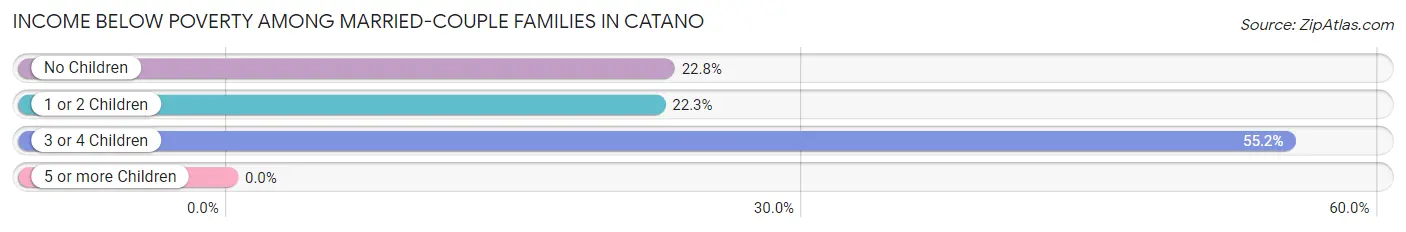
| Children | Above Poverty | Below Poverty |
| No Children | 1,709 (77.2%) | 505 (22.8%) |
| 1 or 2 Children | 515 (77.7%) | 148 (22.3%) |
| 3 or 4 Children | 43 (44.8%) | 53 (55.2%) |
| 5 or more Children | 0 (0.0%) | 0 (0.0%) |
| Total | 2,267 (76.2%) | 706 (23.7%) |
Income Below Poverty Among Single-Parent Households in Catano
According to the poverty data in Catano, 38.2% or 279 single-father households and 65.0% or 1,523 single-mother households are living below the poverty line. Among single-father households, those with 3 or 4 children have the highest poverty rate, with 47 households (100.0%) experiencing poverty. Likewise, among single-mother households, those with 3 or 4 children have the highest poverty rate, with 194 households (92.8%) falling below the poverty line.
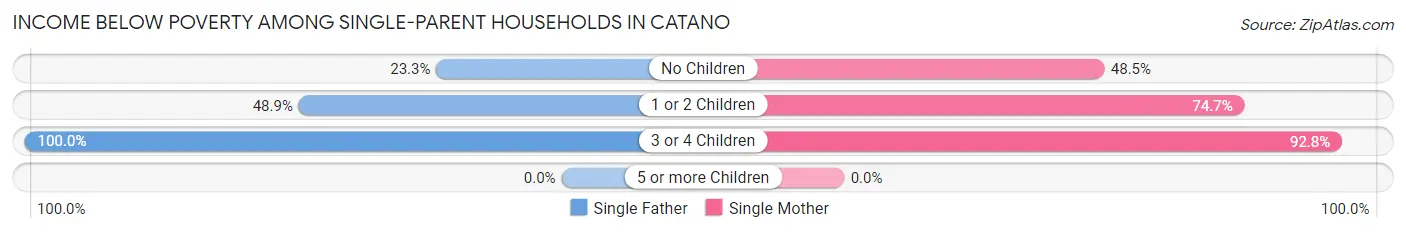
| Children | Single Father | Single Mother |
| No Children | 93 (23.3%) | 489 (48.5%) |
| 1 or 2 Children | 139 (48.9%) | 840 (74.7%) |
| 3 or 4 Children | 47 (100.0%) | 194 (92.8%) |
| 5 or more Children | 0 (0.0%) | 0 (0.0%) |
| Total | 279 (38.2%) | 1,523 (65.0%) |
Income Below Poverty Among Married-Couple vs Single-Parent Households in Catano
The poverty data for Catano shows that 706 of the married-couple family households (23.7%) and 1,802 of the single-parent households (58.6%) are living below the poverty level. Within the married-couple family households, those with 3 or 4 children have the highest poverty rate, with 53 households (55.2%) falling below the poverty line. Among the single-parent households, those with 3 or 4 children have the highest poverty rate, with 241 household (94.1%) living below poverty.
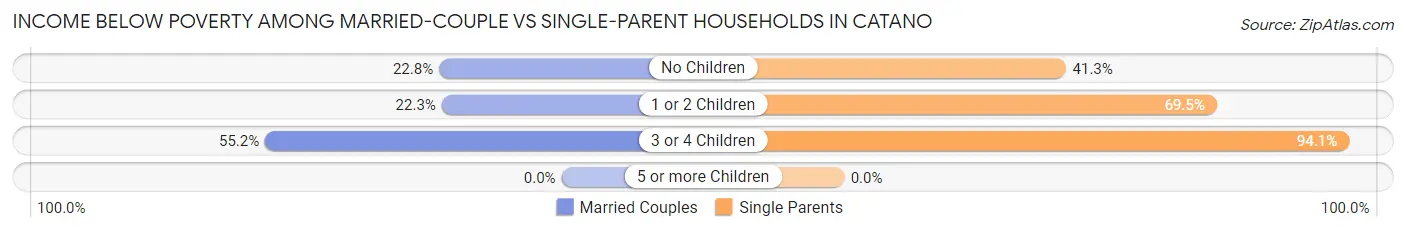
| Children | Married-Couple Families | Single-Parent Households |
| No Children | 505 (22.8%) | 582 (41.3%) |
| 1 or 2 Children | 148 (22.3%) | 979 (69.5%) |
| 3 or 4 Children | 53 (55.2%) | 241 (94.1%) |
| 5 or more Children | 0 (0.0%) | 0 (0.0%) |
| Total | 706 (23.7%) | 1,802 (58.6%) |
Race in Catano
The most populous races in Catano are Hispanic or Latino (22,781 | 98.8%), White / Caucasian (9,466 | 41.0%), and Two or more Races (9,241 | 40.1%).
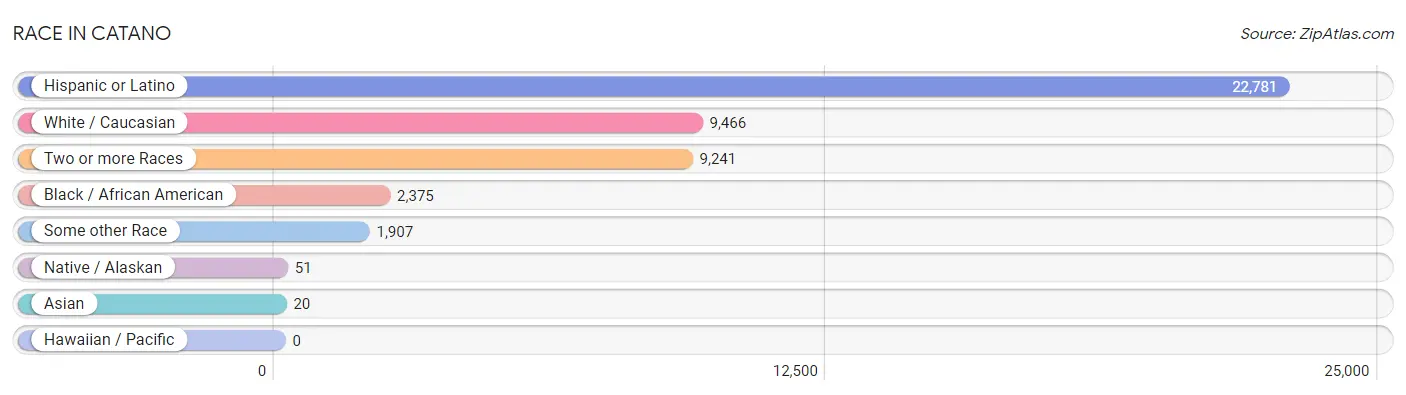
| Race | # Population | % Population |
| Asian | 20 | 0.1% |
| Black / African American | 2,375 | 10.3% |
| Hawaiian / Pacific | 0 | 0.0% |
| Hispanic or Latino | 22,781 | 98.8% |
| Native / Alaskan | 51 | 0.2% |
| White / Caucasian | 9,466 | 41.0% |
| Two or more Races | 9,241 | 40.1% |
| Some other Race | 1,907 | 8.3% |
| Total | 23,060 | 100.0% |
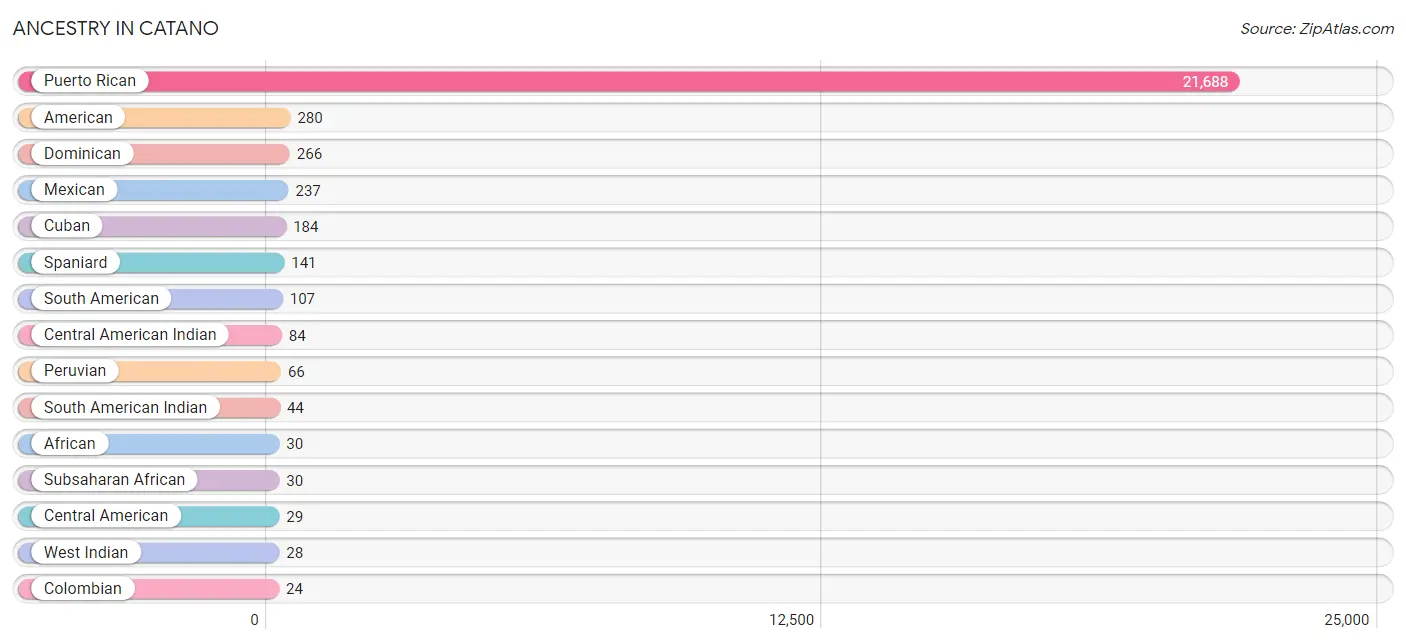
Ancestry in Catano
The most populous ancestries reported in Catano are Puerto Rican (21,688 | 94.1%), American (280 | 1.2%), Dominican (266 | 1.1%), Mexican (237 | 1.0%), and Cuban (184 | 0.8%), together accounting for 98.2% of all Catano residents.
| Ancestry | # Population | % Population |
| African | 30 | 0.1% |
| American | 280 | 1.2% |
| Central American | 29 | 0.1% |
| Central American Indian | 84 | 0.4% |
| Colombian | 24 | 0.1% |
| Cuban | 184 | 0.8% |
| Dominican | 266 | 1.1% |
| Ecuadorian | 17 | 0.1% |
| English | 13 | 0.1% |
| French | 14 | 0.1% |
| Guatemalan | 9 | 0.0% |
| Indian (Asian) | 16 | 0.1% |
| Italian | 9 | 0.0% |
| Mexican | 237 | 1.0% |
| Norwegian | 4 | 0.0% |
| Panamanian | 20 | 0.1% |
| Peruvian | 66 | 0.3% |
| Puerto Rican | 21,688 | 94.1% |
| South American | 107 | 0.5% |
| South American Indian | 44 | 0.2% |
| Spaniard | 141 | 0.6% |
| Subsaharan African | 30 | 0.1% |
| Thai | 20 | 0.1% |
| West Indian | 28 | 0.1% | View All 24 Rows |
Immigrants in Catano

| Immigration Origin | # Population | % Population | View All 0 Rows |
Sex and Age in Catano
Sex and Age in Catano
The most populous age groups in Catano are 5 to 9 Years (826 | 7.6%) for men and 60 to 64 Years (984 | 8.1%) for women.
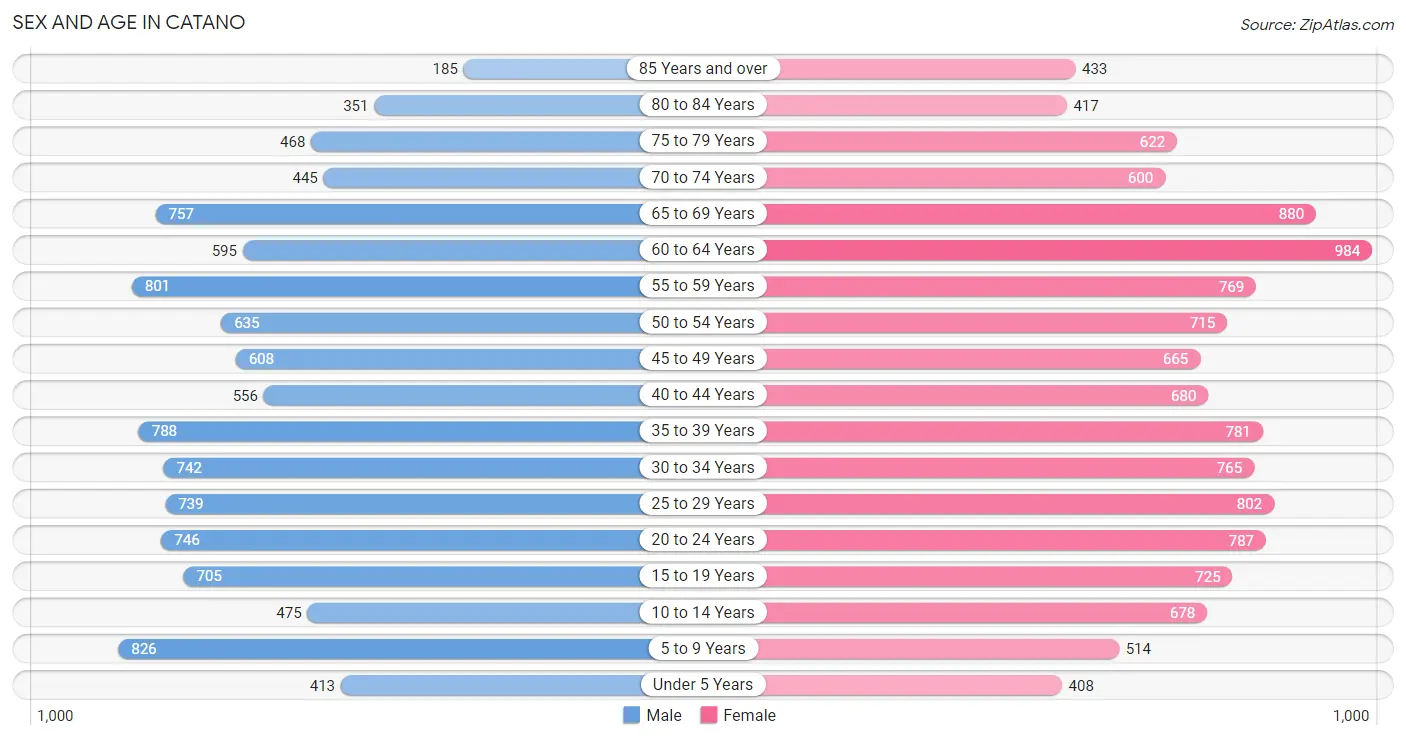
| Age Bracket | Male | Female |
| Under 5 Years | 413 (3.8%) | 408 (3.3%) |
| 5 to 9 Years | 826 (7.6%) | 514 (4.2%) |
| 10 to 14 Years | 475 (4.4%) | 678 (5.6%) |
| 15 to 19 Years | 705 (6.5%) | 725 (5.9%) |
| 20 to 24 Years | 746 (6.9%) | 787 (6.4%) |
| 25 to 29 Years | 739 (6.8%) | 802 (6.6%) |
| 30 to 34 Years | 742 (6.9%) | 765 (6.3%) |
| 35 to 39 Years | 788 (7.3%) | 781 (6.4%) |
| 40 to 44 Years | 556 (5.1%) | 680 (5.6%) |
| 45 to 49 Years | 608 (5.6%) | 665 (5.4%) |
| 50 to 54 Years | 635 (5.9%) | 715 (5.9%) |
| 55 to 59 Years | 801 (7.4%) | 769 (6.3%) |
| 60 to 64 Years | 595 (5.5%) | 984 (8.1%) |
| 65 to 69 Years | 757 (7.0%) | 880 (7.2%) |
| 70 to 74 Years | 445 (4.1%) | 600 (4.9%) |
| 75 to 79 Years | 468 (4.3%) | 622 (5.1%) |
| 80 to 84 Years | 351 (3.2%) | 417 (3.4%) |
| 85 Years and over | 185 (1.7%) | 433 (3.5%) |
| Total | 10,835 (100.0%) | 12,225 (100.0%) |
Families and Households in Catano
Median Family Size in Catano
The median family size in Catano is 3.22 persons per family, with single male/father families (730 | 12.1%) accounting for the largest median family size of 3.49 persons per family. On the other hand, married-couple families (2,973 | 49.2%) represent the smallest median family size with 3.11 persons per family.
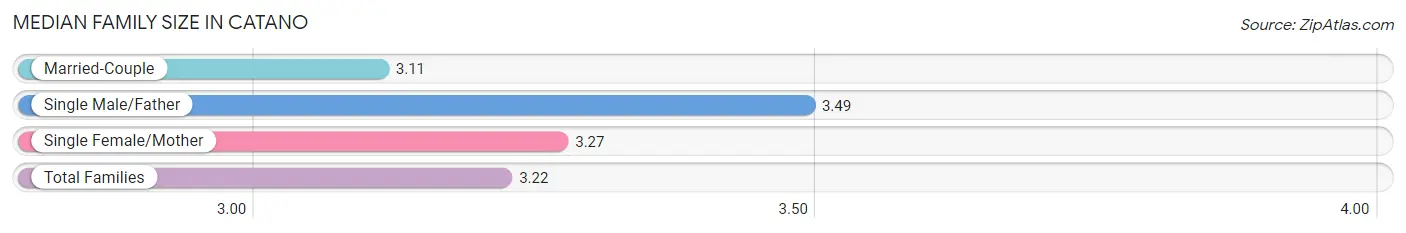
| Family Type | # Families | Family Size |
| Married-Couple | 2,973 (49.2%) | 3.11 |
| Single Male/Father | 730 (12.1%) | 3.49 |
| Single Female/Mother | 2,343 (38.8%) | 3.27 |
| Total Families | 6,046 (100.0%) | 3.22 |
Median Household Size in Catano
The median household size in Catano is 2.62 persons per household, with single male/father households (730 | 8.3%) accounting for the largest median household size of 3.86 persons per household. non-family households (2,748 | 31.2%) represent the smallest median household size with 1.10 persons per household.
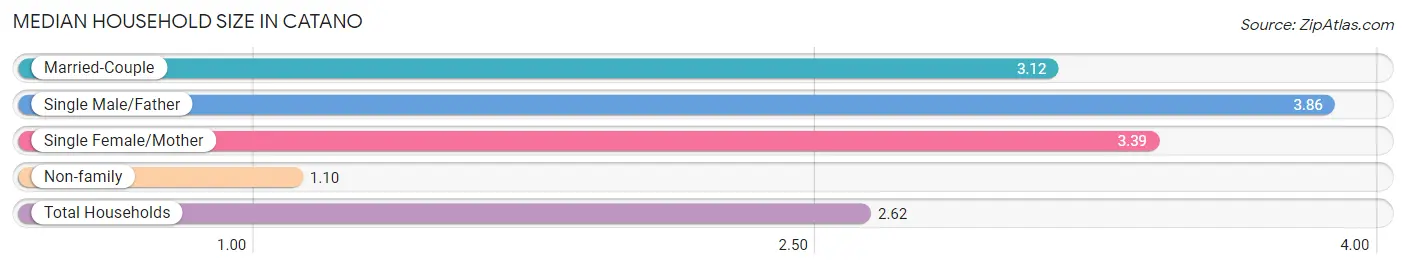
| Household Type | # Households | Household Size |
| Married-Couple | 2,973 (33.8%) | 3.12 |
| Single Male/Father | 730 (8.3%) | 3.86 |
| Single Female/Mother | 2,343 (26.6%) | 3.39 |
| Non-family | 2,748 (31.2%) | 1.10 |
| Total Households | 8,794 (100.0%) | 2.62 |
Household Size by Marriage Status in Catano
Out of a total of 8,794 households in Catano, 6,046 (68.8%) are family households, while 2,748 (31.2%) are nonfamily households. The most numerous type of family households are 2-person households, comprising 2,845, and the most common type of nonfamily households are 1-person households, comprising 2,540.
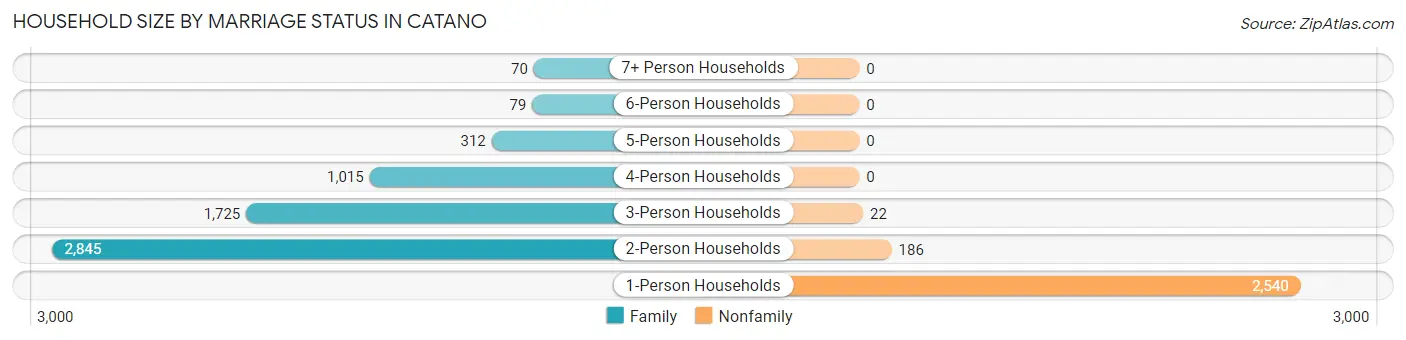
| Household Size | Family Households | Nonfamily Households |
| 1-Person Households | - | 2,540 (28.9%) |
| 2-Person Households | 2,845 (32.4%) | 186 (2.1%) |
| 3-Person Households | 1,725 (19.6%) | 22 (0.3%) |
| 4-Person Households | 1,015 (11.5%) | 0 (0.0%) |
| 5-Person Households | 312 (3.5%) | 0 (0.0%) |
| 6-Person Households | 79 (0.9%) | 0 (0.0%) |
| 7+ Person Households | 70 (0.8%) | 0 (0.0%) |
| Total | 6,046 (68.8%) | 2,748 (31.2%) |
Female Fertility in Catano
Fertility by Age in Catano
Average fertility rate in Catano is 25.0 births per 1,000 women. Women in the age bracket of 20 to 34 years have the highest fertility rate with 34.0 births per 1,000 women. Women in the age bracket of 20 to 34 years acount for 60.9% of all women with births.
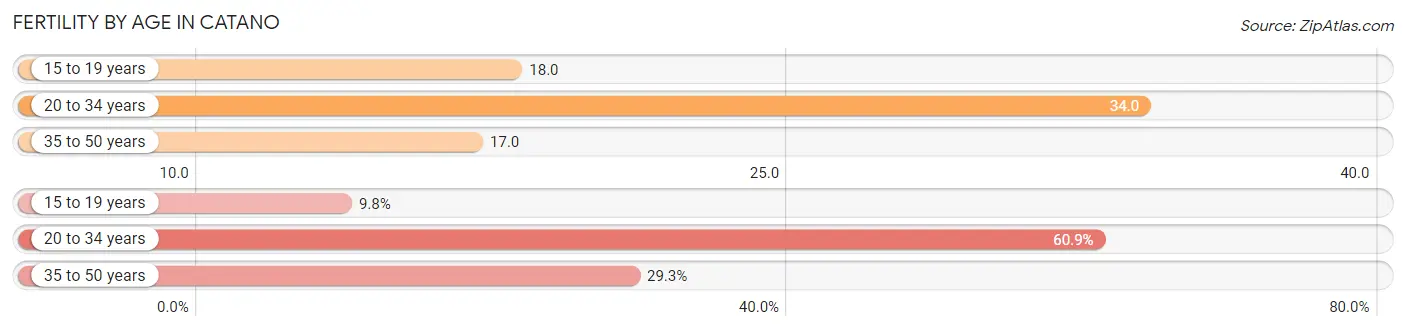
| Age Bracket | Women with Births | Births / 1,000 Women |
| 15 to 19 years | 13 (9.8%) | 18.0 |
| 20 to 34 years | 81 (60.9%) | 34.0 |
| 35 to 50 years | 39 (29.3%) | 17.0 |
| Total | 133 (100.0%) | 25.0 |
Fertility by Age by Marriage Status in Catano
40.6% of women with births (133) in Catano are married. The highest percentage of unmarried women with births falls into 15 to 19 years age bracket with 100.0% of them unmarried at the time of birth, while the lowest percentage of unmarried women with births belong to 20 to 34 years age bracket with 33.3% of them unmarried.
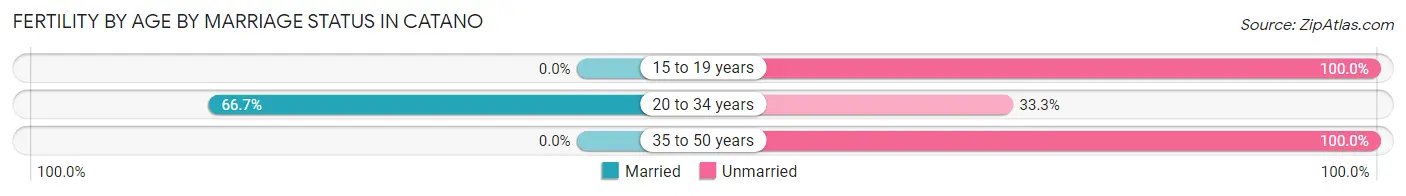
| Age Bracket | Married | Unmarried |
| 15 to 19 years | 0 (0.0%) | 13 (100.0%) |
| 20 to 34 years | 54 (66.7%) | 27 (33.3%) |
| 35 to 50 years | 0 (0.0%) | 39 (100.0%) |
| Total | 54 (40.6%) | 79 (59.4%) |
Fertility by Education in Catano
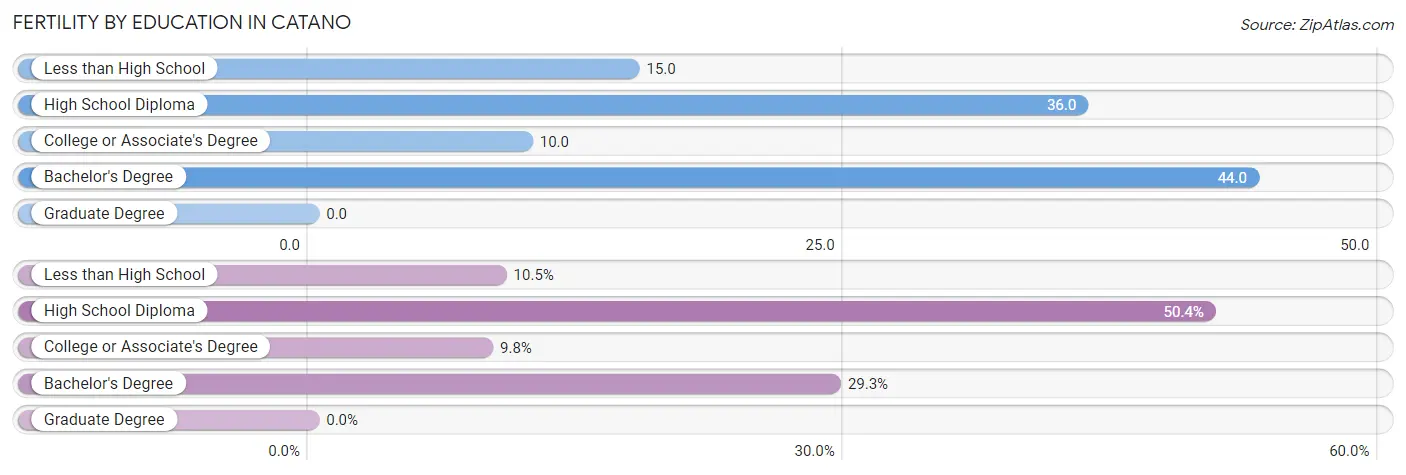
| Educational Attainment | Women with Births | Births / 1,000 Women |
| Less than High School | 14 (10.5%) | 15.0 |
| High School Diploma | 67 (50.4%) | 36.0 |
| College or Associate's Degree | 13 (9.8%) | 10.0 |
| Bachelor's Degree | 39 (29.3%) | 44.0 |
| Graduate Degree | 0 (0.0%) | 0.0 |
| Total | 133 (100.0%) | 25.0 |
Fertility by Education by Marriage Status in Catano
59.4% of women with births in Catano are unmarried. Women with the educational attainment of high school diploma are most likely to be married with 80.6% of them married at childbirth, while women with the educational attainment of less than high school are least likely to be married with 100.0% of them unmarried at childbirth.
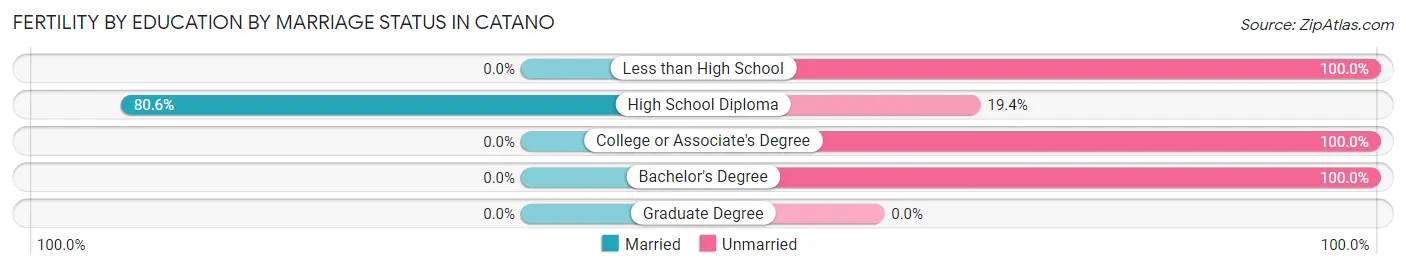
| Educational Attainment | Married | Unmarried |
| Less than High School | 0 (0.0%) | 14 (100.0%) |
| High School Diploma | 54 (80.6%) | 13 (19.4%) |
| College or Associate's Degree | 0 (0.0%) | 13 (100.0%) |
| Bachelor's Degree | 0 (0.0%) | 39 (100.0%) |
| Graduate Degree | 0 (0.0%) | 0 (0.0%) |
| Total | 54 (40.6%) | 79 (59.4%) |
Employment Characteristics in Catano
Employment by Class of Employer in Catano
Among the 7,182 employed individuals in Catano, private company employees (4,524 | 63.0%), state government employees (805 | 11.2%), and local government employees (633 | 8.8%) make up the most common classes of employment.
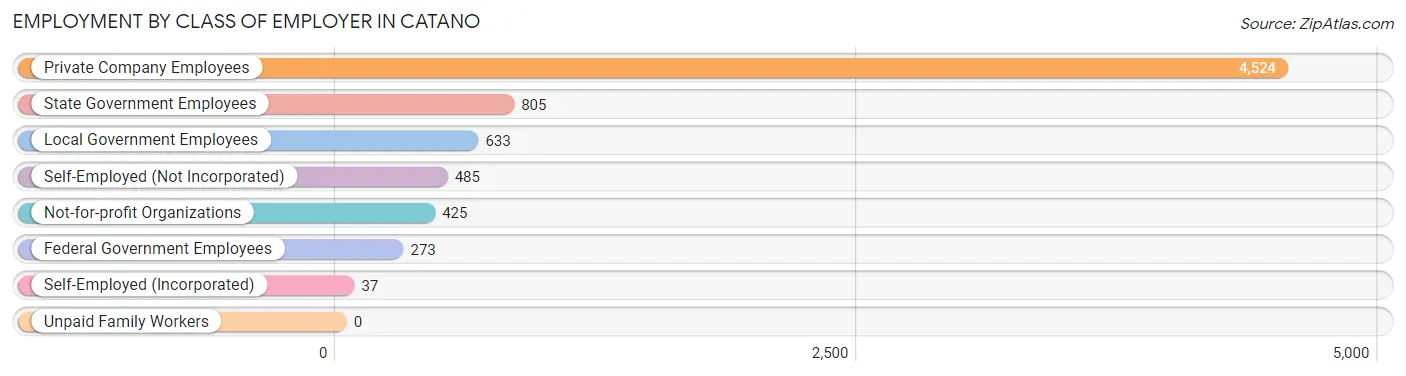
| Employer Class | # Employees | % Employees |
| Private Company Employees | 4,524 | 63.0% |
| Self-Employed (Incorporated) | 37 | 0.5% |
| Self-Employed (Not Incorporated) | 485 | 6.8% |
| Not-for-profit Organizations | 425 | 5.9% |
| Local Government Employees | 633 | 8.8% |
| State Government Employees | 805 | 11.2% |
| Federal Government Employees | 273 | 3.8% |
| Unpaid Family Workers | 0 | 0.0% |
| Total | 7,182 | 100.0% |
Employment Status by Age in Catano
According to the labor force statistics for Catano, out of the total population over 16 years of age (19,443), 43.6% or 8,477 individuals are in the labor force, with 13.7% or 1,161 of them unemployed. The age group with the highest labor force participation rate is 35 to 44 years, with 72.8% or 2,042 individuals in the labor force. Within the labor force, the 16 to 19 years age range has the highest percentage of unemployed individuals, with 34.3% or 47 of them being unemployed.
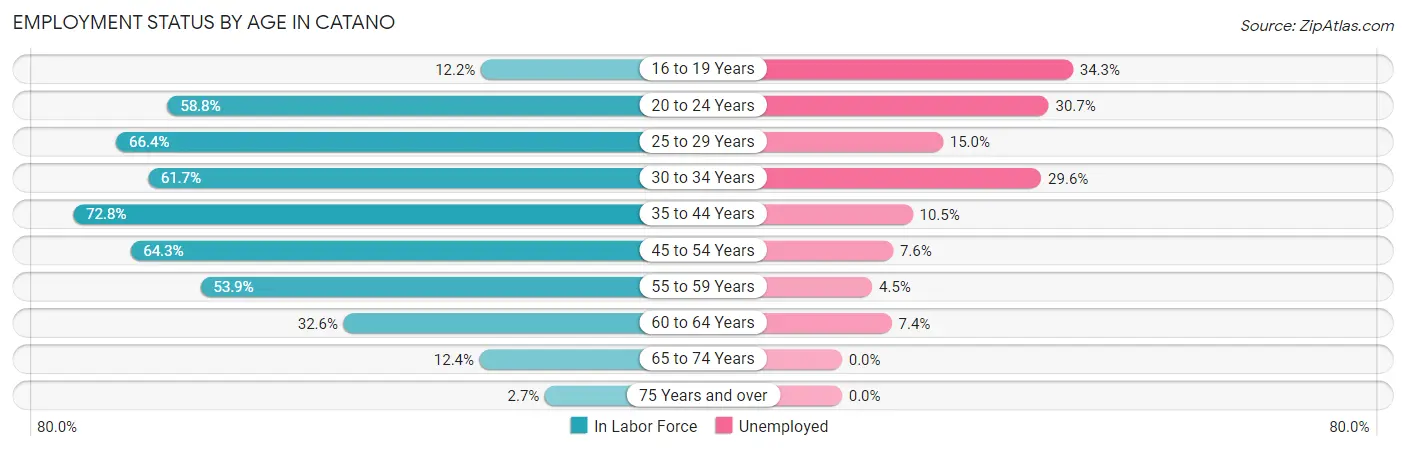
| Age Bracket | In Labor Force | Unemployed |
| 16 to 19 Years | 137 (12.2%) | 47 (34.3%) |
| 20 to 24 Years | 901 (58.8%) | 277 (30.7%) |
| 25 to 29 Years | 1,023 (66.4%) | 153 (15.0%) |
| 30 to 34 Years | 930 (61.7%) | 275 (29.6%) |
| 35 to 44 Years | 2,042 (72.8%) | 214 (10.5%) |
| 45 to 54 Years | 1,687 (64.3%) | 128 (7.6%) |
| 55 to 59 Years | 846 (53.9%) | 38 (4.5%) |
| 60 to 64 Years | 515 (32.6%) | 38 (7.4%) |
| 65 to 74 Years | 333 (12.4%) | 0 (0.0%) |
| 75 Years and over | 67 (2.7%) | 0 (0.0%) |
| Total | 8,477 (43.6%) | 1,161 (13.7%) |
Employment Status by Educational Attainment in Catano
According to labor force statistics for Catano, 60.6% of individuals (7,045) out of the total population between 25 and 64 years of age (11,625) are in the labor force, with 12.0% or 845 of them being unemployed. The group with the highest labor force participation rate are those with the educational attainment of bachelor's degree or higher, with 83.0% or 2,262 individuals in the labor force. Within the labor force, individuals with less than high school education have the highest percentage of unemployment, with 22.1% or 118 of them being unemployed.
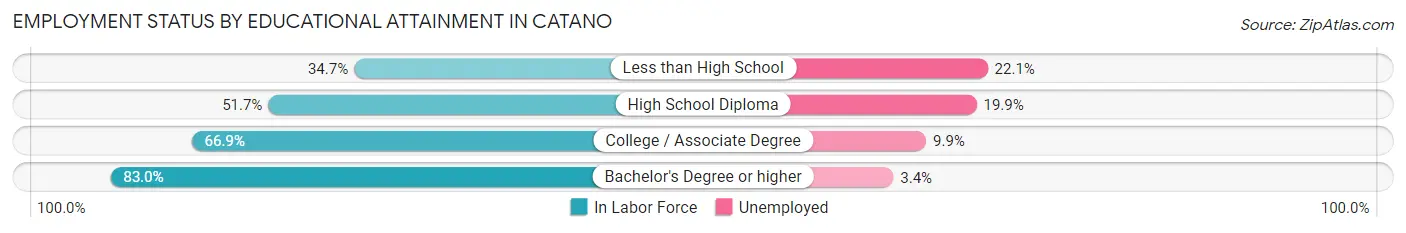
| Educational Attainment | In Labor Force | Unemployed |
| Less than High School | 535 (34.7%) | 341 (22.1%) |
| High School Diploma | 2,291 (51.7%) | 882 (19.9%) |
| College / Associate Degree | 1,958 (66.9%) | 290 (9.9%) |
| Bachelor's Degree or higher | 2,262 (83.0%) | 93 (3.4%) |
| Total | 7,045 (60.6%) | 1,395 (12.0%) |
Employment Occupations by Sex in Catano
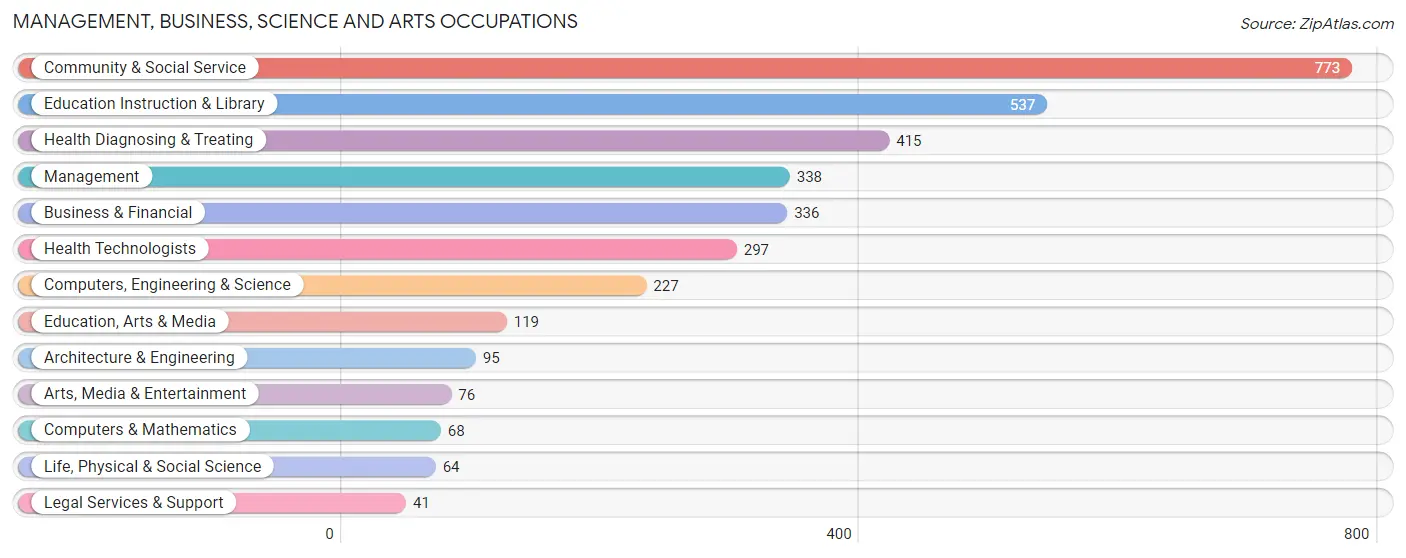
Management, Business, Science and Arts Occupations
The most common Management, Business, Science and Arts occupations in Catano are Community & Social Service (773 | 10.7%), Education Instruction & Library (537 | 7.4%), Health Diagnosing & Treating (415 | 5.7%), Management (338 | 4.7%), and Business & Financial (336 | 4.6%).
Management, Business, Science and Arts Occupations by Sex
Within the Management, Business, Science and Arts occupations in Catano, the most male-oriented occupations are Arts, Media & Entertainment (100.0%), Life, Physical & Social Science (78.1%), and Computers, Engineering & Science (75.8%), while the most female-oriented occupations are Legal Services & Support (100.0%), Education Instruction & Library (89.6%), and Community & Social Service (76.6%).
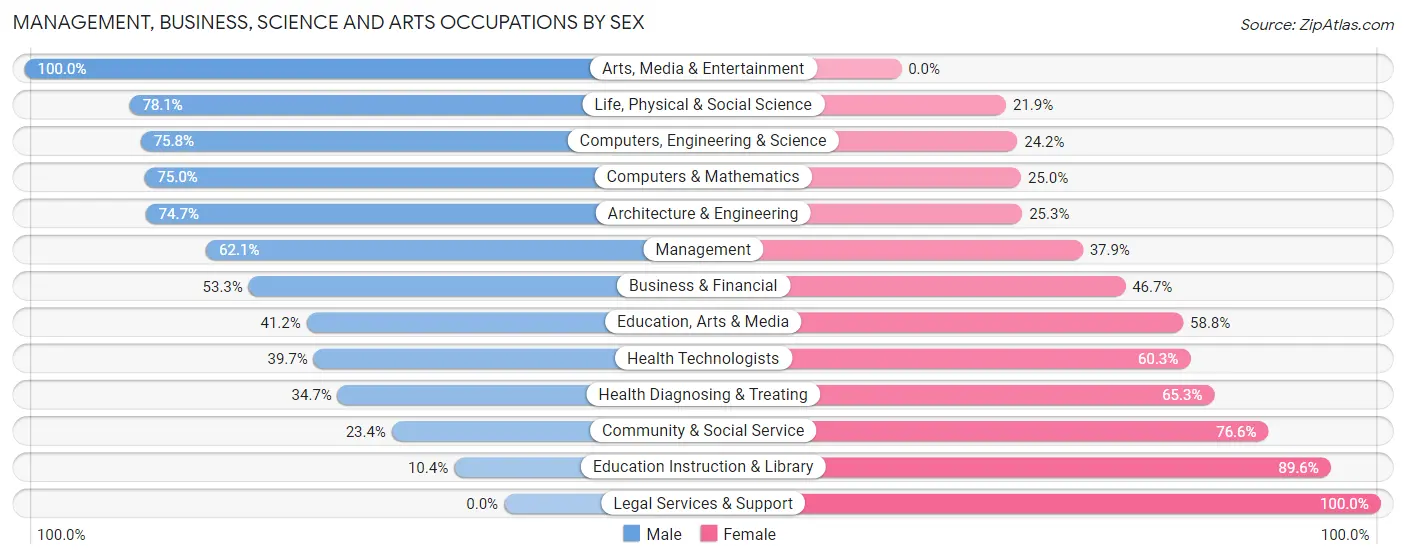
| Occupation | Male | Female |
| Management | 210 (62.1%) | 128 (37.9%) |
| Business & Financial | 179 (53.3%) | 157 (46.7%) |
| Computers, Engineering & Science | 172 (75.8%) | 55 (24.2%) |
| Computers & Mathematics | 51 (75.0%) | 17 (25.0%) |
| Architecture & Engineering | 71 (74.7%) | 24 (25.3%) |
| Life, Physical & Social Science | 50 (78.1%) | 14 (21.9%) |
| Community & Social Service | 181 (23.4%) | 592 (76.6%) |
| Education, Arts & Media | 49 (41.2%) | 70 (58.8%) |
| Legal Services & Support | 0 (0.0%) | 41 (100.0%) |
| Education Instruction & Library | 56 (10.4%) | 481 (89.6%) |
| Arts, Media & Entertainment | 76 (100.0%) | 0 (0.0%) |
| Health Diagnosing & Treating | 144 (34.7%) | 271 (65.3%) |
| Health Technologists | 118 (39.7%) | 179 (60.3%) |
| Total (Category) | 886 (42.4%) | 1,203 (57.6%) |
| Total (Overall) | 3,798 (52.4%) | 3,449 (47.6%) |
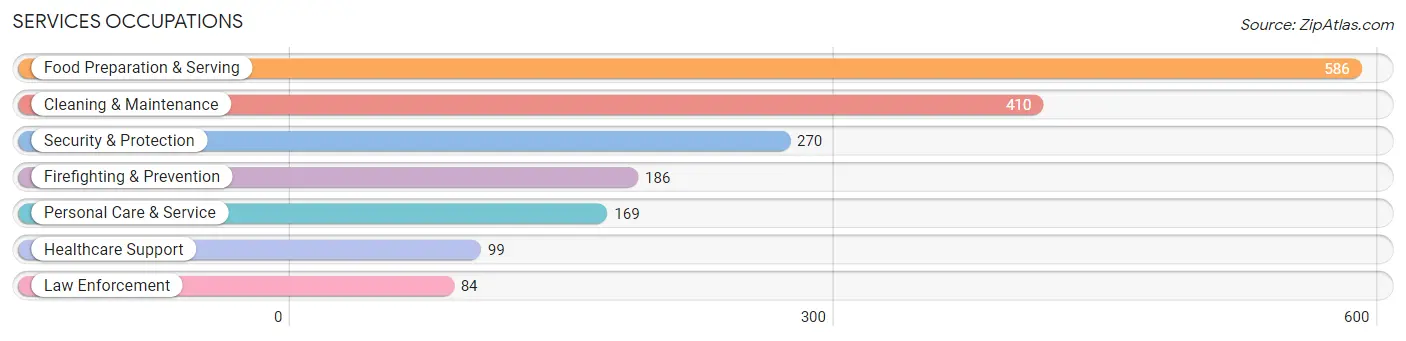
Services Occupations
The most common Services occupations in Catano are Food Preparation & Serving (586 | 8.1%), Cleaning & Maintenance (410 | 5.7%), Security & Protection (270 | 3.7%), Firefighting & Prevention (186 | 2.6%), and Personal Care & Service (169 | 2.3%).
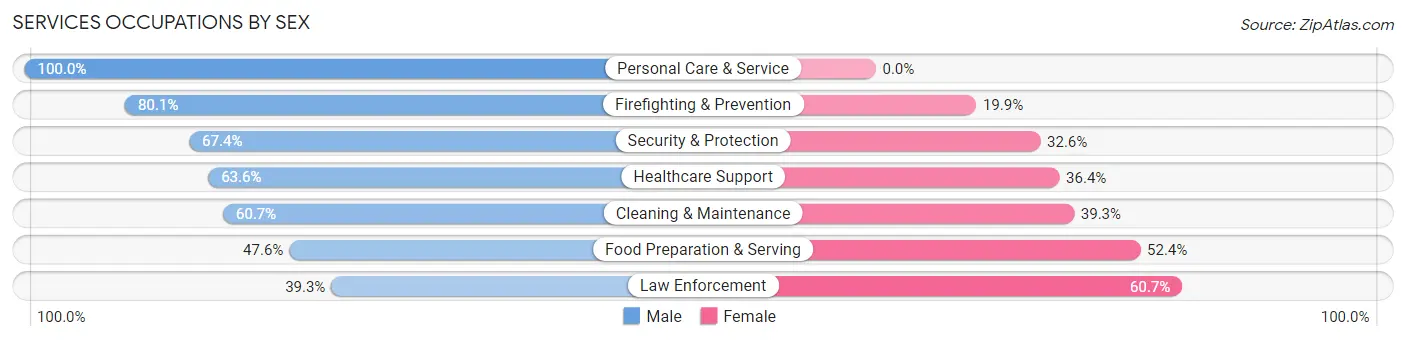
Services Occupations by Sex
Within the Services occupations in Catano, the most male-oriented occupations are Personal Care & Service (100.0%), Firefighting & Prevention (80.1%), and Security & Protection (67.4%), while the most female-oriented occupations are Law Enforcement (60.7%), Food Preparation & Serving (52.4%), and Cleaning & Maintenance (39.3%).
| Occupation | Male | Female |
| Healthcare Support | 63 (63.6%) | 36 (36.4%) |
| Security & Protection | 182 (67.4%) | 88 (32.6%) |
| Firefighting & Prevention | 149 (80.1%) | 37 (19.9%) |
| Law Enforcement | 33 (39.3%) | 51 (60.7%) |
| Food Preparation & Serving | 279 (47.6%) | 307 (52.4%) |
| Cleaning & Maintenance | 249 (60.7%) | 161 (39.3%) |
| Personal Care & Service | 169 (100.0%) | 0 (0.0%) |
| Total (Category) | 942 (61.4%) | 592 (38.6%) |
| Total (Overall) | 3,798 (52.4%) | 3,449 (47.6%) |
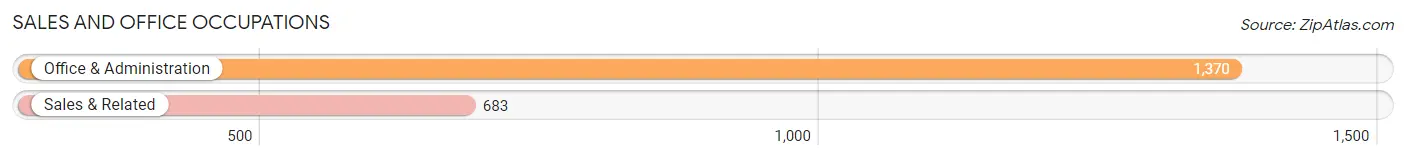
Sales and Office Occupations
The most common Sales and Office occupations in Catano are Office & Administration (1,370 | 18.9%), and Sales & Related (683 | 9.4%).
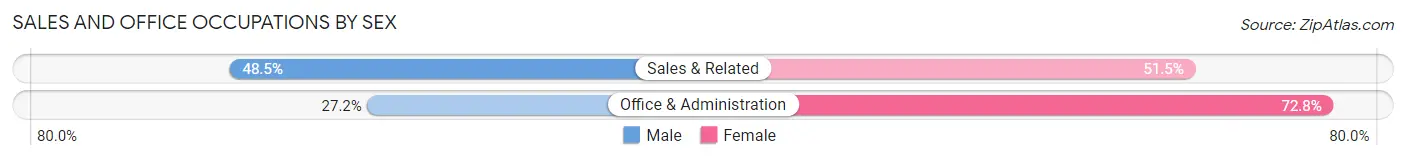
Sales and Office Occupations by Sex
| Occupation | Male | Female |
| Sales & Related | 331 (48.5%) | 352 (51.5%) |
| Office & Administration | 373 (27.2%) | 997 (72.8%) |
| Total (Category) | 704 (34.3%) | 1,349 (65.7%) |
| Total (Overall) | 3,798 (52.4%) | 3,449 (47.6%) |
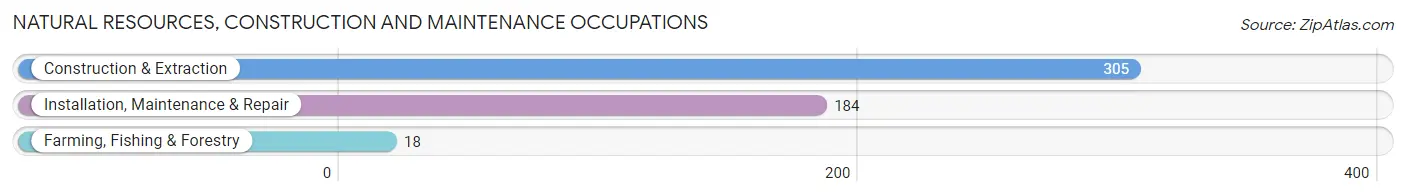
Natural Resources, Construction and Maintenance Occupations
The most common Natural Resources, Construction and Maintenance occupations in Catano are Construction & Extraction (305 | 4.2%), Installation, Maintenance & Repair (184 | 2.5%), and Farming, Fishing & Forestry (18 | 0.3%).
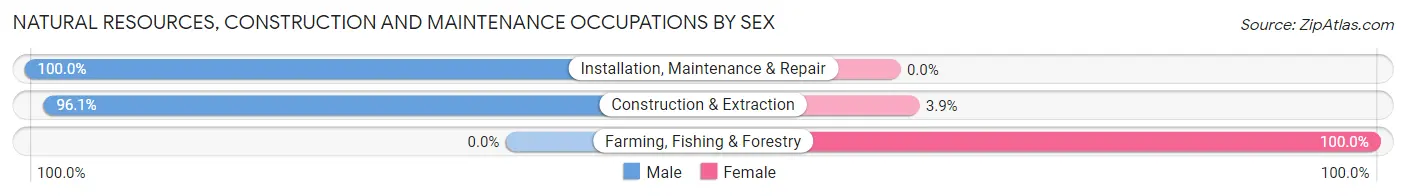
Natural Resources, Construction and Maintenance Occupations by Sex
| Occupation | Male | Female |
| Farming, Fishing & Forestry | 0 (0.0%) | 18 (100.0%) |
| Construction & Extraction | 293 (96.1%) | 12 (3.9%) |
| Installation, Maintenance & Repair | 184 (100.0%) | 0 (0.0%) |
| Total (Category) | 477 (94.1%) | 30 (5.9%) |
| Total (Overall) | 3,798 (52.4%) | 3,449 (47.6%) |
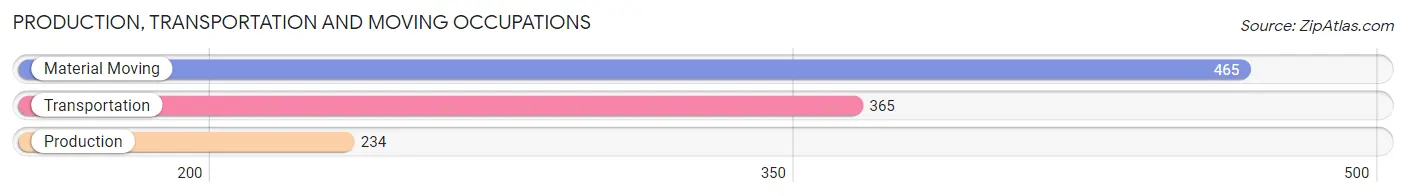
Production, Transportation and Moving Occupations
The most common Production, Transportation and Moving occupations in Catano are Material Moving (465 | 6.4%), Transportation (365 | 5.0%), and Production (234 | 3.2%).
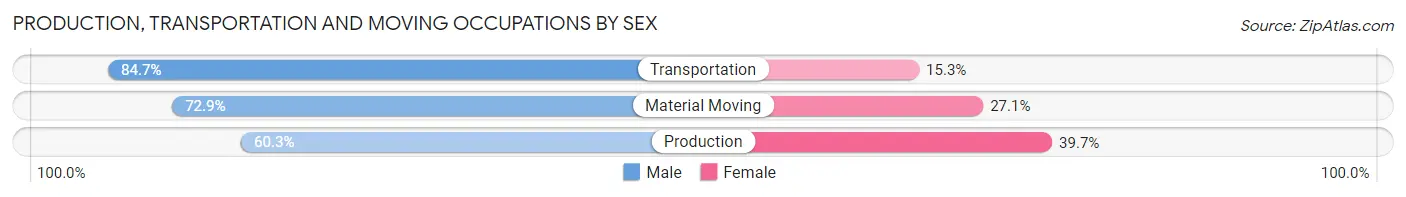
Production, Transportation and Moving Occupations by Sex
| Occupation | Male | Female |
| Production | 141 (60.3%) | 93 (39.7%) |
| Transportation | 309 (84.7%) | 56 (15.3%) |
| Material Moving | 339 (72.9%) | 126 (27.1%) |
| Total (Category) | 789 (74.2%) | 275 (25.9%) |
| Total (Overall) | 3,798 (52.4%) | 3,449 (47.6%) |
Employment Industries by Sex in Catano
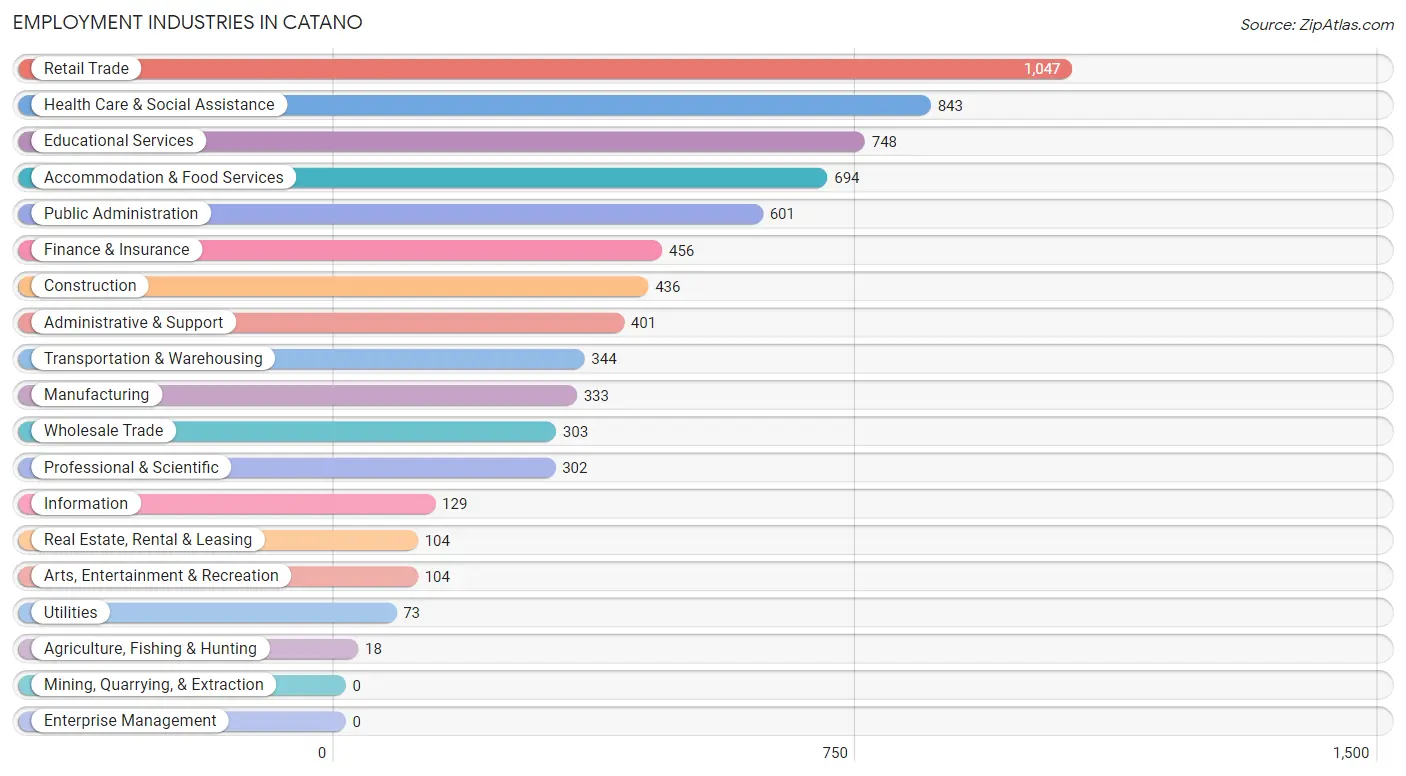
Employment Industries in Catano
The major employment industries in Catano include Retail Trade (1,047 | 14.4%), Health Care & Social Assistance (843 | 11.6%), Educational Services (748 | 10.3%), Accommodation & Food Services (694 | 9.6%), and Public Administration (601 | 8.3%).
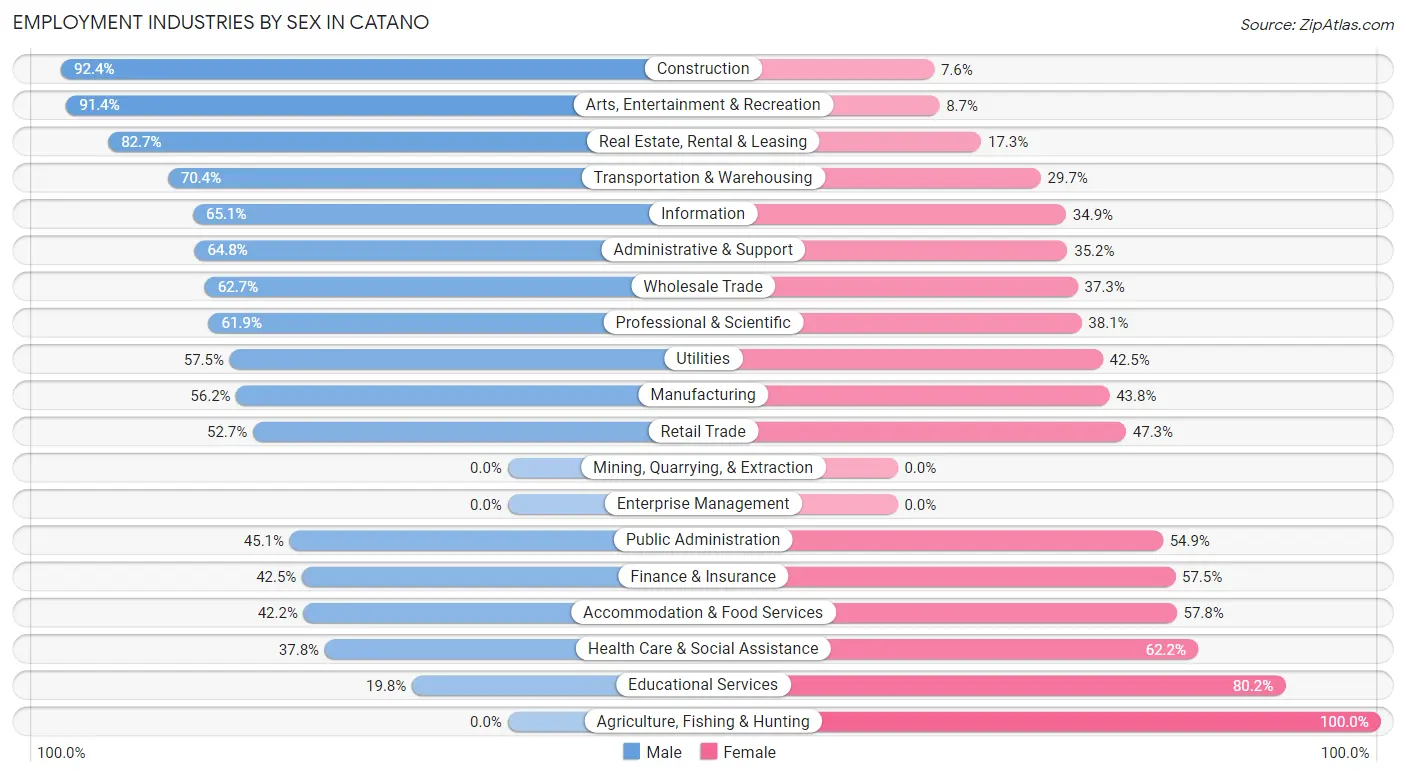
Employment Industries by Sex in Catano
The Catano industries that see more men than women are Construction (92.4%), Arts, Entertainment & Recreation (91.3%), and Real Estate, Rental & Leasing (82.7%), whereas the industries that tend to have a higher number of women are Agriculture, Fishing & Hunting (100.0%), Educational Services (80.2%), and Health Care & Social Assistance (62.2%).
| Industry | Male | Female |
| Agriculture, Fishing & Hunting | 0 (0.0%) | 18 (100.0%) |
| Mining, Quarrying, & Extraction | 0 (0.0%) | 0 (0.0%) |
| Construction | 403 (92.4%) | 33 (7.6%) |
| Manufacturing | 187 (56.2%) | 146 (43.8%) |
| Wholesale Trade | 190 (62.7%) | 113 (37.3%) |
| Retail Trade | 552 (52.7%) | 495 (47.3%) |
| Transportation & Warehousing | 242 (70.4%) | 102 (29.6%) |
| Utilities | 42 (57.5%) | 31 (42.5%) |
| Information | 84 (65.1%) | 45 (34.9%) |
| Finance & Insurance | 194 (42.5%) | 262 (57.5%) |
| Real Estate, Rental & Leasing | 86 (82.7%) | 18 (17.3%) |
| Professional & Scientific | 187 (61.9%) | 115 (38.1%) |
| Enterprise Management | 0 (0.0%) | 0 (0.0%) |
| Administrative & Support | 260 (64.8%) | 141 (35.2%) |
| Educational Services | 148 (19.8%) | 600 (80.2%) |
| Health Care & Social Assistance | 319 (37.8%) | 524 (62.2%) |
| Arts, Entertainment & Recreation | 95 (91.3%) | 9 (8.6%) |
| Accommodation & Food Services | 293 (42.2%) | 401 (57.8%) |
| Public Administration | 271 (45.1%) | 330 (54.9%) |
| Total | 3,798 (52.4%) | 3,449 (47.6%) |
Education in Catano
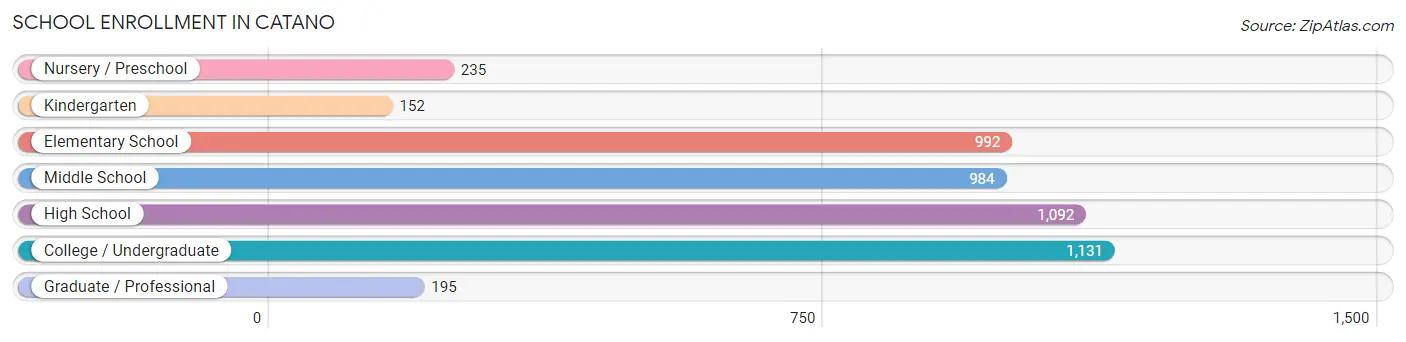
School Enrollment in Catano
The most common levels of schooling among the 4,781 students in Catano are college / undergraduate (1,131 | 23.7%), high school (1,092 | 22.8%), and elementary school (992 | 20.7%).
| School Level | # Students | % Students |
| Nursery / Preschool | 235 | 4.9% |
| Kindergarten | 152 | 3.2% |
| Elementary School | 992 | 20.7% |
| Middle School | 984 | 20.6% |
| High School | 1,092 | 22.8% |
| College / Undergraduate | 1,131 | 23.7% |
| Graduate / Professional | 195 | 4.1% |
| Total | 4,781 | 100.0% |
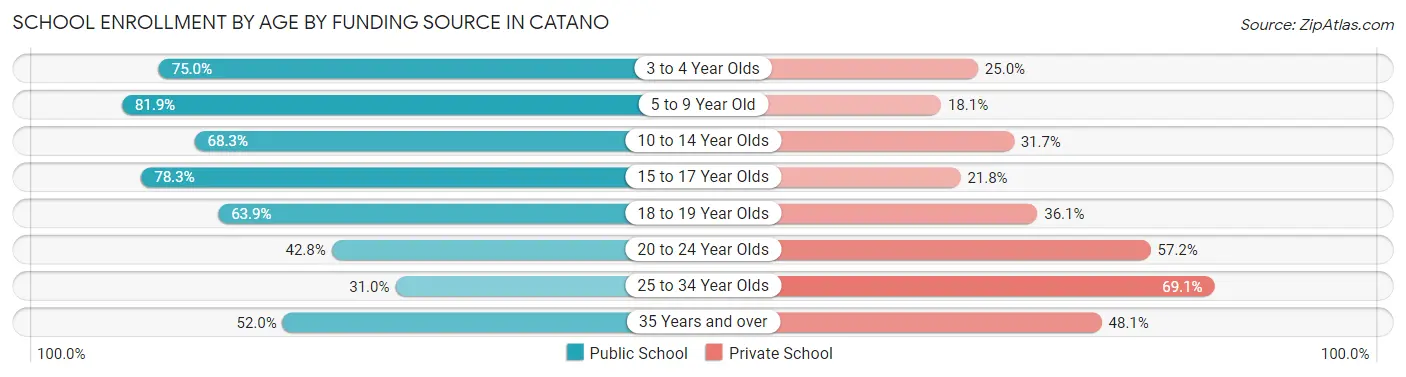
School Enrollment by Age by Funding Source in Catano
Out of a total of 4,781 students who are enrolled in schools in Catano, 1,583 (33.1%) attend a private institution, while the remaining 3,198 (66.9%) are enrolled in public schools. The age group of 25 to 34 year olds has the highest likelihood of being enrolled in private schools, with 232 (69.1% in the age bracket) enrolled. Conversely, the age group of 5 to 9 year old has the lowest likelihood of being enrolled in a private school, with 1,007 (81.9% in the age bracket) attending a public institution.
| Age Bracket | Public School | Private School |
| 3 to 4 Year Olds | 156 (75.0%) | 52 (25.0%) |
| 5 to 9 Year Old | 1,007 (81.9%) | 223 (18.1%) |
| 10 to 14 Year Olds | 738 (68.3%) | 342 (31.7%) |
| 15 to 17 Year Olds | 590 (78.2%) | 164 (21.7%) |
| 18 to 19 Year Olds | 234 (63.9%) | 132 (36.1%) |
| 20 to 24 Year Olds | 236 (42.8%) | 315 (57.2%) |
| 25 to 34 Year Olds | 104 (30.9%) | 232 (69.1%) |
| 35 Years and over | 133 (51.9%) | 123 (48.0%) |
| Total | 3,198 (66.9%) | 1,583 (33.1%) |
Educational Attainment by Field of Study in Catano
Business (1,287 | 34.4%), education (632 | 16.9%), science & technology (502 | 13.4%), arts & humanities (358 | 9.6%), and engineering (234 | 6.2%) are the most common fields of study among 3,744 individuals in Catano who have obtained a bachelor's degree or higher.
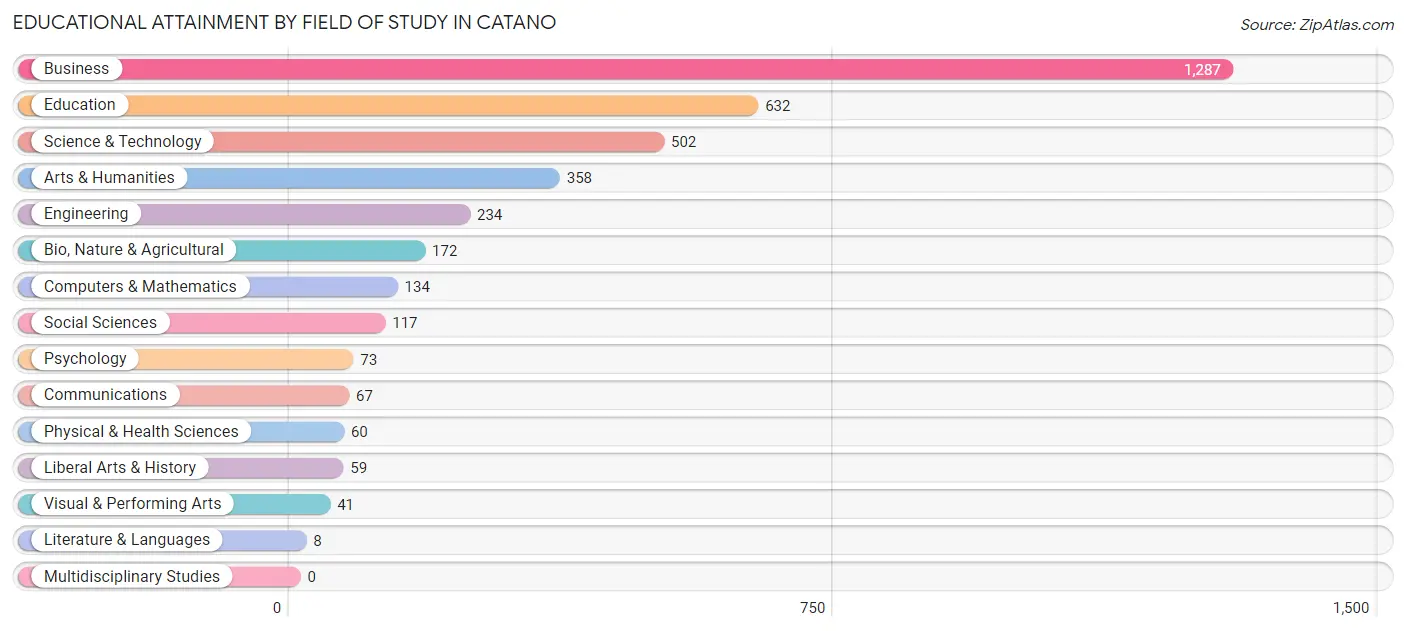
| Field of Study | # Graduates | % Graduates |
| Computers & Mathematics | 134 | 3.6% |
| Bio, Nature & Agricultural | 172 | 4.6% |
| Physical & Health Sciences | 60 | 1.6% |
| Psychology | 73 | 1.9% |
| Social Sciences | 117 | 3.1% |
| Engineering | 234 | 6.2% |
| Multidisciplinary Studies | 0 | 0.0% |
| Science & Technology | 502 | 13.4% |
| Business | 1,287 | 34.4% |
| Education | 632 | 16.9% |
| Literature & Languages | 8 | 0.2% |
| Liberal Arts & History | 59 | 1.6% |
| Visual & Performing Arts | 41 | 1.1% |
| Communications | 67 | 1.8% |
| Arts & Humanities | 358 | 9.6% |
| Total | 3,744 | 100.0% |
Transportation & Commute in Catano
Vehicle Availability by Sex in Catano
The most prevalent vehicle ownership categories in Catano are males with 2 vehicles (1,441, accounting for 37.8%) and females with 2 vehicles (1,253, making up 42.8%).
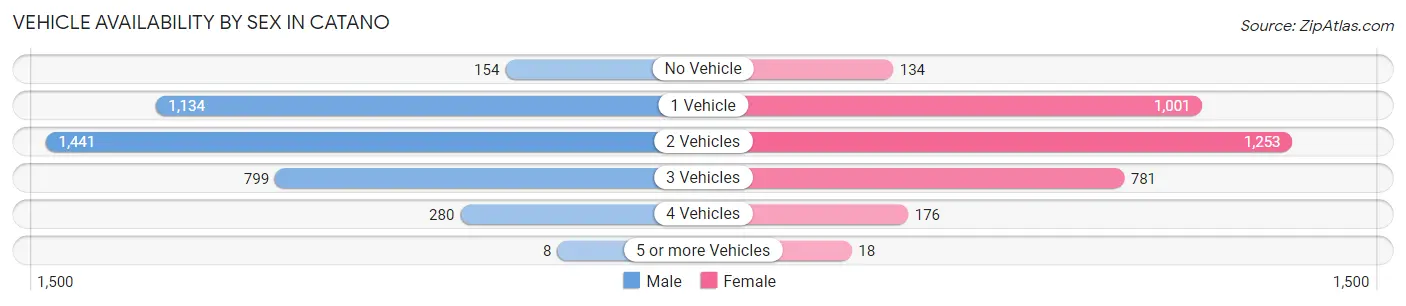
| Vehicles Available | Male | Female |
| No Vehicle | 154 (4.0%) | 134 (4.0%) |
| 1 Vehicle | 1,134 (29.7%) | 1,001 (29.8%) |
| 2 Vehicles | 1,441 (37.8%) | 1,253 (37.3%) |
| 3 Vehicles | 799 (20.9%) | 781 (23.2%) |
| 4 Vehicles | 280 (7.3%) | 176 (5.2%) |
| 5 or more Vehicles | 8 (0.2%) | 18 (0.5%) |
| Total | 3,816 (100.0%) | 3,363 (100.0%) |
Commute Time in Catano
The most frequently occuring commute durations in Catano are 30 to 34 minutes (1,756 commuters, 25.9%), 15 to 19 minutes (1,376 commuters, 20.3%), and 20 to 24 minutes (832 commuters, 12.3%).
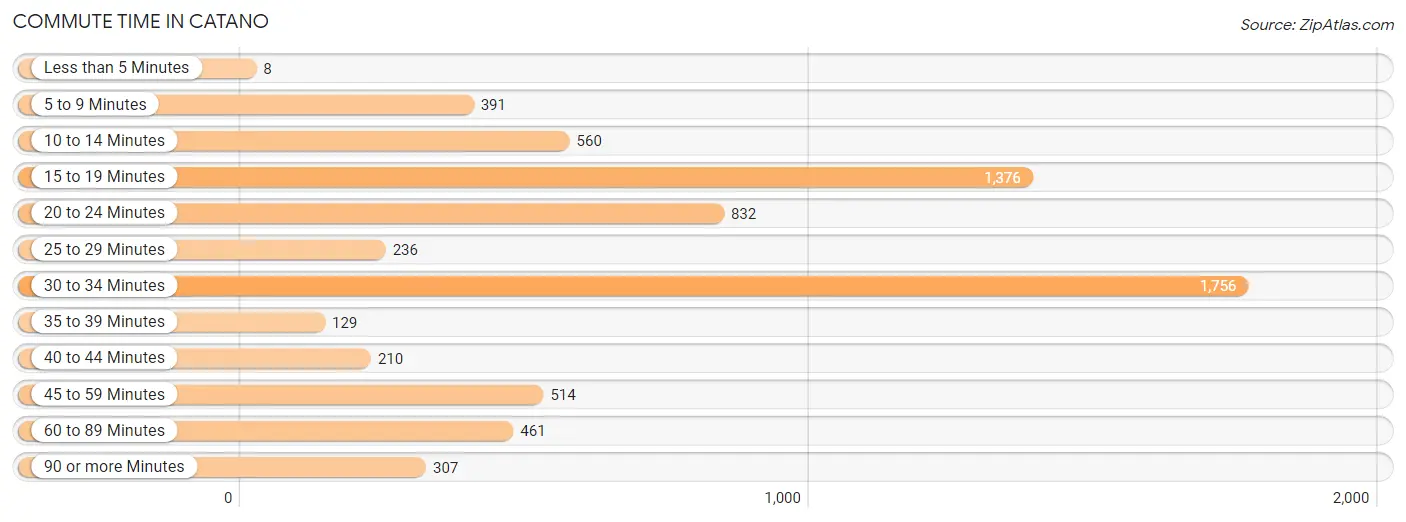
| Commute Time | # Commuters | % Commuters |
| Less than 5 Minutes | 8 | 0.1% |
| 5 to 9 Minutes | 391 | 5.8% |
| 10 to 14 Minutes | 560 | 8.3% |
| 15 to 19 Minutes | 1,376 | 20.3% |
| 20 to 24 Minutes | 832 | 12.3% |
| 25 to 29 Minutes | 236 | 3.5% |
| 30 to 34 Minutes | 1,756 | 25.9% |
| 35 to 39 Minutes | 129 | 1.9% |
| 40 to 44 Minutes | 210 | 3.1% |
| 45 to 59 Minutes | 514 | 7.6% |
| 60 to 89 Minutes | 461 | 6.8% |
| 90 or more Minutes | 307 | 4.5% |
Commute Time by Sex in Catano
The most common commute times in Catano are 30 to 34 minutes (1,002 commuters, 28.0%) for males and 30 to 34 minutes (754 commuters, 23.6%) for females.
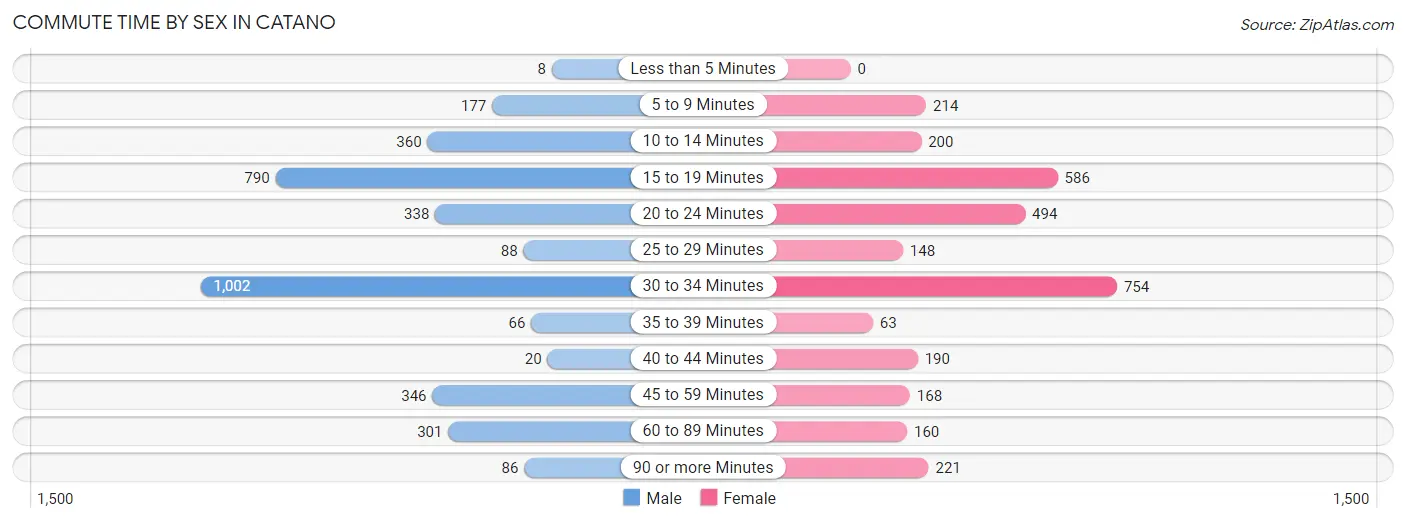
| Commute Time | Male | Female |
| Less than 5 Minutes | 8 (0.2%) | 0 (0.0%) |
| 5 to 9 Minutes | 177 (4.9%) | 214 (6.7%) |
| 10 to 14 Minutes | 360 (10.1%) | 200 (6.2%) |
| 15 to 19 Minutes | 790 (22.1%) | 586 (18.3%) |
| 20 to 24 Minutes | 338 (9.4%) | 494 (15.4%) |
| 25 to 29 Minutes | 88 (2.5%) | 148 (4.6%) |
| 30 to 34 Minutes | 1,002 (28.0%) | 754 (23.6%) |
| 35 to 39 Minutes | 66 (1.8%) | 63 (2.0%) |
| 40 to 44 Minutes | 20 (0.6%) | 190 (5.9%) |
| 45 to 59 Minutes | 346 (9.7%) | 168 (5.2%) |
| 60 to 89 Minutes | 301 (8.4%) | 160 (5.0%) |
| 90 or more Minutes | 86 (2.4%) | 221 (6.9%) |
Time of Departure to Work by Sex in Catano
The most frequent times of departure to work in Catano are 7:00 AM to 7:29 AM (774, 21.6%) for males and 7:00 AM to 7:29 AM (545, 17.0%) for females.
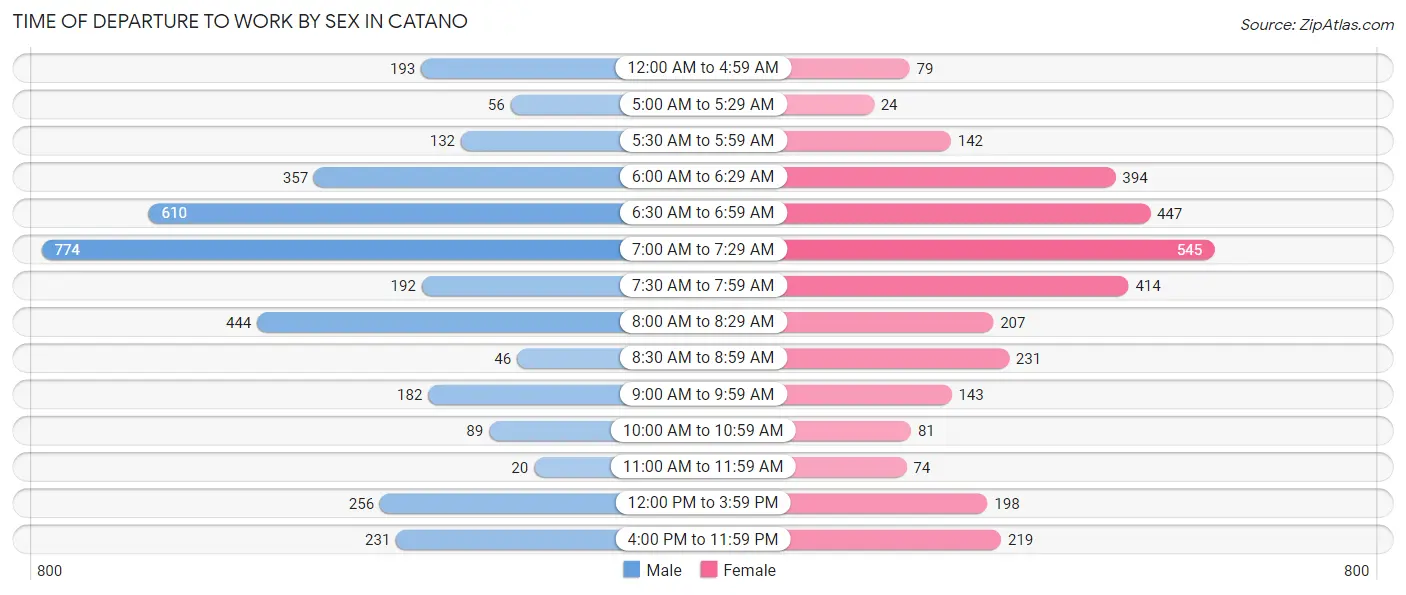
| Time of Departure | Male | Female |
| 12:00 AM to 4:59 AM | 193 (5.4%) | 79 (2.5%) |
| 5:00 AM to 5:29 AM | 56 (1.6%) | 24 (0.7%) |
| 5:30 AM to 5:59 AM | 132 (3.7%) | 142 (4.4%) |
| 6:00 AM to 6:29 AM | 357 (10.0%) | 394 (12.3%) |
| 6:30 AM to 6:59 AM | 610 (17.0%) | 447 (14.0%) |
| 7:00 AM to 7:29 AM | 774 (21.6%) | 545 (17.0%) |
| 7:30 AM to 7:59 AM | 192 (5.4%) | 414 (13.0%) |
| 8:00 AM to 8:29 AM | 444 (12.4%) | 207 (6.5%) |
| 8:30 AM to 8:59 AM | 46 (1.3%) | 231 (7.2%) |
| 9:00 AM to 9:59 AM | 182 (5.1%) | 143 (4.5%) |
| 10:00 AM to 10:59 AM | 89 (2.5%) | 81 (2.5%) |
| 11:00 AM to 11:59 AM | 20 (0.6%) | 74 (2.3%) |
| 12:00 PM to 3:59 PM | 256 (7.1%) | 198 (6.2%) |
| 4:00 PM to 11:59 PM | 231 (6.5%) | 219 (6.9%) |
| Total | 3,582 (100.0%) | 3,198 (100.0%) |
Housing Occupancy in Catano
Occupancy by Ownership in Catano
Of the total 8,794 dwellings in Catano, owner-occupied units account for 5,313 (60.4%), while renter-occupied units make up 3,481 (39.6%).
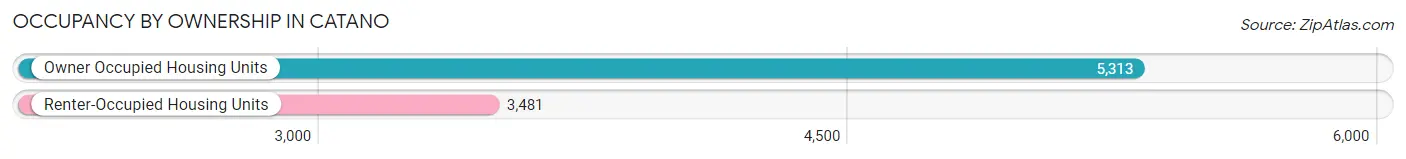
| Occupancy | # Housing Units | % Housing Units |
| Owner Occupied Housing Units | 5,313 | 60.4% |
| Renter-Occupied Housing Units | 3,481 | 39.6% |
| Total Occupied Housing Units | 8,794 | 100.0% |
Occupancy by Household Size in Catano
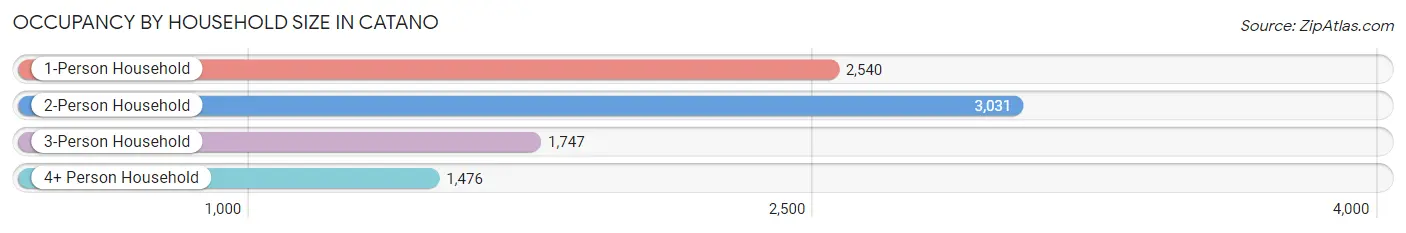
| Household Size | # Housing Units | % Housing Units |
| 1-Person Household | 2,540 | 28.9% |
| 2-Person Household | 3,031 | 34.5% |
| 3-Person Household | 1,747 | 19.9% |
| 4+ Person Household | 1,476 | 16.8% |
| Total Housing Units | 8,794 | 100.0% |
Occupancy by Ownership by Household Size in Catano
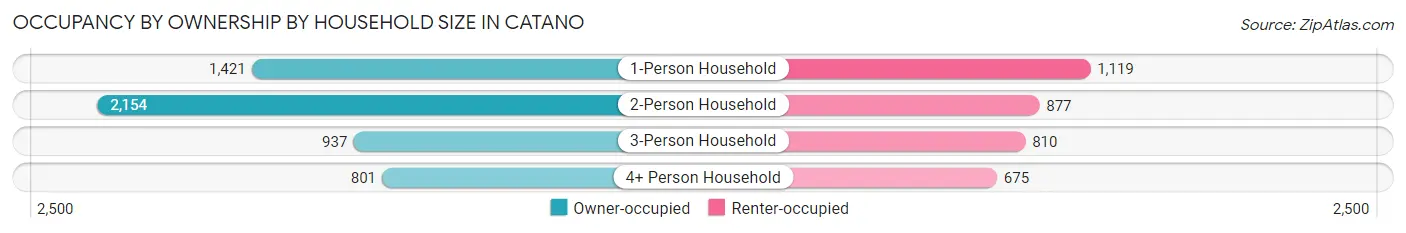
| Household Size | Owner-occupied | Renter-occupied |
| 1-Person Household | 1,421 (55.9%) | 1,119 (44.1%) |
| 2-Person Household | 2,154 (71.1%) | 877 (28.9%) |
| 3-Person Household | 937 (53.6%) | 810 (46.4%) |
| 4+ Person Household | 801 (54.3%) | 675 (45.7%) |
| Total Housing Units | 5,313 (60.4%) | 3,481 (39.6%) |
Occupancy by Educational Attainment in Catano
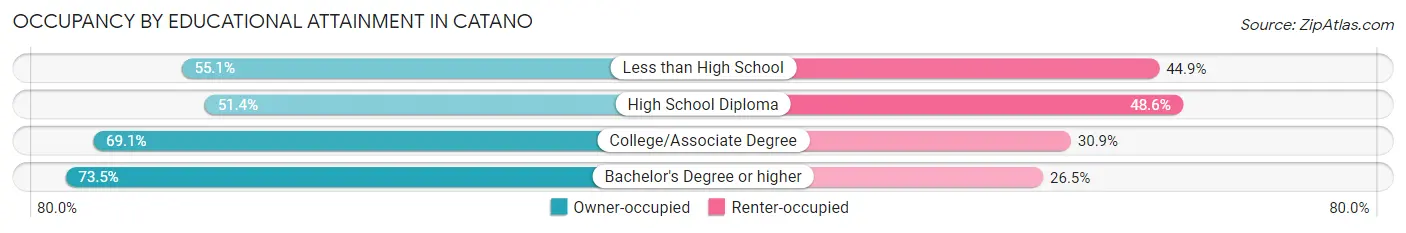
| Household Size | Owner-occupied | Renter-occupied |
| Less than High School | 1,193 (55.1%) | 972 (44.9%) |
| High School Diploma | 1,562 (51.4%) | 1,476 (48.6%) |
| College/Associate Degree | 1,289 (69.1%) | 576 (30.9%) |
| Bachelor's Degree or higher | 1,269 (73.5%) | 457 (26.5%) |
Occupancy by Age of Householder in Catano
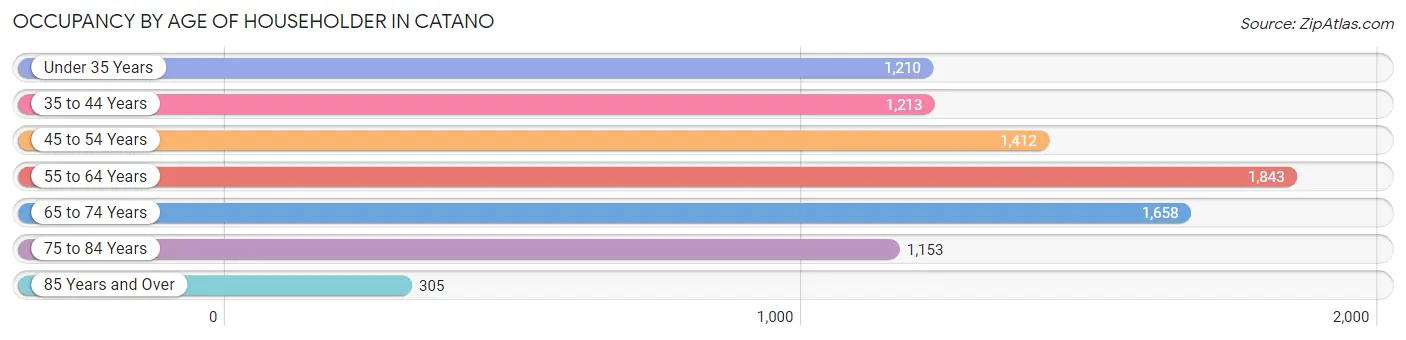
| Age Bracket | # Households | % Households |
| Under 35 Years | 1,210 | 13.8% |
| 35 to 44 Years | 1,213 | 13.8% |
| 45 to 54 Years | 1,412 | 16.1% |
| 55 to 64 Years | 1,843 | 21.0% |
| 65 to 74 Years | 1,658 | 18.9% |
| 75 to 84 Years | 1,153 | 13.1% |
| 85 Years and Over | 305 | 3.5% |
| Total | 8,794 | 100.0% |
Housing Finances in Catano
Median Income by Occupancy in Catano
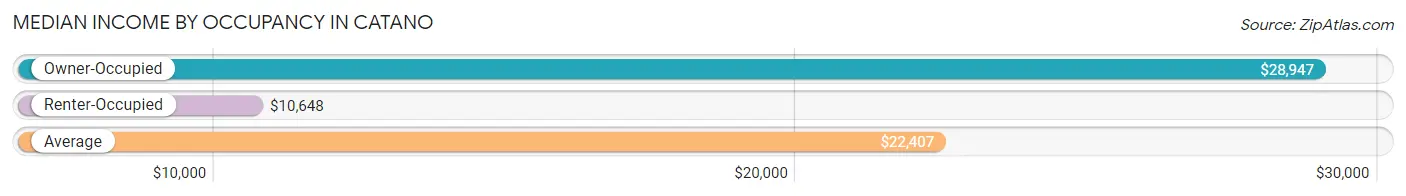
| Occupancy Type | # Households | Median Income |
| Owner-Occupied | 5,313 (60.4%) | $28,947 |
| Renter-Occupied | 3,481 (39.6%) | $10,648 |
| Average | 8,794 (100.0%) | $22,407 |
Occupancy by Householder Income Bracket in Catano
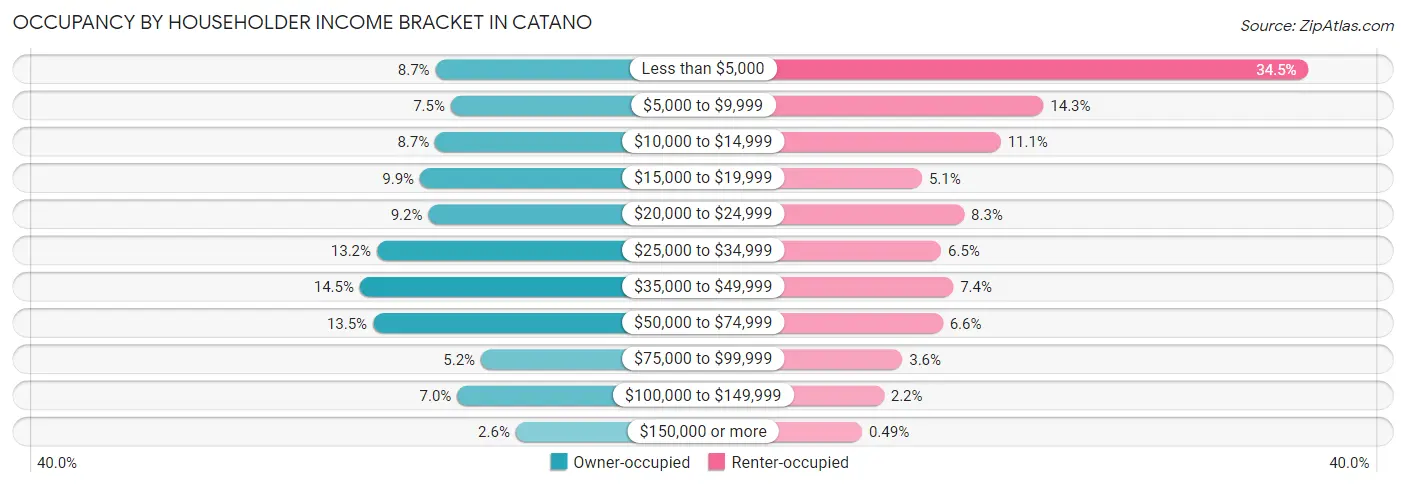
| Income Bracket | Owner-occupied | Renter-occupied |
| Less than $5,000 | 462 (8.7%) | 1,201 (34.5%) |
| $5,000 to $9,999 | 400 (7.5%) | 498 (14.3%) |
| $10,000 to $14,999 | 464 (8.7%) | 385 (11.1%) |
| $15,000 to $19,999 | 525 (9.9%) | 176 (5.1%) |
| $20,000 to $24,999 | 491 (9.2%) | 288 (8.3%) |
| $25,000 to $34,999 | 699 (13.2%) | 227 (6.5%) |
| $35,000 to $49,999 | 768 (14.5%) | 259 (7.4%) |
| $50,000 to $74,999 | 715 (13.5%) | 231 (6.6%) |
| $75,000 to $99,999 | 278 (5.2%) | 124 (3.6%) |
| $100,000 to $149,999 | 374 (7.0%) | 75 (2.1%) |
| $150,000 or more | 137 (2.6%) | 17 (0.5%) |
| Total | 5,313 (100.0%) | 3,481 (100.0%) |
Monthly Housing Cost Tiers in Catano
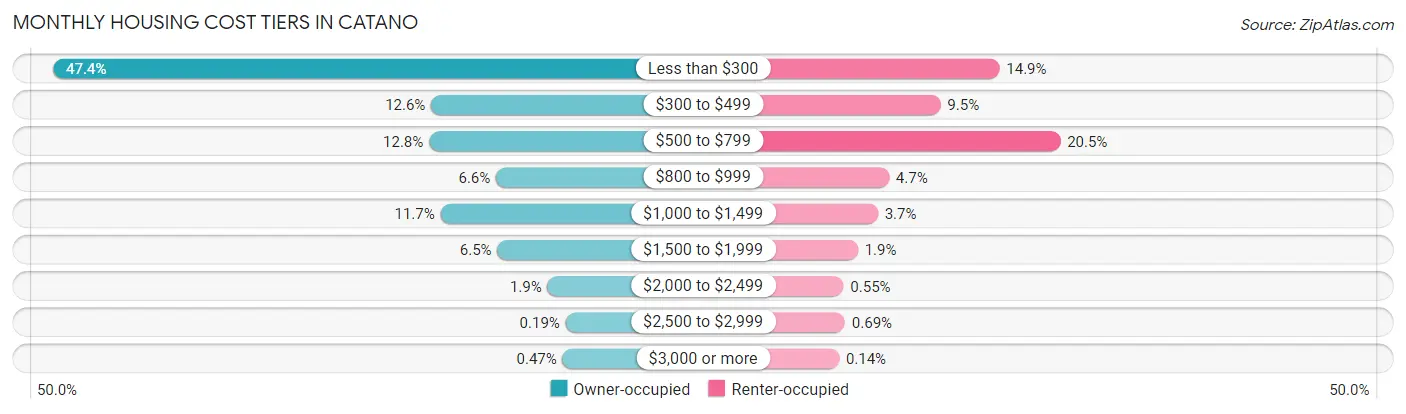
| Monthly Cost | Owner-occupied | Renter-occupied |
| Less than $300 | 2,517 (47.4%) | 519 (14.9%) |
| $300 to $499 | 668 (12.6%) | 330 (9.5%) |
| $500 to $799 | 678 (12.8%) | 714 (20.5%) |
| $800 to $999 | 350 (6.6%) | 165 (4.7%) |
| $1,000 to $1,499 | 622 (11.7%) | 129 (3.7%) |
| $1,500 to $1,999 | 344 (6.5%) | 65 (1.9%) |
| $2,000 to $2,499 | 99 (1.9%) | 19 (0.5%) |
| $2,500 to $2,999 | 10 (0.2%) | 24 (0.7%) |
| $3,000 or more | 25 (0.5%) | 5 (0.1%) |
| Total | 5,313 (100.0%) | 3,481 (100.0%) |
Physical Housing Characteristics in Catano
Housing Structures in Catano
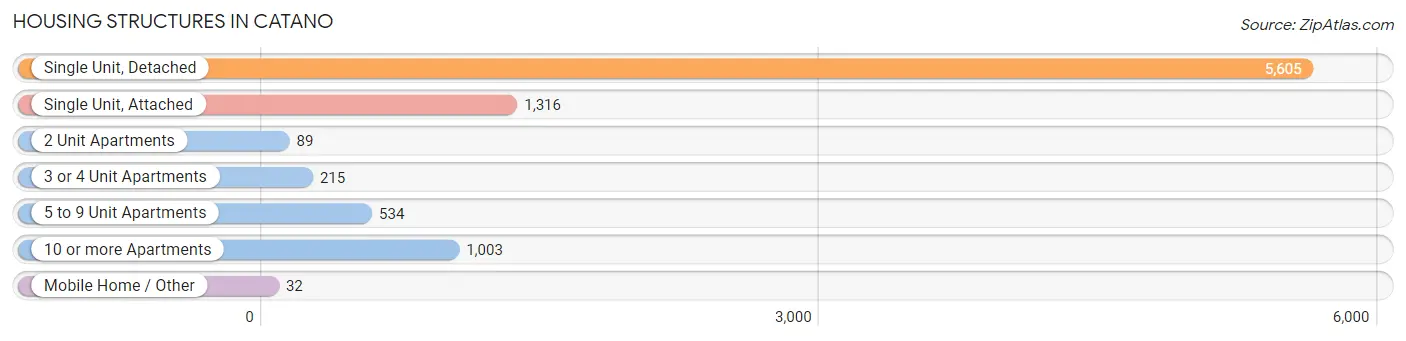
| Structure Type | # Housing Units | % Housing Units |
| Single Unit, Detached | 5,605 | 63.7% |
| Single Unit, Attached | 1,316 | 15.0% |
| 2 Unit Apartments | 89 | 1.0% |
| 3 or 4 Unit Apartments | 215 | 2.4% |
| 5 to 9 Unit Apartments | 534 | 6.1% |
| 10 or more Apartments | 1,003 | 11.4% |
| Mobile Home / Other | 32 | 0.4% |
| Total | 8,794 | 100.0% |
Housing Structures by Occupancy in Catano
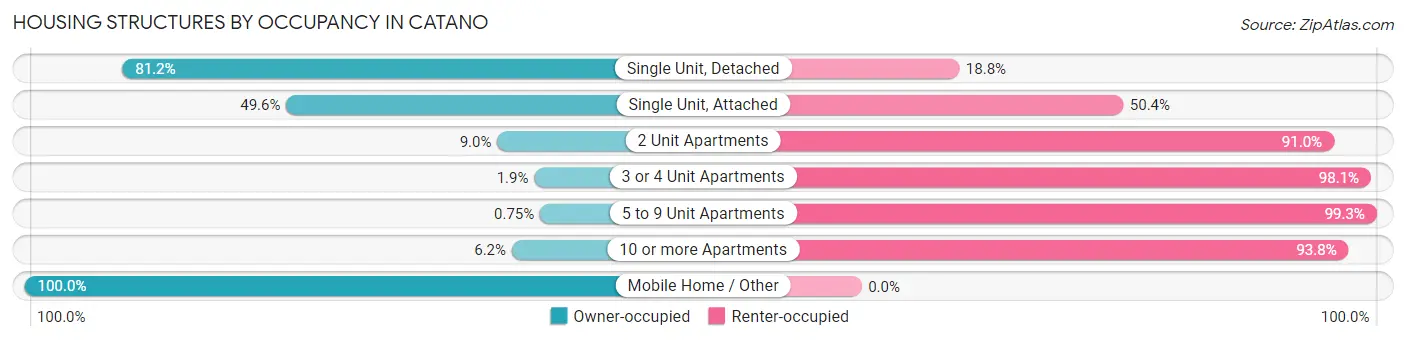
| Structure Type | Owner-occupied | Renter-occupied |
| Single Unit, Detached | 4,550 (81.2%) | 1,055 (18.8%) |
| Single Unit, Attached | 653 (49.6%) | 663 (50.4%) |
| 2 Unit Apartments | 8 (9.0%) | 81 (91.0%) |
| 3 or 4 Unit Apartments | 4 (1.9%) | 211 (98.1%) |
| 5 to 9 Unit Apartments | 4 (0.7%) | 530 (99.3%) |
| 10 or more Apartments | 62 (6.2%) | 941 (93.8%) |
| Mobile Home / Other | 32 (100.0%) | 0 (0.0%) |
| Total | 5,313 (60.4%) | 3,481 (39.6%) |
Housing Structures by Number of Rooms in Catano
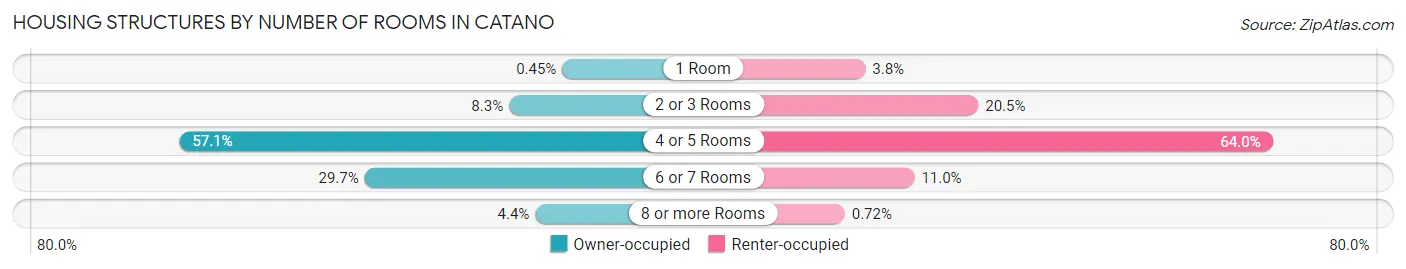
| Number of Rooms | Owner-occupied | Renter-occupied |
| 1 Room | 24 (0.4%) | 131 (3.8%) |
| 2 or 3 Rooms | 442 (8.3%) | 713 (20.5%) |
| 4 or 5 Rooms | 3,033 (57.1%) | 2,228 (64.0%) |
| 6 or 7 Rooms | 1,578 (29.7%) | 384 (11.0%) |
| 8 or more Rooms | 236 (4.4%) | 25 (0.7%) |
| Total | 5,313 (100.0%) | 3,481 (100.0%) |
Housing Structure by Heating Type in Catano
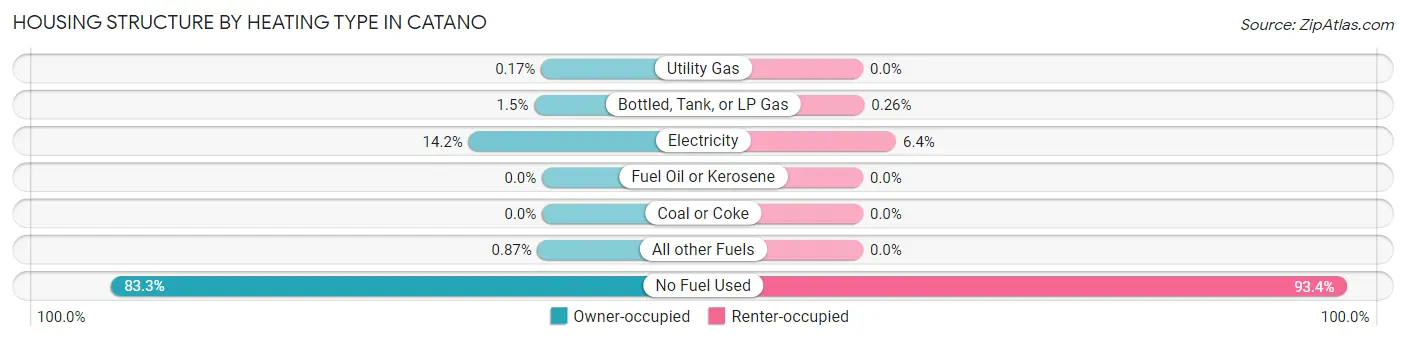
| Heating Type | Owner-occupied | Renter-occupied |
| Utility Gas | 9 (0.2%) | 0 (0.0%) |
| Bottled, Tank, or LP Gas | 81 (1.5%) | 9 (0.3%) |
| Electricity | 754 (14.2%) | 222 (6.4%) |
| Fuel Oil or Kerosene | 0 (0.0%) | 0 (0.0%) |
| Coal or Coke | 0 (0.0%) | 0 (0.0%) |
| All other Fuels | 46 (0.9%) | 0 (0.0%) |
| No Fuel Used | 4,423 (83.3%) | 3,250 (93.4%) |
| Total | 5,313 (100.0%) | 3,481 (100.0%) |
Household Vehicle Usage in Catano
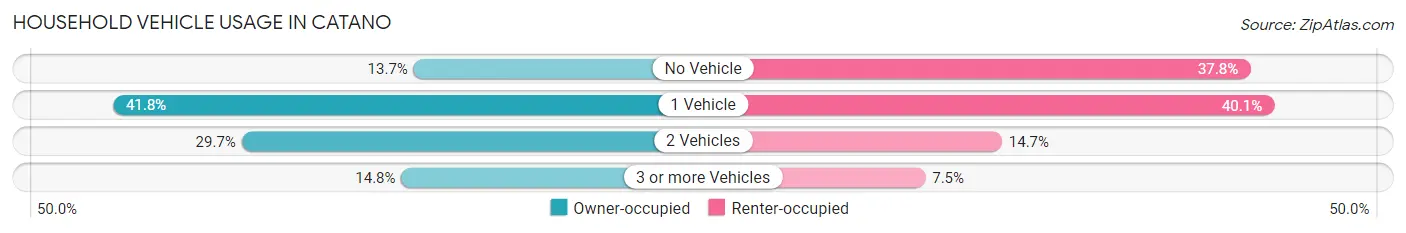
| Vehicles per Household | Owner-occupied | Renter-occupied |
| No Vehicle | 727 (13.7%) | 1,316 (37.8%) |
| 1 Vehicle | 2,218 (41.7%) | 1,394 (40.1%) |
| 2 Vehicles | 1,580 (29.7%) | 510 (14.6%) |
| 3 or more Vehicles | 788 (14.8%) | 261 (7.5%) |
| Total | 5,313 (100.0%) | 3,481 (100.0%) |
Real Estate & Mortgages in Catano
Real Estate and Mortgage Overview in Catano
| Characteristic | Without Mortgage | With Mortgage |
| Housing Units | 3,349 | 1,964 |
| Median Property Value | $107,800 | $156,700 |
| Median Household Income | $23,508 | $118 |
| Monthly Housing Costs | $200 | $25 |
| Real Estate Taxes | $733 | $1,466 |
Property Value by Mortgage Status in Catano
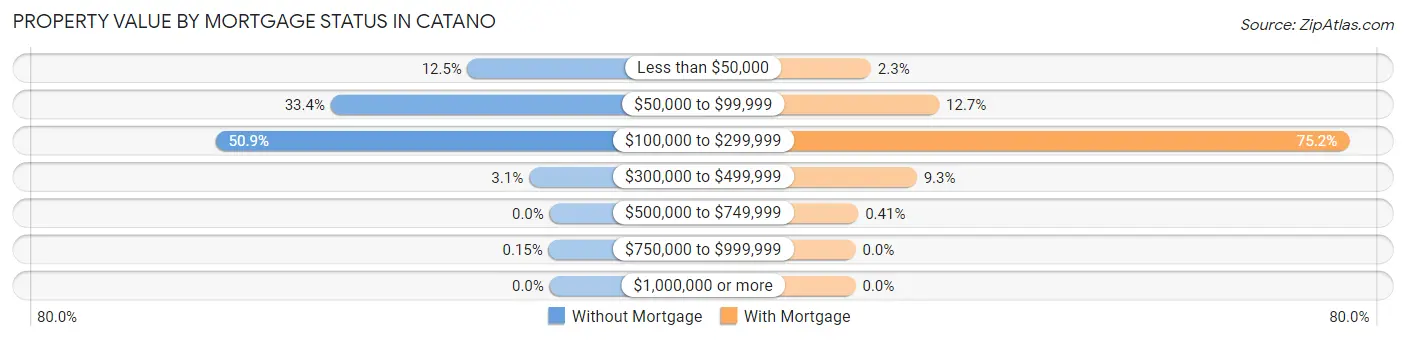
| Property Value | Without Mortgage | With Mortgage |
| Less than $50,000 | 418 (12.5%) | 46 (2.3%) |
| $50,000 to $99,999 | 1,117 (33.4%) | 250 (12.7%) |
| $100,000 to $299,999 | 1,704 (50.9%) | 1,477 (75.2%) |
| $300,000 to $499,999 | 105 (3.1%) | 183 (9.3%) |
| $500,000 to $749,999 | 0 (0.0%) | 8 (0.4%) |
| $750,000 to $999,999 | 5 (0.2%) | 0 (0.0%) |
| $1,000,000 or more | 0 (0.0%) | 0 (0.0%) |
| Total | 3,349 (100.0%) | 1,964 (100.0%) |
Household Income by Mortgage Status in Catano
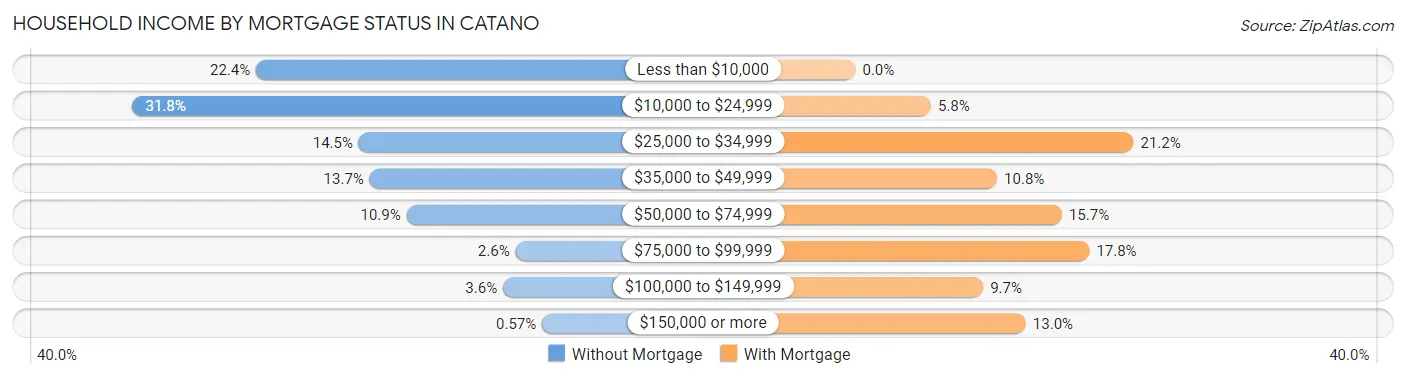
| Household Income | Without Mortgage | With Mortgage |
| Less than $10,000 | 749 (22.4%) | 0 (0.0%) |
| $10,000 to $24,999 | 1,064 (31.8%) | 113 (5.8%) |
| $25,000 to $34,999 | 487 (14.5%) | 416 (21.2%) |
| $35,000 to $49,999 | 459 (13.7%) | 212 (10.8%) |
| $50,000 to $74,999 | 365 (10.9%) | 309 (15.7%) |
| $75,000 to $99,999 | 87 (2.6%) | 350 (17.8%) |
| $100,000 to $149,999 | 119 (3.5%) | 191 (9.7%) |
| $150,000 or more | 19 (0.6%) | 255 (13.0%) |
| Total | 3,349 (100.0%) | 1,964 (100.0%) |
Property Value to Household Income Ratio in Catano
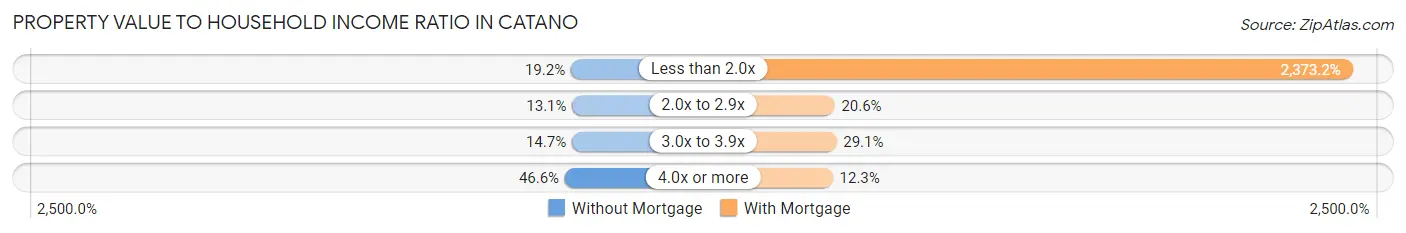
| Value-to-Income Ratio | Without Mortgage | With Mortgage |
| Less than 2.0x | 642 (19.2%) | 46,610 (2,373.2%) |
| 2.0x to 2.9x | 439 (13.1%) | 405 (20.6%) |
| 3.0x to 3.9x | 491 (14.7%) | 571 (29.1%) |
| 4.0x or more | 1,561 (46.6%) | 242 (12.3%) |
| Total | 3,349 (100.0%) | 1,964 (100.0%) |
Real Estate Taxes by Mortgage Status in Catano
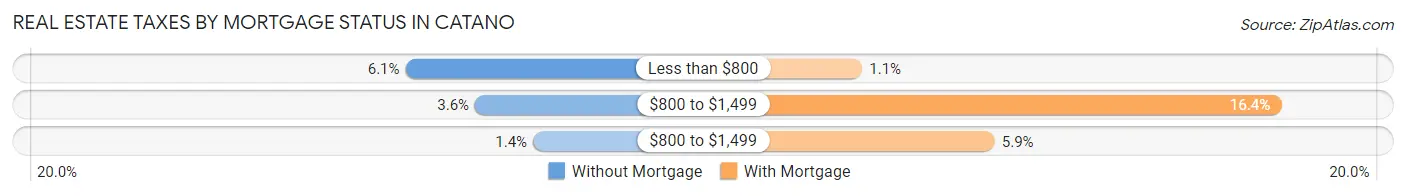
| Property Taxes | Without Mortgage | With Mortgage |
| Less than $800 | 204 (6.1%) | 21 (1.1%) |
| $800 to $1,499 | 119 (3.5%) | 322 (16.4%) |
| $800 to $1,499 | 48 (1.4%) | 116 (5.9%) |
| Total | 3,349 (100.0%) | 1,964 (100.0%) |
Health & Disability in Catano
Health Insurance Coverage by Age in Catano
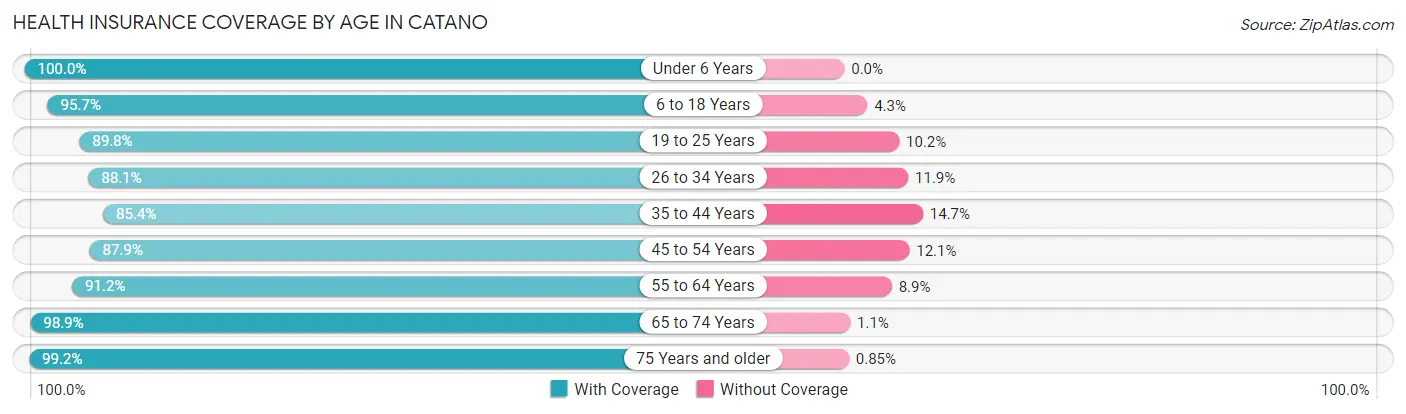
| Age Bracket | With Coverage | Without Coverage |
| Under 6 Years | 1,056 (100.0%) | 0 (0.0%) |
| 6 to 18 Years | 3,196 (95.7%) | 143 (4.3%) |
| 19 to 25 Years | 1,872 (89.8%) | 213 (10.2%) |
| 26 to 34 Years | 2,450 (88.1%) | 331 (11.9%) |
| 35 to 44 Years | 2,394 (85.4%) | 411 (14.6%) |
| 45 to 54 Years | 2,305 (87.9%) | 318 (12.1%) |
| 55 to 64 Years | 2,854 (91.1%) | 277 (8.8%) |
| 65 to 74 Years | 2,653 (98.9%) | 29 (1.1%) |
| 75 Years and older | 2,455 (99.2%) | 21 (0.9%) |
| Total | 21,235 (92.4%) | 1,743 (7.6%) |
Health Insurance Coverage by Citizenship Status in Catano
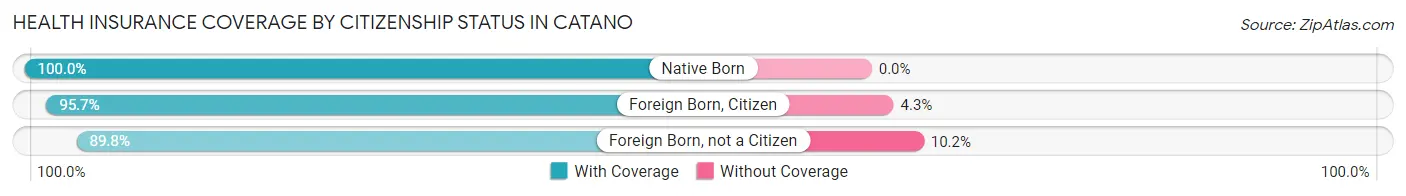
| Citizenship Status | With Coverage | Without Coverage |
| Native Born | 1,056 (100.0%) | 0 (0.0%) |
| Foreign Born, Citizen | 3,196 (95.7%) | 143 (4.3%) |
| Foreign Born, not a Citizen | 1,872 (89.8%) | 213 (10.2%) |
Health Insurance Coverage by Household Income in Catano
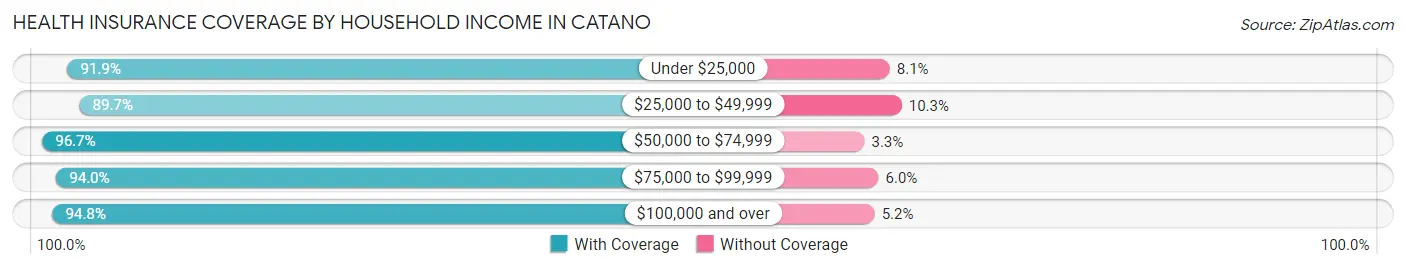
| Household Income | With Coverage | Without Coverage |
| Under $25,000 | 9,926 (91.9%) | 870 (8.1%) |
| $25,000 to $49,999 | 5,043 (89.7%) | 580 (10.3%) |
| $50,000 to $74,999 | 3,059 (96.7%) | 105 (3.3%) |
| $75,000 to $99,999 | 1,388 (94.0%) | 88 (6.0%) |
| $100,000 and over | 1,813 (94.8%) | 100 (5.2%) |
Public vs Private Health Insurance Coverage by Age in Catano
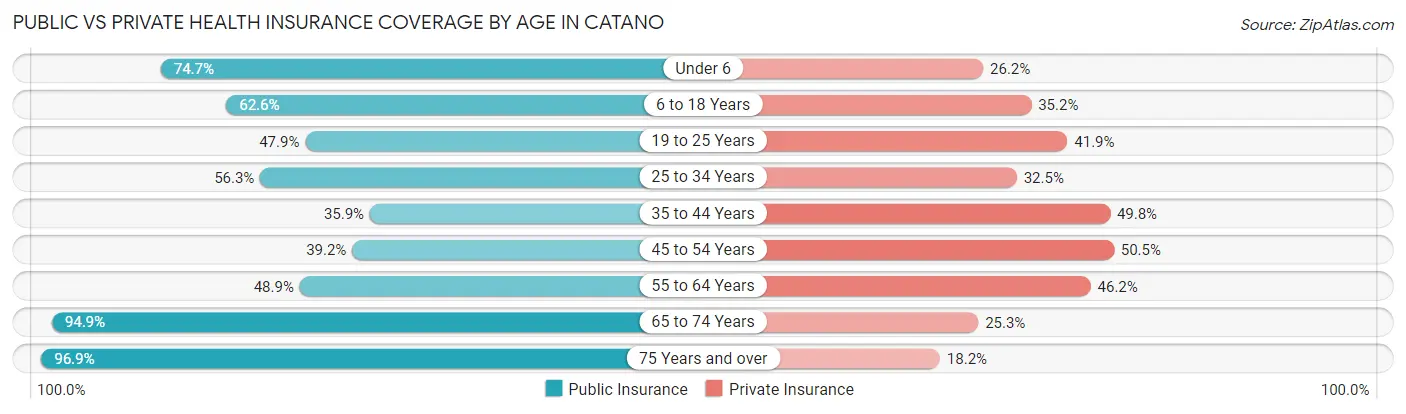
| Age Bracket | Public Insurance | Private Insurance |
| Under 6 | 789 (74.7%) | 277 (26.2%) |
| 6 to 18 Years | 2,089 (62.6%) | 1,174 (35.2%) |
| 19 to 25 Years | 999 (47.9%) | 873 (41.9%) |
| 25 to 34 Years | 1,565 (56.3%) | 903 (32.5%) |
| 35 to 44 Years | 1,007 (35.9%) | 1,396 (49.8%) |
| 45 to 54 Years | 1,028 (39.2%) | 1,324 (50.5%) |
| 55 to 64 Years | 1,532 (48.9%) | 1,446 (46.2%) |
| 65 to 74 Years | 2,546 (94.9%) | 679 (25.3%) |
| 75 Years and over | 2,399 (96.9%) | 451 (18.2%) |
| Total | 13,954 (60.7%) | 8,523 (37.1%) |
Disability Status by Sex by Age in Catano
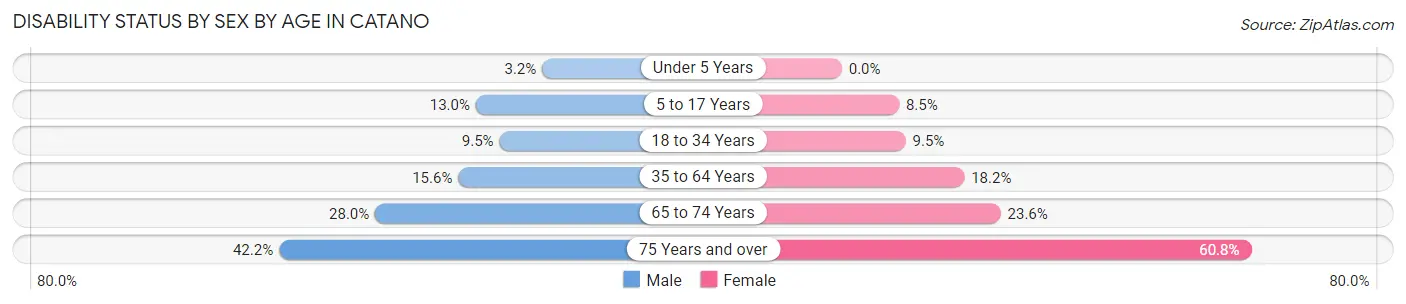
| Age Bracket | Male | Female |
| Under 5 Years | 13 (3.2%) | 0 (0.0%) |
| 5 to 17 Years | 223 (13.0%) | 137 (8.5%) |
| 18 to 34 Years | 233 (9.5%) | 252 (9.5%) |
| 35 to 64 Years | 619 (15.6%) | 835 (18.2%) |
| 65 to 74 Years | 336 (28.0%) | 349 (23.6%) |
| 75 Years and over | 424 (42.2%) | 895 (60.8%) |
Disability Class by Sex by Age in Catano
Disability Class: Hearing Difficulty
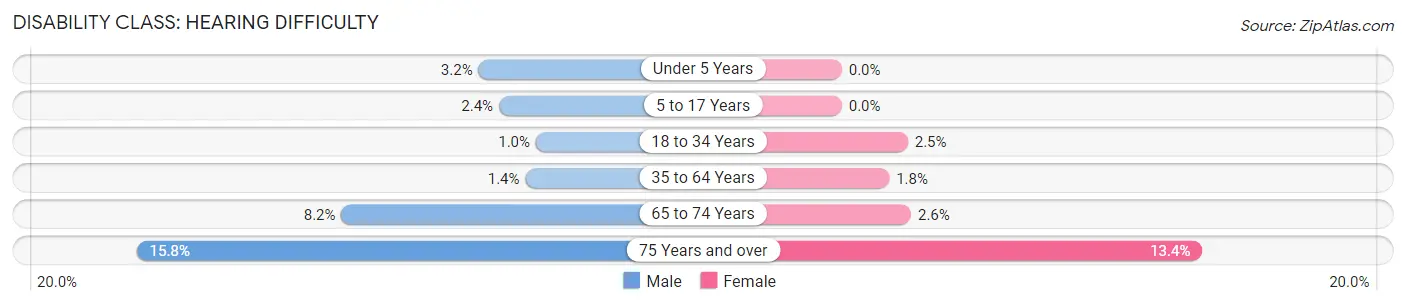
| Age Bracket | Male | Female |
| Under 5 Years | 13 (3.2%) | 0 (0.0%) |
| 5 to 17 Years | 41 (2.4%) | 0 (0.0%) |
| 18 to 34 Years | 25 (1.0%) | 65 (2.5%) |
| 35 to 64 Years | 56 (1.4%) | 81 (1.8%) |
| 65 to 74 Years | 99 (8.2%) | 38 (2.6%) |
| 75 Years and over | 159 (15.8%) | 197 (13.4%) |
Disability Class: Vision Difficulty
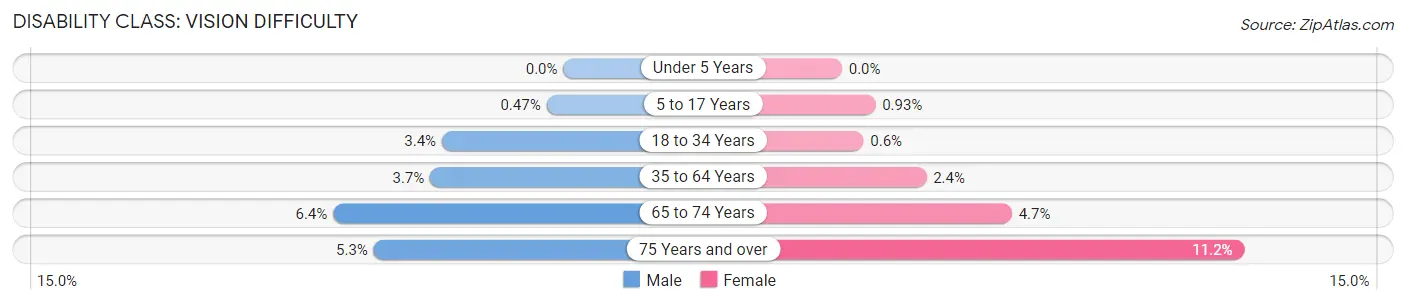
| Age Bracket | Male | Female |
| Under 5 Years | 0 (0.0%) | 0 (0.0%) |
| 5 to 17 Years | 8 (0.5%) | 15 (0.9%) |
| 18 to 34 Years | 83 (3.4%) | 16 (0.6%) |
| 35 to 64 Years | 147 (3.7%) | 108 (2.4%) |
| 65 to 74 Years | 77 (6.4%) | 70 (4.7%) |
| 75 Years and over | 53 (5.3%) | 165 (11.2%) |
Disability Class: Cognitive Difficulty
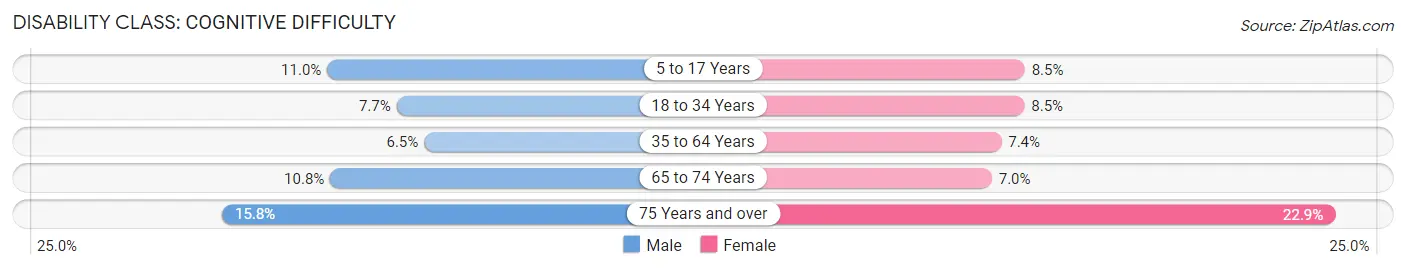
| Age Bracket | Male | Female |
| 5 to 17 Years | 188 (11.0%) | 137 (8.5%) |
| 18 to 34 Years | 190 (7.7%) | 225 (8.5%) |
| 35 to 64 Years | 256 (6.5%) | 340 (7.4%) |
| 65 to 74 Years | 130 (10.8%) | 103 (7.0%) |
| 75 Years and over | 159 (15.8%) | 337 (22.9%) |
Disability Class: Ambulatory Difficulty
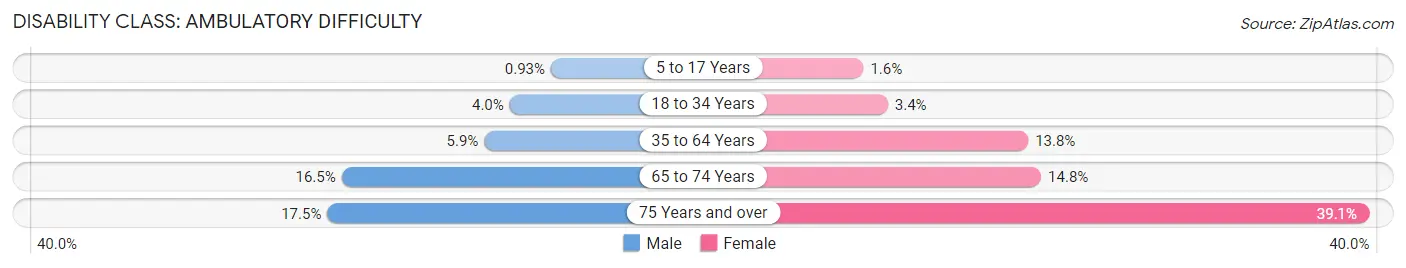
| Age Bracket | Male | Female |
| 5 to 17 Years | 16 (0.9%) | 26 (1.6%) |
| 18 to 34 Years | 98 (4.0%) | 91 (3.4%) |
| 35 to 64 Years | 233 (5.9%) | 636 (13.8%) |
| 65 to 74 Years | 198 (16.5%) | 219 (14.8%) |
| 75 Years and over | 176 (17.5%) | 576 (39.1%) |
Disability Class: Self-Care Difficulty
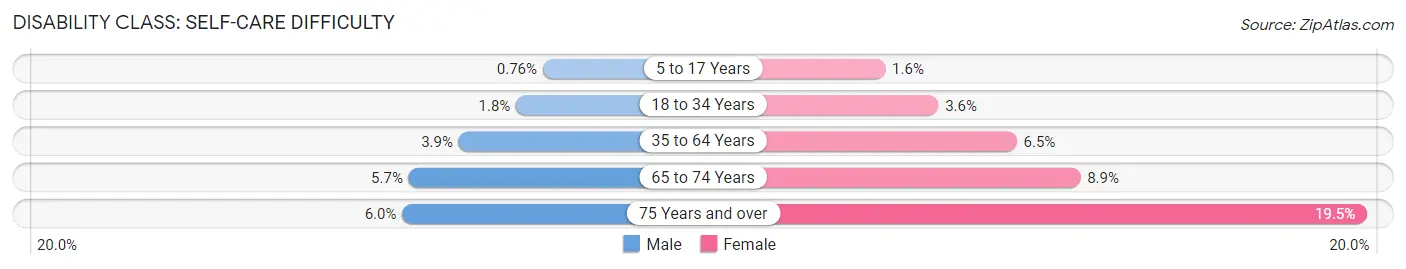
| Age Bracket | Male | Female |
| 5 to 17 Years | 13 (0.8%) | 26 (1.6%) |
| 18 to 34 Years | 43 (1.8%) | 95 (3.6%) |
| 35 to 64 Years | 154 (3.9%) | 298 (6.5%) |
| 65 to 74 Years | 69 (5.7%) | 131 (8.8%) |
| 75 Years and over | 60 (6.0%) | 287 (19.5%) |
Technology Access in Catano
Computing Device Access in Catano
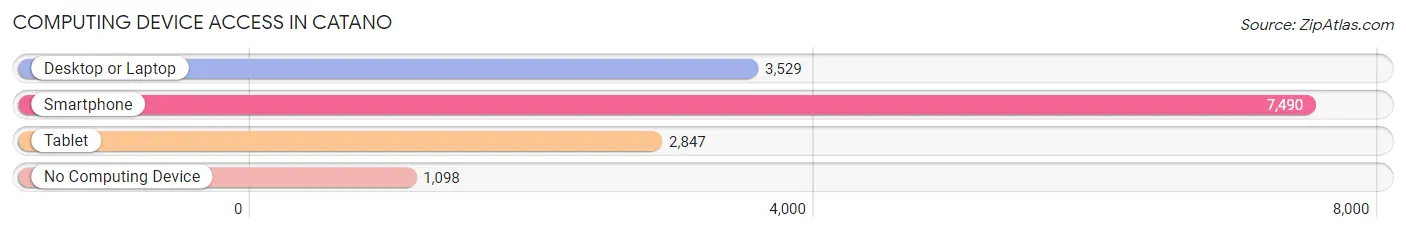
| Device Type | # Households | % Households |
| Desktop or Laptop | 3,529 | 40.1% |
| Smartphone | 7,490 | 85.2% |
| Tablet | 2,847 | 32.4% |
| No Computing Device | 1,098 | 12.5% |
| Total | 8,794 | 100.0% |
Internet Access in Catano
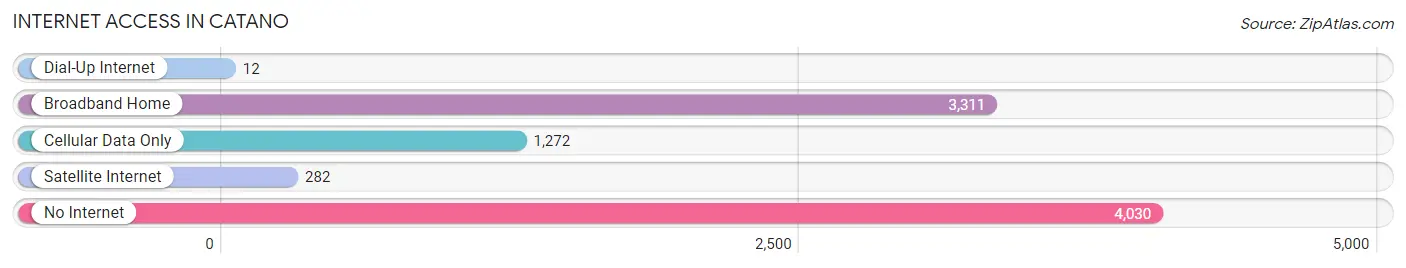
| Internet Type | # Households | % Households |
| Dial-Up Internet | 12 | 0.1% |
| Broadband Home | 3,311 | 37.7% |
| Cellular Data Only | 1,272 | 14.5% |
| Satellite Internet | 282 | 3.2% |
| No Internet | 4,030 | 45.8% |
| Total | 8,794 | 100.0% |
Catano Summary
Catano is a municipality located in the northern coast of Puerto Rico, in the San Juan-Caguas-Guaynabo metropolitan area. It is bordered by the municipalities of Bayamon, Toa Baja, and San Juan. Catano is known for its industrial and commercial activity, as well as its beautiful beaches.
History
Catano was founded in 1737 by Don Francisco de los Olivos, who was granted the land by the Spanish Crown. The name of the town is derived from the Taino word “Cataño”, which means “place of many trees”. The town was originally a small fishing village, but it grew in importance during the 19th century due to its strategic location near the San Juan Bay. During this period, the town became an important port for the export of sugar, coffee, and other agricultural products.
In 1898, Catano was annexed to the United States as part of the Treaty of Paris, which ended the Spanish-American War. During the early 20th century, the town experienced a period of economic growth due to the construction of the San Juan-Carolina Railroad, which connected Catano to the rest of Puerto Rico.
Geography
Catano is located in the northern coast of Puerto Rico, in the San Juan-Caguas-Guaynabo metropolitan area. It is bordered by the municipalities of Bayamon, Toa Baja, and San Juan. The town covers an area of 8.9 square miles and has a population of approximately 40,000 people.
The terrain of Catano is mostly flat, with some hills in the northern part of the municipality. The town is located near the San Juan Bay, which provides access to the Atlantic Ocean. The climate of Catano is tropical, with temperatures ranging from 75 to 90 degrees Fahrenheit.
Economy
Catano is an important industrial and commercial center in Puerto Rico. The town is home to several large factories, including a Coca-Cola bottling plant, a pharmaceutical plant, and a paper mill. The town also has a large port, which is used for the export of agricultural products and other goods.
The town is also home to several shopping centers, restaurants, and other businesses. Tourism is also an important part of the local economy, as the town is home to several beautiful beaches.
Demographics
As of the 2010 census, Catano had a population of 40,000 people. The population is mostly of Puerto Rican descent, with a small percentage of African and European ancestry. The town has a median household income of $20,000, which is slightly lower than the national average.
Catano is a predominantly Catholic town, with over 90% of the population identifying as Catholic. The town also has a small Protestant population, as well as a small Jewish community.
Conclusion
Catano is a municipality located in the northern coast of Puerto Rico, in the San Juan-Caguas-Guaynabo metropolitan area. It is known for its industrial and commercial activity, as well as its beautiful beaches. The town has a population of 40,000 people, mostly of Puerto Rican descent, and a median household income of $20,000. Catano is an important industrial and commercial center in Puerto Rico, and tourism is also an important part of the local economy.
Common Questions
What is Per Capita Income in Catano?
Per Capita income in Catano is $14,094.
What is the Median Family Income in Catano?
Median Family Income in Catano is $26,691.
What is the Median Household income in Catano?
Median Household Income in Catano is $22,407.
What is Income or Wage Gap in Catano?
Income or Wage Gap in Catano is 4.6%.
Women in Catano earn 95.4 cents for every dollar earned by a man.
What is Family Income Deficit in Catano?
Family Income Deficit in Catano is $12,344.
Families that are below poverty line in Catano earn $12,344 less on average than the poverty threshold level.
What is Inequality or Gini Index in Catano?
Inequality or Gini Index in Catano is 0.55.
What is the Total Population of Catano?
Total Population of Catano is 23,060.
What is the Total Male Population of Catano?
Total Male Population of Catano is 10,835.
What is the Total Female Population of Catano?
Total Female Population of Catano is 12,225.
What is the Ratio of Males per 100 Females in Catano?
There are 88.63 Males per 100 Females in Catano.
What is the Ratio of Females per 100 Males in Catano?
There are 112.83 Females per 100 Males in Catano.
What is the Median Population Age in Catano?
Median Population Age in Catano is 42.9 Years.
What is the Average Family Size in Catano
Average Family Size in Catano is 3.2 People.
What is the Average Household Size in Catano
Average Household Size in Catano is 2.6 People.
How Large is the Labor Force in Catano?
There are 8,477 People in the Labor Forcein in Catano.
What is the Percentage of People in the Labor Force in Catano?
43.6% of People are in the Labor Force in Catano.
What is the Unemployment Rate in Catano?
Unemployment Rate in Catano is 13.7%.