Aibonito, PR Map & Demographics
Aibonito Map
Aibonito Overview
$12,622
PER CAPITA INCOME
$24,740
AVG FAMILY INCOME
$18,359
AVG HOUSEHOLD INCOME
7.7%
WAGE / INCOME GAP [ % ]
92.3¢/ $1
WAGE / INCOME GAP [ $ ]
$11,542
FAMILY INCOME DEFICIT
0.52
INEQUALITY / GINI INDEX
8,596
TOTAL POPULATION
4,053
MALE POPULATION
4,543
FEMALE POPULATION
89.21
MALES / 100 FEMALES
112.09
FEMALES / 100 MALES
43.3
MEDIAN AGE
3.7
AVG FAMILY SIZE
2.6
AVG HOUSEHOLD SIZE
2,710
LABOR FORCE [ PEOPLE ]
37.5%
PERCENT IN LABOR FORCE
8.2%
UNEMPLOYMENT RATE
Aibonito Zip Codes
Aibonito Area Codes
Income in Aibonito
Income Overview in Aibonito
Per Capita Income in Aibonito is $12,622, while median incomes of families and households are $24,740 and $18,359 respectively.
| Characteristic | Number | Measure |
| Per Capita Income | 8,596 | $12,622 |
| Median Family Income | 1,779 | $24,740 |
| Mean Family Income | 1,779 | $32,232 |
| Median Household Income | 3,260 | $18,359 |
| Mean Household Income | 3,260 | $27,394 |
| Income Deficit | 1,779 | $11,542 |
| Wage / Income Gap (%) | 8,596 | 7.74% |
| Wage / Income Gap ($) | 8,596 | 92.26¢ per $1 |
| Gini / Inequality Index | 8,596 | 0.52 |
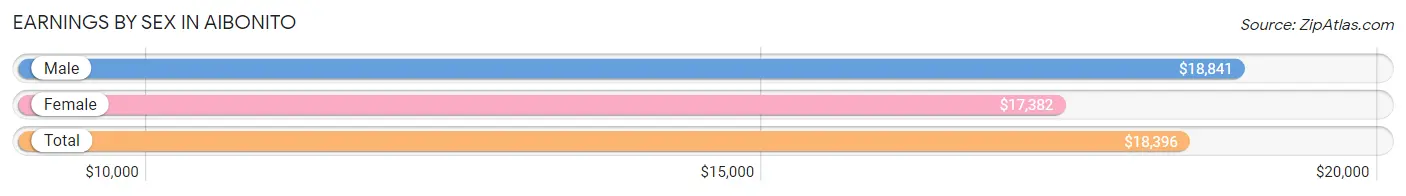
Earnings by Sex in Aibonito
Average Earnings in Aibonito are $18,396, $18,841 for men and $17,382 for women, a difference of 7.7%.
| Sex | Number | Average Earnings |
| Male | 1,363 (50.5%) | $18,841 |
| Female | 1,336 (49.5%) | $17,382 |
| Total | 2,699 (100.0%) | $18,396 |
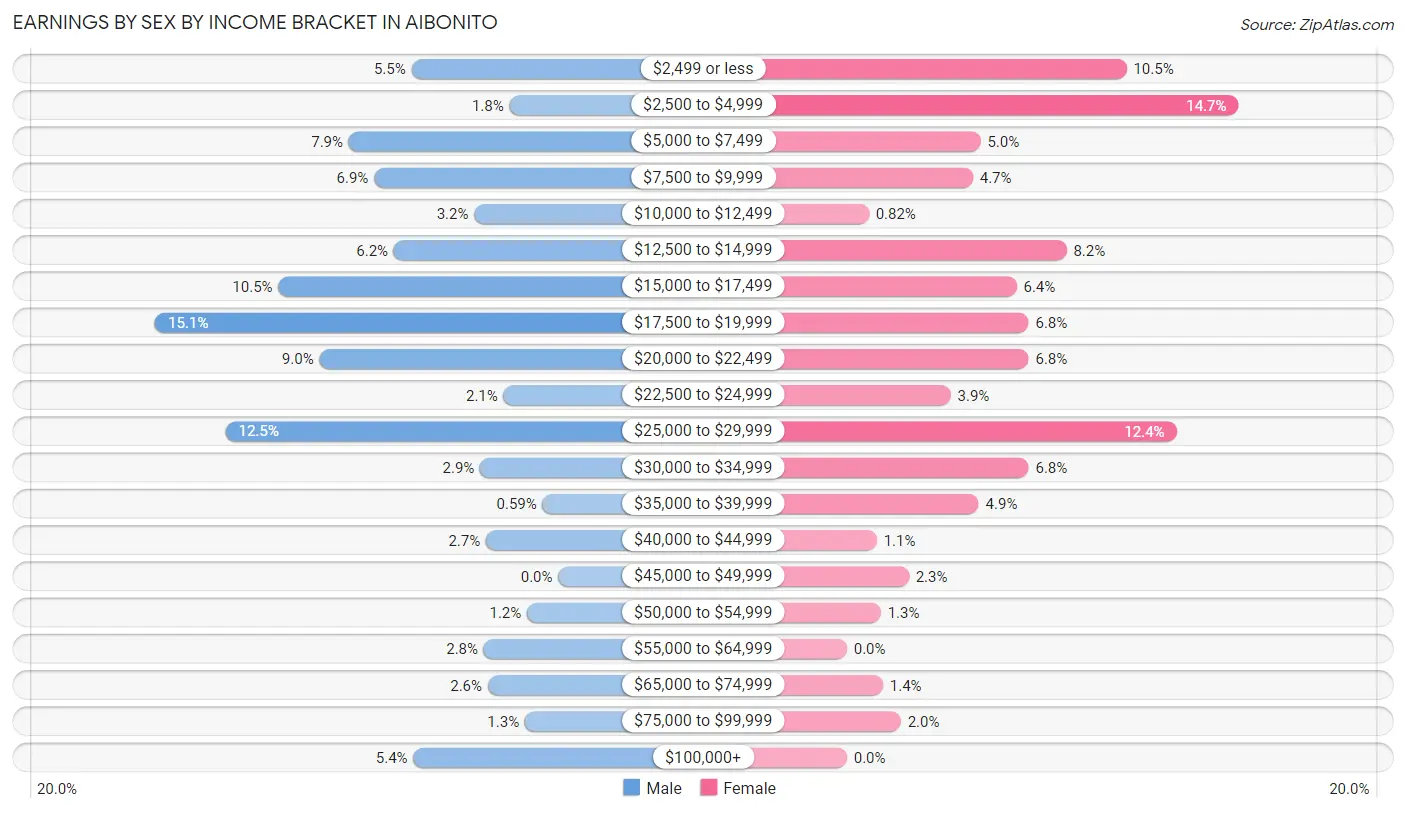
Earnings by Sex by Income Bracket in Aibonito
The most common earnings brackets in Aibonito are $17,500 to $19,999 for men (206 | 15.1%) and $2,500 to $4,999 for women (196 | 14.7%).
| Income | Male | Female |
| $2,499 or less | 75 (5.5%) | 140 (10.5%) |
| $2,500 to $4,999 | 25 (1.8%) | 196 (14.7%) |
| $5,000 to $7,499 | 107 (7.9%) | 67 (5.0%) |
| $7,500 to $9,999 | 94 (6.9%) | 63 (4.7%) |
| $10,000 to $12,499 | 43 (3.2%) | 11 (0.8%) |
| $12,500 to $14,999 | 84 (6.2%) | 110 (8.2%) |
| $15,000 to $17,499 | 143 (10.5%) | 85 (6.4%) |
| $17,500 to $19,999 | 206 (15.1%) | 91 (6.8%) |
| $20,000 to $22,499 | 122 (8.9%) | 91 (6.8%) |
| $22,500 to $24,999 | 28 (2.1%) | 52 (3.9%) |
| $25,000 to $29,999 | 170 (12.5%) | 165 (12.3%) |
| $30,000 to $34,999 | 40 (2.9%) | 91 (6.8%) |
| $35,000 to $39,999 | 8 (0.6%) | 66 (4.9%) |
| $40,000 to $44,999 | 37 (2.7%) | 15 (1.1%) |
| $45,000 to $49,999 | 0 (0.0%) | 31 (2.3%) |
| $50,000 to $54,999 | 16 (1.2%) | 17 (1.3%) |
| $55,000 to $64,999 | 38 (2.8%) | 0 (0.0%) |
| $65,000 to $74,999 | 36 (2.6%) | 18 (1.3%) |
| $75,000 to $99,999 | 17 (1.3%) | 27 (2.0%) |
| $100,000+ | 74 (5.4%) | 0 (0.0%) |
| Total | 1,363 (100.0%) | 1,336 (100.0%) |
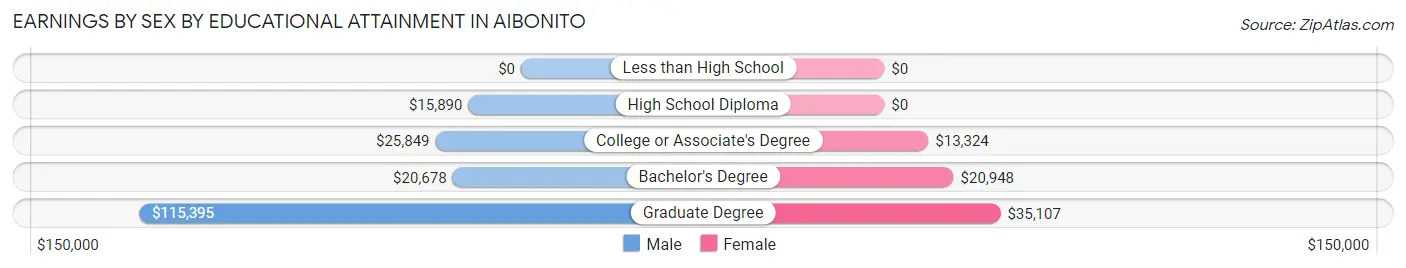
Earnings by Sex by Educational Attainment in Aibonito
Average earnings in Aibonito are $19,528 for men and $18,322 for women, a difference of 6.2%. Men with an educational attainment of graduate degree enjoy the highest average annual earnings of $115,395, while those with high school diploma education earn the least with $15,890. Women with an educational attainment of graduate degree earn the most with the average annual earnings of $35,107, while those with college or associate's degree education have the smallest earnings of $13,324.
| Educational Attainment | Male Income | Female Income |
| Less than High School | - | - |
| High School Diploma | $15,890 | $0 |
| College or Associate's Degree | $25,849 | $13,324 |
| Bachelor's Degree | $20,678 | $20,948 |
| Graduate Degree | $115,395 | $35,107 |
| Total | $19,528 | $18,322 |
Family Income in Aibonito
Family Income Brackets in Aibonito
According to the Aibonito family income data, there are 361 families falling into the less than $10,000 income range, which is the most common income bracket and makes up 20.3% of all families.
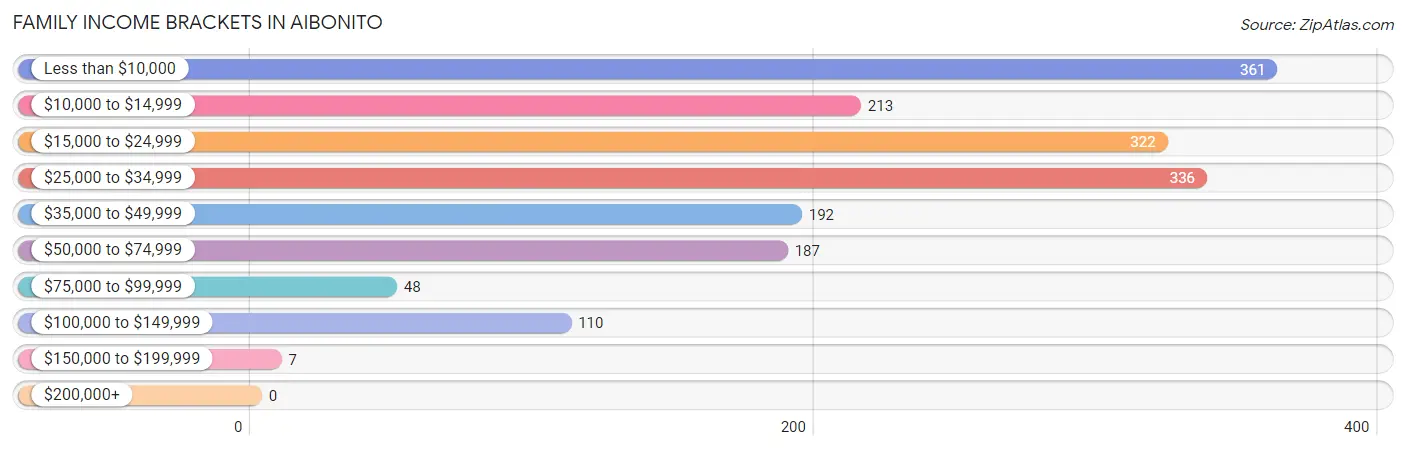
| Income Bracket | # Families | % Families |
| Less than $10,000 | 361 | 20.3% |
| $10,000 to $14,999 | 213 | 12.0% |
| $15,000 to $24,999 | 322 | 18.1% |
| $25,000 to $34,999 | 336 | 18.9% |
| $35,000 to $49,999 | 192 | 10.8% |
| $50,000 to $74,999 | 187 | 10.5% |
| $75,000 to $99,999 | 48 | 2.7% |
| $100,000 to $149,999 | 110 | 6.2% |
| $150,000 to $199,999 | 7 | 0.4% |
| $200,000+ | 0 | 0.0% |
Family Income by Famaliy Size in Aibonito
5-person families (101 | 5.7%) account for the highest median family income in Aibonito with $59,702 per family, while 5-person families (101 | 5.7%) have the highest median income of $11,940 per family member.
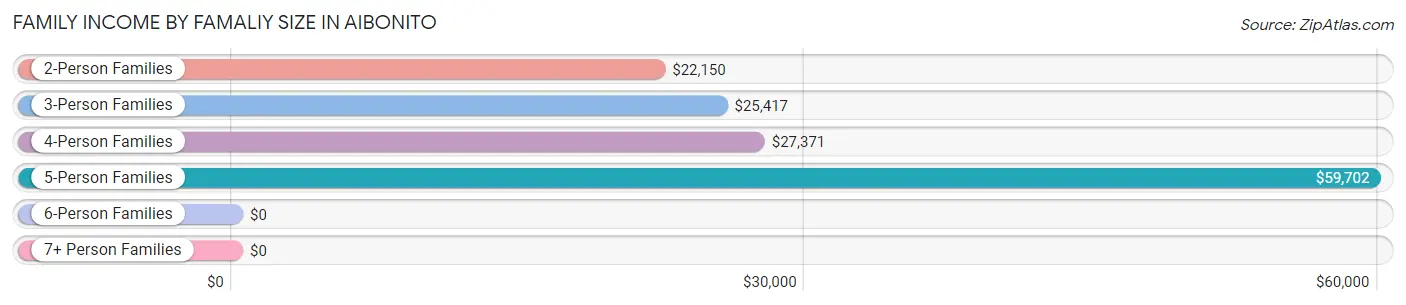
| Income Bracket | # Families | Median Income |
| 2-Person Families | 954 (53.6%) | $22,150 |
| 3-Person Families | 454 (25.5%) | $25,417 |
| 4-Person Families | 261 (14.7%) | $27,371 |
| 5-Person Families | 101 (5.7%) | $59,702 |
| 6-Person Families | 9 (0.5%) | $0 |
| 7+ Person Families | 0 (0.0%) | $0 |
| Total | 1,779 (100.0%) | $24,740 |
Family Income by Number of Earners in Aibonito
The median family income in Aibonito is $24,740, with families comprising 3+ earners (118) having the highest median family income of $77,222, while families with no earners (783) have the lowest median family income of $17,036, accounting for 6.6% and 44.0% of families, respectively.
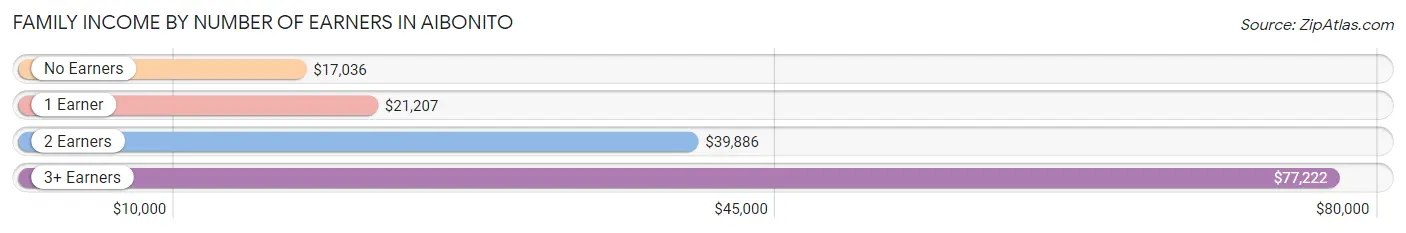
| Number of Earners | # Families | Median Income |
| No Earners | 783 (44.0%) | $17,036 |
| 1 Earner | 686 (38.6%) | $21,207 |
| 2 Earners | 192 (10.8%) | $39,886 |
| 3+ Earners | 118 (6.6%) | $77,222 |
| Total | 1,779 (100.0%) | $24,740 |
Household Income in Aibonito
Household Income Brackets in Aibonito
With 890 households falling in the category, the less than $10,000 income range is the most frequent in Aibonito, accounting for 27.3% of all households. In contrast, only 7 households (0.2%) fall into the $150,000 to $199,999 income bracket, making it the least populous group.
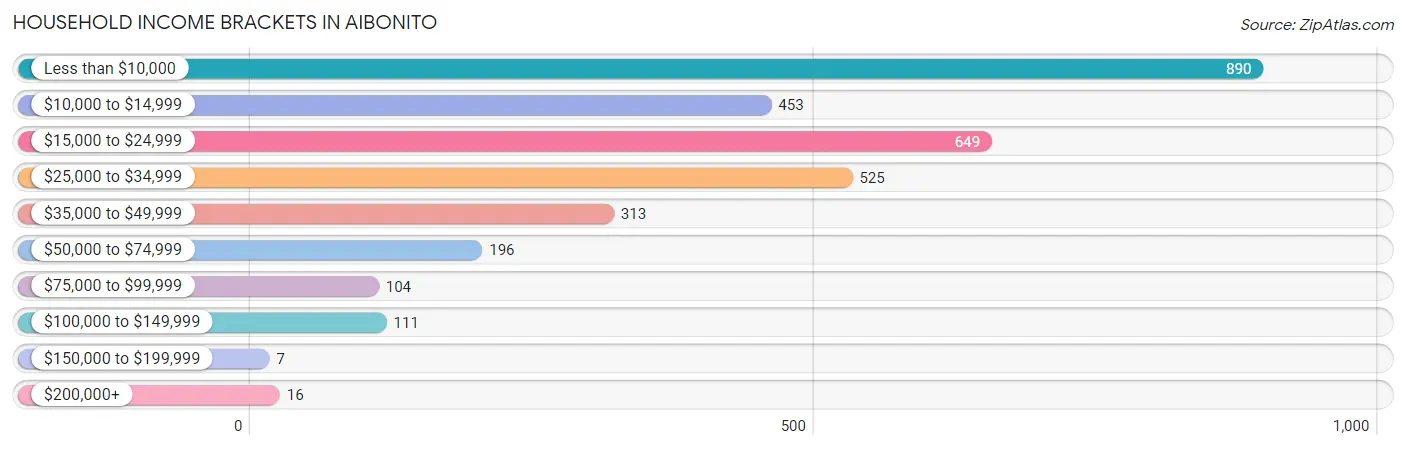
| Income Bracket | # Households | % Households |
| Less than $10,000 | 890 | 27.3% |
| $10,000 to $14,999 | 453 | 13.9% |
| $15,000 to $24,999 | 649 | 19.9% |
| $25,000 to $34,999 | 525 | 16.1% |
| $35,000 to $49,999 | 313 | 9.6% |
| $50,000 to $74,999 | 196 | 6.0% |
| $75,000 to $99,999 | 104 | 3.2% |
| $100,000 to $149,999 | 111 | 3.4% |
| $150,000 to $199,999 | 7 | 0.2% |
| $200,000+ | 16 | 0.5% |
Household Income by Householder Age in Aibonito
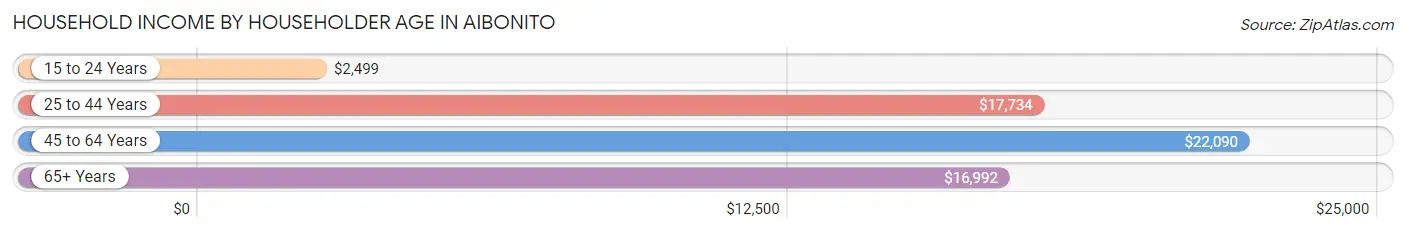
The median household income in Aibonito is $18,359, with the highest median household income of $22,090 found in the 45 to 64 years age bracket for the primary householder. A total of 1,218 households (37.4%) fall into this category. Meanwhile, the 15 to 24 years age bracket for the primary householder has the lowest median household income of $2,499, with 51 households (1.6%) in this group.
| Income Bracket | # Households | Median Income |
| 15 to 24 Years | 51 (1.6%) | $2,499 |
| 25 to 44 Years | 675 (20.7%) | $17,734 |
| 45 to 64 Years | 1,218 (37.4%) | $22,090 |
| 65+ Years | 1,316 (40.4%) | $16,992 |
| Total | 3,260 (100.0%) | $18,359 |
Poverty in Aibonito
Income Below Poverty by Sex and Age in Aibonito
With 45.4% poverty level for males and 49.6% for females among the residents of Aibonito, 5 year old males and 25 to 34 year old females are the most vulnerable to poverty, with 26 males (100.0%) and 516 females (78.2%) in their respective age groups living below the poverty level.
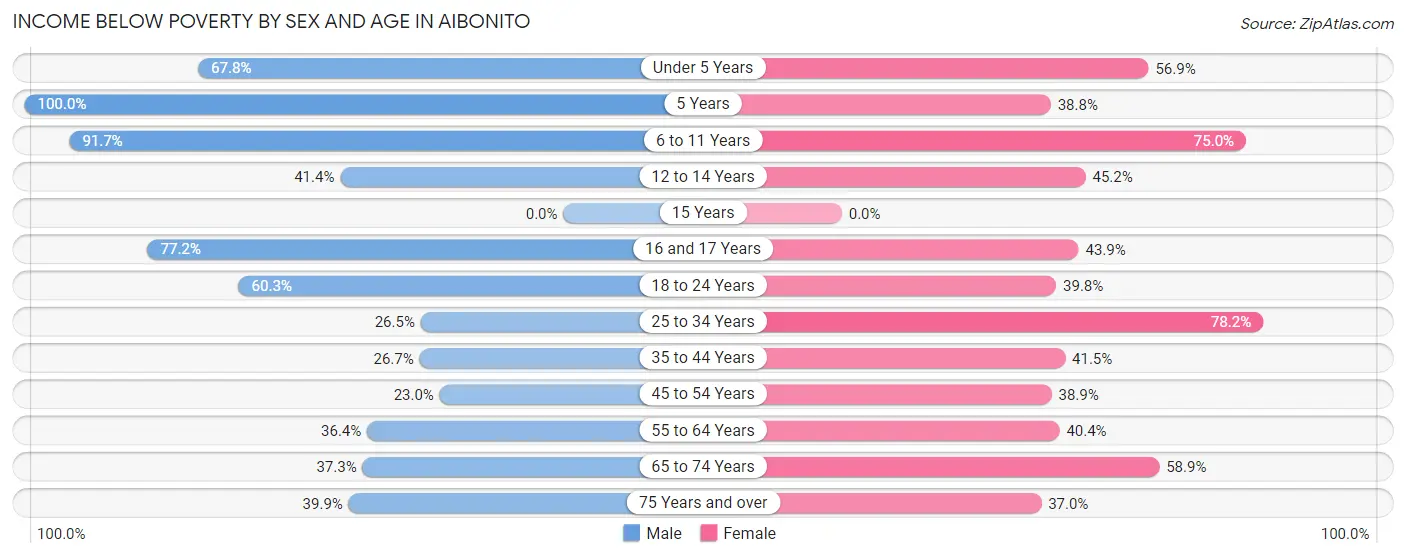
| Age Bracket | Male | Female |
| Under 5 Years | 122 (67.8%) | 78 (56.9%) |
| 5 Years | 26 (100.0%) | 38 (38.8%) |
| 6 to 11 Years | 396 (91.7%) | 96 (75.0%) |
| 12 to 14 Years | 41 (41.4%) | 114 (45.2%) |
| 15 Years | 0 (0.0%) | 0 (0.0%) |
| 16 and 17 Years | 125 (77.2%) | 29 (43.9%) |
| 18 to 24 Years | 282 (60.3%) | 148 (39.8%) |
| 25 to 34 Years | 153 (26.5%) | 516 (78.2%) |
| 35 to 44 Years | 91 (26.7%) | 172 (41.4%) |
| 45 to 54 Years | 98 (23.0%) | 204 (38.9%) |
| 55 to 64 Years | 177 (36.4%) | 305 (40.4%) |
| 65 to 74 Years | 173 (37.3%) | 370 (58.9%) |
| 75 Years and over | 155 (39.9%) | 181 (37.0%) |
| Total | 1,839 (45.4%) | 2,251 (49.6%) |
Income Above Poverty by Sex and Age in Aibonito
According to the poverty statistics in Aibonito, males aged 45 to 54 years and females aged 15 years are the age groups that are most secure financially, with 77.0% of males and 100.0% of females in these age groups living above the poverty line.
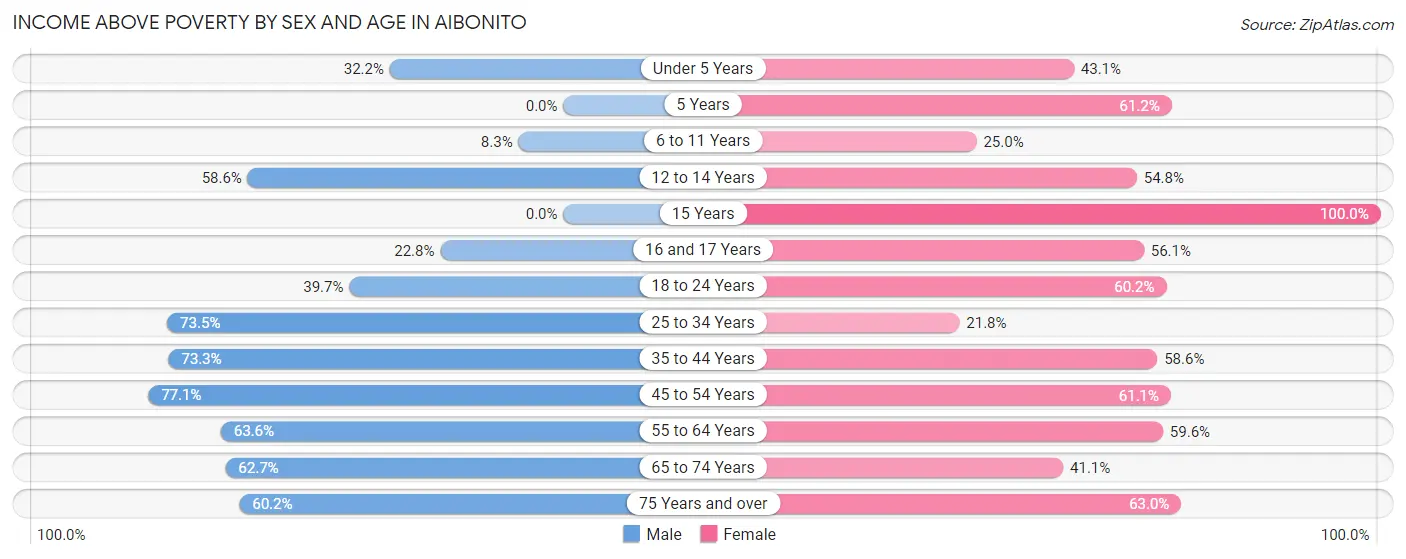
| Age Bracket | Male | Female |
| Under 5 Years | 58 (32.2%) | 59 (43.1%) |
| 5 Years | 0 (0.0%) | 60 (61.2%) |
| 6 to 11 Years | 36 (8.3%) | 32 (25.0%) |
| 12 to 14 Years | 58 (58.6%) | 138 (54.8%) |
| 15 Years | 0 (0.0%) | 18 (100.0%) |
| 16 and 17 Years | 37 (22.8%) | 37 (56.1%) |
| 18 to 24 Years | 186 (39.7%) | 224 (60.2%) |
| 25 to 34 Years | 425 (73.5%) | 144 (21.8%) |
| 35 to 44 Years | 250 (73.3%) | 243 (58.6%) |
| 45 to 54 Years | 329 (77.0%) | 320 (61.1%) |
| 55 to 64 Years | 309 (63.6%) | 450 (59.6%) |
| 65 to 74 Years | 291 (62.7%) | 258 (41.1%) |
| 75 Years and over | 234 (60.2%) | 308 (63.0%) |
| Total | 2,213 (54.6%) | 2,291 (50.4%) |
Income Below Poverty Among Married-Couple Families in Aibonito
The poverty statistics for married-couple families in Aibonito show that 23.7% or 140 of the total 590 families live below the poverty line. Families with no children have the highest poverty rate of 23.8%, comprising of 97 families. On the other hand, families with 1 or 2 children have the lowest poverty rate of 23.6%, which includes 43 families.
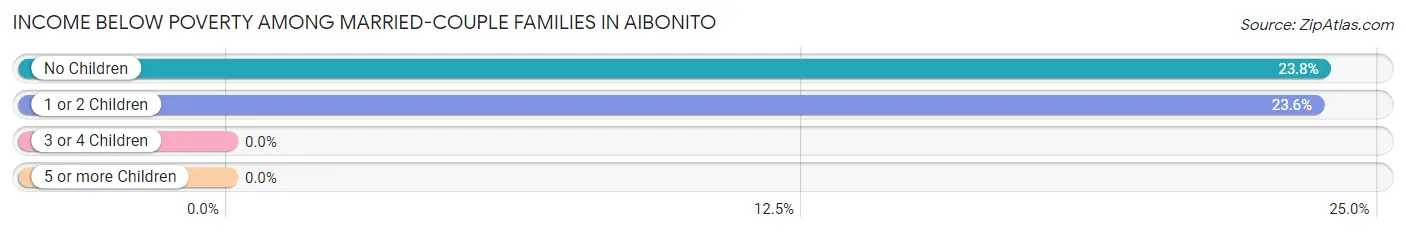
| Children | Above Poverty | Below Poverty |
| No Children | 311 (76.2%) | 97 (23.8%) |
| 1 or 2 Children | 139 (76.4%) | 43 (23.6%) |
| 3 or 4 Children | 0 (0.0%) | 0 (0.0%) |
| 5 or more Children | 0 (0.0%) | 0 (0.0%) |
| Total | 450 (76.3%) | 140 (23.7%) |
Income Below Poverty Among Single-Parent Households in Aibonito
According to the poverty data in Aibonito, 61.7% or 103 single-father households and 54.9% or 561 single-mother households are living below the poverty line. Among single-father households, those with 1 or 2 children have the highest poverty rate, with 68 households (100.0%) experiencing poverty. Likewise, among single-mother households, those with 3 or 4 children have the highest poverty rate, with 91 households (84.3%) falling below the poverty line.
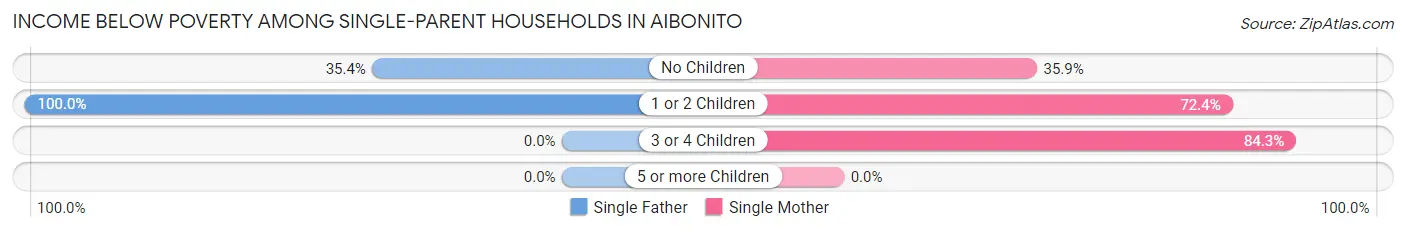
| Children | Single Father | Single Mother |
| No Children | 35 (35.3%) | 189 (35.9%) |
| 1 or 2 Children | 68 (100.0%) | 281 (72.4%) |
| 3 or 4 Children | 0 (0.0%) | 91 (84.3%) |
| 5 or more Children | 0 (0.0%) | 0 (0.0%) |
| Total | 103 (61.7%) | 561 (54.9%) |
Income Below Poverty Among Married-Couple vs Single-Parent Households in Aibonito
The poverty data for Aibonito shows that 140 of the married-couple family households (23.7%) and 664 of the single-parent households (55.8%) are living below the poverty level. Within the married-couple family households, those with no children have the highest poverty rate, with 97 households (23.8%) falling below the poverty line. Among the single-parent households, those with 3 or 4 children have the highest poverty rate, with 91 household (84.3%) living below poverty.
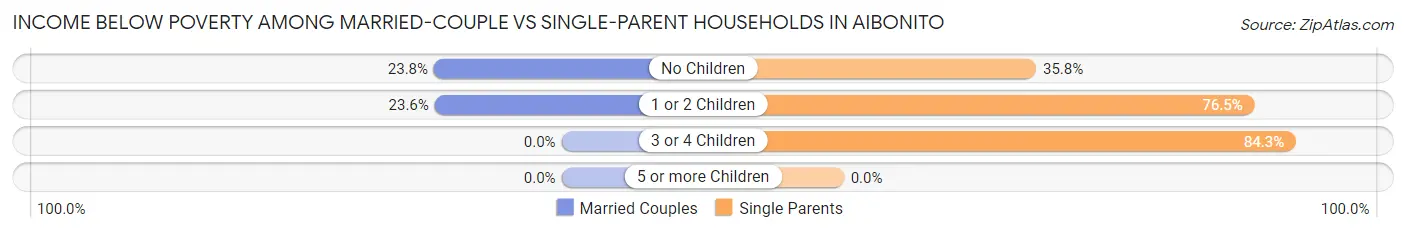
| Children | Married-Couple Families | Single-Parent Households |
| No Children | 97 (23.8%) | 224 (35.8%) |
| 1 or 2 Children | 43 (23.6%) | 349 (76.5%) |
| 3 or 4 Children | 0 (0.0%) | 91 (84.3%) |
| 5 or more Children | 0 (0.0%) | 0 (0.0%) |
| Total | 140 (23.7%) | 664 (55.8%) |
Race in Aibonito
The most populous races in Aibonito are Hispanic or Latino (8,590 | 99.9%), Two or more Races (4,104 | 47.7%), and White / Caucasian (3,044 | 35.4%).
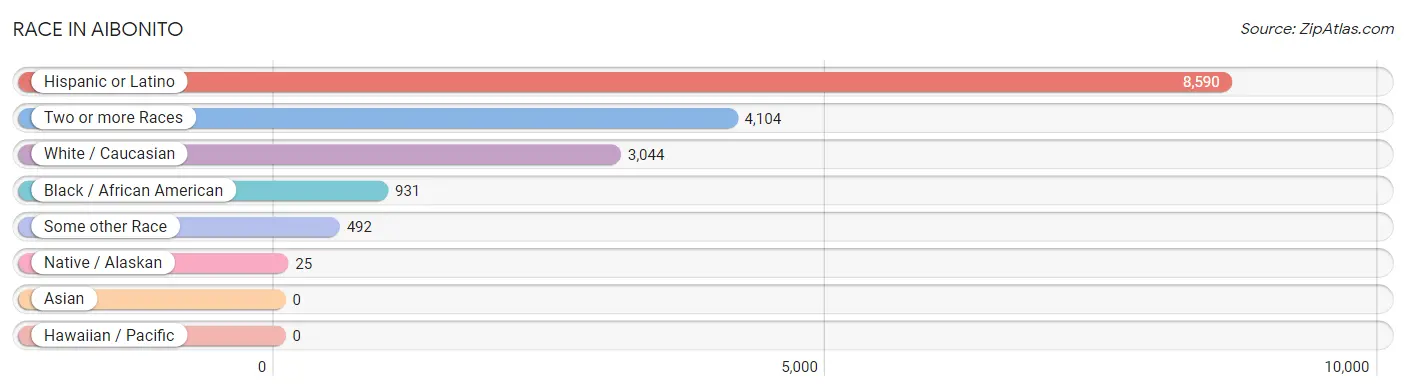
| Race | # Population | % Population |
| Asian | 0 | 0.0% |
| Black / African American | 931 | 10.8% |
| Hawaiian / Pacific | 0 | 0.0% |
| Hispanic or Latino | 8,590 | 99.9% |
| Native / Alaskan | 25 | 0.3% |
| White / Caucasian | 3,044 | 35.4% |
| Two or more Races | 4,104 | 47.7% |
| Some other Race | 492 | 5.7% |
| Total | 8,596 | 100.0% |
Ancestry in Aibonito
The most populous ancestries reported in Aibonito are Puerto Rican (8,560 | 99.6%), American (74 | 0.9%), Central American Indian (63 | 0.7%), African (31 | 0.4%), and Subsaharan African (31 | 0.4%), together accounting for 101.9% of all Aibonito residents.
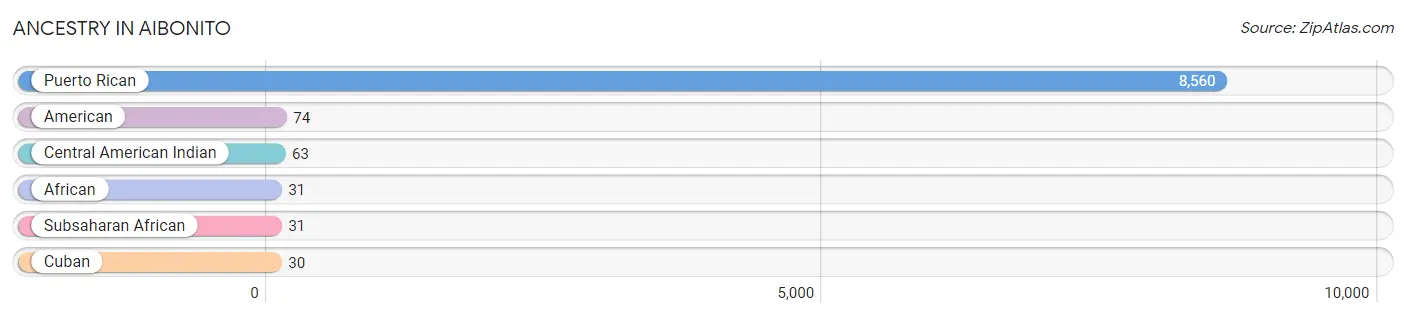
| Ancestry | # Population | % Population |
| African | 31 | 0.4% |
| American | 74 | 0.9% |
| Central American Indian | 63 | 0.7% |
| Cuban | 30 | 0.4% |
| Puerto Rican | 8,560 | 99.6% |
| Subsaharan African | 31 | 0.4% | View All 6 Rows |
Immigrants in Aibonito

| Immigration Origin | # Population | % Population | View All 0 Rows |
Sex and Age in Aibonito
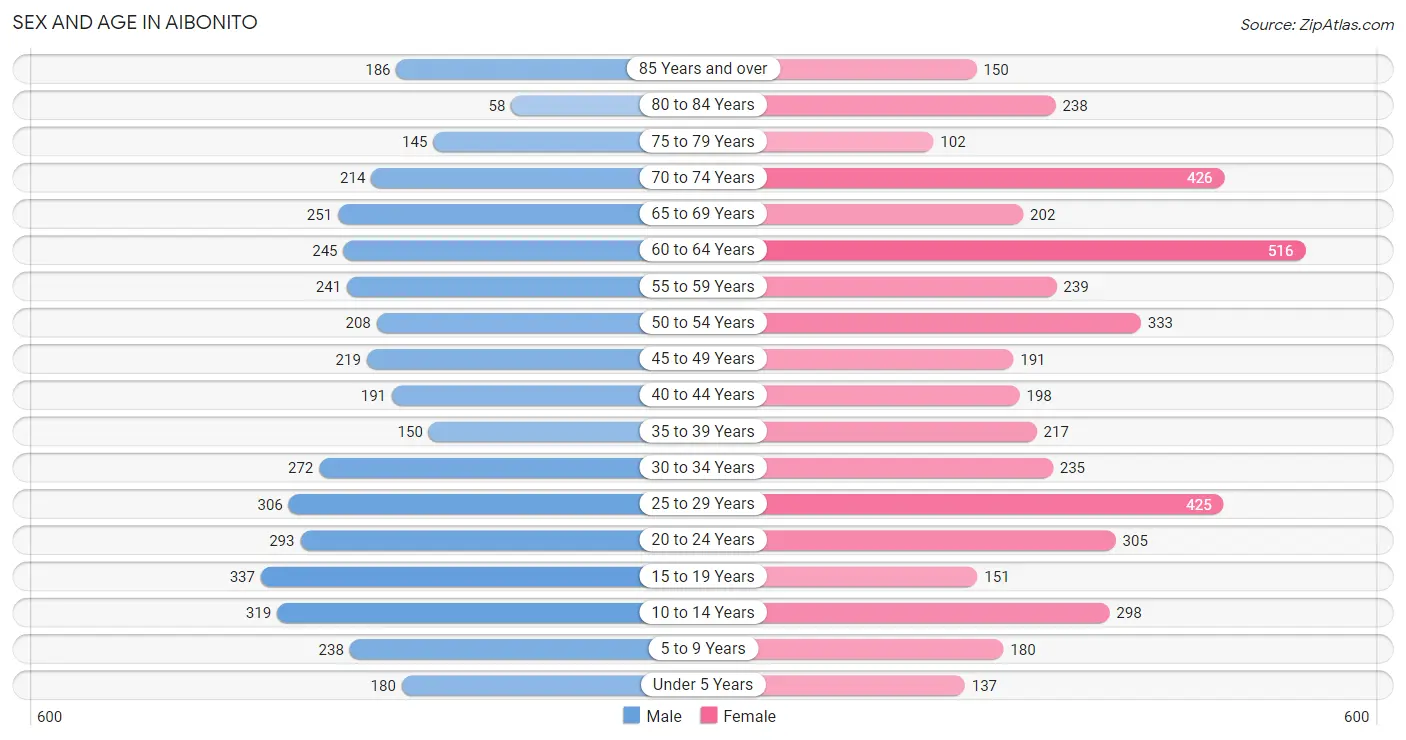
Sex and Age in Aibonito
The most populous age groups in Aibonito are 15 to 19 Years (337 | 8.3%) for men and 60 to 64 Years (516 | 11.4%) for women.
| Age Bracket | Male | Female |
| Under 5 Years | 180 (4.4%) | 137 (3.0%) |
| 5 to 9 Years | 238 (5.9%) | 180 (4.0%) |
| 10 to 14 Years | 319 (7.9%) | 298 (6.6%) |
| 15 to 19 Years | 337 (8.3%) | 151 (3.3%) |
| 20 to 24 Years | 293 (7.2%) | 305 (6.7%) |
| 25 to 29 Years | 306 (7.5%) | 425 (9.4%) |
| 30 to 34 Years | 272 (6.7%) | 235 (5.2%) |
| 35 to 39 Years | 150 (3.7%) | 217 (4.8%) |
| 40 to 44 Years | 191 (4.7%) | 198 (4.4%) |
| 45 to 49 Years | 219 (5.4%) | 191 (4.2%) |
| 50 to 54 Years | 208 (5.1%) | 333 (7.3%) |
| 55 to 59 Years | 241 (5.9%) | 239 (5.3%) |
| 60 to 64 Years | 245 (6.0%) | 516 (11.4%) |
| 65 to 69 Years | 251 (6.2%) | 202 (4.4%) |
| 70 to 74 Years | 214 (5.3%) | 426 (9.4%) |
| 75 to 79 Years | 145 (3.6%) | 102 (2.2%) |
| 80 to 84 Years | 58 (1.4%) | 238 (5.2%) |
| 85 Years and over | 186 (4.6%) | 150 (3.3%) |
| Total | 4,053 (100.0%) | 4,543 (100.0%) |
Families and Households in Aibonito
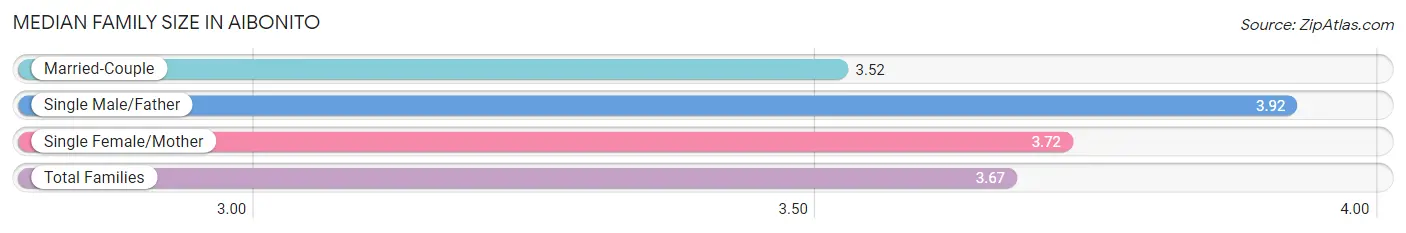
Median Family Size in Aibonito
The median family size in Aibonito is 3.67 persons per family, with single male/father families (167 | 9.4%) accounting for the largest median family size of 3.92 persons per family. On the other hand, married-couple families (590 | 33.2%) represent the smallest median family size with 3.52 persons per family.
| Family Type | # Families | Family Size |
| Married-Couple | 590 (33.2%) | 3.52 |
| Single Male/Father | 167 (9.4%) | 3.92 |
| Single Female/Mother | 1,022 (57.5%) | 3.72 |
| Total Families | 1,779 (100.0%) | 3.67 |
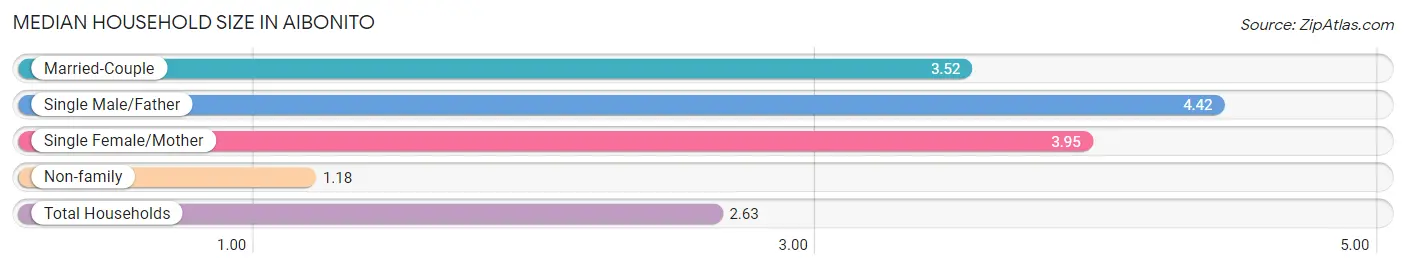
Median Household Size in Aibonito
The median household size in Aibonito is 2.63 persons per household, with single male/father households (167 | 5.1%) accounting for the largest median household size of 4.42 persons per household. non-family households (1,481 | 45.4%) represent the smallest median household size with 1.18 persons per household.
| Household Type | # Households | Household Size |
| Married-Couple | 590 (18.1%) | 3.52 |
| Single Male/Father | 167 (5.1%) | 4.42 |
| Single Female/Mother | 1,022 (31.4%) | 3.95 |
| Non-family | 1,481 (45.4%) | 1.18 |
| Total Households | 3,260 (100.0%) | 2.63 |
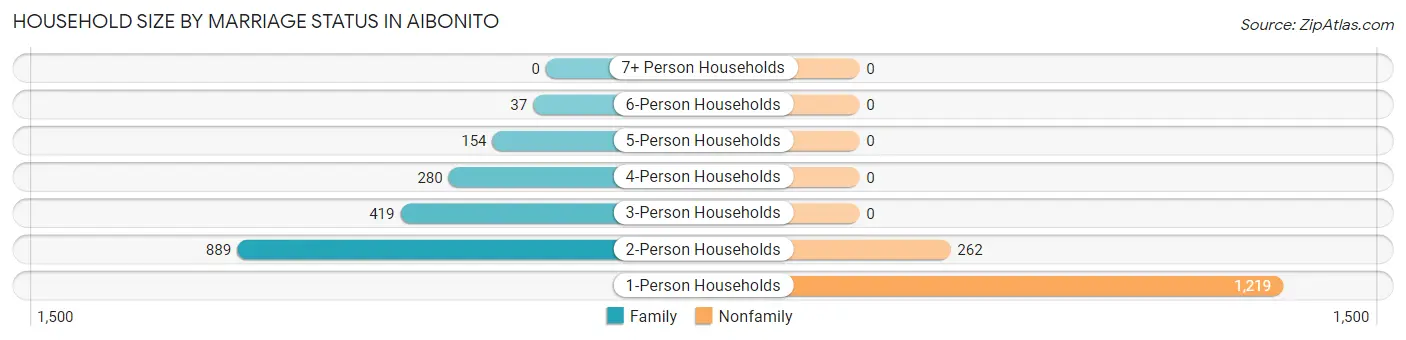
Household Size by Marriage Status in Aibonito
Out of a total of 3,260 households in Aibonito, 1,779 (54.6%) are family households, while 1,481 (45.4%) are nonfamily households. The most numerous type of family households are 2-person households, comprising 889, and the most common type of nonfamily households are 1-person households, comprising 1,219.
| Household Size | Family Households | Nonfamily Households |
| 1-Person Households | - | 1,219 (37.4%) |
| 2-Person Households | 889 (27.3%) | 262 (8.0%) |
| 3-Person Households | 419 (12.9%) | 0 (0.0%) |
| 4-Person Households | 280 (8.6%) | 0 (0.0%) |
| 5-Person Households | 154 (4.7%) | 0 (0.0%) |
| 6-Person Households | 37 (1.1%) | 0 (0.0%) |
| 7+ Person Households | 0 (0.0%) | 0 (0.0%) |
| Total | 1,779 (54.6%) | 1,481 (45.4%) |
Female Fertility in Aibonito
Fertility by Age in Aibonito
Average fertility rate in Aibonito is 54.0 births per 1,000 women. Women in the age bracket of 20 to 34 years have the highest fertility rate with 99.0 births per 1,000 women. Women in the age bracket of 20 to 34 years acount for 100.0% of all women with births.
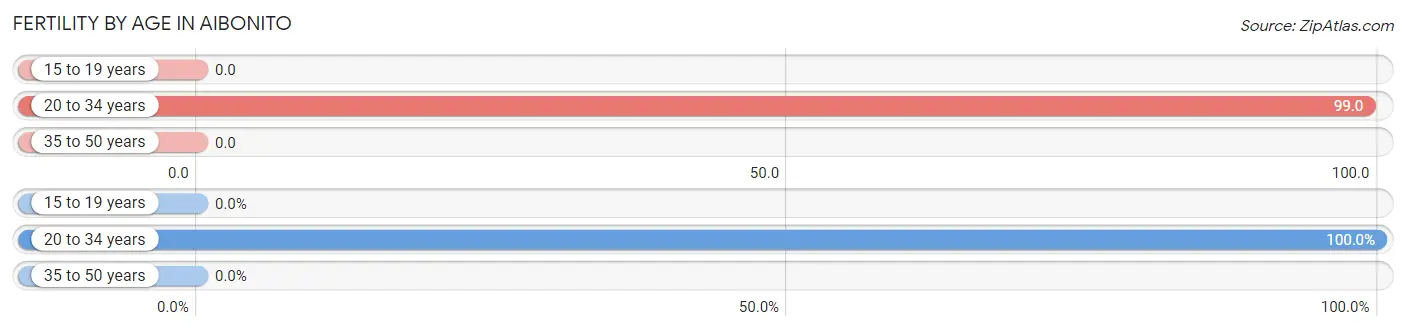
| Age Bracket | Women with Births | Births / 1,000 Women |
| 15 to 19 years | 0 (0.0%) | 0.0 |
| 20 to 34 years | 96 (100.0%) | 99.0 |
| 35 to 50 years | 0 (0.0%) | 0.0 |
| Total | 96 (100.0%) | 54.0 |
Fertility by Age by Marriage Status in Aibonito
51.0% of women with births (96) in Aibonito are married. The highest percentage of unmarried women with births falls into 20 to 34 years age bracket with 49.0% of them unmarried at the time of birth, while the lowest percentage of unmarried women with births belong to 20 to 34 years age bracket with 49.0% of them unmarried.
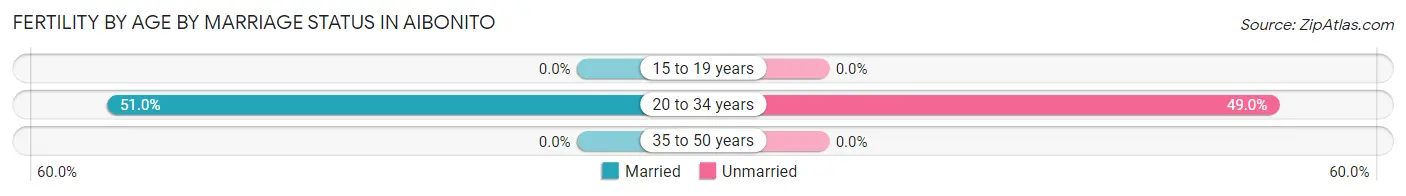
| Age Bracket | Married | Unmarried |
| 15 to 19 years | 0 (0.0%) | 0 (0.0%) |
| 20 to 34 years | 49 (51.0%) | 47 (49.0%) |
| 35 to 50 years | 0 (0.0%) | 0 (0.0%) |
| Total | 49 (51.0%) | 47 (49.0%) |
Fertility by Education in Aibonito
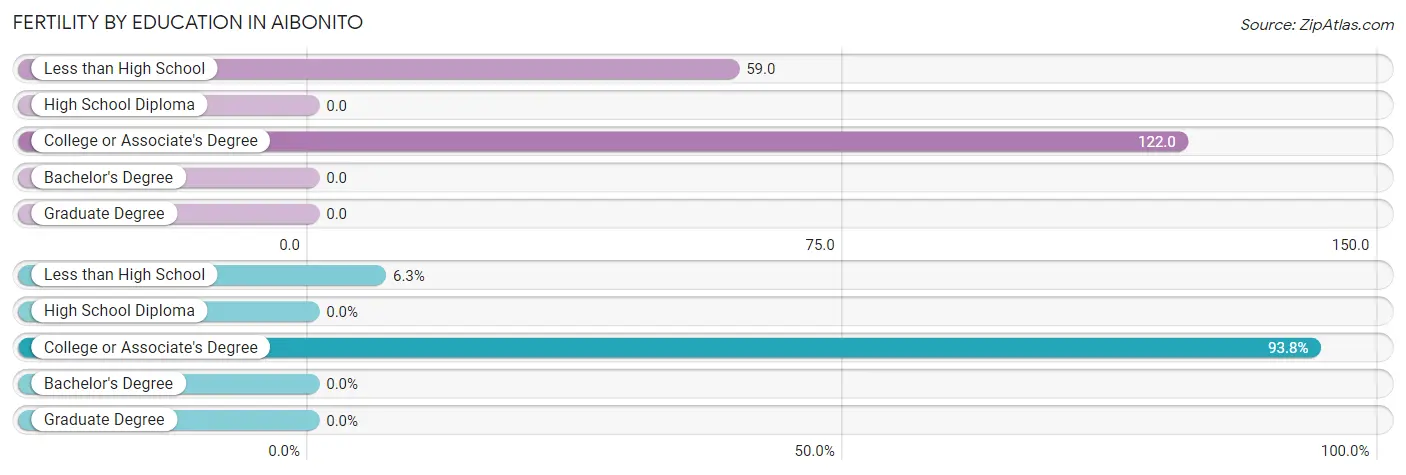
| Educational Attainment | Women with Births | Births / 1,000 Women |
| Less than High School | 6 (6.2%) | 59.0 |
| High School Diploma | 0 (0.0%) | 0.0 |
| College or Associate's Degree | 90 (93.8%) | 122.0 |
| Bachelor's Degree | 0 (0.0%) | 0.0 |
| Graduate Degree | 0 (0.0%) | 0.0 |
| Total | 96 (100.0%) | 54.0 |
Fertility by Education by Marriage Status in Aibonito
49.0% of women with births in Aibonito are unmarried. Women with the educational attainment of college or associate's degree are most likely to be married with 54.4% of them married at childbirth, while women with the educational attainment of less than high school are least likely to be married with 100.0% of them unmarried at childbirth.
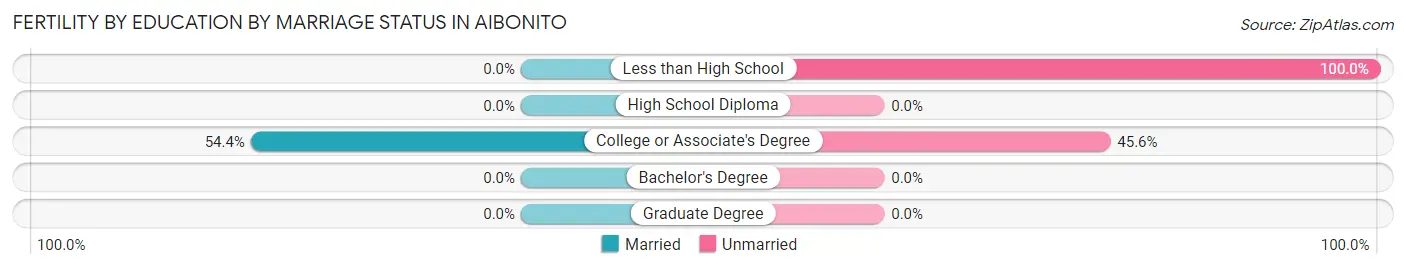
| Educational Attainment | Married | Unmarried |
| Less than High School | 0 (0.0%) | 6 (100.0%) |
| High School Diploma | 0 (0.0%) | 0 (0.0%) |
| College or Associate's Degree | 49 (54.4%) | 41 (45.6%) |
| Bachelor's Degree | 0 (0.0%) | 0 (0.0%) |
| Graduate Degree | 0 (0.0%) | 0 (0.0%) |
| Total | 49 (51.0%) | 47 (49.0%) |
Employment Characteristics in Aibonito
Employment by Class of Employer in Aibonito
Among the 2,321 employed individuals in Aibonito, private company employees (1,753 | 75.5%), state government employees (326 | 14.1%), and local government employees (108 | 4.6%) make up the most common classes of employment.
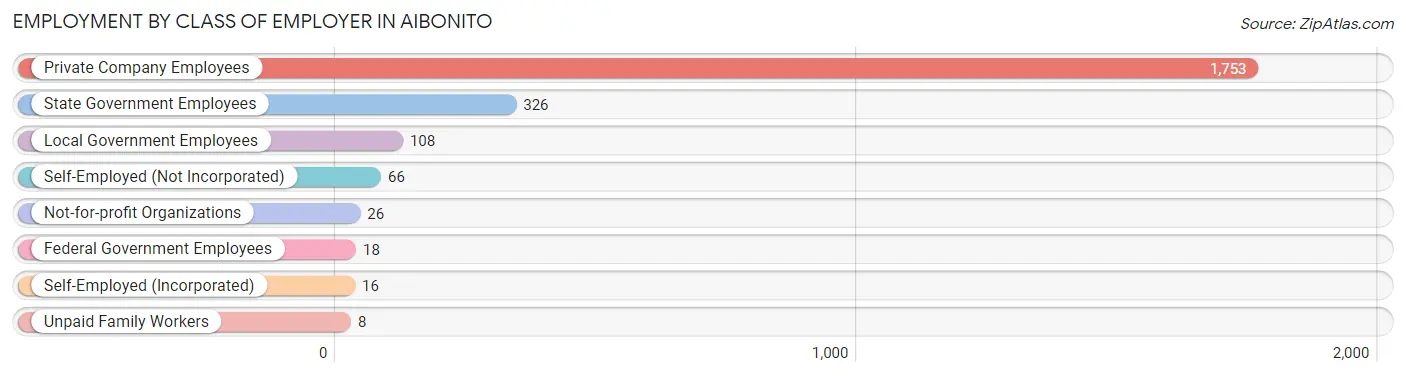
| Employer Class | # Employees | % Employees |
| Private Company Employees | 1,753 | 75.5% |
| Self-Employed (Incorporated) | 16 | 0.7% |
| Self-Employed (Not Incorporated) | 66 | 2.8% |
| Not-for-profit Organizations | 26 | 1.1% |
| Local Government Employees | 108 | 4.6% |
| State Government Employees | 326 | 14.1% |
| Federal Government Employees | 18 | 0.8% |
| Unpaid Family Workers | 8 | 0.3% |
| Total | 2,321 | 100.0% |
Employment Status by Age in Aibonito
According to the labor force statistics for Aibonito, out of the total population over 16 years of age (7,226), 37.5% or 2,710 individuals are in the labor force, with 8.2% or 222 of them unemployed. The age group with the highest labor force participation rate is 30 to 34 years, with 89.9% or 456 individuals in the labor force. Within the labor force, the 16 to 19 years age range has the highest percentage of unemployed individuals, with 100.0% or 24 of them being unemployed.
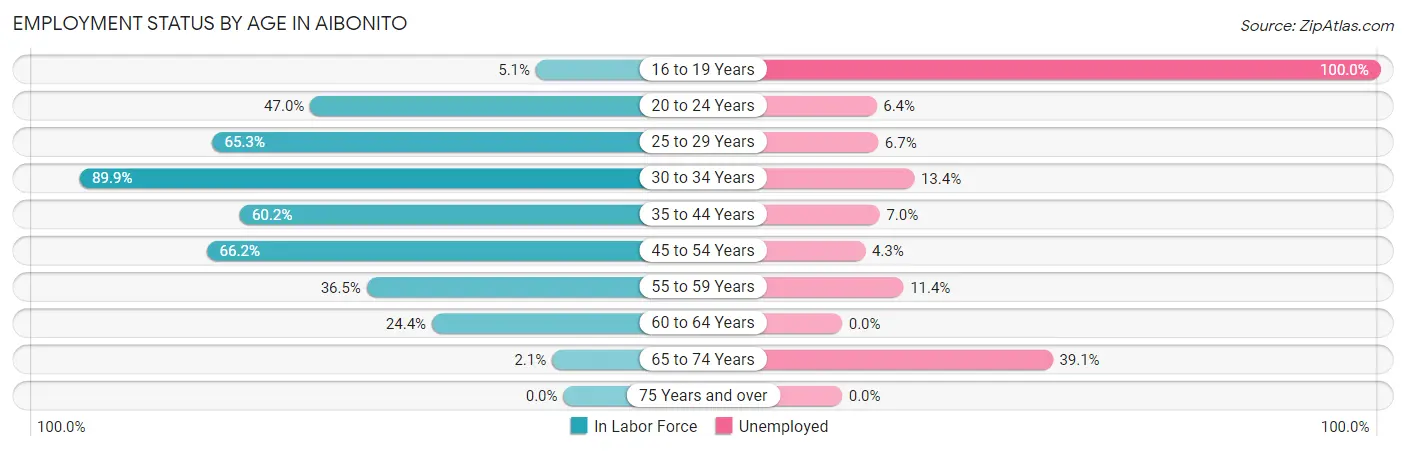
| Age Bracket | In Labor Force | Unemployed |
| 16 to 19 Years | 24 (5.1%) | 24 (100.0%) |
| 20 to 24 Years | 281 (47.0%) | 18 (6.4%) |
| 25 to 29 Years | 477 (65.3%) | 32 (6.7%) |
| 30 to 34 Years | 456 (89.9%) | 61 (13.4%) |
| 35 to 44 Years | 455 (60.2%) | 32 (7.0%) |
| 45 to 54 Years | 630 (66.2%) | 27 (4.3%) |
| 55 to 59 Years | 175 (36.5%) | 20 (11.4%) |
| 60 to 64 Years | 186 (24.4%) | 0 (0.0%) |
| 65 to 74 Years | 23 (2.1%) | 9 (39.1%) |
| 75 Years and over | 0 (0.0%) | 0 (0.0%) |
| Total | 2,710 (37.5%) | 222 (8.2%) |
Employment Status by Educational Attainment in Aibonito
According to labor force statistics for Aibonito, 56.8% of individuals (2,378) out of the total population between 25 and 64 years of age (4,186) are in the labor force, with 7.2% or 171 of them being unemployed. The group with the highest labor force participation rate are those with the educational attainment of bachelor's degree or higher, with 75.7% or 893 individuals in the labor force. Within the labor force, individuals with less than high school education have the highest percentage of unemployment, with 23.7% or 14 of them being unemployed.
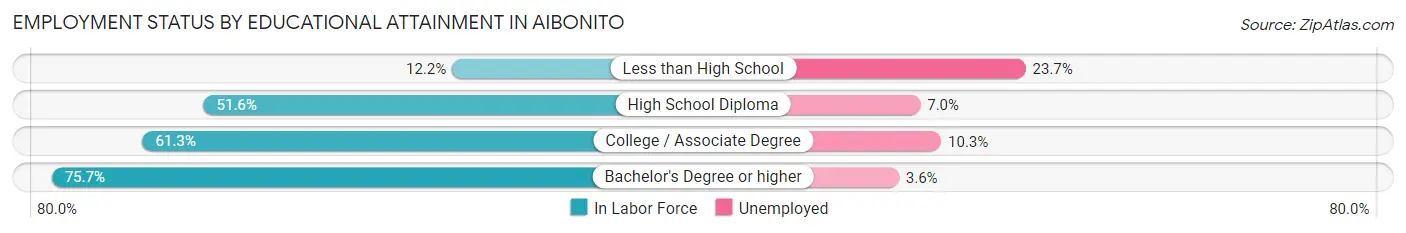
| Educational Attainment | In Labor Force | Unemployed |
| Less than High School | 59 (12.2%) | 114 (23.7%) |
| High School Diploma | 641 (51.6%) | 87 (7.0%) |
| College / Associate Degree | 786 (61.3%) | 132 (10.3%) |
| Bachelor's Degree or higher | 893 (75.7%) | 42 (3.6%) |
| Total | 2,378 (56.8%) | 301 (7.2%) |
Employment Occupations by Sex in Aibonito
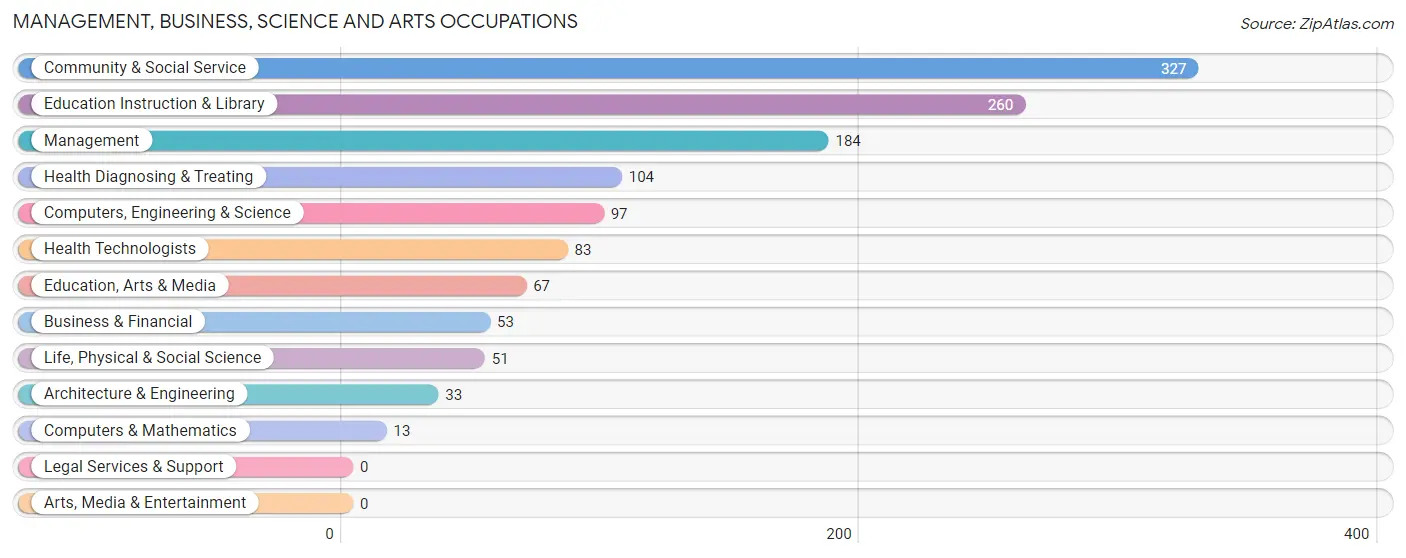
Management, Business, Science and Arts Occupations
The most common Management, Business, Science and Arts occupations in Aibonito are Community & Social Service (327 | 13.2%), Education Instruction & Library (260 | 10.5%), Management (184 | 7.4%), Health Diagnosing & Treating (104 | 4.2%), and Computers, Engineering & Science (97 | 3.9%).
Management, Business, Science and Arts Occupations by Sex
Within the Management, Business, Science and Arts occupations in Aibonito, the most male-oriented occupations are Computers & Mathematics (100.0%), Life, Physical & Social Science (70.6%), and Business & Financial (69.8%), while the most female-oriented occupations are Education, Arts & Media (73.1%), Health Diagnosing & Treating (70.2%), and Community & Social Service (64.2%).
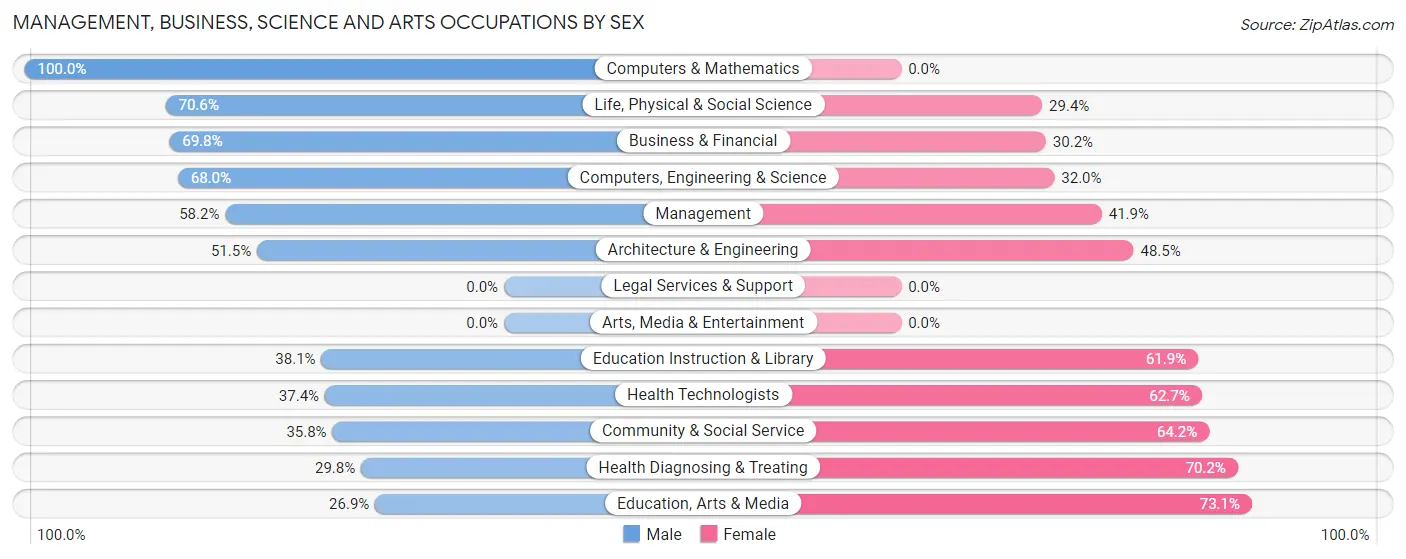
| Occupation | Male | Female |
| Management | 107 (58.2%) | 77 (41.8%) |
| Business & Financial | 37 (69.8%) | 16 (30.2%) |
| Computers, Engineering & Science | 66 (68.0%) | 31 (32.0%) |
| Computers & Mathematics | 13 (100.0%) | 0 (0.0%) |
| Architecture & Engineering | 17 (51.5%) | 16 (48.5%) |
| Life, Physical & Social Science | 36 (70.6%) | 15 (29.4%) |
| Community & Social Service | 117 (35.8%) | 210 (64.2%) |
| Education, Arts & Media | 18 (26.9%) | 49 (73.1%) |
| Legal Services & Support | 0 (0.0%) | 0 (0.0%) |
| Education Instruction & Library | 99 (38.1%) | 161 (61.9%) |
| Arts, Media & Entertainment | 0 (0.0%) | 0 (0.0%) |
| Health Diagnosing & Treating | 31 (29.8%) | 73 (70.2%) |
| Health Technologists | 31 (37.3%) | 52 (62.6%) |
| Total (Category) | 358 (46.8%) | 407 (53.2%) |
| Total (Overall) | 1,224 (49.3%) | 1,260 (50.7%) |
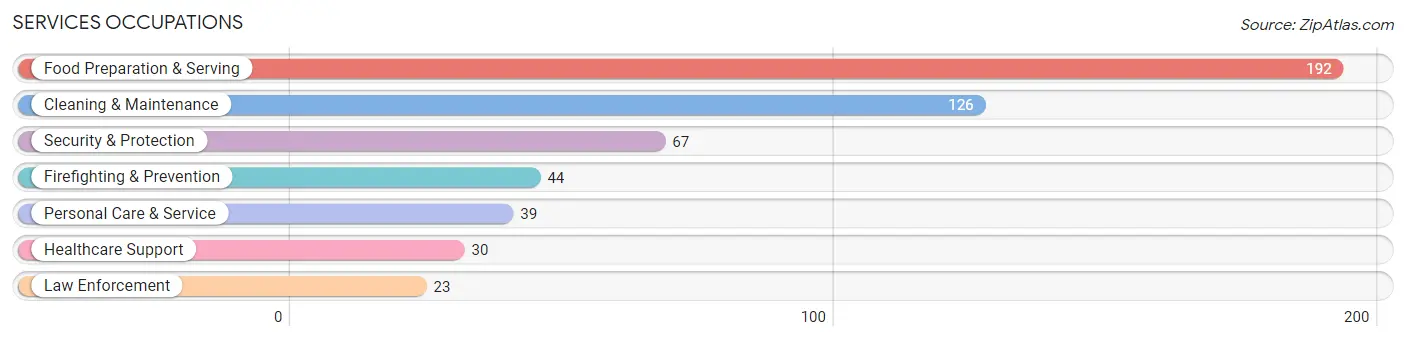
Services Occupations
The most common Services occupations in Aibonito are Food Preparation & Serving (192 | 7.7%), Cleaning & Maintenance (126 | 5.1%), Security & Protection (67 | 2.7%), Firefighting & Prevention (44 | 1.8%), and Personal Care & Service (39 | 1.6%).
Services Occupations by Sex
Within the Services occupations in Aibonito, the most male-oriented occupations are Firefighting & Prevention (100.0%), Security & Protection (89.5%), and Food Preparation & Serving (85.4%), while the most female-oriented occupations are Healthcare Support (46.7%), Personal Care & Service (38.5%), and Law Enforcement (30.4%).
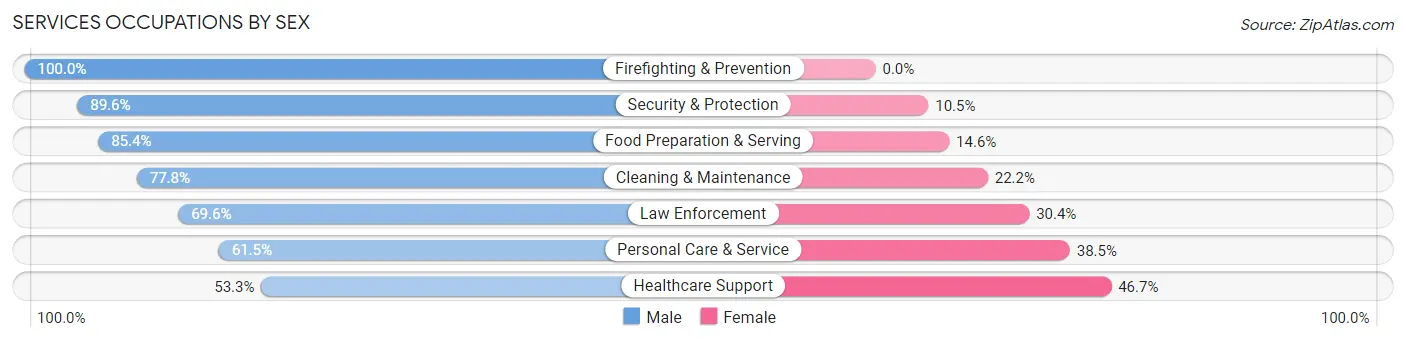
| Occupation | Male | Female |
| Healthcare Support | 16 (53.3%) | 14 (46.7%) |
| Security & Protection | 60 (89.5%) | 7 (10.4%) |
| Firefighting & Prevention | 44 (100.0%) | 0 (0.0%) |
| Law Enforcement | 16 (69.6%) | 7 (30.4%) |
| Food Preparation & Serving | 164 (85.4%) | 28 (14.6%) |
| Cleaning & Maintenance | 98 (77.8%) | 28 (22.2%) |
| Personal Care & Service | 24 (61.5%) | 15 (38.5%) |
| Total (Category) | 362 (79.7%) | 92 (20.3%) |
| Total (Overall) | 1,224 (49.3%) | 1,260 (50.7%) |
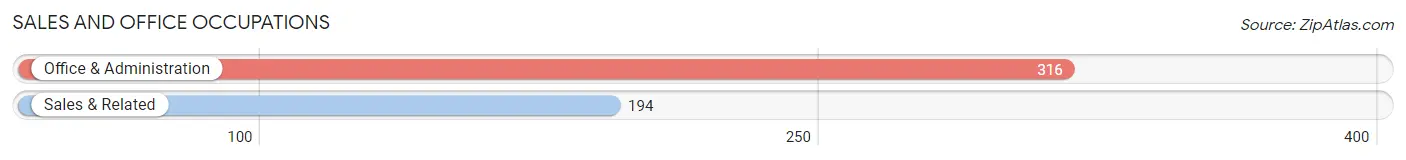
Sales and Office Occupations
The most common Sales and Office occupations in Aibonito are Office & Administration (316 | 12.7%), and Sales & Related (194 | 7.8%).
Sales and Office Occupations by Sex
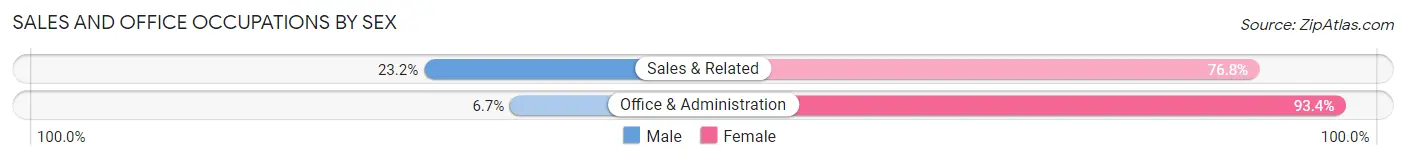
| Occupation | Male | Female |
| Sales & Related | 45 (23.2%) | 149 (76.8%) |
| Office & Administration | 21 (6.7%) | 295 (93.3%) |
| Total (Category) | 66 (12.9%) | 444 (87.1%) |
| Total (Overall) | 1,224 (49.3%) | 1,260 (50.7%) |
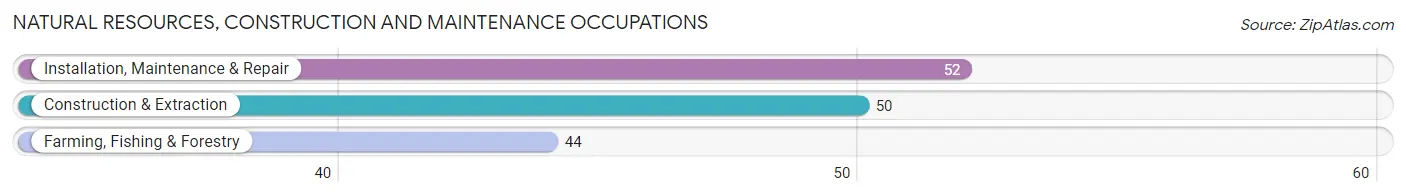
Natural Resources, Construction and Maintenance Occupations
The most common Natural Resources, Construction and Maintenance occupations in Aibonito are Installation, Maintenance & Repair (52 | 2.1%), Construction & Extraction (50 | 2.0%), and Farming, Fishing & Forestry (44 | 1.8%).
Natural Resources, Construction and Maintenance Occupations by Sex
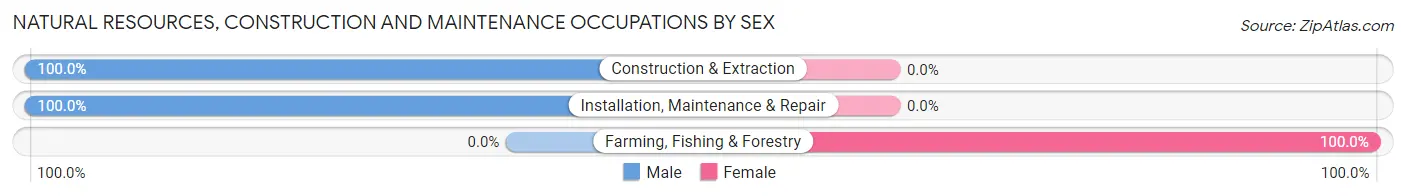
| Occupation | Male | Female |
| Farming, Fishing & Forestry | 0 (0.0%) | 44 (100.0%) |
| Construction & Extraction | 50 (100.0%) | 0 (0.0%) |
| Installation, Maintenance & Repair | 52 (100.0%) | 0 (0.0%) |
| Total (Category) | 102 (69.9%) | 44 (30.1%) |
| Total (Overall) | 1,224 (49.3%) | 1,260 (50.7%) |
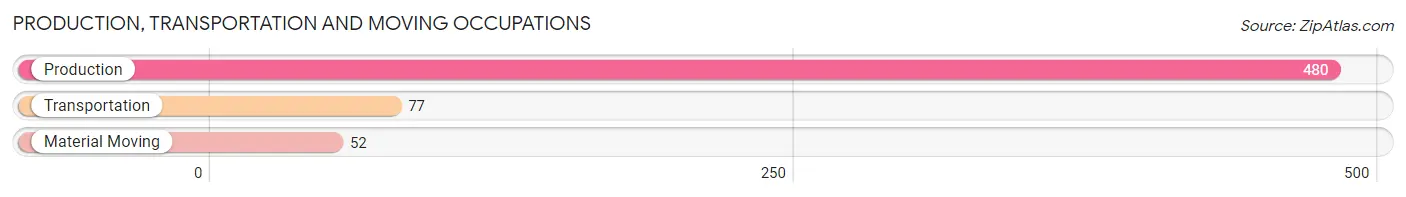
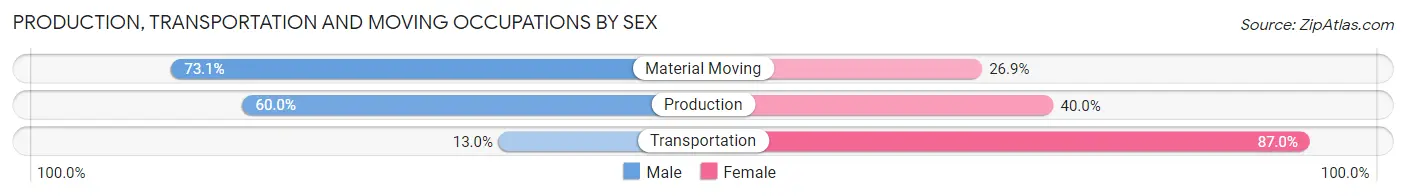
Production, Transportation and Moving Occupations
The most common Production, Transportation and Moving occupations in Aibonito are Production (480 | 19.3%), Transportation (77 | 3.1%), and Material Moving (52 | 2.1%).
Production, Transportation and Moving Occupations by Sex
| Occupation | Male | Female |
| Production | 288 (60.0%) | 192 (40.0%) |
| Transportation | 10 (13.0%) | 67 (87.0%) |
| Material Moving | 38 (73.1%) | 14 (26.9%) |
| Total (Category) | 336 (55.2%) | 273 (44.8%) |
| Total (Overall) | 1,224 (49.3%) | 1,260 (50.7%) |
Employment Industries by Sex in Aibonito
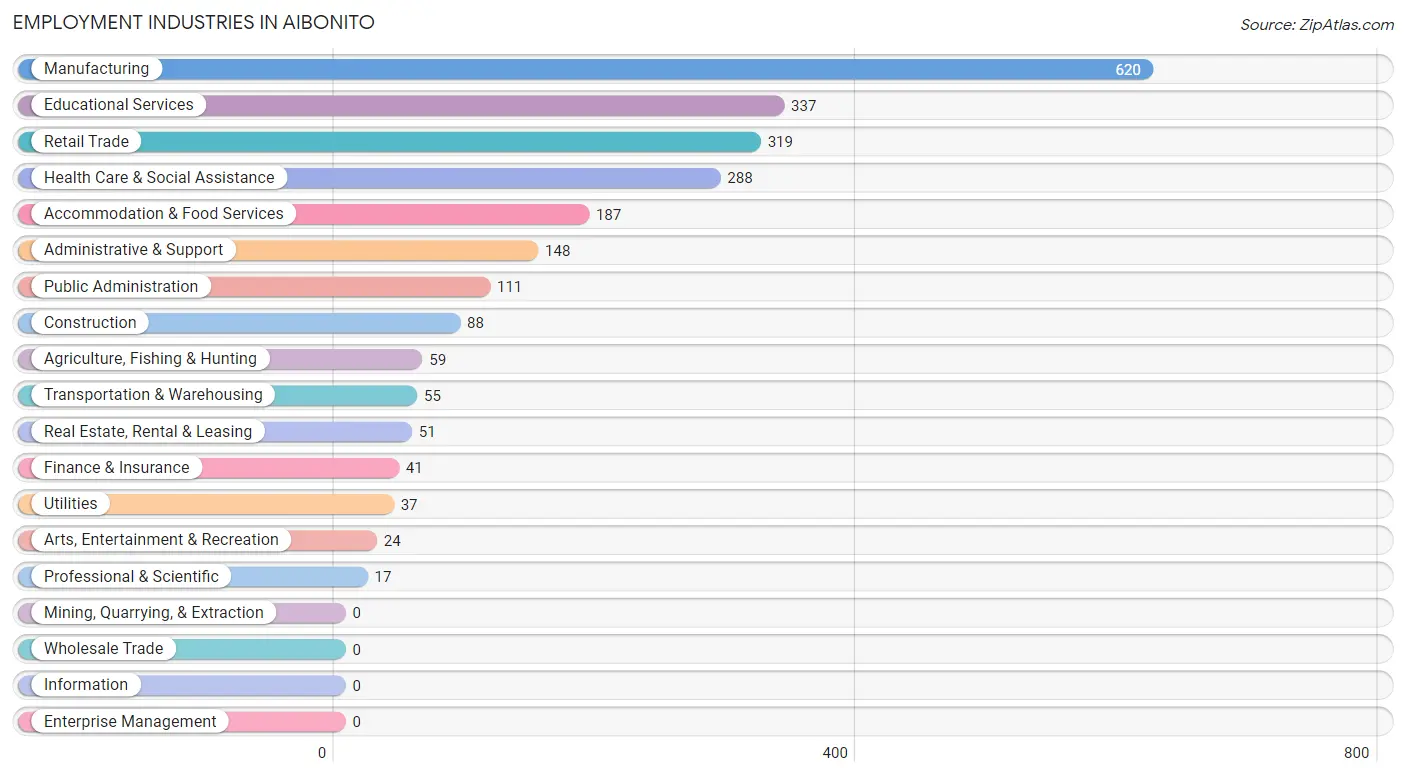
Employment Industries in Aibonito
The major employment industries in Aibonito include Manufacturing (620 | 25.0%), Educational Services (337 | 13.6%), Retail Trade (319 | 12.8%), Health Care & Social Assistance (288 | 11.6%), and Accommodation & Food Services (187 | 7.5%).
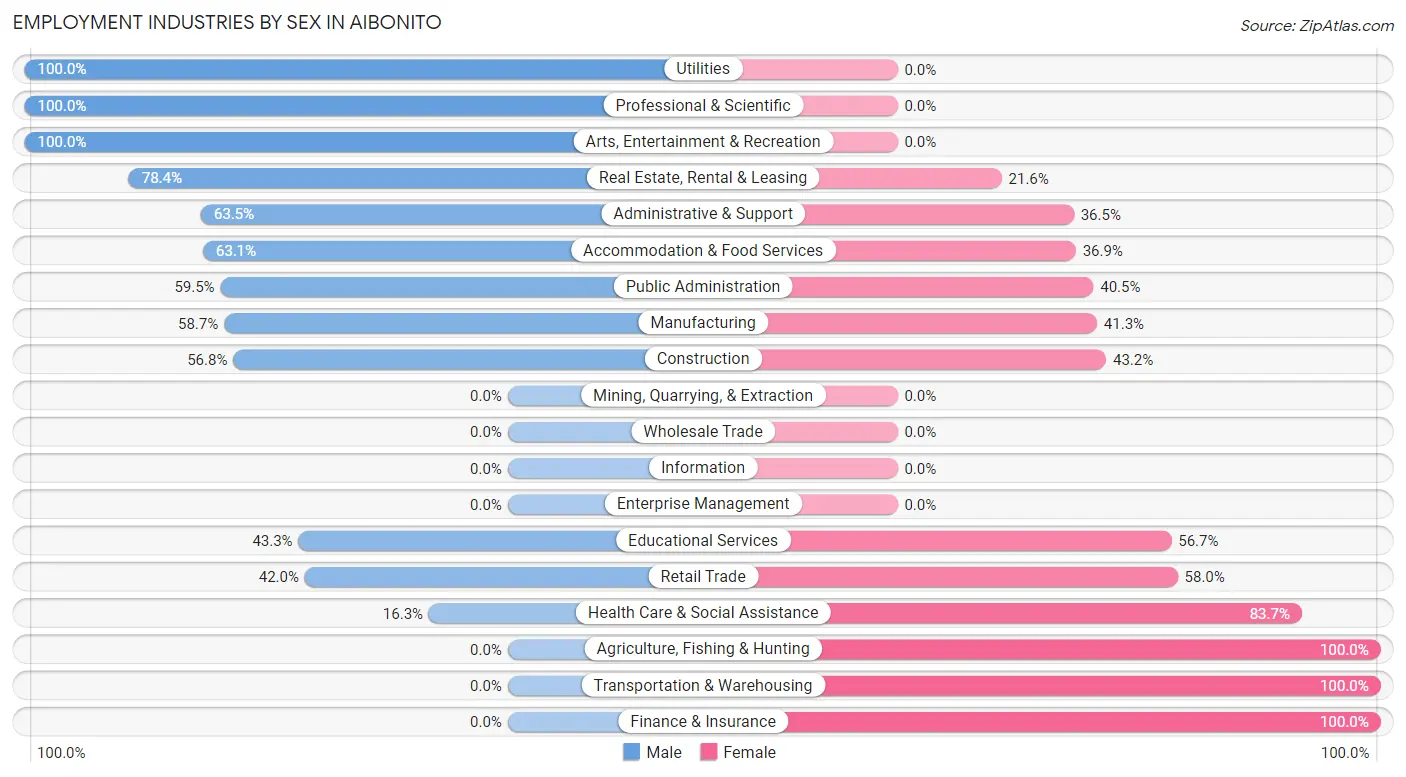
Employment Industries by Sex in Aibonito
The Aibonito industries that see more men than women are Utilities (100.0%), Professional & Scientific (100.0%), and Arts, Entertainment & Recreation (100.0%), whereas the industries that tend to have a higher number of women are Agriculture, Fishing & Hunting (100.0%), Transportation & Warehousing (100.0%), and Finance & Insurance (100.0%).
| Industry | Male | Female |
| Agriculture, Fishing & Hunting | 0 (0.0%) | 59 (100.0%) |
| Mining, Quarrying, & Extraction | 0 (0.0%) | 0 (0.0%) |
| Construction | 50 (56.8%) | 38 (43.2%) |
| Manufacturing | 364 (58.7%) | 256 (41.3%) |
| Wholesale Trade | 0 (0.0%) | 0 (0.0%) |
| Retail Trade | 134 (42.0%) | 185 (58.0%) |
| Transportation & Warehousing | 0 (0.0%) | 55 (100.0%) |
| Utilities | 37 (100.0%) | 0 (0.0%) |
| Information | 0 (0.0%) | 0 (0.0%) |
| Finance & Insurance | 0 (0.0%) | 41 (100.0%) |
| Real Estate, Rental & Leasing | 40 (78.4%) | 11 (21.6%) |
| Professional & Scientific | 17 (100.0%) | 0 (0.0%) |
| Enterprise Management | 0 (0.0%) | 0 (0.0%) |
| Administrative & Support | 94 (63.5%) | 54 (36.5%) |
| Educational Services | 146 (43.3%) | 191 (56.7%) |
| Health Care & Social Assistance | 47 (16.3%) | 241 (83.7%) |
| Arts, Entertainment & Recreation | 24 (100.0%) | 0 (0.0%) |
| Accommodation & Food Services | 118 (63.1%) | 69 (36.9%) |
| Public Administration | 66 (59.5%) | 45 (40.5%) |
| Total | 1,224 (49.3%) | 1,260 (50.7%) |
Education in Aibonito
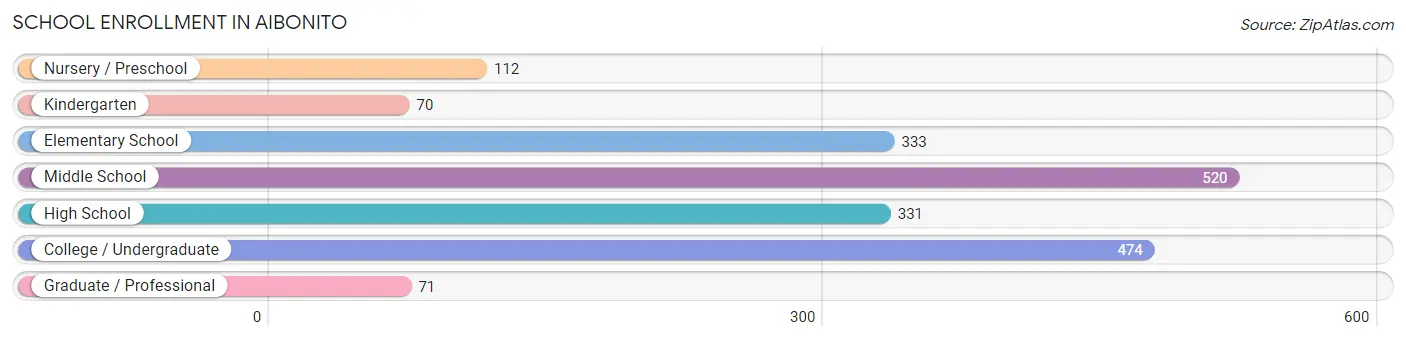
School Enrollment in Aibonito
The most common levels of schooling among the 1,911 students in Aibonito are middle school (520 | 27.2%), college / undergraduate (474 | 24.8%), and elementary school (333 | 17.4%).
| School Level | # Students | % Students |
| Nursery / Preschool | 112 | 5.9% |
| Kindergarten | 70 | 3.7% |
| Elementary School | 333 | 17.4% |
| Middle School | 520 | 27.2% |
| High School | 331 | 17.3% |
| College / Undergraduate | 474 | 24.8% |
| Graduate / Professional | 71 | 3.7% |
| Total | 1,911 | 100.0% |
School Enrollment by Age by Funding Source in Aibonito
Out of a total of 1,911 students who are enrolled in schools in Aibonito, 493 (25.8%) attend a private institution, while the remaining 1,418 (74.2%) are enrolled in public schools. The age group of 25 to 34 year olds has the highest likelihood of being enrolled in private schools, with 121 (100.0% in the age bracket) enrolled. Conversely, the age group of 3 to 4 year olds has the lowest likelihood of being enrolled in a private school, with 112 (100.0% in the age bracket) attending a public institution.
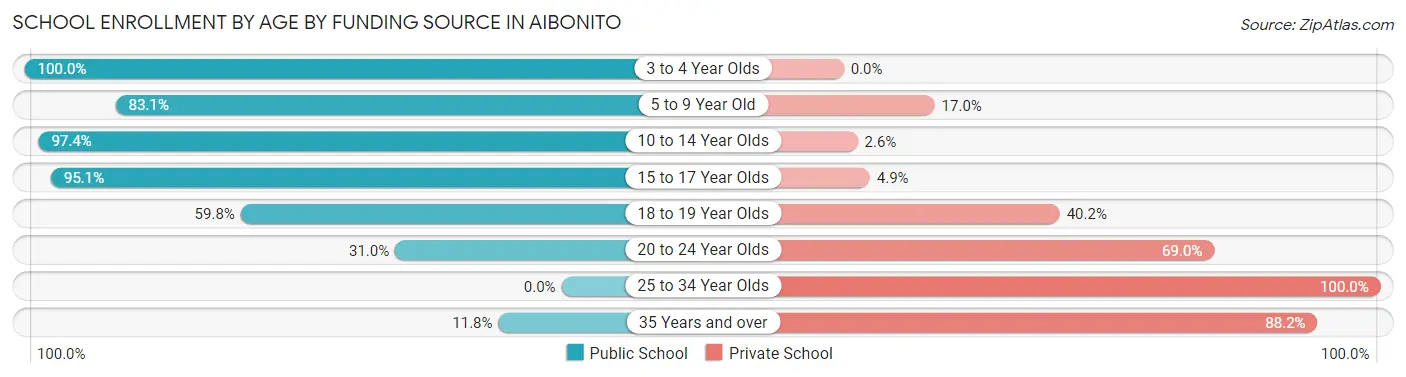
| Age Bracket | Public School | Private School |
| 3 to 4 Year Olds | 112 (100.0%) | 0 (0.0%) |
| 5 to 9 Year Old | 294 (83.1%) | 60 (17.0%) |
| 10 to 14 Year Olds | 601 (97.4%) | 16 (2.6%) |
| 15 to 17 Year Olds | 234 (95.1%) | 12 (4.9%) |
| 18 to 19 Year Olds | 98 (59.8%) | 66 (40.2%) |
| 20 to 24 Year Olds | 71 (31.0%) | 158 (69.0%) |
| 25 to 34 Year Olds | 0 (0.0%) | 121 (100.0%) |
| 35 Years and over | 8 (11.8%) | 60 (88.2%) |
| Total | 1,418 (74.2%) | 493 (25.8%) |
Educational Attainment by Field of Study in Aibonito
Education (447 | 28.7%), business (313 | 20.1%), science & technology (240 | 15.4%), bio, nature & agricultural (125 | 8.0%), and social sciences (121 | 7.8%) are the most common fields of study among 1,556 individuals in Aibonito who have obtained a bachelor's degree or higher.
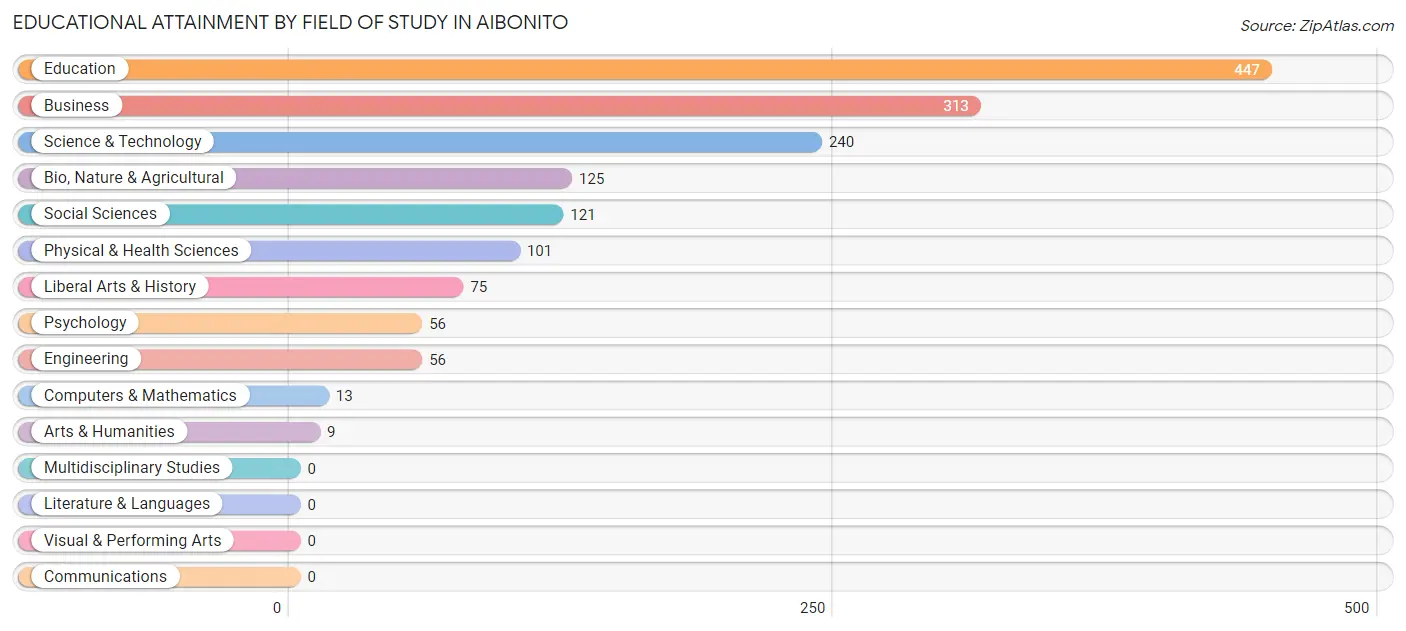
| Field of Study | # Graduates | % Graduates |
| Computers & Mathematics | 13 | 0.8% |
| Bio, Nature & Agricultural | 125 | 8.0% |
| Physical & Health Sciences | 101 | 6.5% |
| Psychology | 56 | 3.6% |
| Social Sciences | 121 | 7.8% |
| Engineering | 56 | 3.6% |
| Multidisciplinary Studies | 0 | 0.0% |
| Science & Technology | 240 | 15.4% |
| Business | 313 | 20.1% |
| Education | 447 | 28.7% |
| Literature & Languages | 0 | 0.0% |
| Liberal Arts & History | 75 | 4.8% |
| Visual & Performing Arts | 0 | 0.0% |
| Communications | 0 | 0.0% |
| Arts & Humanities | 9 | 0.6% |
| Total | 1,556 | 100.0% |
Transportation & Commute in Aibonito
Vehicle Availability by Sex in Aibonito
The most prevalent vehicle ownership categories in Aibonito are males with 2 vehicles (357, accounting for 30.5%) and females with 2 vehicles (329, making up 31.1%).
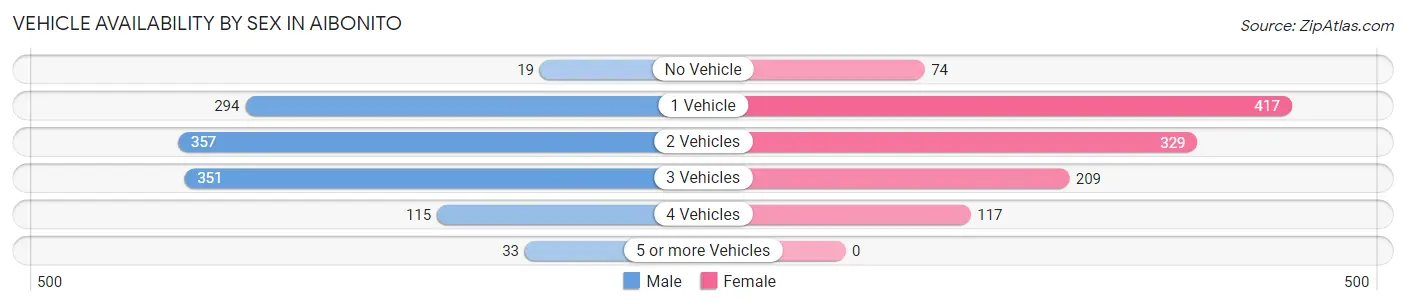
| Vehicles Available | Male | Female |
| No Vehicle | 19 (1.6%) | 74 (6.5%) |
| 1 Vehicle | 294 (25.2%) | 417 (36.4%) |
| 2 Vehicles | 357 (30.5%) | 329 (28.7%) |
| 3 Vehicles | 351 (30.0%) | 209 (18.2%) |
| 4 Vehicles | 115 (9.8%) | 117 (10.2%) |
| 5 or more Vehicles | 33 (2.8%) | 0 (0.0%) |
| Total | 1,169 (100.0%) | 1,146 (100.0%) |
Commute Time in Aibonito
The most frequently occuring commute durations in Aibonito are 5 to 9 minutes (767 commuters, 33.9%), 10 to 14 minutes (516 commuters, 22.8%), and 60 to 89 minutes (271 commuters, 12.0%).
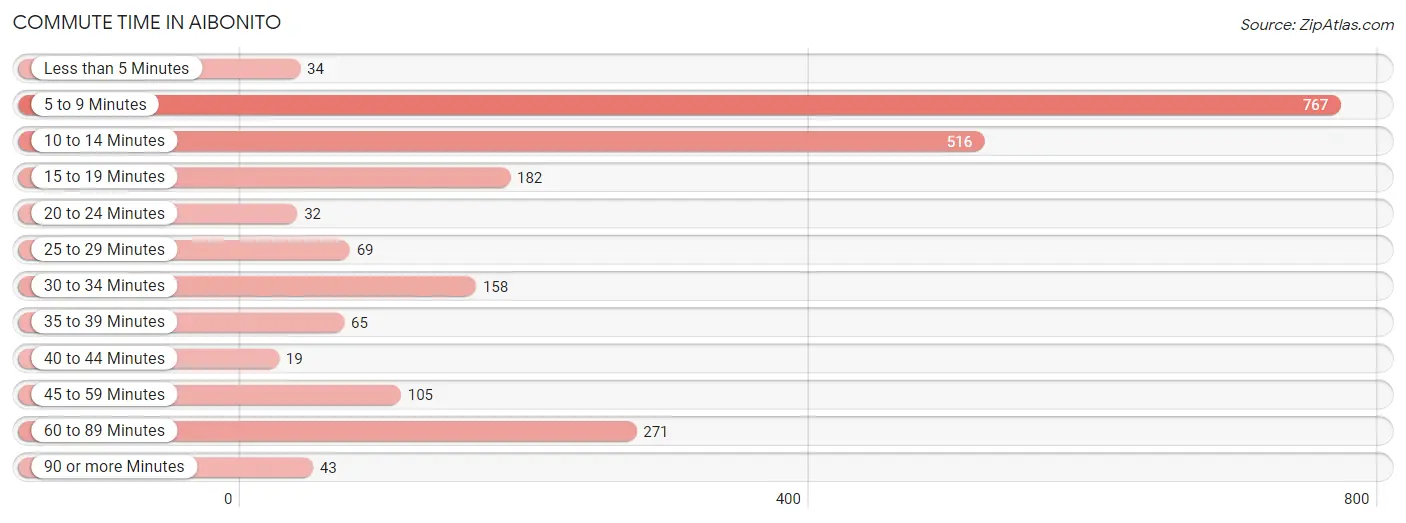
| Commute Time | # Commuters | % Commuters |
| Less than 5 Minutes | 34 | 1.5% |
| 5 to 9 Minutes | 767 | 33.9% |
| 10 to 14 Minutes | 516 | 22.8% |
| 15 to 19 Minutes | 182 | 8.1% |
| 20 to 24 Minutes | 32 | 1.4% |
| 25 to 29 Minutes | 69 | 3.0% |
| 30 to 34 Minutes | 158 | 7.0% |
| 35 to 39 Minutes | 65 | 2.9% |
| 40 to 44 Minutes | 19 | 0.8% |
| 45 to 59 Minutes | 105 | 4.6% |
| 60 to 89 Minutes | 271 | 12.0% |
| 90 or more Minutes | 43 | 1.9% |
Commute Time by Sex in Aibonito
The most common commute times in Aibonito are 5 to 9 minutes (365 commuters, 32.3%) for males and 5 to 9 minutes (402 commuters, 35.5%) for females.
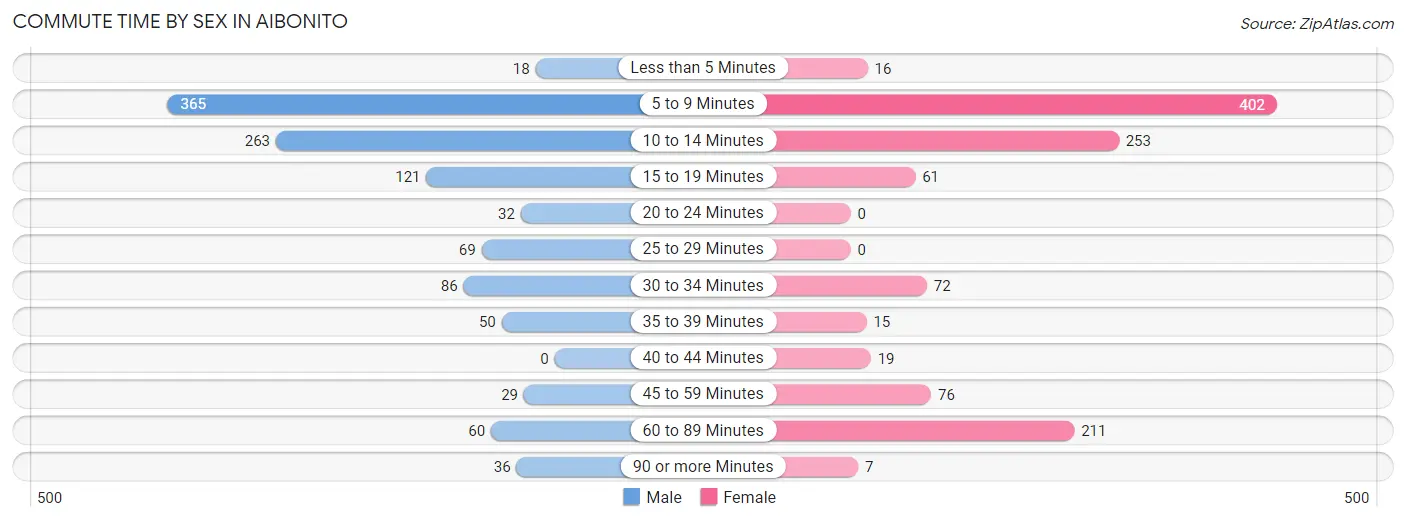
| Commute Time | Male | Female |
| Less than 5 Minutes | 18 (1.6%) | 16 (1.4%) |
| 5 to 9 Minutes | 365 (32.3%) | 402 (35.5%) |
| 10 to 14 Minutes | 263 (23.3%) | 253 (22.4%) |
| 15 to 19 Minutes | 121 (10.7%) | 61 (5.4%) |
| 20 to 24 Minutes | 32 (2.8%) | 0 (0.0%) |
| 25 to 29 Minutes | 69 (6.1%) | 0 (0.0%) |
| 30 to 34 Minutes | 86 (7.6%) | 72 (6.4%) |
| 35 to 39 Minutes | 50 (4.4%) | 15 (1.3%) |
| 40 to 44 Minutes | 0 (0.0%) | 19 (1.7%) |
| 45 to 59 Minutes | 29 (2.6%) | 76 (6.7%) |
| 60 to 89 Minutes | 60 (5.3%) | 211 (18.6%) |
| 90 or more Minutes | 36 (3.2%) | 7 (0.6%) |
Time of Departure to Work by Sex in Aibonito
The most frequent times of departure to work in Aibonito are 6:00 AM to 6:29 AM (176, 15.6%) for males and 7:00 AM to 7:29 AM (303, 26.8%) for females.
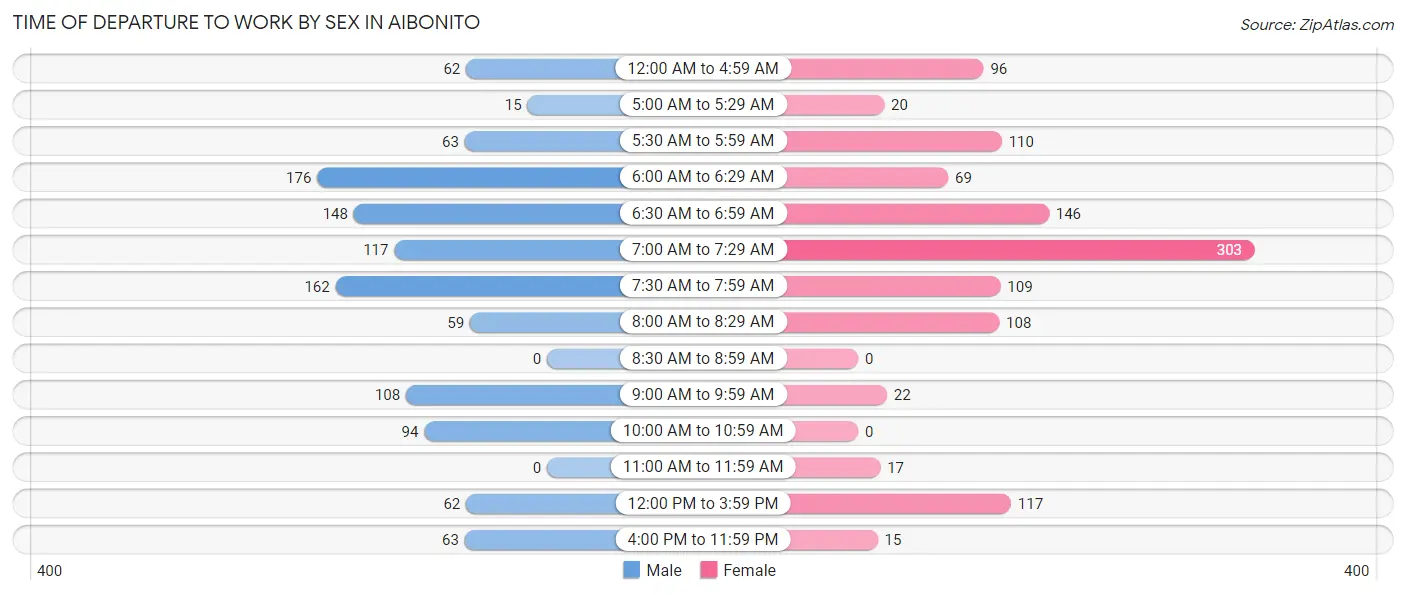
| Time of Departure | Male | Female |
| 12:00 AM to 4:59 AM | 62 (5.5%) | 96 (8.5%) |
| 5:00 AM to 5:29 AM | 15 (1.3%) | 20 (1.8%) |
| 5:30 AM to 5:59 AM | 63 (5.6%) | 110 (9.7%) |
| 6:00 AM to 6:29 AM | 176 (15.6%) | 69 (6.1%) |
| 6:30 AM to 6:59 AM | 148 (13.1%) | 146 (12.9%) |
| 7:00 AM to 7:29 AM | 117 (10.4%) | 303 (26.8%) |
| 7:30 AM to 7:59 AM | 162 (14.3%) | 109 (9.6%) |
| 8:00 AM to 8:29 AM | 59 (5.2%) | 108 (9.5%) |
| 8:30 AM to 8:59 AM | 0 (0.0%) | 0 (0.0%) |
| 9:00 AM to 9:59 AM | 108 (9.6%) | 22 (1.9%) |
| 10:00 AM to 10:59 AM | 94 (8.3%) | 0 (0.0%) |
| 11:00 AM to 11:59 AM | 0 (0.0%) | 17 (1.5%) |
| 12:00 PM to 3:59 PM | 62 (5.5%) | 117 (10.3%) |
| 4:00 PM to 11:59 PM | 63 (5.6%) | 15 (1.3%) |
| Total | 1,129 (100.0%) | 1,132 (100.0%) |
Housing Occupancy in Aibonito
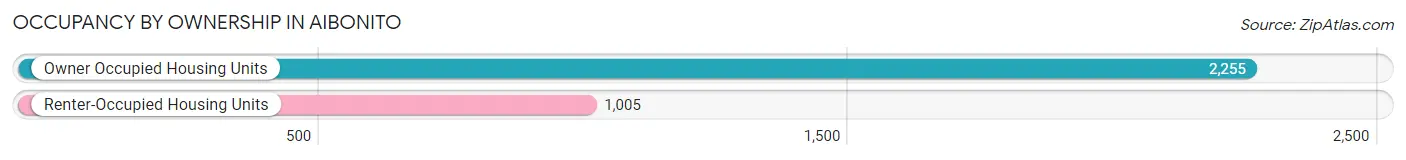
Occupancy by Ownership in Aibonito
Of the total 3,260 dwellings in Aibonito, owner-occupied units account for 2,255 (69.2%), while renter-occupied units make up 1,005 (30.8%).
| Occupancy | # Housing Units | % Housing Units |
| Owner Occupied Housing Units | 2,255 | 69.2% |
| Renter-Occupied Housing Units | 1,005 | 30.8% |
| Total Occupied Housing Units | 3,260 | 100.0% |
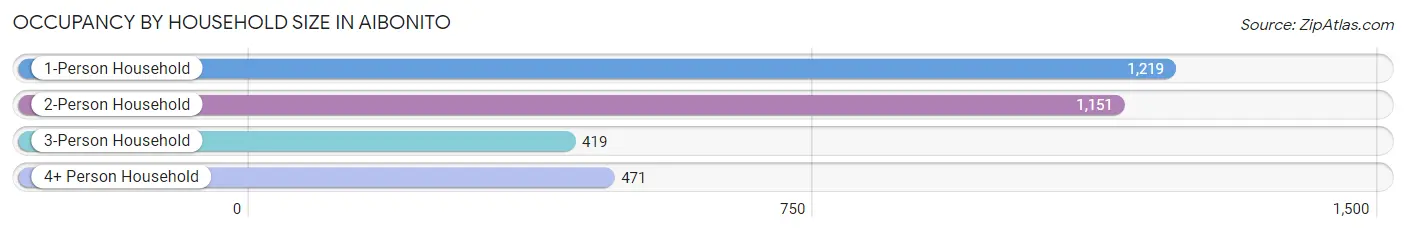
Occupancy by Household Size in Aibonito
| Household Size | # Housing Units | % Housing Units |
| 1-Person Household | 1,219 | 37.4% |
| 2-Person Household | 1,151 | 35.3% |
| 3-Person Household | 419 | 12.9% |
| 4+ Person Household | 471 | 14.4% |
| Total Housing Units | 3,260 | 100.0% |
Occupancy by Ownership by Household Size in Aibonito
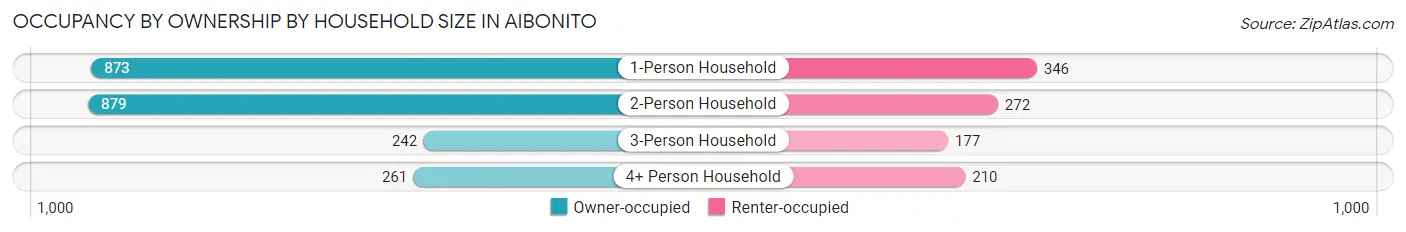
| Household Size | Owner-occupied | Renter-occupied |
| 1-Person Household | 873 (71.6%) | 346 (28.4%) |
| 2-Person Household | 879 (76.4%) | 272 (23.6%) |
| 3-Person Household | 242 (57.8%) | 177 (42.2%) |
| 4+ Person Household | 261 (55.4%) | 210 (44.6%) |
| Total Housing Units | 2,255 (69.2%) | 1,005 (30.8%) |
Occupancy by Educational Attainment in Aibonito
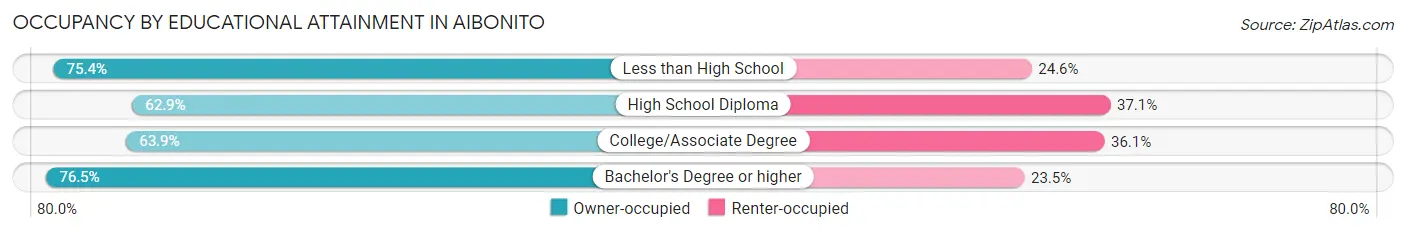
| Household Size | Owner-occupied | Renter-occupied |
| Less than High School | 536 (75.4%) | 175 (24.6%) |
| High School Diploma | 646 (62.9%) | 381 (37.1%) |
| College/Associate Degree | 463 (63.9%) | 262 (36.1%) |
| Bachelor's Degree or higher | 610 (76.5%) | 187 (23.5%) |
Occupancy by Age of Householder in Aibonito
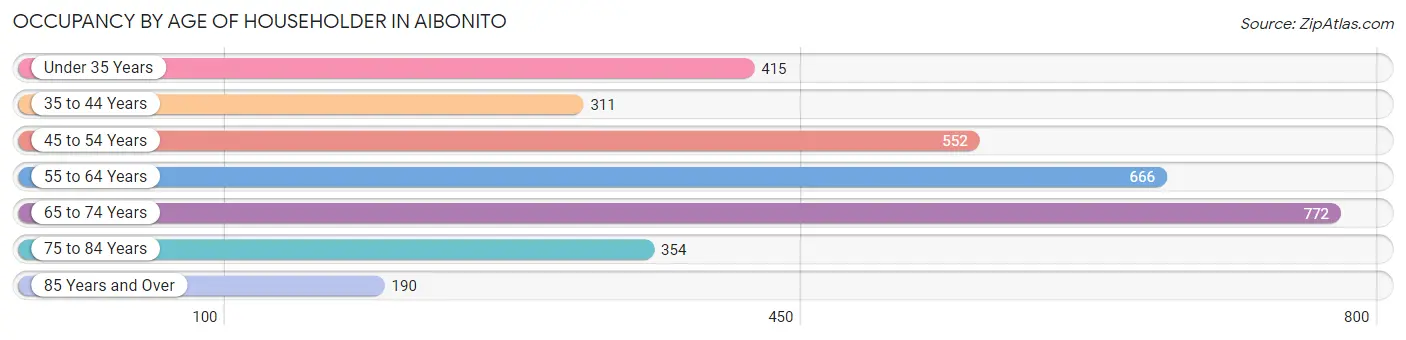
| Age Bracket | # Households | % Households |
| Under 35 Years | 415 | 12.7% |
| 35 to 44 Years | 311 | 9.5% |
| 45 to 54 Years | 552 | 16.9% |
| 55 to 64 Years | 666 | 20.4% |
| 65 to 74 Years | 772 | 23.7% |
| 75 to 84 Years | 354 | 10.9% |
| 85 Years and Over | 190 | 5.8% |
| Total | 3,260 | 100.0% |
Housing Finances in Aibonito
Median Income by Occupancy in Aibonito
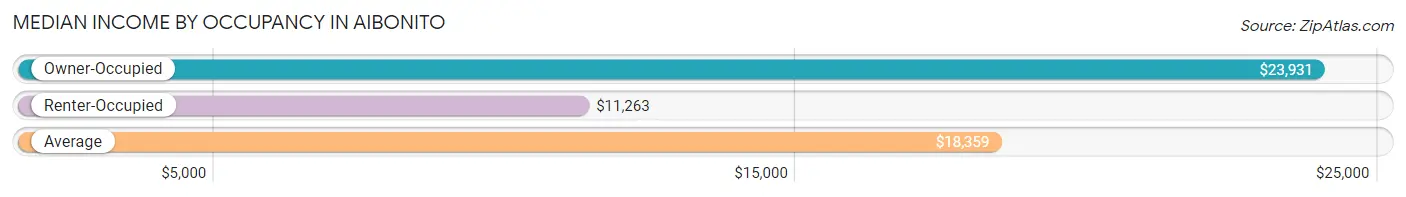
| Occupancy Type | # Households | Median Income |
| Owner-Occupied | 2,255 (69.2%) | $23,931 |
| Renter-Occupied | 1,005 (30.8%) | $11,263 |
| Average | 3,260 (100.0%) | $18,359 |
Occupancy by Householder Income Bracket in Aibonito
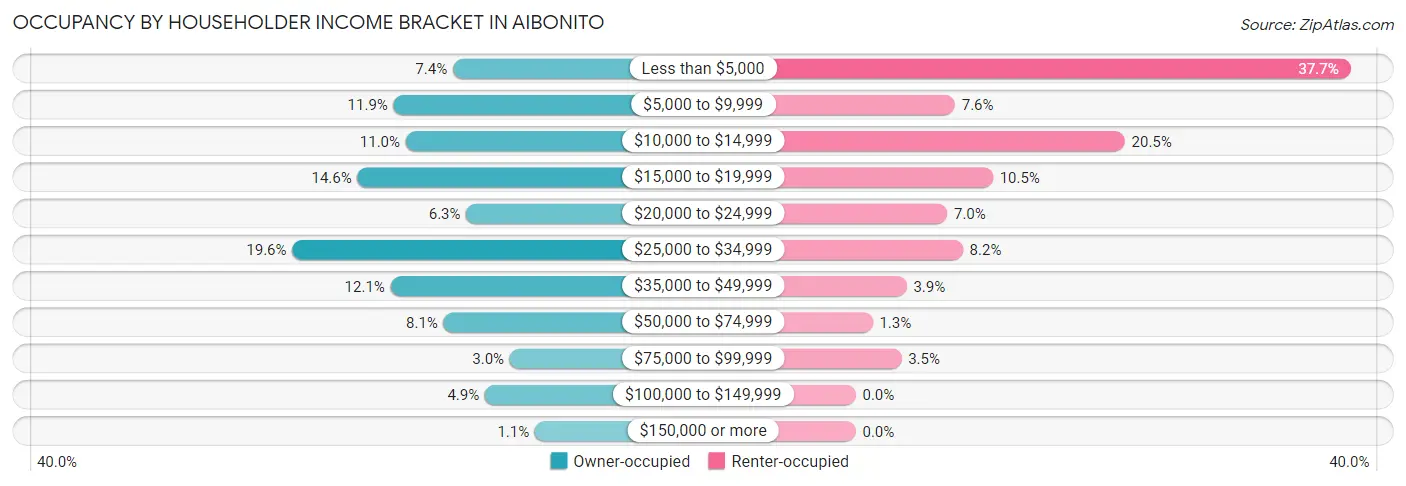
| Income Bracket | Owner-occupied | Renter-occupied |
| Less than $5,000 | 166 (7.4%) | 379 (37.7%) |
| $5,000 to $9,999 | 268 (11.9%) | 76 (7.6%) |
| $10,000 to $14,999 | 247 (11.0%) | 206 (20.5%) |
| $15,000 to $19,999 | 330 (14.6%) | 105 (10.4%) |
| $20,000 to $24,999 | 143 (6.3%) | 70 (7.0%) |
| $25,000 to $34,999 | 442 (19.6%) | 82 (8.2%) |
| $35,000 to $49,999 | 273 (12.1%) | 39 (3.9%) |
| $50,000 to $74,999 | 182 (8.1%) | 13 (1.3%) |
| $75,000 to $99,999 | 68 (3.0%) | 35 (3.5%) |
| $100,000 to $149,999 | 111 (4.9%) | 0 (0.0%) |
| $150,000 or more | 25 (1.1%) | 0 (0.0%) |
| Total | 2,255 (100.0%) | 1,005 (100.0%) |
Monthly Housing Cost Tiers in Aibonito
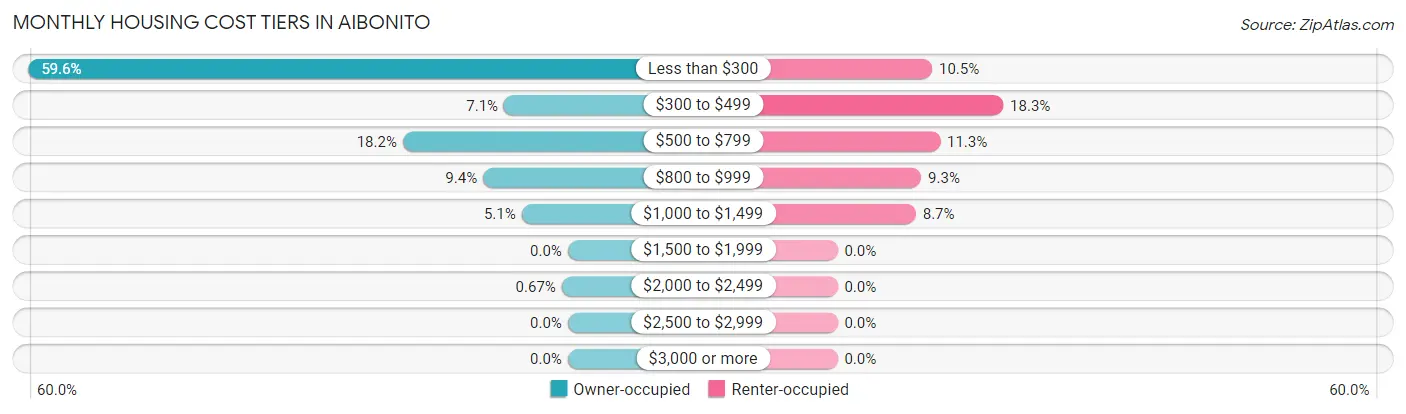
| Monthly Cost | Owner-occupied | Renter-occupied |
| Less than $300 | 1,344 (59.6%) | 105 (10.4%) |
| $300 to $499 | 159 (7.0%) | 184 (18.3%) |
| $500 to $799 | 411 (18.2%) | 114 (11.3%) |
| $800 to $999 | 211 (9.4%) | 93 (9.2%) |
| $1,000 to $1,499 | 115 (5.1%) | 87 (8.7%) |
| $1,500 to $1,999 | 0 (0.0%) | 0 (0.0%) |
| $2,000 to $2,499 | 15 (0.7%) | 0 (0.0%) |
| $2,500 to $2,999 | 0 (0.0%) | 0 (0.0%) |
| $3,000 or more | 0 (0.0%) | 0 (0.0%) |
| Total | 2,255 (100.0%) | 1,005 (100.0%) |
Physical Housing Characteristics in Aibonito
Housing Structures in Aibonito
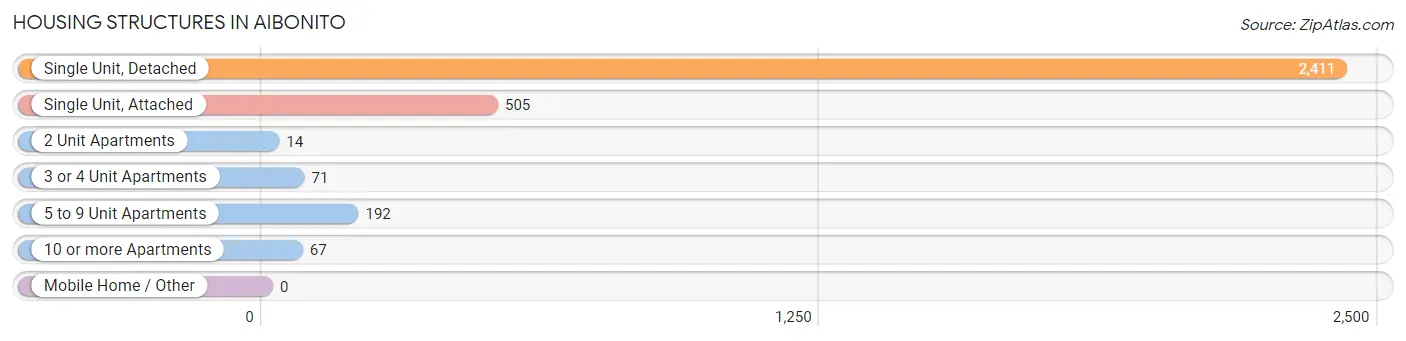
| Structure Type | # Housing Units | % Housing Units |
| Single Unit, Detached | 2,411 | 74.0% |
| Single Unit, Attached | 505 | 15.5% |
| 2 Unit Apartments | 14 | 0.4% |
| 3 or 4 Unit Apartments | 71 | 2.2% |
| 5 to 9 Unit Apartments | 192 | 5.9% |
| 10 or more Apartments | 67 | 2.1% |
| Mobile Home / Other | 0 | 0.0% |
| Total | 3,260 | 100.0% |
Housing Structures by Occupancy in Aibonito
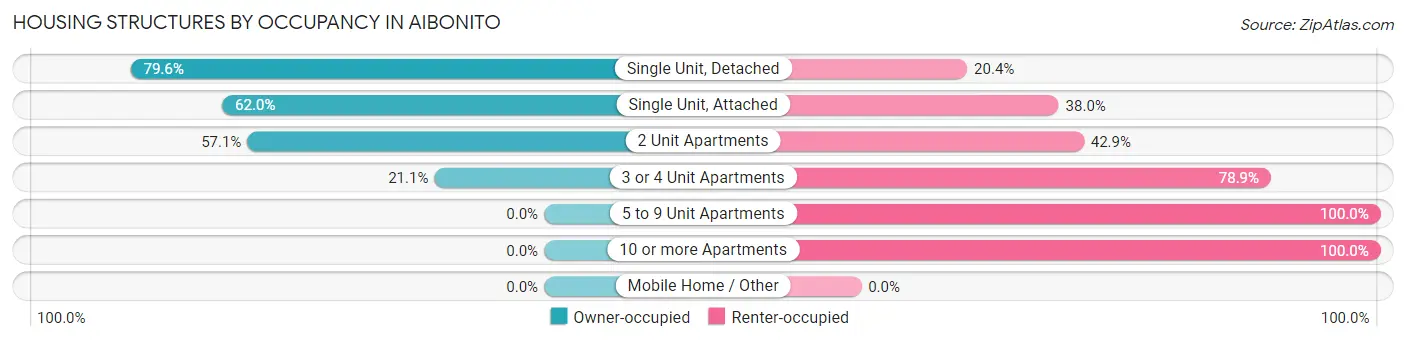
| Structure Type | Owner-occupied | Renter-occupied |
| Single Unit, Detached | 1,919 (79.6%) | 492 (20.4%) |
| Single Unit, Attached | 313 (62.0%) | 192 (38.0%) |
| 2 Unit Apartments | 8 (57.1%) | 6 (42.9%) |
| 3 or 4 Unit Apartments | 15 (21.1%) | 56 (78.9%) |
| 5 to 9 Unit Apartments | 0 (0.0%) | 192 (100.0%) |
| 10 or more Apartments | 0 (0.0%) | 67 (100.0%) |
| Mobile Home / Other | 0 (0.0%) | 0 (0.0%) |
| Total | 2,255 (69.2%) | 1,005 (30.8%) |
Housing Structures by Number of Rooms in Aibonito
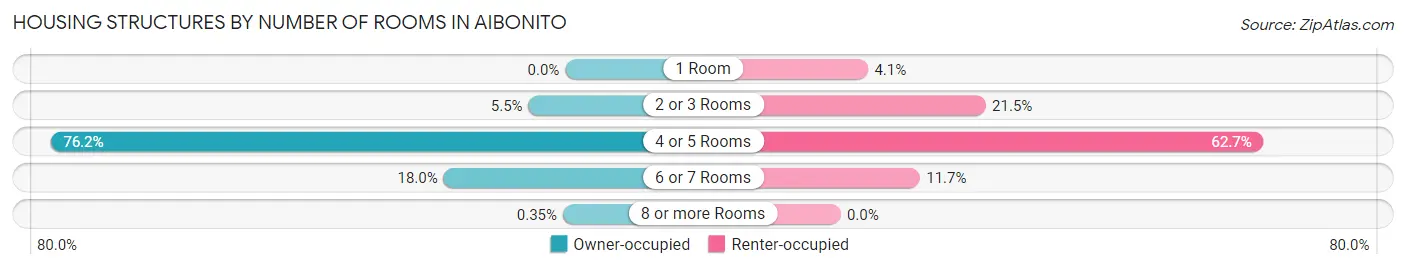
| Number of Rooms | Owner-occupied | Renter-occupied |
| 1 Room | 0 (0.0%) | 41 (4.1%) |
| 2 or 3 Rooms | 123 (5.4%) | 216 (21.5%) |
| 4 or 5 Rooms | 1,718 (76.2%) | 630 (62.7%) |
| 6 or 7 Rooms | 406 (18.0%) | 118 (11.7%) |
| 8 or more Rooms | 8 (0.4%) | 0 (0.0%) |
| Total | 2,255 (100.0%) | 1,005 (100.0%) |
Housing Structure by Heating Type in Aibonito
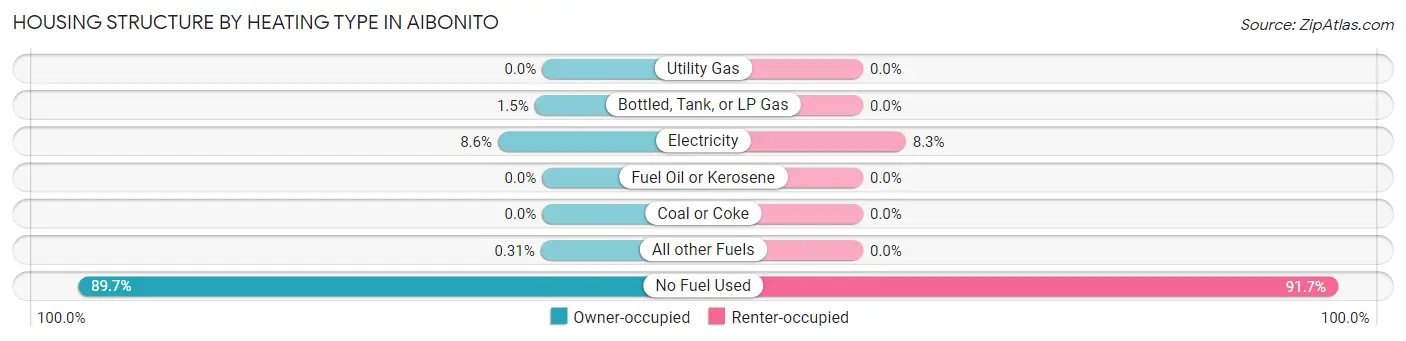
| Heating Type | Owner-occupied | Renter-occupied |
| Utility Gas | 0 (0.0%) | 0 (0.0%) |
| Bottled, Tank, or LP Gas | 33 (1.5%) | 0 (0.0%) |
| Electricity | 193 (8.6%) | 83 (8.3%) |
| Fuel Oil or Kerosene | 0 (0.0%) | 0 (0.0%) |
| Coal or Coke | 0 (0.0%) | 0 (0.0%) |
| All other Fuels | 7 (0.3%) | 0 (0.0%) |
| No Fuel Used | 2,022 (89.7%) | 922 (91.7%) |
| Total | 2,255 (100.0%) | 1,005 (100.0%) |
Household Vehicle Usage in Aibonito
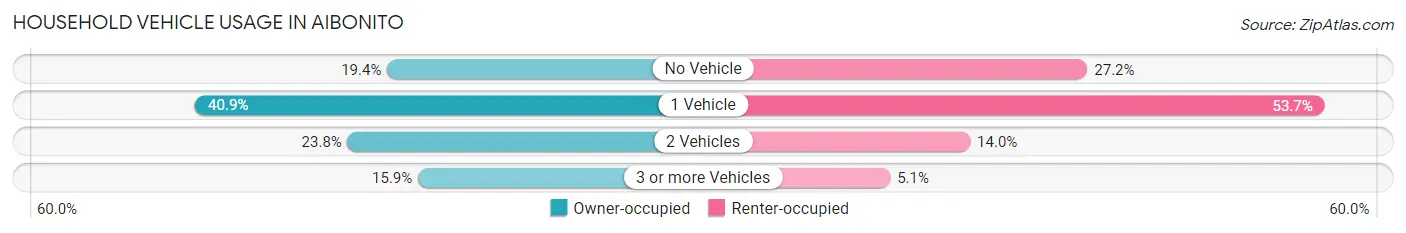
| Vehicles per Household | Owner-occupied | Renter-occupied |
| No Vehicle | 437 (19.4%) | 273 (27.2%) |
| 1 Vehicle | 922 (40.9%) | 540 (53.7%) |
| 2 Vehicles | 537 (23.8%) | 141 (14.0%) |
| 3 or more Vehicles | 359 (15.9%) | 51 (5.1%) |
| Total | 2,255 (100.0%) | 1,005 (100.0%) |
Real Estate & Mortgages in Aibonito
Real Estate and Mortgage Overview in Aibonito
| Characteristic | Without Mortgage | With Mortgage |
| Housing Units | 1,447 | 808 |
| Median Property Value | $109,000 | $120,800 |
| Median Household Income | $19,112 | $0 |
| Monthly Housing Costs | $146 | $0 |
| Real Estate Taxes | - | - |
Property Value by Mortgage Status in Aibonito
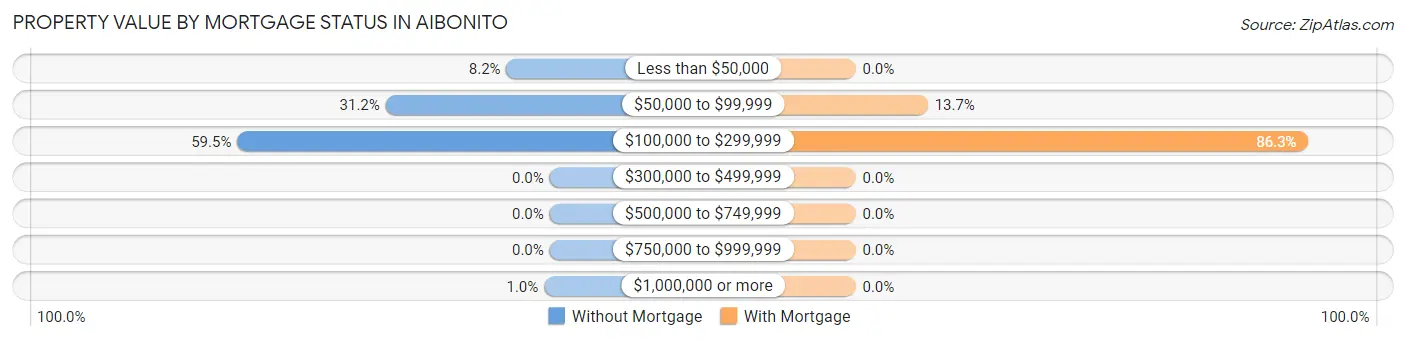
| Property Value | Without Mortgage | With Mortgage |
| Less than $50,000 | 119 (8.2%) | 0 (0.0%) |
| $50,000 to $99,999 | 452 (31.2%) | 111 (13.7%) |
| $100,000 to $299,999 | 861 (59.5%) | 697 (86.3%) |
| $300,000 to $499,999 | 0 (0.0%) | 0 (0.0%) |
| $500,000 to $749,999 | 0 (0.0%) | 0 (0.0%) |
| $750,000 to $999,999 | 0 (0.0%) | 0 (0.0%) |
| $1,000,000 or more | 15 (1.0%) | 0 (0.0%) |
| Total | 1,447 (100.0%) | 808 (100.0%) |
Household Income by Mortgage Status in Aibonito
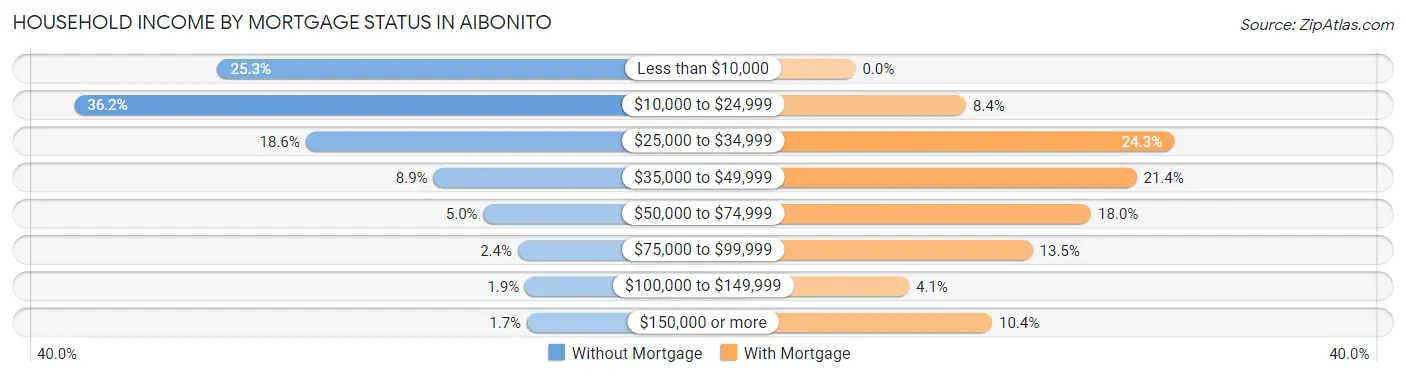
| Household Income | Without Mortgage | With Mortgage |
| Less than $10,000 | 366 (25.3%) | 0 (0.0%) |
| $10,000 to $24,999 | 524 (36.2%) | 68 (8.4%) |
| $25,000 to $34,999 | 269 (18.6%) | 196 (24.3%) |
| $35,000 to $49,999 | 128 (8.8%) | 173 (21.4%) |
| $50,000 to $74,999 | 73 (5.0%) | 145 (17.9%) |
| $75,000 to $99,999 | 35 (2.4%) | 109 (13.5%) |
| $100,000 to $149,999 | 27 (1.9%) | 33 (4.1%) |
| $150,000 or more | 25 (1.7%) | 84 (10.4%) |
| Total | 1,447 (100.0%) | 808 (100.0%) |
Property Value to Household Income Ratio in Aibonito
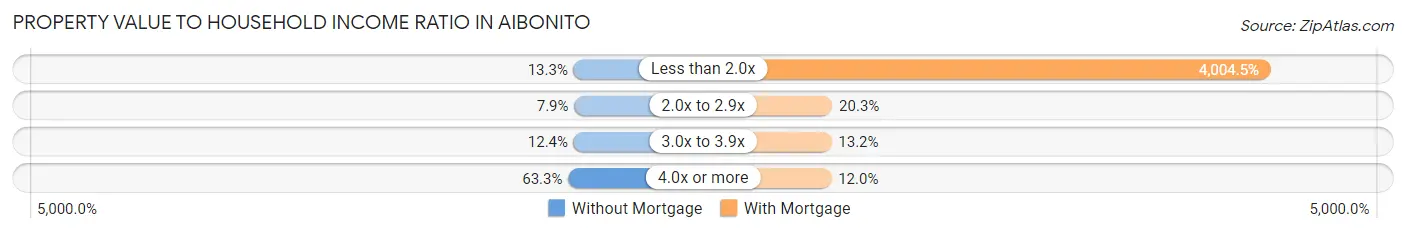
| Value-to-Income Ratio | Without Mortgage | With Mortgage |
| Less than 2.0x | 193 (13.3%) | 32,356 (4,004.5%) |
| 2.0x to 2.9x | 114 (7.9%) | 164 (20.3%) |
| 3.0x to 3.9x | 180 (12.4%) | 107 (13.2%) |
| 4.0x or more | 916 (63.3%) | 97 (12.0%) |
| Total | 1,447 (100.0%) | 808 (100.0%) |
Real Estate Taxes by Mortgage Status in Aibonito
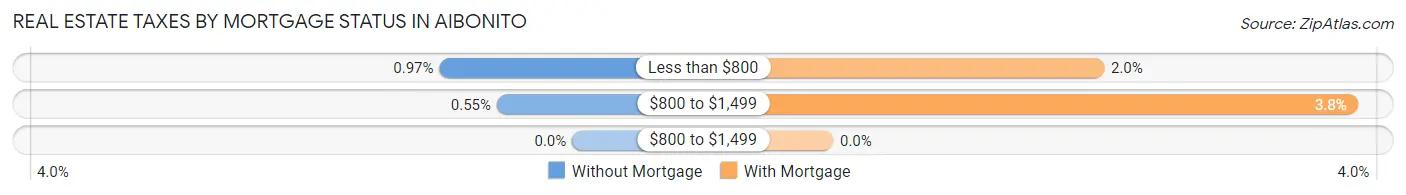
| Property Taxes | Without Mortgage | With Mortgage |
| Less than $800 | 14 (1.0%) | 16 (2.0%) |
| $800 to $1,499 | 8 (0.5%) | 31 (3.8%) |
| $800 to $1,499 | 0 (0.0%) | 0 (0.0%) |
| Total | 1,447 (100.0%) | 808 (100.0%) |
Health & Disability in Aibonito
Health Insurance Coverage by Age in Aibonito
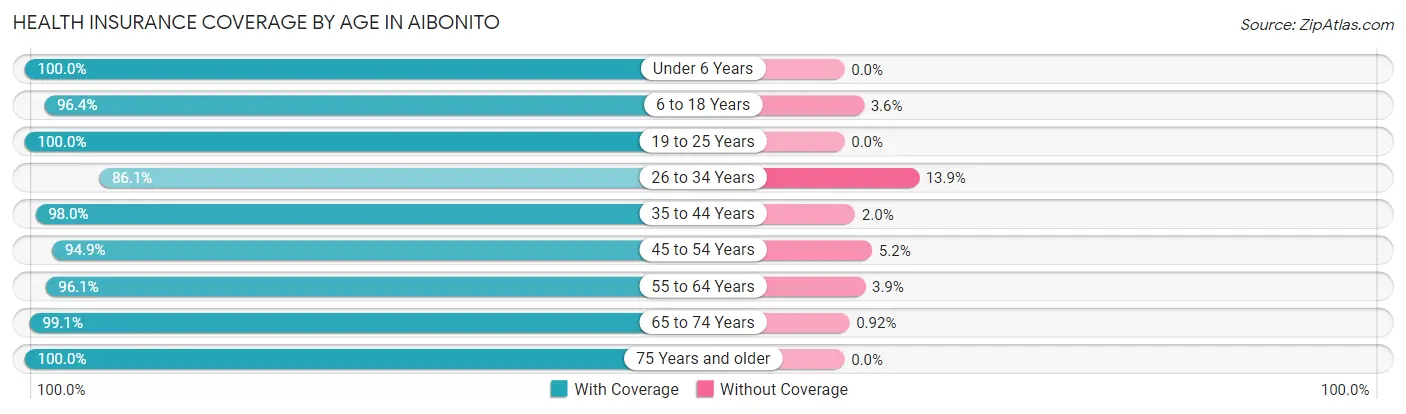
| Age Bracket | With Coverage | Without Coverage |
| Under 6 Years | 441 (100.0%) | 0 (0.0%) |
| 6 to 18 Years | 1,252 (96.4%) | 47 (3.6%) |
| 19 to 25 Years | 775 (100.0%) | 0 (0.0%) |
| 26 to 34 Years | 1,000 (86.1%) | 161 (13.9%) |
| 35 to 44 Years | 741 (98.0%) | 15 (2.0%) |
| 45 to 54 Years | 902 (94.9%) | 49 (5.1%) |
| 55 to 64 Years | 1,193 (96.1%) | 48 (3.9%) |
| 65 to 74 Years | 1,082 (99.1%) | 10 (0.9%) |
| 75 Years and older | 878 (100.0%) | 0 (0.0%) |
| Total | 8,264 (96.2%) | 330 (3.8%) |
Health Insurance Coverage by Citizenship Status in Aibonito
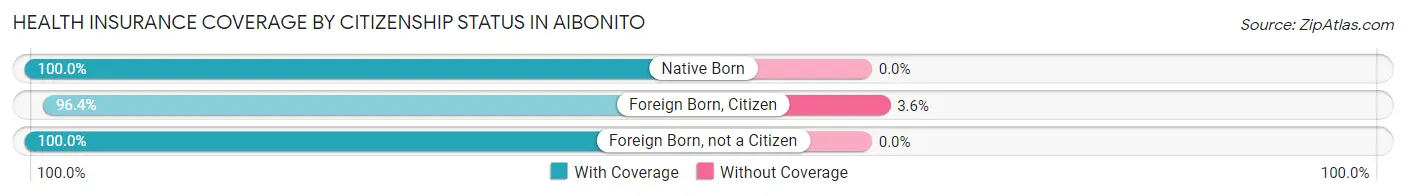
| Citizenship Status | With Coverage | Without Coverage |
| Native Born | 441 (100.0%) | 0 (0.0%) |
| Foreign Born, Citizen | 1,252 (96.4%) | 47 (3.6%) |
| Foreign Born, not a Citizen | 775 (100.0%) | 0 (0.0%) |
Health Insurance Coverage by Household Income in Aibonito
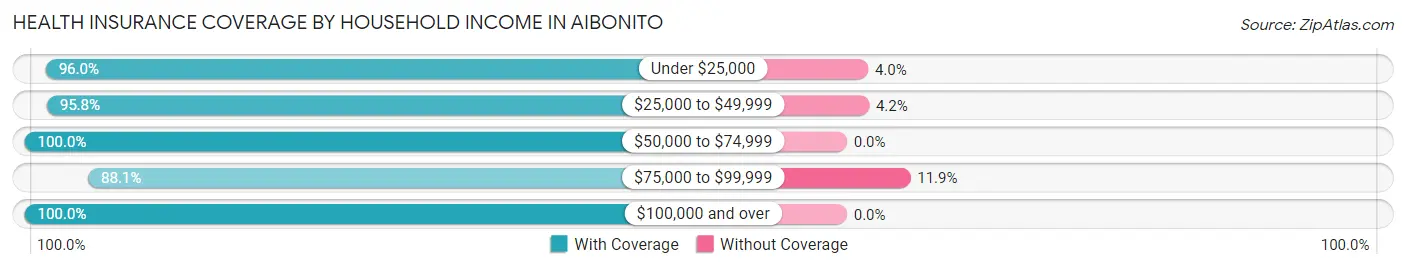
| Household Income | With Coverage | Without Coverage |
| Under $25,000 | 3,952 (96.0%) | 163 (4.0%) |
| $25,000 to $49,999 | 2,491 (95.8%) | 108 (4.2%) |
| $50,000 to $74,999 | 814 (100.0%) | 0 (0.0%) |
| $75,000 to $99,999 | 437 (88.1%) | 59 (11.9%) |
| $100,000 and over | 564 (100.0%) | 0 (0.0%) |
Public vs Private Health Insurance Coverage by Age in Aibonito
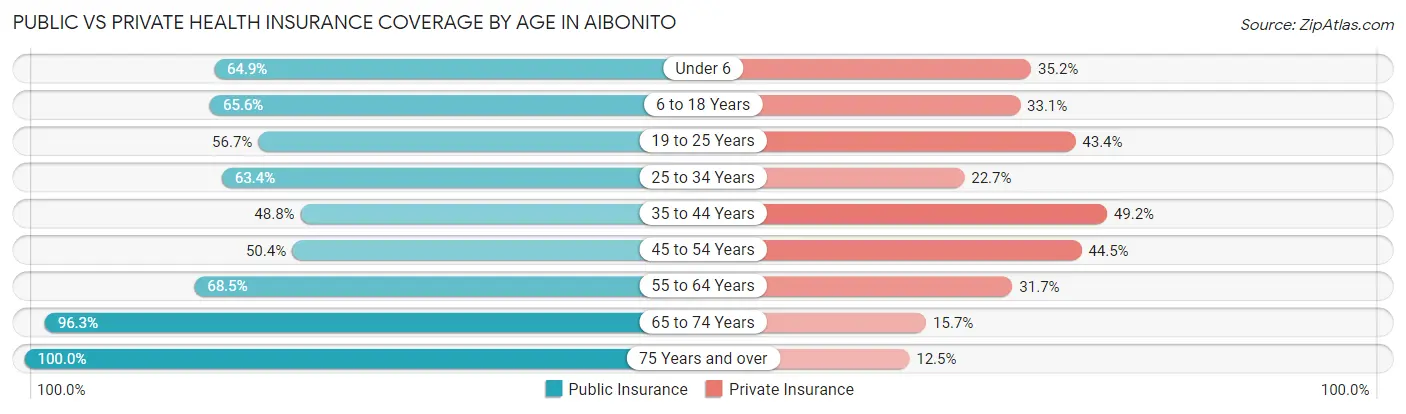
| Age Bracket | Public Insurance | Private Insurance |
| Under 6 | 286 (64.8%) | 155 (35.1%) |
| 6 to 18 Years | 852 (65.6%) | 430 (33.1%) |
| 19 to 25 Years | 439 (56.7%) | 336 (43.3%) |
| 25 to 34 Years | 736 (63.4%) | 264 (22.7%) |
| 35 to 44 Years | 369 (48.8%) | 372 (49.2%) |
| 45 to 54 Years | 479 (50.4%) | 423 (44.5%) |
| 55 to 64 Years | 850 (68.5%) | 393 (31.7%) |
| 65 to 74 Years | 1,051 (96.3%) | 171 (15.7%) |
| 75 Years and over | 878 (100.0%) | 110 (12.5%) |
| Total | 5,940 (69.1%) | 2,654 (30.9%) |
Disability Status by Sex by Age in Aibonito
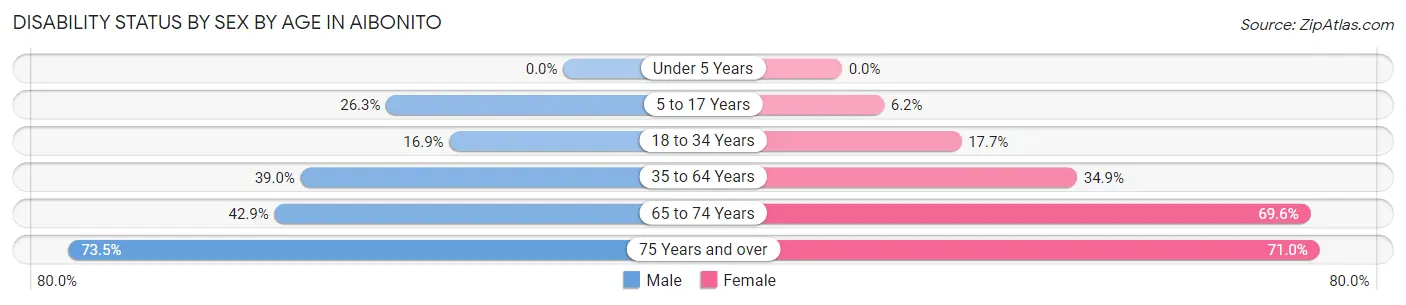
| Age Bracket | Male | Female |
| Under 5 Years | 0 (0.0%) | 0 (0.0%) |
| 5 to 17 Years | 189 (26.3%) | 35 (6.2%) |
| 18 to 34 Years | 177 (16.9%) | 183 (17.7%) |
| 35 to 64 Years | 489 (39.0%) | 591 (34.9%) |
| 65 to 74 Years | 199 (42.9%) | 437 (69.6%) |
| 75 Years and over | 286 (73.5%) | 347 (71.0%) |
Disability Class by Sex by Age in Aibonito
Disability Class: Hearing Difficulty
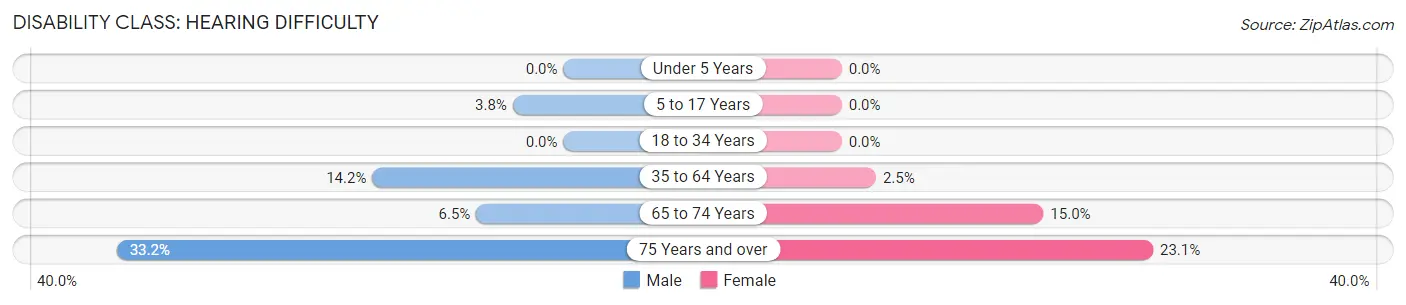
| Age Bracket | Male | Female |
| Under 5 Years | 0 (0.0%) | 0 (0.0%) |
| 5 to 17 Years | 27 (3.8%) | 0 (0.0%) |
| 18 to 34 Years | 0 (0.0%) | 0 (0.0%) |
| 35 to 64 Years | 178 (14.2%) | 43 (2.5%) |
| 65 to 74 Years | 30 (6.5%) | 94 (15.0%) |
| 75 Years and over | 129 (33.2%) | 113 (23.1%) |
Disability Class: Vision Difficulty
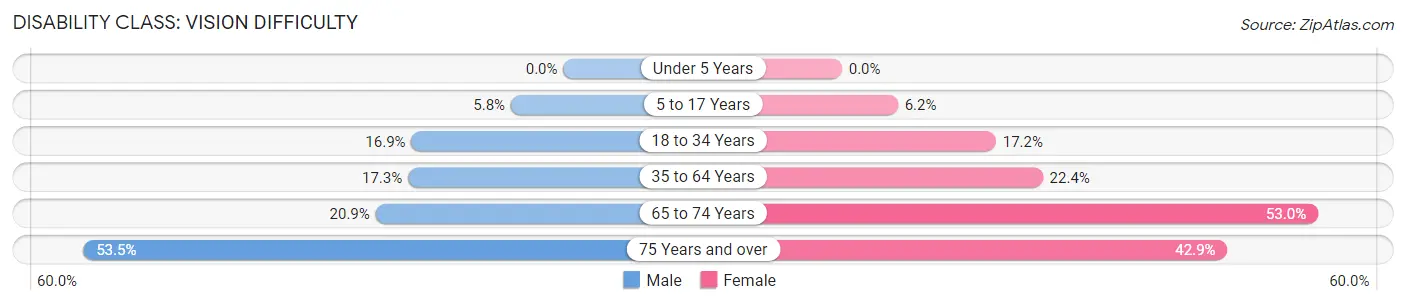
| Age Bracket | Male | Female |
| Under 5 Years | 0 (0.0%) | 0 (0.0%) |
| 5 to 17 Years | 42 (5.8%) | 35 (6.2%) |
| 18 to 34 Years | 177 (16.9%) | 177 (17.2%) |
| 35 to 64 Years | 217 (17.3%) | 379 (22.4%) |
| 65 to 74 Years | 97 (20.9%) | 333 (53.0%) |
| 75 Years and over | 208 (53.5%) | 210 (42.9%) |
Disability Class: Cognitive Difficulty
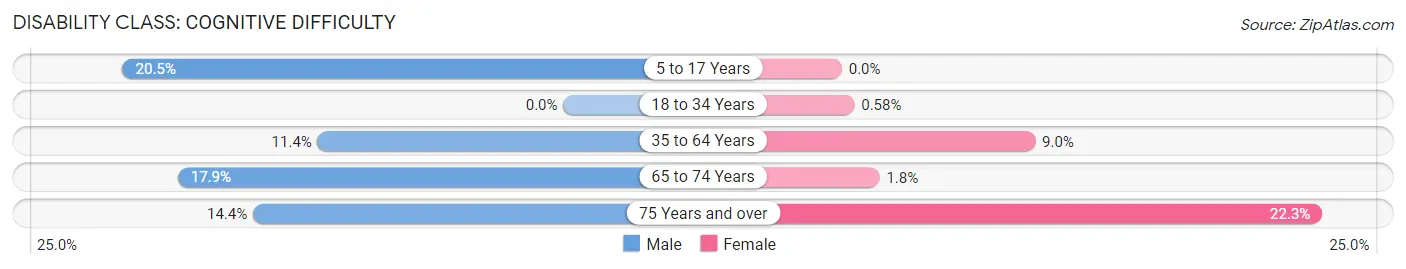
| Age Bracket | Male | Female |
| 5 to 17 Years | 147 (20.4%) | 0 (0.0%) |
| 18 to 34 Years | 0 (0.0%) | 6 (0.6%) |
| 35 to 64 Years | 143 (11.4%) | 152 (9.0%) |
| 65 to 74 Years | 83 (17.9%) | 11 (1.8%) |
| 75 Years and over | 56 (14.4%) | 109 (22.3%) |
Disability Class: Ambulatory Difficulty
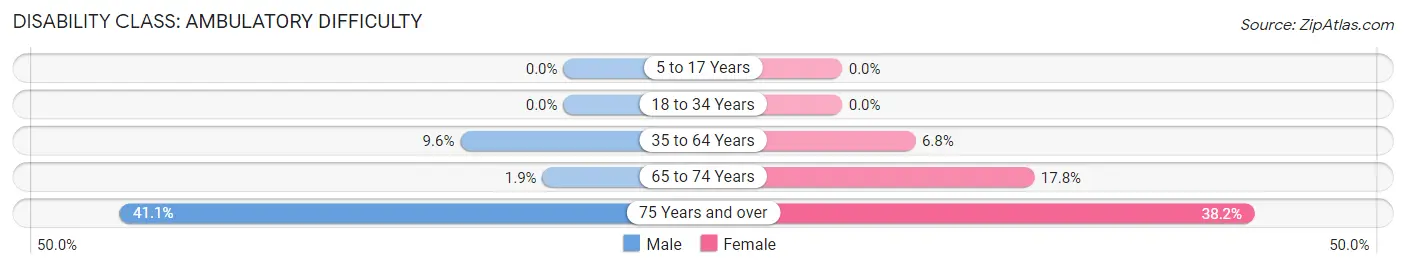
| Age Bracket | Male | Female |
| 5 to 17 Years | 0 (0.0%) | 0 (0.0%) |
| 18 to 34 Years | 0 (0.0%) | 0 (0.0%) |
| 35 to 64 Years | 120 (9.6%) | 115 (6.8%) |
| 65 to 74 Years | 9 (1.9%) | 112 (17.8%) |
| 75 Years and over | 160 (41.1%) | 187 (38.2%) |
Disability Class: Self-Care Difficulty
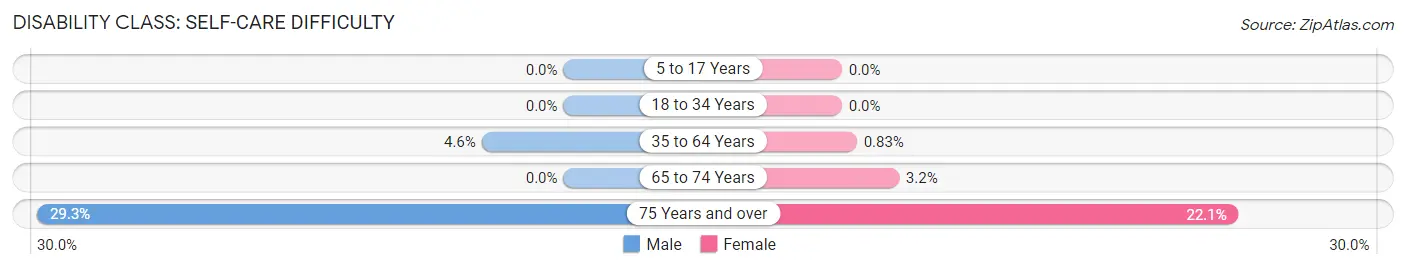
| Age Bracket | Male | Female |
| 5 to 17 Years | 0 (0.0%) | 0 (0.0%) |
| 18 to 34 Years | 0 (0.0%) | 0 (0.0%) |
| 35 to 64 Years | 57 (4.5%) | 14 (0.8%) |
| 65 to 74 Years | 0 (0.0%) | 20 (3.2%) |
| 75 Years and over | 114 (29.3%) | 108 (22.1%) |
Technology Access in Aibonito
Computing Device Access in Aibonito
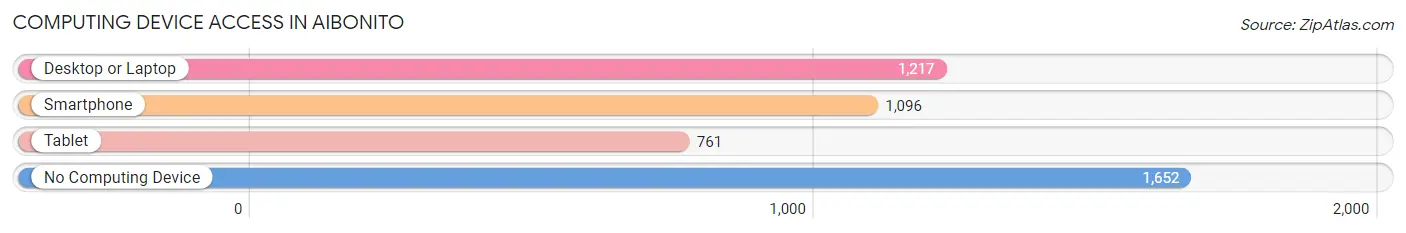
| Device Type | # Households | % Households |
| Desktop or Laptop | 1,217 | 37.3% |
| Smartphone | 1,096 | 33.6% |
| Tablet | 761 | 23.3% |
| No Computing Device | 1,652 | 50.7% |
| Total | 3,260 | 100.0% |
Internet Access in Aibonito
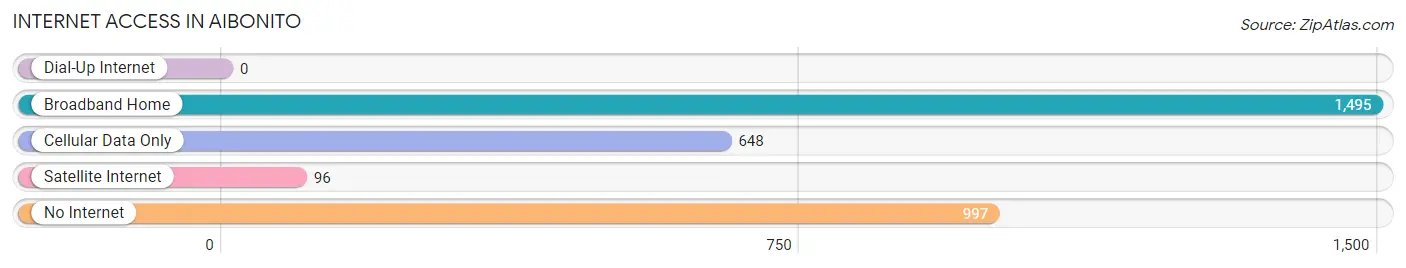
| Internet Type | # Households | % Households |
| Dial-Up Internet | 0 | 0.0% |
| Broadband Home | 1,495 | 45.9% |
| Cellular Data Only | 648 | 19.9% |
| Satellite Internet | 96 | 2.9% |
| No Internet | 997 | 30.6% |
| Total | 3,260 | 100.0% |
Aibonito Summary
Aibonito is a municipality located in the central mountain range of Puerto Rico. It is the highest municipality in the island, with an elevation of 3,000 feet above sea level. It is located in the south-central region of the island, about an hour and a half away from San Juan, the capital of Puerto Rico. Aibonito is known for its beautiful landscapes, its rich history, and its vibrant culture.
Geography
Aibonito is located in the central mountain range of Puerto Rico, in the south-central region of the island. It is bordered by the municipalities of Barranquitas to the north, Coamo to the south, Cayey to the east, and Orocovis to the west. The municipality covers an area of approximately 40 square miles, and is the highest municipality in Puerto Rico, with an elevation of 3,000 feet above sea level. The terrain is mostly mountainous, with some flat areas in the lower elevations. The highest point in the municipality is Cerro La Punta, which has an elevation of 4,390 feet.
The climate in Aibonito is tropical, with temperatures ranging from the mid-70s to the mid-80s Fahrenheit. The rainy season runs from May to November, with the heaviest rains occurring in September and October.
History
Aibonito was founded in 1824 by Don Francisco de Aibonito, a Spanish soldier who was stationed in the area. The town was originally called San Antonio de la Tuna, but was later changed to Aibonito in honor of its founder.
In the late 19th century, Aibonito became a popular tourist destination due to its beautiful landscapes and mild climate. The town was also known for its production of coffee, tobacco, and other agricultural products.
In the early 20th century, Aibonito became a center of political activity. It was the birthplace of the Puerto Rican Nationalist Party, and was the site of several protests and demonstrations against the US occupation of the island.
Economy
The economy of Aibonito is largely based on agriculture and tourism. The municipality is known for its production of coffee, tobacco, and other agricultural products. It is also a popular tourist destination, due to its beautiful landscapes and mild climate.
The municipality also has a number of small businesses, including restaurants, shops, and other services.
Demographics
As of the 2010 census, Aibonito had a population of 16,845. The population is mostly of Puerto Rican descent, with a small percentage of other ethnicities. The median age is 38.5 years, and the median household income is $17,845.
The majority of the population is Roman Catholic, with a small percentage of other religious affiliations. Spanish is the primary language spoken in Aibonito, although English is also spoken by some of the population.
Conclusion
Aibonito is a municipality located in the central mountain range of Puerto Rico. It is the highest municipality in the island, with an elevation of 3,000 feet above sea level. It is known for its beautiful landscapes, its rich history, and its vibrant culture. The economy of Aibonito is largely based on agriculture and tourism, and the population is mostly of Puerto Rican descent. Aibonito is a popular tourist destination, due to its beautiful landscapes and mild climate, and is also a center of political activity.
Common Questions
What is Per Capita Income in Aibonito?
Per Capita income in Aibonito is $12,622.
What is the Median Family Income in Aibonito?
Median Family Income in Aibonito is $24,740.
What is the Median Household income in Aibonito?
Median Household Income in Aibonito is $18,359.
What is Income or Wage Gap in Aibonito?
Income or Wage Gap in Aibonito is 7.7%.
Women in Aibonito earn 92.3 cents for every dollar earned by a man.
What is Family Income Deficit in Aibonito?
Family Income Deficit in Aibonito is $11,542.
Families that are below poverty line in Aibonito earn $11,542 less on average than the poverty threshold level.
What is Inequality or Gini Index in Aibonito?
Inequality or Gini Index in Aibonito is 0.52.
What is the Total Population of Aibonito?
Total Population of Aibonito is 8,596.
What is the Total Male Population of Aibonito?
Total Male Population of Aibonito is 4,053.
What is the Total Female Population of Aibonito?
Total Female Population of Aibonito is 4,543.
What is the Ratio of Males per 100 Females in Aibonito?
There are 89.21 Males per 100 Females in Aibonito.
What is the Ratio of Females per 100 Males in Aibonito?
There are 112.09 Females per 100 Males in Aibonito.
What is the Median Population Age in Aibonito?
Median Population Age in Aibonito is 43.3 Years.
What is the Average Family Size in Aibonito
Average Family Size in Aibonito is 3.7 People.
What is the Average Household Size in Aibonito
Average Household Size in Aibonito is 2.6 People.
How Large is the Labor Force in Aibonito?
There are 2,710 People in the Labor Forcein in Aibonito.
What is the Percentage of People in the Labor Force in Aibonito?
37.5% of People are in the Labor Force in Aibonito.
What is the Unemployment Rate in Aibonito?
Unemployment Rate in Aibonito is 8.2%.