Loiza, PR Map & Demographics
Loiza Overview
$9,047
PER CAPITA INCOME
$15,808
AVG FAMILY INCOME
$12,104
AVG HOUSEHOLD INCOME
27.9%
WAGE / INCOME GAP [ % ]
72.1¢/ $1
WAGE / INCOME GAP [ $ ]
0.53
INEQUALITY / GINI INDEX
2,714
TOTAL POPULATION
1,122
MALE POPULATION
1,592
FEMALE POPULATION
70.48
MALES / 100 FEMALES
141.89
FEMALES / 100 MALES
44.1
MEDIAN AGE
3.0
AVG FAMILY SIZE
2.3
AVG HOUSEHOLD SIZE
1,053
LABOR FORCE [ PEOPLE ]
46.2%
PERCENT IN LABOR FORCE
33.2%
UNEMPLOYMENT RATE
Loiza Zip Codes
Income in Loiza
Income Overview in Loiza
Per Capita Income in Loiza is $9,047, while median incomes of families and households are $15,808 and $12,104 respectively.
| Characteristic | Number | Measure |
| Per Capita Income | 2,714 | $9,047 |
| Median Family Income | 720 | $15,808 |
| Mean Family Income | 720 | $22,637 |
| Median Household Income | 1,179 | $12,104 |
| Mean Household Income | 1,179 | $19,498 |
| Income Deficit | 720 | $0 |
| Wage / Income Gap (%) | 2,714 | 27.95% |
| Wage / Income Gap ($) | 2,714 | 72.05¢ per $1 |
| Gini / Inequality Index | 2,714 | 0.53 |
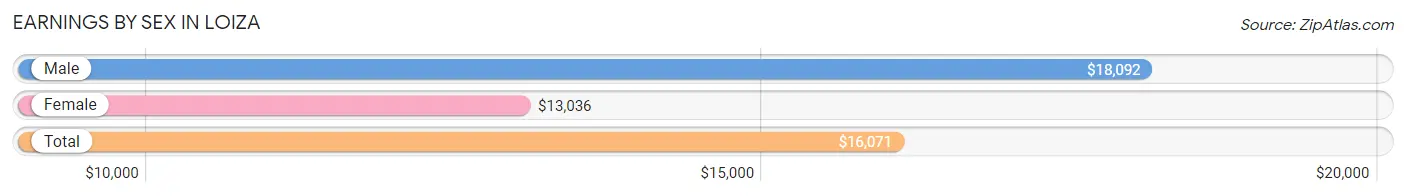
Earnings by Sex in Loiza
Average Earnings in Loiza are $16,071, $18,092 for men and $13,036 for women, a difference of 28.0%.
| Sex | Number | Average Earnings |
| Male | 292 (36.0%) | $18,092 |
| Female | 518 (63.9%) | $13,036 |
| Total | 810 (100.0%) | $16,071 |
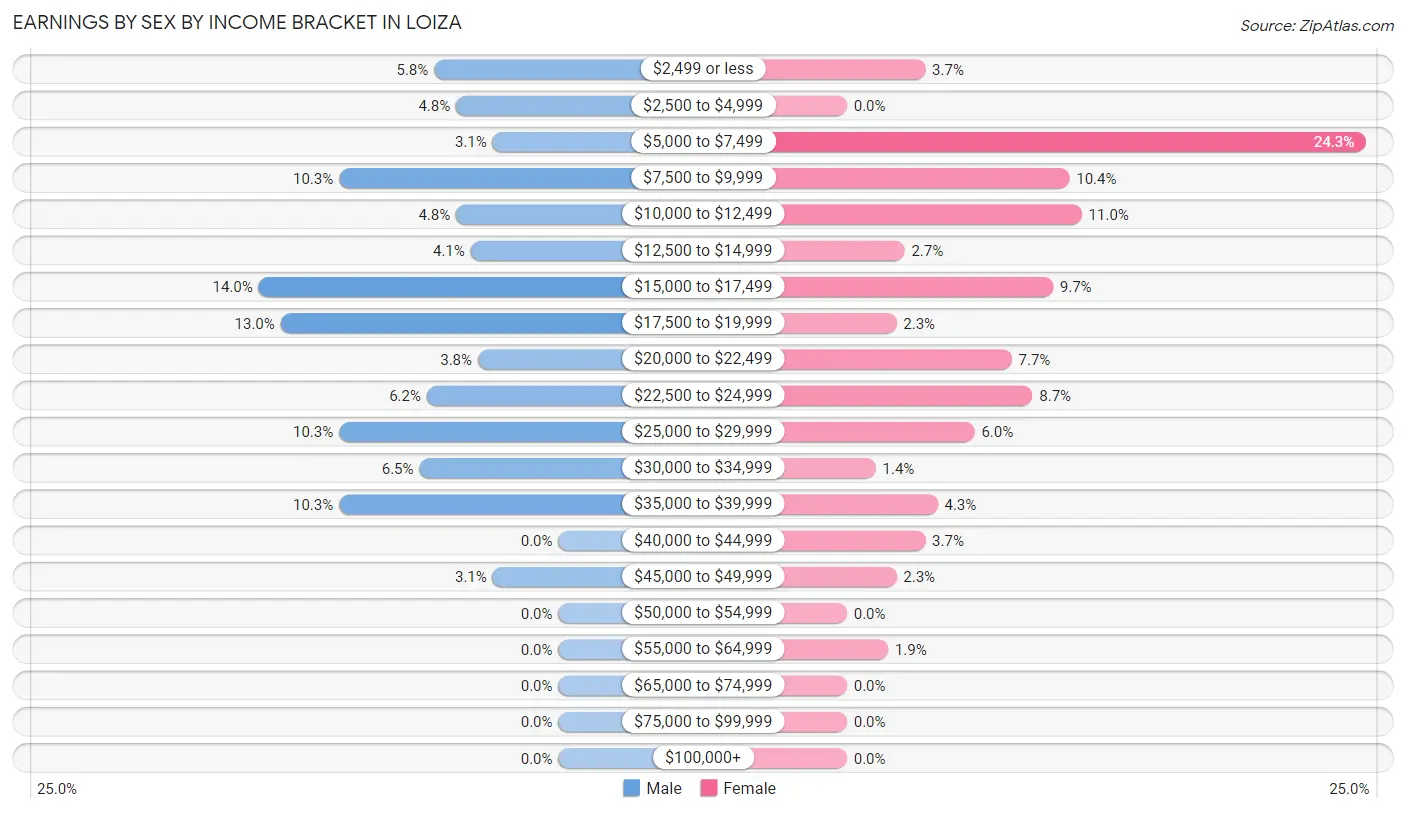
Earnings by Sex by Income Bracket in Loiza
The most common earnings brackets in Loiza are $15,000 to $17,499 for men (41 | 14.0%) and $5,000 to $7,499 for women (126 | 24.3%).
| Income | Male | Female |
| $2,499 or less | 17 (5.8%) | 19 (3.7%) |
| $2,500 to $4,999 | 14 (4.8%) | 0 (0.0%) |
| $5,000 to $7,499 | 9 (3.1%) | 126 (24.3%) |
| $7,500 to $9,999 | 30 (10.3%) | 54 (10.4%) |
| $10,000 to $12,499 | 14 (4.8%) | 57 (11.0%) |
| $12,500 to $14,999 | 12 (4.1%) | 14 (2.7%) |
| $15,000 to $17,499 | 41 (14.0%) | 50 (9.7%) |
| $17,500 to $19,999 | 38 (13.0%) | 12 (2.3%) |
| $20,000 to $22,499 | 11 (3.8%) | 40 (7.7%) |
| $22,500 to $24,999 | 18 (6.2%) | 45 (8.7%) |
| $25,000 to $29,999 | 30 (10.3%) | 31 (6.0%) |
| $30,000 to $34,999 | 19 (6.5%) | 7 (1.3%) |
| $35,000 to $39,999 | 30 (10.3%) | 22 (4.3%) |
| $40,000 to $44,999 | 0 (0.0%) | 19 (3.7%) |
| $45,000 to $49,999 | 9 (3.1%) | 12 (2.3%) |
| $50,000 to $54,999 | 0 (0.0%) | 0 (0.0%) |
| $55,000 to $64,999 | 0 (0.0%) | 10 (1.9%) |
| $65,000 to $74,999 | 0 (0.0%) | 0 (0.0%) |
| $75,000 to $99,999 | 0 (0.0%) | 0 (0.0%) |
| $100,000+ | 0 (0.0%) | 0 (0.0%) |
| Total | 292 (100.0%) | 518 (100.0%) |
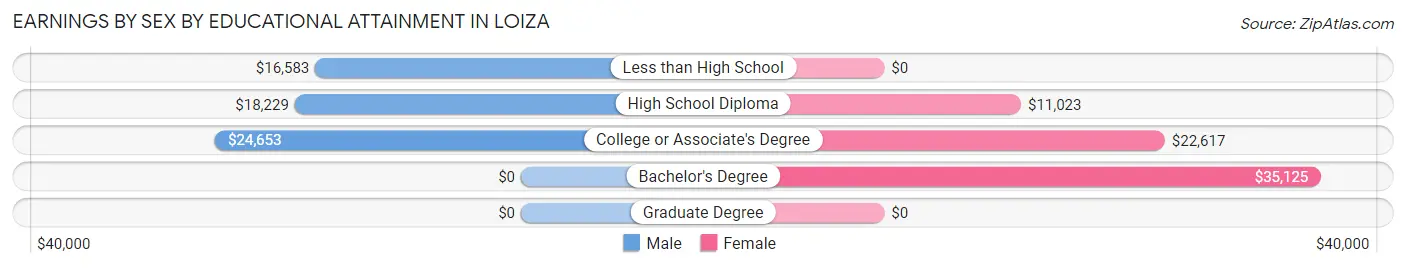
Earnings by Sex by Educational Attainment in Loiza
Average earnings in Loiza are $18,651 for men and $17,125 for women, a difference of 8.2%. Men with an educational attainment of college or associate's degree enjoy the highest average annual earnings of $24,653, while those with less than high school education earn the least with $16,583. Women with an educational attainment of bachelor's degree earn the most with the average annual earnings of $35,125, while those with high school diploma education have the smallest earnings of $11,023.
| Educational Attainment | Male Income | Female Income |
| Less than High School | $16,583 | $0 |
| High School Diploma | $18,229 | $11,023 |
| College or Associate's Degree | $24,653 | $22,617 |
| Bachelor's Degree | - | - |
| Graduate Degree | - | - |
| Total | $18,651 | $17,125 |
Family Income in Loiza
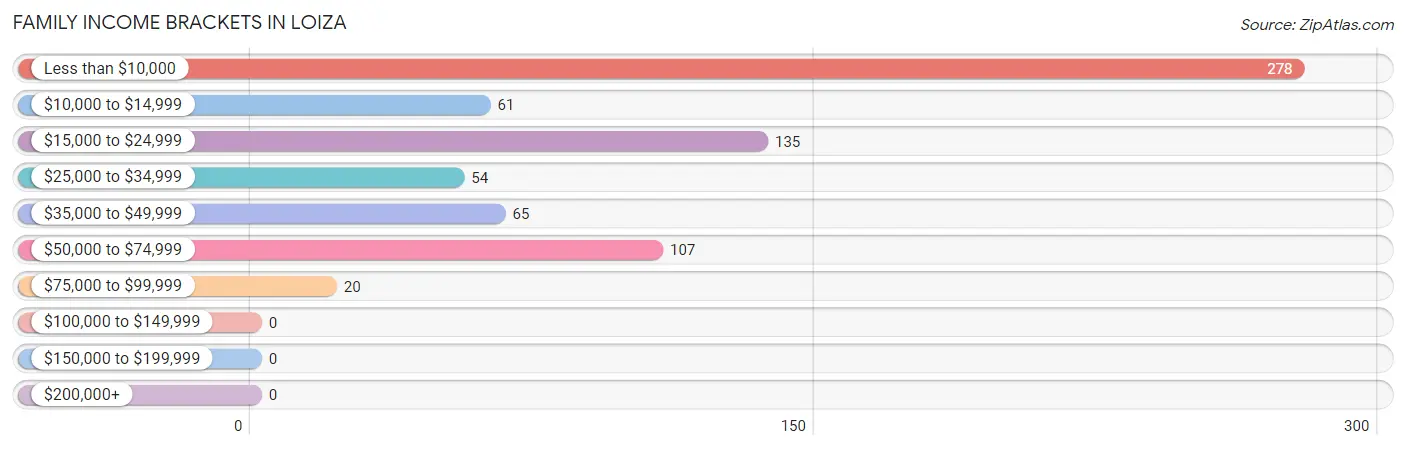
Family Income Brackets in Loiza
According to the Loiza family income data, there are 278 families falling into the less than $10,000 income range, which is the most common income bracket and makes up 38.6% of all families.
| Income Bracket | # Families | % Families |
| Less than $10,000 | 278 | 38.6% |
| $10,000 to $14,999 | 61 | 8.5% |
| $15,000 to $24,999 | 135 | 18.8% |
| $25,000 to $34,999 | 54 | 7.5% |
| $35,000 to $49,999 | 65 | 9.0% |
| $50,000 to $74,999 | 107 | 14.9% |
| $75,000 to $99,999 | 20 | 2.8% |
| $100,000 to $149,999 | 0 | 0.0% |
| $150,000 to $199,999 | 0 | 0.0% |
| $200,000+ | 0 | 0.0% |
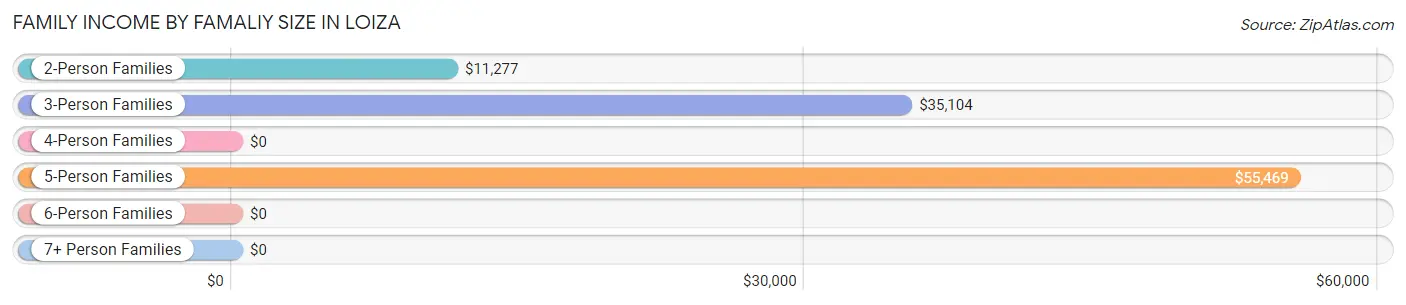
Family Income by Famaliy Size in Loiza
5-person families (49 | 6.8%) account for the highest median family income in Loiza with $55,469 per family, while 3-person families (105 | 14.6%) have the highest median income of $11,701 per family member.
| Income Bracket | # Families | Median Income |
| 2-Person Families | 450 (62.5%) | $11,277 |
| 3-Person Families | 105 (14.6%) | $35,104 |
| 4-Person Families | 116 (16.1%) | $0 |
| 5-Person Families | 49 (6.8%) | $55,469 |
| 6-Person Families | 0 (0.0%) | $0 |
| 7+ Person Families | 0 (0.0%) | $0 |
| Total | 720 (100.0%) | $15,808 |
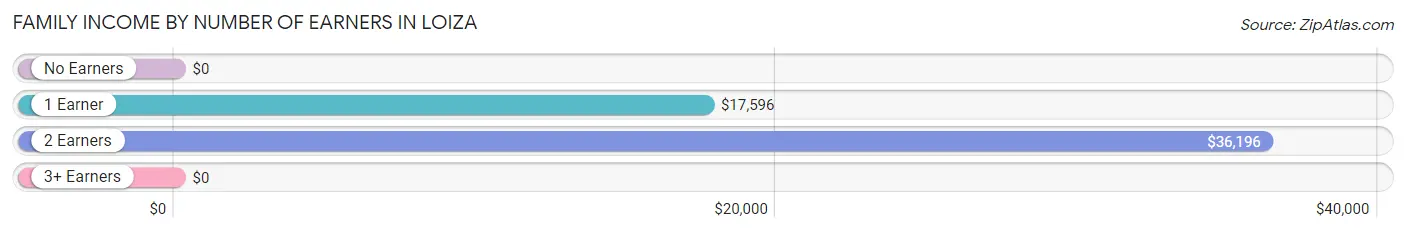
Family Income by Number of Earners in Loiza
| Number of Earners | # Families | Median Income |
| No Earners | 321 (44.6%) | $0 |
| 1 Earner | 276 (38.3%) | $17,596 |
| 2 Earners | 102 (14.2%) | $36,196 |
| 3+ Earners | 21 (2.9%) | $0 |
| Total | 720 (100.0%) | $15,808 |
Household Income in Loiza
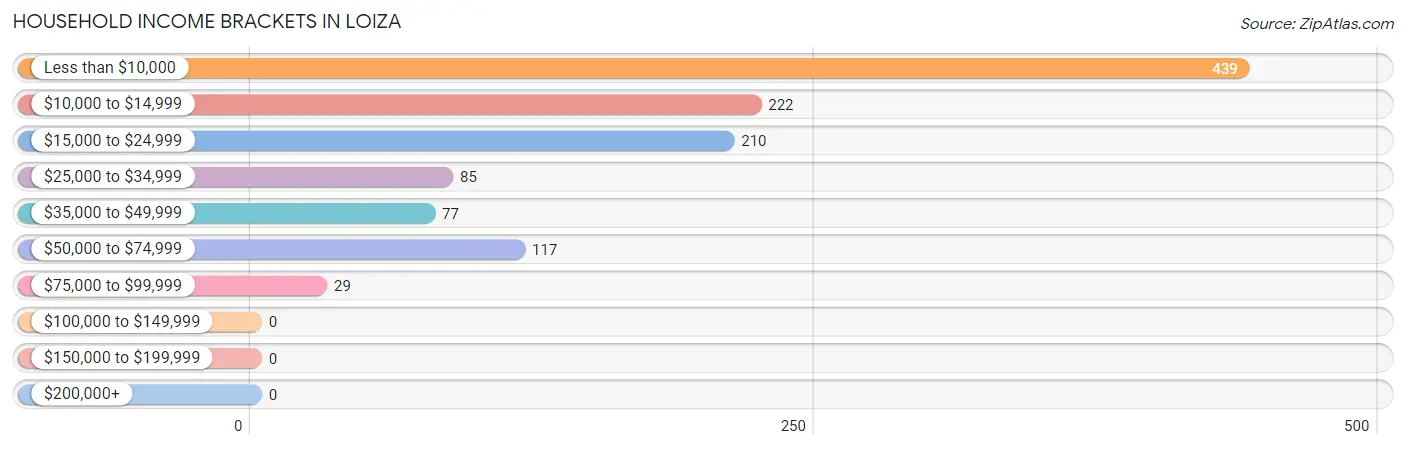
Household Income Brackets in Loiza
With 439 households falling in the category, the less than $10,000 income range is the most frequent in Loiza, accounting for 37.2% of all households.
| Income Bracket | # Households | % Households |
| Less than $10,000 | 439 | 37.2% |
| $10,000 to $14,999 | 222 | 18.8% |
| $15,000 to $24,999 | 210 | 17.8% |
| $25,000 to $34,999 | 85 | 7.2% |
| $35,000 to $49,999 | 77 | 6.5% |
| $50,000 to $74,999 | 117 | 9.9% |
| $75,000 to $99,999 | 29 | 2.5% |
| $100,000 to $149,999 | 0 | 0.0% |
| $150,000 to $199,999 | 0 | 0.0% |
| $200,000+ | 0 | 0.0% |
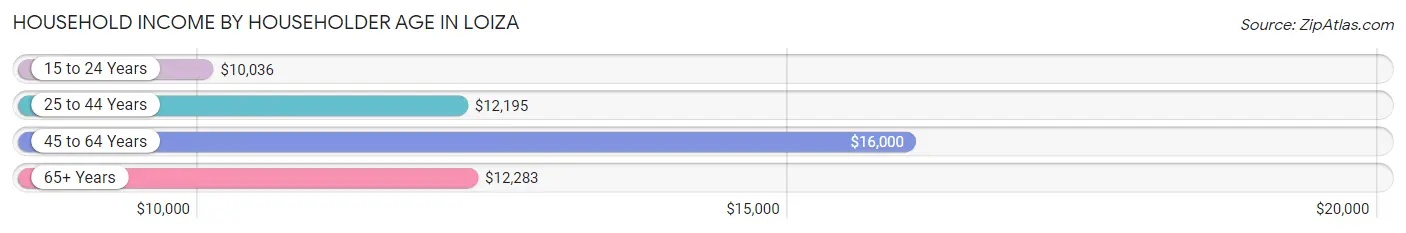
Household Income by Householder Age in Loiza
The median household income in Loiza is $12,104, with the highest median household income of $16,000 found in the 45 to 64 years age bracket for the primary householder. A total of 364 households (30.9%) fall into this category. Meanwhile, the 15 to 24 years age bracket for the primary householder has the lowest median household income of $10,036, with 69 households (5.9%) in this group.
| Income Bracket | # Households | Median Income |
| 15 to 24 Years | 69 (5.9%) | $10,036 |
| 25 to 44 Years | 302 (25.6%) | $12,195 |
| 45 to 64 Years | 364 (30.9%) | $16,000 |
| 65+ Years | 444 (37.7%) | $12,283 |
| Total | 1,179 (100.0%) | $12,104 |
Poverty in Loiza
Income Below Poverty by Sex and Age in Loiza
With 57.7% poverty level for males and 63.5% for females among the residents of Loiza, under 5 year old males and under 5 year old females are the most vulnerable to poverty, with 18 males (100.0%) and 39 females (100.0%) in their respective age groups living below the poverty level.
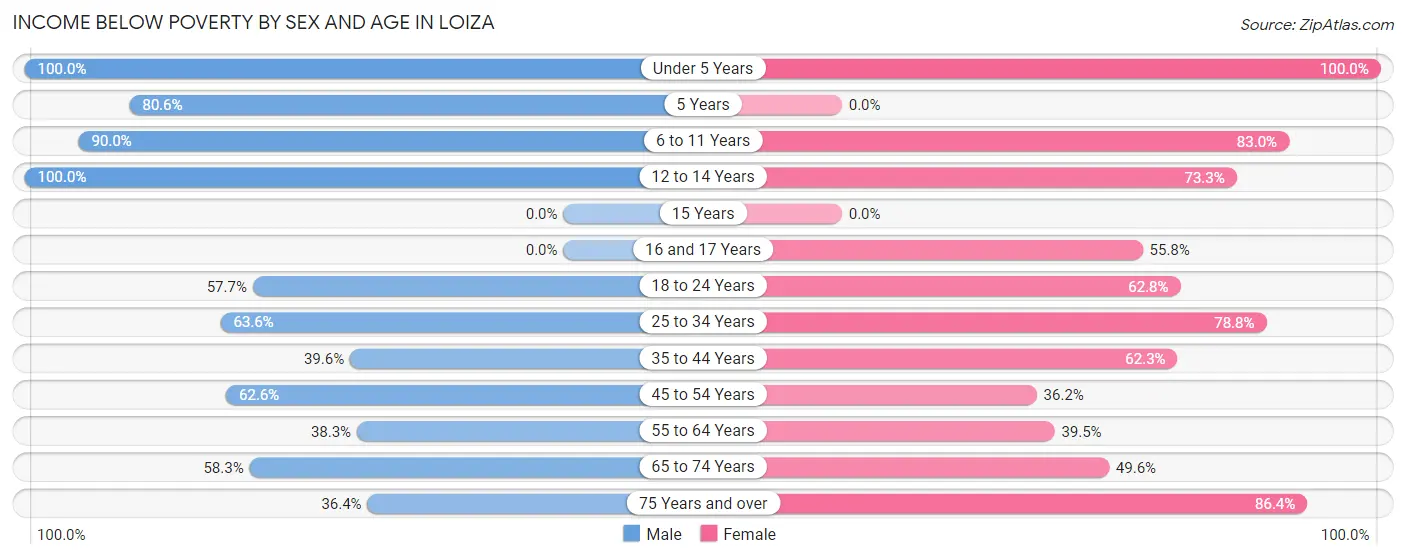
| Age Bracket | Male | Female |
| Under 5 Years | 18 (100.0%) | 39 (100.0%) |
| 5 Years | 29 (80.6%) | 0 (0.0%) |
| 6 to 11 Years | 54 (90.0%) | 78 (83.0%) |
| 12 to 14 Years | 75 (100.0%) | 74 (73.3%) |
| 15 Years | 0 (0.0%) | 0 (0.0%) |
| 16 and 17 Years | 0 (0.0%) | 43 (55.8%) |
| 18 to 24 Years | 79 (57.7%) | 120 (62.8%) |
| 25 to 34 Years | 42 (63.6%) | 156 (78.8%) |
| 35 to 44 Years | 40 (39.6%) | 109 (62.3%) |
| 45 to 54 Years | 129 (62.6%) | 68 (36.2%) |
| 55 to 64 Years | 59 (38.3%) | 75 (39.5%) |
| 65 to 74 Years | 67 (58.3%) | 59 (49.6%) |
| 75 Years and over | 48 (36.4%) | 190 (86.4%) |
| Total | 640 (57.7%) | 1,011 (63.5%) |
Income Above Poverty by Sex and Age in Loiza
According to the poverty statistics in Loiza, males aged 16 and 17 years and females aged 45 to 54 years are the age groups that are most secure financially, with 100.0% of males and 63.8% of females in these age groups living above the poverty line.
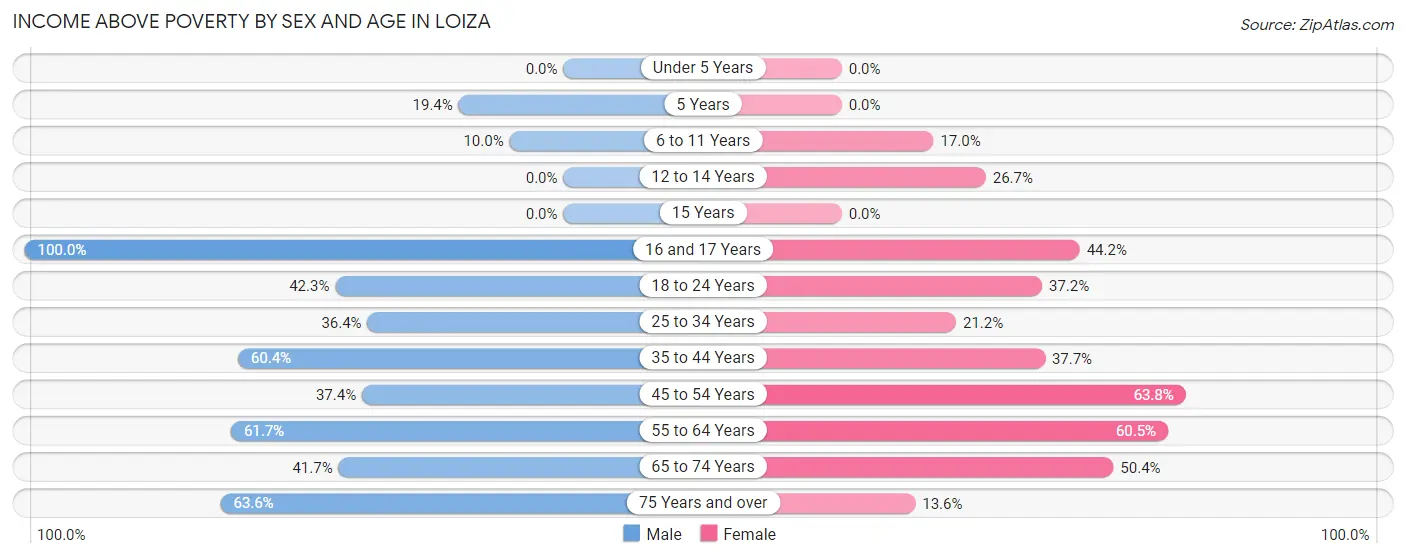
| Age Bracket | Male | Female |
| Under 5 Years | 0 (0.0%) | 0 (0.0%) |
| 5 Years | 7 (19.4%) | 0 (0.0%) |
| 6 to 11 Years | 6 (10.0%) | 16 (17.0%) |
| 12 to 14 Years | 0 (0.0%) | 27 (26.7%) |
| 15 Years | 0 (0.0%) | 0 (0.0%) |
| 16 and 17 Years | 10 (100.0%) | 34 (44.2%) |
| 18 to 24 Years | 58 (42.3%) | 71 (37.2%) |
| 25 to 34 Years | 24 (36.4%) | 42 (21.2%) |
| 35 to 44 Years | 61 (60.4%) | 66 (37.7%) |
| 45 to 54 Years | 77 (37.4%) | 120 (63.8%) |
| 55 to 64 Years | 95 (61.7%) | 115 (60.5%) |
| 65 to 74 Years | 48 (41.7%) | 60 (50.4%) |
| 75 Years and over | 84 (63.6%) | 30 (13.6%) |
| Total | 470 (42.3%) | 581 (36.5%) |
Income Below Poverty Among Married-Couple Families in Loiza
The poverty statistics for married-couple families in Loiza show that 35.4% or 87 of the total 246 families live below the poverty line. Families with 1 or 2 children have the highest poverty rate of 51.8%, comprising of 43 families. On the other hand, families with no children have the lowest poverty rate of 27.0%, which includes 44 families.
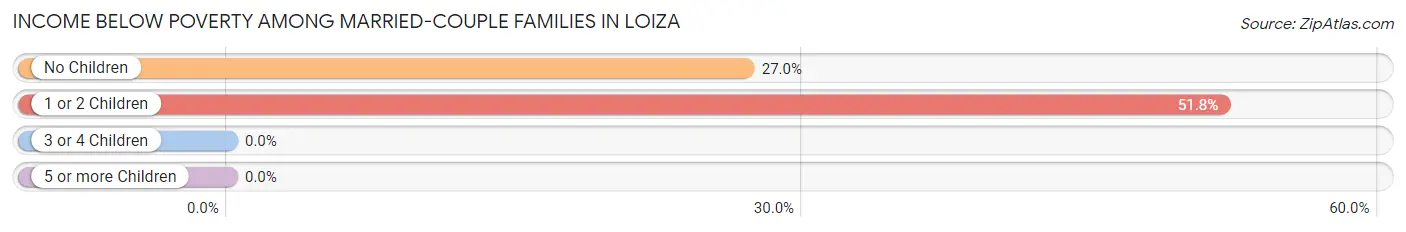
| Children | Above Poverty | Below Poverty |
| No Children | 119 (73.0%) | 44 (27.0%) |
| 1 or 2 Children | 40 (48.2%) | 43 (51.8%) |
| 3 or 4 Children | 0 (0.0%) | 0 (0.0%) |
| 5 or more Children | 0 (0.0%) | 0 (0.0%) |
| Total | 159 (64.6%) | 87 (35.4%) |
Income Below Poverty Among Single-Parent Households in Loiza
According to the poverty data in Loiza, 57.5% or 27 single-father households and 78.9% or 337 single-mother households are living below the poverty line. Among single-father households, those with 1 or 2 children have the highest poverty rate, with 10 households (100.0%) experiencing poverty. Likewise, among single-mother households, those with 3 or 4 children have the highest poverty rate, with 42 households (100.0%) falling below the poverty line.
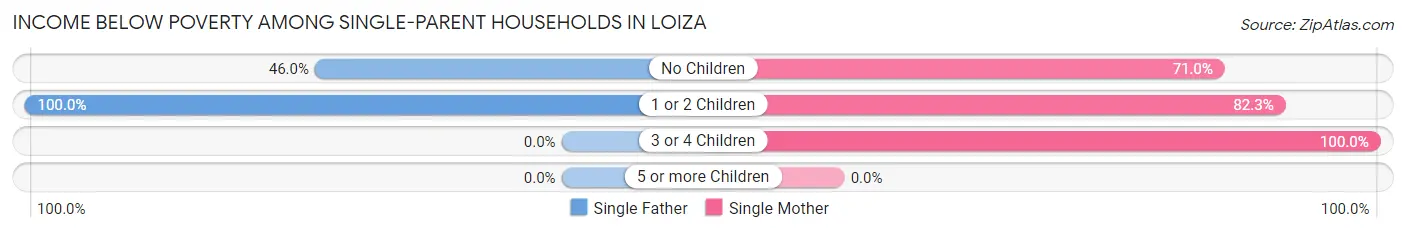
| Children | Single Father | Single Mother |
| No Children | 17 (46.0%) | 137 (71.0%) |
| 1 or 2 Children | 10 (100.0%) | 158 (82.3%) |
| 3 or 4 Children | 0 (0.0%) | 42 (100.0%) |
| 5 or more Children | 0 (0.0%) | 0 (0.0%) |
| Total | 27 (57.5%) | 337 (78.9%) |
Income Below Poverty Among Married-Couple vs Single-Parent Households in Loiza
The poverty data for Loiza shows that 87 of the married-couple family households (35.4%) and 364 of the single-parent households (76.8%) are living below the poverty level. Within the married-couple family households, those with 1 or 2 children have the highest poverty rate, with 43 households (51.8%) falling below the poverty line. Among the single-parent households, those with 3 or 4 children have the highest poverty rate, with 42 household (100.0%) living below poverty.
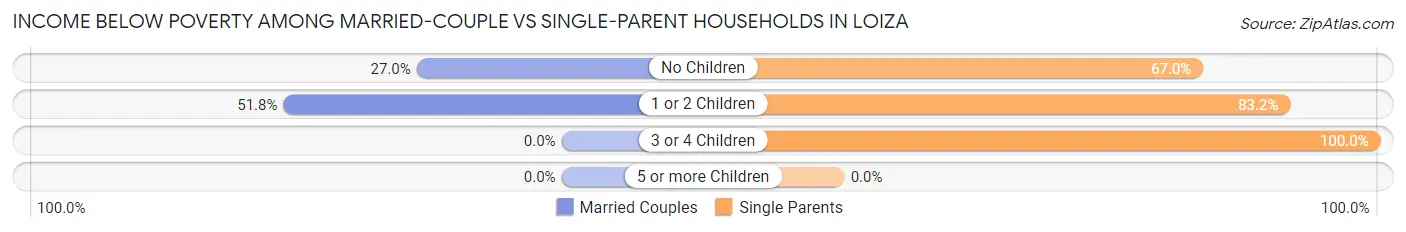
| Children | Married-Couple Families | Single-Parent Households |
| No Children | 44 (27.0%) | 154 (67.0%) |
| 1 or 2 Children | 43 (51.8%) | 168 (83.2%) |
| 3 or 4 Children | 0 (0.0%) | 42 (100.0%) |
| 5 or more Children | 0 (0.0%) | 0 (0.0%) |
| Total | 87 (35.4%) | 364 (76.8%) |
Race in Loiza
The most populous races in Loiza are Hispanic or Latino (2,714 | 100.0%), Some other Race (1,216 | 44.8%), and Black / African American (893 | 32.9%).
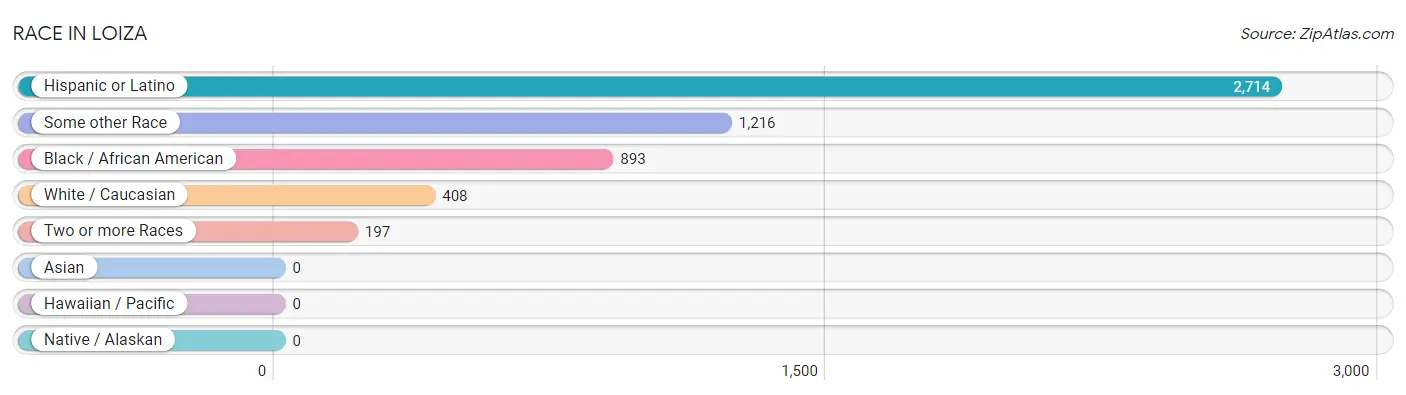
| Race | # Population | % Population |
| Asian | 0 | 0.0% |
| Black / African American | 893 | 32.9% |
| Hawaiian / Pacific | 0 | 0.0% |
| Hispanic or Latino | 2,714 | 100.0% |
| Native / Alaskan | 0 | 0.0% |
| White / Caucasian | 408 | 15.0% |
| Two or more Races | 197 | 7.3% |
| Some other Race | 1,216 | 44.8% |
| Total | 2,714 | 100.0% |
Ancestry in Loiza
The most populous ancestries reported in Loiza are Puerto Rican (2,650 | 97.6%), Dominican (42 | 1.5%), American (19 | 0.7%), Colombian (16 | 0.6%), and South American (16 | 0.6%), together accounting for 101.1% of all Loiza residents.
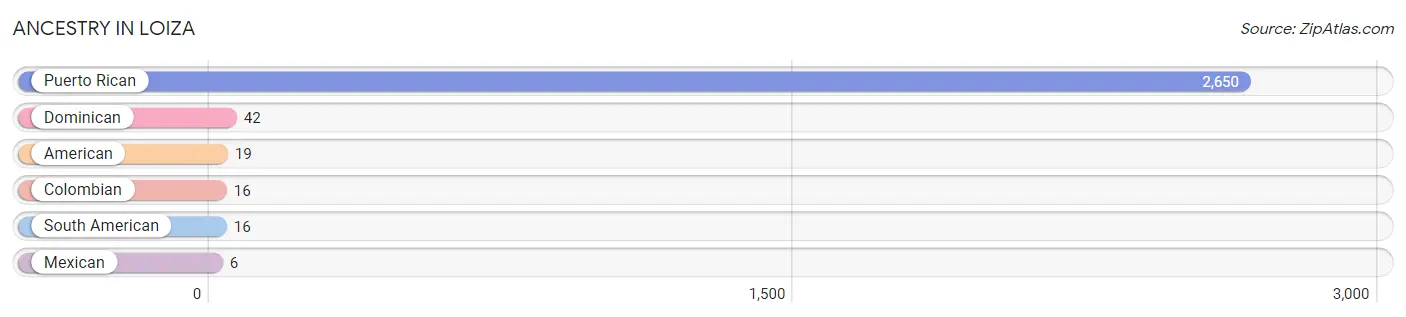
| Ancestry | # Population | % Population |
| American | 19 | 0.7% |
| Colombian | 16 | 0.6% |
| Dominican | 42 | 1.5% |
| Mexican | 6 | 0.2% |
| Puerto Rican | 2,650 | 97.6% |
| South American | 16 | 0.6% | View All 6 Rows |
Immigrants in Loiza

| Immigration Origin | # Population | % Population | View All 0 Rows |
Sex and Age in Loiza
Sex and Age in Loiza
The most populous age groups in Loiza are 50 to 54 Years (117 | 10.4%) for men and 10 to 14 Years (157 | 9.9%) for women.
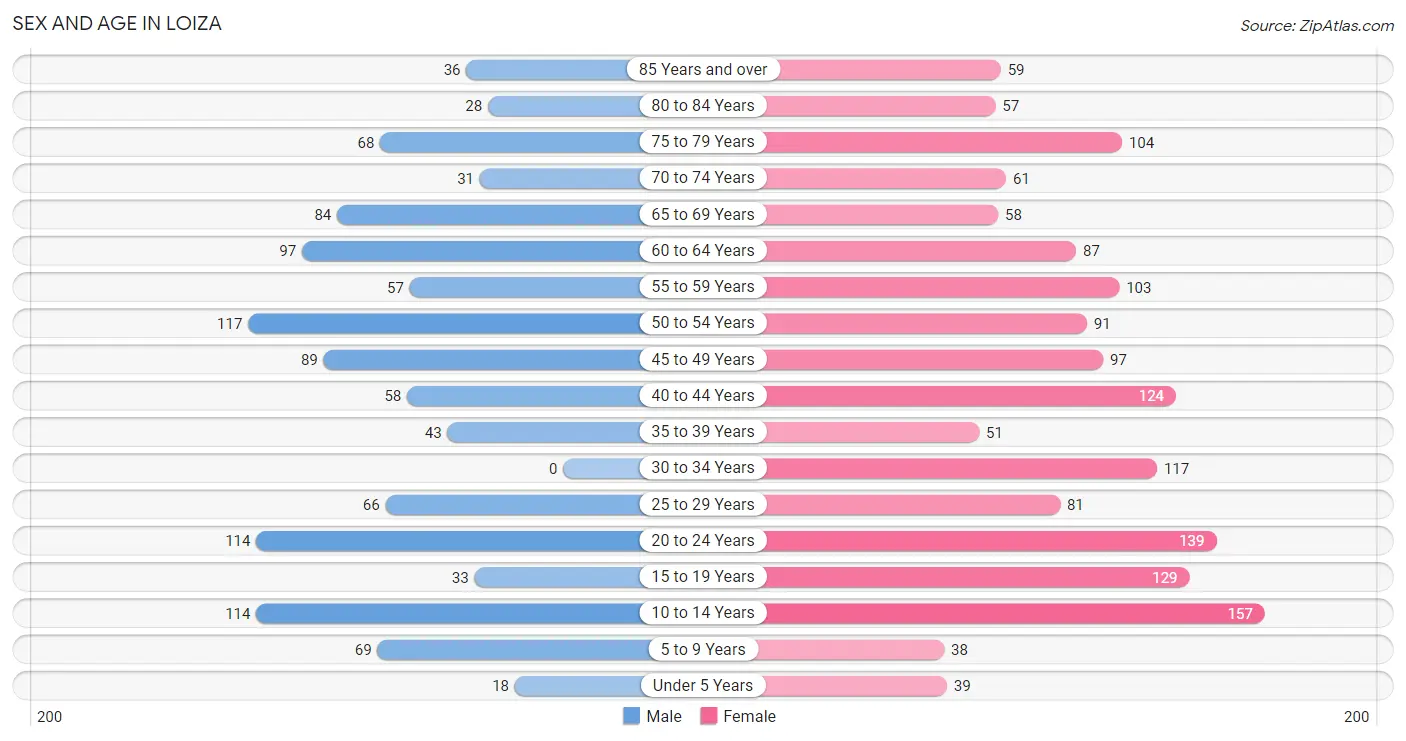
| Age Bracket | Male | Female |
| Under 5 Years | 18 (1.6%) | 39 (2.5%) |
| 5 to 9 Years | 69 (6.1%) | 38 (2.4%) |
| 10 to 14 Years | 114 (10.2%) | 157 (9.9%) |
| 15 to 19 Years | 33 (2.9%) | 129 (8.1%) |
| 20 to 24 Years | 114 (10.2%) | 139 (8.7%) |
| 25 to 29 Years | 66 (5.9%) | 81 (5.1%) |
| 30 to 34 Years | 0 (0.0%) | 117 (7.3%) |
| 35 to 39 Years | 43 (3.8%) | 51 (3.2%) |
| 40 to 44 Years | 58 (5.2%) | 124 (7.8%) |
| 45 to 49 Years | 89 (7.9%) | 97 (6.1%) |
| 50 to 54 Years | 117 (10.4%) | 91 (5.7%) |
| 55 to 59 Years | 57 (5.1%) | 103 (6.5%) |
| 60 to 64 Years | 97 (8.6%) | 87 (5.5%) |
| 65 to 69 Years | 84 (7.5%) | 58 (3.6%) |
| 70 to 74 Years | 31 (2.8%) | 61 (3.8%) |
| 75 to 79 Years | 68 (6.1%) | 104 (6.5%) |
| 80 to 84 Years | 28 (2.5%) | 57 (3.6%) |
| 85 Years and over | 36 (3.2%) | 59 (3.7%) |
| Total | 1,122 (100.0%) | 1,592 (100.0%) |
Families and Households in Loiza
Median Family Size in Loiza
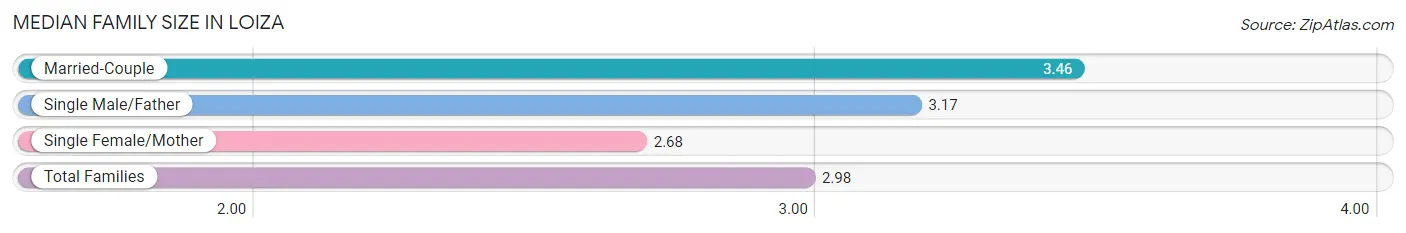
The median family size in Loiza is 2.98 persons per family, with married-couple families (246 | 34.2%) accounting for the largest median family size of 3.46 persons per family. On the other hand, single female/mother families (427 | 59.3%) represent the smallest median family size with 2.68 persons per family.
| Family Type | # Families | Family Size |
| Married-Couple | 246 (34.2%) | 3.46 |
| Single Male/Father | 47 (6.5%) | 3.17 |
| Single Female/Mother | 427 (59.3%) | 2.68 |
| Total Families | 720 (100.0%) | 2.98 |
Median Household Size in Loiza
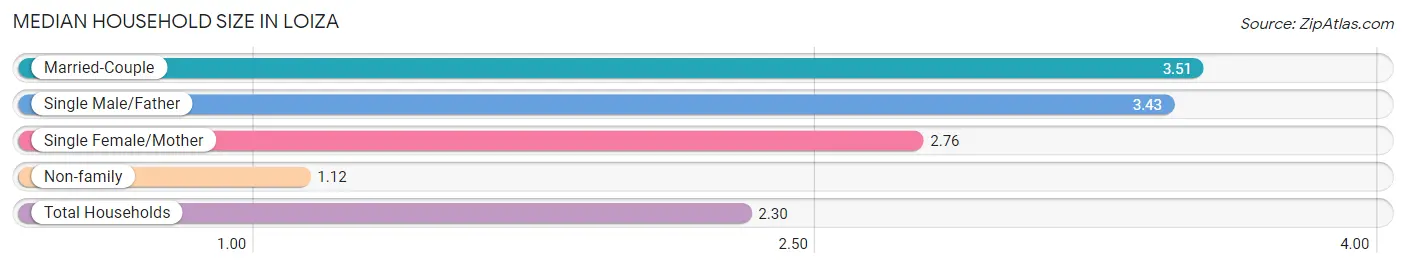
The median household size in Loiza is 2.30 persons per household, with married-couple households (246 | 20.9%) accounting for the largest median household size of 3.51 persons per household. non-family households (459 | 38.9%) represent the smallest median household size with 1.12 persons per household.
| Household Type | # Households | Household Size |
| Married-Couple | 246 (20.9%) | 3.51 |
| Single Male/Father | 47 (4.0%) | 3.43 |
| Single Female/Mother | 427 (36.2%) | 2.76 |
| Non-family | 459 (38.9%) | 1.12 |
| Total Households | 1,179 (100.0%) | 2.30 |
Household Size by Marriage Status in Loiza
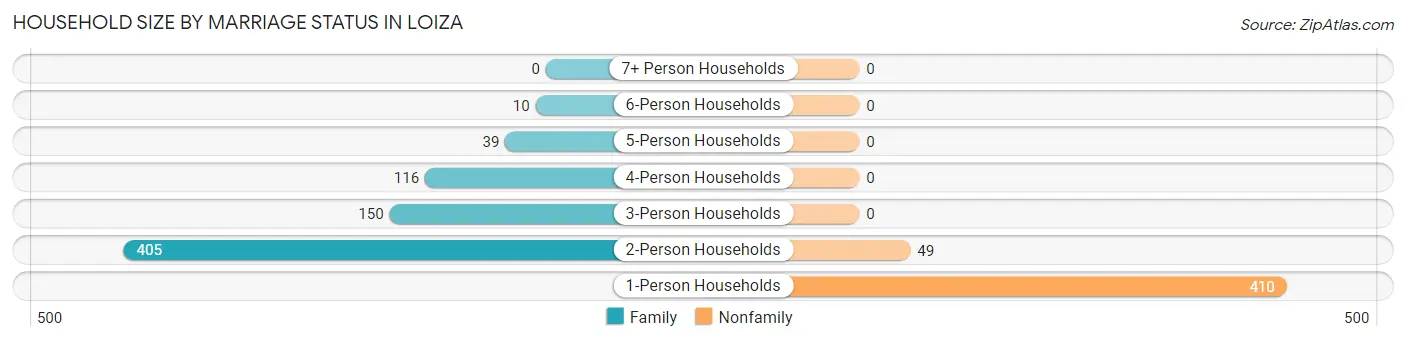
Out of a total of 1,179 households in Loiza, 720 (61.1%) are family households, while 459 (38.9%) are nonfamily households. The most numerous type of family households are 2-person households, comprising 405, and the most common type of nonfamily households are 1-person households, comprising 410.
| Household Size | Family Households | Nonfamily Households |
| 1-Person Households | - | 410 (34.8%) |
| 2-Person Households | 405 (34.4%) | 49 (4.2%) |
| 3-Person Households | 150 (12.7%) | 0 (0.0%) |
| 4-Person Households | 116 (9.8%) | 0 (0.0%) |
| 5-Person Households | 39 (3.3%) | 0 (0.0%) |
| 6-Person Households | 10 (0.9%) | 0 (0.0%) |
| 7+ Person Households | 0 (0.0%) | 0 (0.0%) |
| Total | 720 (61.1%) | 459 (38.9%) |
Female Fertility in Loiza
Fertility by Age in Loiza
| Age Bracket | Women with Births | Births / 1,000 Women |
| 15 to 19 years | 0 (0.0%) | 0.0 |
| 20 to 34 years | 0 (0.0%) | 0.0 |
| 35 to 50 years | 0 (0.0%) | 0.0 |
| Total | 0 (0.0%) | 0.0 |
Fertility by Age by Marriage Status in Loiza
| Age Bracket | Married | Unmarried |
| 15 to 19 years | 0 (0.0%) | 0 (0.0%) |
| 20 to 34 years | 0 (0.0%) | 0 (0.0%) |
| 35 to 50 years | 0 (0.0%) | 0 (0.0%) |
| Total | 0 (0.0%) | 0 (0.0%) |
Fertility by Education in Loiza
| Educational Attainment | Women with Births | Births / 1,000 Women |
| Less than High School | 0 (0.0%) | 0.0 |
| High School Diploma | 0 (0.0%) | 0.0 |
| College or Associate's Degree | 0 (0.0%) | 0.0 |
| Bachelor's Degree | 0 (0.0%) | 0.0 |
| Graduate Degree | 0 (0.0%) | 0.0 |
| Total | 0 (0.0%) | 0.0 |
Fertility by Education by Marriage Status in Loiza
| Educational Attainment | Married | Unmarried |
| Less than High School | 0 (0.0%) | 0 (0.0%) |
| High School Diploma | 0 (0.0%) | 0 (0.0%) |
| College or Associate's Degree | 0 (0.0%) | 0 (0.0%) |
| Bachelor's Degree | 0 (0.0%) | 0 (0.0%) |
| Graduate Degree | 0 (0.0%) | 0 (0.0%) |
| Total | 0 (0.0%) | 0 (0.0%) |
Employment Characteristics in Loiza
Employment by Class of Employer in Loiza
Among the 693 employed individuals in Loiza, private company employees (406 | 58.6%), state government employees (140 | 20.2%), and self-employed (not incorporated) (64 | 9.2%) make up the most common classes of employment.
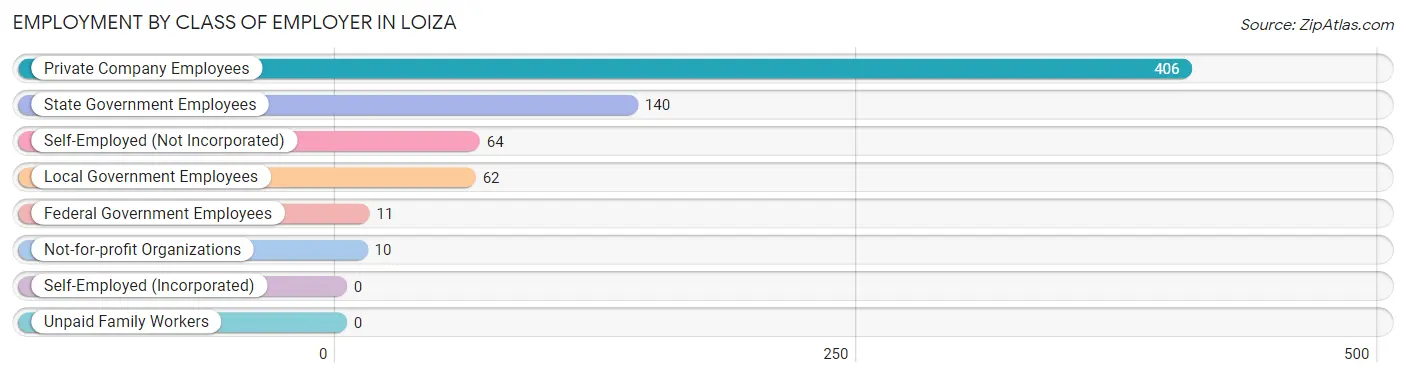
| Employer Class | # Employees | % Employees |
| Private Company Employees | 406 | 58.6% |
| Self-Employed (Incorporated) | 0 | 0.0% |
| Self-Employed (Not Incorporated) | 64 | 9.2% |
| Not-for-profit Organizations | 10 | 1.4% |
| Local Government Employees | 62 | 8.9% |
| State Government Employees | 140 | 20.2% |
| Federal Government Employees | 11 | 1.6% |
| Unpaid Family Workers | 0 | 0.0% |
| Total | 693 | 100.0% |
Employment Status by Age in Loiza
According to the labor force statistics for Loiza, out of the total population over 16 years of age (2,279), 46.2% or 1,053 individuals are in the labor force, with 33.2% or 350 of them unemployed. The age group with the highest labor force participation rate is 35 to 44 years, with 83.3% or 230 individuals in the labor force. Within the labor force, the 16 to 19 years age range has the highest percentage of unemployed individuals, with 45.7% or 16 of them being unemployed.
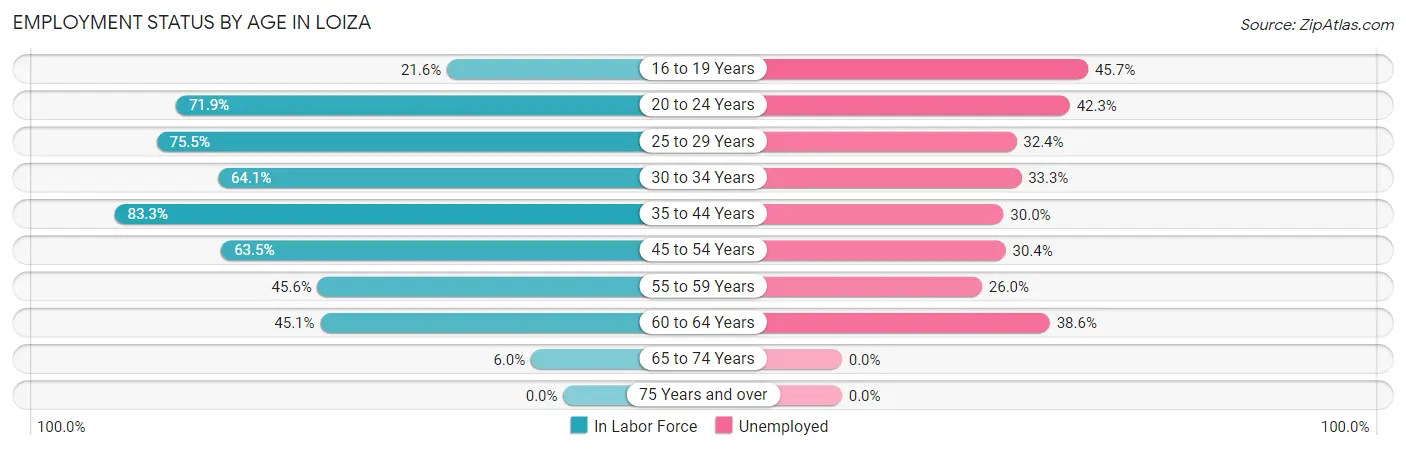
| Age Bracket | In Labor Force | Unemployed |
| 16 to 19 Years | 35 (21.6%) | 16 (45.7%) |
| 20 to 24 Years | 182 (71.9%) | 77 (42.3%) |
| 25 to 29 Years | 111 (75.5%) | 36 (32.4%) |
| 30 to 34 Years | 75 (64.1%) | 25 (33.3%) |
| 35 to 44 Years | 230 (83.3%) | 69 (30.0%) |
| 45 to 54 Years | 250 (63.5%) | 76 (30.4%) |
| 55 to 59 Years | 73 (45.6%) | 19 (26.0%) |
| 60 to 64 Years | 83 (45.1%) | 32 (38.6%) |
| 65 to 74 Years | 14 (6.0%) | 0 (0.0%) |
| 75 Years and over | 0 (0.0%) | 0 (0.0%) |
| Total | 1,053 (46.2%) | 350 (33.2%) |
Employment Status by Educational Attainment in Loiza
According to labor force statistics for Loiza, 64.3% of individuals (822) out of the total population between 25 and 64 years of age (1,278) are in the labor force, with 31.3% or 257 of them being unemployed. The group with the highest labor force participation rate are those with the educational attainment of bachelor's degree or higher, with 81.0% or 94 individuals in the labor force. Within the labor force, individuals with college / associate degree education have the highest percentage of unemployment, with 47.7% or 93 of them being unemployed.
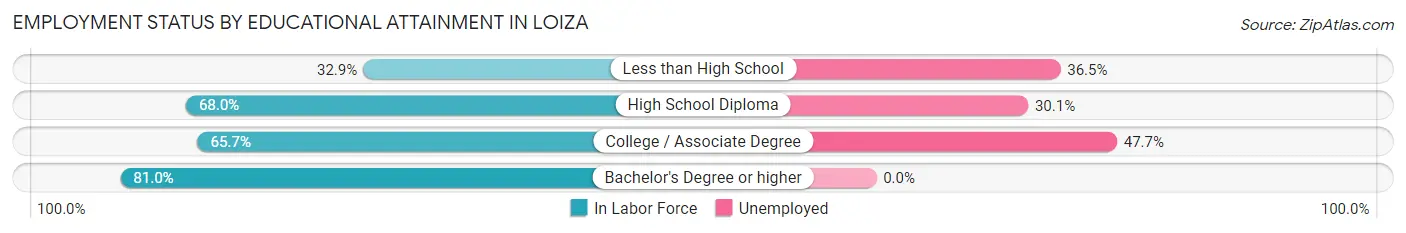
| Educational Attainment | In Labor Force | Unemployed |
| Less than High School | 52 (32.9%) | 58 (36.5%) |
| High School Diploma | 481 (68.0%) | 213 (30.1%) |
| College / Associate Degree | 195 (65.7%) | 142 (47.7%) |
| Bachelor's Degree or higher | 94 (81.0%) | 0 (0.0%) |
| Total | 822 (64.3%) | 400 (31.3%) |
Employment Occupations by Sex in Loiza
Management, Business, Science and Arts Occupations
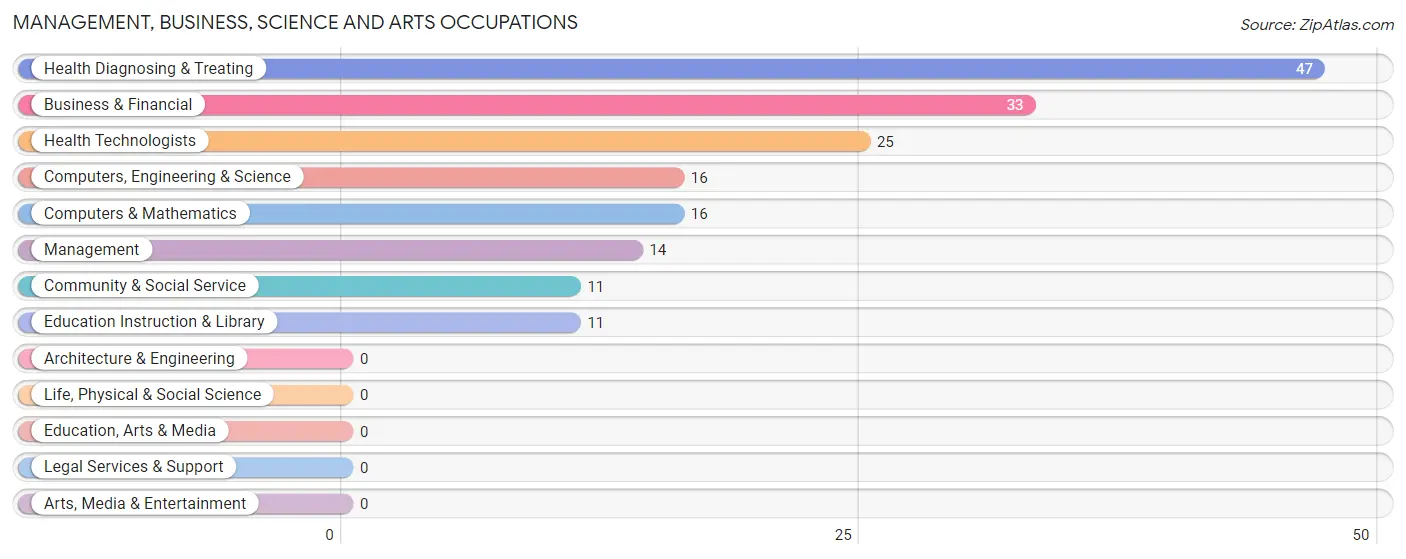
The most common Management, Business, Science and Arts occupations in Loiza are Health Diagnosing & Treating (47 | 6.7%), Business & Financial (33 | 4.7%), Health Technologists (25 | 3.6%), Computers, Engineering & Science (16 | 2.3%), and Computers & Mathematics (16 | 2.3%).
Management, Business, Science and Arts Occupations by Sex
Within the Management, Business, Science and Arts occupations in Loiza, the most male-oriented occupations are Computers, Engineering & Science (56.2%), Computers & Mathematics (56.2%), and Business & Financial (24.2%), while the most female-oriented occupations are Management (100.0%), Community & Social Service (100.0%), and Education Instruction & Library (100.0%).
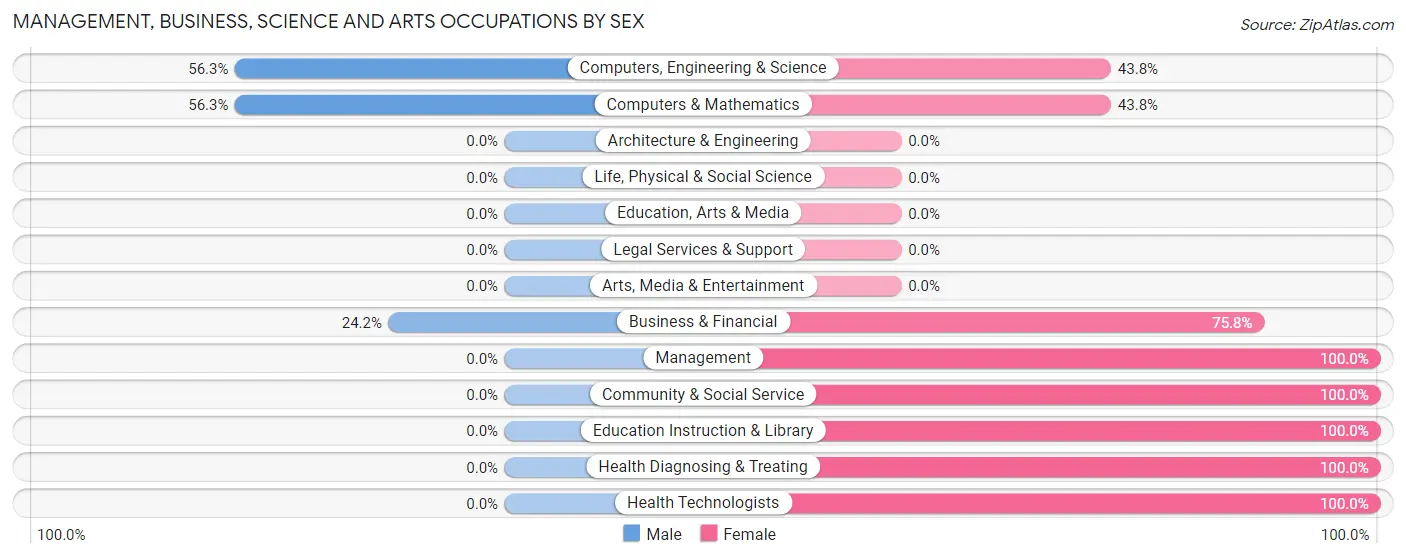
| Occupation | Male | Female |
| Management | 0 (0.0%) | 14 (100.0%) |
| Business & Financial | 8 (24.2%) | 25 (75.8%) |
| Computers, Engineering & Science | 9 (56.2%) | 7 (43.8%) |
| Computers & Mathematics | 9 (56.2%) | 7 (43.8%) |
| Architecture & Engineering | 0 (0.0%) | 0 (0.0%) |
| Life, Physical & Social Science | 0 (0.0%) | 0 (0.0%) |
| Community & Social Service | 0 (0.0%) | 11 (100.0%) |
| Education, Arts & Media | 0 (0.0%) | 0 (0.0%) |
| Legal Services & Support | 0 (0.0%) | 0 (0.0%) |
| Education Instruction & Library | 0 (0.0%) | 11 (100.0%) |
| Arts, Media & Entertainment | 0 (0.0%) | 0 (0.0%) |
| Health Diagnosing & Treating | 0 (0.0%) | 47 (100.0%) |
| Health Technologists | 0 (0.0%) | 25 (100.0%) |
| Total (Category) | 17 (14.1%) | 104 (86.0%) |
| Total (Overall) | 245 (34.8%) | 458 (65.1%) |
Services Occupations
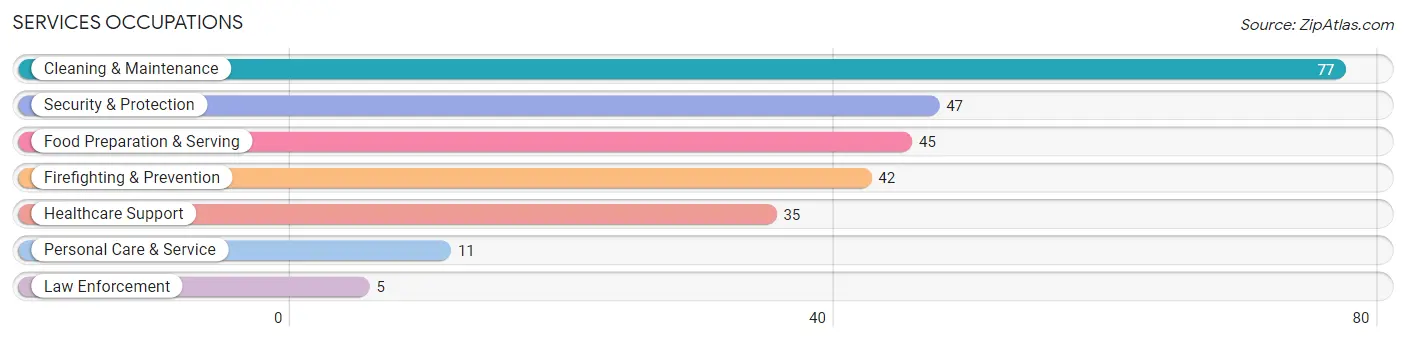
The most common Services occupations in Loiza are Cleaning & Maintenance (77 | 11.0%), Security & Protection (47 | 6.7%), Food Preparation & Serving (45 | 6.4%), Firefighting & Prevention (42 | 6.0%), and Healthcare Support (35 | 5.0%).
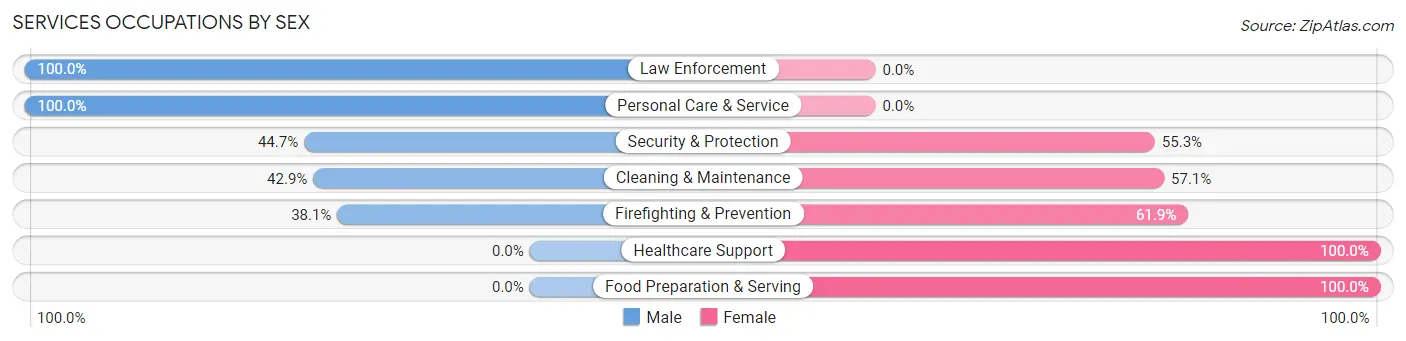
Services Occupations by Sex
Within the Services occupations in Loiza, the most male-oriented occupations are Law Enforcement (100.0%), Personal Care & Service (100.0%), and Security & Protection (44.7%), while the most female-oriented occupations are Healthcare Support (100.0%), Food Preparation & Serving (100.0%), and Firefighting & Prevention (61.9%).
| Occupation | Male | Female |
| Healthcare Support | 0 (0.0%) | 35 (100.0%) |
| Security & Protection | 21 (44.7%) | 26 (55.3%) |
| Firefighting & Prevention | 16 (38.1%) | 26 (61.9%) |
| Law Enforcement | 5 (100.0%) | 0 (0.0%) |
| Food Preparation & Serving | 0 (0.0%) | 45 (100.0%) |
| Cleaning & Maintenance | 33 (42.9%) | 44 (57.1%) |
| Personal Care & Service | 11 (100.0%) | 0 (0.0%) |
| Total (Category) | 65 (30.2%) | 150 (69.8%) |
| Total (Overall) | 245 (34.8%) | 458 (65.1%) |
Sales and Office Occupations
The most common Sales and Office occupations in Loiza are Office & Administration (146 | 20.8%), and Sales & Related (50 | 7.1%).

Sales and Office Occupations by Sex

| Occupation | Male | Female |
| Sales & Related | 17 (34.0%) | 33 (66.0%) |
| Office & Administration | 11 (7.5%) | 135 (92.5%) |
| Total (Category) | 28 (14.3%) | 168 (85.7%) |
| Total (Overall) | 245 (34.8%) | 458 (65.1%) |
Natural Resources, Construction and Maintenance Occupations
The most common Natural Resources, Construction and Maintenance occupations in Loiza are Installation, Maintenance & Repair (41 | 5.8%), and Construction & Extraction (30 | 4.3%).

Natural Resources, Construction and Maintenance Occupations by Sex
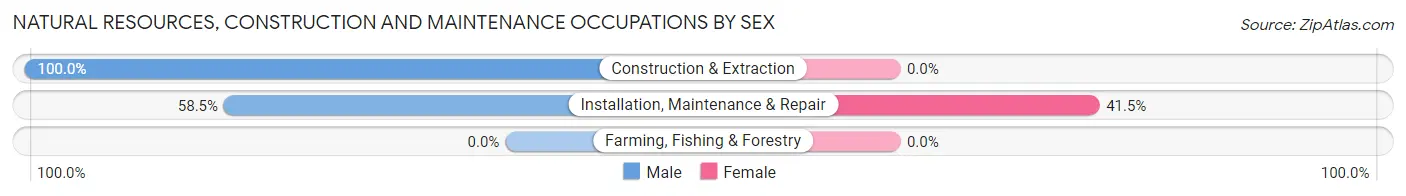
| Occupation | Male | Female |
| Farming, Fishing & Forestry | 0 (0.0%) | 0 (0.0%) |
| Construction & Extraction | 30 (100.0%) | 0 (0.0%) |
| Installation, Maintenance & Repair | 24 (58.5%) | 17 (41.5%) |
| Total (Category) | 54 (76.1%) | 17 (23.9%) |
| Total (Overall) | 245 (34.8%) | 458 (65.1%) |
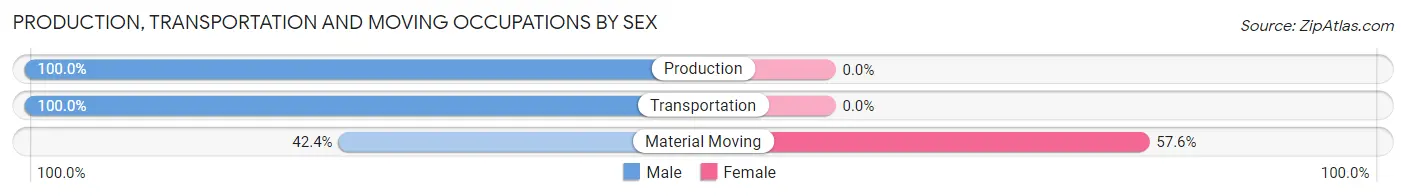
Production, Transportation and Moving Occupations
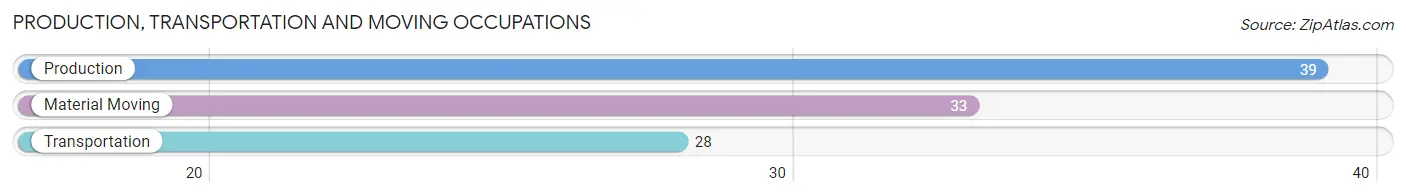
The most common Production, Transportation and Moving occupations in Loiza are Production (39 | 5.6%), Material Moving (33 | 4.7%), and Transportation (28 | 4.0%).
Production, Transportation and Moving Occupations by Sex
| Occupation | Male | Female |
| Production | 39 (100.0%) | 0 (0.0%) |
| Transportation | 28 (100.0%) | 0 (0.0%) |
| Material Moving | 14 (42.4%) | 19 (57.6%) |
| Total (Category) | 81 (81.0%) | 19 (19.0%) |
| Total (Overall) | 245 (34.8%) | 458 (65.1%) |
Employment Industries by Sex in Loiza
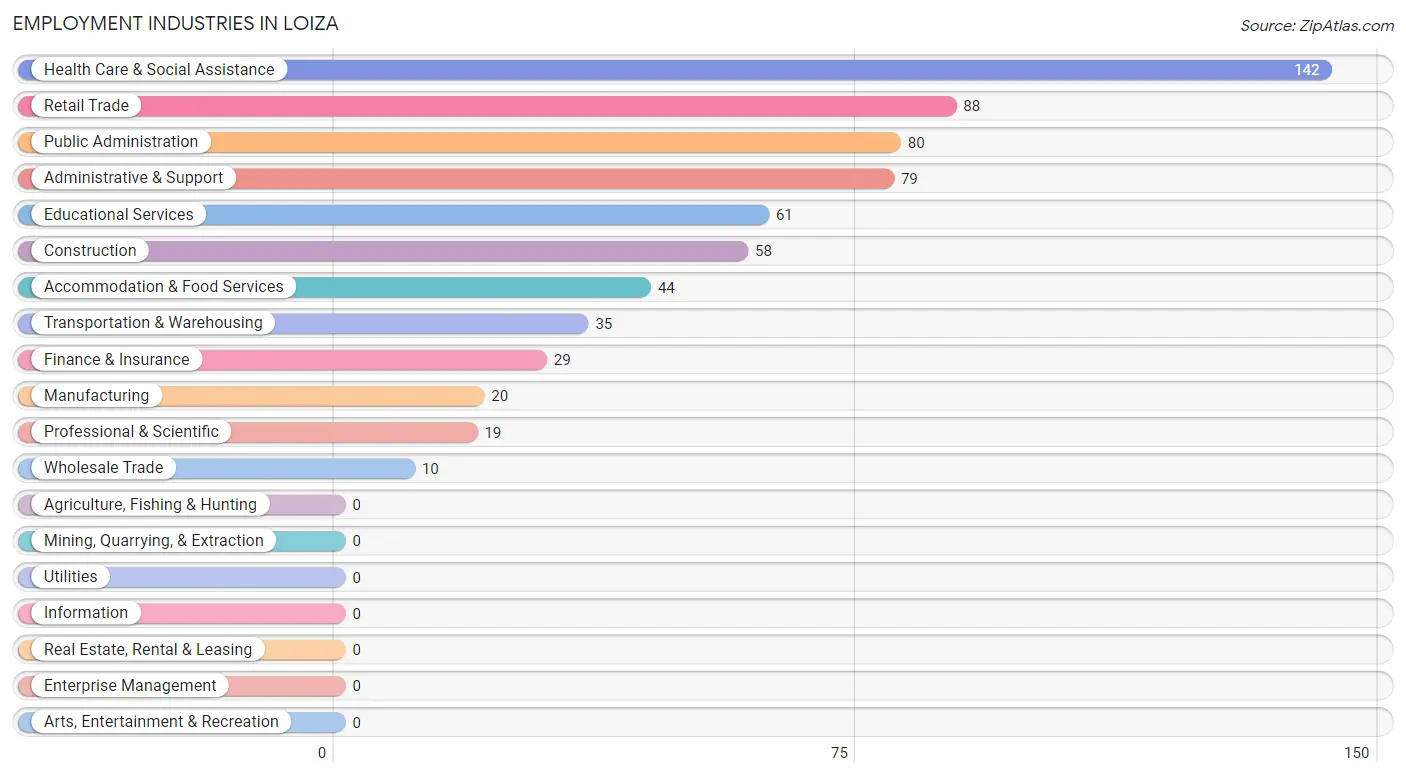
Employment Industries in Loiza
The major employment industries in Loiza include Health Care & Social Assistance (142 | 20.2%), Retail Trade (88 | 12.5%), Public Administration (80 | 11.4%), Administrative & Support (79 | 11.2%), and Educational Services (61 | 8.7%).
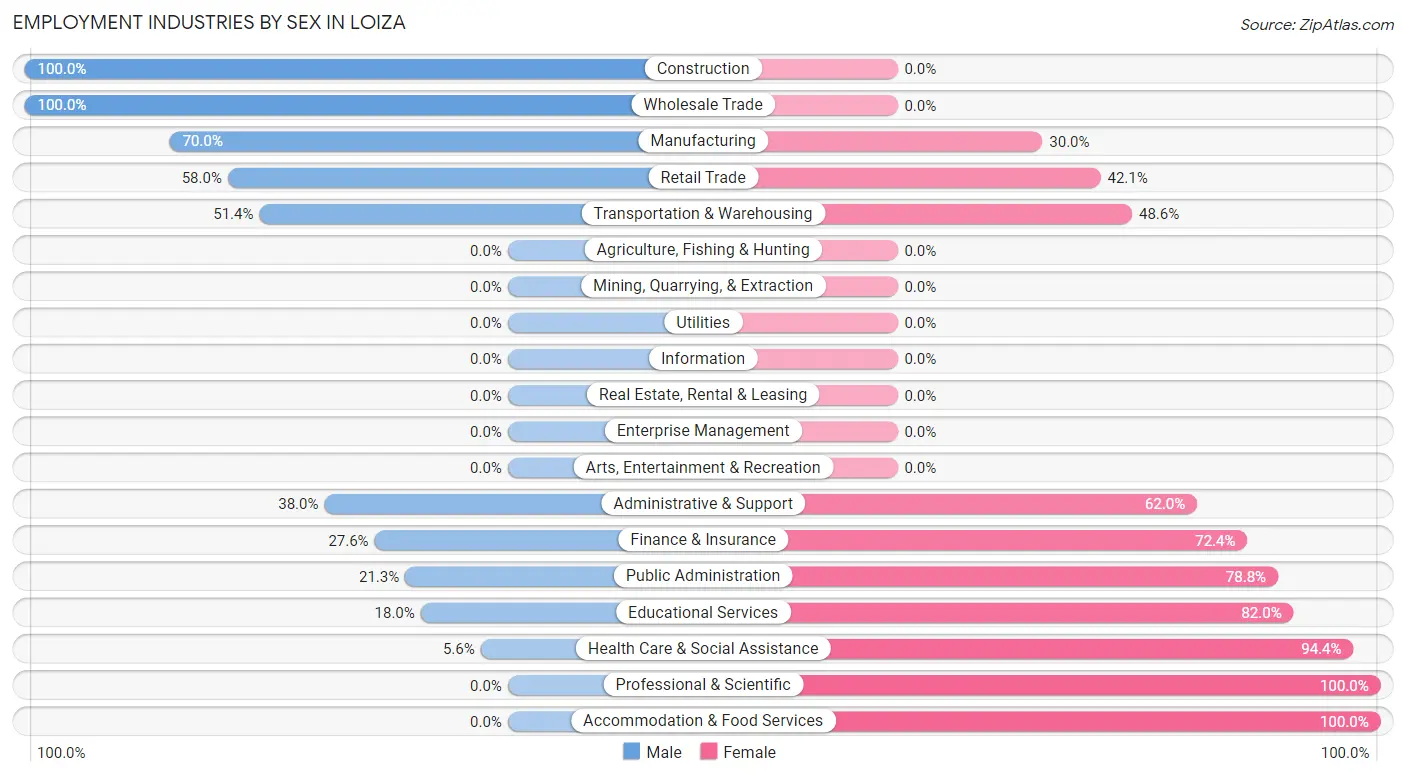
Employment Industries by Sex in Loiza
The Loiza industries that see more men than women are Construction (100.0%), Wholesale Trade (100.0%), and Manufacturing (70.0%), whereas the industries that tend to have a higher number of women are Professional & Scientific (100.0%), Accommodation & Food Services (100.0%), and Health Care & Social Assistance (94.4%).
| Industry | Male | Female |
| Agriculture, Fishing & Hunting | 0 (0.0%) | 0 (0.0%) |
| Mining, Quarrying, & Extraction | 0 (0.0%) | 0 (0.0%) |
| Construction | 58 (100.0%) | 0 (0.0%) |
| Manufacturing | 14 (70.0%) | 6 (30.0%) |
| Wholesale Trade | 10 (100.0%) | 0 (0.0%) |
| Retail Trade | 51 (58.0%) | 37 (42.0%) |
| Transportation & Warehousing | 18 (51.4%) | 17 (48.6%) |
| Utilities | 0 (0.0%) | 0 (0.0%) |
| Information | 0 (0.0%) | 0 (0.0%) |
| Finance & Insurance | 8 (27.6%) | 21 (72.4%) |
| Real Estate, Rental & Leasing | 0 (0.0%) | 0 (0.0%) |
| Professional & Scientific | 0 (0.0%) | 19 (100.0%) |
| Enterprise Management | 0 (0.0%) | 0 (0.0%) |
| Administrative & Support | 30 (38.0%) | 49 (62.0%) |
| Educational Services | 11 (18.0%) | 50 (82.0%) |
| Health Care & Social Assistance | 8 (5.6%) | 134 (94.4%) |
| Arts, Entertainment & Recreation | 0 (0.0%) | 0 (0.0%) |
| Accommodation & Food Services | 0 (0.0%) | 44 (100.0%) |
| Public Administration | 17 (21.2%) | 63 (78.7%) |
| Total | 245 (34.8%) | 458 (65.1%) |
Education in Loiza
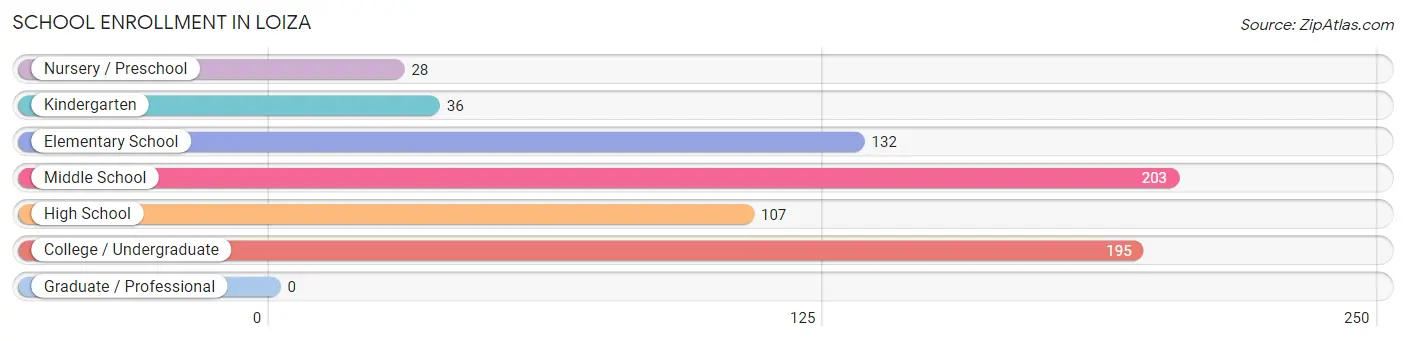
School Enrollment in Loiza
The most common levels of schooling among the 701 students in Loiza are middle school (203 | 29.0%), college / undergraduate (195 | 27.8%), and elementary school (132 | 18.8%).
| School Level | # Students | % Students |
| Nursery / Preschool | 28 | 4.0% |
| Kindergarten | 36 | 5.1% |
| Elementary School | 132 | 18.8% |
| Middle School | 203 | 29.0% |
| High School | 107 | 15.3% |
| College / Undergraduate | 195 | 27.8% |
| Graduate / Professional | 0 | 0.0% |
| Total | 701 | 100.0% |
School Enrollment by Age by Funding Source in Loiza
Out of a total of 701 students who are enrolled in schools in Loiza, 166 (23.7%) attend a private institution, while the remaining 535 (76.3%) are enrolled in public schools. The age group of 20 to 24 year olds has the highest likelihood of being enrolled in private schools, with 101 (85.6% in the age bracket) enrolled. Conversely, the age group of 3 to 4 year olds has the lowest likelihood of being enrolled in a private school, with 28 (100.0% in the age bracket) attending a public institution.
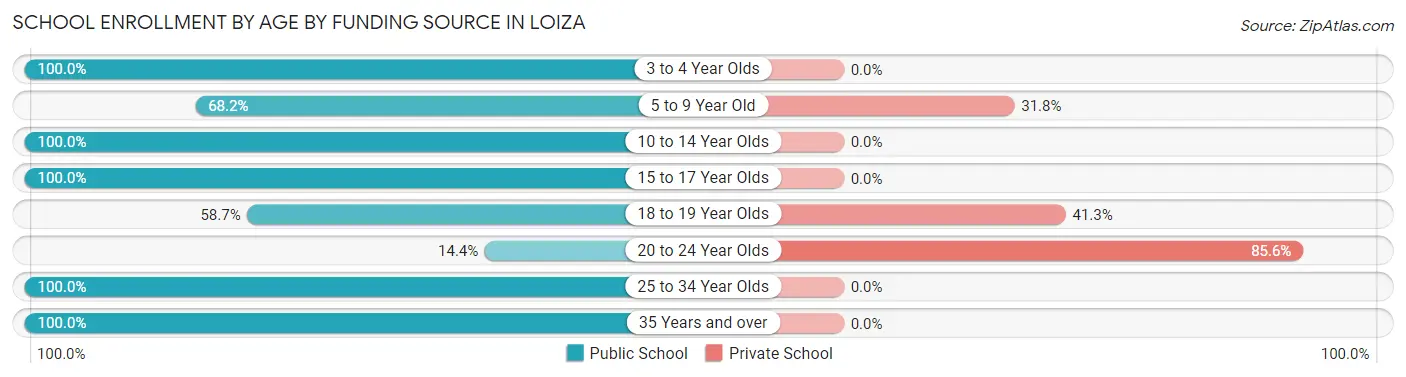
| Age Bracket | Public School | Private School |
| 3 to 4 Year Olds | 28 (100.0%) | 0 (0.0%) |
| 5 to 9 Year Old | 73 (68.2%) | 34 (31.8%) |
| 10 to 14 Year Olds | 271 (100.0%) | 0 (0.0%) |
| 15 to 17 Year Olds | 75 (100.0%) | 0 (0.0%) |
| 18 to 19 Year Olds | 44 (58.7%) | 31 (41.3%) |
| 20 to 24 Year Olds | 17 (14.4%) | 101 (85.6%) |
| 25 to 34 Year Olds | 21 (100.0%) | 0 (0.0%) |
| 35 Years and over | 6 (100.0%) | 0 (0.0%) |
| Total | 535 (76.3%) | 166 (23.7%) |
Educational Attainment by Field of Study in Loiza
Science & technology (60 | 38.7%), business (40 | 25.8%), education (21 | 13.6%), arts & humanities (14 | 9.0%), and communications (12 | 7.7%) are the most common fields of study among 155 individuals in Loiza who have obtained a bachelor's degree or higher.
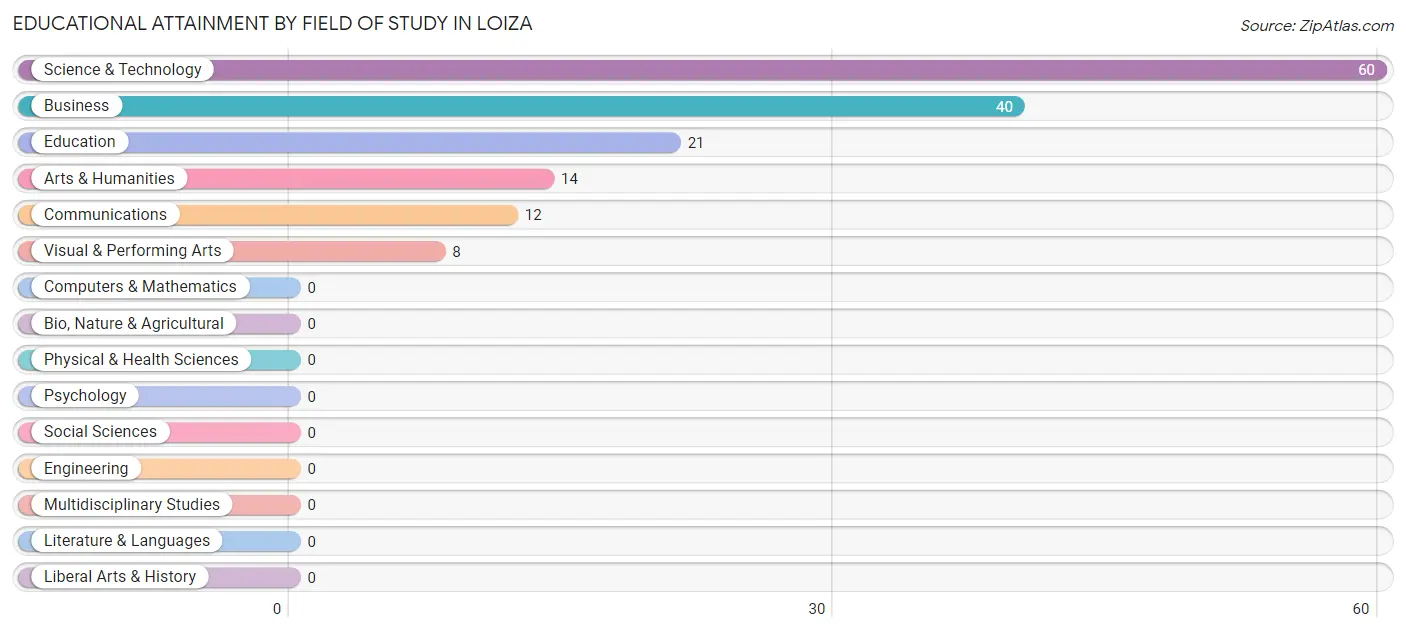
| Field of Study | # Graduates | % Graduates |
| Computers & Mathematics | 0 | 0.0% |
| Bio, Nature & Agricultural | 0 | 0.0% |
| Physical & Health Sciences | 0 | 0.0% |
| Psychology | 0 | 0.0% |
| Social Sciences | 0 | 0.0% |
| Engineering | 0 | 0.0% |
| Multidisciplinary Studies | 0 | 0.0% |
| Science & Technology | 60 | 38.7% |
| Business | 40 | 25.8% |
| Education | 21 | 13.6% |
| Literature & Languages | 0 | 0.0% |
| Liberal Arts & History | 0 | 0.0% |
| Visual & Performing Arts | 8 | 5.2% |
| Communications | 12 | 7.7% |
| Arts & Humanities | 14 | 9.0% |
| Total | 155 | 100.0% |
Transportation & Commute in Loiza
Vehicle Availability by Sex in Loiza
The most prevalent vehicle ownership categories in Loiza are males with 1 vehicle (102, accounting for 41.6%) and females with 1 vehicle (281, making up 22.8%).
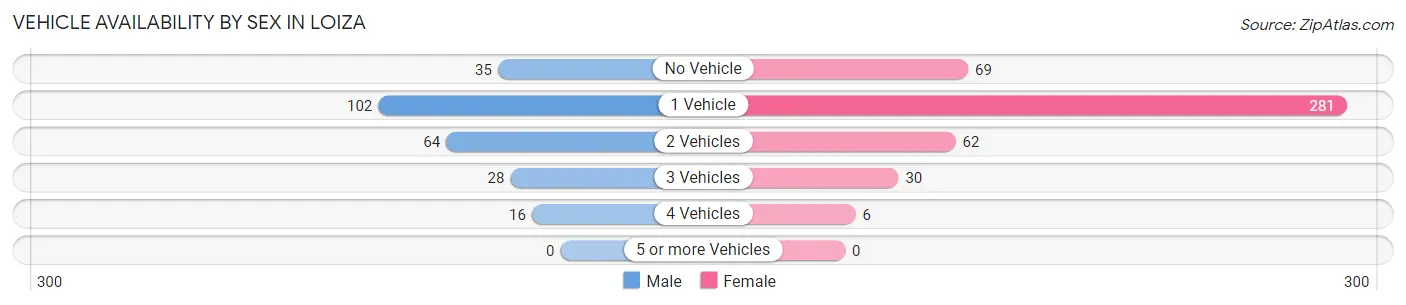
| Vehicles Available | Male | Female |
| No Vehicle | 35 (14.3%) | 69 (15.4%) |
| 1 Vehicle | 102 (41.6%) | 281 (62.7%) |
| 2 Vehicles | 64 (26.1%) | 62 (13.8%) |
| 3 Vehicles | 28 (11.4%) | 30 (6.7%) |
| 4 Vehicles | 16 (6.5%) | 6 (1.3%) |
| 5 or more Vehicles | 0 (0.0%) | 0 (0.0%) |
| Total | 245 (100.0%) | 448 (100.0%) |
Commute Time in Loiza
The most frequently occuring commute durations in Loiza are 30 to 34 minutes (147 commuters, 22.3%), 40 to 44 minutes (101 commuters, 15.3%), and 90 or more minutes (95 commuters, 14.4%).
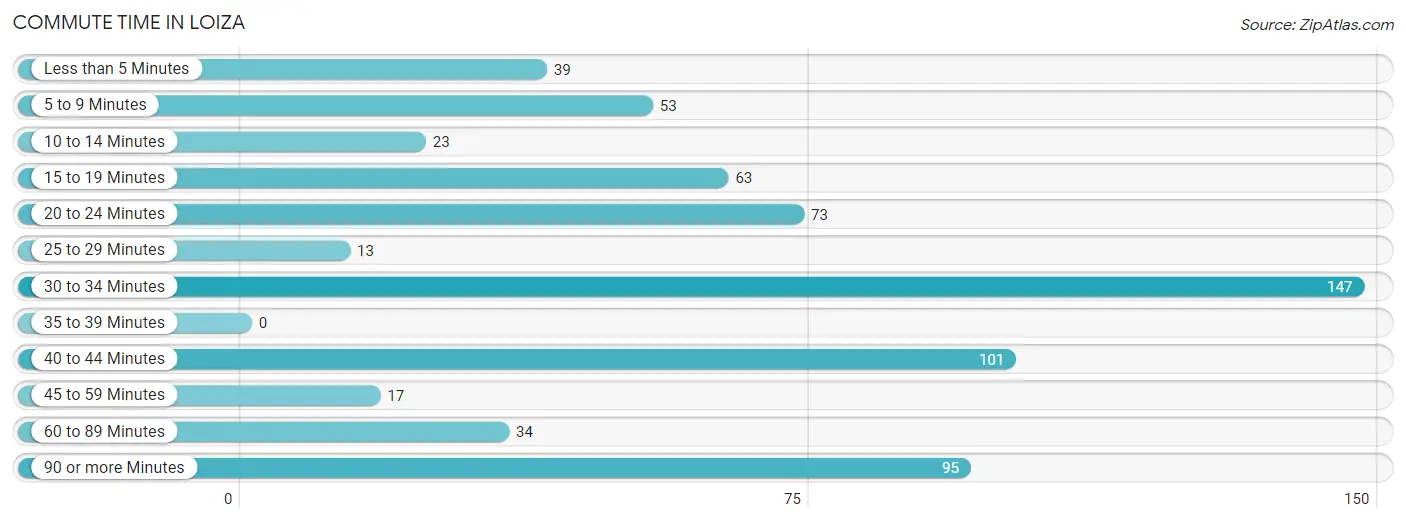
| Commute Time | # Commuters | % Commuters |
| Less than 5 Minutes | 39 | 5.9% |
| 5 to 9 Minutes | 53 | 8.1% |
| 10 to 14 Minutes | 23 | 3.5% |
| 15 to 19 Minutes | 63 | 9.6% |
| 20 to 24 Minutes | 73 | 11.1% |
| 25 to 29 Minutes | 13 | 2.0% |
| 30 to 34 Minutes | 147 | 22.3% |
| 35 to 39 Minutes | 0 | 0.0% |
| 40 to 44 Minutes | 101 | 15.3% |
| 45 to 59 Minutes | 17 | 2.6% |
| 60 to 89 Minutes | 34 | 5.2% |
| 90 or more Minutes | 95 | 14.4% |
Commute Time by Sex in Loiza
The most common commute times in Loiza are 30 to 34 minutes (85 commuters, 36.3%) for males and 40 to 44 minutes (87 commuters, 20.5%) for females.
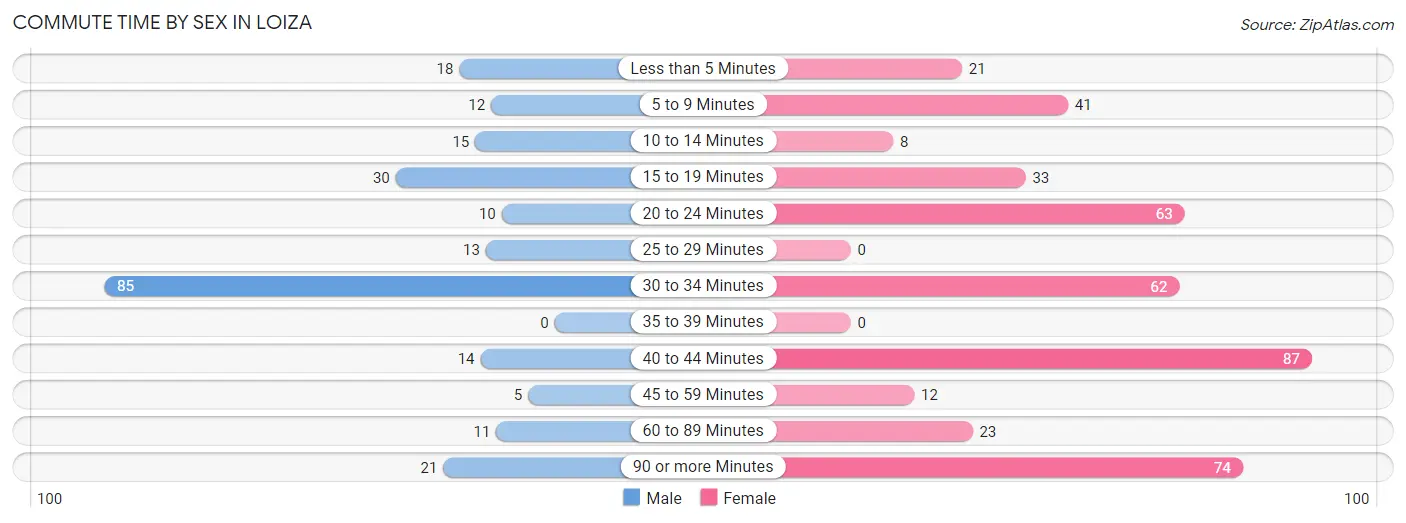
| Commute Time | Male | Female |
| Less than 5 Minutes | 18 (7.7%) | 21 (5.0%) |
| 5 to 9 Minutes | 12 (5.1%) | 41 (9.7%) |
| 10 to 14 Minutes | 15 (6.4%) | 8 (1.9%) |
| 15 to 19 Minutes | 30 (12.8%) | 33 (7.8%) |
| 20 to 24 Minutes | 10 (4.3%) | 63 (14.9%) |
| 25 to 29 Minutes | 13 (5.6%) | 0 (0.0%) |
| 30 to 34 Minutes | 85 (36.3%) | 62 (14.6%) |
| 35 to 39 Minutes | 0 (0.0%) | 0 (0.0%) |
| 40 to 44 Minutes | 14 (6.0%) | 87 (20.5%) |
| 45 to 59 Minutes | 5 (2.1%) | 12 (2.8%) |
| 60 to 89 Minutes | 11 (4.7%) | 23 (5.4%) |
| 90 or more Minutes | 21 (9.0%) | 74 (17.4%) |
Time of Departure to Work by Sex in Loiza
The most frequent times of departure to work in Loiza are 6:00 AM to 6:29 AM (51, 21.8%) for males and 12:00 AM to 4:59 AM (66, 15.6%) for females.
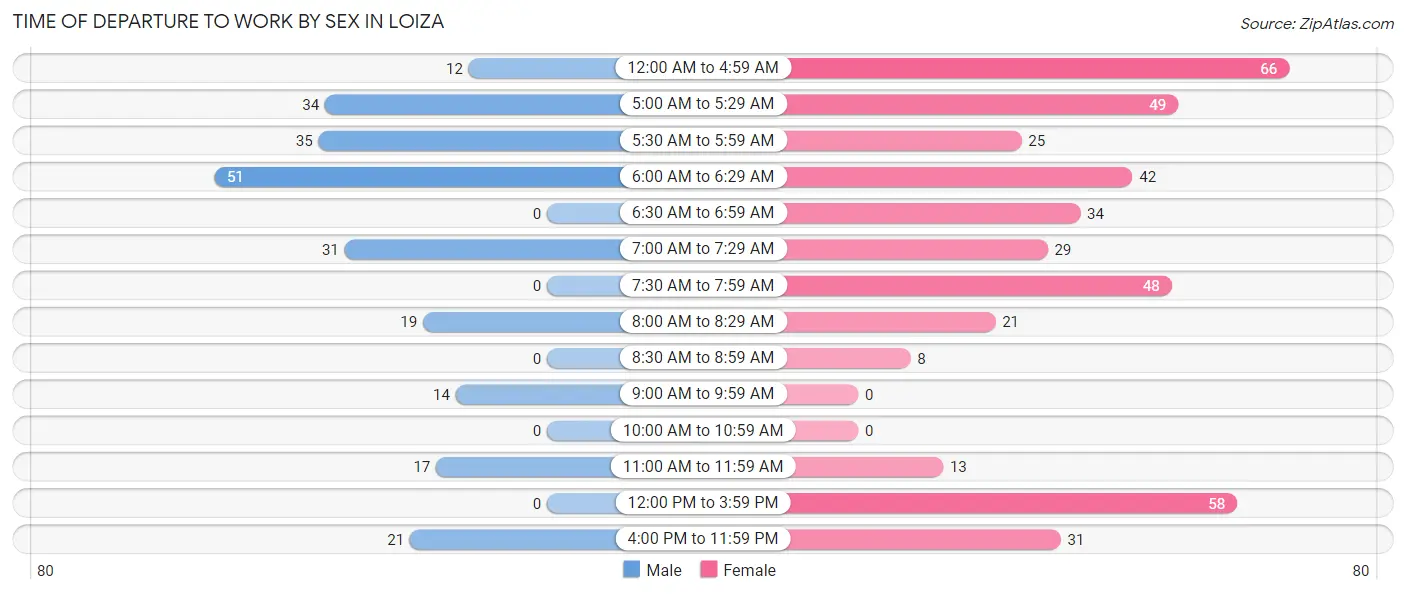
| Time of Departure | Male | Female |
| 12:00 AM to 4:59 AM | 12 (5.1%) | 66 (15.6%) |
| 5:00 AM to 5:29 AM | 34 (14.5%) | 49 (11.6%) |
| 5:30 AM to 5:59 AM | 35 (15.0%) | 25 (5.9%) |
| 6:00 AM to 6:29 AM | 51 (21.8%) | 42 (9.9%) |
| 6:30 AM to 6:59 AM | 0 (0.0%) | 34 (8.0%) |
| 7:00 AM to 7:29 AM | 31 (13.3%) | 29 (6.8%) |
| 7:30 AM to 7:59 AM | 0 (0.0%) | 48 (11.3%) |
| 8:00 AM to 8:29 AM | 19 (8.1%) | 21 (5.0%) |
| 8:30 AM to 8:59 AM | 0 (0.0%) | 8 (1.9%) |
| 9:00 AM to 9:59 AM | 14 (6.0%) | 0 (0.0%) |
| 10:00 AM to 10:59 AM | 0 (0.0%) | 0 (0.0%) |
| 11:00 AM to 11:59 AM | 17 (7.3%) | 13 (3.1%) |
| 12:00 PM to 3:59 PM | 0 (0.0%) | 58 (13.7%) |
| 4:00 PM to 11:59 PM | 21 (9.0%) | 31 (7.3%) |
| Total | 234 (100.0%) | 424 (100.0%) |
Housing Occupancy in Loiza
Occupancy by Ownership in Loiza
Of the total 1,179 dwellings in Loiza, owner-occupied units account for 524 (44.4%), while renter-occupied units make up 655 (55.6%).
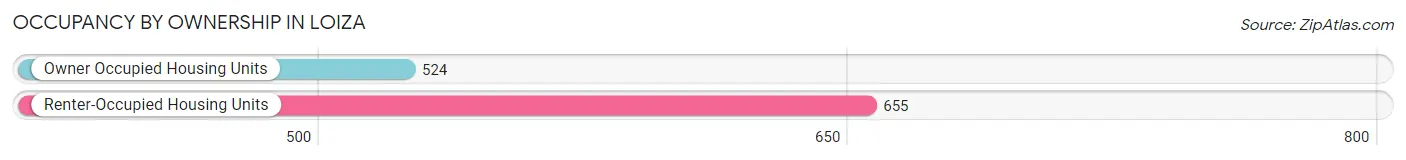
| Occupancy | # Housing Units | % Housing Units |
| Owner Occupied Housing Units | 524 | 44.4% |
| Renter-Occupied Housing Units | 655 | 55.6% |
| Total Occupied Housing Units | 1,179 | 100.0% |
Occupancy by Household Size in Loiza
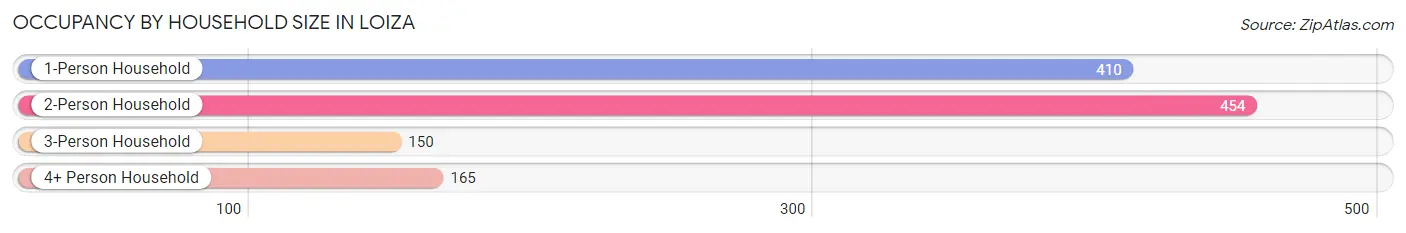
| Household Size | # Housing Units | % Housing Units |
| 1-Person Household | 410 | 34.8% |
| 2-Person Household | 454 | 38.5% |
| 3-Person Household | 150 | 12.7% |
| 4+ Person Household | 165 | 14.0% |
| Total Housing Units | 1,179 | 100.0% |
Occupancy by Ownership by Household Size in Loiza
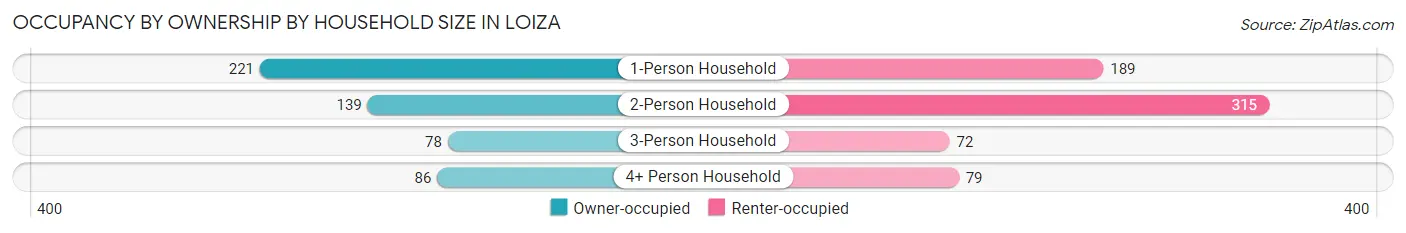
| Household Size | Owner-occupied | Renter-occupied |
| 1-Person Household | 221 (53.9%) | 189 (46.1%) |
| 2-Person Household | 139 (30.6%) | 315 (69.4%) |
| 3-Person Household | 78 (52.0%) | 72 (48.0%) |
| 4+ Person Household | 86 (52.1%) | 79 (47.9%) |
| Total Housing Units | 524 (44.4%) | 655 (55.6%) |
Occupancy by Educational Attainment in Loiza
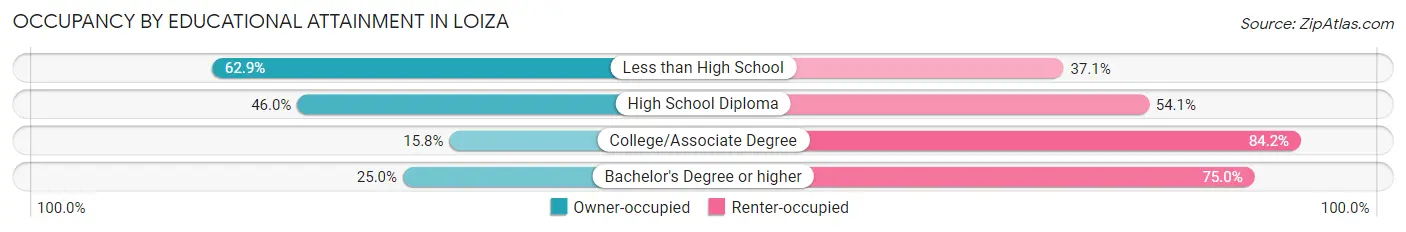
| Household Size | Owner-occupied | Renter-occupied |
| Less than High School | 176 (62.9%) | 104 (37.1%) |
| High School Diploma | 301 (46.0%) | 354 (54.0%) |
| College/Associate Degree | 24 (15.8%) | 128 (84.2%) |
| Bachelor's Degree or higher | 23 (25.0%) | 69 (75.0%) |
Occupancy by Age of Householder in Loiza
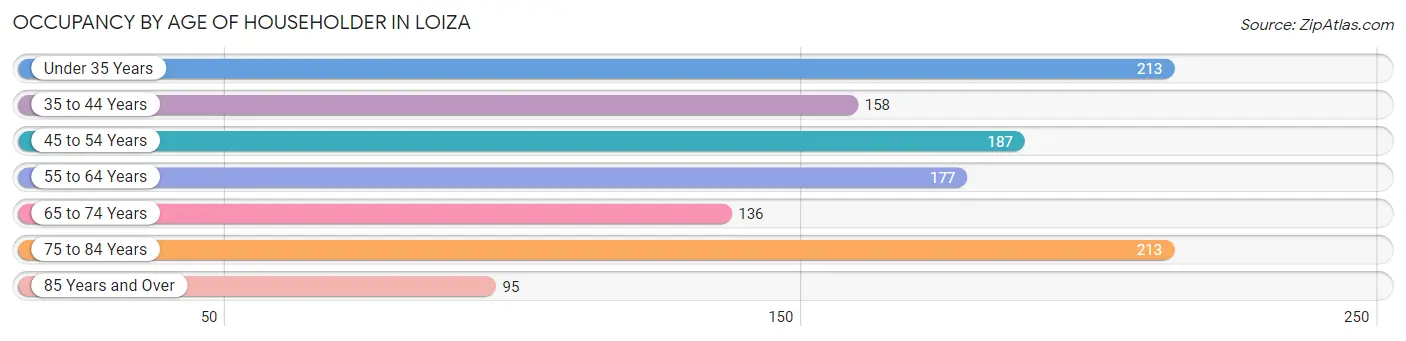
| Age Bracket | # Households | % Households |
| Under 35 Years | 213 | 18.1% |
| 35 to 44 Years | 158 | 13.4% |
| 45 to 54 Years | 187 | 15.9% |
| 55 to 64 Years | 177 | 15.0% |
| 65 to 74 Years | 136 | 11.5% |
| 75 to 84 Years | 213 | 18.1% |
| 85 Years and Over | 95 | 8.1% |
| Total | 1,179 | 100.0% |
Housing Finances in Loiza
Median Income by Occupancy in Loiza
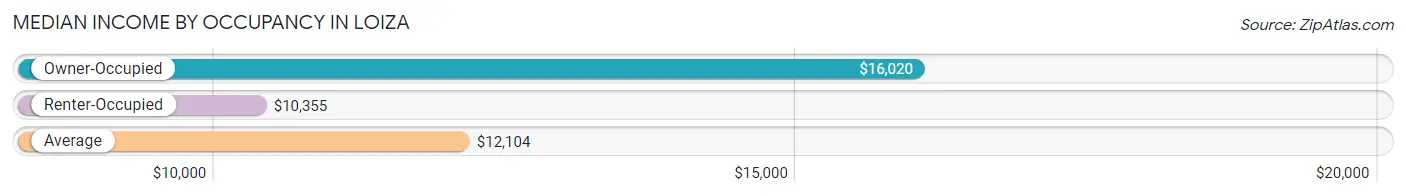
| Occupancy Type | # Households | Median Income |
| Owner-Occupied | 524 (44.4%) | $16,020 |
| Renter-Occupied | 655 (55.6%) | $10,355 |
| Average | 1,179 (100.0%) | $12,104 |
Occupancy by Householder Income Bracket in Loiza
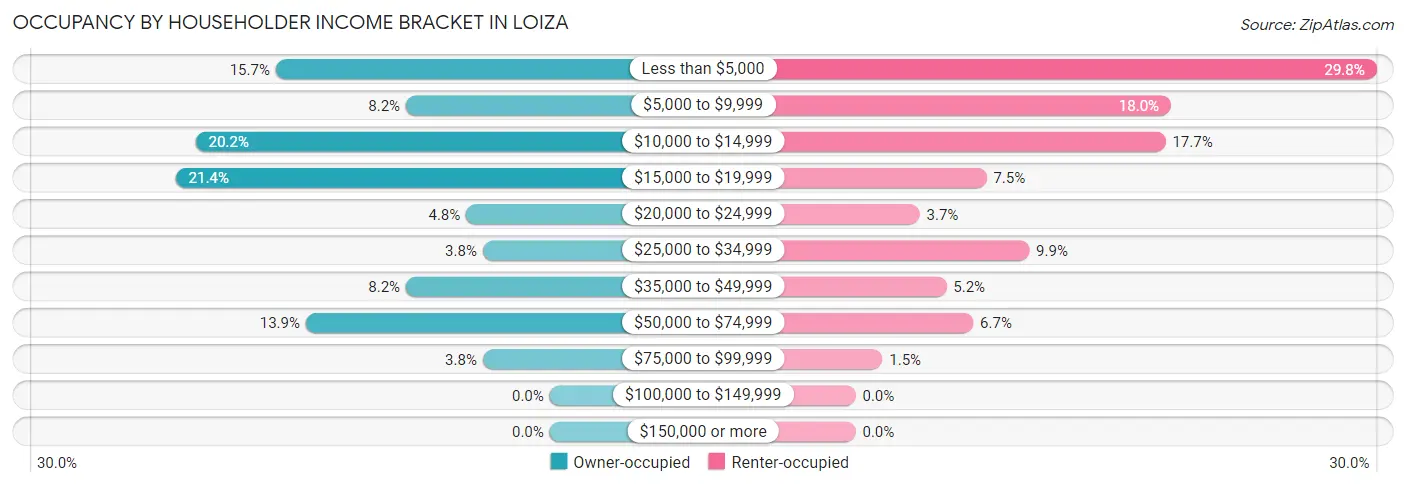
| Income Bracket | Owner-occupied | Renter-occupied |
| Less than $5,000 | 82 (15.7%) | 195 (29.8%) |
| $5,000 to $9,999 | 43 (8.2%) | 118 (18.0%) |
| $10,000 to $14,999 | 106 (20.2%) | 116 (17.7%) |
| $15,000 to $19,999 | 112 (21.4%) | 49 (7.5%) |
| $20,000 to $24,999 | 25 (4.8%) | 24 (3.7%) |
| $25,000 to $34,999 | 20 (3.8%) | 65 (9.9%) |
| $35,000 to $49,999 | 43 (8.2%) | 34 (5.2%) |
| $50,000 to $74,999 | 73 (13.9%) | 44 (6.7%) |
| $75,000 to $99,999 | 20 (3.8%) | 10 (1.5%) |
| $100,000 to $149,999 | 0 (0.0%) | 0 (0.0%) |
| $150,000 or more | 0 (0.0%) | 0 (0.0%) |
| Total | 524 (100.0%) | 655 (100.0%) |
Monthly Housing Cost Tiers in Loiza
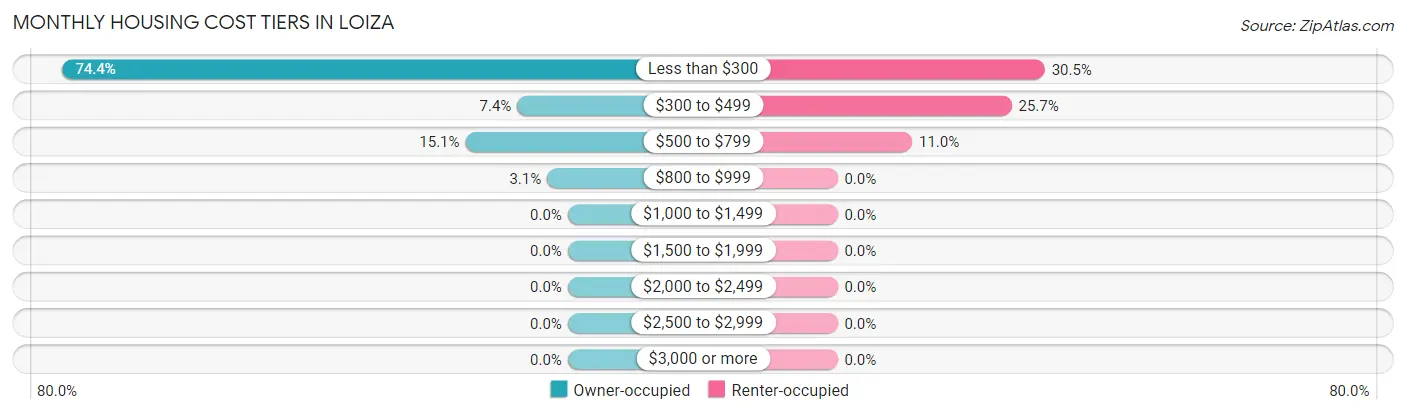
| Monthly Cost | Owner-occupied | Renter-occupied |
| Less than $300 | 390 (74.4%) | 200 (30.5%) |
| $300 to $499 | 39 (7.4%) | 168 (25.7%) |
| $500 to $799 | 79 (15.1%) | 72 (11.0%) |
| $800 to $999 | 16 (3.0%) | 0 (0.0%) |
| $1,000 to $1,499 | 0 (0.0%) | 0 (0.0%) |
| $1,500 to $1,999 | 0 (0.0%) | 0 (0.0%) |
| $2,000 to $2,499 | 0 (0.0%) | 0 (0.0%) |
| $2,500 to $2,999 | 0 (0.0%) | 0 (0.0%) |
| $3,000 or more | 0 (0.0%) | 0 (0.0%) |
| Total | 524 (100.0%) | 655 (100.0%) |
Physical Housing Characteristics in Loiza
Housing Structures in Loiza
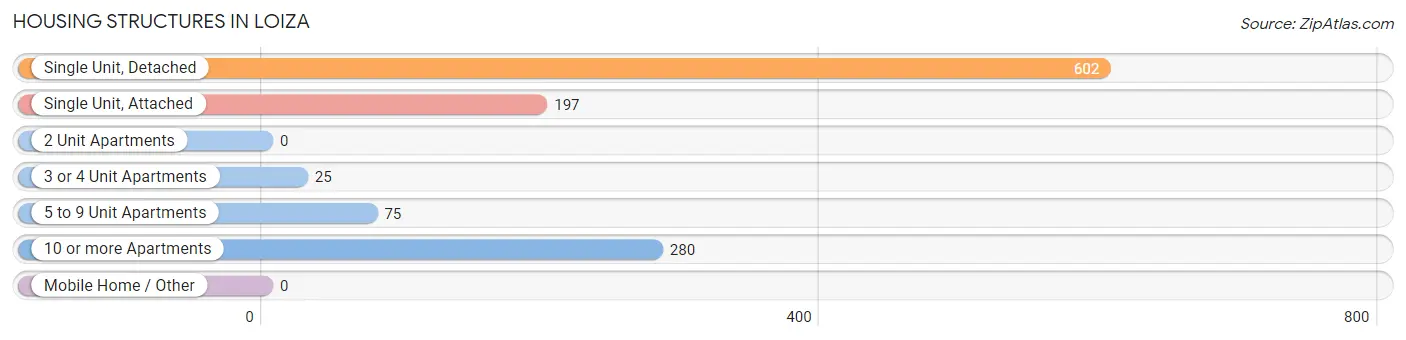
| Structure Type | # Housing Units | % Housing Units |
| Single Unit, Detached | 602 | 51.1% |
| Single Unit, Attached | 197 | 16.7% |
| 2 Unit Apartments | 0 | 0.0% |
| 3 or 4 Unit Apartments | 25 | 2.1% |
| 5 to 9 Unit Apartments | 75 | 6.4% |
| 10 or more Apartments | 280 | 23.7% |
| Mobile Home / Other | 0 | 0.0% |
| Total | 1,179 | 100.0% |
Housing Structures by Occupancy in Loiza
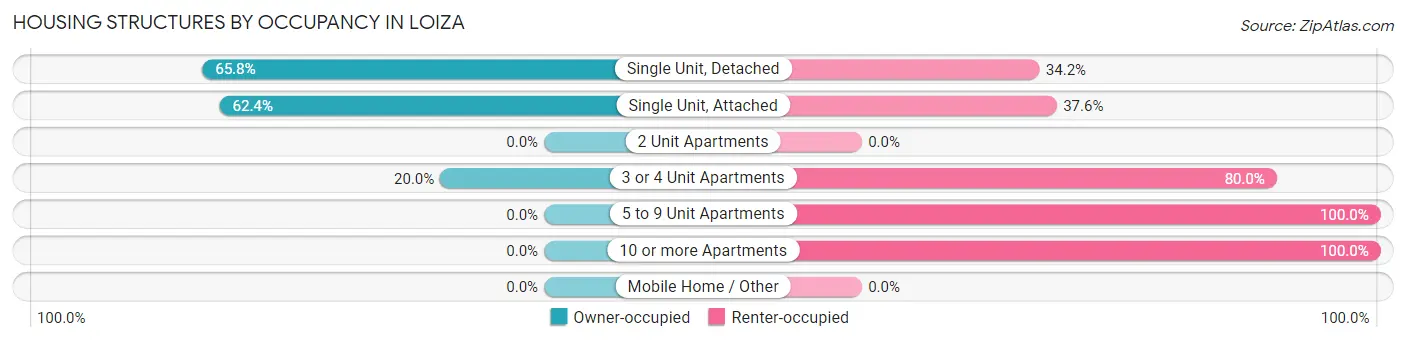
| Structure Type | Owner-occupied | Renter-occupied |
| Single Unit, Detached | 396 (65.8%) | 206 (34.2%) |
| Single Unit, Attached | 123 (62.4%) | 74 (37.6%) |
| 2 Unit Apartments | 0 (0.0%) | 0 (0.0%) |
| 3 or 4 Unit Apartments | 5 (20.0%) | 20 (80.0%) |
| 5 to 9 Unit Apartments | 0 (0.0%) | 75 (100.0%) |
| 10 or more Apartments | 0 (0.0%) | 280 (100.0%) |
| Mobile Home / Other | 0 (0.0%) | 0 (0.0%) |
| Total | 524 (44.4%) | 655 (55.6%) |
Housing Structures by Number of Rooms in Loiza
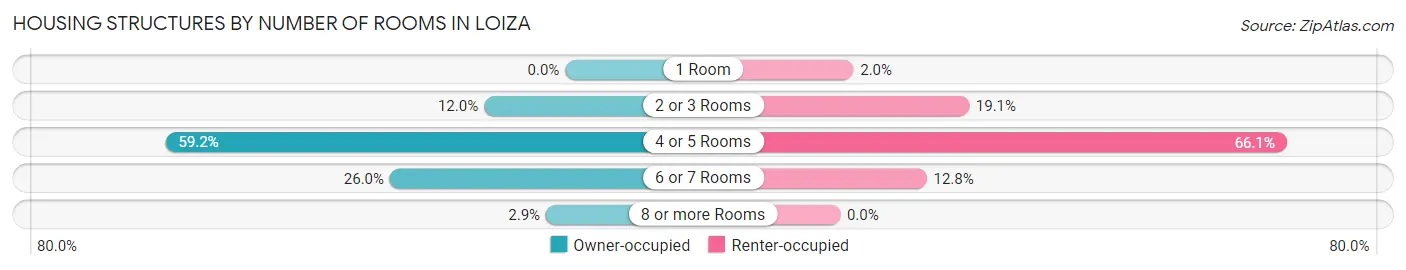
| Number of Rooms | Owner-occupied | Renter-occupied |
| 1 Room | 0 (0.0%) | 13 (2.0%) |
| 2 or 3 Rooms | 63 (12.0%) | 125 (19.1%) |
| 4 or 5 Rooms | 310 (59.2%) | 433 (66.1%) |
| 6 or 7 Rooms | 136 (26.0%) | 84 (12.8%) |
| 8 or more Rooms | 15 (2.9%) | 0 (0.0%) |
| Total | 524 (100.0%) | 655 (100.0%) |
Housing Structure by Heating Type in Loiza
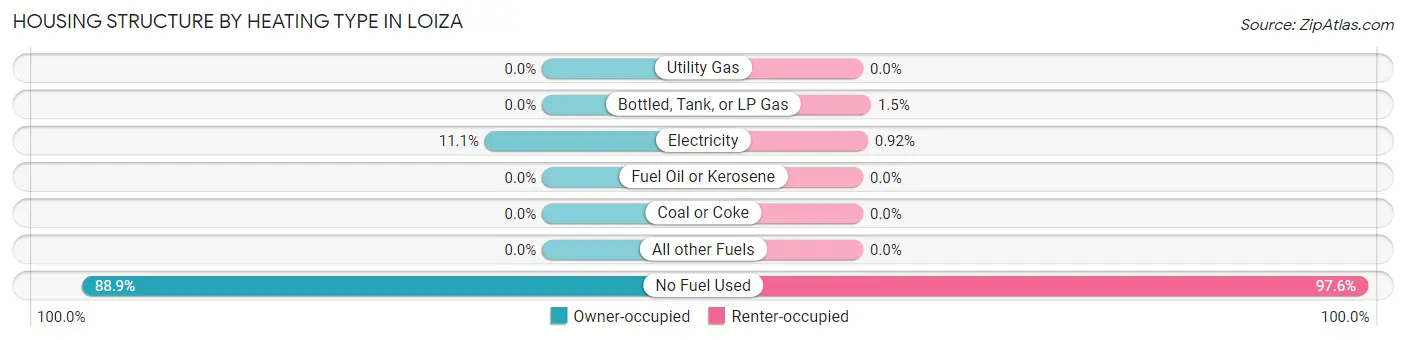
| Heating Type | Owner-occupied | Renter-occupied |
| Utility Gas | 0 (0.0%) | 0 (0.0%) |
| Bottled, Tank, or LP Gas | 0 (0.0%) | 10 (1.5%) |
| Electricity | 58 (11.1%) | 6 (0.9%) |
| Fuel Oil or Kerosene | 0 (0.0%) | 0 (0.0%) |
| Coal or Coke | 0 (0.0%) | 0 (0.0%) |
| All other Fuels | 0 (0.0%) | 0 (0.0%) |
| No Fuel Used | 466 (88.9%) | 639 (97.6%) |
| Total | 524 (100.0%) | 655 (100.0%) |
Household Vehicle Usage in Loiza
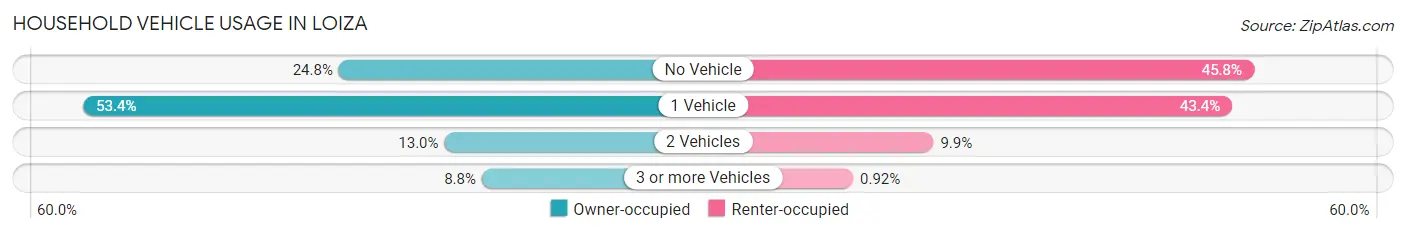
| Vehicles per Household | Owner-occupied | Renter-occupied |
| No Vehicle | 130 (24.8%) | 300 (45.8%) |
| 1 Vehicle | 280 (53.4%) | 284 (43.4%) |
| 2 Vehicles | 68 (13.0%) | 65 (9.9%) |
| 3 or more Vehicles | 46 (8.8%) | 6 (0.9%) |
| Total | 524 (100.0%) | 655 (100.0%) |
Real Estate & Mortgages in Loiza
Real Estate and Mortgage Overview in Loiza
| Characteristic | Without Mortgage | With Mortgage |
| Housing Units | 433 | 91 |
| Median Property Value | $98,100 | $89,300 |
| Median Household Income | $15,280 | $0 |
| Monthly Housing Costs | $134 | $0 |
| Real Estate Taxes | - | - |
Property Value by Mortgage Status in Loiza
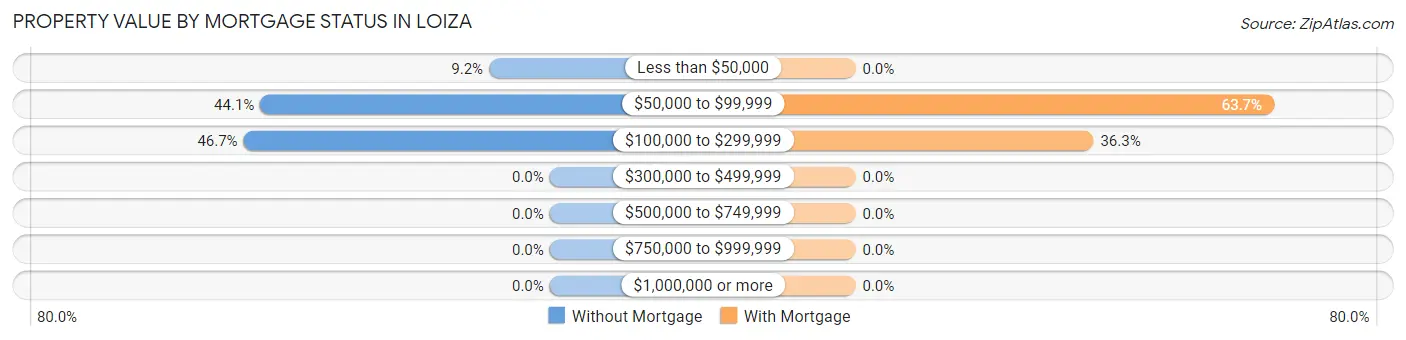
| Property Value | Without Mortgage | With Mortgage |
| Less than $50,000 | 40 (9.2%) | 0 (0.0%) |
| $50,000 to $99,999 | 191 (44.1%) | 58 (63.7%) |
| $100,000 to $299,999 | 202 (46.7%) | 33 (36.3%) |
| $300,000 to $499,999 | 0 (0.0%) | 0 (0.0%) |
| $500,000 to $749,999 | 0 (0.0%) | 0 (0.0%) |
| $750,000 to $999,999 | 0 (0.0%) | 0 (0.0%) |
| $1,000,000 or more | 0 (0.0%) | 0 (0.0%) |
| Total | 433 (100.0%) | 91 (100.0%) |
Household Income by Mortgage Status in Loiza
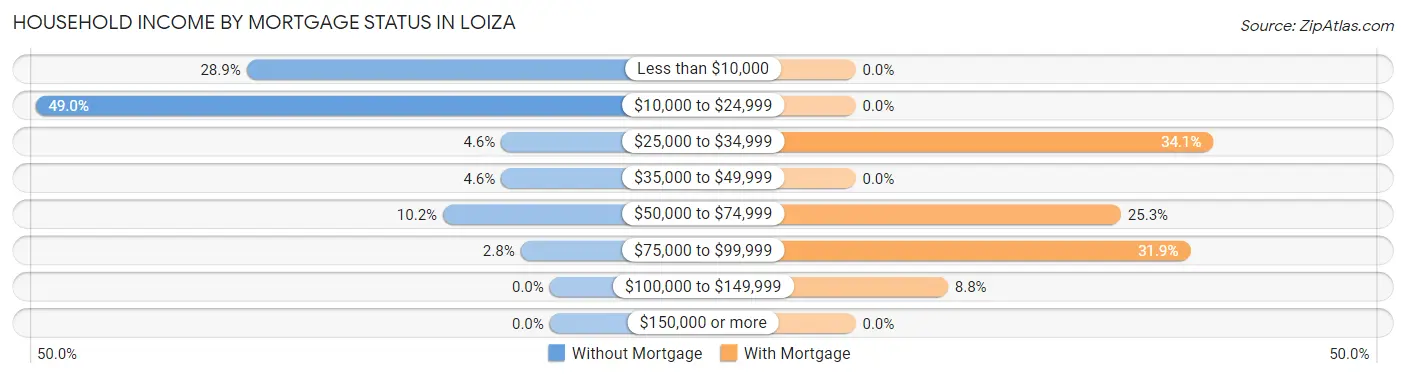
| Household Income | Without Mortgage | With Mortgage |
| Less than $10,000 | 125 (28.9%) | 0 (0.0%) |
| $10,000 to $24,999 | 212 (49.0%) | 0 (0.0%) |
| $25,000 to $34,999 | 20 (4.6%) | 31 (34.1%) |
| $35,000 to $49,999 | 20 (4.6%) | 0 (0.0%) |
| $50,000 to $74,999 | 44 (10.2%) | 23 (25.3%) |
| $75,000 to $99,999 | 12 (2.8%) | 29 (31.9%) |
| $100,000 to $149,999 | 0 (0.0%) | 8 (8.8%) |
| $150,000 or more | 0 (0.0%) | 0 (0.0%) |
| Total | 433 (100.0%) | 91 (100.0%) |
Property Value to Household Income Ratio in Loiza
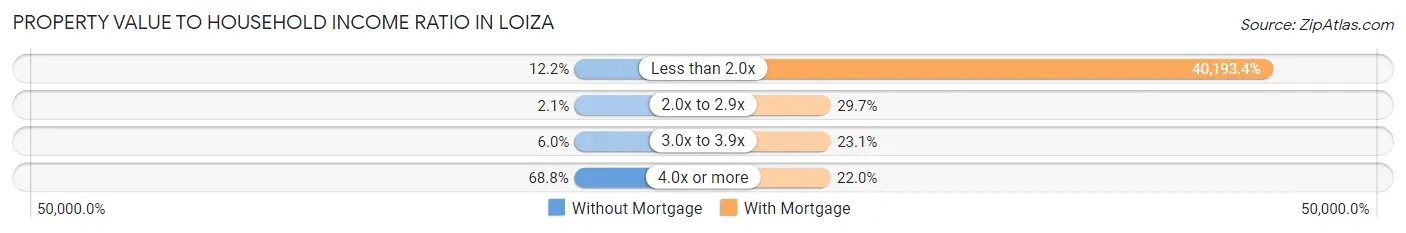
| Value-to-Income Ratio | Without Mortgage | With Mortgage |
| Less than 2.0x | 53 (12.2%) | 36,576 (40,193.4%) |
| 2.0x to 2.9x | 9 (2.1%) | 27 (29.7%) |
| 3.0x to 3.9x | 26 (6.0%) | 21 (23.1%) |
| 4.0x or more | 298 (68.8%) | 20 (22.0%) |
| Total | 433 (100.0%) | 91 (100.0%) |
Real Estate Taxes by Mortgage Status in Loiza
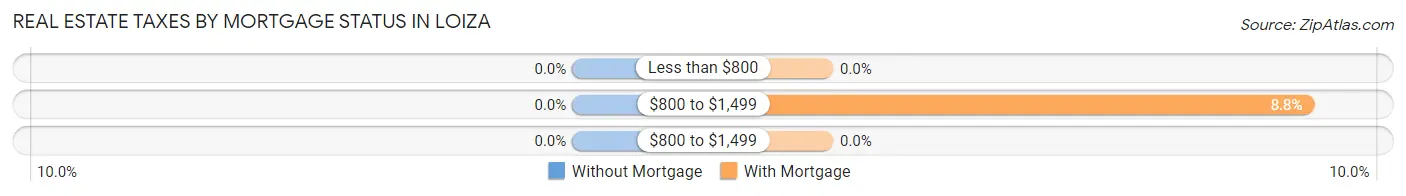
| Property Taxes | Without Mortgage | With Mortgage |
| Less than $800 | 0 (0.0%) | 0 (0.0%) |
| $800 to $1,499 | 0 (0.0%) | 8 (8.8%) |
| $800 to $1,499 | 0 (0.0%) | 0 (0.0%) |
| Total | 433 (100.0%) | 91 (100.0%) |
Health & Disability in Loiza
Health Insurance Coverage by Age in Loiza
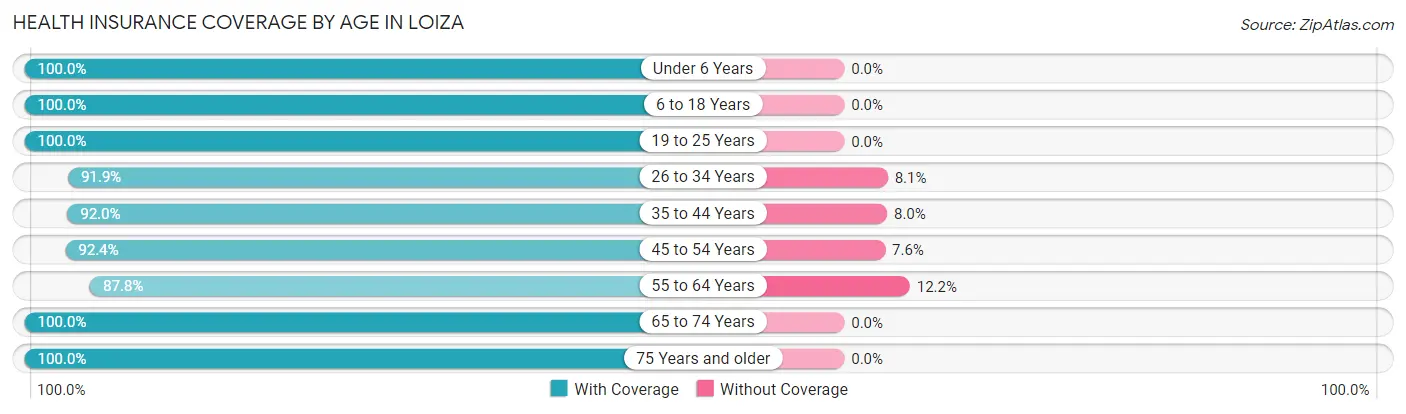
| Age Bracket | With Coverage | Without Coverage |
| Under 6 Years | 93 (100.0%) | 0 (0.0%) |
| 6 to 18 Years | 454 (100.0%) | 0 (0.0%) |
| 19 to 25 Years | 332 (100.0%) | 0 (0.0%) |
| 26 to 34 Years | 216 (91.9%) | 19 (8.1%) |
| 35 to 44 Years | 254 (92.0%) | 22 (8.0%) |
| 45 to 54 Years | 364 (92.4%) | 30 (7.6%) |
| 55 to 64 Years | 302 (87.8%) | 42 (12.2%) |
| 65 to 74 Years | 234 (100.0%) | 0 (0.0%) |
| 75 Years and older | 352 (100.0%) | 0 (0.0%) |
| Total | 2,601 (95.8%) | 113 (4.2%) |
Health Insurance Coverage by Citizenship Status in Loiza

| Citizenship Status | With Coverage | Without Coverage |
| Native Born | 93 (100.0%) | 0 (0.0%) |
| Foreign Born, Citizen | 454 (100.0%) | 0 (0.0%) |
| Foreign Born, not a Citizen | 332 (100.0%) | 0 (0.0%) |
Health Insurance Coverage by Household Income in Loiza
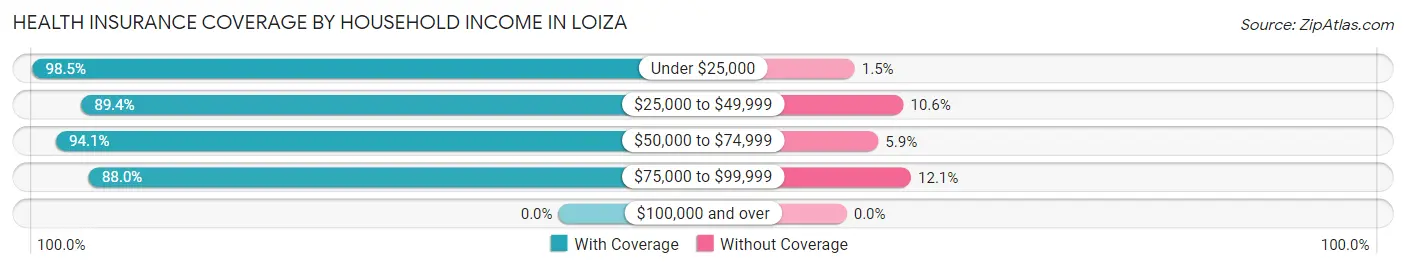
| Household Income | With Coverage | Without Coverage |
| Under $25,000 | 1,694 (98.5%) | 26 (1.5%) |
| $25,000 to $49,999 | 437 (89.4%) | 52 (10.6%) |
| $50,000 to $74,999 | 397 (94.1%) | 25 (5.9%) |
| $75,000 to $99,999 | 73 (87.9%) | 10 (12.0%) |
| $100,000 and over | 0 (0.0%) | 0 (0.0%) |
Public vs Private Health Insurance Coverage by Age in Loiza
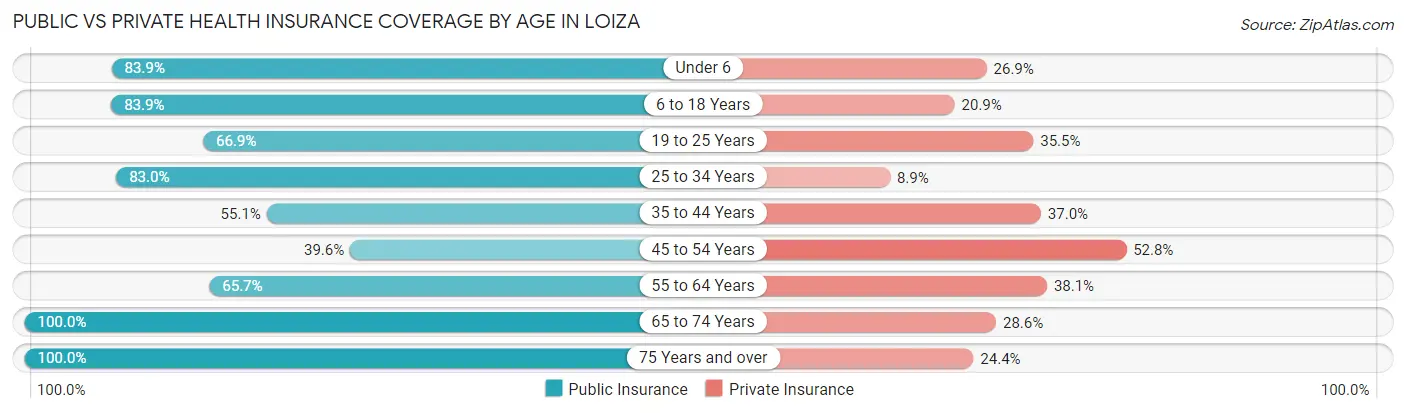
| Age Bracket | Public Insurance | Private Insurance |
| Under 6 | 78 (83.9%) | 25 (26.9%) |
| 6 to 18 Years | 381 (83.9%) | 95 (20.9%) |
| 19 to 25 Years | 222 (66.9%) | 118 (35.5%) |
| 25 to 34 Years | 195 (83.0%) | 21 (8.9%) |
| 35 to 44 Years | 152 (55.1%) | 102 (37.0%) |
| 45 to 54 Years | 156 (39.6%) | 208 (52.8%) |
| 55 to 64 Years | 226 (65.7%) | 131 (38.1%) |
| 65 to 74 Years | 234 (100.0%) | 67 (28.6%) |
| 75 Years and over | 352 (100.0%) | 86 (24.4%) |
| Total | 1,996 (73.5%) | 853 (31.4%) |
Disability Status by Sex by Age in Loiza
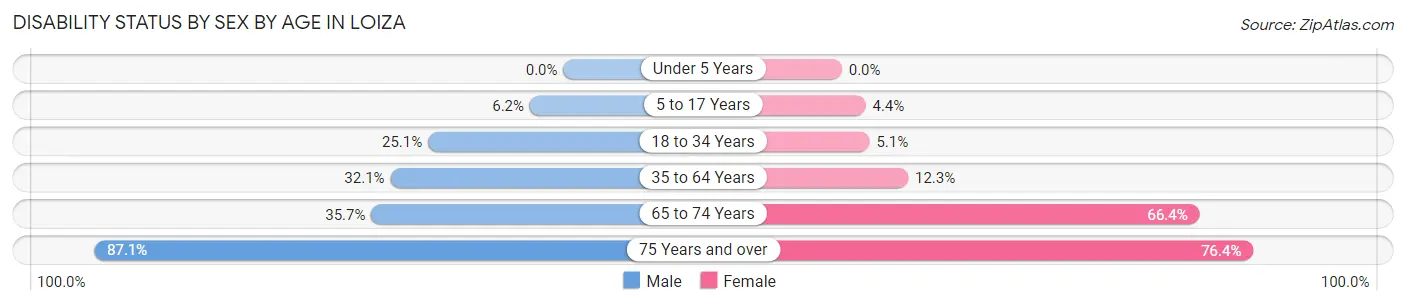
| Age Bracket | Male | Female |
| Under 5 Years | 0 (0.0%) | 0 (0.0%) |
| 5 to 17 Years | 12 (6.2%) | 12 (4.4%) |
| 18 to 34 Years | 51 (25.1%) | 20 (5.1%) |
| 35 to 64 Years | 148 (32.1%) | 68 (12.3%) |
| 65 to 74 Years | 41 (35.6%) | 79 (66.4%) |
| 75 Years and over | 115 (87.1%) | 168 (76.4%) |
Disability Class by Sex by Age in Loiza
Disability Class: Hearing Difficulty
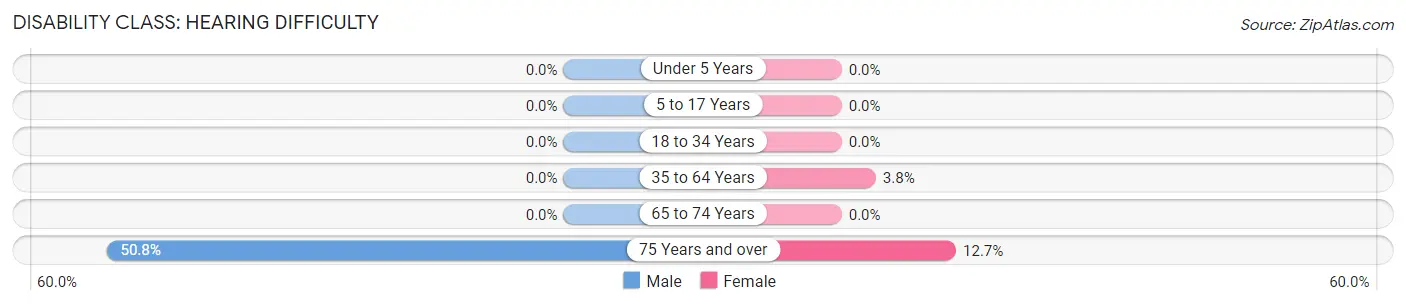
| Age Bracket | Male | Female |
| Under 5 Years | 0 (0.0%) | 0 (0.0%) |
| 5 to 17 Years | 0 (0.0%) | 0 (0.0%) |
| 18 to 34 Years | 0 (0.0%) | 0 (0.0%) |
| 35 to 64 Years | 0 (0.0%) | 21 (3.8%) |
| 65 to 74 Years | 0 (0.0%) | 0 (0.0%) |
| 75 Years and over | 67 (50.8%) | 28 (12.7%) |
Disability Class: Vision Difficulty
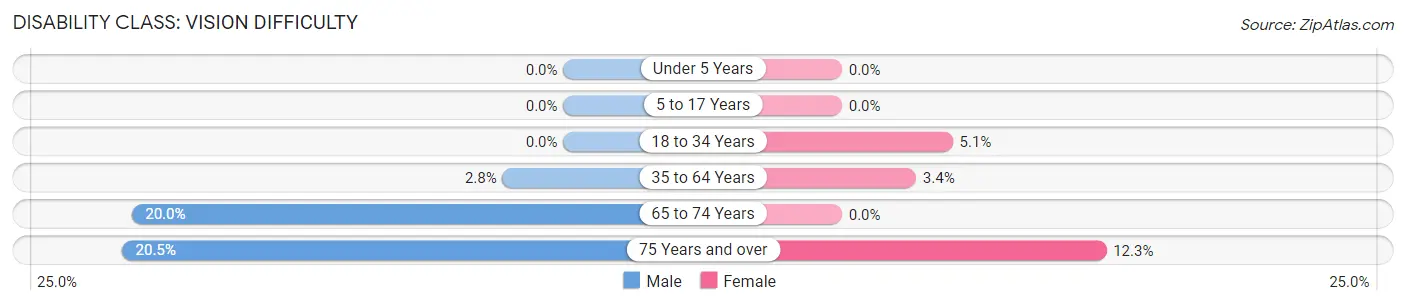
| Age Bracket | Male | Female |
| Under 5 Years | 0 (0.0%) | 0 (0.0%) |
| 5 to 17 Years | 0 (0.0%) | 0 (0.0%) |
| 18 to 34 Years | 0 (0.0%) | 20 (5.1%) |
| 35 to 64 Years | 13 (2.8%) | 19 (3.4%) |
| 65 to 74 Years | 23 (20.0%) | 0 (0.0%) |
| 75 Years and over | 27 (20.4%) | 27 (12.3%) |
Disability Class: Cognitive Difficulty
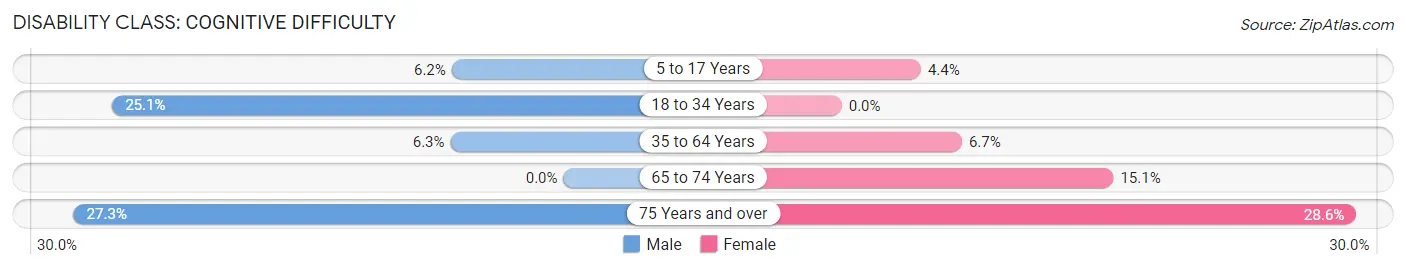
| Age Bracket | Male | Female |
| 5 to 17 Years | 12 (6.2%) | 12 (4.4%) |
| 18 to 34 Years | 51 (25.1%) | 0 (0.0%) |
| 35 to 64 Years | 29 (6.3%) | 37 (6.7%) |
| 65 to 74 Years | 0 (0.0%) | 18 (15.1%) |
| 75 Years and over | 36 (27.3%) | 63 (28.6%) |
Disability Class: Ambulatory Difficulty
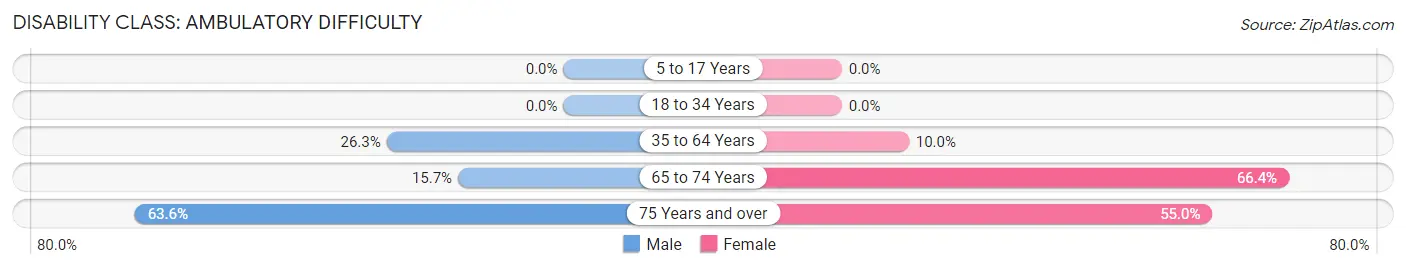
| Age Bracket | Male | Female |
| 5 to 17 Years | 0 (0.0%) | 0 (0.0%) |
| 18 to 34 Years | 0 (0.0%) | 0 (0.0%) |
| 35 to 64 Years | 121 (26.3%) | 55 (10.0%) |
| 65 to 74 Years | 18 (15.7%) | 79 (66.4%) |
| 75 Years and over | 84 (63.6%) | 121 (55.0%) |
Disability Class: Self-Care Difficulty
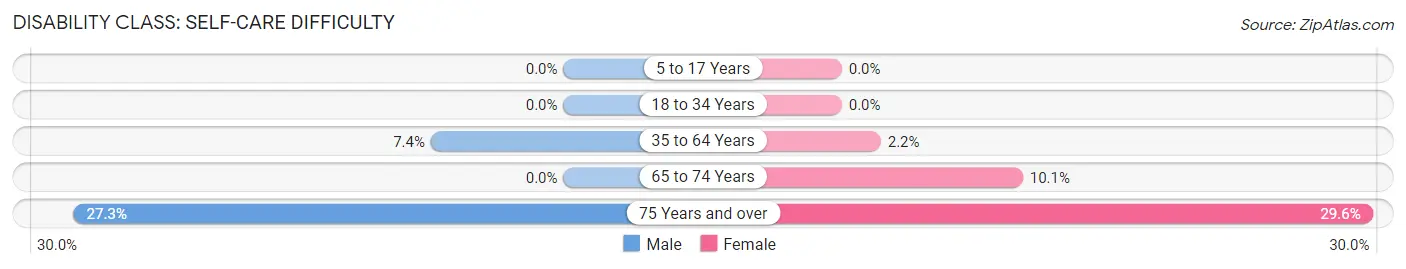
| Age Bracket | Male | Female |
| 5 to 17 Years | 0 (0.0%) | 0 (0.0%) |
| 18 to 34 Years | 0 (0.0%) | 0 (0.0%) |
| 35 to 64 Years | 34 (7.4%) | 12 (2.2%) |
| 65 to 74 Years | 0 (0.0%) | 12 (10.1%) |
| 75 Years and over | 36 (27.3%) | 65 (29.5%) |
Technology Access in Loiza
Computing Device Access in Loiza
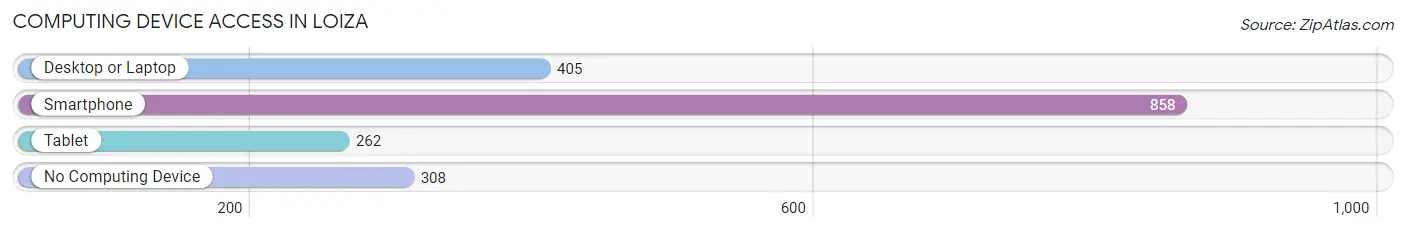
| Device Type | # Households | % Households |
| Desktop or Laptop | 405 | 34.4% |
| Smartphone | 858 | 72.8% |
| Tablet | 262 | 22.2% |
| No Computing Device | 308 | 26.1% |
| Total | 1,179 | 100.0% |
Internet Access in Loiza
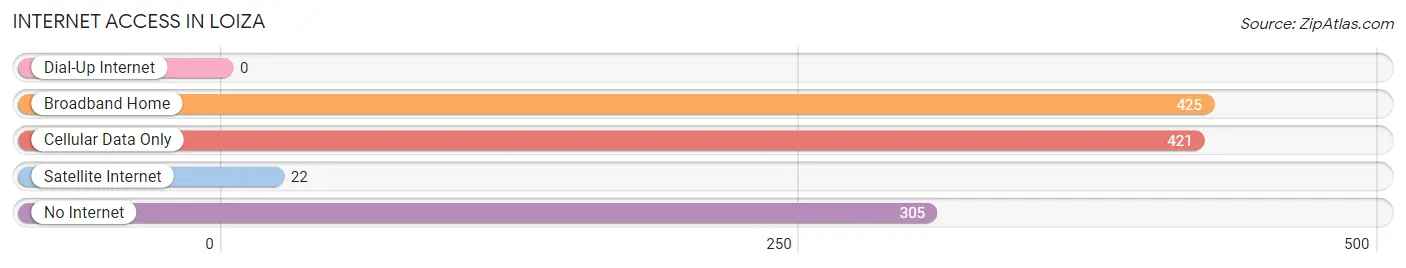
| Internet Type | # Households | % Households |
| Dial-Up Internet | 0 | 0.0% |
| Broadband Home | 425 | 36.0% |
| Cellular Data Only | 421 | 35.7% |
| Satellite Internet | 22 | 1.9% |
| No Internet | 305 | 25.9% |
| Total | 1,179 | 100.0% |
Loiza Summary
Loiza, Puerto Rico is a municipality located on the northeast coast of the island of Puerto Rico. It is part of the San Juan-Caguas-Guaynabo Metropolitan Statistical Area. The municipality is known for its rich cultural heritage, which is a mix of African, Taíno, and Spanish influences.
Geography
Loiza is located on the northeast coast of Puerto Rico, about 20 miles east of San Juan. It is bordered by the municipalities of Canóvanas to the west, Carolina to the north, and Naguabo to the east. The municipality covers an area of approximately 24 square miles and is home to a population of approximately 32,000 people.
The terrain of Loiza is mostly flat, with some hills in the western part of the municipality. The municipality is home to several rivers, including the Loíza River, which flows through the center of the municipality. The municipality is also home to several beaches, including the popular Balneario de Luquillo beach.
History
The area that is now Loiza was originally inhabited by the Taíno people. The Taíno were a group of indigenous people who lived in the Caribbean before the arrival of the Spanish. The Taíno were eventually displaced by the Spanish, who established a settlement in the area in the 16th century.
The area was originally part of the municipality of San Juan, but it was separated in 1719 and became its own municipality. The municipality was named after the Loíza River, which flows through the area.
In the 19th century, the area became a popular destination for African slaves who had escaped from the nearby island of St. Thomas. These slaves established a community in the area and brought with them their own culture and traditions. This culture is still evident in the area today, and the municipality is known for its Afro-Caribbean culture.
Economy
The economy of Loiza is largely based on tourism and agriculture. The municipality is home to several popular tourist attractions, including the Balneario de Luquillo beach and the Loíza River. The municipality is also home to several agricultural businesses, including sugar cane and tobacco farms.
The municipality is also home to several manufacturing businesses, including a pharmaceutical plant and a plastics factory. The municipality is also home to several small businesses, including restaurants, shops, and hotels.
Demographics
As of the 2010 census, the population of Loiza was 32,097. The population is mostly of mixed African and Taíno descent, with a small percentage of white and Asian residents. The majority of the population is Roman Catholic, and Spanish is the primary language spoken in the municipality.
The median household income in Loiza is $17,000, which is lower than the national average. The unemployment rate in the municipality is also higher than the national average, at around 15%.
Conclusion
Loiza is a municipality located on the northeast coast of Puerto Rico. It is known for its rich cultural heritage, which is a mix of African, Taíno, and Spanish influences. The economy of the municipality is largely based on tourism and agriculture, and the population is mostly of mixed African and Taíno descent. The median household income in Loiza is lower than the national average, and the unemployment rate is higher than the national average.
Common Questions
What is Per Capita Income in Loiza?
Per Capita income in Loiza is $9,047.
What is the Median Family Income in Loiza?
Median Family Income in Loiza is $15,808.
What is the Median Household income in Loiza?
Median Household Income in Loiza is $12,104.
What is Income or Wage Gap in Loiza?
Income or Wage Gap in Loiza is 27.9%.
Women in Loiza earn 72.1 cents for every dollar earned by a man.
What is Inequality or Gini Index in Loiza?
Inequality or Gini Index in Loiza is 0.53.
What is the Total Population of Loiza?
Total Population of Loiza is 2,714.
What is the Total Male Population of Loiza?
Total Male Population of Loiza is 1,122.
What is the Total Female Population of Loiza?
Total Female Population of Loiza is 1,592.
What is the Ratio of Males per 100 Females in Loiza?
There are 70.48 Males per 100 Females in Loiza.
What is the Ratio of Females per 100 Males in Loiza?
There are 141.89 Females per 100 Males in Loiza.
What is the Median Population Age in Loiza?
Median Population Age in Loiza is 44.1 Years.
What is the Average Family Size in Loiza
Average Family Size in Loiza is 3.0 People.
What is the Average Household Size in Loiza
Average Household Size in Loiza is 2.3 People.
How Large is the Labor Force in Loiza?
There are 1,053 People in the Labor Forcein in Loiza.
What is the Percentage of People in the Labor Force in Loiza?
46.2% of People are in the Labor Force in Loiza.
What is the Unemployment Rate in Loiza?
Unemployment Rate in Loiza is 33.2%.