San Lorenzo, PR Map & Demographics
San Lorenzo Map
San Lorenzo Overview
$12,782
PER CAPITA INCOME
$26,225
AVG FAMILY INCOME
$22,835
AVG HOUSEHOLD INCOME
30.4%
WAGE / INCOME GAP [ % ]
69.6¢/ $1
WAGE / INCOME GAP [ $ ]
$12,962
FAMILY INCOME DEFICIT
0.48
INEQUALITY / GINI INDEX
8,588
TOTAL POPULATION
3,875
MALE POPULATION
4,713
FEMALE POPULATION
82.22
MALES / 100 FEMALES
121.63
FEMALES / 100 MALES
41.9
MEDIAN AGE
3.3
AVG FAMILY SIZE
2.6
AVG HOUSEHOLD SIZE
2,865
LABOR FORCE [ PEOPLE ]
39.9%
PERCENT IN LABOR FORCE
6.3%
UNEMPLOYMENT RATE
San Lorenzo Zip Codes
San Lorenzo Area Codes
Income in San Lorenzo
Income Overview in San Lorenzo
Per Capita Income in San Lorenzo is $12,782, while median incomes of families and households are $26,225 and $22,835 respectively.
| Characteristic | Number | Measure |
| Per Capita Income | 8,588 | $12,782 |
| Median Family Income | 2,001 | $26,225 |
| Mean Family Income | 2,001 | $32,612 |
| Median Household Income | 3,278 | $22,835 |
| Mean Household Income | 3,278 | $30,247 |
| Income Deficit | 2,001 | $12,962 |
| Wage / Income Gap (%) | 8,588 | 30.44% |
| Wage / Income Gap ($) | 8,588 | 69.56¢ per $1 |
| Gini / Inequality Index | 8,588 | 0.48 |
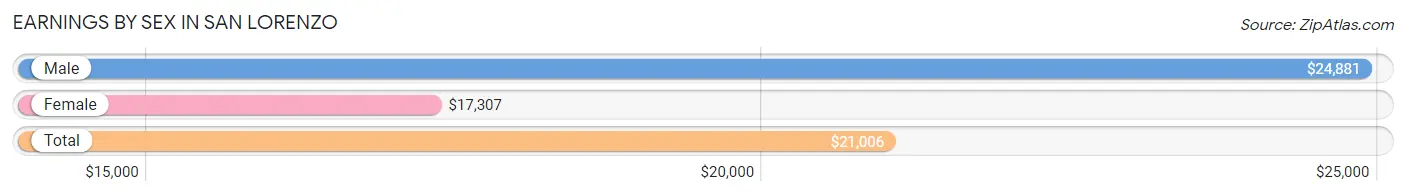
Earnings by Sex in San Lorenzo
Average Earnings in San Lorenzo are $21,006, $24,881 for men and $17,307 for women, a difference of 30.4%.
| Sex | Number | Average Earnings |
| Male | 1,496 (51.4%) | $24,881 |
| Female | 1,417 (48.6%) | $17,307 |
| Total | 2,913 (100.0%) | $21,006 |
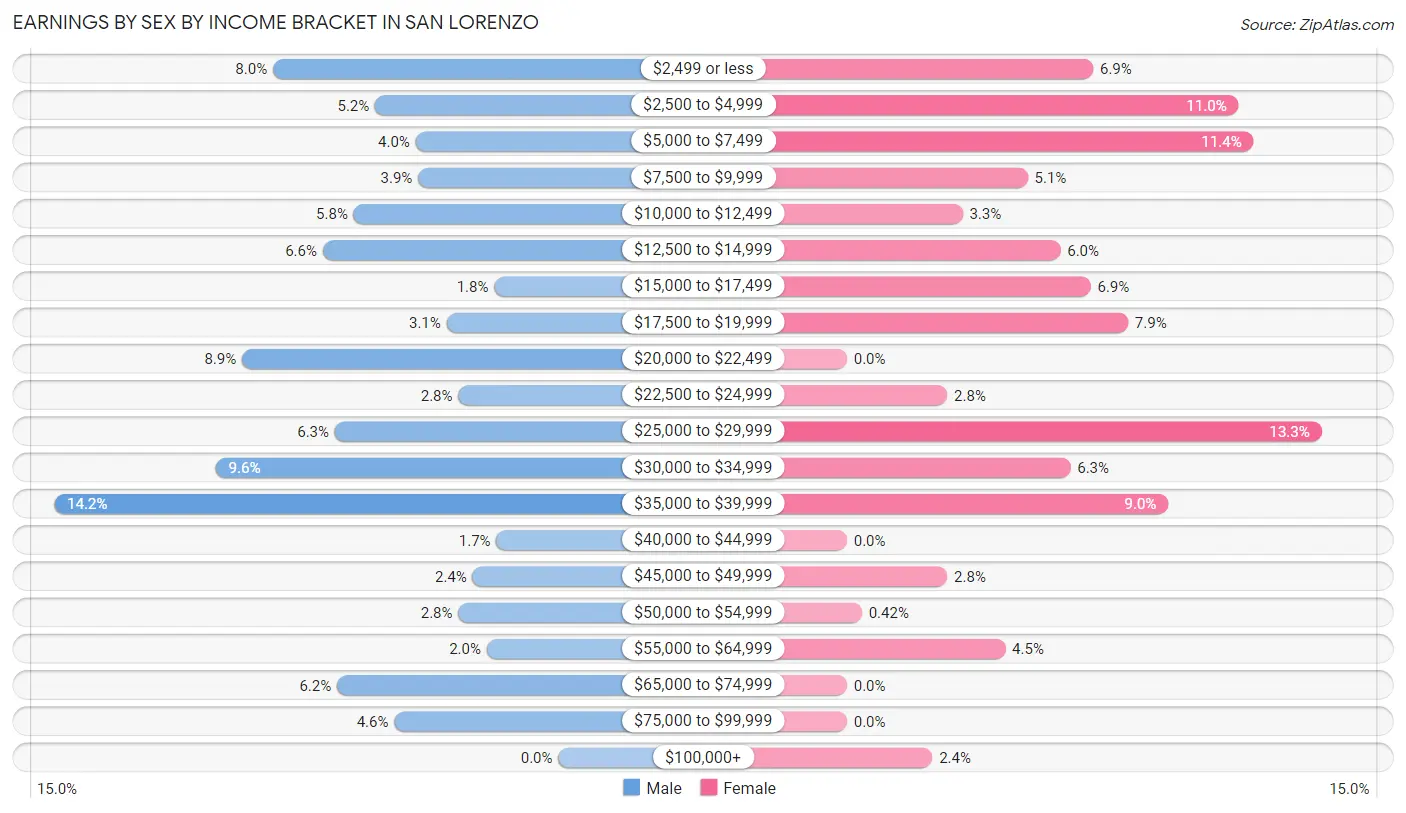
Earnings by Sex by Income Bracket in San Lorenzo
The most common earnings brackets in San Lorenzo are $35,000 to $39,999 for men (212 | 14.2%) and $25,000 to $29,999 for women (189 | 13.3%).
| Income | Male | Female |
| $2,499 or less | 120 (8.0%) | 98 (6.9%) |
| $2,500 to $4,999 | 77 (5.1%) | 156 (11.0%) |
| $5,000 to $7,499 | 60 (4.0%) | 162 (11.4%) |
| $7,500 to $9,999 | 59 (3.9%) | 72 (5.1%) |
| $10,000 to $12,499 | 86 (5.8%) | 46 (3.3%) |
| $12,500 to $14,999 | 99 (6.6%) | 85 (6.0%) |
| $15,000 to $17,499 | 27 (1.8%) | 97 (6.9%) |
| $17,500 to $19,999 | 47 (3.1%) | 112 (7.9%) |
| $20,000 to $22,499 | 133 (8.9%) | 0 (0.0%) |
| $22,500 to $24,999 | 42 (2.8%) | 40 (2.8%) |
| $25,000 to $29,999 | 94 (6.3%) | 189 (13.3%) |
| $30,000 to $34,999 | 144 (9.6%) | 89 (6.3%) |
| $35,000 to $39,999 | 212 (14.2%) | 128 (9.0%) |
| $40,000 to $44,999 | 26 (1.7%) | 0 (0.0%) |
| $45,000 to $49,999 | 36 (2.4%) | 40 (2.8%) |
| $50,000 to $54,999 | 42 (2.8%) | 6 (0.4%) |
| $55,000 to $64,999 | 30 (2.0%) | 63 (4.4%) |
| $65,000 to $74,999 | 93 (6.2%) | 0 (0.0%) |
| $75,000 to $99,999 | 69 (4.6%) | 0 (0.0%) |
| $100,000+ | 0 (0.0%) | 34 (2.4%) |
| Total | 1,496 (100.0%) | 1,417 (100.0%) |
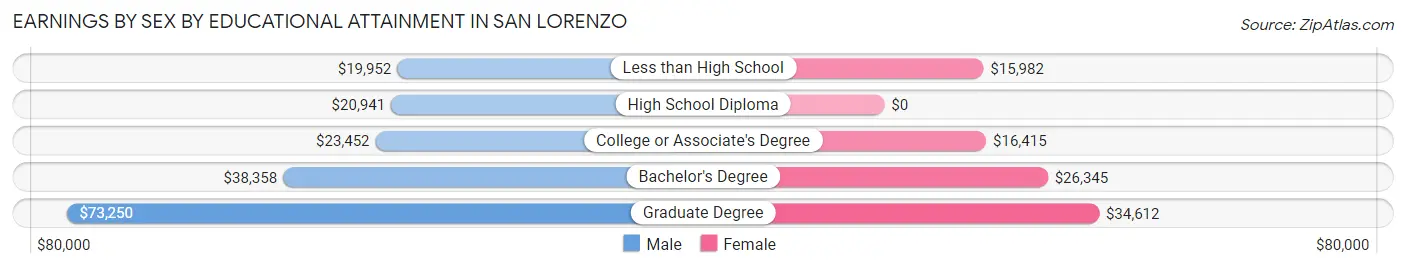
Earnings by Sex by Educational Attainment in San Lorenzo
Average earnings in San Lorenzo are $27,753 for men and $19,125 for women, a difference of 31.1%. Men with an educational attainment of graduate degree enjoy the highest average annual earnings of $73,250, while those with less than high school education earn the least with $19,952. Women with an educational attainment of graduate degree earn the most with the average annual earnings of $34,612, while those with less than high school education have the smallest earnings of $15,982.
| Educational Attainment | Male Income | Female Income |
| Less than High School | $19,952 | $15,982 |
| High School Diploma | $20,941 | $0 |
| College or Associate's Degree | $23,452 | $16,415 |
| Bachelor's Degree | $38,358 | $26,345 |
| Graduate Degree | $73,250 | $34,612 |
| Total | $27,753 | $19,125 |
Family Income in San Lorenzo
Family Income Brackets in San Lorenzo
According to the San Lorenzo family income data, there are 500 families falling into the less than $10,000 income range, which is the most common income bracket and makes up 25.0% of all families.
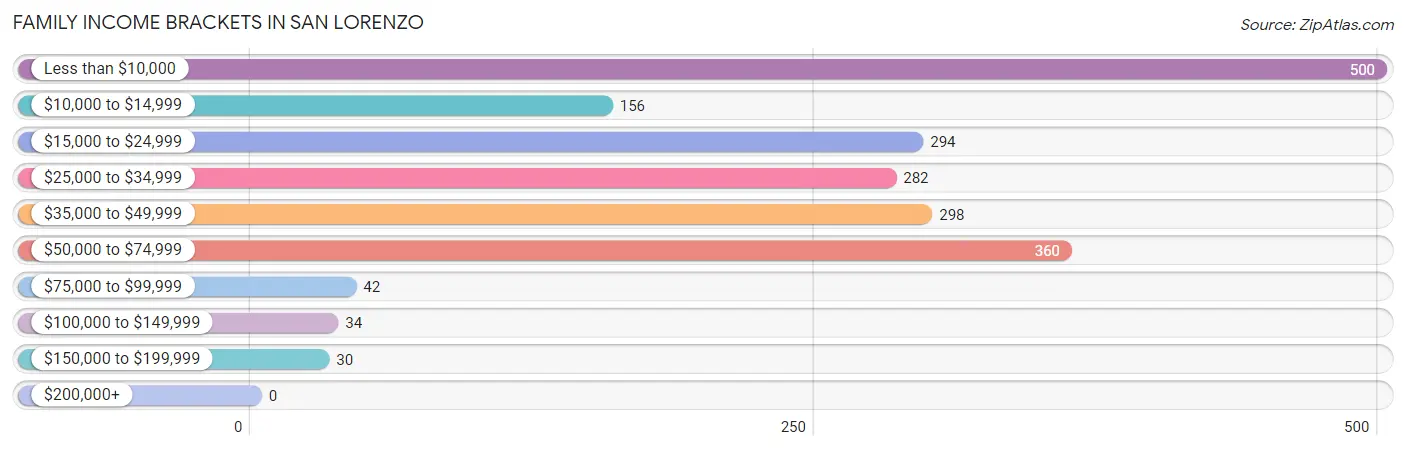
| Income Bracket | # Families | % Families |
| Less than $10,000 | 500 | 25.0% |
| $10,000 to $14,999 | 156 | 7.8% |
| $15,000 to $24,999 | 294 | 14.7% |
| $25,000 to $34,999 | 282 | 14.1% |
| $35,000 to $49,999 | 298 | 14.9% |
| $50,000 to $74,999 | 360 | 18.0% |
| $75,000 to $99,999 | 42 | 2.1% |
| $100,000 to $149,999 | 34 | 1.7% |
| $150,000 to $199,999 | 30 | 1.5% |
| $200,000+ | 0 | 0.0% |
Family Income by Famaliy Size in San Lorenzo
4-person families (407 | 20.3%) account for the highest median family income in San Lorenzo with $41,307 per family, while 2-person families (1,003 | 50.1%) have the highest median income of $10,684 per family member.
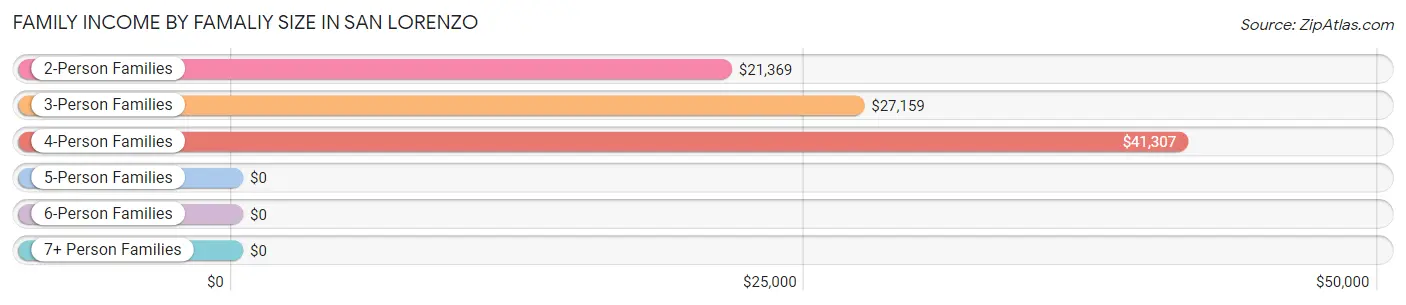
| Income Bracket | # Families | Median Income |
| 2-Person Families | 1,003 (50.1%) | $21,369 |
| 3-Person Families | 473 (23.6%) | $27,159 |
| 4-Person Families | 407 (20.3%) | $41,307 |
| 5-Person Families | 84 (4.2%) | $0 |
| 6-Person Families | 34 (1.7%) | $0 |
| 7+ Person Families | 0 (0.0%) | $0 |
| Total | 2,001 (100.0%) | $26,225 |
Family Income by Number of Earners in San Lorenzo
The median family income in San Lorenzo is $26,225, with families comprising 2 earners (303) having the highest median family income of $57,904, while families with no earners (714) have the lowest median family income of $15,341, accounting for 15.1% and 35.7% of families, respectively.
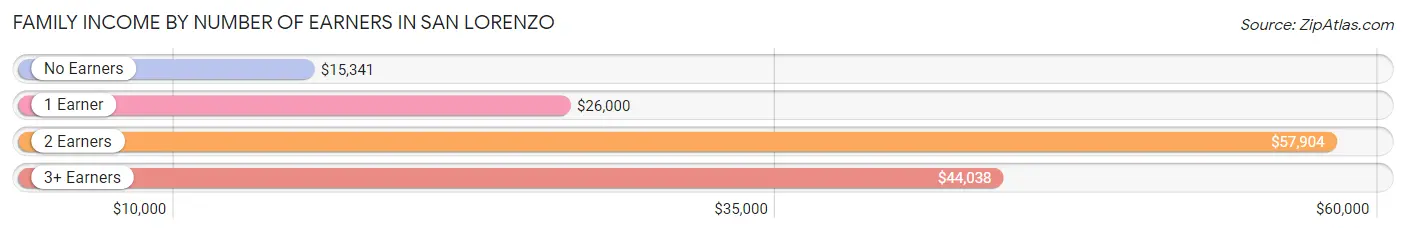
| Number of Earners | # Families | Median Income |
| No Earners | 714 (35.7%) | $15,341 |
| 1 Earner | 912 (45.6%) | $26,000 |
| 2 Earners | 303 (15.1%) | $57,904 |
| 3+ Earners | 72 (3.6%) | $44,038 |
| Total | 2,001 (100.0%) | $26,225 |
Household Income in San Lorenzo
Household Income Brackets in San Lorenzo
With 859 households falling in the category, the less than $10,000 income range is the most frequent in San Lorenzo, accounting for 26.2% of all households.
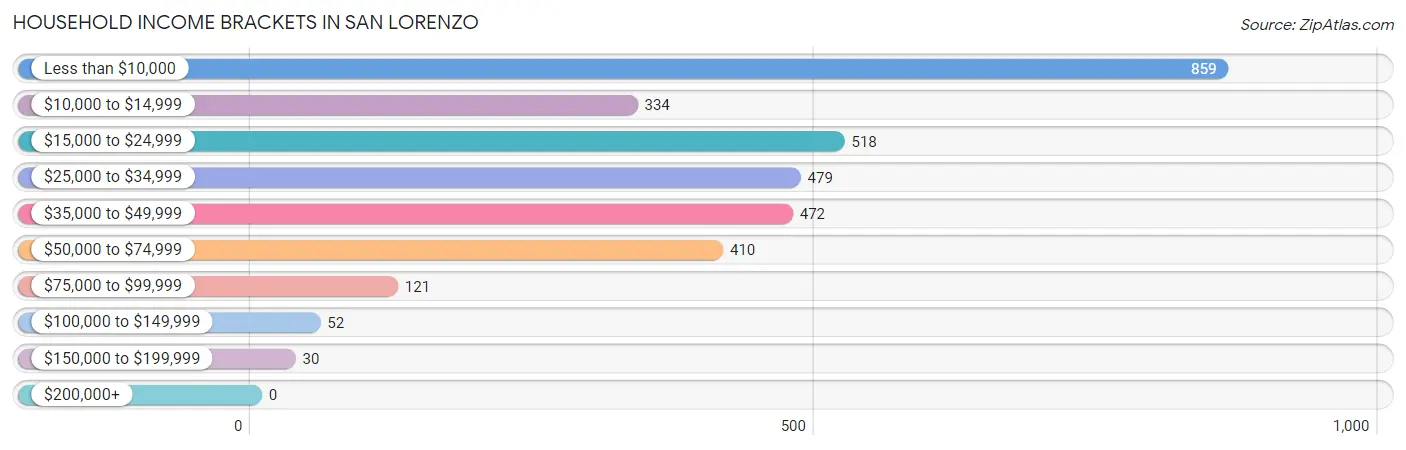
| Income Bracket | # Households | % Households |
| Less than $10,000 | 859 | 26.2% |
| $10,000 to $14,999 | 334 | 10.2% |
| $15,000 to $24,999 | 518 | 15.8% |
| $25,000 to $34,999 | 479 | 14.6% |
| $35,000 to $49,999 | 472 | 14.4% |
| $50,000 to $74,999 | 410 | 12.5% |
| $75,000 to $99,999 | 121 | 3.7% |
| $100,000 to $149,999 | 52 | 1.6% |
| $150,000 to $199,999 | 30 | 0.9% |
| $200,000+ | 0 | 0.0% |
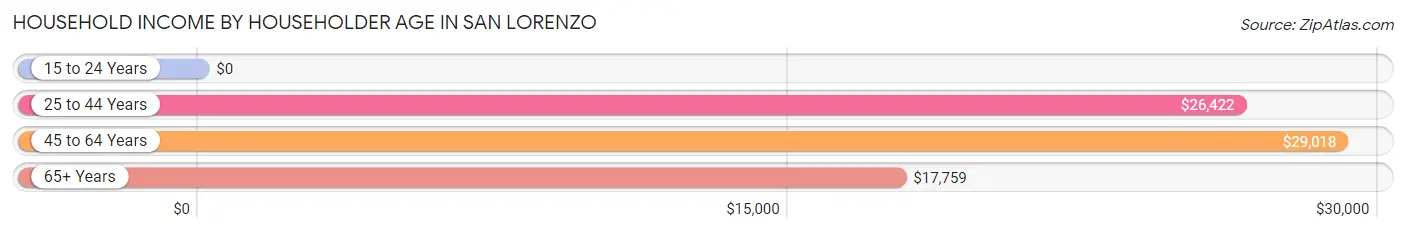
Household Income by Householder Age in San Lorenzo
The median household income in San Lorenzo is $22,835, with the highest median household income of $29,018 found in the 45 to 64 years age bracket for the primary householder. A total of 1,126 households (34.4%) fall into this category. Meanwhile, the 15 to 24 years age bracket for the primary householder has the lowest median household income of $0, with 14 households (0.4%) in this group.
| Income Bracket | # Households | Median Income |
| 15 to 24 Years | 14 (0.4%) | $0 |
| 25 to 44 Years | 1,066 (32.5%) | $26,422 |
| 45 to 64 Years | 1,126 (34.4%) | $29,018 |
| 65+ Years | 1,072 (32.7%) | $17,759 |
| Total | 3,278 (100.0%) | $22,835 |
Poverty in San Lorenzo
Income Below Poverty by Sex and Age in San Lorenzo
With 37.0% poverty level for males and 47.7% for females among the residents of San Lorenzo, 6 to 11 year old males and 5 year old females are the most vulnerable to poverty, with 243 males (67.3%) and 57 females (100.0%) in their respective age groups living below the poverty level.
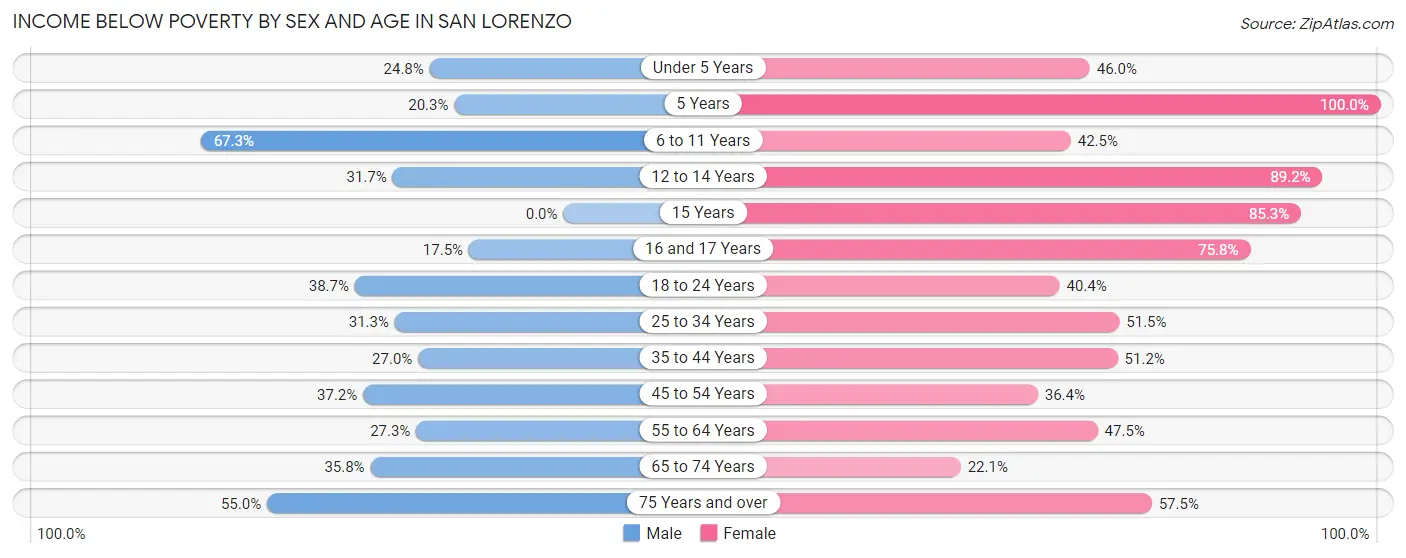
| Age Bracket | Male | Female |
| Under 5 Years | 35 (24.8%) | 64 (46.0%) |
| 5 Years | 16 (20.3%) | 57 (100.0%) |
| 6 to 11 Years | 243 (67.3%) | 119 (42.5%) |
| 12 to 14 Years | 39 (31.7%) | 124 (89.2%) |
| 15 Years | 0 (0.0%) | 52 (85.3%) |
| 16 and 17 Years | 17 (17.5%) | 116 (75.8%) |
| 18 to 24 Years | 108 (38.7%) | 213 (40.4%) |
| 25 to 34 Years | 143 (31.3%) | 272 (51.5%) |
| 35 to 44 Years | 114 (27.0%) | 362 (51.2%) |
| 45 to 54 Years | 255 (37.2%) | 223 (36.4%) |
| 55 to 64 Years | 118 (27.3%) | 255 (47.5%) |
| 65 to 74 Years | 140 (35.8%) | 102 (22.1%) |
| 75 Years and over | 203 (55.0%) | 275 (57.5%) |
| Total | 1,431 (37.0%) | 2,234 (47.7%) |
Income Above Poverty by Sex and Age in San Lorenzo
According to the poverty statistics in San Lorenzo, males aged 15 years and females aged 65 to 74 years are the age groups that are most secure financially, with 100.0% of males and 77.9% of females in these age groups living above the poverty line.
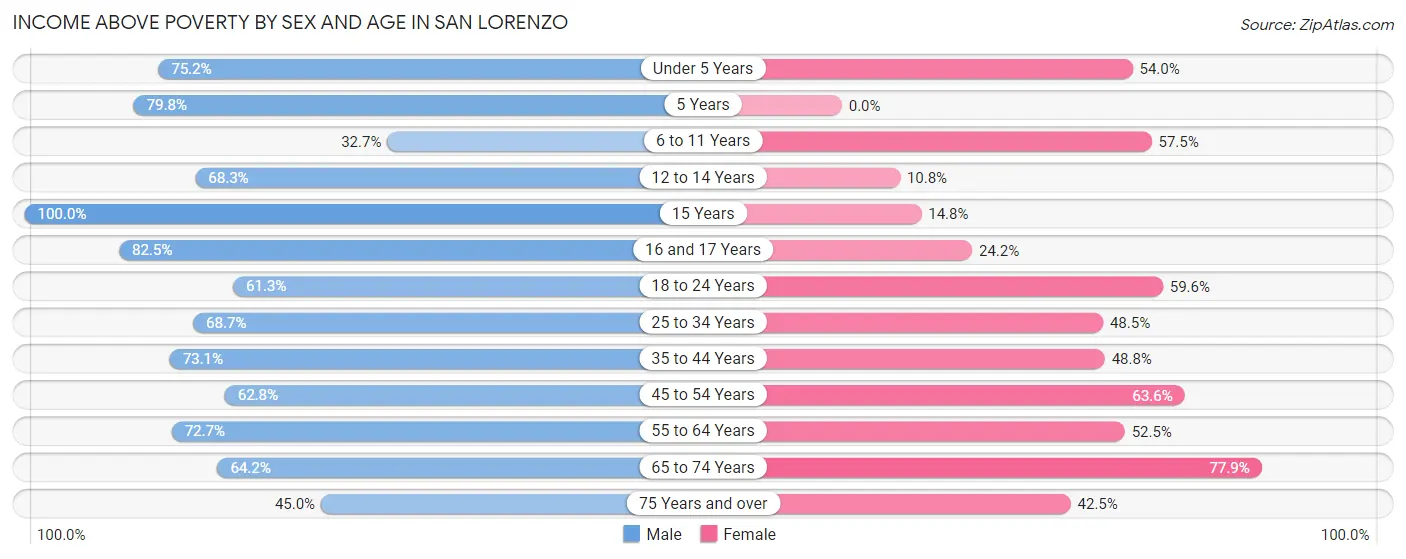
| Age Bracket | Male | Female |
| Under 5 Years | 106 (75.2%) | 75 (54.0%) |
| 5 Years | 63 (79.7%) | 0 (0.0%) |
| 6 to 11 Years | 118 (32.7%) | 161 (57.5%) |
| 12 to 14 Years | 84 (68.3%) | 15 (10.8%) |
| 15 Years | 27 (100.0%) | 9 (14.7%) |
| 16 and 17 Years | 80 (82.5%) | 37 (24.2%) |
| 18 to 24 Years | 171 (61.3%) | 314 (59.6%) |
| 25 to 34 Years | 314 (68.7%) | 256 (48.5%) |
| 35 to 44 Years | 309 (73.1%) | 345 (48.8%) |
| 45 to 54 Years | 431 (62.8%) | 390 (63.6%) |
| 55 to 64 Years | 314 (72.7%) | 282 (52.5%) |
| 65 to 74 Years | 251 (64.2%) | 360 (77.9%) |
| 75 Years and over | 166 (45.0%) | 203 (42.5%) |
| Total | 2,434 (63.0%) | 2,447 (52.3%) |
Income Below Poverty Among Married-Couple Families in San Lorenzo
The poverty statistics for married-couple families in San Lorenzo show that 21.6% or 202 of the total 933 families live below the poverty line. Families with 1 or 2 children have the highest poverty rate of 28.0%, comprising of 86 families. On the other hand, families with 3 or 4 children have the lowest poverty rate of 0.0%, which includes 0 families.
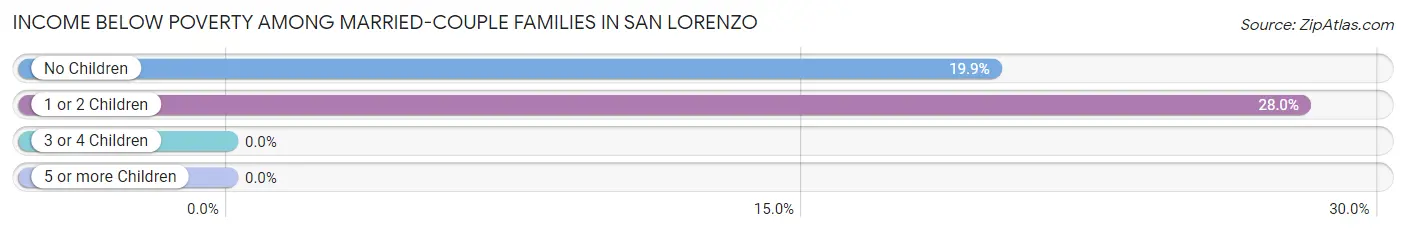
| Children | Above Poverty | Below Poverty |
| No Children | 466 (80.1%) | 116 (19.9%) |
| 1 or 2 Children | 221 (72.0%) | 86 (28.0%) |
| 3 or 4 Children | 44 (100.0%) | 0 (0.0%) |
| 5 or more Children | 0 (0.0%) | 0 (0.0%) |
| Total | 731 (78.3%) | 202 (21.6%) |
Income Below Poverty Among Single-Parent Households in San Lorenzo
According to the poverty data in San Lorenzo, 47.4% or 100 single-father households and 63.7% or 546 single-mother households are living below the poverty line. Among single-father households, those with no children have the highest poverty rate, with 65 households (56.5%) experiencing poverty. Likewise, among single-mother households, those with 3 or 4 children have the highest poverty rate, with 78 households (100.0%) falling below the poverty line.
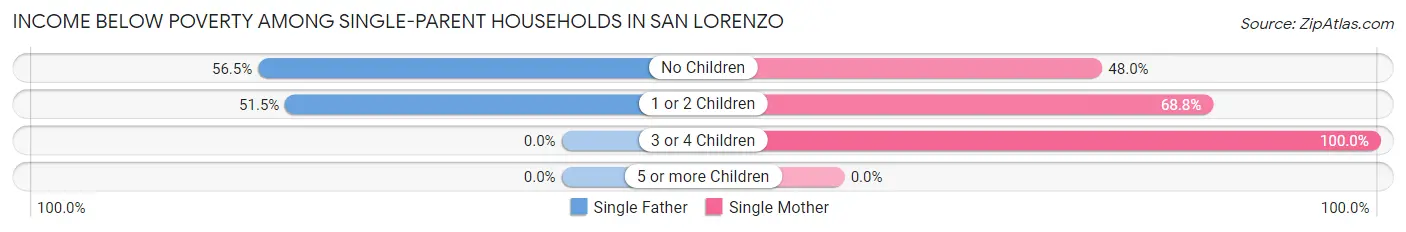
| Children | Single Father | Single Mother |
| No Children | 65 (56.5%) | 157 (48.0%) |
| 1 or 2 Children | 35 (51.5%) | 311 (68.8%) |
| 3 or 4 Children | 0 (0.0%) | 78 (100.0%) |
| 5 or more Children | 0 (0.0%) | 0 (0.0%) |
| Total | 100 (47.4%) | 546 (63.7%) |
Income Below Poverty Among Married-Couple vs Single-Parent Households in San Lorenzo
The poverty data for San Lorenzo shows that 202 of the married-couple family households (21.6%) and 646 of the single-parent households (60.5%) are living below the poverty level. Within the married-couple family households, those with 1 or 2 children have the highest poverty rate, with 86 households (28.0%) falling below the poverty line. Among the single-parent households, those with 3 or 4 children have the highest poverty rate, with 78 household (73.6%) living below poverty.
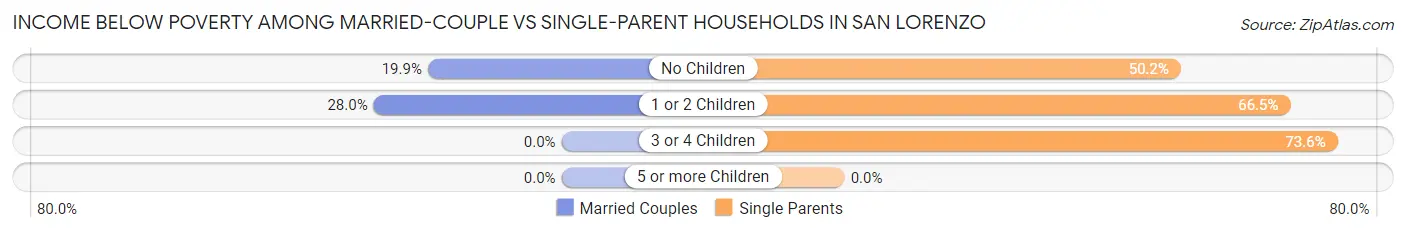
| Children | Married-Couple Families | Single-Parent Households |
| No Children | 116 (19.9%) | 222 (50.2%) |
| 1 or 2 Children | 86 (28.0%) | 346 (66.5%) |
| 3 or 4 Children | 0 (0.0%) | 78 (73.6%) |
| 5 or more Children | 0 (0.0%) | 0 (0.0%) |
| Total | 202 (21.6%) | 646 (60.5%) |
Race in San Lorenzo
The most populous races in San Lorenzo are Hispanic or Latino (8,563 | 99.7%), Some other Race (4,729 | 55.1%), and Black / African American (2,028 | 23.6%).
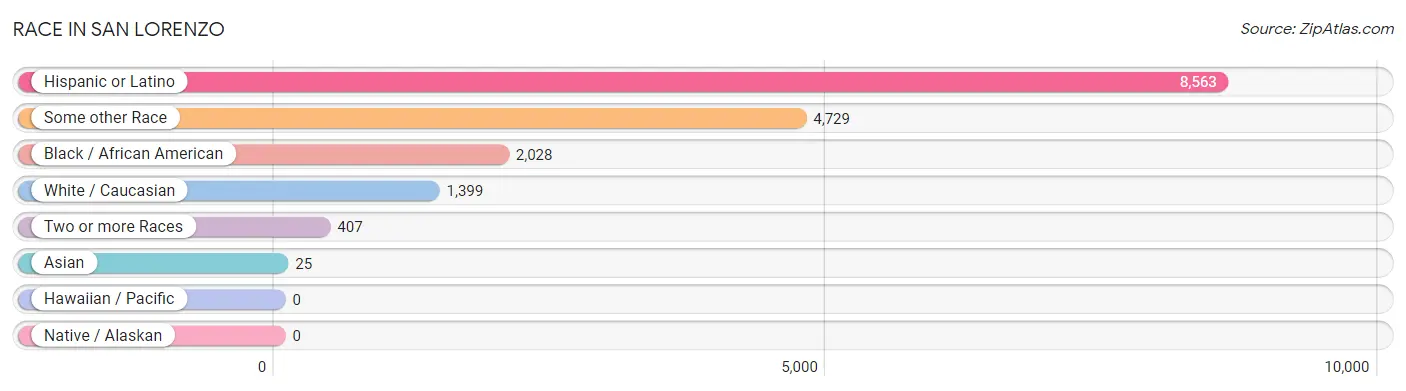
| Race | # Population | % Population |
| Asian | 25 | 0.3% |
| Black / African American | 2,028 | 23.6% |
| Hawaiian / Pacific | 0 | 0.0% |
| Hispanic or Latino | 8,563 | 99.7% |
| Native / Alaskan | 0 | 0.0% |
| White / Caucasian | 1,399 | 16.3% |
| Two or more Races | 407 | 4.7% |
| Some other Race | 4,729 | 55.1% |
| Total | 8,588 | 100.0% |
Ancestry in San Lorenzo
The most populous ancestries reported in San Lorenzo are Puerto Rican (8,523 | 99.2%), American (90 | 1.1%), Colombian (40 | 0.5%), South American (40 | 0.5%), and Indian (Asian) (25 | 0.3%), together accounting for 101.5% of all San Lorenzo residents.
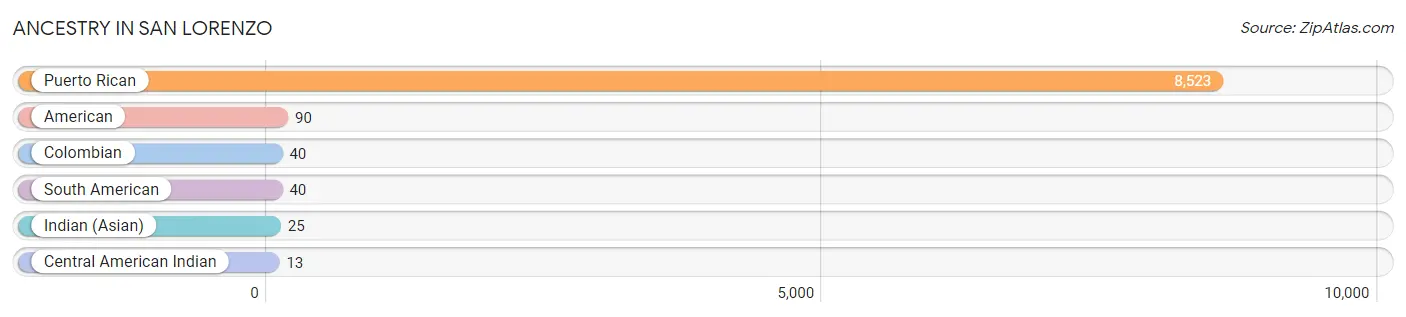
| Ancestry | # Population | % Population |
| American | 90 | 1.1% |
| Central American Indian | 13 | 0.2% |
| Colombian | 40 | 0.5% |
| Indian (Asian) | 25 | 0.3% |
| Puerto Rican | 8,523 | 99.2% |
| South American | 40 | 0.5% | View All 6 Rows |
Immigrants in San Lorenzo

| Immigration Origin | # Population | % Population | View All 0 Rows |
Sex and Age in San Lorenzo
Sex and Age in San Lorenzo
The most populous age groups in San Lorenzo are 50 to 54 Years (390 | 10.1%) for men and 35 to 39 Years (392 | 8.3%) for women.
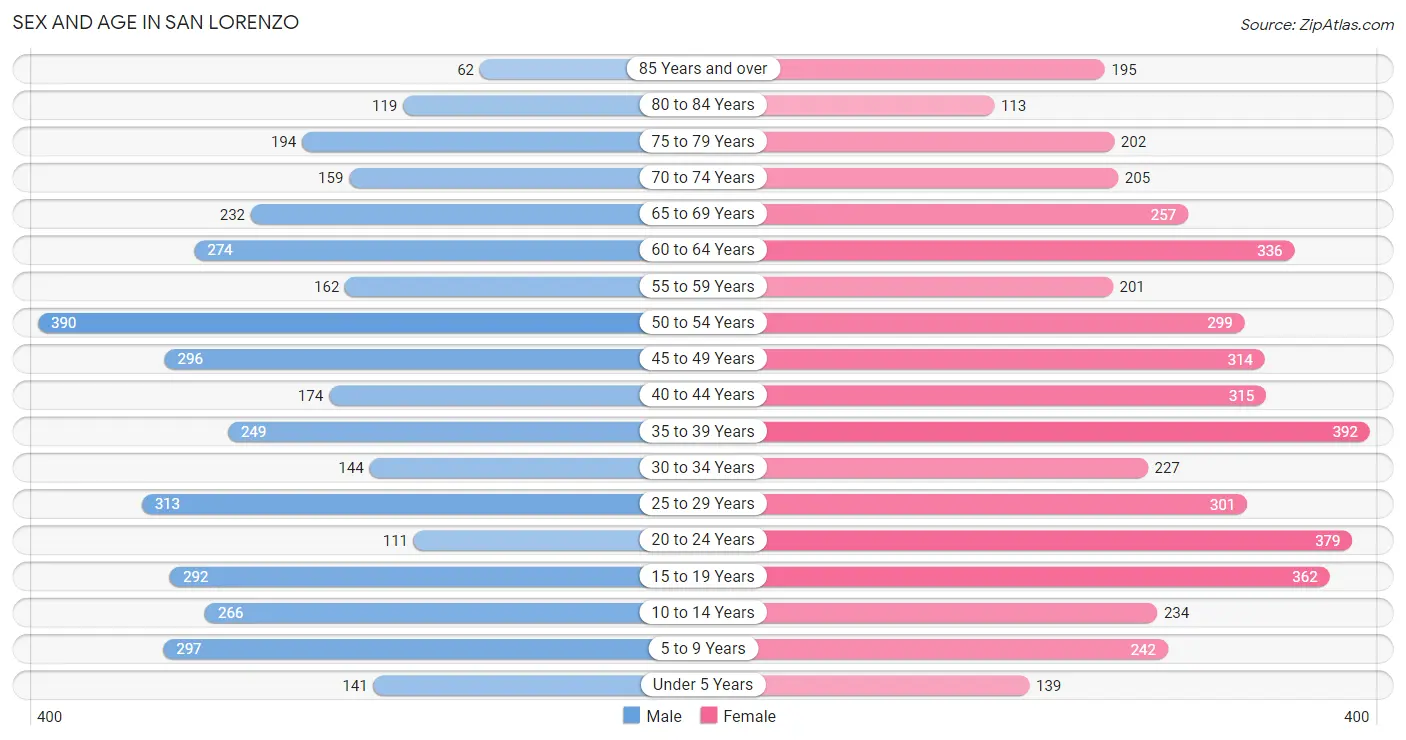
| Age Bracket | Male | Female |
| Under 5 Years | 141 (3.6%) | 139 (2.9%) |
| 5 to 9 Years | 297 (7.7%) | 242 (5.1%) |
| 10 to 14 Years | 266 (6.9%) | 234 (5.0%) |
| 15 to 19 Years | 292 (7.5%) | 362 (7.7%) |
| 20 to 24 Years | 111 (2.9%) | 379 (8.0%) |
| 25 to 29 Years | 313 (8.1%) | 301 (6.4%) |
| 30 to 34 Years | 144 (3.7%) | 227 (4.8%) |
| 35 to 39 Years | 249 (6.4%) | 392 (8.3%) |
| 40 to 44 Years | 174 (4.5%) | 315 (6.7%) |
| 45 to 49 Years | 296 (7.6%) | 314 (6.7%) |
| 50 to 54 Years | 390 (10.1%) | 299 (6.3%) |
| 55 to 59 Years | 162 (4.2%) | 201 (4.3%) |
| 60 to 64 Years | 274 (7.1%) | 336 (7.1%) |
| 65 to 69 Years | 232 (6.0%) | 257 (5.4%) |
| 70 to 74 Years | 159 (4.1%) | 205 (4.3%) |
| 75 to 79 Years | 194 (5.0%) | 202 (4.3%) |
| 80 to 84 Years | 119 (3.1%) | 113 (2.4%) |
| 85 Years and over | 62 (1.6%) | 195 (4.1%) |
| Total | 3,875 (100.0%) | 4,713 (100.0%) |
Families and Households in San Lorenzo
Median Family Size in San Lorenzo
The median family size in San Lorenzo is 3.34 persons per family, with single male/father families (211 | 10.5%) accounting for the largest median family size of 4 persons per family. On the other hand, single female/mother families (857 | 42.8%) represent the smallest median family size with 3.08 persons per family.
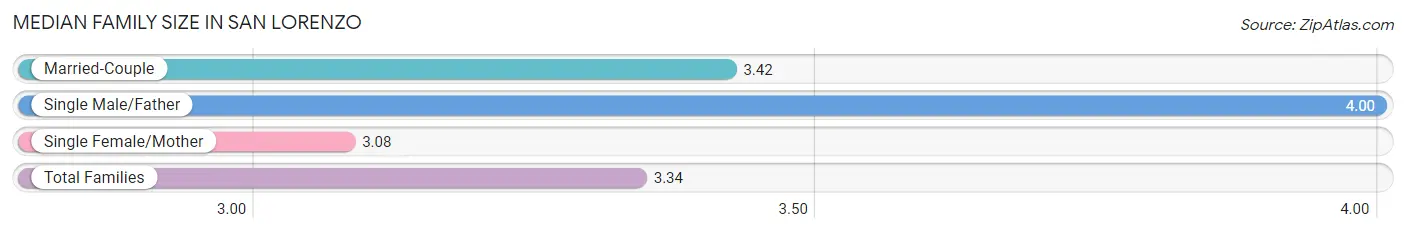
| Family Type | # Families | Family Size |
| Married-Couple | 933 (46.6%) | 3.42 |
| Single Male/Father | 211 (10.5%) | 4.00 |
| Single Female/Mother | 857 (42.8%) | 3.08 |
| Total Families | 2,001 (100.0%) | 3.34 |
Median Household Size in San Lorenzo
The median household size in San Lorenzo is 2.61 persons per household, with single male/father households (211 | 6.4%) accounting for the largest median household size of 4.85 persons per household. non-family households (1,277 | 39.0%) represent the smallest median household size with 1.17 persons per household.
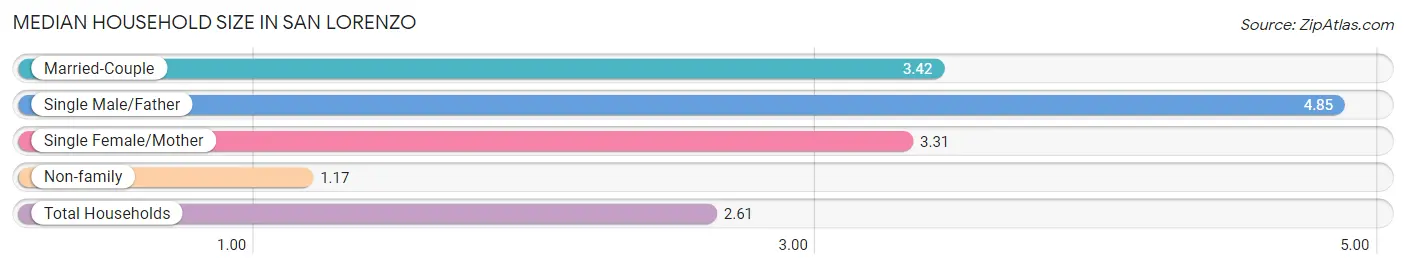
| Household Type | # Households | Household Size |
| Married-Couple | 933 (28.5%) | 3.42 |
| Single Male/Father | 211 (6.4%) | 4.85 |
| Single Female/Mother | 857 (26.1%) | 3.31 |
| Non-family | 1,277 (39.0%) | 1.17 |
| Total Households | 3,278 (100.0%) | 2.61 |
Household Size by Marriage Status in San Lorenzo
Out of a total of 3,278 households in San Lorenzo, 2,001 (61.0%) are family households, while 1,277 (39.0%) are nonfamily households. The most numerous type of family households are 2-person households, comprising 786, and the most common type of nonfamily households are 1-person households, comprising 1,056.
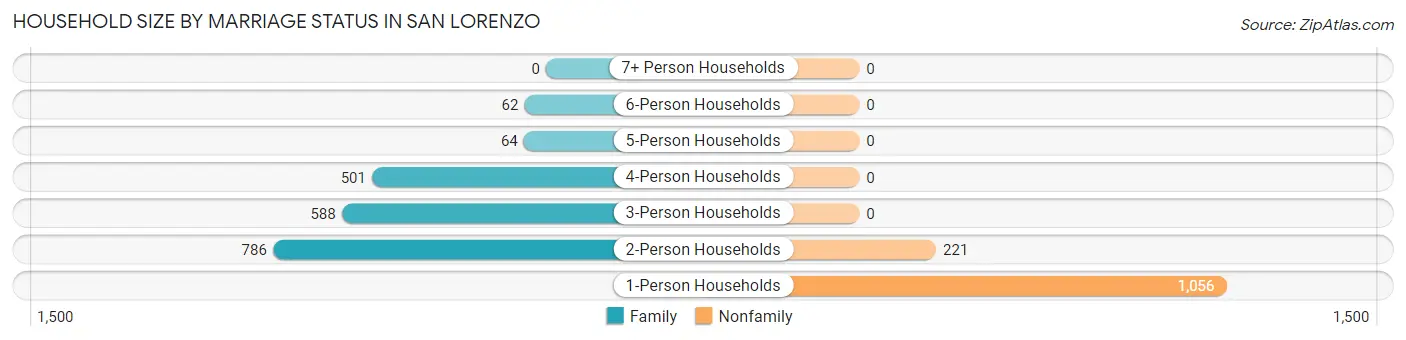
| Household Size | Family Households | Nonfamily Households |
| 1-Person Households | - | 1,056 (32.2%) |
| 2-Person Households | 786 (24.0%) | 221 (6.7%) |
| 3-Person Households | 588 (17.9%) | 0 (0.0%) |
| 4-Person Households | 501 (15.3%) | 0 (0.0%) |
| 5-Person Households | 64 (1.9%) | 0 (0.0%) |
| 6-Person Households | 62 (1.9%) | 0 (0.0%) |
| 7+ Person Households | 0 (0.0%) | 0 (0.0%) |
| Total | 2,001 (61.0%) | 1,277 (39.0%) |
Female Fertility in San Lorenzo
Fertility by Age in San Lorenzo
Average fertility rate in San Lorenzo is 37.0 births per 1,000 women. Women in the age bracket of 15 to 19 years have the highest fertility rate with 77.0 births per 1,000 women. Women in the age bracket of 35 to 50 years acount for 35.6% of all women with births.
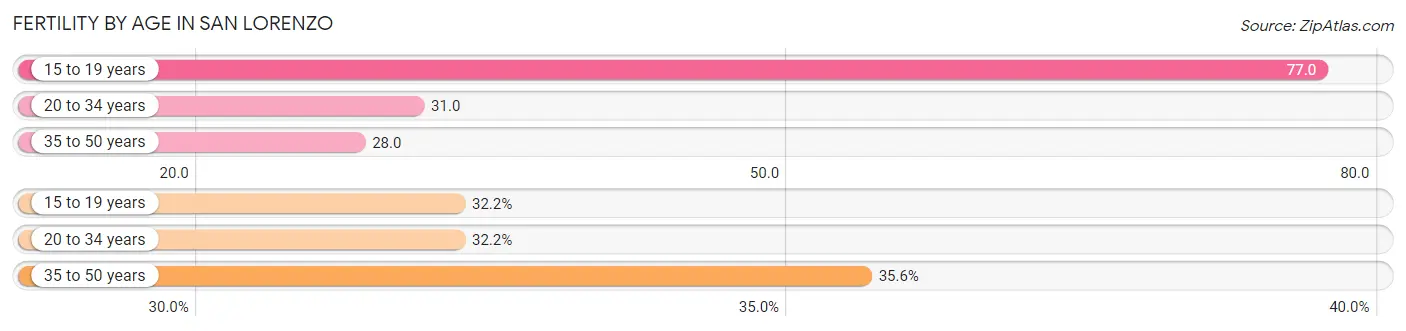
| Age Bracket | Women with Births | Births / 1,000 Women |
| 15 to 19 years | 28 (32.2%) | 77.0 |
| 20 to 34 years | 28 (32.2%) | 31.0 |
| 35 to 50 years | 31 (35.6%) | 28.0 |
| Total | 87 (100.0%) | 37.0 |
Fertility by Age by Marriage Status in San Lorenzo
35.6% of women with births (87) in San Lorenzo are married. The highest percentage of unmarried women with births falls into 15 to 19 years age bracket with 100.0% of them unmarried at the time of birth, while the lowest percentage of unmarried women with births belong to 35 to 50 years age bracket with 0.0% of them unmarried.
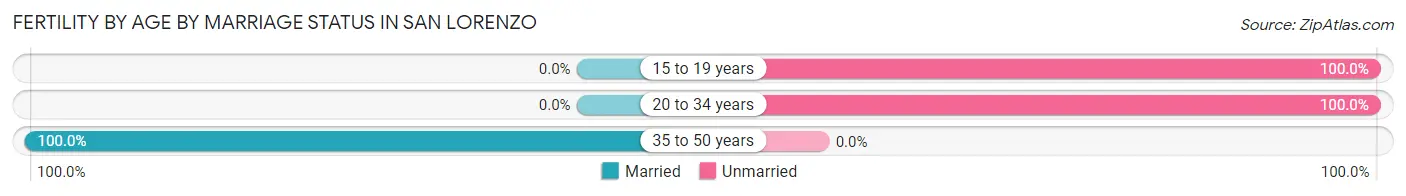
| Age Bracket | Married | Unmarried |
| 15 to 19 years | 0 (0.0%) | 28 (100.0%) |
| 20 to 34 years | 0 (0.0%) | 28 (100.0%) |
| 35 to 50 years | 31 (100.0%) | 0 (0.0%) |
| Total | 31 (35.6%) | 56 (64.4%) |
Fertility by Education in San Lorenzo
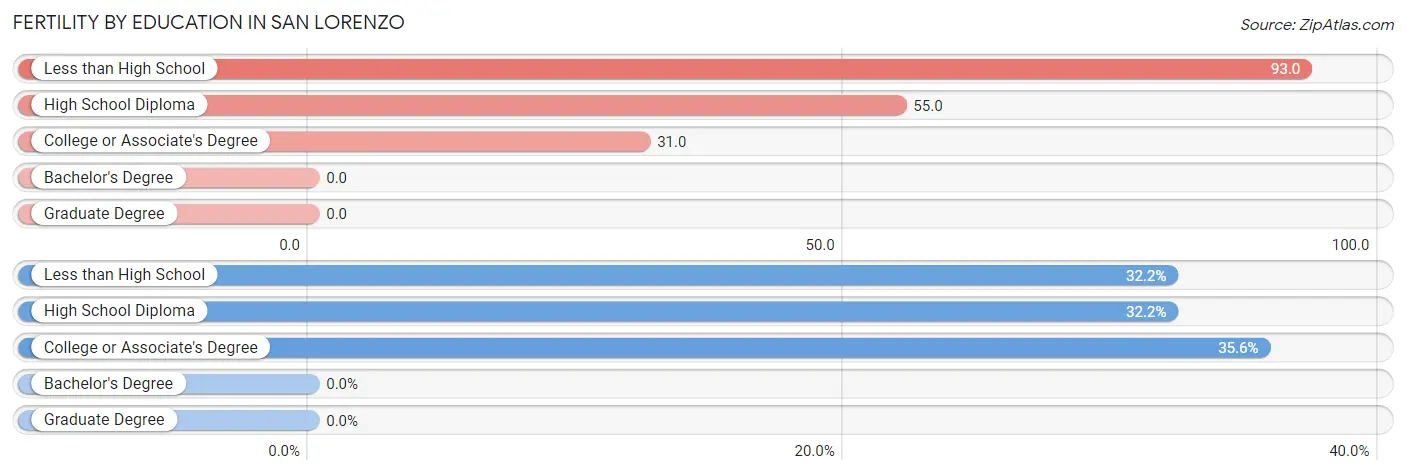
| Educational Attainment | Women with Births | Births / 1,000 Women |
| Less than High School | 28 (32.2%) | 93.0 |
| High School Diploma | 28 (32.2%) | 55.0 |
| College or Associate's Degree | 31 (35.6%) | 31.0 |
| Bachelor's Degree | 0 (0.0%) | 0.0 |
| Graduate Degree | 0 (0.0%) | 0.0 |
| Total | 87 (100.0%) | 37.0 |
Fertility by Education by Marriage Status in San Lorenzo
64.4% of women with births in San Lorenzo are unmarried. Women with the educational attainment of college or associate's degree are most likely to be married with 100.0% of them married at childbirth, while women with the educational attainment of less than high school are least likely to be married with 100.0% of them unmarried at childbirth.
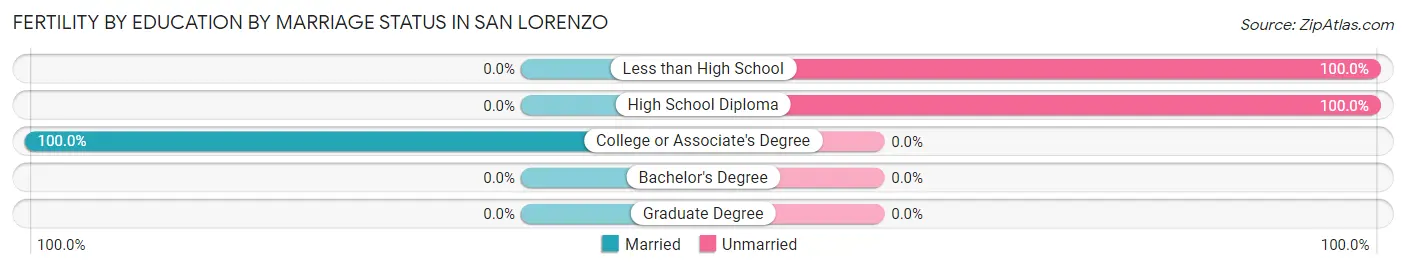
| Educational Attainment | Married | Unmarried |
| Less than High School | 0 (0.0%) | 28 (100.0%) |
| High School Diploma | 0 (0.0%) | 28 (100.0%) |
| College or Associate's Degree | 31 (100.0%) | 0 (0.0%) |
| Bachelor's Degree | 0 (0.0%) | 0 (0.0%) |
| Graduate Degree | 0 (0.0%) | 0 (0.0%) |
| Total | 31 (35.6%) | 56 (64.4%) |
Employment Characteristics in San Lorenzo
Employment by Class of Employer in San Lorenzo
Among the 2,609 employed individuals in San Lorenzo, private company employees (1,687 | 64.7%), state government employees (349 | 13.4%), and self-employed (not incorporated) (314 | 12.0%) make up the most common classes of employment.
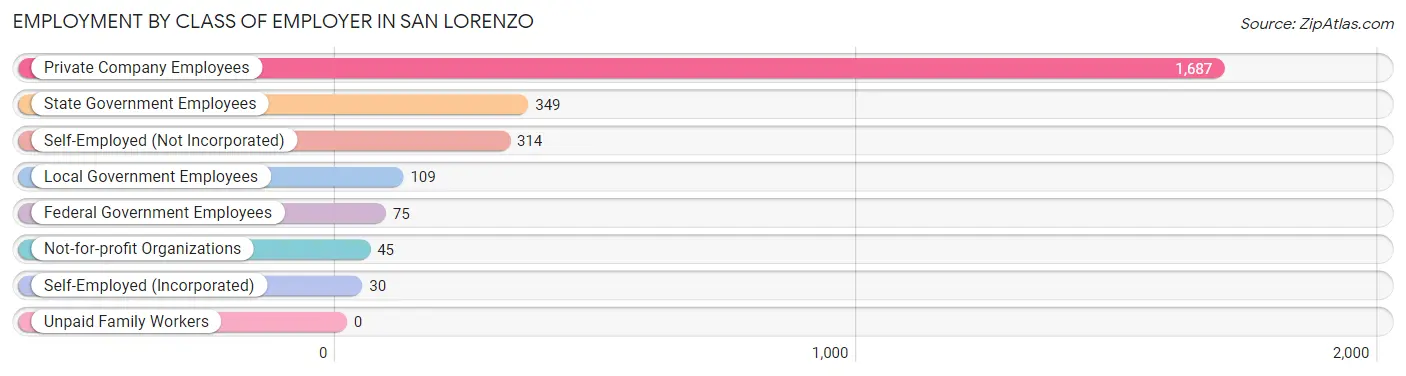
| Employer Class | # Employees | % Employees |
| Private Company Employees | 1,687 | 64.7% |
| Self-Employed (Incorporated) | 30 | 1.1% |
| Self-Employed (Not Incorporated) | 314 | 12.0% |
| Not-for-profit Organizations | 45 | 1.7% |
| Local Government Employees | 109 | 4.2% |
| State Government Employees | 349 | 13.4% |
| Federal Government Employees | 75 | 2.9% |
| Unpaid Family Workers | 0 | 0.0% |
| Total | 2,609 | 100.0% |
Employment Status by Age in San Lorenzo
According to the labor force statistics for San Lorenzo, out of the total population over 16 years of age (7,181), 39.9% or 2,865 individuals are in the labor force, with 6.3% or 180 of them unemployed. The age group with the highest labor force participation rate is 30 to 34 years, with 76.8% or 285 individuals in the labor force. Within the labor force, the 16 to 19 years age range has the highest percentage of unemployed individuals, with 23.6% or 13 of them being unemployed.
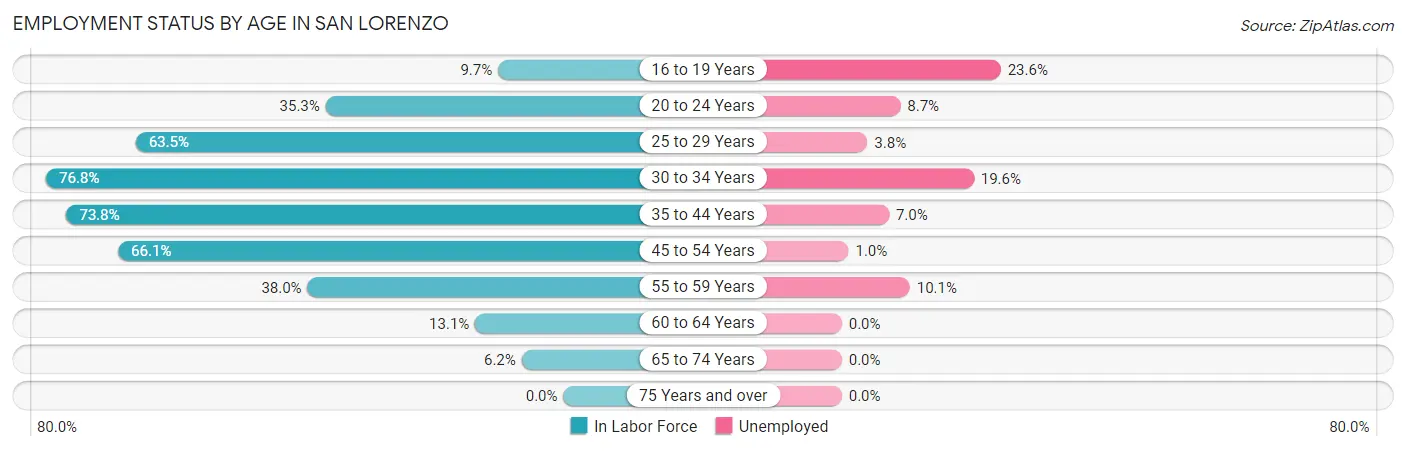
| Age Bracket | In Labor Force | Unemployed |
| 16 to 19 Years | 55 (9.7%) | 13 (23.6%) |
| 20 to 24 Years | 173 (35.3%) | 15 (8.7%) |
| 25 to 29 Years | 390 (63.5%) | 15 (3.8%) |
| 30 to 34 Years | 285 (76.8%) | 56 (19.6%) |
| 35 to 44 Years | 834 (73.8%) | 58 (7.0%) |
| 45 to 54 Years | 859 (66.1%) | 9 (1.0%) |
| 55 to 59 Years | 138 (38.0%) | 14 (10.1%) |
| 60 to 64 Years | 80 (13.1%) | 0 (0.0%) |
| 65 to 74 Years | 53 (6.2%) | 0 (0.0%) |
| 75 Years and over | 0 (0.0%) | 0 (0.0%) |
| Total | 2,865 (39.9%) | 180 (6.3%) |
Employment Status by Educational Attainment in San Lorenzo
According to labor force statistics for San Lorenzo, 58.9% of individuals (2,584) out of the total population between 25 and 64 years of age (4,387) are in the labor force, with 5.9% or 152 of them being unemployed. The group with the highest labor force participation rate are those with the educational attainment of bachelor's degree or higher, with 80.7% or 976 individuals in the labor force. Within the labor force, individuals with high school diploma education have the highest percentage of unemployment, with 11.6% or 77 of them being unemployed.
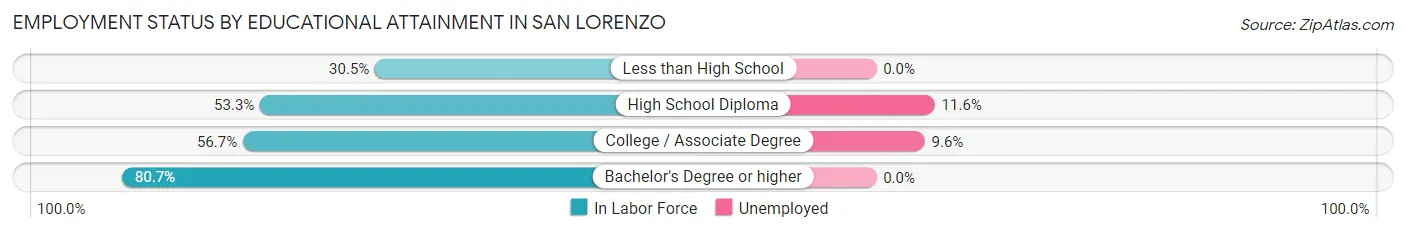
| Educational Attainment | In Labor Force | Unemployed |
| Less than High School | 174 (30.5%) | 0 (0.0%) |
| High School Diploma | 664 (53.3%) | 145 (11.6%) |
| College / Associate Degree | 771 (56.7%) | 131 (9.6%) |
| Bachelor's Degree or higher | 976 (80.7%) | 0 (0.0%) |
| Total | 2,584 (58.9%) | 259 (5.9%) |
Employment Occupations by Sex in San Lorenzo
Management, Business, Science and Arts Occupations
The most common Management, Business, Science and Arts occupations in San Lorenzo are Health Diagnosing & Treating (251 | 9.4%), Health Technologists (213 | 8.0%), Business & Financial (177 | 6.6%), Community & Social Service (156 | 5.8%), and Education Instruction & Library (146 | 5.5%).
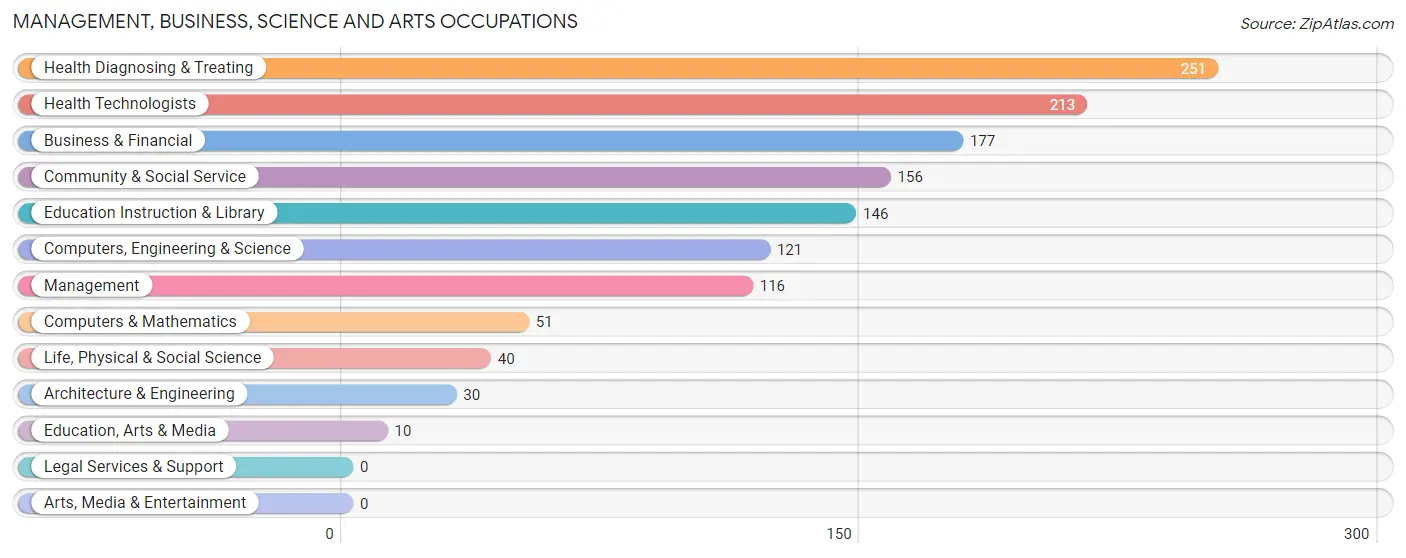
Management, Business, Science and Arts Occupations by Sex
Within the Management, Business, Science and Arts occupations in San Lorenzo, the most male-oriented occupations are Computers & Mathematics (100.0%), Architecture & Engineering (100.0%), and Computers, Engineering & Science (81.0%), while the most female-oriented occupations are Education, Arts & Media (100.0%), Health Diagnosing & Treating (97.6%), and Health Technologists (97.2%).
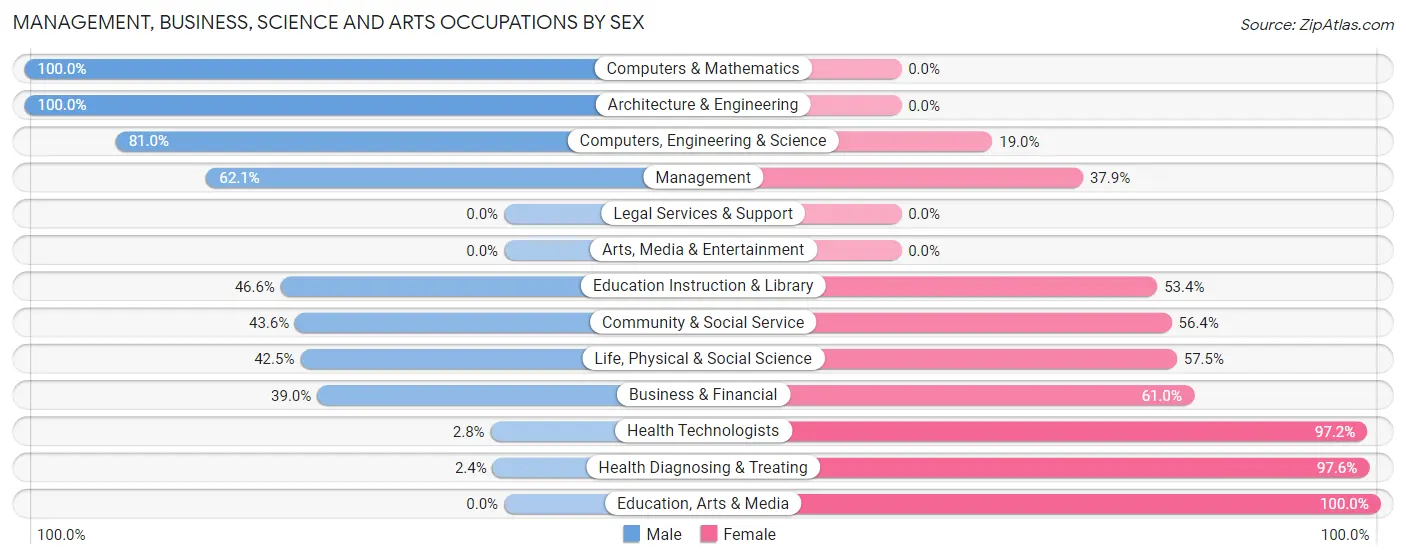
| Occupation | Male | Female |
| Management | 72 (62.1%) | 44 (37.9%) |
| Business & Financial | 69 (39.0%) | 108 (61.0%) |
| Computers, Engineering & Science | 98 (81.0%) | 23 (19.0%) |
| Computers & Mathematics | 51 (100.0%) | 0 (0.0%) |
| Architecture & Engineering | 30 (100.0%) | 0 (0.0%) |
| Life, Physical & Social Science | 17 (42.5%) | 23 (57.5%) |
| Community & Social Service | 68 (43.6%) | 88 (56.4%) |
| Education, Arts & Media | 0 (0.0%) | 10 (100.0%) |
| Legal Services & Support | 0 (0.0%) | 0 (0.0%) |
| Education Instruction & Library | 68 (46.6%) | 78 (53.4%) |
| Arts, Media & Entertainment | 0 (0.0%) | 0 (0.0%) |
| Health Diagnosing & Treating | 6 (2.4%) | 245 (97.6%) |
| Health Technologists | 6 (2.8%) | 207 (97.2%) |
| Total (Category) | 313 (38.1%) | 508 (61.9%) |
| Total (Overall) | 1,373 (51.4%) | 1,297 (48.6%) |
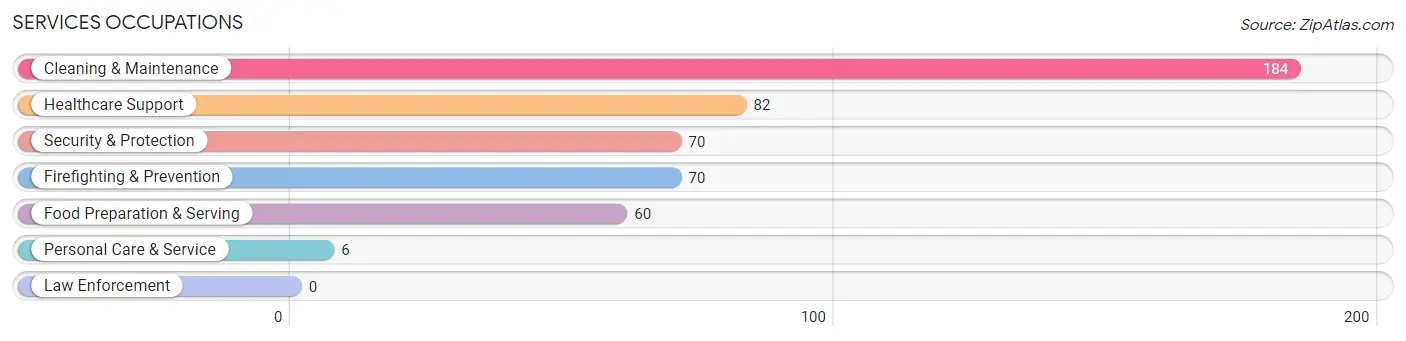
Services Occupations
The most common Services occupations in San Lorenzo are Cleaning & Maintenance (184 | 6.9%), Healthcare Support (82 | 3.1%), Security & Protection (70 | 2.6%), Firefighting & Prevention (70 | 2.6%), and Food Preparation & Serving (60 | 2.2%).
Services Occupations by Sex
Within the Services occupations in San Lorenzo, the most male-oriented occupations are Security & Protection (100.0%), Firefighting & Prevention (100.0%), and Cleaning & Maintenance (76.1%), while the most female-oriented occupations are Personal Care & Service (100.0%), Healthcare Support (75.6%), and Food Preparation & Serving (58.3%).
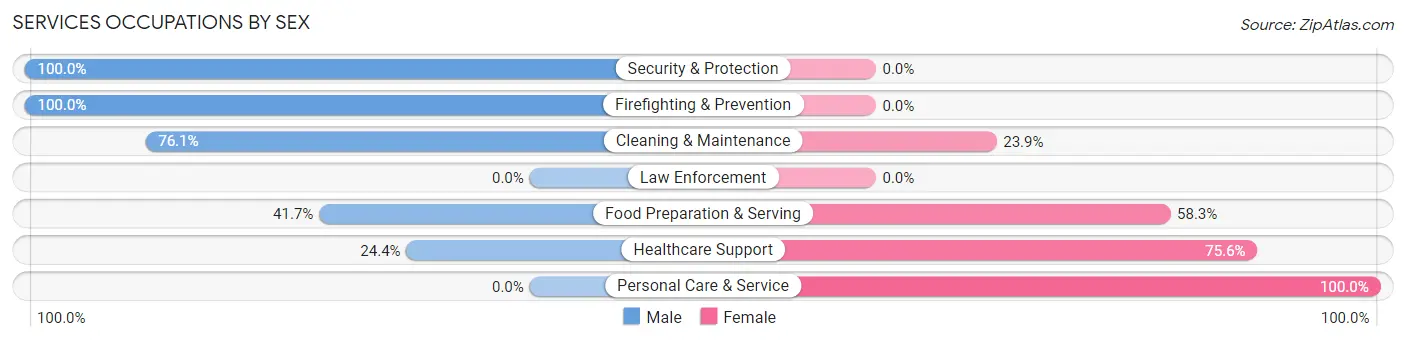
| Occupation | Male | Female |
| Healthcare Support | 20 (24.4%) | 62 (75.6%) |
| Security & Protection | 70 (100.0%) | 0 (0.0%) |
| Firefighting & Prevention | 70 (100.0%) | 0 (0.0%) |
| Law Enforcement | 0 (0.0%) | 0 (0.0%) |
| Food Preparation & Serving | 25 (41.7%) | 35 (58.3%) |
| Cleaning & Maintenance | 140 (76.1%) | 44 (23.9%) |
| Personal Care & Service | 0 (0.0%) | 6 (100.0%) |
| Total (Category) | 255 (63.4%) | 147 (36.6%) |
| Total (Overall) | 1,373 (51.4%) | 1,297 (48.6%) |
Sales and Office Occupations
The most common Sales and Office occupations in San Lorenzo are Office & Administration (442 | 16.6%), and Sales & Related (227 | 8.5%).

Sales and Office Occupations by Sex
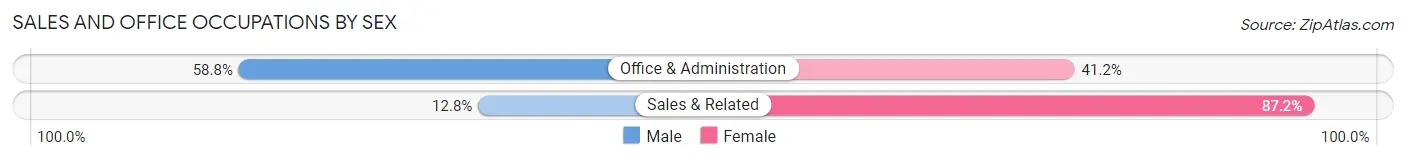
| Occupation | Male | Female |
| Sales & Related | 29 (12.8%) | 198 (87.2%) |
| Office & Administration | 260 (58.8%) | 182 (41.2%) |
| Total (Category) | 289 (43.2%) | 380 (56.8%) |
| Total (Overall) | 1,373 (51.4%) | 1,297 (48.6%) |
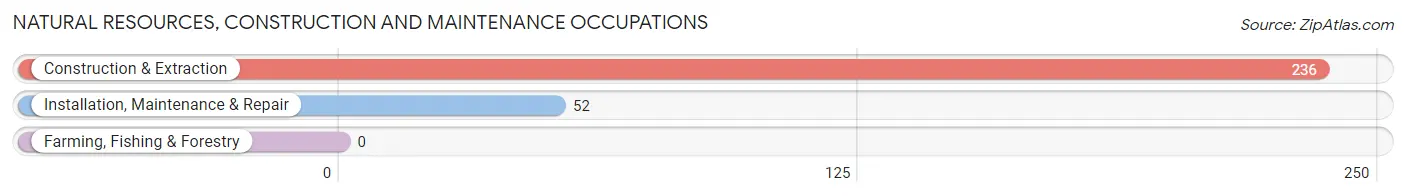
Natural Resources, Construction and Maintenance Occupations
The most common Natural Resources, Construction and Maintenance occupations in San Lorenzo are Construction & Extraction (236 | 8.8%), and Installation, Maintenance & Repair (52 | 1.9%).
Natural Resources, Construction and Maintenance Occupations by Sex
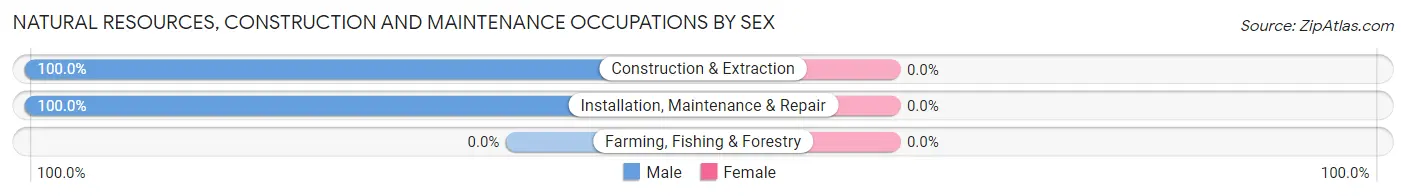
| Occupation | Male | Female |
| Farming, Fishing & Forestry | 0 (0.0%) | 0 (0.0%) |
| Construction & Extraction | 236 (100.0%) | 0 (0.0%) |
| Installation, Maintenance & Repair | 52 (100.0%) | 0 (0.0%) |
| Total (Category) | 288 (100.0%) | 0 (0.0%) |
| Total (Overall) | 1,373 (51.4%) | 1,297 (48.6%) |
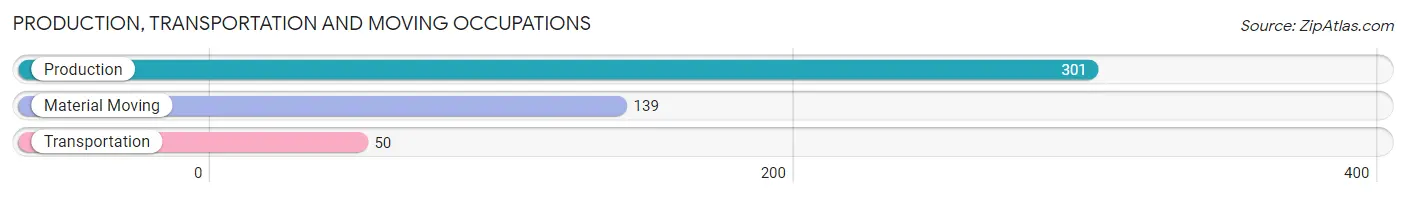
Production, Transportation and Moving Occupations
The most common Production, Transportation and Moving occupations in San Lorenzo are Production (301 | 11.3%), Material Moving (139 | 5.2%), and Transportation (50 | 1.9%).
Production, Transportation and Moving Occupations by Sex
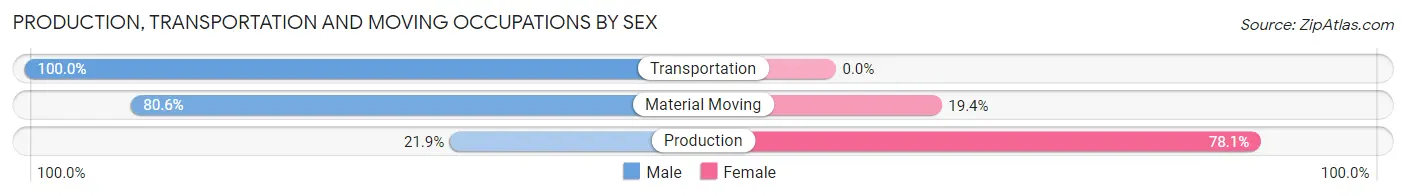
| Occupation | Male | Female |
| Production | 66 (21.9%) | 235 (78.1%) |
| Transportation | 50 (100.0%) | 0 (0.0%) |
| Material Moving | 112 (80.6%) | 27 (19.4%) |
| Total (Category) | 228 (46.5%) | 262 (53.5%) |
| Total (Overall) | 1,373 (51.4%) | 1,297 (48.6%) |
Employment Industries by Sex in San Lorenzo
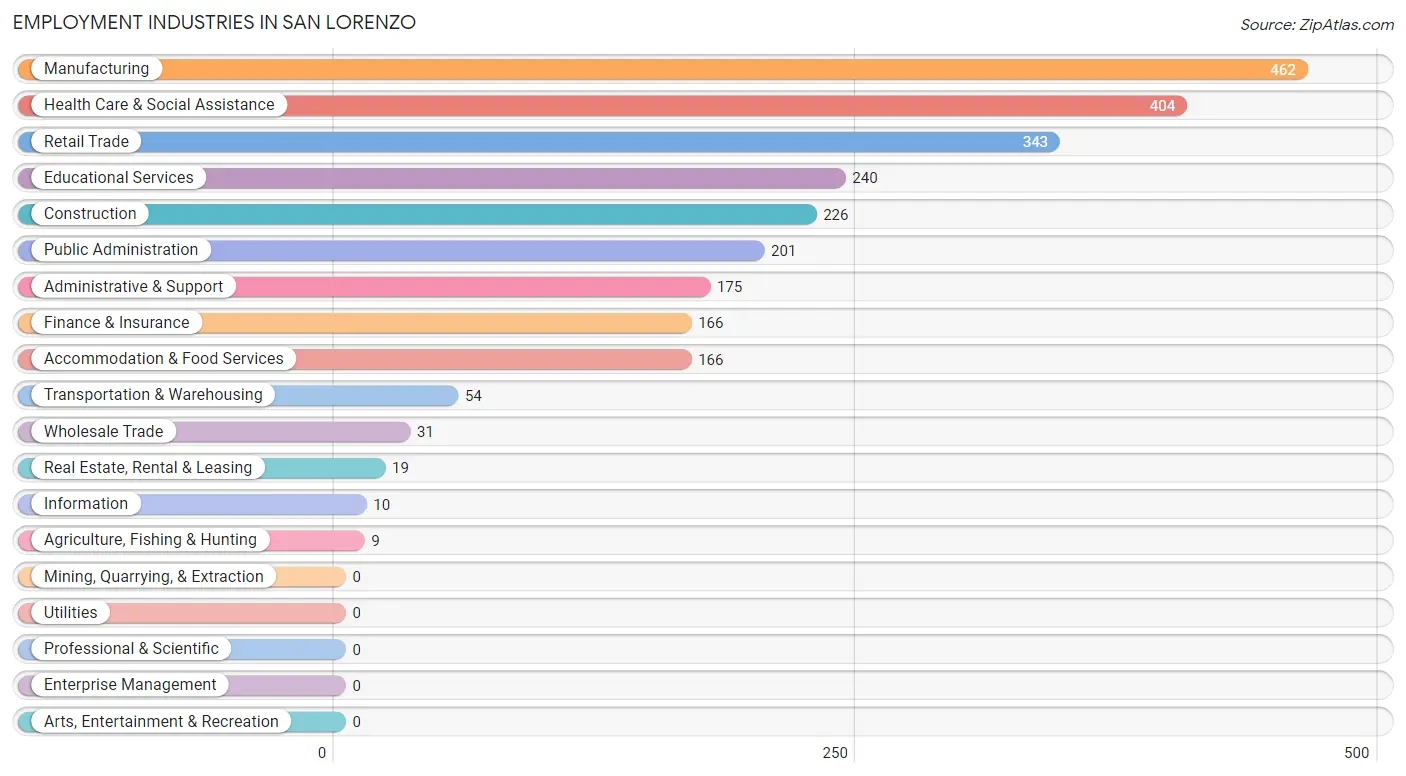
Employment Industries in San Lorenzo
The major employment industries in San Lorenzo include Manufacturing (462 | 17.3%), Health Care & Social Assistance (404 | 15.1%), Retail Trade (343 | 12.9%), Educational Services (240 | 9.0%), and Construction (226 | 8.5%).
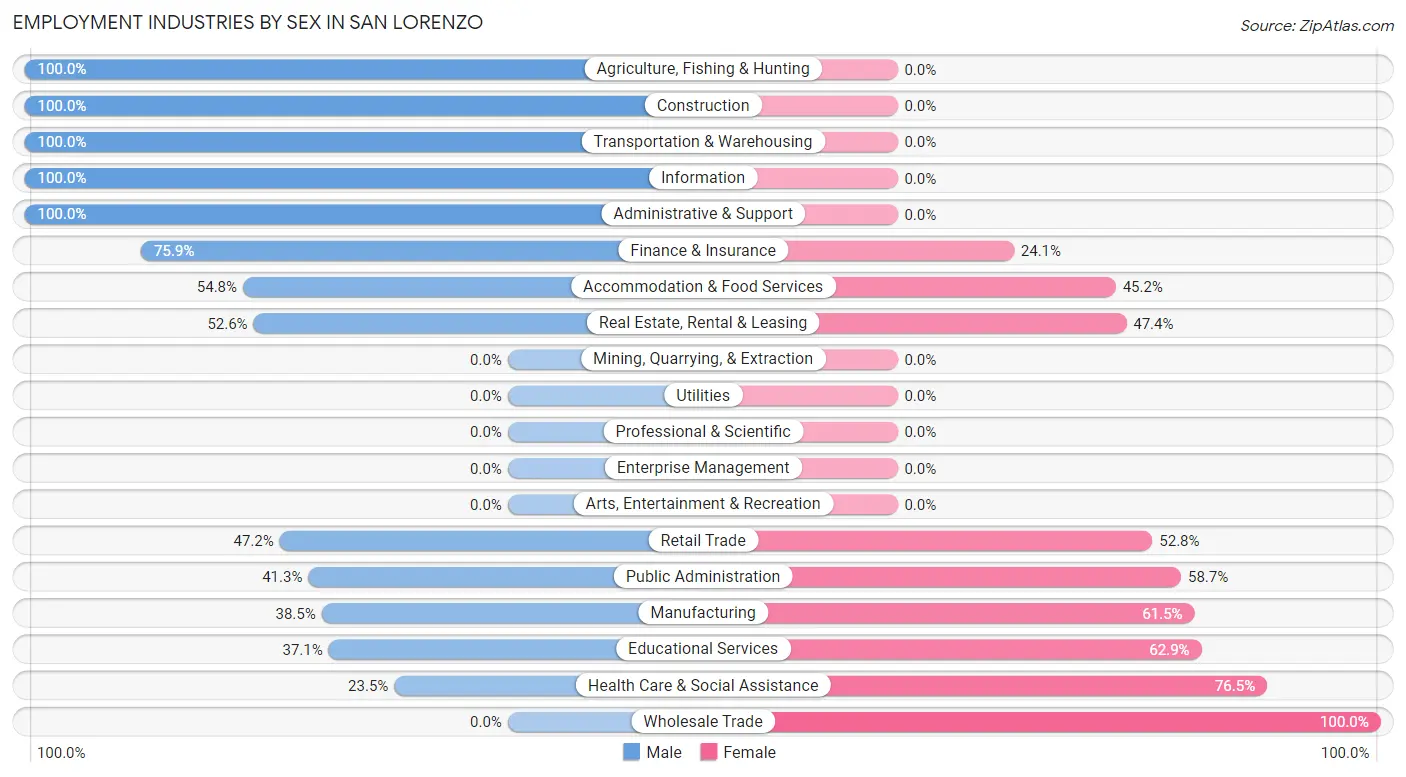
Employment Industries by Sex in San Lorenzo
The San Lorenzo industries that see more men than women are Agriculture, Fishing & Hunting (100.0%), Construction (100.0%), and Transportation & Warehousing (100.0%), whereas the industries that tend to have a higher number of women are Wholesale Trade (100.0%), Health Care & Social Assistance (76.5%), and Educational Services (62.9%).
| Industry | Male | Female |
| Agriculture, Fishing & Hunting | 9 (100.0%) | 0 (0.0%) |
| Mining, Quarrying, & Extraction | 0 (0.0%) | 0 (0.0%) |
| Construction | 226 (100.0%) | 0 (0.0%) |
| Manufacturing | 178 (38.5%) | 284 (61.5%) |
| Wholesale Trade | 0 (0.0%) | 31 (100.0%) |
| Retail Trade | 162 (47.2%) | 181 (52.8%) |
| Transportation & Warehousing | 54 (100.0%) | 0 (0.0%) |
| Utilities | 0 (0.0%) | 0 (0.0%) |
| Information | 10 (100.0%) | 0 (0.0%) |
| Finance & Insurance | 126 (75.9%) | 40 (24.1%) |
| Real Estate, Rental & Leasing | 10 (52.6%) | 9 (47.4%) |
| Professional & Scientific | 0 (0.0%) | 0 (0.0%) |
| Enterprise Management | 0 (0.0%) | 0 (0.0%) |
| Administrative & Support | 175 (100.0%) | 0 (0.0%) |
| Educational Services | 89 (37.1%) | 151 (62.9%) |
| Health Care & Social Assistance | 95 (23.5%) | 309 (76.5%) |
| Arts, Entertainment & Recreation | 0 (0.0%) | 0 (0.0%) |
| Accommodation & Food Services | 91 (54.8%) | 75 (45.2%) |
| Public Administration | 83 (41.3%) | 118 (58.7%) |
| Total | 1,373 (51.4%) | 1,297 (48.6%) |
Education in San Lorenzo
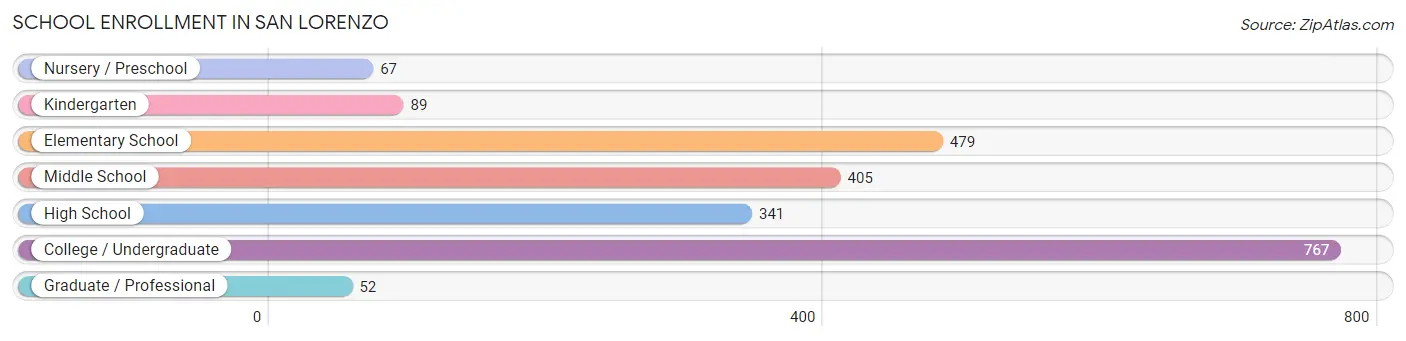
School Enrollment in San Lorenzo
The most common levels of schooling among the 2,200 students in San Lorenzo are college / undergraduate (767 | 34.9%), elementary school (479 | 21.8%), and middle school (405 | 18.4%).
| School Level | # Students | % Students |
| Nursery / Preschool | 67 | 3.0% |
| Kindergarten | 89 | 4.1% |
| Elementary School | 479 | 21.8% |
| Middle School | 405 | 18.4% |
| High School | 341 | 15.5% |
| College / Undergraduate | 767 | 34.9% |
| Graduate / Professional | 52 | 2.4% |
| Total | 2,200 | 100.0% |
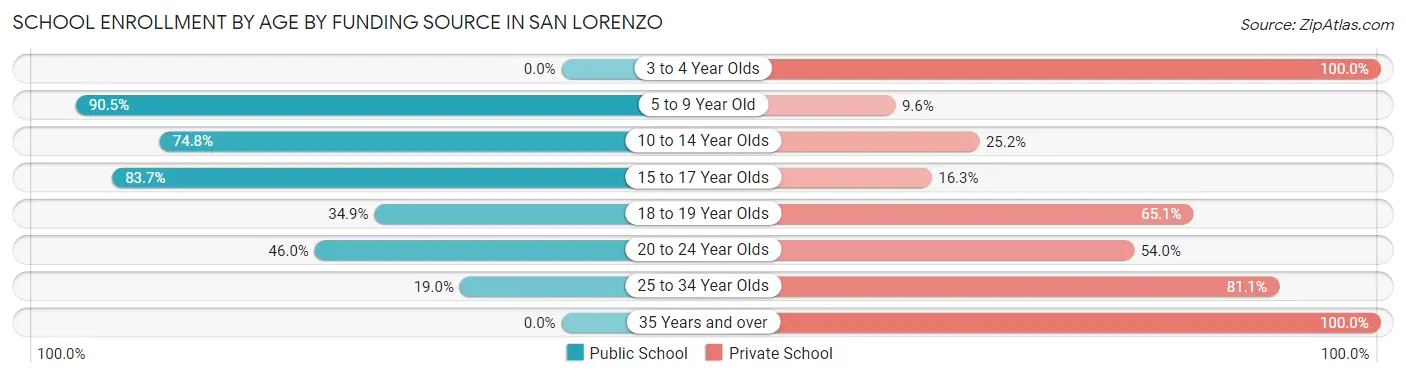
School Enrollment by Age by Funding Source in San Lorenzo
Out of a total of 2,200 students who are enrolled in schools in San Lorenzo, 832 (37.8%) attend a private institution, while the remaining 1,368 (62.2%) are enrolled in public schools. The age group of 3 to 4 year olds has the highest likelihood of being enrolled in private schools, with 80 (100.0% in the age bracket) enrolled. Conversely, the age group of 5 to 9 year old has the lowest likelihood of being enrolled in a private school, with 464 (90.4% in the age bracket) attending a public institution.
| Age Bracket | Public School | Private School |
| 3 to 4 Year Olds | 0 (0.0%) | 80 (100.0%) |
| 5 to 9 Year Old | 464 (90.4%) | 49 (9.6%) |
| 10 to 14 Year Olds | 374 (74.8%) | 126 (25.2%) |
| 15 to 17 Year Olds | 241 (83.7%) | 47 (16.3%) |
| 18 to 19 Year Olds | 83 (34.9%) | 155 (65.1%) |
| 20 to 24 Year Olds | 188 (46.0%) | 221 (54.0%) |
| 25 to 34 Year Olds | 18 (19.0%) | 77 (81.0%) |
| 35 Years and over | 0 (0.0%) | 77 (100.0%) |
| Total | 1,368 (62.2%) | 832 (37.8%) |
Educational Attainment by Field of Study in San Lorenzo
Business (430 | 29.3%), education (292 | 19.9%), science & technology (178 | 12.1%), social sciences (131 | 8.9%), and physical & health sciences (122 | 8.3%) are the most common fields of study among 1,465 individuals in San Lorenzo who have obtained a bachelor's degree or higher.

| Field of Study | # Graduates | % Graduates |
| Computers & Mathematics | 10 | 0.7% |
| Bio, Nature & Agricultural | 26 | 1.8% |
| Physical & Health Sciences | 122 | 8.3% |
| Psychology | 84 | 5.7% |
| Social Sciences | 131 | 8.9% |
| Engineering | 21 | 1.4% |
| Multidisciplinary Studies | 0 | 0.0% |
| Science & Technology | 178 | 12.1% |
| Business | 430 | 29.3% |
| Education | 292 | 19.9% |
| Literature & Languages | 0 | 0.0% |
| Liberal Arts & History | 31 | 2.1% |
| Visual & Performing Arts | 21 | 1.4% |
| Communications | 0 | 0.0% |
| Arts & Humanities | 119 | 8.1% |
| Total | 1,465 | 100.0% |
Transportation & Commute in San Lorenzo
Vehicle Availability by Sex in San Lorenzo
The most prevalent vehicle ownership categories in San Lorenzo are males with 2 vehicles (498, accounting for 37.7%) and females with 2 vehicles (304, making up 38.7%).
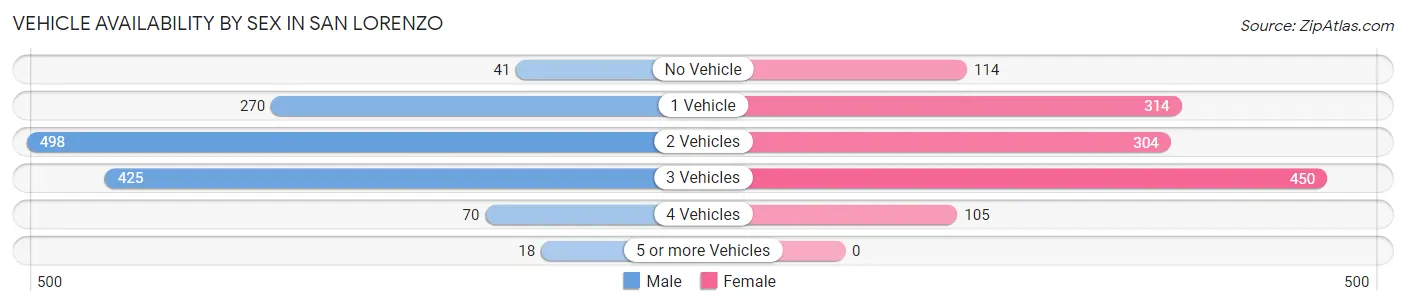
| Vehicles Available | Male | Female |
| No Vehicle | 41 (3.1%) | 114 (8.9%) |
| 1 Vehicle | 270 (20.4%) | 314 (24.4%) |
| 2 Vehicles | 498 (37.7%) | 304 (23.6%) |
| 3 Vehicles | 425 (32.2%) | 450 (35.0%) |
| 4 Vehicles | 70 (5.3%) | 105 (8.2%) |
| 5 or more Vehicles | 18 (1.4%) | 0 (0.0%) |
| Total | 1,322 (100.0%) | 1,287 (100.0%) |
Commute Time in San Lorenzo
The most frequently occuring commute durations in San Lorenzo are 30 to 34 minutes (603 commuters, 23.1%), 60 to 89 minutes (464 commuters, 17.8%), and less than 5 minutes (293 commuters, 11.2%).
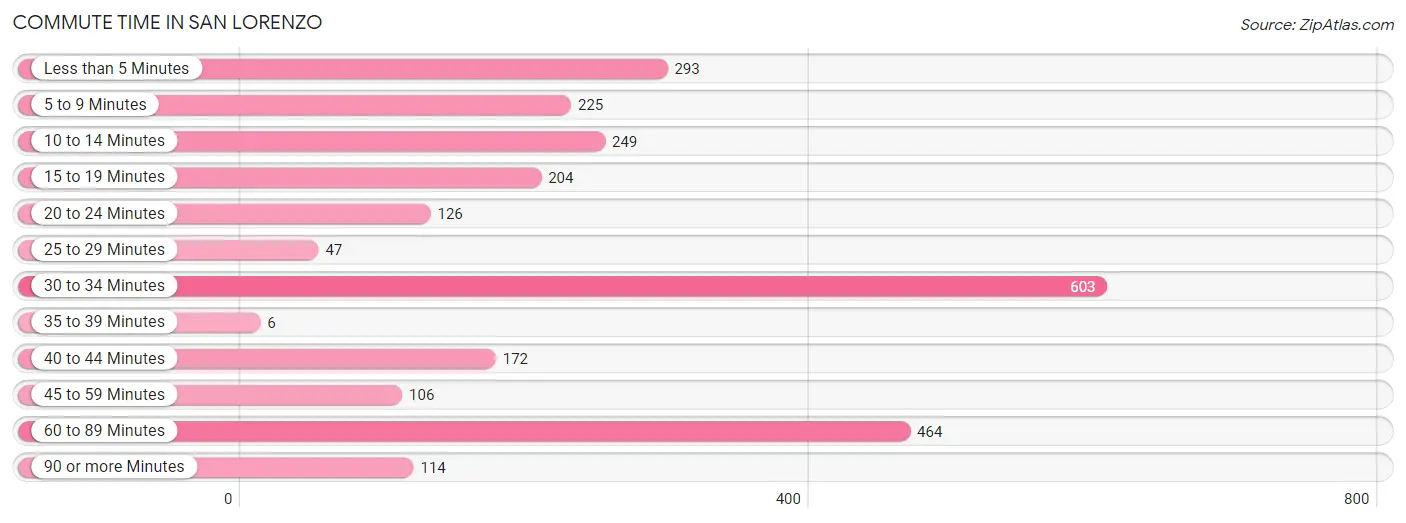
| Commute Time | # Commuters | % Commuters |
| Less than 5 Minutes | 293 | 11.2% |
| 5 to 9 Minutes | 225 | 8.6% |
| 10 to 14 Minutes | 249 | 9.5% |
| 15 to 19 Minutes | 204 | 7.8% |
| 20 to 24 Minutes | 126 | 4.8% |
| 25 to 29 Minutes | 47 | 1.8% |
| 30 to 34 Minutes | 603 | 23.1% |
| 35 to 39 Minutes | 6 | 0.2% |
| 40 to 44 Minutes | 172 | 6.6% |
| 45 to 59 Minutes | 106 | 4.1% |
| 60 to 89 Minutes | 464 | 17.8% |
| 90 or more Minutes | 114 | 4.4% |
Commute Time by Sex in San Lorenzo
The most common commute times in San Lorenzo are 30 to 34 minutes (324 commuters, 24.5%) for males and 60 to 89 minutes (285 commuters, 22.1%) for females.
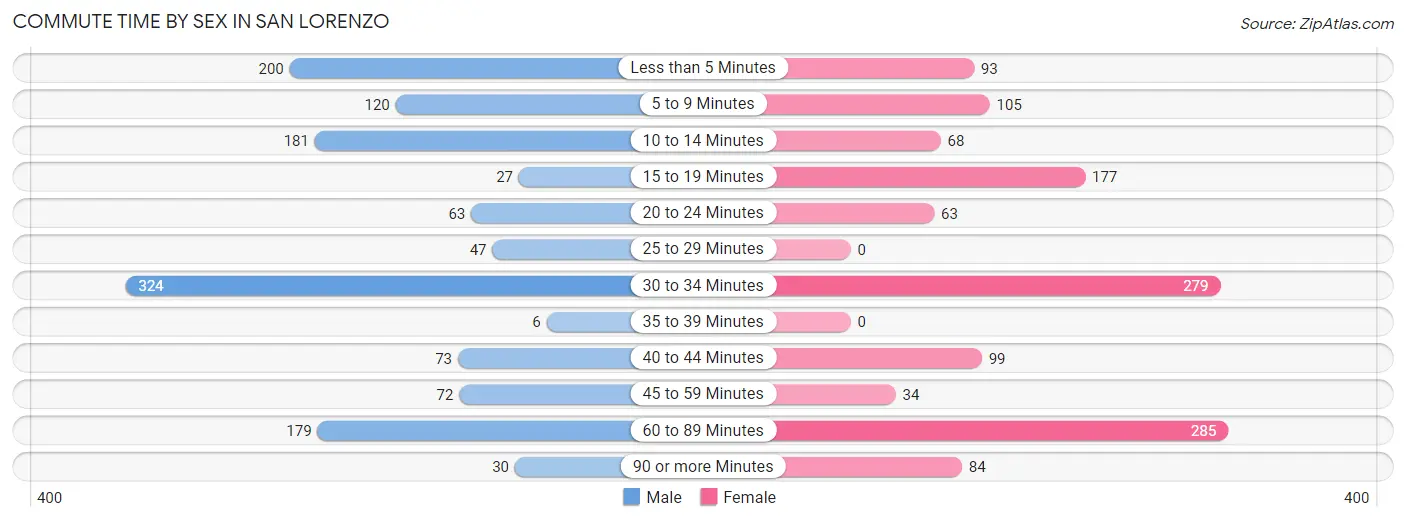
| Commute Time | Male | Female |
| Less than 5 Minutes | 200 (15.1%) | 93 (7.2%) |
| 5 to 9 Minutes | 120 (9.1%) | 105 (8.2%) |
| 10 to 14 Minutes | 181 (13.7%) | 68 (5.3%) |
| 15 to 19 Minutes | 27 (2.0%) | 177 (13.8%) |
| 20 to 24 Minutes | 63 (4.8%) | 63 (4.9%) |
| 25 to 29 Minutes | 47 (3.6%) | 0 (0.0%) |
| 30 to 34 Minutes | 324 (24.5%) | 279 (21.7%) |
| 35 to 39 Minutes | 6 (0.4%) | 0 (0.0%) |
| 40 to 44 Minutes | 73 (5.5%) | 99 (7.7%) |
| 45 to 59 Minutes | 72 (5.4%) | 34 (2.6%) |
| 60 to 89 Minutes | 179 (13.5%) | 285 (22.1%) |
| 90 or more Minutes | 30 (2.3%) | 84 (6.5%) |
Time of Departure to Work by Sex in San Lorenzo
The most frequent times of departure to work in San Lorenzo are 6:00 AM to 6:29 AM (283, 21.4%) for males and 6:00 AM to 6:29 AM (308, 23.9%) for females.
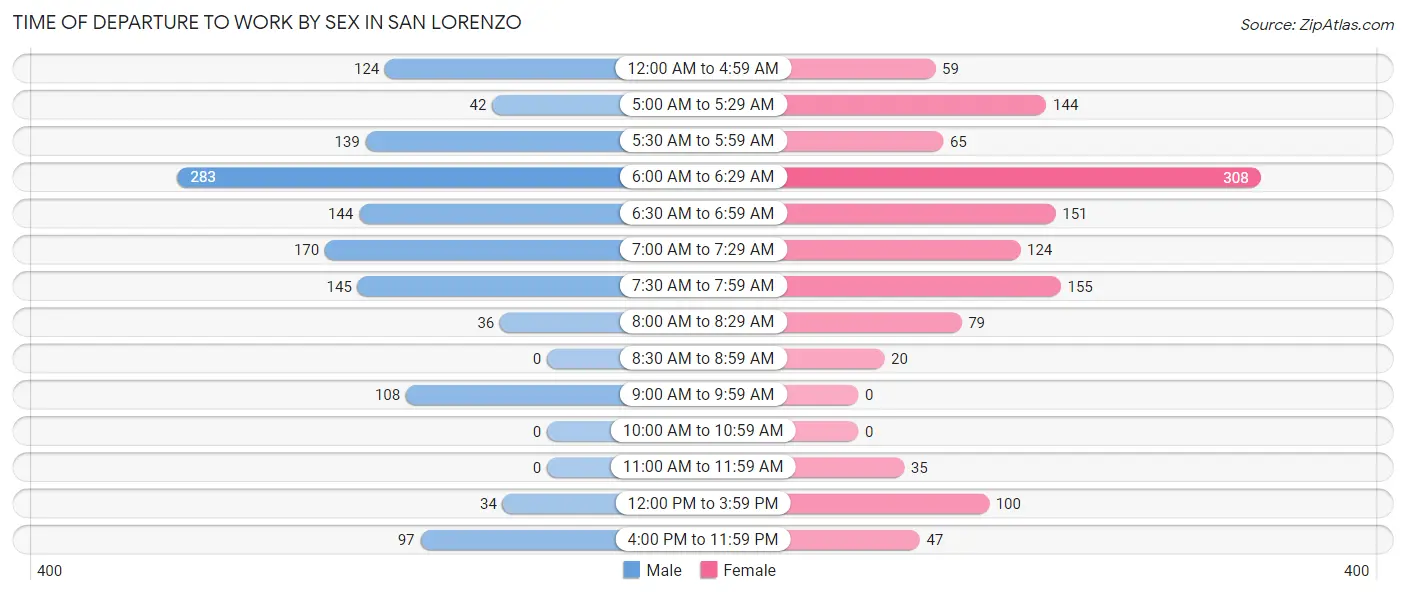
| Time of Departure | Male | Female |
| 12:00 AM to 4:59 AM | 124 (9.4%) | 59 (4.6%) |
| 5:00 AM to 5:29 AM | 42 (3.2%) | 144 (11.2%) |
| 5:30 AM to 5:59 AM | 139 (10.5%) | 65 (5.1%) |
| 6:00 AM to 6:29 AM | 283 (21.4%) | 308 (23.9%) |
| 6:30 AM to 6:59 AM | 144 (10.9%) | 151 (11.7%) |
| 7:00 AM to 7:29 AM | 170 (12.9%) | 124 (9.6%) |
| 7:30 AM to 7:59 AM | 145 (11.0%) | 155 (12.0%) |
| 8:00 AM to 8:29 AM | 36 (2.7%) | 79 (6.1%) |
| 8:30 AM to 8:59 AM | 0 (0.0%) | 20 (1.5%) |
| 9:00 AM to 9:59 AM | 108 (8.2%) | 0 (0.0%) |
| 10:00 AM to 10:59 AM | 0 (0.0%) | 0 (0.0%) |
| 11:00 AM to 11:59 AM | 0 (0.0%) | 35 (2.7%) |
| 12:00 PM to 3:59 PM | 34 (2.6%) | 100 (7.8%) |
| 4:00 PM to 11:59 PM | 97 (7.3%) | 47 (3.6%) |
| Total | 1,322 (100.0%) | 1,287 (100.0%) |
Housing Occupancy in San Lorenzo
Occupancy by Ownership in San Lorenzo
Of the total 3,278 dwellings in San Lorenzo, owner-occupied units account for 1,971 (60.1%), while renter-occupied units make up 1,307 (39.9%).
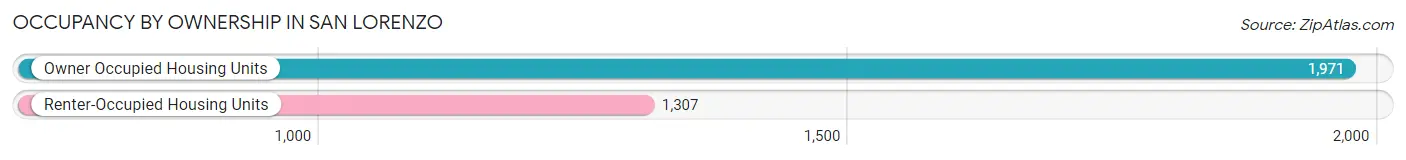
| Occupancy | # Housing Units | % Housing Units |
| Owner Occupied Housing Units | 1,971 | 60.1% |
| Renter-Occupied Housing Units | 1,307 | 39.9% |
| Total Occupied Housing Units | 3,278 | 100.0% |
Occupancy by Household Size in San Lorenzo
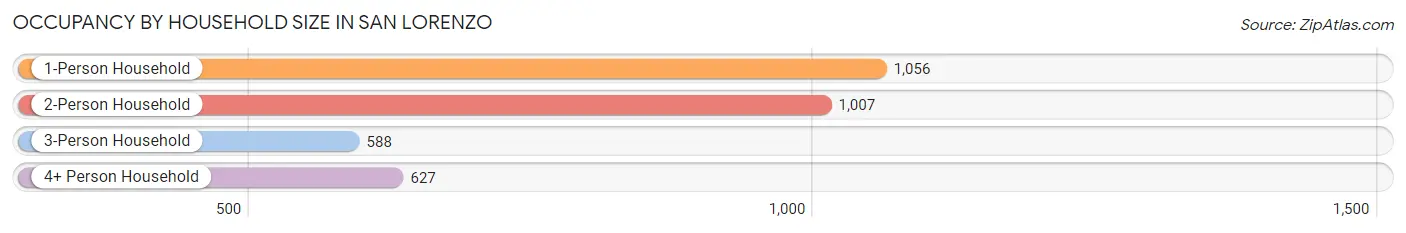
| Household Size | # Housing Units | % Housing Units |
| 1-Person Household | 1,056 | 32.2% |
| 2-Person Household | 1,007 | 30.7% |
| 3-Person Household | 588 | 17.9% |
| 4+ Person Household | 627 | 19.1% |
| Total Housing Units | 3,278 | 100.0% |
Occupancy by Ownership by Household Size in San Lorenzo
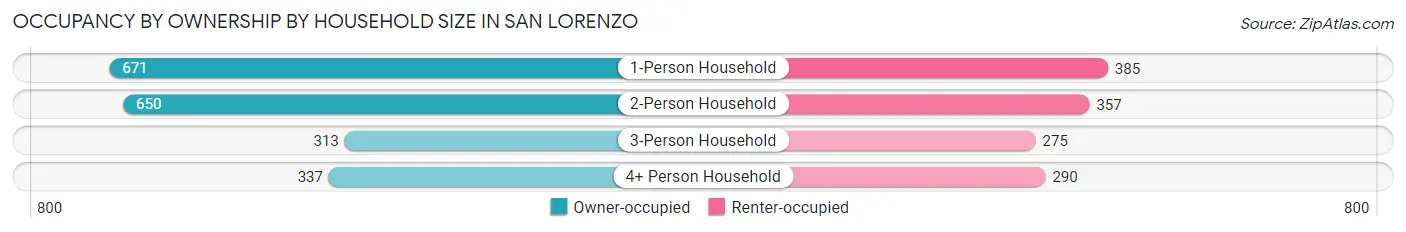
| Household Size | Owner-occupied | Renter-occupied |
| 1-Person Household | 671 (63.5%) | 385 (36.5%) |
| 2-Person Household | 650 (64.5%) | 357 (35.4%) |
| 3-Person Household | 313 (53.2%) | 275 (46.8%) |
| 4+ Person Household | 337 (53.7%) | 290 (46.3%) |
| Total Housing Units | 1,971 (60.1%) | 1,307 (39.9%) |
Occupancy by Educational Attainment in San Lorenzo
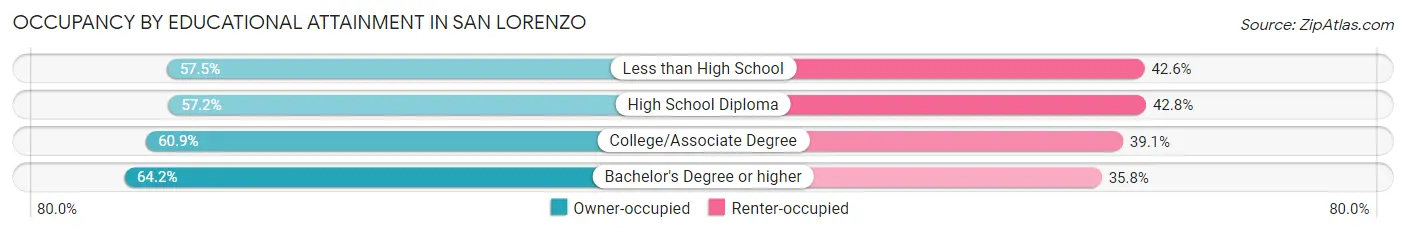
| Household Size | Owner-occupied | Renter-occupied |
| Less than High School | 478 (57.5%) | 354 (42.5%) |
| High School Diploma | 409 (57.2%) | 306 (42.8%) |
| College/Associate Degree | 504 (60.9%) | 324 (39.1%) |
| Bachelor's Degree or higher | 580 (64.2%) | 323 (35.8%) |
Occupancy by Age of Householder in San Lorenzo
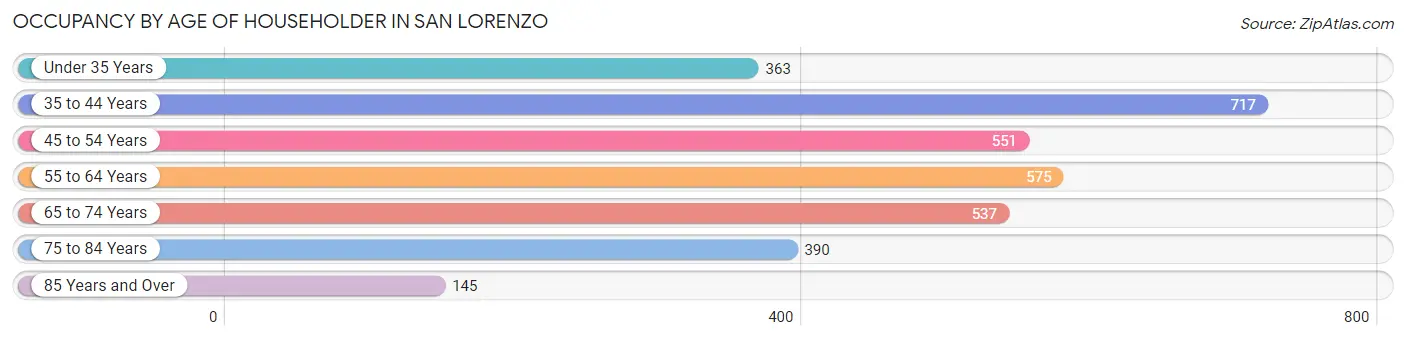
| Age Bracket | # Households | % Households |
| Under 35 Years | 363 | 11.1% |
| 35 to 44 Years | 717 | 21.9% |
| 45 to 54 Years | 551 | 16.8% |
| 55 to 64 Years | 575 | 17.5% |
| 65 to 74 Years | 537 | 16.4% |
| 75 to 84 Years | 390 | 11.9% |
| 85 Years and Over | 145 | 4.4% |
| Total | 3,278 | 100.0% |
Housing Finances in San Lorenzo
Median Income by Occupancy in San Lorenzo
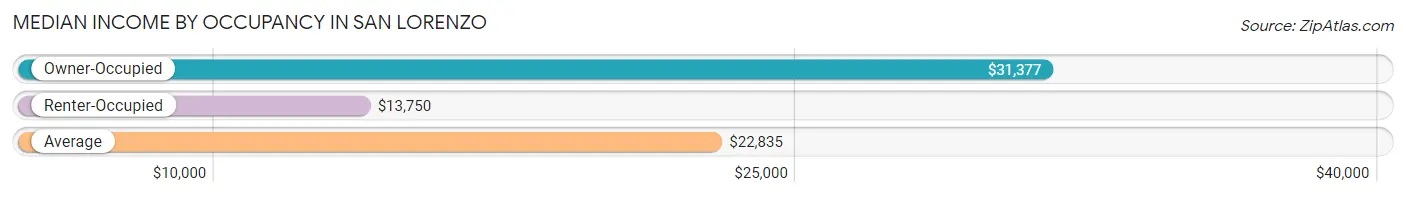
| Occupancy Type | # Households | Median Income |
| Owner-Occupied | 1,971 (60.1%) | $31,377 |
| Renter-Occupied | 1,307 (39.9%) | $13,750 |
| Average | 3,278 (100.0%) | $22,835 |
Occupancy by Householder Income Bracket in San Lorenzo
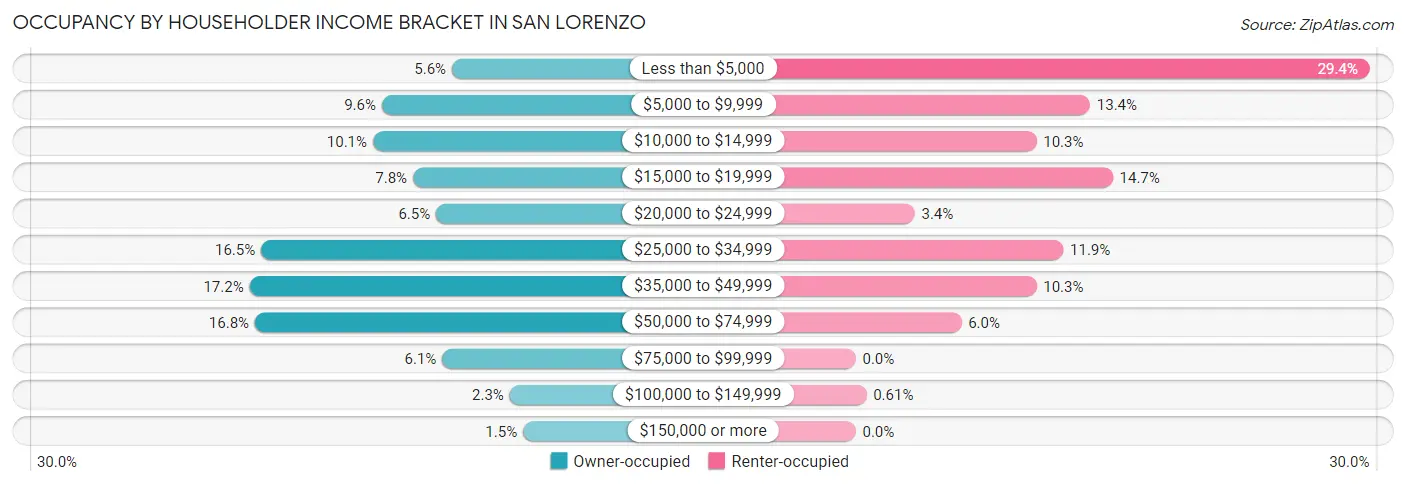
| Income Bracket | Owner-occupied | Renter-occupied |
| Less than $5,000 | 110 (5.6%) | 384 (29.4%) |
| $5,000 to $9,999 | 189 (9.6%) | 175 (13.4%) |
| $10,000 to $14,999 | 199 (10.1%) | 135 (10.3%) |
| $15,000 to $19,999 | 154 (7.8%) | 192 (14.7%) |
| $20,000 to $24,999 | 128 (6.5%) | 44 (3.4%) |
| $25,000 to $34,999 | 325 (16.5%) | 155 (11.9%) |
| $35,000 to $49,999 | 338 (17.2%) | 135 (10.3%) |
| $50,000 to $74,999 | 332 (16.8%) | 79 (6.0%) |
| $75,000 to $99,999 | 121 (6.1%) | 0 (0.0%) |
| $100,000 to $149,999 | 45 (2.3%) | 8 (0.6%) |
| $150,000 or more | 30 (1.5%) | 0 (0.0%) |
| Total | 1,971 (100.0%) | 1,307 (100.0%) |
Monthly Housing Cost Tiers in San Lorenzo
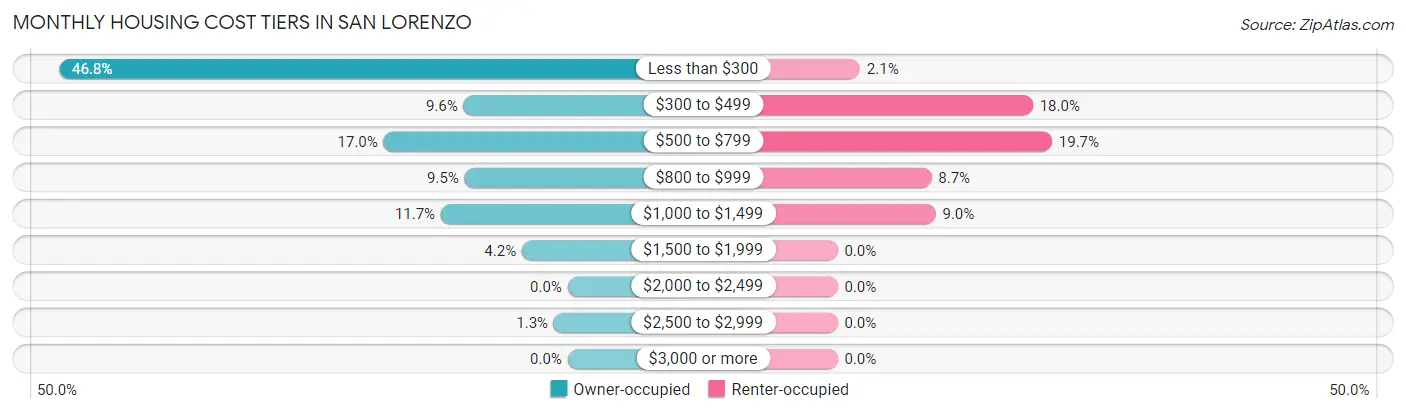
| Monthly Cost | Owner-occupied | Renter-occupied |
| Less than $300 | 923 (46.8%) | 27 (2.1%) |
| $300 to $499 | 189 (9.6%) | 235 (18.0%) |
| $500 to $799 | 334 (17.0%) | 258 (19.7%) |
| $800 to $999 | 187 (9.5%) | 113 (8.6%) |
| $1,000 to $1,499 | 230 (11.7%) | 118 (9.0%) |
| $1,500 to $1,999 | 83 (4.2%) | 0 (0.0%) |
| $2,000 to $2,499 | 0 (0.0%) | 0 (0.0%) |
| $2,500 to $2,999 | 25 (1.3%) | 0 (0.0%) |
| $3,000 or more | 0 (0.0%) | 0 (0.0%) |
| Total | 1,971 (100.0%) | 1,307 (100.0%) |
Physical Housing Characteristics in San Lorenzo
Housing Structures in San Lorenzo
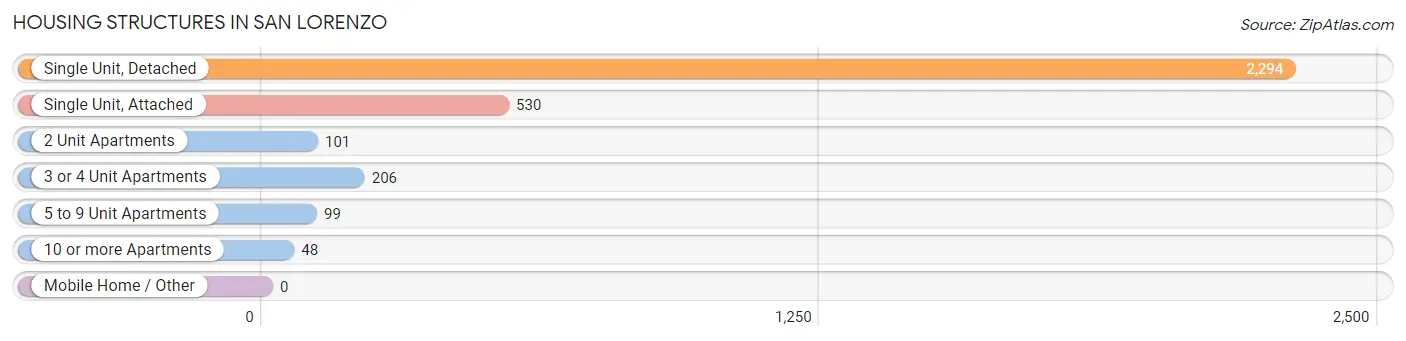
| Structure Type | # Housing Units | % Housing Units |
| Single Unit, Detached | 2,294 | 70.0% |
| Single Unit, Attached | 530 | 16.2% |
| 2 Unit Apartments | 101 | 3.1% |
| 3 or 4 Unit Apartments | 206 | 6.3% |
| 5 to 9 Unit Apartments | 99 | 3.0% |
| 10 or more Apartments | 48 | 1.5% |
| Mobile Home / Other | 0 | 0.0% |
| Total | 3,278 | 100.0% |
Housing Structures by Occupancy in San Lorenzo
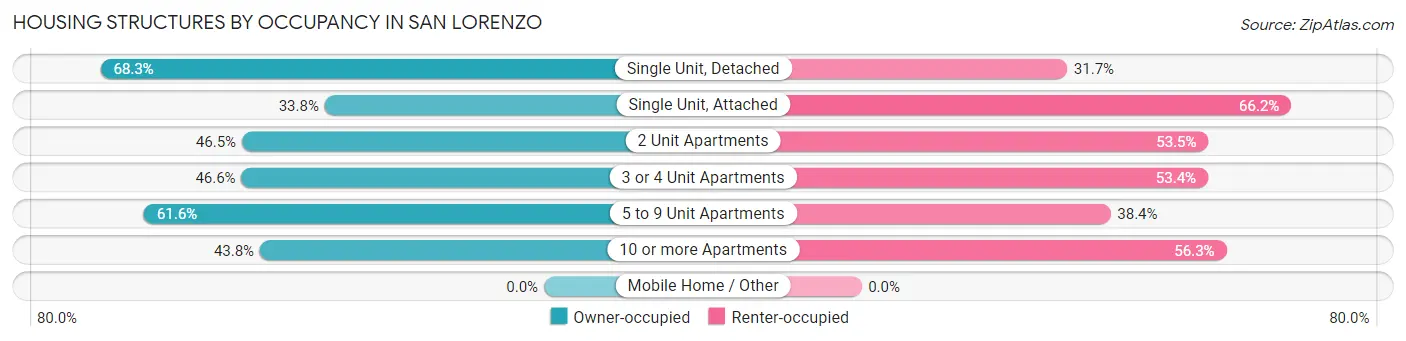
| Structure Type | Owner-occupied | Renter-occupied |
| Single Unit, Detached | 1,567 (68.3%) | 727 (31.7%) |
| Single Unit, Attached | 179 (33.8%) | 351 (66.2%) |
| 2 Unit Apartments | 47 (46.5%) | 54 (53.5%) |
| 3 or 4 Unit Apartments | 96 (46.6%) | 110 (53.4%) |
| 5 to 9 Unit Apartments | 61 (61.6%) | 38 (38.4%) |
| 10 or more Apartments | 21 (43.8%) | 27 (56.2%) |
| Mobile Home / Other | 0 (0.0%) | 0 (0.0%) |
| Total | 1,971 (60.1%) | 1,307 (39.9%) |
Housing Structures by Number of Rooms in San Lorenzo
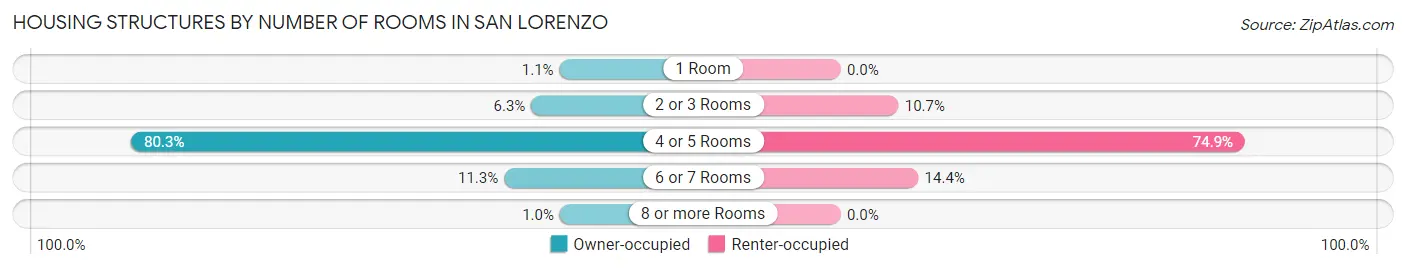
| Number of Rooms | Owner-occupied | Renter-occupied |
| 1 Room | 21 (1.1%) | 0 (0.0%) |
| 2 or 3 Rooms | 124 (6.3%) | 140 (10.7%) |
| 4 or 5 Rooms | 1,583 (80.3%) | 979 (74.9%) |
| 6 or 7 Rooms | 223 (11.3%) | 188 (14.4%) |
| 8 or more Rooms | 20 (1.0%) | 0 (0.0%) |
| Total | 1,971 (100.0%) | 1,307 (100.0%) |
Housing Structure by Heating Type in San Lorenzo
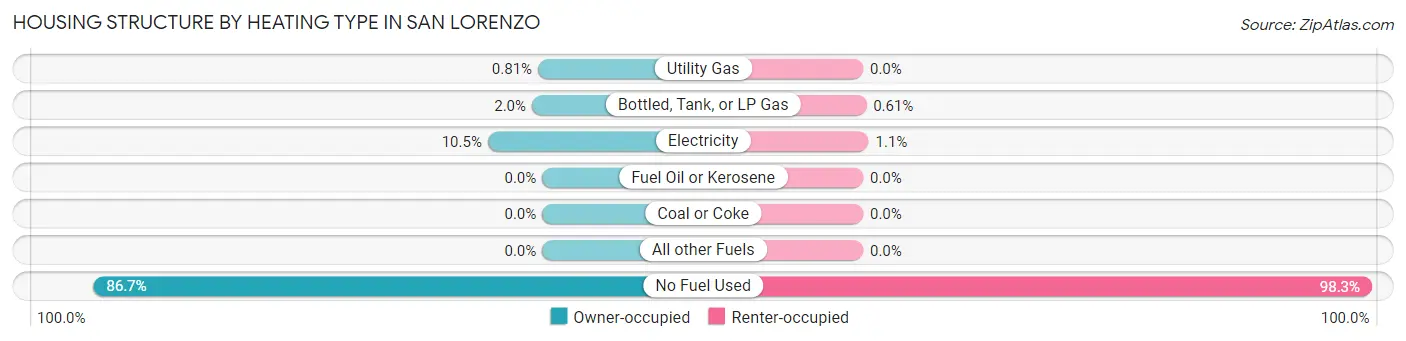
| Heating Type | Owner-occupied | Renter-occupied |
| Utility Gas | 16 (0.8%) | 0 (0.0%) |
| Bottled, Tank, or LP Gas | 39 (2.0%) | 8 (0.6%) |
| Electricity | 207 (10.5%) | 14 (1.1%) |
| Fuel Oil or Kerosene | 0 (0.0%) | 0 (0.0%) |
| Coal or Coke | 0 (0.0%) | 0 (0.0%) |
| All other Fuels | 0 (0.0%) | 0 (0.0%) |
| No Fuel Used | 1,709 (86.7%) | 1,285 (98.3%) |
| Total | 1,971 (100.0%) | 1,307 (100.0%) |
Household Vehicle Usage in San Lorenzo
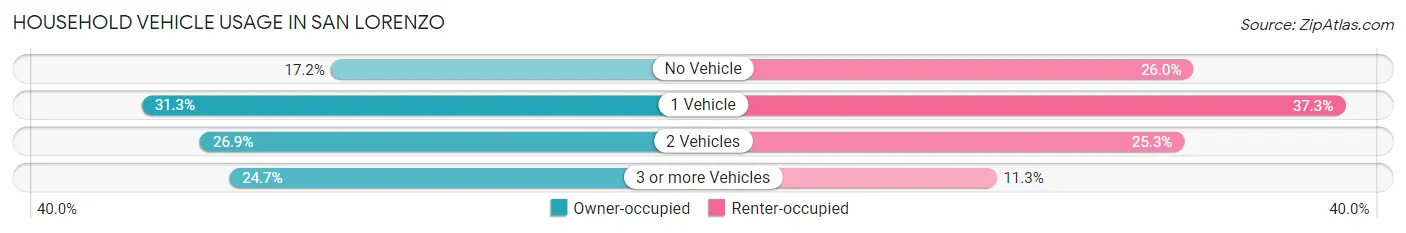
| Vehicles per Household | Owner-occupied | Renter-occupied |
| No Vehicle | 338 (17.2%) | 340 (26.0%) |
| 1 Vehicle | 616 (31.2%) | 488 (37.3%) |
| 2 Vehicles | 530 (26.9%) | 331 (25.3%) |
| 3 or more Vehicles | 487 (24.7%) | 148 (11.3%) |
| Total | 1,971 (100.0%) | 1,307 (100.0%) |
Real Estate & Mortgages in San Lorenzo
Real Estate and Mortgage Overview in San Lorenzo
| Characteristic | Without Mortgage | With Mortgage |
| Housing Units | 1,054 | 917 |
| Median Property Value | $95,800 | $130,100 |
| Median Household Income | $22,024 | $30 |
| Monthly Housing Costs | $165 | $0 |
| Real Estate Taxes | $475 | $853 |
Property Value by Mortgage Status in San Lorenzo
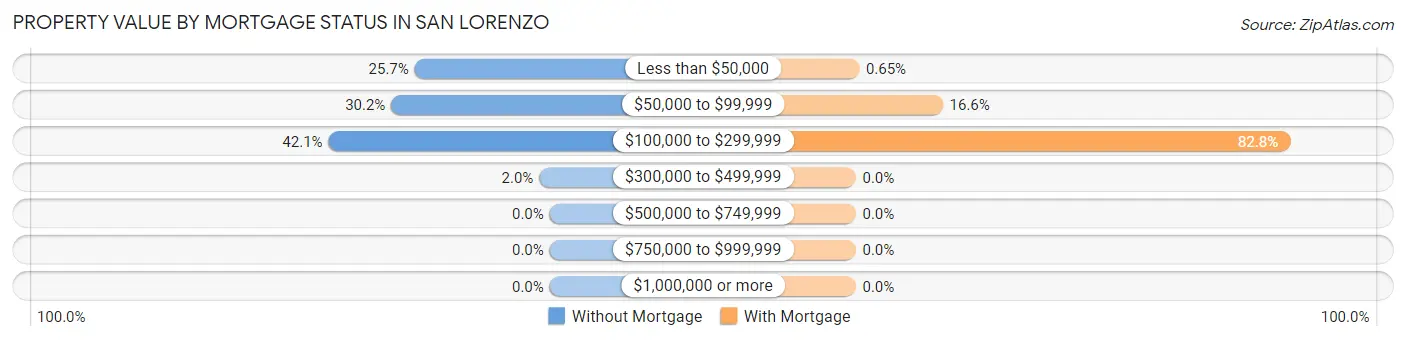
| Property Value | Without Mortgage | With Mortgage |
| Less than $50,000 | 271 (25.7%) | 6 (0.6%) |
| $50,000 to $99,999 | 318 (30.2%) | 152 (16.6%) |
| $100,000 to $299,999 | 444 (42.1%) | 759 (82.8%) |
| $300,000 to $499,999 | 21 (2.0%) | 0 (0.0%) |
| $500,000 to $749,999 | 0 (0.0%) | 0 (0.0%) |
| $750,000 to $999,999 | 0 (0.0%) | 0 (0.0%) |
| $1,000,000 or more | 0 (0.0%) | 0 (0.0%) |
| Total | 1,054 (100.0%) | 917 (100.0%) |
Household Income by Mortgage Status in San Lorenzo
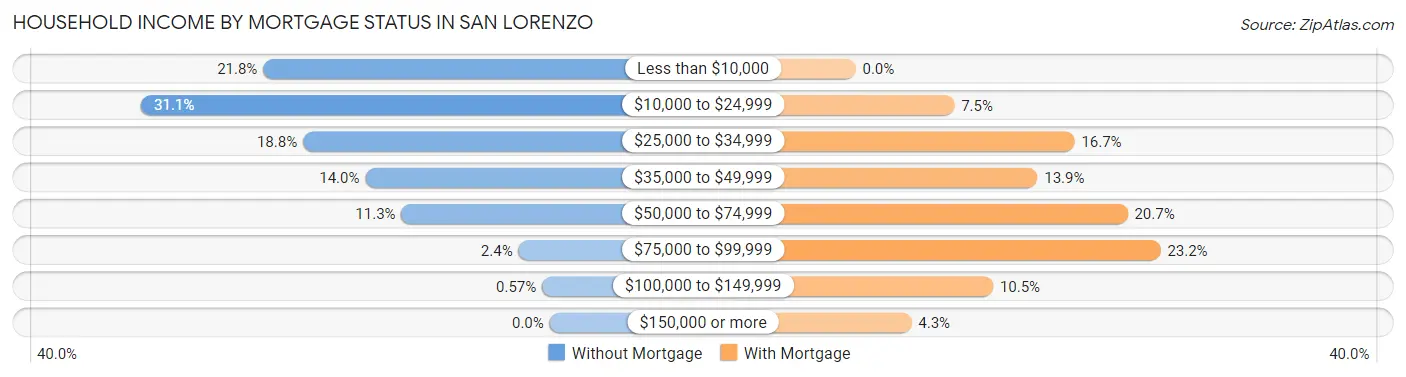
| Household Income | Without Mortgage | With Mortgage |
| Less than $10,000 | 230 (21.8%) | 0 (0.0%) |
| $10,000 to $24,999 | 328 (31.1%) | 69 (7.5%) |
| $25,000 to $34,999 | 198 (18.8%) | 153 (16.7%) |
| $35,000 to $49,999 | 148 (14.0%) | 127 (13.9%) |
| $50,000 to $74,999 | 119 (11.3%) | 190 (20.7%) |
| $75,000 to $99,999 | 25 (2.4%) | 213 (23.2%) |
| $100,000 to $149,999 | 6 (0.6%) | 96 (10.5%) |
| $150,000 or more | 0 (0.0%) | 39 (4.3%) |
| Total | 1,054 (100.0%) | 917 (100.0%) |
Property Value to Household Income Ratio in San Lorenzo
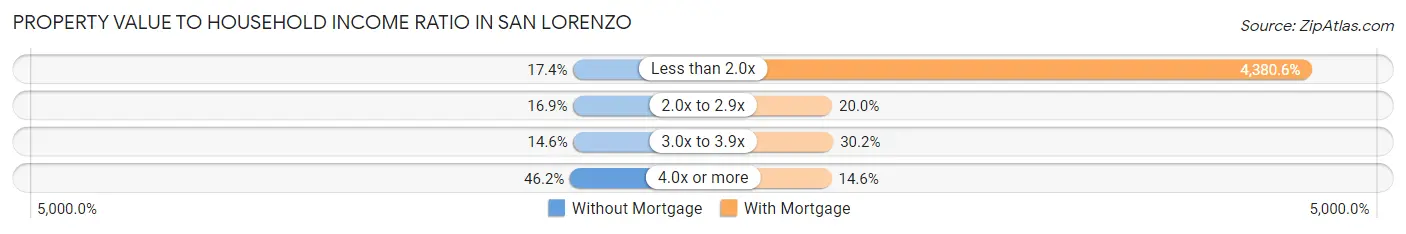
| Value-to-Income Ratio | Without Mortgage | With Mortgage |
| Less than 2.0x | 183 (17.4%) | 40,170 (4,380.6%) |
| 2.0x to 2.9x | 178 (16.9%) | 183 (20.0%) |
| 3.0x to 3.9x | 154 (14.6%) | 277 (30.2%) |
| 4.0x or more | 487 (46.2%) | 134 (14.6%) |
| Total | 1,054 (100.0%) | 917 (100.0%) |
Real Estate Taxes by Mortgage Status in San Lorenzo
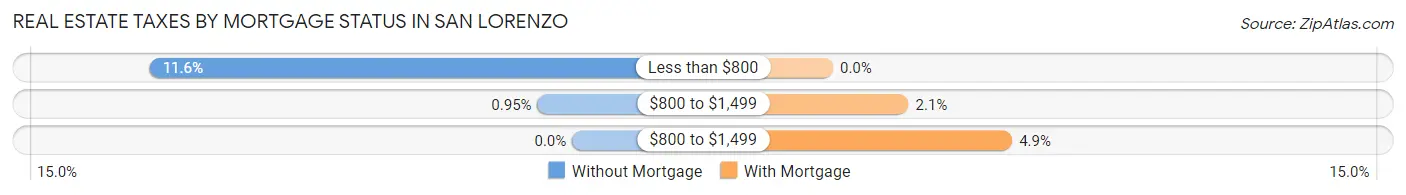
| Property Taxes | Without Mortgage | With Mortgage |
| Less than $800 | 122 (11.6%) | 0 (0.0%) |
| $800 to $1,499 | 10 (0.9%) | 19 (2.1%) |
| $800 to $1,499 | 0 (0.0%) | 45 (4.9%) |
| Total | 1,054 (100.0%) | 917 (100.0%) |
Health & Disability in San Lorenzo
Health Insurance Coverage by Age in San Lorenzo
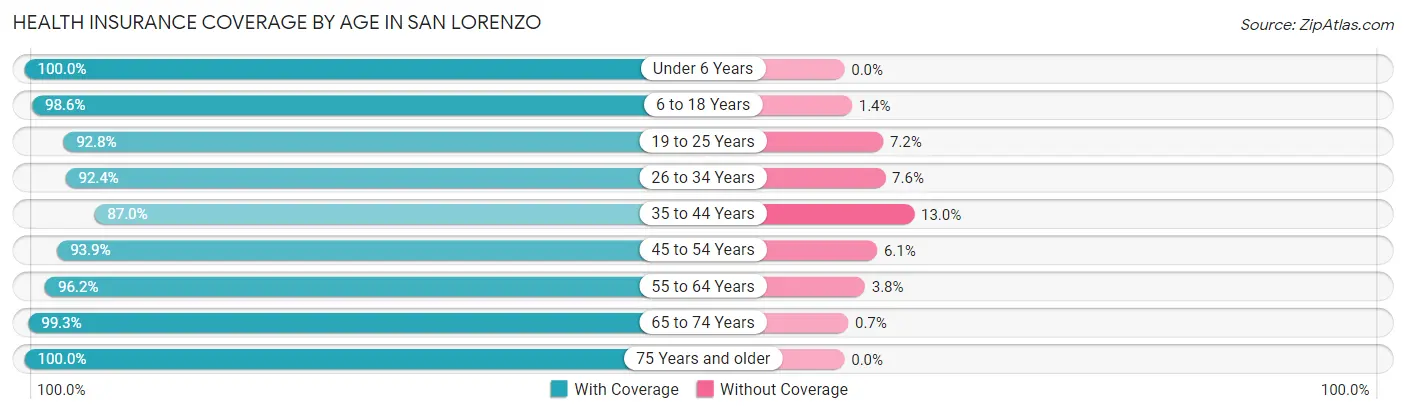
| Age Bracket | With Coverage | Without Coverage |
| Under 6 Years | 416 (100.0%) | 0 (0.0%) |
| 6 to 18 Years | 1,411 (98.6%) | 20 (1.4%) |
| 19 to 25 Years | 682 (92.8%) | 53 (7.2%) |
| 26 to 34 Years | 800 (92.4%) | 66 (7.6%) |
| 35 to 44 Years | 983 (87.0%) | 147 (13.0%) |
| 45 to 54 Years | 1,203 (93.9%) | 78 (6.1%) |
| 55 to 64 Years | 932 (96.2%) | 37 (3.8%) |
| 65 to 74 Years | 847 (99.3%) | 6 (0.7%) |
| 75 Years and older | 847 (100.0%) | 0 (0.0%) |
| Total | 8,121 (95.2%) | 407 (4.8%) |
Health Insurance Coverage by Citizenship Status in San Lorenzo
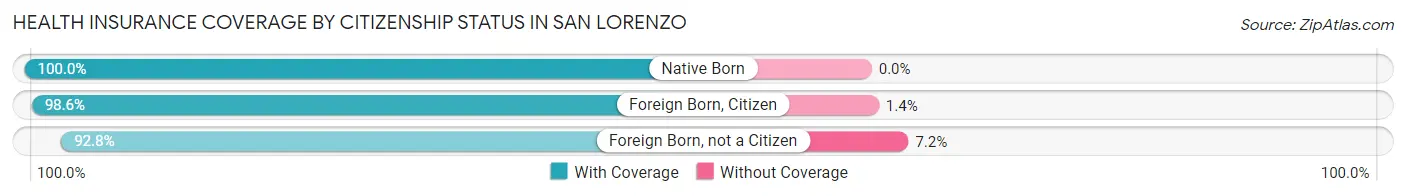
| Citizenship Status | With Coverage | Without Coverage |
| Native Born | 416 (100.0%) | 0 (0.0%) |
| Foreign Born, Citizen | 1,411 (98.6%) | 20 (1.4%) |
| Foreign Born, not a Citizen | 682 (92.8%) | 53 (7.2%) |
Health Insurance Coverage by Household Income in San Lorenzo
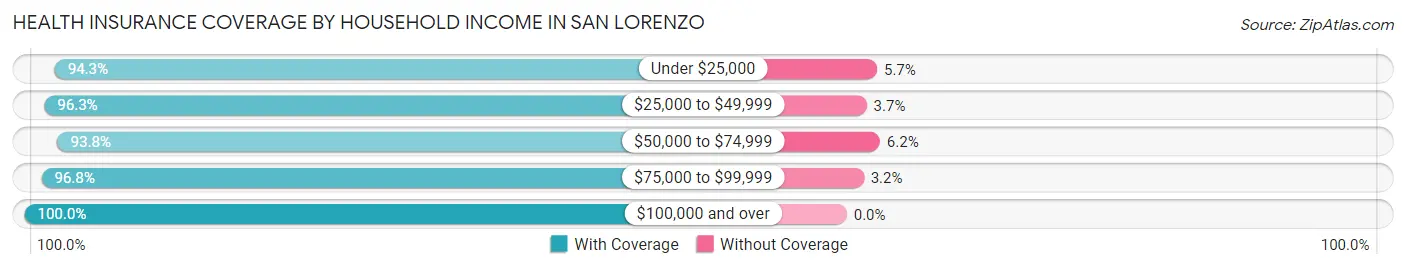
| Household Income | With Coverage | Without Coverage |
| Under $25,000 | 3,524 (94.3%) | 212 (5.7%) |
| $25,000 to $49,999 | 2,462 (96.3%) | 95 (3.7%) |
| $50,000 to $74,999 | 1,271 (93.8%) | 84 (6.2%) |
| $75,000 to $99,999 | 488 (96.8%) | 16 (3.2%) |
| $100,000 and over | 376 (100.0%) | 0 (0.0%) |
Public vs Private Health Insurance Coverage by Age in San Lorenzo
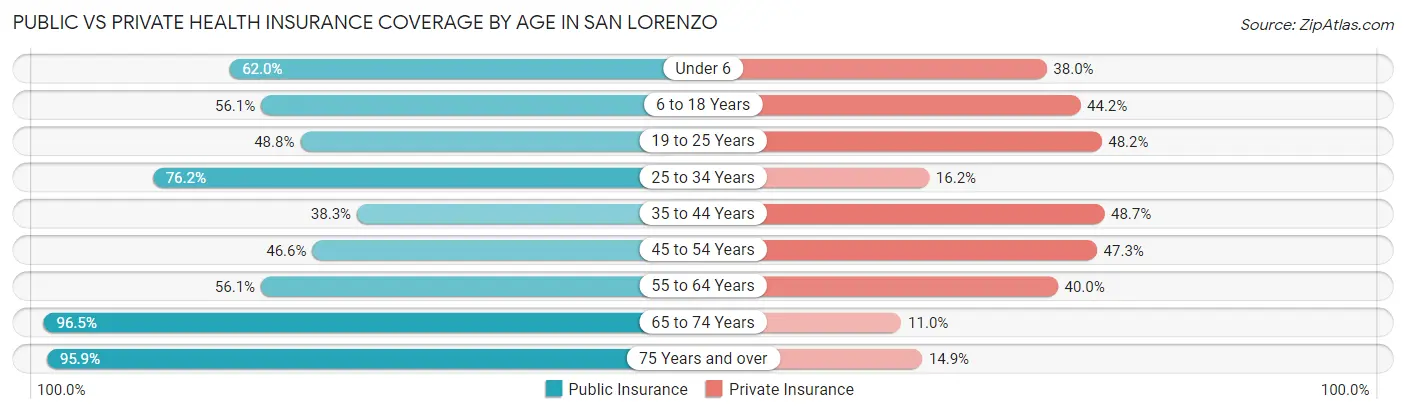
| Age Bracket | Public Insurance | Private Insurance |
| Under 6 | 258 (62.0%) | 158 (38.0%) |
| 6 to 18 Years | 803 (56.1%) | 633 (44.2%) |
| 19 to 25 Years | 359 (48.8%) | 354 (48.2%) |
| 25 to 34 Years | 660 (76.2%) | 140 (16.2%) |
| 35 to 44 Years | 433 (38.3%) | 550 (48.7%) |
| 45 to 54 Years | 597 (46.6%) | 606 (47.3%) |
| 55 to 64 Years | 544 (56.1%) | 388 (40.0%) |
| 65 to 74 Years | 823 (96.5%) | 94 (11.0%) |
| 75 Years and over | 812 (95.9%) | 126 (14.9%) |
| Total | 5,289 (62.0%) | 3,049 (35.7%) |
Disability Status by Sex by Age in San Lorenzo
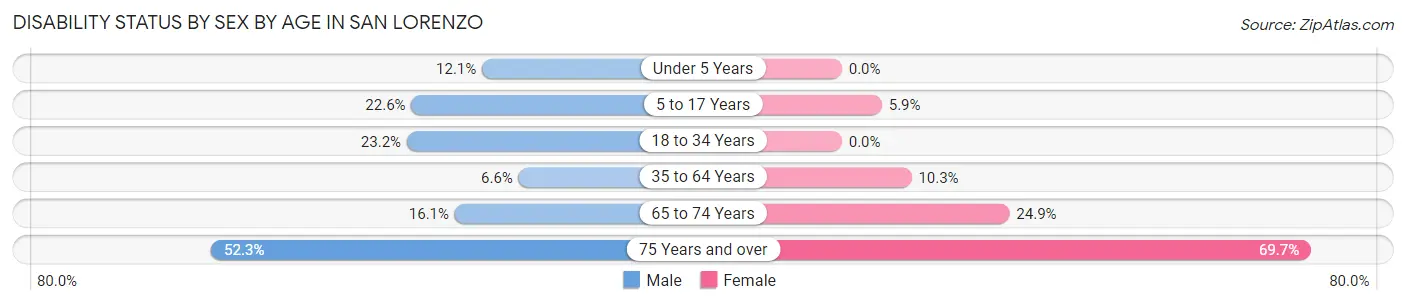
| Age Bracket | Male | Female |
| Under 5 Years | 17 (12.1%) | 0 (0.0%) |
| 5 to 17 Years | 155 (22.6%) | 41 (5.9%) |
| 18 to 34 Years | 171 (23.2%) | 0 (0.0%) |
| 35 to 64 Years | 101 (6.6%) | 192 (10.3%) |
| 65 to 74 Years | 63 (16.1%) | 115 (24.9%) |
| 75 Years and over | 193 (52.3%) | 333 (69.7%) |
Disability Class by Sex by Age in San Lorenzo
Disability Class: Hearing Difficulty
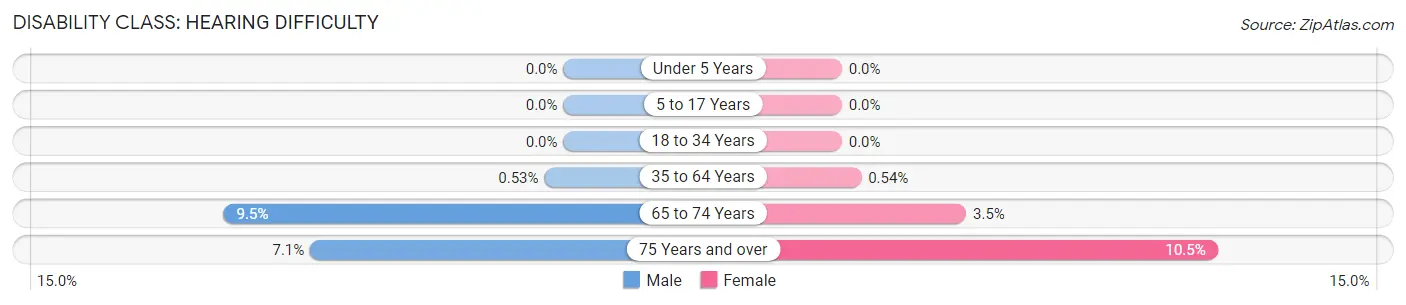
| Age Bracket | Male | Female |
| Under 5 Years | 0 (0.0%) | 0 (0.0%) |
| 5 to 17 Years | 0 (0.0%) | 0 (0.0%) |
| 18 to 34 Years | 0 (0.0%) | 0 (0.0%) |
| 35 to 64 Years | 8 (0.5%) | 10 (0.5%) |
| 65 to 74 Years | 37 (9.5%) | 16 (3.5%) |
| 75 Years and over | 26 (7.0%) | 50 (10.5%) |
Disability Class: Vision Difficulty
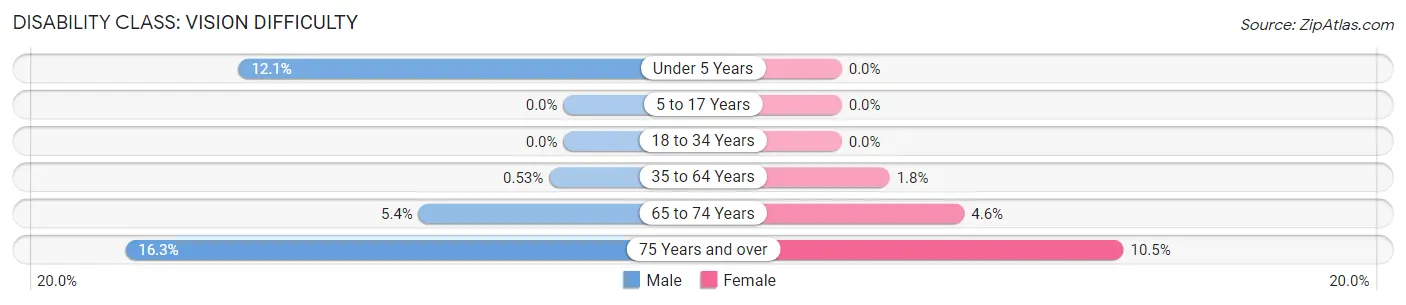
| Age Bracket | Male | Female |
| Under 5 Years | 17 (12.1%) | 0 (0.0%) |
| 5 to 17 Years | 0 (0.0%) | 0 (0.0%) |
| 18 to 34 Years | 0 (0.0%) | 0 (0.0%) |
| 35 to 64 Years | 8 (0.5%) | 33 (1.8%) |
| 65 to 74 Years | 21 (5.4%) | 21 (4.5%) |
| 75 Years and over | 60 (16.3%) | 50 (10.5%) |
Disability Class: Cognitive Difficulty
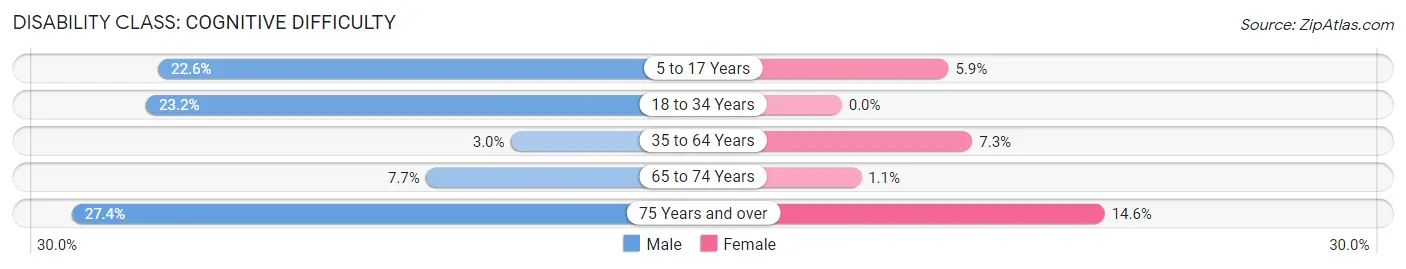
| Age Bracket | Male | Female |
| 5 to 17 Years | 155 (22.6%) | 41 (5.9%) |
| 18 to 34 Years | 171 (23.2%) | 0 (0.0%) |
| 35 to 64 Years | 45 (2.9%) | 135 (7.3%) |
| 65 to 74 Years | 30 (7.7%) | 5 (1.1%) |
| 75 Years and over | 101 (27.4%) | 70 (14.6%) |
Disability Class: Ambulatory Difficulty
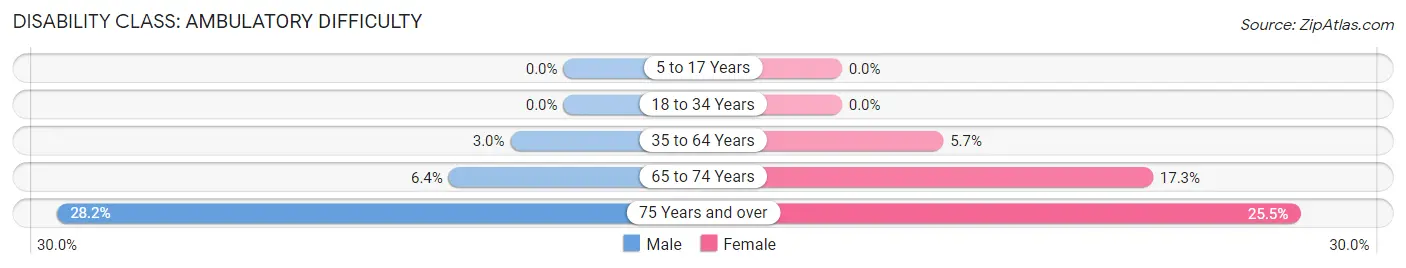
| Age Bracket | Male | Female |
| 5 to 17 Years | 0 (0.0%) | 0 (0.0%) |
| 18 to 34 Years | 0 (0.0%) | 0 (0.0%) |
| 35 to 64 Years | 45 (2.9%) | 105 (5.7%) |
| 65 to 74 Years | 25 (6.4%) | 80 (17.3%) |
| 75 Years and over | 104 (28.2%) | 122 (25.5%) |
Disability Class: Self-Care Difficulty
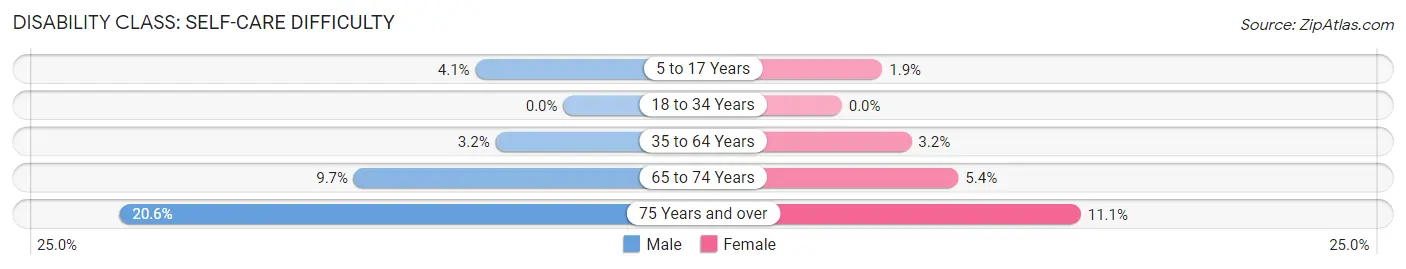
| Age Bracket | Male | Female |
| 5 to 17 Years | 28 (4.1%) | 13 (1.9%) |
| 18 to 34 Years | 0 (0.0%) | 0 (0.0%) |
| 35 to 64 Years | 48 (3.2%) | 60 (3.2%) |
| 65 to 74 Years | 38 (9.7%) | 25 (5.4%) |
| 75 Years and over | 76 (20.6%) | 53 (11.1%) |
Technology Access in San Lorenzo
Computing Device Access in San Lorenzo
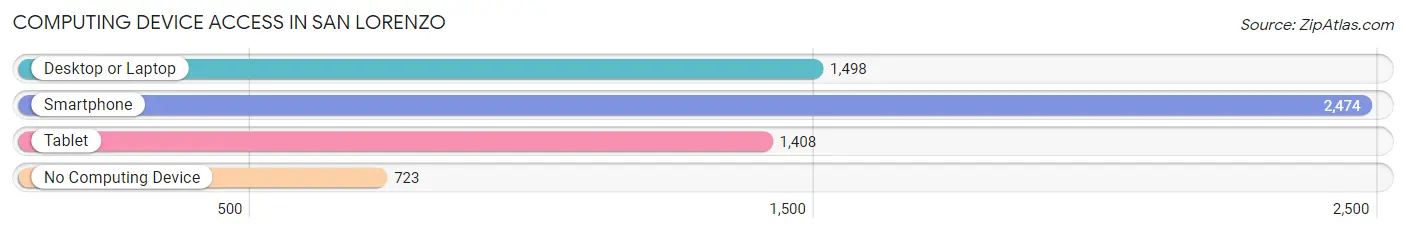
| Device Type | # Households | % Households |
| Desktop or Laptop | 1,498 | 45.7% |
| Smartphone | 2,474 | 75.5% |
| Tablet | 1,408 | 42.9% |
| No Computing Device | 723 | 22.1% |
| Total | 3,278 | 100.0% |
Internet Access in San Lorenzo
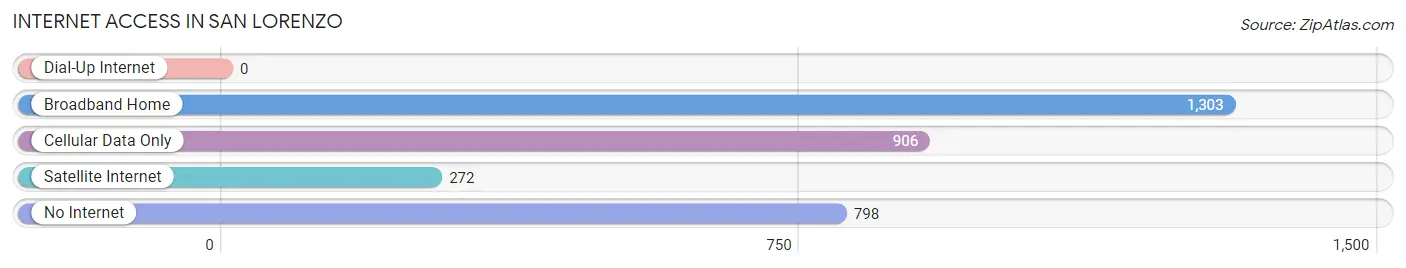
| Internet Type | # Households | % Households |
| Dial-Up Internet | 0 | 0.0% |
| Broadband Home | 1,303 | 39.8% |
| Cellular Data Only | 906 | 27.6% |
| Satellite Internet | 272 | 8.3% |
| No Internet | 798 | 24.3% |
| Total | 3,278 | 100.0% |
San Lorenzo Summary
San Lorenzo is a municipality located in the eastern part of Puerto Rico, in the region known as the Eastern Region. It is bordered by the municipalities of Yabucoa, Maunabo, Patillas, and Las Piedras. San Lorenzo is known as the “City of the Three Rivers” because it is located at the confluence of the San Lorenzo, Cibuco, and La Plata rivers.
History
San Lorenzo was founded in 1737 by Don Juan de Aponte y Toledo, a Spanish military officer. The town was originally called San Lorenzo de la Magdalena, but the name was later shortened to San Lorenzo. The town was officially recognized by the Spanish government in 1741.
San Lorenzo was an important agricultural center during the Spanish colonial period. The town was known for its production of sugar cane, coffee, and tobacco. In the 19th century, San Lorenzo was also an important center for the production of rum.
Geography
San Lorenzo is located in the eastern part of Puerto Rico, in the region known as the Eastern Region. It is bordered by the municipalities of Yabucoa, Maunabo, Patillas, and Las Piedras. San Lorenzo is known as the “City of the Three Rivers” because it is located at the confluence of the San Lorenzo, Cibuco, and La Plata rivers.
The municipality has a total area of 39.9 square miles (103.2 km2). The terrain is mostly flat, with some hills in the northern part of the municipality. The highest point in San Lorenzo is Cerro La Punta, which has an elevation of 1,067 feet (325 m).
Economy
San Lorenzo’s economy is largely based on agriculture. The municipality is known for its production of sugar cane, coffee, and tobacco. In addition, San Lorenzo is home to several manufacturing plants, including a pharmaceutical plant and a plastics factory.
The municipality also has a growing tourism industry. San Lorenzo is home to several beaches, including Playa de San Lorenzo, Playa de La Punta, and Playa de La Plata. The municipality also has several historical sites, including the ruins of the San Lorenzo de la Magdalena sugar mill.
Demographics
As of the 2010 census, San Lorenzo had a population of 28,845. The population is mostly of Puerto Rican descent, with a small percentage of African and European descent. The median age in San Lorenzo is 38.7 years, and the median household income is $19,845.
San Lorenzo is a predominantly Roman Catholic municipality. The majority of the population speaks Spanish as their first language, although English is also spoken.
San Lorenzo is a municipality with a rich history, diverse geography, and a vibrant economy. The municipality is home to several historical sites, beautiful beaches, and a variety of agricultural products. San Lorenzo is a great place to visit and live, and its population is sure to continue to grow in the years to come.
Common Questions
What is Per Capita Income in San Lorenzo?
Per Capita income in San Lorenzo is $12,782.
What is the Median Family Income in San Lorenzo?
Median Family Income in San Lorenzo is $26,225.
What is the Median Household income in San Lorenzo?
Median Household Income in San Lorenzo is $22,835.
What is Income or Wage Gap in San Lorenzo?
Income or Wage Gap in San Lorenzo is 30.4%.
Women in San Lorenzo earn 69.6 cents for every dollar earned by a man.
What is Family Income Deficit in San Lorenzo?
Family Income Deficit in San Lorenzo is $12,962.
Families that are below poverty line in San Lorenzo earn $12,962 less on average than the poverty threshold level.
What is Inequality or Gini Index in San Lorenzo?
Inequality or Gini Index in San Lorenzo is 0.48.
What is the Total Population of San Lorenzo?
Total Population of San Lorenzo is 8,588.
What is the Total Male Population of San Lorenzo?
Total Male Population of San Lorenzo is 3,875.
What is the Total Female Population of San Lorenzo?
Total Female Population of San Lorenzo is 4,713.
What is the Ratio of Males per 100 Females in San Lorenzo?
There are 82.22 Males per 100 Females in San Lorenzo.
What is the Ratio of Females per 100 Males in San Lorenzo?
There are 121.63 Females per 100 Males in San Lorenzo.
What is the Median Population Age in San Lorenzo?
Median Population Age in San Lorenzo is 41.9 Years.
What is the Average Family Size in San Lorenzo
Average Family Size in San Lorenzo is 3.3 People.
What is the Average Household Size in San Lorenzo
Average Household Size in San Lorenzo is 2.6 People.
How Large is the Labor Force in San Lorenzo?
There are 2,865 People in the Labor Forcein in San Lorenzo.
What is the Percentage of People in the Labor Force in San Lorenzo?
39.9% of People are in the Labor Force in San Lorenzo.
What is the Unemployment Rate in San Lorenzo?
Unemployment Rate in San Lorenzo is 6.3%.