Trujillo Alto, PR Map & Demographics
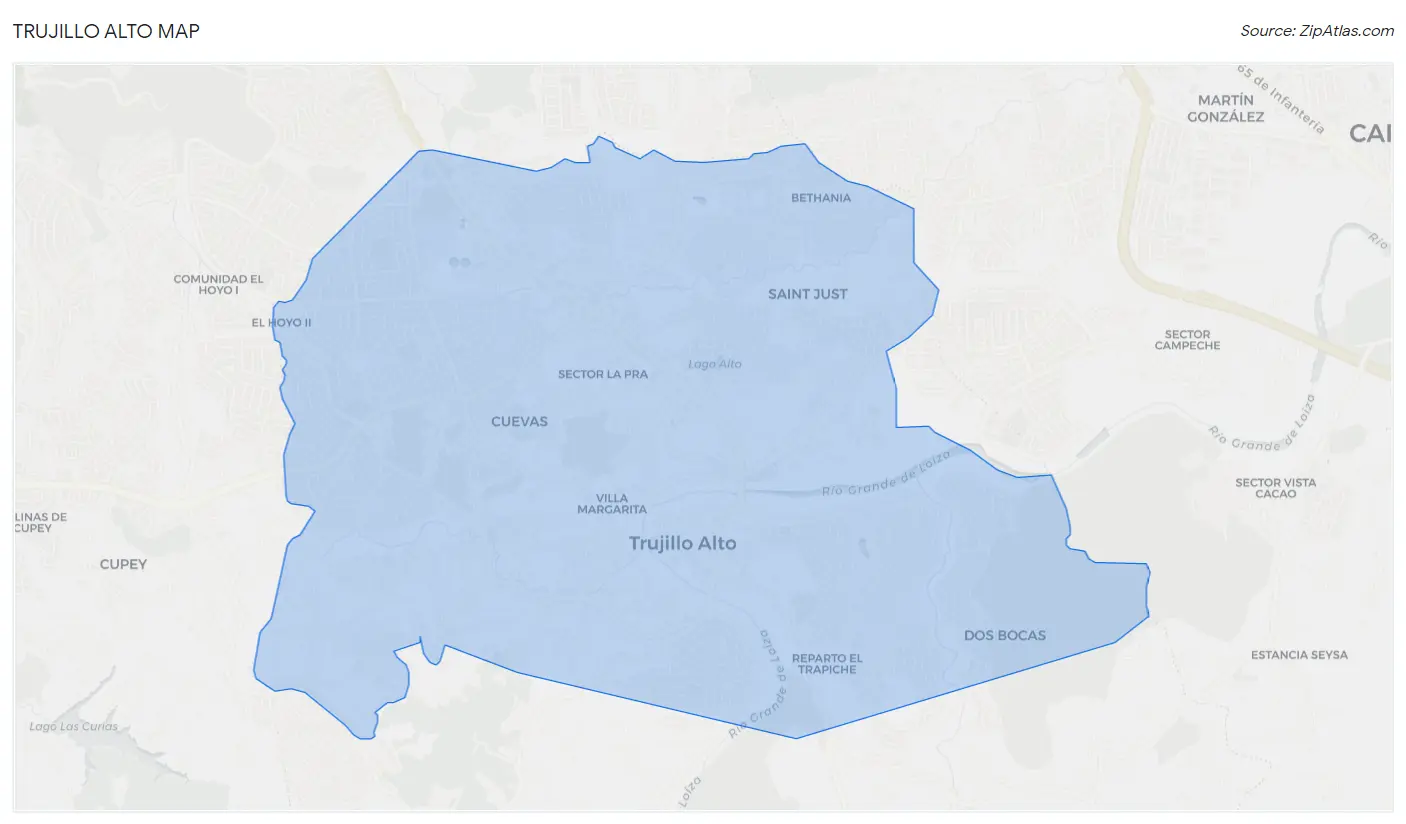
Trujillo Alto Map
Trujillo Alto Overview
$20,531
PER CAPITA INCOME
$44,505
AVG FAMILY INCOME
$36,706
AVG HOUSEHOLD INCOME
5.2%
WAGE / INCOME GAP [ % ]
94.8¢/ $1
WAGE / INCOME GAP [ $ ]
$9,211
FAMILY INCOME DEFICIT
0.49
INEQUALITY / GINI INDEX
43,192
TOTAL POPULATION
19,792
MALE POPULATION
23,400
FEMALE POPULATION
84.58
MALES / 100 FEMALES
118.23
FEMALES / 100 MALES
43.6
MEDIAN AGE
3.0
AVG FAMILY SIZE
2.5
AVG HOUSEHOLD SIZE
19,712
LABOR FORCE [ PEOPLE ]
52.7%
PERCENT IN LABOR FORCE
7.7%
UNEMPLOYMENT RATE
Trujillo Alto Zip Codes
Income in Trujillo Alto
Income Overview in Trujillo Alto
Per Capita Income in Trujillo Alto is $20,531, while median incomes of families and households are $44,505 and $36,706 respectively.
| Characteristic | Number | Measure |
| Per Capita Income | 43,192 | $20,531 |
| Median Family Income | 11,604 | $44,505 |
| Mean Family Income | 11,604 | $58,188 |
| Median Household Income | 16,940 | $36,706 |
| Mean Household Income | 16,940 | $50,746 |
| Income Deficit | 11,604 | $9,211 |
| Wage / Income Gap (%) | 43,192 | 5.24% |
| Wage / Income Gap ($) | 43,192 | 94.76¢ per $1 |
| Gini / Inequality Index | 43,192 | 0.49 |
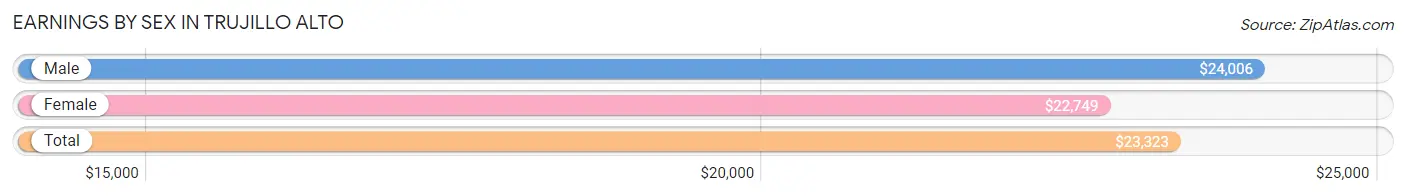
Earnings by Sex in Trujillo Alto
Average Earnings in Trujillo Alto are $23,323, $24,006 for men and $22,749 for women, a difference of 5.2%.
| Sex | Number | Average Earnings |
| Male | 9,458 (48.8%) | $24,006 |
| Female | 9,912 (51.2%) | $22,749 |
| Total | 19,370 (100.0%) | $23,323 |
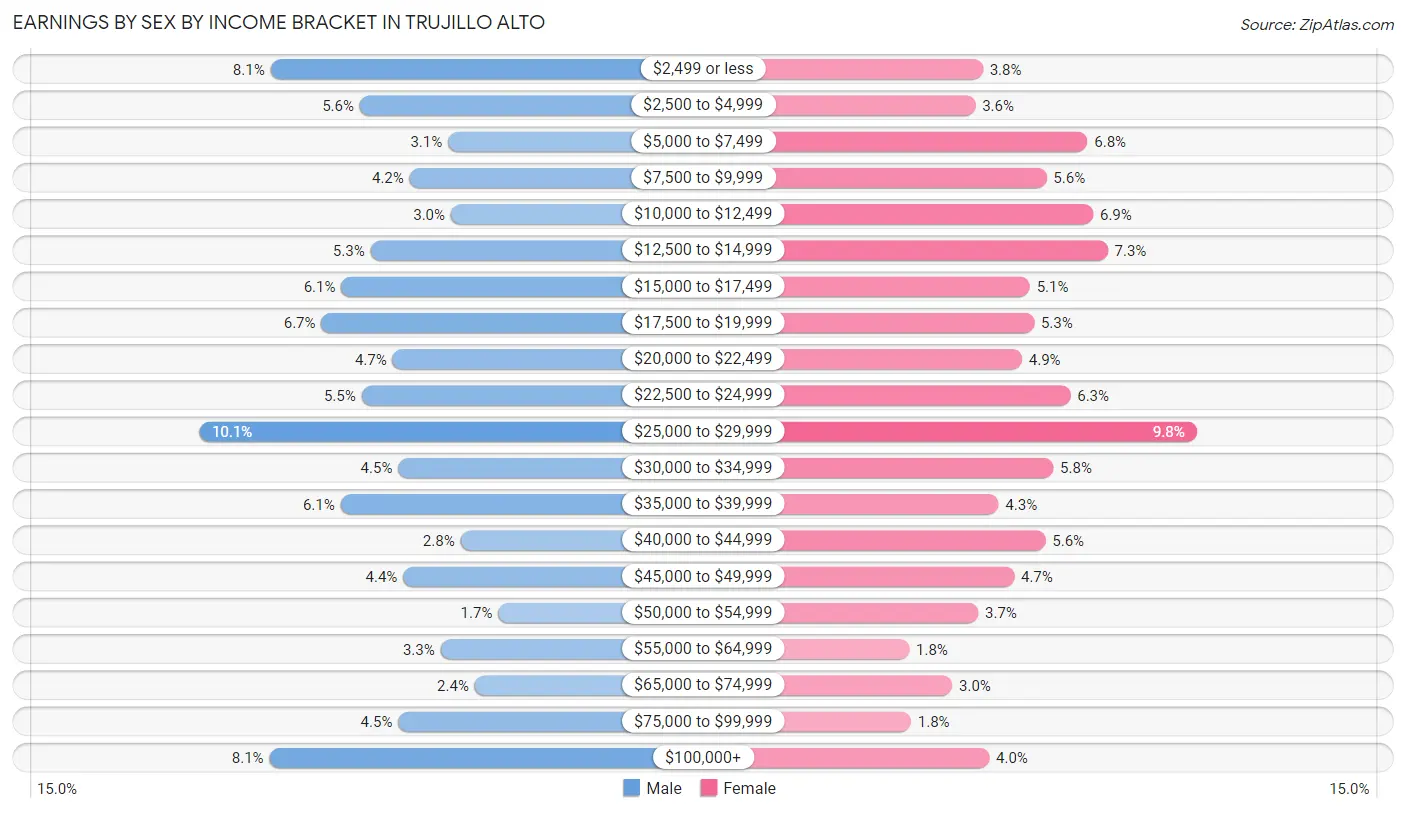
Earnings by Sex by Income Bracket in Trujillo Alto
The most common earnings brackets in Trujillo Alto are $25,000 to $29,999 for men (955 | 10.1%) and $25,000 to $29,999 for women (974 | 9.8%).
| Income | Male | Female |
| $2,499 or less | 765 (8.1%) | 379 (3.8%) |
| $2,500 to $4,999 | 528 (5.6%) | 358 (3.6%) |
| $5,000 to $7,499 | 293 (3.1%) | 670 (6.8%) |
| $7,500 to $9,999 | 395 (4.2%) | 556 (5.6%) |
| $10,000 to $12,499 | 286 (3.0%) | 686 (6.9%) |
| $12,500 to $14,999 | 499 (5.3%) | 727 (7.3%) |
| $15,000 to $17,499 | 577 (6.1%) | 509 (5.1%) |
| $17,500 to $19,999 | 630 (6.7%) | 521 (5.3%) |
| $20,000 to $22,499 | 441 (4.7%) | 488 (4.9%) |
| $22,500 to $24,999 | 523 (5.5%) | 622 (6.3%) |
| $25,000 to $29,999 | 955 (10.1%) | 974 (9.8%) |
| $30,000 to $34,999 | 426 (4.5%) | 575 (5.8%) |
| $35,000 to $39,999 | 579 (6.1%) | 422 (4.3%) |
| $40,000 to $44,999 | 260 (2.8%) | 553 (5.6%) |
| $45,000 to $49,999 | 412 (4.4%) | 466 (4.7%) |
| $50,000 to $54,999 | 160 (1.7%) | 366 (3.7%) |
| $55,000 to $64,999 | 313 (3.3%) | 173 (1.8%) |
| $65,000 to $74,999 | 222 (2.4%) | 293 (3.0%) |
| $75,000 to $99,999 | 426 (4.5%) | 178 (1.8%) |
| $100,000+ | 768 (8.1%) | 396 (4.0%) |
| Total | 9,458 (100.0%) | 9,912 (100.0%) |
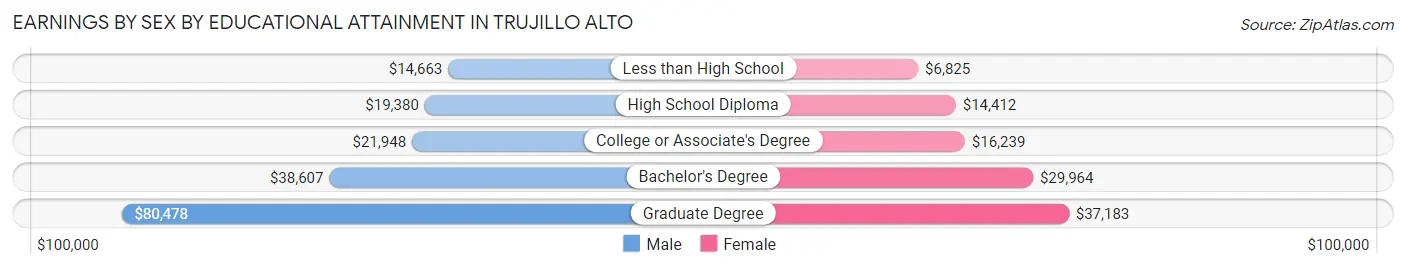
Earnings by Sex by Educational Attainment in Trujillo Alto
Average earnings in Trujillo Alto are $26,171 for men and $23,810 for women, a difference of 9.0%. Men with an educational attainment of graduate degree enjoy the highest average annual earnings of $80,478, while those with less than high school education earn the least with $14,663. Women with an educational attainment of graduate degree earn the most with the average annual earnings of $37,183, while those with less than high school education have the smallest earnings of $6,825.
| Educational Attainment | Male Income | Female Income |
| Less than High School | $14,663 | $6,825 |
| High School Diploma | $19,380 | $14,412 |
| College or Associate's Degree | $21,948 | $16,239 |
| Bachelor's Degree | $38,607 | $29,964 |
| Graduate Degree | $80,478 | $37,183 |
| Total | $26,171 | $23,810 |
Family Income in Trujillo Alto
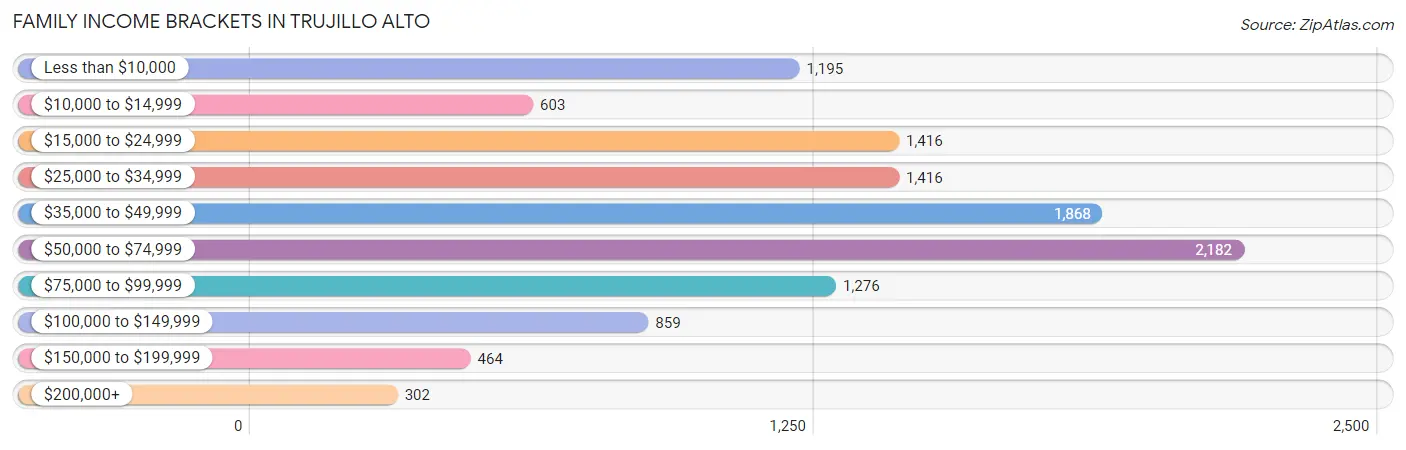
Family Income Brackets in Trujillo Alto
According to the Trujillo Alto family income data, there are 2,182 families falling into the $50,000 to $74,999 income range, which is the most common income bracket and makes up 18.8% of all families. Conversely, the $200,000+ income bracket is the least frequent group with only 302 families (2.6%) belonging to this category.
| Income Bracket | # Families | % Families |
| Less than $10,000 | 1,195 | 10.3% |
| $10,000 to $14,999 | 603 | 5.2% |
| $15,000 to $24,999 | 1,416 | 12.2% |
| $25,000 to $34,999 | 1,416 | 12.2% |
| $35,000 to $49,999 | 1,868 | 16.1% |
| $50,000 to $74,999 | 2,182 | 18.8% |
| $75,000 to $99,999 | 1,276 | 11.0% |
| $100,000 to $149,999 | 859 | 7.4% |
| $150,000 to $199,999 | 464 | 4.0% |
| $200,000+ | 302 | 2.6% |
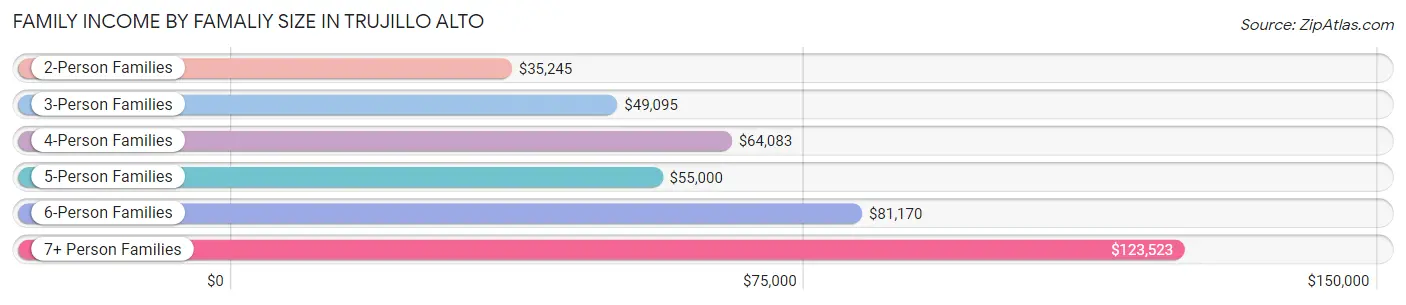
Family Income by Famaliy Size in Trujillo Alto
7+ person families (83 | 0.7%) account for the highest median family income in Trujillo Alto with $123,523 per family, while 7+ person families (83 | 0.7%) have the highest median income of $17,646 per family member.
| Income Bracket | # Families | Median Income |
| 2-Person Families | 5,440 (46.9%) | $35,245 |
| 3-Person Families | 3,755 (32.4%) | $49,095 |
| 4-Person Families | 1,550 (13.4%) | $64,083 |
| 5-Person Families | 706 (6.1%) | $55,000 |
| 6-Person Families | 70 (0.6%) | $81,170 |
| 7+ Person Families | 83 (0.7%) | $123,523 |
| Total | 11,604 (100.0%) | $44,505 |
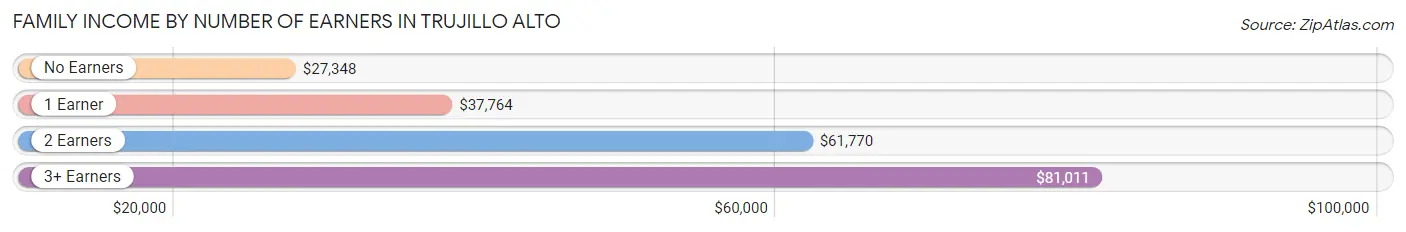
Family Income by Number of Earners in Trujillo Alto
The median family income in Trujillo Alto is $44,505, with families comprising 3+ earners (1,036) having the highest median family income of $81,011, while families with no earners (2,676) have the lowest median family income of $27,348, accounting for 8.9% and 23.1% of families, respectively.
| Number of Earners | # Families | Median Income |
| No Earners | 2,676 (23.1%) | $27,348 |
| 1 Earner | 4,759 (41.0%) | $37,764 |
| 2 Earners | 3,133 (27.0%) | $61,770 |
| 3+ Earners | 1,036 (8.9%) | $81,011 |
| Total | 11,604 (100.0%) | $44,505 |
Household Income in Trujillo Alto
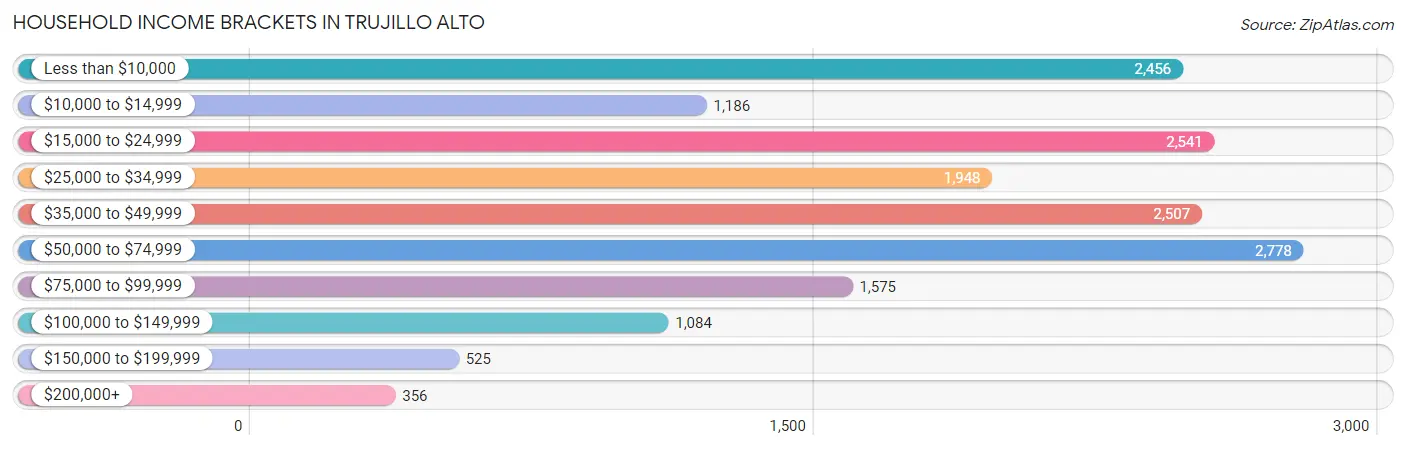
Household Income Brackets in Trujillo Alto
With 2,778 households falling in the category, the $50,000 to $74,999 income range is the most frequent in Trujillo Alto, accounting for 16.4% of all households. In contrast, only 356 households (2.1%) fall into the $200,000+ income bracket, making it the least populous group.
| Income Bracket | # Households | % Households |
| Less than $10,000 | 2,456 | 14.5% |
| $10,000 to $14,999 | 1,186 | 7.0% |
| $15,000 to $24,999 | 2,541 | 15.0% |
| $25,000 to $34,999 | 1,948 | 11.5% |
| $35,000 to $49,999 | 2,507 | 14.8% |
| $50,000 to $74,999 | 2,778 | 16.4% |
| $75,000 to $99,999 | 1,575 | 9.3% |
| $100,000 to $149,999 | 1,084 | 6.4% |
| $150,000 to $199,999 | 525 | 3.1% |
| $200,000+ | 356 | 2.1% |
Household Income by Householder Age in Trujillo Alto
The median household income in Trujillo Alto is $36,706, with the highest median household income of $47,638 found in the 45 to 64 years age bracket for the primary householder. A total of 6,504 households (38.4%) fall into this category. Meanwhile, the 15 to 24 years age bracket for the primary householder has the lowest median household income of $0, with 80 households (0.5%) in this group.
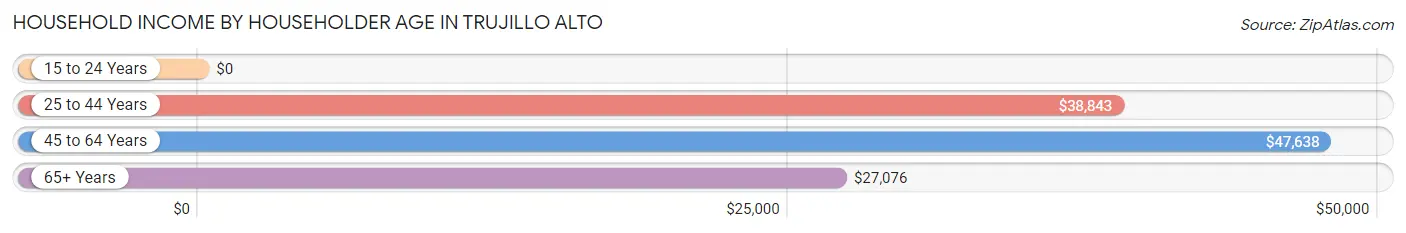
| Income Bracket | # Households | Median Income |
| 15 to 24 Years | 80 (0.5%) | $0 |
| 25 to 44 Years | 4,339 (25.6%) | $38,843 |
| 45 to 64 Years | 6,504 (38.4%) | $47,638 |
| 65+ Years | 6,017 (35.5%) | $27,076 |
| Total | 16,940 (100.0%) | $36,706 |
Poverty in Trujillo Alto
Income Below Poverty by Sex and Age in Trujillo Alto
With 23.9% poverty level for males and 31.1% for females among the residents of Trujillo Alto, 15 year old males and under 5 year old females are the most vulnerable to poverty, with 133 males (64.6%) and 332 females (53.9%) in their respective age groups living below the poverty level.
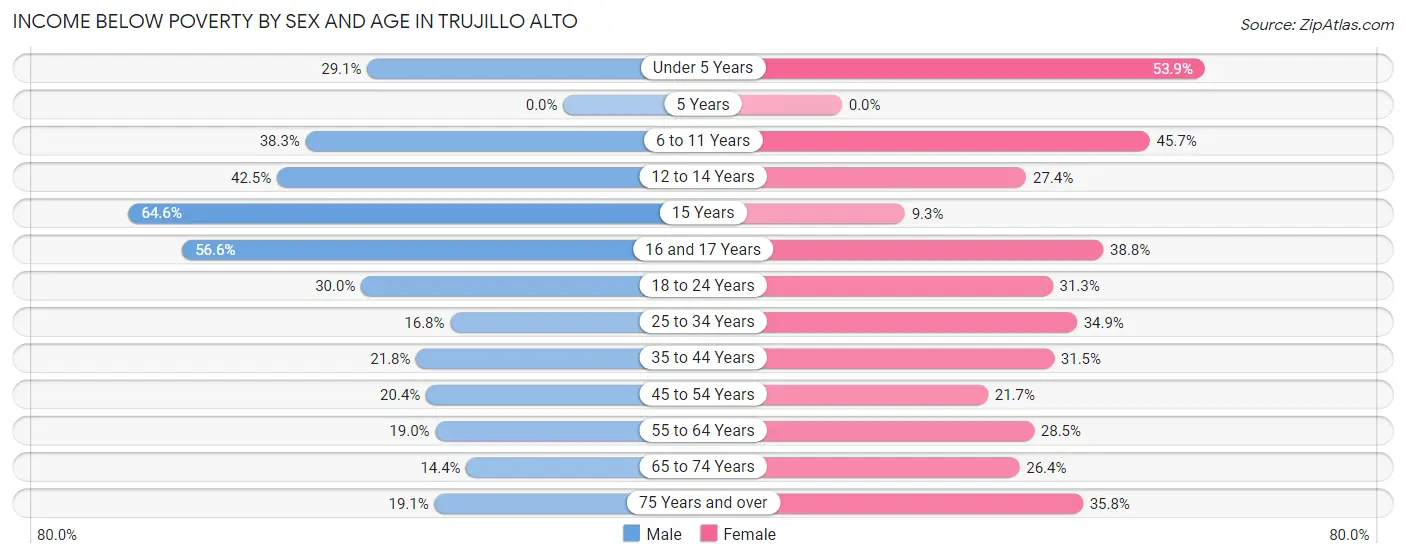
| Age Bracket | Male | Female |
| Under 5 Years | 161 (29.1%) | 332 (53.9%) |
| 5 Years | 0 (0.0%) | 0 (0.0%) |
| 6 to 11 Years | 637 (38.3%) | 558 (45.7%) |
| 12 to 14 Years | 193 (42.5%) | 209 (27.4%) |
| 15 Years | 133 (64.6%) | 17 (9.3%) |
| 16 and 17 Years | 309 (56.6%) | 175 (38.8%) |
| 18 to 24 Years | 672 (30.0%) | 612 (31.3%) |
| 25 to 34 Years | 489 (16.8%) | 1,091 (34.9%) |
| 35 to 44 Years | 526 (21.8%) | 900 (31.5%) |
| 45 to 54 Years | 525 (20.4%) | 672 (21.7%) |
| 55 to 64 Years | 460 (19.0%) | 975 (28.5%) |
| 65 to 74 Years | 290 (14.4%) | 778 (26.4%) |
| 75 Years and over | 312 (19.1%) | 953 (35.8%) |
| Total | 4,707 (23.9%) | 7,272 (31.1%) |
Income Above Poverty by Sex and Age in Trujillo Alto
According to the poverty statistics in Trujillo Alto, males aged 5 years and females aged 5 years are the age groups that are most secure financially, with 100.0% of males and 100.0% of females in these age groups living above the poverty line.
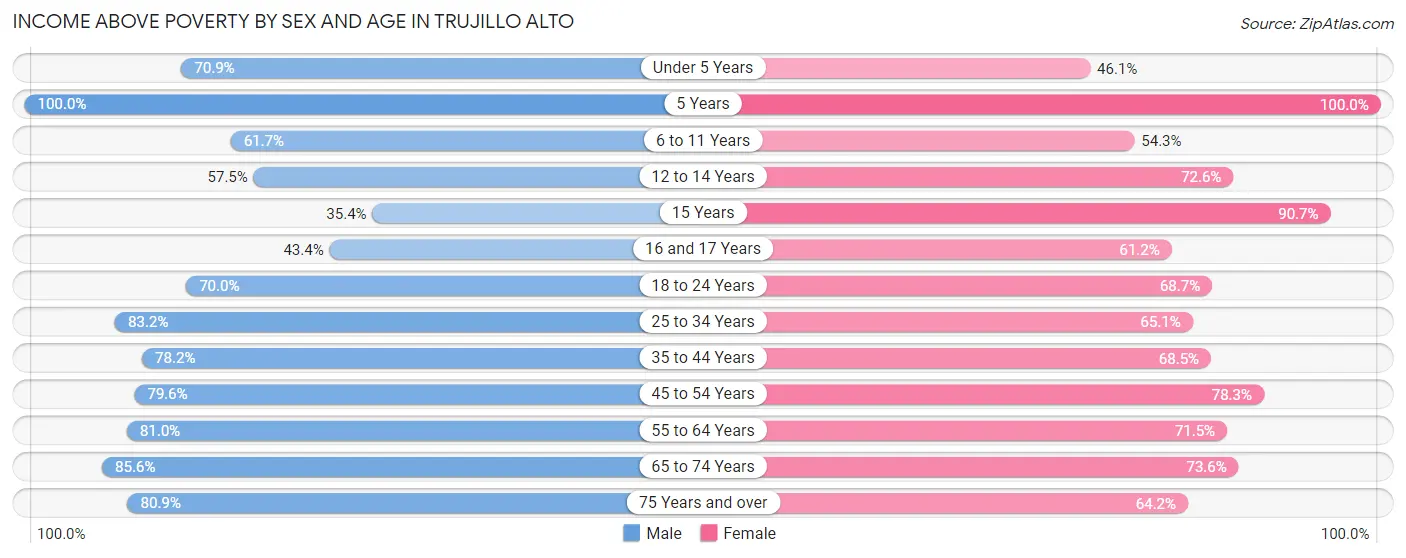
| Age Bracket | Male | Female |
| Under 5 Years | 392 (70.9%) | 284 (46.1%) |
| 5 Years | 83 (100.0%) | 44 (100.0%) |
| 6 to 11 Years | 1,028 (61.7%) | 663 (54.3%) |
| 12 to 14 Years | 261 (57.5%) | 555 (72.6%) |
| 15 Years | 73 (35.4%) | 165 (90.7%) |
| 16 and 17 Years | 237 (43.4%) | 276 (61.2%) |
| 18 to 24 Years | 1,567 (70.0%) | 1,344 (68.7%) |
| 25 to 34 Years | 2,426 (83.2%) | 2,037 (65.1%) |
| 35 to 44 Years | 1,883 (78.2%) | 1,958 (68.5%) |
| 45 to 54 Years | 2,052 (79.6%) | 2,428 (78.3%) |
| 55 to 64 Years | 1,961 (81.0%) | 2,444 (71.5%) |
| 65 to 74 Years | 1,725 (85.6%) | 2,173 (73.6%) |
| 75 Years and over | 1,319 (80.9%) | 1,711 (64.2%) |
| Total | 15,007 (76.1%) | 16,082 (68.9%) |
Income Below Poverty Among Married-Couple Families in Trujillo Alto
The poverty statistics for married-couple families in Trujillo Alto show that 9.2% or 607 of the total 6,595 families live below the poverty line. Families with 1 or 2 children have the highest poverty rate of 14.7%, comprising of 221 families. On the other hand, families with 3 or 4 children have the lowest poverty rate of 0.0%, which includes 0 families.
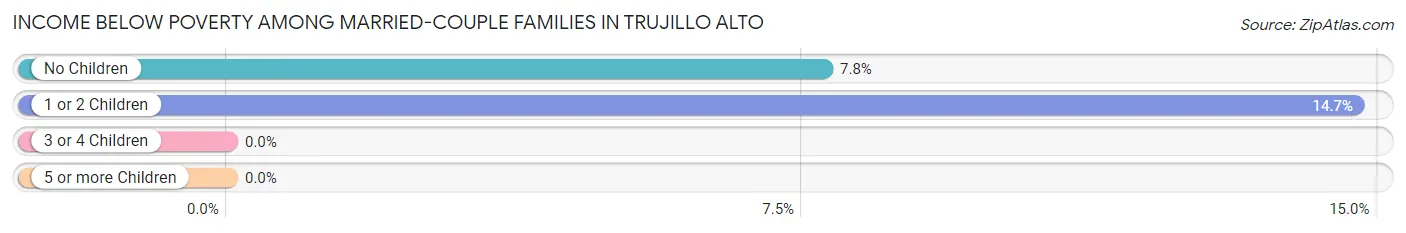
| Children | Above Poverty | Below Poverty |
| No Children | 4,583 (92.2%) | 386 (7.8%) |
| 1 or 2 Children | 1,281 (85.3%) | 221 (14.7%) |
| 3 or 4 Children | 109 (100.0%) | 0 (0.0%) |
| 5 or more Children | 15 (100.0%) | 0 (0.0%) |
| Total | 5,988 (90.8%) | 607 (9.2%) |
Income Below Poverty Among Single-Parent Households in Trujillo Alto
According to the poverty data in Trujillo Alto, 34.0% or 388 single-father households and 52.9% or 2,044 single-mother households are living below the poverty line. Among single-father households, those with 3 or 4 children have the highest poverty rate, with 75 households (70.1%) experiencing poverty. Likewise, among single-mother households, those with 3 or 4 children have the highest poverty rate, with 87 households (72.5%) falling below the poverty line.
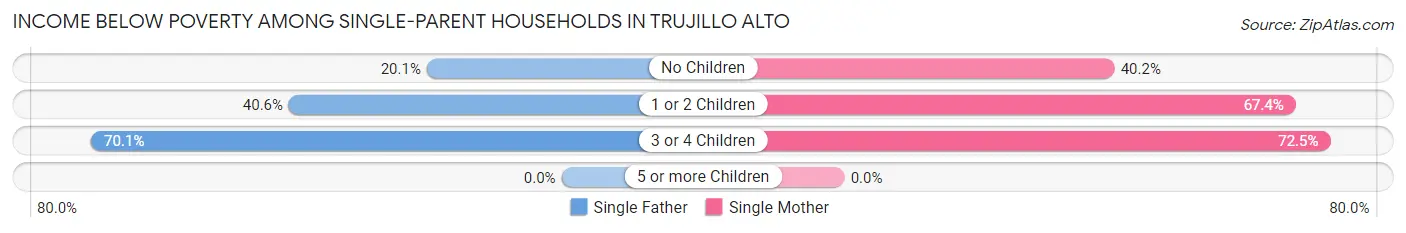
| Children | Single Father | Single Mother |
| No Children | 105 (20.1%) | 841 (40.2%) |
| 1 or 2 Children | 208 (40.6%) | 1,116 (67.3%) |
| 3 or 4 Children | 75 (70.1%) | 87 (72.5%) |
| 5 or more Children | 0 (0.0%) | 0 (0.0%) |
| Total | 388 (34.0%) | 2,044 (52.9%) |
Income Below Poverty Among Married-Couple vs Single-Parent Households in Trujillo Alto
The poverty data for Trujillo Alto shows that 607 of the married-couple family households (9.2%) and 2,432 of the single-parent households (48.5%) are living below the poverty level. Within the married-couple family households, those with 1 or 2 children have the highest poverty rate, with 221 households (14.7%) falling below the poverty line. Among the single-parent households, those with 3 or 4 children have the highest poverty rate, with 162 household (71.4%) living below poverty.
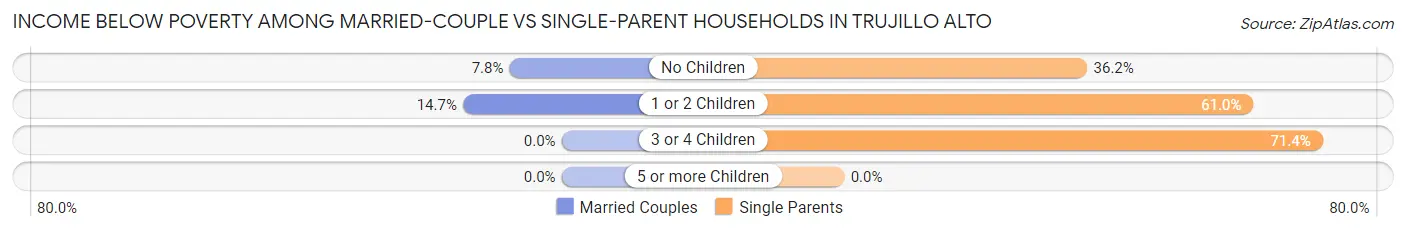
| Children | Married-Couple Families | Single-Parent Households |
| No Children | 386 (7.8%) | 946 (36.2%) |
| 1 or 2 Children | 221 (14.7%) | 1,324 (61.0%) |
| 3 or 4 Children | 0 (0.0%) | 162 (71.4%) |
| 5 or more Children | 0 (0.0%) | 0 (0.0%) |
| Total | 607 (9.2%) | 2,432 (48.5%) |
Race in Trujillo Alto
The most populous races in Trujillo Alto are Hispanic or Latino (42,896 | 99.3%), White / Caucasian (22,765 | 52.7%), and Two or more Races (9,091 | 21.0%).
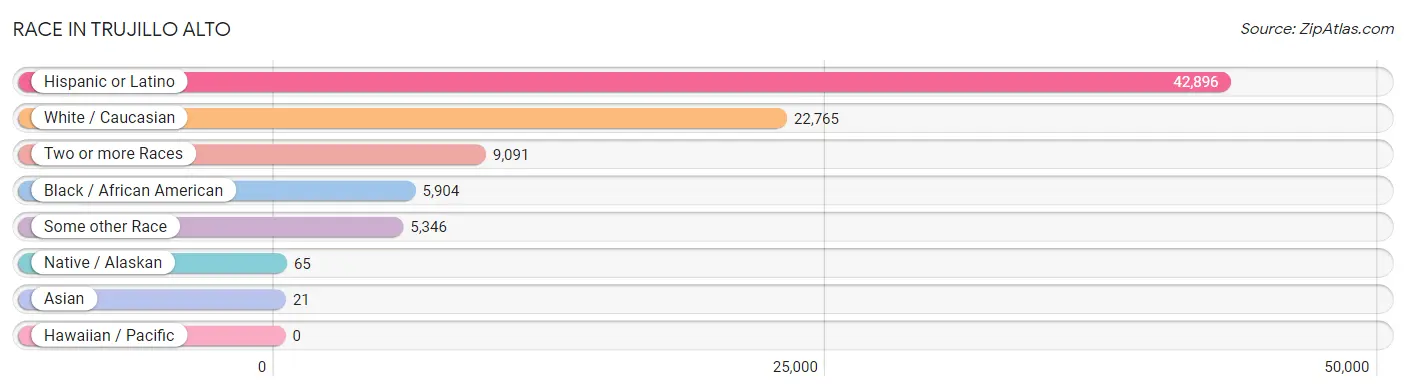
| Race | # Population | % Population |
| Asian | 21 | 0.1% |
| Black / African American | 5,904 | 13.7% |
| Hawaiian / Pacific | 0 | 0.0% |
| Hispanic or Latino | 42,896 | 99.3% |
| Native / Alaskan | 65 | 0.2% |
| White / Caucasian | 22,765 | 52.7% |
| Two or more Races | 9,091 | 21.0% |
| Some other Race | 5,346 | 12.4% |
| Total | 43,192 | 100.0% |
Ancestry in Trujillo Alto
The most populous ancestries reported in Trujillo Alto are Puerto Rican (41,478 | 96.0%), Dominican (662 | 1.5%), American (649 | 1.5%), South American (264 | 0.6%), and Cuban (247 | 0.6%), together accounting for 100.2% of all Trujillo Alto residents.
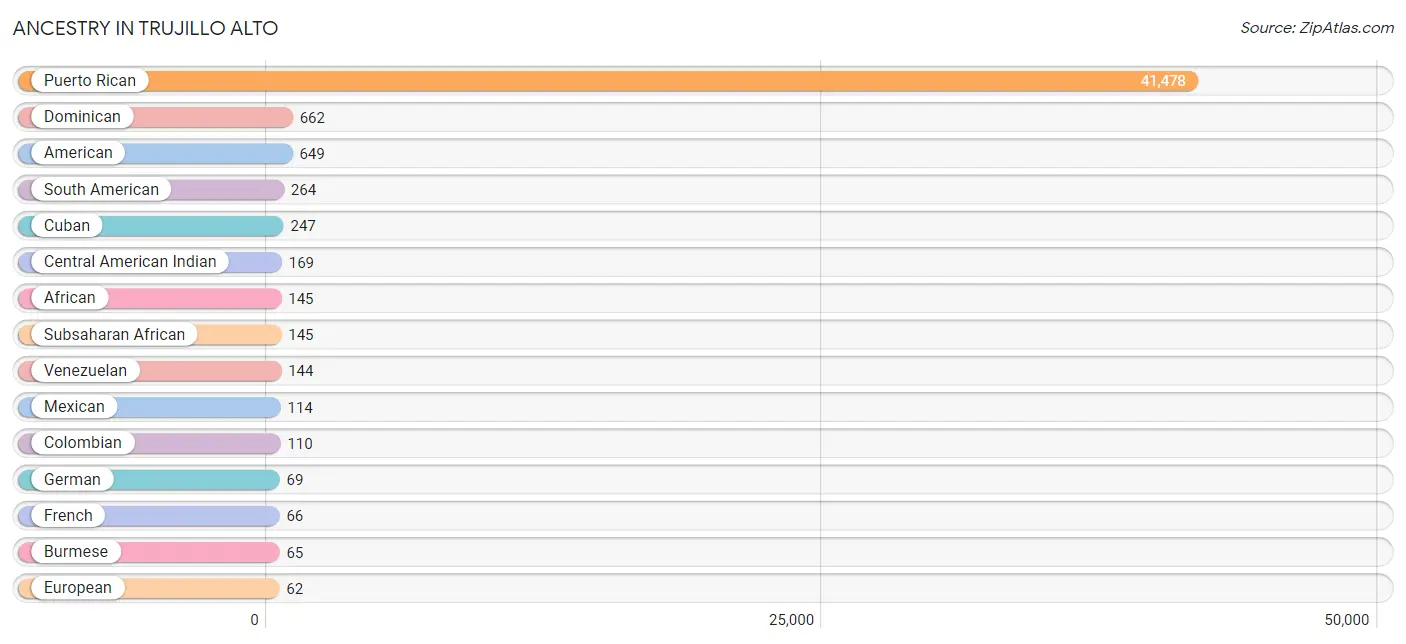
| Ancestry | # Population | % Population |
| African | 145 | 0.3% |
| American | 649 | 1.5% |
| Burmese | 65 | 0.2% |
| Central American | 18 | 0.0% |
| Central American Indian | 169 | 0.4% |
| Chilean | 10 | 0.0% |
| Colombian | 110 | 0.3% |
| Costa Rican | 18 | 0.0% |
| Cuban | 247 | 0.6% |
| Dominican | 662 | 1.5% |
| Dutch | 28 | 0.1% |
| European | 62 | 0.1% |
| French | 66 | 0.2% |
| German | 69 | 0.2% |
| Irish | 60 | 0.1% |
| Italian | 24 | 0.1% |
| Mexican | 114 | 0.3% |
| Portuguese | 13 | 0.0% |
| Puerto Rican | 41,478 | 96.0% |
| South American | 264 | 0.6% |
| Spaniard | 54 | 0.1% |
| Subsaharan African | 145 | 0.3% |
| Thai | 27 | 0.1% |
| Venezuelan | 144 | 0.3% |
| West Indian | 34 | 0.1% | View All 25 Rows |
Immigrants in Trujillo Alto

| Immigration Origin | # Population | % Population | View All 0 Rows |
Sex and Age in Trujillo Alto
Sex and Age in Trujillo Alto
The most populous age groups in Trujillo Alto are 20 to 24 Years (1,606 | 8.1%) for men and 55 to 59 Years (1,872 | 8.0%) for women.
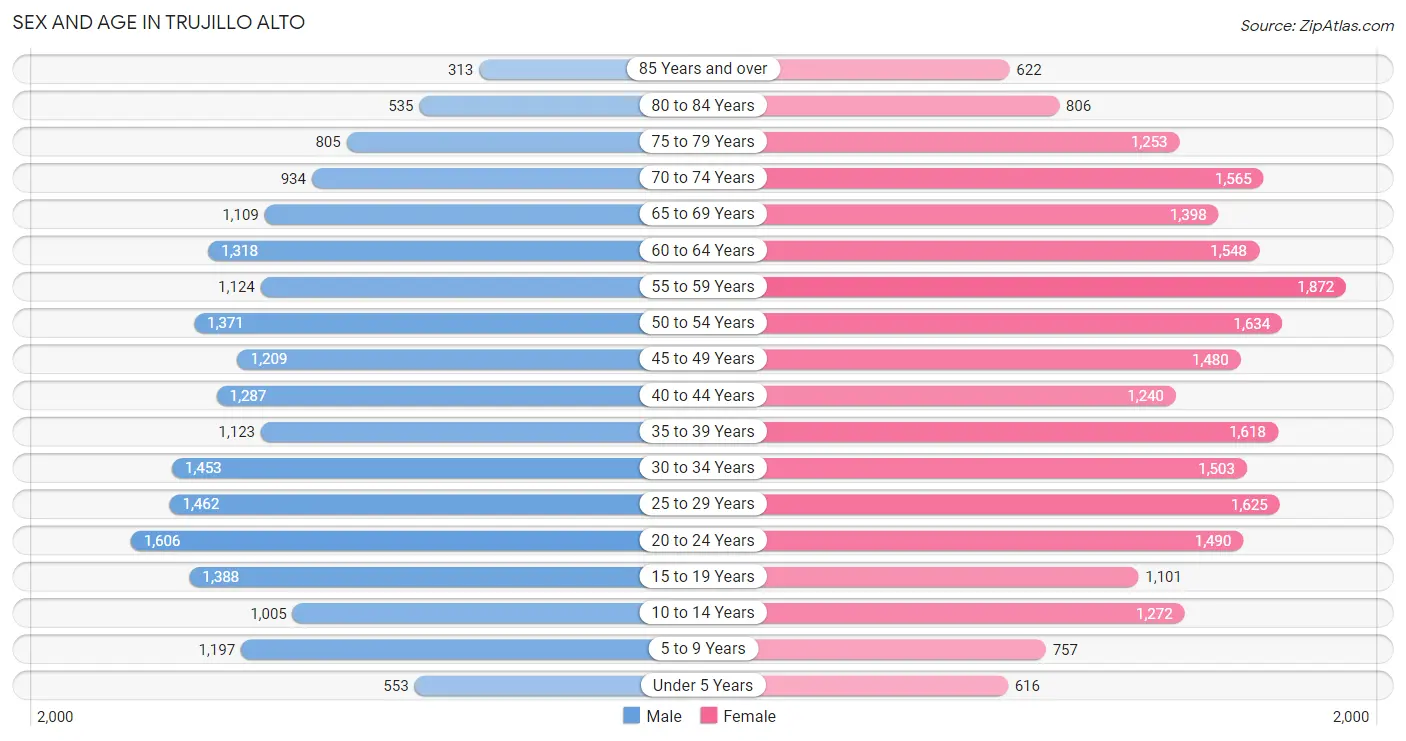
| Age Bracket | Male | Female |
| Under 5 Years | 553 (2.8%) | 616 (2.6%) |
| 5 to 9 Years | 1,197 (6.0%) | 757 (3.2%) |
| 10 to 14 Years | 1,005 (5.1%) | 1,272 (5.4%) |
| 15 to 19 Years | 1,388 (7.0%) | 1,101 (4.7%) |
| 20 to 24 Years | 1,606 (8.1%) | 1,490 (6.4%) |
| 25 to 29 Years | 1,462 (7.4%) | 1,625 (6.9%) |
| 30 to 34 Years | 1,453 (7.3%) | 1,503 (6.4%) |
| 35 to 39 Years | 1,123 (5.7%) | 1,618 (6.9%) |
| 40 to 44 Years | 1,287 (6.5%) | 1,240 (5.3%) |
| 45 to 49 Years | 1,209 (6.1%) | 1,480 (6.3%) |
| 50 to 54 Years | 1,371 (6.9%) | 1,634 (7.0%) |
| 55 to 59 Years | 1,124 (5.7%) | 1,872 (8.0%) |
| 60 to 64 Years | 1,318 (6.7%) | 1,548 (6.6%) |
| 65 to 69 Years | 1,109 (5.6%) | 1,398 (6.0%) |
| 70 to 74 Years | 934 (4.7%) | 1,565 (6.7%) |
| 75 to 79 Years | 805 (4.1%) | 1,253 (5.3%) |
| 80 to 84 Years | 535 (2.7%) | 806 (3.4%) |
| 85 Years and over | 313 (1.6%) | 622 (2.7%) |
| Total | 19,792 (100.0%) | 23,400 (100.0%) |
Families and Households in Trujillo Alto
Median Family Size in Trujillo Alto
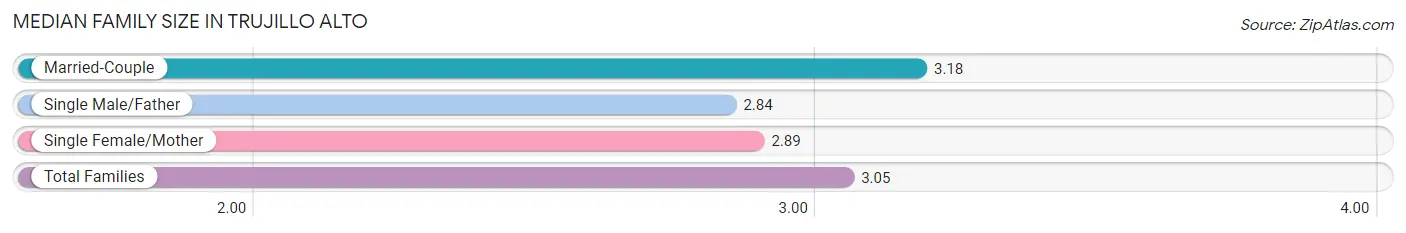
The median family size in Trujillo Alto is 3.05 persons per family, with married-couple families (6,595 | 56.8%) accounting for the largest median family size of 3.18 persons per family. On the other hand, single male/father families (1,142 | 9.8%) represent the smallest median family size with 2.84 persons per family.
| Family Type | # Families | Family Size |
| Married-Couple | 6,595 (56.8%) | 3.18 |
| Single Male/Father | 1,142 (9.8%) | 2.84 |
| Single Female/Mother | 3,867 (33.3%) | 2.89 |
| Total Families | 11,604 (100.0%) | 3.05 |
Median Household Size in Trujillo Alto
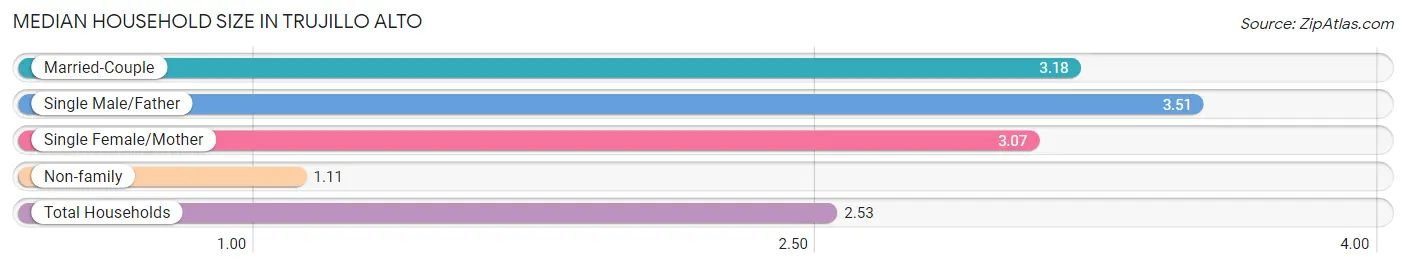
The median household size in Trujillo Alto is 2.53 persons per household, with single male/father households (1,142 | 6.7%) accounting for the largest median household size of 3.51 persons per household. non-family households (5,336 | 31.5%) represent the smallest median household size with 1.11 persons per household.
| Household Type | # Households | Household Size |
| Married-Couple | 6,595 (38.9%) | 3.18 |
| Single Male/Father | 1,142 (6.7%) | 3.51 |
| Single Female/Mother | 3,867 (22.8%) | 3.07 |
| Non-family | 5,336 (31.5%) | 1.11 |
| Total Households | 16,940 (100.0%) | 2.53 |
Household Size by Marriage Status in Trujillo Alto
Out of a total of 16,940 households in Trujillo Alto, 11,604 (68.5%) are family households, while 5,336 (31.5%) are nonfamily households. The most numerous type of family households are 2-person households, comprising 4,811, and the most common type of nonfamily households are 1-person households, comprising 4,738.
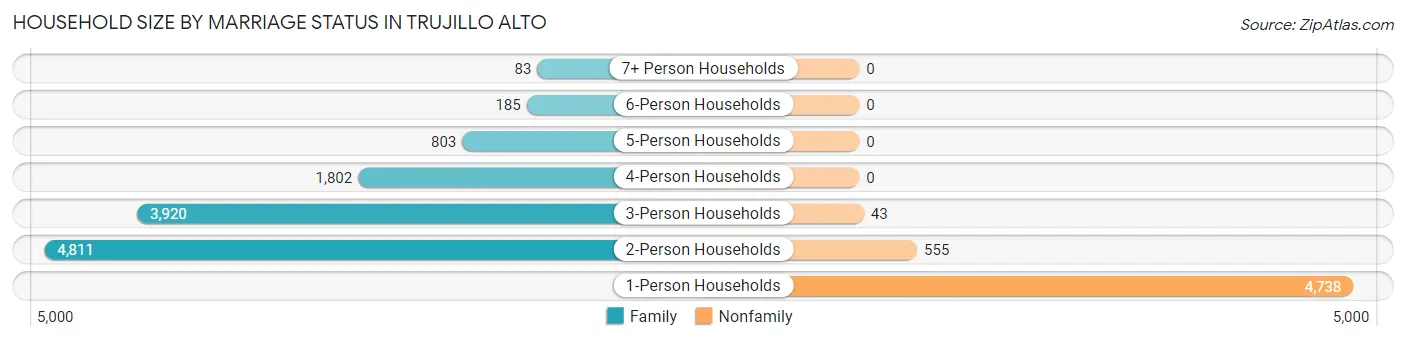
| Household Size | Family Households | Nonfamily Households |
| 1-Person Households | - | 4,738 (28.0%) |
| 2-Person Households | 4,811 (28.4%) | 555 (3.3%) |
| 3-Person Households | 3,920 (23.1%) | 43 (0.3%) |
| 4-Person Households | 1,802 (10.6%) | 0 (0.0%) |
| 5-Person Households | 803 (4.7%) | 0 (0.0%) |
| 6-Person Households | 185 (1.1%) | 0 (0.0%) |
| 7+ Person Households | 83 (0.5%) | 0 (0.0%) |
| Total | 11,604 (68.5%) | 5,336 (31.5%) |
Female Fertility in Trujillo Alto
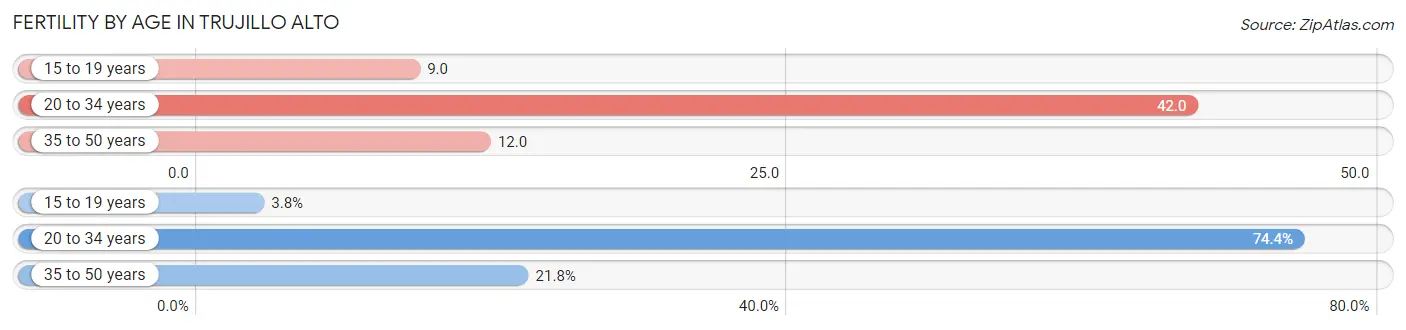
Fertility by Age in Trujillo Alto
Average fertility rate in Trujillo Alto is 25.0 births per 1,000 women. Women in the age bracket of 20 to 34 years have the highest fertility rate with 42.0 births per 1,000 women. Women in the age bracket of 20 to 34 years acount for 74.4% of all women with births.
| Age Bracket | Women with Births | Births / 1,000 Women |
| 15 to 19 years | 10 (3.8%) | 9.0 |
| 20 to 34 years | 195 (74.4%) | 42.0 |
| 35 to 50 years | 57 (21.8%) | 12.0 |
| Total | 262 (100.0%) | 25.0 |
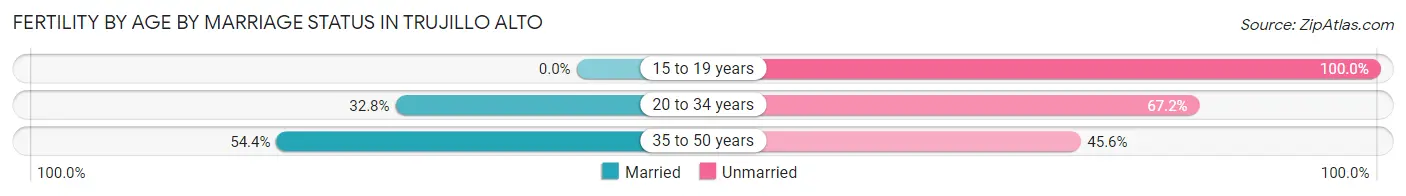
Fertility by Age by Marriage Status in Trujillo Alto
36.3% of women with births (262) in Trujillo Alto are married. The highest percentage of unmarried women with births falls into 15 to 19 years age bracket with 100.0% of them unmarried at the time of birth, while the lowest percentage of unmarried women with births belong to 35 to 50 years age bracket with 45.6% of them unmarried.
| Age Bracket | Married | Unmarried |
| 15 to 19 years | 0 (0.0%) | 10 (100.0%) |
| 20 to 34 years | 64 (32.8%) | 131 (67.2%) |
| 35 to 50 years | 31 (54.4%) | 26 (45.6%) |
| Total | 95 (36.3%) | 167 (63.7%) |
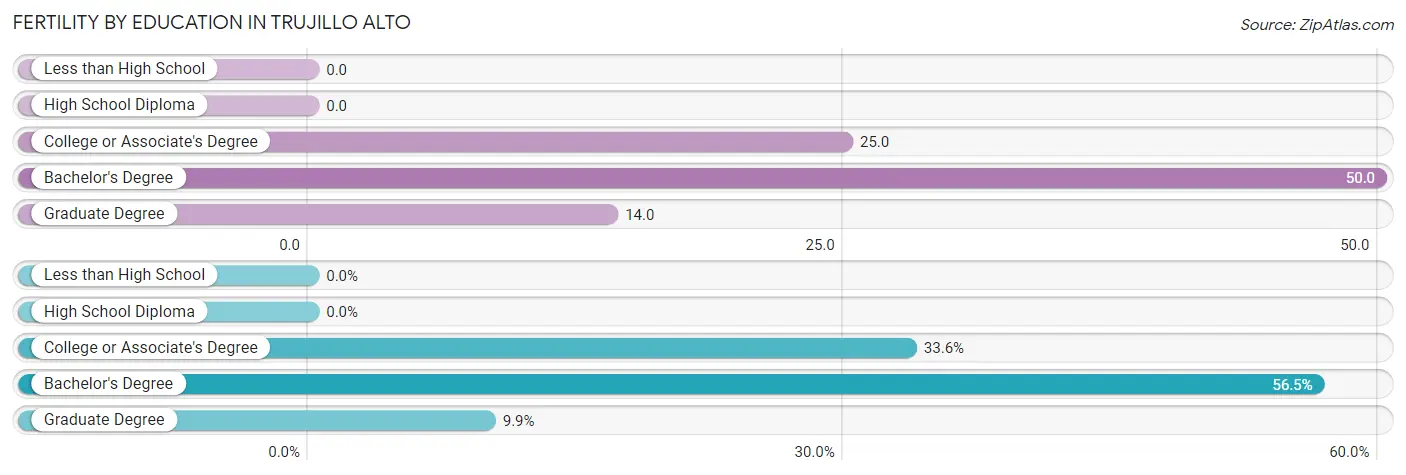
Fertility by Education in Trujillo Alto
| Educational Attainment | Women with Births | Births / 1,000 Women |
| Less than High School | 0 (0.0%) | 0.0 |
| High School Diploma | 0 (0.0%) | 0.0 |
| College or Associate's Degree | 88 (33.6%) | 25.0 |
| Bachelor's Degree | 148 (56.5%) | 50.0 |
| Graduate Degree | 26 (9.9%) | 14.0 |
| Total | 262 (100.0%) | 25.0 |
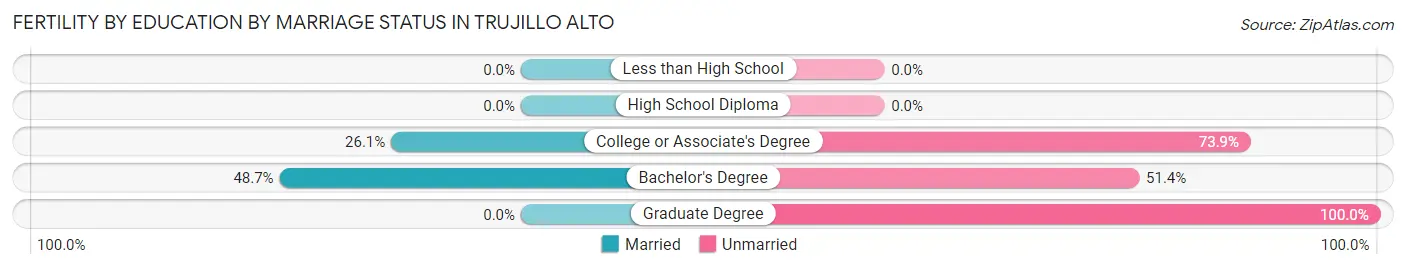
Fertility by Education by Marriage Status in Trujillo Alto
63.7% of women with births in Trujillo Alto are unmarried. Women with the educational attainment of bachelor's degree are most likely to be married with 48.6% of them married at childbirth, while women with the educational attainment of graduate degree are least likely to be married with 100.0% of them unmarried at childbirth.
| Educational Attainment | Married | Unmarried |
| Less than High School | 0 (0.0%) | 0 (0.0%) |
| High School Diploma | 0 (0.0%) | 0 (0.0%) |
| College or Associate's Degree | 23 (26.1%) | 65 (73.9%) |
| Bachelor's Degree | 72 (48.6%) | 76 (51.3%) |
| Graduate Degree | 0 (0.0%) | 26 (100.0%) |
| Total | 95 (36.3%) | 167 (63.7%) |
Employment Characteristics in Trujillo Alto
Employment by Class of Employer in Trujillo Alto
Among the 17,737 employed individuals in Trujillo Alto, private company employees (10,390 | 58.6%), state government employees (2,276 | 12.8%), and self-employed (not incorporated) (1,604 | 9.0%) make up the most common classes of employment.
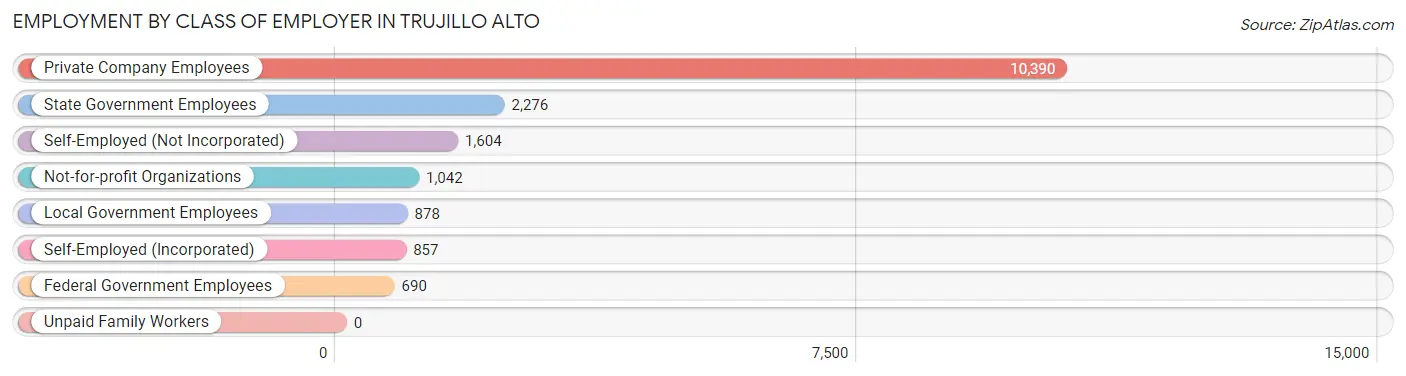
| Employer Class | # Employees | % Employees |
| Private Company Employees | 10,390 | 58.6% |
| Self-Employed (Incorporated) | 857 | 4.8% |
| Self-Employed (Not Incorporated) | 1,604 | 9.0% |
| Not-for-profit Organizations | 1,042 | 5.9% |
| Local Government Employees | 878 | 5.0% |
| State Government Employees | 2,276 | 12.8% |
| Federal Government Employees | 690 | 3.9% |
| Unpaid Family Workers | 0 | 0.0% |
| Total | 17,737 | 100.0% |
Employment Status by Age in Trujillo Alto
According to the labor force statistics for Trujillo Alto, out of the total population over 16 years of age (37,404), 52.7% or 19,712 individuals are in the labor force, with 7.7% or 1,518 of them unemployed. The age group with the highest labor force participation rate is 35 to 44 years, with 84.2% or 4,436 individuals in the labor force. Within the labor force, the 25 to 29 years age range has the highest percentage of unemployed individuals, with 13.6% or 330 of them being unemployed.
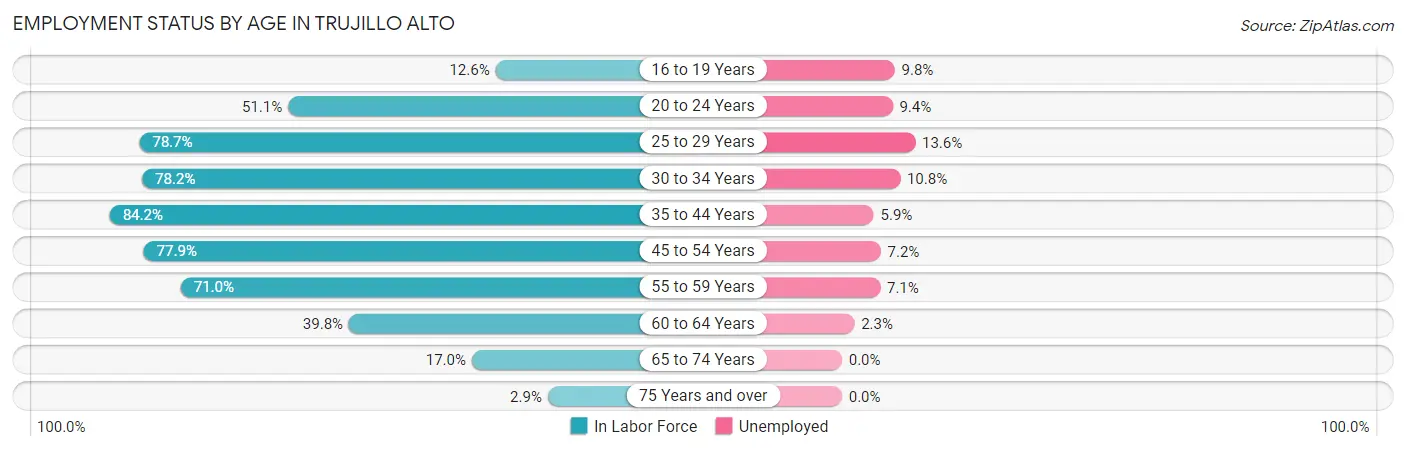
| Age Bracket | In Labor Force | Unemployed |
| 16 to 19 Years | 265 (12.6%) | 26 (9.8%) |
| 20 to 24 Years | 1,582 (51.1%) | 149 (9.4%) |
| 25 to 29 Years | 2,429 (78.7%) | 330 (13.6%) |
| 30 to 34 Years | 2,312 (78.2%) | 250 (10.8%) |
| 35 to 44 Years | 4,436 (84.2%) | 262 (5.9%) |
| 45 to 54 Years | 4,436 (77.9%) | 319 (7.2%) |
| 55 to 59 Years | 2,127 (71.0%) | 151 (7.1%) |
| 60 to 64 Years | 1,141 (39.8%) | 26 (2.3%) |
| 65 to 74 Years | 851 (17.0%) | 0 (0.0%) |
| 75 Years and over | 126 (2.9%) | 0 (0.0%) |
| Total | 19,712 (52.7%) | 1,518 (7.7%) |
Employment Status by Educational Attainment in Trujillo Alto
According to labor force statistics for Trujillo Alto, 73.8% of individuals (16,876) out of the total population between 25 and 64 years of age (22,867) are in the labor force, with 7.9% or 1,333 of them being unemployed. The group with the highest labor force participation rate are those with the educational attainment of bachelor's degree or higher, with 80.6% or 8,865 individuals in the labor force. Within the labor force, individuals with less than high school education have the highest percentage of unemployment, with 14.2% or 53 of them being unemployed.
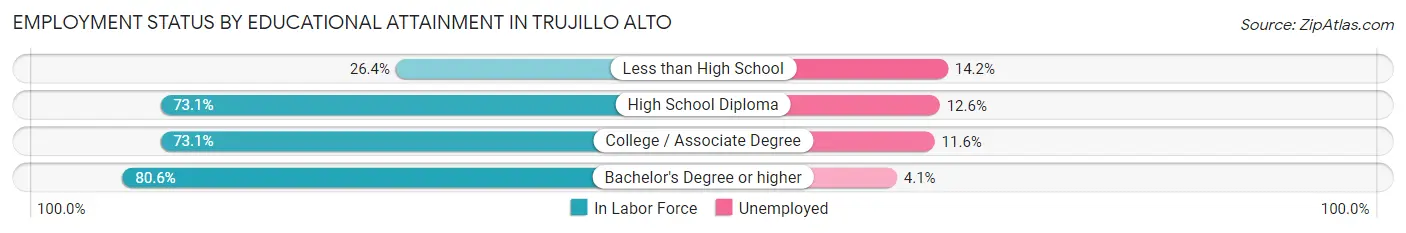
| Educational Attainment | In Labor Force | Unemployed |
| Less than High School | 372 (26.4%) | 200 (14.2%) |
| High School Diploma | 2,849 (73.1%) | 491 (12.6%) |
| College / Associate Degree | 4,795 (73.1%) | 761 (11.6%) |
| Bachelor's Degree or higher | 8,865 (80.6%) | 451 (4.1%) |
| Total | 16,876 (73.8%) | 1,806 (7.9%) |
Employment Occupations by Sex in Trujillo Alto
Management, Business, Science and Arts Occupations
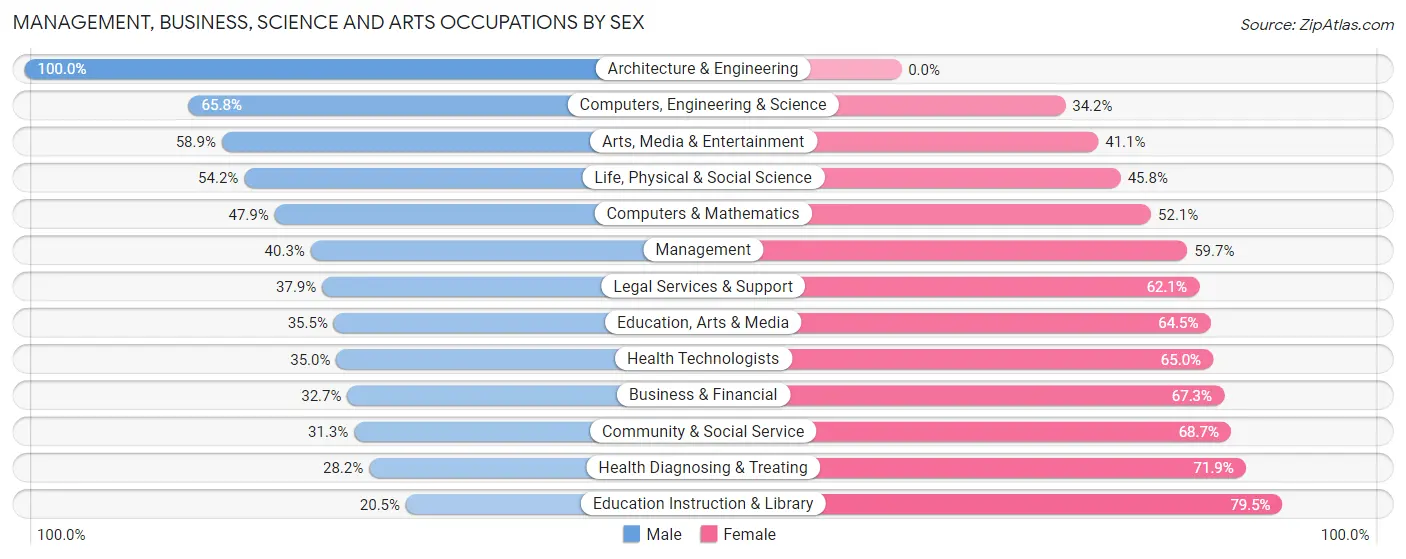
The most common Management, Business, Science and Arts occupations in Trujillo Alto are Community & Social Service (2,252 | 12.4%), Management (1,691 | 9.3%), Business & Financial (1,560 | 8.6%), Education Instruction & Library (1,202 | 6.6%), and Health Diagnosing & Treating (984 | 5.4%).
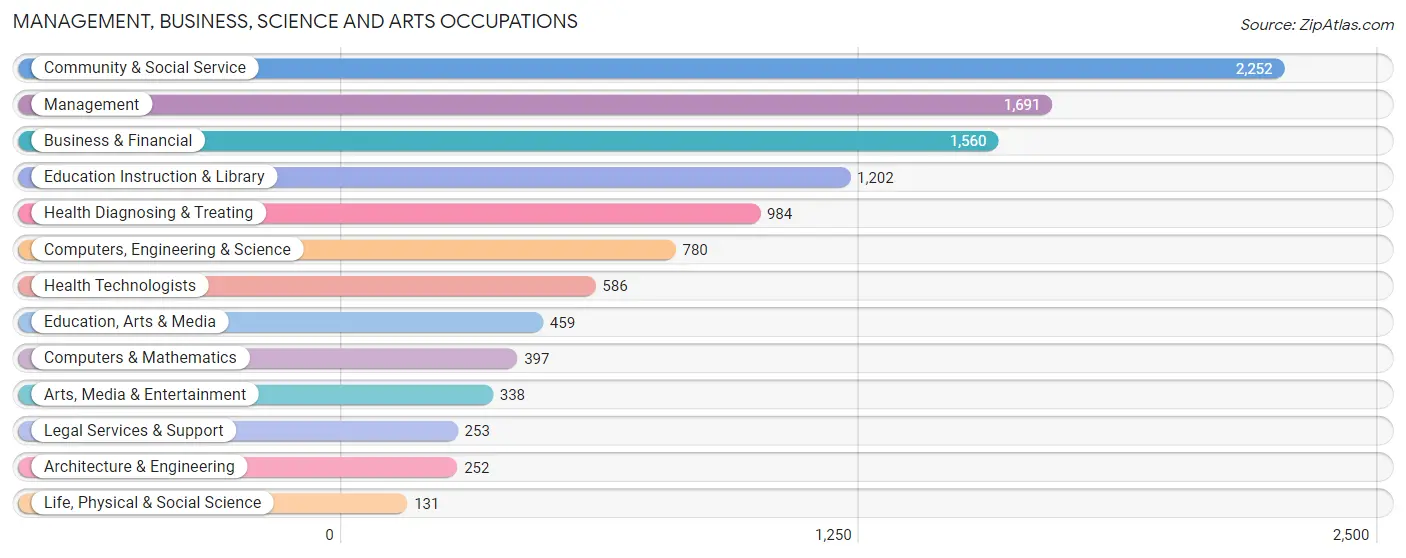
Management, Business, Science and Arts Occupations by Sex
Within the Management, Business, Science and Arts occupations in Trujillo Alto, the most male-oriented occupations are Architecture & Engineering (100.0%), Computers, Engineering & Science (65.8%), and Arts, Media & Entertainment (58.9%), while the most female-oriented occupations are Education Instruction & Library (79.5%), Health Diagnosing & Treating (71.9%), and Community & Social Service (68.7%).
| Occupation | Male | Female |
| Management | 682 (40.3%) | 1,009 (59.7%) |
| Business & Financial | 510 (32.7%) | 1,050 (67.3%) |
| Computers, Engineering & Science | 513 (65.8%) | 267 (34.2%) |
| Computers & Mathematics | 190 (47.9%) | 207 (52.1%) |
| Architecture & Engineering | 252 (100.0%) | 0 (0.0%) |
| Life, Physical & Social Science | 71 (54.2%) | 60 (45.8%) |
| Community & Social Service | 704 (31.3%) | 1,548 (68.7%) |
| Education, Arts & Media | 163 (35.5%) | 296 (64.5%) |
| Legal Services & Support | 96 (37.9%) | 157 (62.1%) |
| Education Instruction & Library | 246 (20.5%) | 956 (79.5%) |
| Arts, Media & Entertainment | 199 (58.9%) | 139 (41.1%) |
| Health Diagnosing & Treating | 277 (28.1%) | 707 (71.9%) |
| Health Technologists | 205 (35.0%) | 381 (65.0%) |
| Total (Category) | 2,686 (37.0%) | 4,581 (63.0%) |
| Total (Overall) | 8,748 (48.2%) | 9,413 (51.8%) |
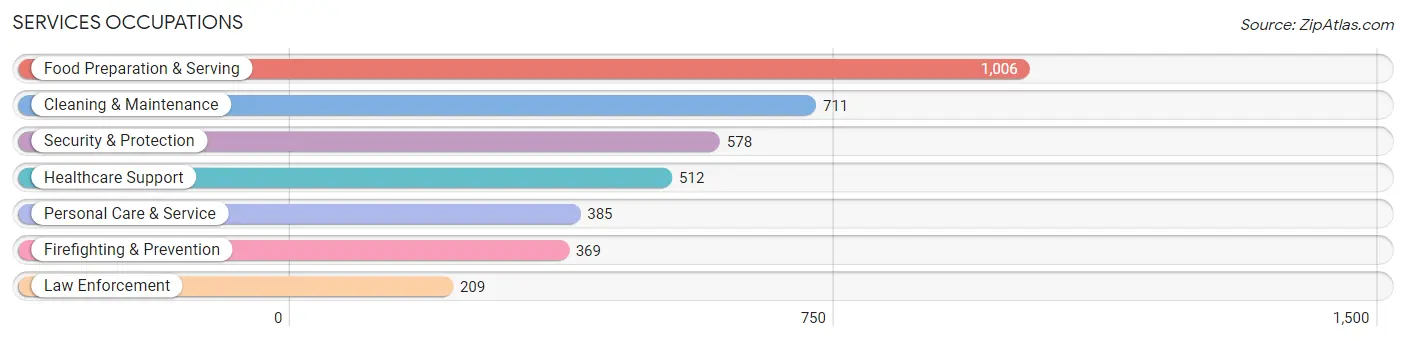
Services Occupations
The most common Services occupations in Trujillo Alto are Food Preparation & Serving (1,006 | 5.5%), Cleaning & Maintenance (711 | 3.9%), Security & Protection (578 | 3.2%), Healthcare Support (512 | 2.8%), and Personal Care & Service (385 | 2.1%).
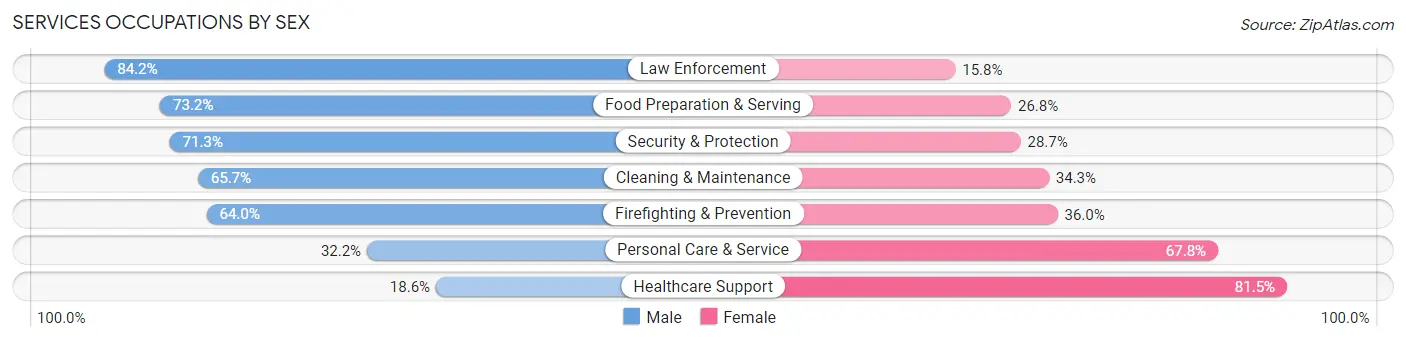
Services Occupations by Sex
Within the Services occupations in Trujillo Alto, the most male-oriented occupations are Law Enforcement (84.2%), Food Preparation & Serving (73.2%), and Security & Protection (71.3%), while the most female-oriented occupations are Healthcare Support (81.5%), Personal Care & Service (67.8%), and Firefighting & Prevention (36.0%).
| Occupation | Male | Female |
| Healthcare Support | 95 (18.5%) | 417 (81.5%) |
| Security & Protection | 412 (71.3%) | 166 (28.7%) |
| Firefighting & Prevention | 236 (64.0%) | 133 (36.0%) |
| Law Enforcement | 176 (84.2%) | 33 (15.8%) |
| Food Preparation & Serving | 736 (73.2%) | 270 (26.8%) |
| Cleaning & Maintenance | 467 (65.7%) | 244 (34.3%) |
| Personal Care & Service | 124 (32.2%) | 261 (67.8%) |
| Total (Category) | 1,834 (57.5%) | 1,358 (42.5%) |
| Total (Overall) | 8,748 (48.2%) | 9,413 (51.8%) |
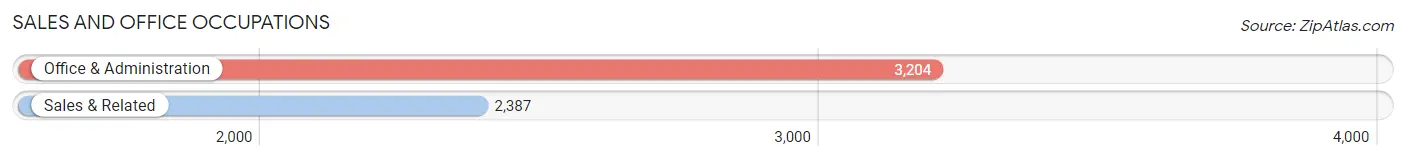
Sales and Office Occupations
The most common Sales and Office occupations in Trujillo Alto are Office & Administration (3,204 | 17.6%), and Sales & Related (2,387 | 13.1%).
Sales and Office Occupations by Sex
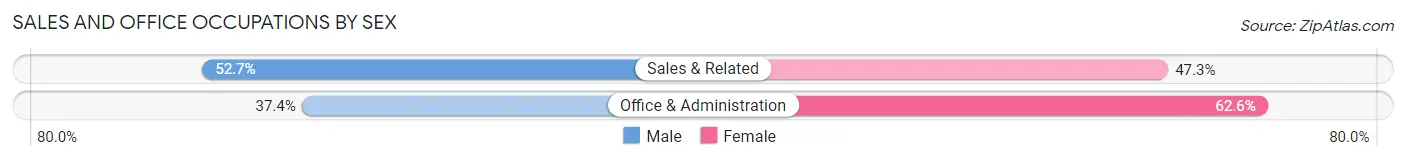
| Occupation | Male | Female |
| Sales & Related | 1,257 (52.7%) | 1,130 (47.3%) |
| Office & Administration | 1,198 (37.4%) | 2,006 (62.6%) |
| Total (Category) | 2,455 (43.9%) | 3,136 (56.1%) |
| Total (Overall) | 8,748 (48.2%) | 9,413 (51.8%) |
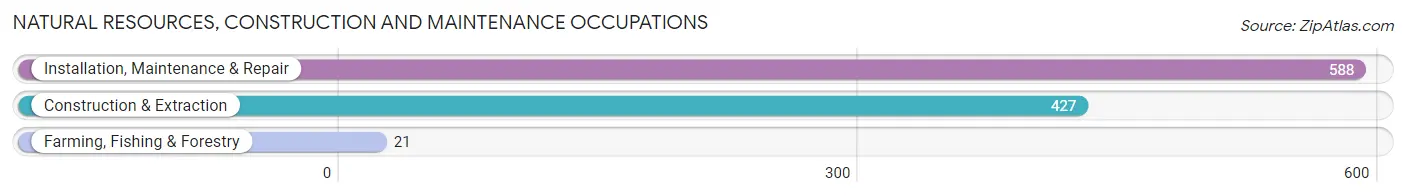
Natural Resources, Construction and Maintenance Occupations
The most common Natural Resources, Construction and Maintenance occupations in Trujillo Alto are Installation, Maintenance & Repair (588 | 3.2%), Construction & Extraction (427 | 2.4%), and Farming, Fishing & Forestry (21 | 0.1%).
Natural Resources, Construction and Maintenance Occupations by Sex
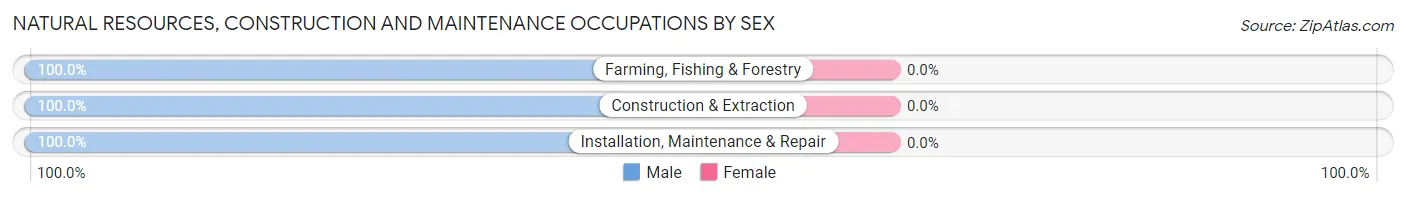
| Occupation | Male | Female |
| Farming, Fishing & Forestry | 21 (100.0%) | 0 (0.0%) |
| Construction & Extraction | 427 (100.0%) | 0 (0.0%) |
| Installation, Maintenance & Repair | 588 (100.0%) | 0 (0.0%) |
| Total (Category) | 1,036 (100.0%) | 0 (0.0%) |
| Total (Overall) | 8,748 (48.2%) | 9,413 (51.8%) |
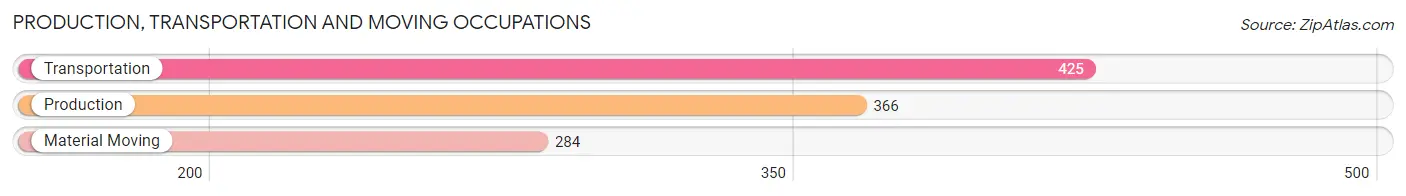
Production, Transportation and Moving Occupations
The most common Production, Transportation and Moving occupations in Trujillo Alto are Transportation (425 | 2.3%), Production (366 | 2.0%), and Material Moving (284 | 1.6%).
Production, Transportation and Moving Occupations by Sex
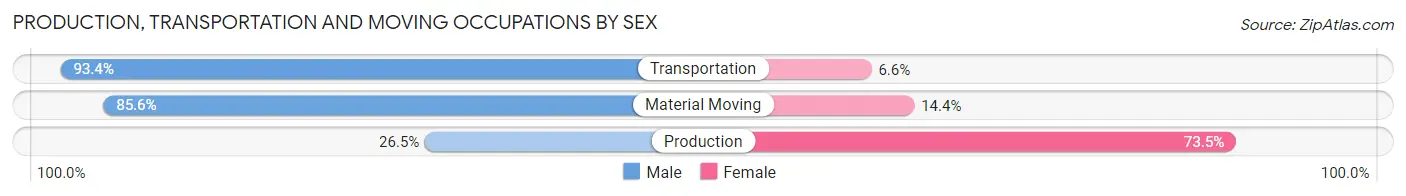
| Occupation | Male | Female |
| Production | 97 (26.5%) | 269 (73.5%) |
| Transportation | 397 (93.4%) | 28 (6.6%) |
| Material Moving | 243 (85.6%) | 41 (14.4%) |
| Total (Category) | 737 (68.6%) | 338 (31.4%) |
| Total (Overall) | 8,748 (48.2%) | 9,413 (51.8%) |
Employment Industries by Sex in Trujillo Alto
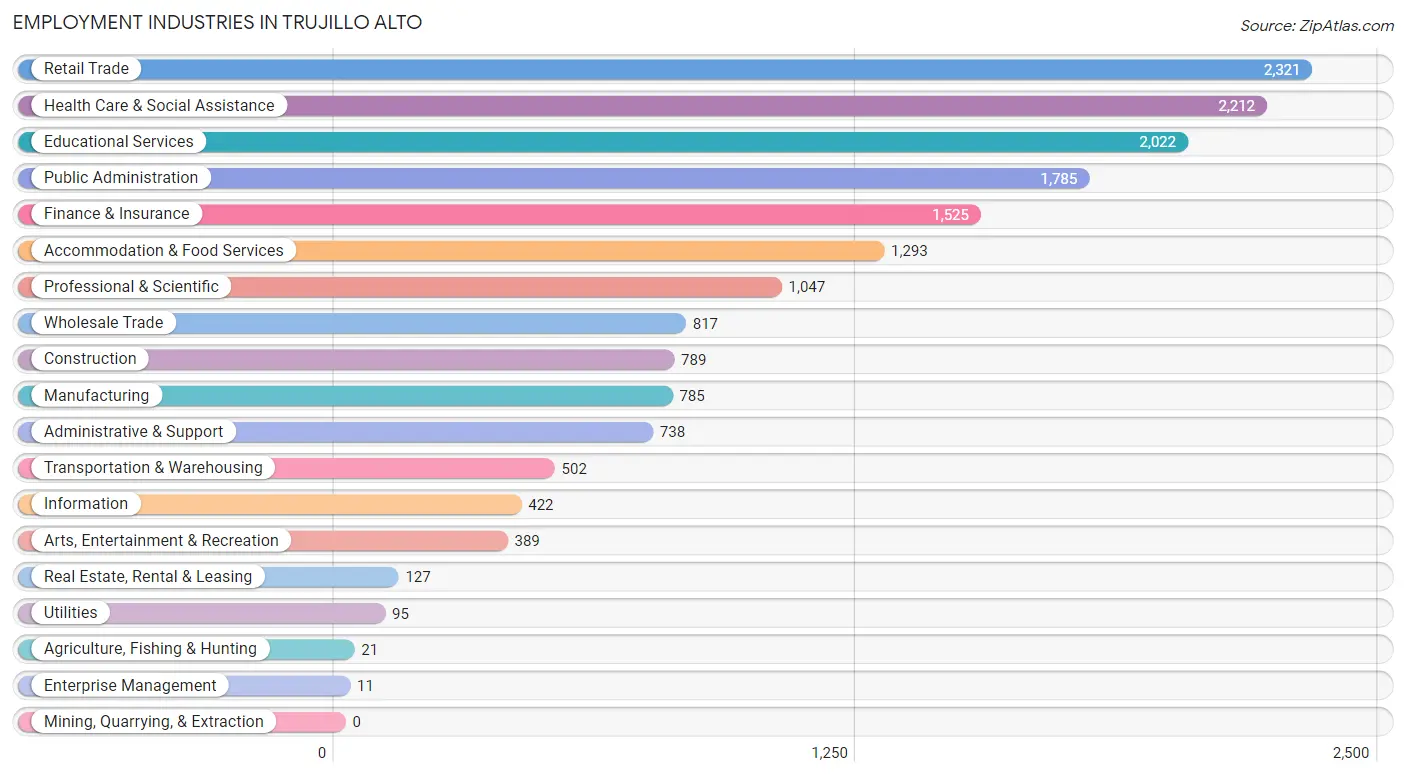
Employment Industries in Trujillo Alto
The major employment industries in Trujillo Alto include Retail Trade (2,321 | 12.8%), Health Care & Social Assistance (2,212 | 12.2%), Educational Services (2,022 | 11.1%), Public Administration (1,785 | 9.8%), and Finance & Insurance (1,525 | 8.4%).
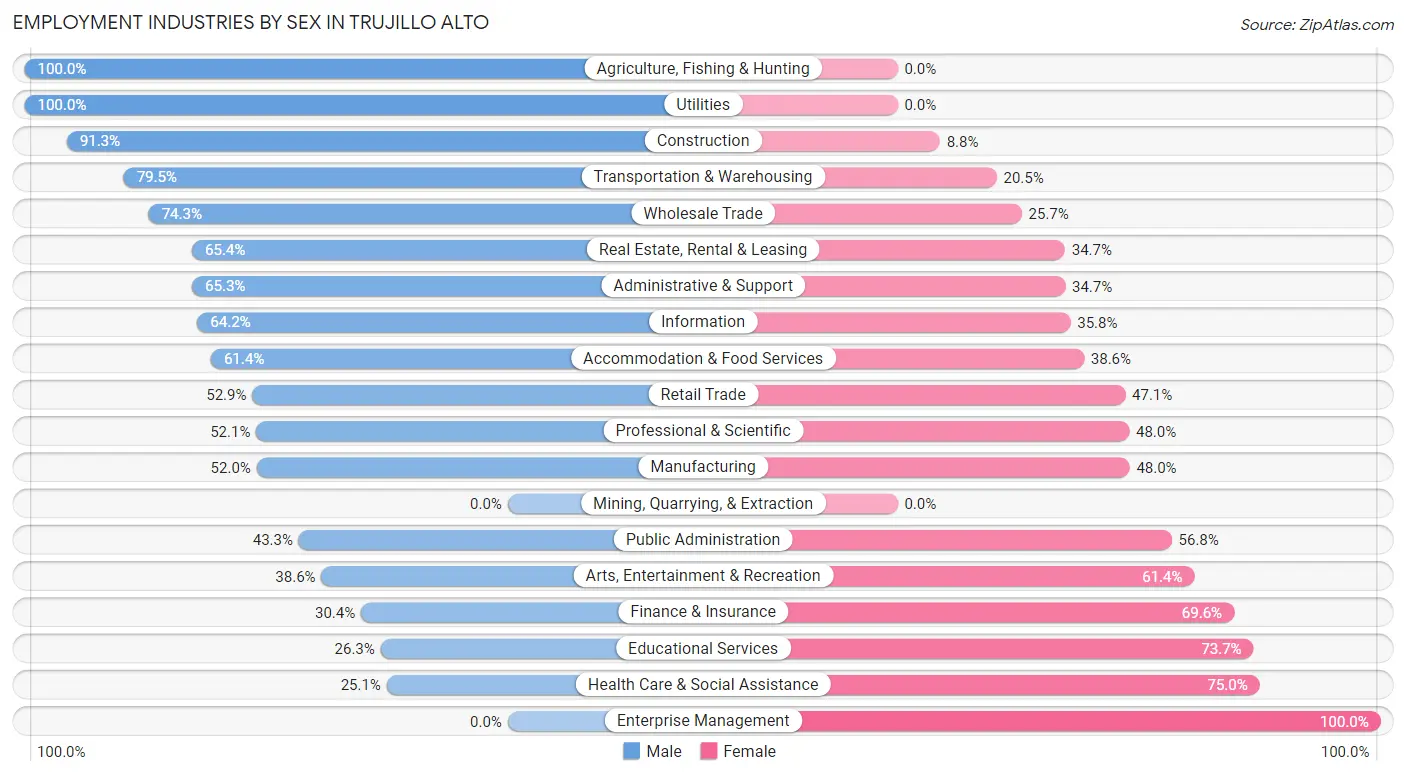
Employment Industries by Sex in Trujillo Alto
The Trujillo Alto industries that see more men than women are Agriculture, Fishing & Hunting (100.0%), Utilities (100.0%), and Construction (91.2%), whereas the industries that tend to have a higher number of women are Enterprise Management (100.0%), Health Care & Social Assistance (75.0%), and Educational Services (73.7%).
| Industry | Male | Female |
| Agriculture, Fishing & Hunting | 21 (100.0%) | 0 (0.0%) |
| Mining, Quarrying, & Extraction | 0 (0.0%) | 0 (0.0%) |
| Construction | 720 (91.2%) | 69 (8.7%) |
| Manufacturing | 408 (52.0%) | 377 (48.0%) |
| Wholesale Trade | 607 (74.3%) | 210 (25.7%) |
| Retail Trade | 1,227 (52.9%) | 1,094 (47.1%) |
| Transportation & Warehousing | 399 (79.5%) | 103 (20.5%) |
| Utilities | 95 (100.0%) | 0 (0.0%) |
| Information | 271 (64.2%) | 151 (35.8%) |
| Finance & Insurance | 463 (30.4%) | 1,062 (69.6%) |
| Real Estate, Rental & Leasing | 83 (65.3%) | 44 (34.6%) |
| Professional & Scientific | 545 (52.0%) | 502 (47.9%) |
| Enterprise Management | 0 (0.0%) | 11 (100.0%) |
| Administrative & Support | 482 (65.3%) | 256 (34.7%) |
| Educational Services | 532 (26.3%) | 1,490 (73.7%) |
| Health Care & Social Assistance | 554 (25.1%) | 1,658 (75.0%) |
| Arts, Entertainment & Recreation | 150 (38.6%) | 239 (61.4%) |
| Accommodation & Food Services | 794 (61.4%) | 499 (38.6%) |
| Public Administration | 772 (43.2%) | 1,013 (56.8%) |
| Total | 8,748 (48.2%) | 9,413 (51.8%) |
Education in Trujillo Alto
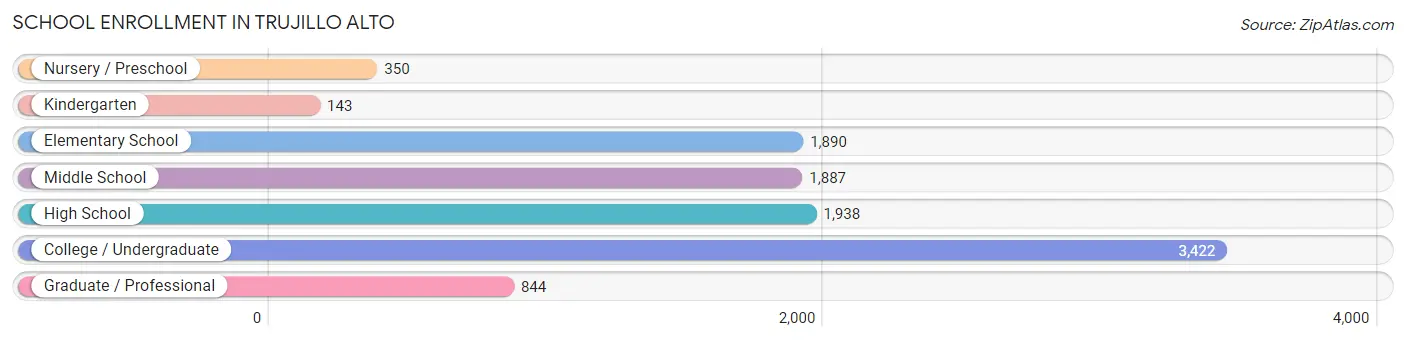
School Enrollment in Trujillo Alto
The most common levels of schooling among the 10,474 students in Trujillo Alto are college / undergraduate (3,422 | 32.7%), high school (1,938 | 18.5%), and elementary school (1,890 | 18.0%).
| School Level | # Students | % Students |
| Nursery / Preschool | 350 | 3.3% |
| Kindergarten | 143 | 1.4% |
| Elementary School | 1,890 | 18.0% |
| Middle School | 1,887 | 18.0% |
| High School | 1,938 | 18.5% |
| College / Undergraduate | 3,422 | 32.7% |
| Graduate / Professional | 844 | 8.1% |
| Total | 10,474 | 100.0% |
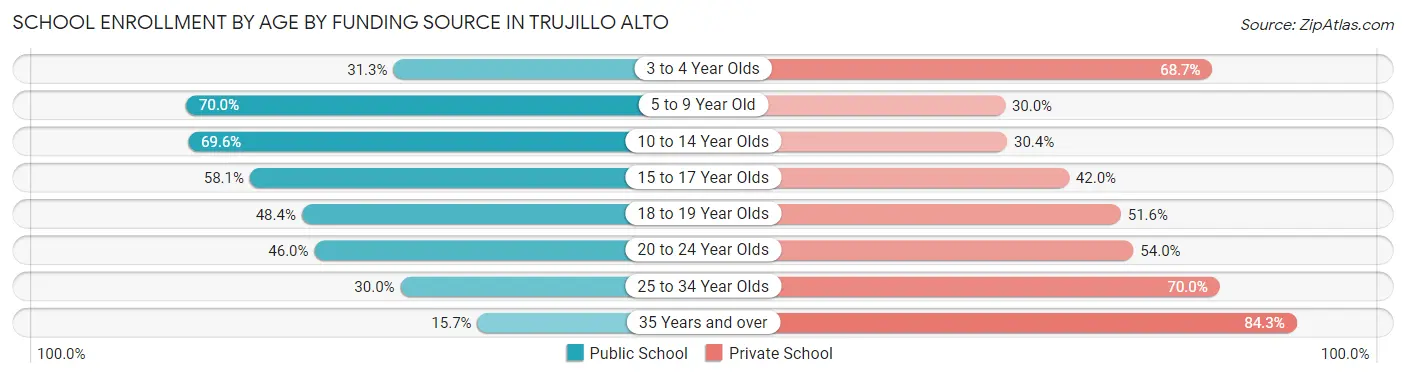
School Enrollment by Age by Funding Source in Trujillo Alto
Out of a total of 10,474 students who are enrolled in schools in Trujillo Alto, 4,870 (46.5%) attend a private institution, while the remaining 5,604 (53.5%) are enrolled in public schools. The age group of 35 years and over has the highest likelihood of being enrolled in private schools, with 544 (84.3% in the age bracket) enrolled. Conversely, the age group of 5 to 9 year old has the lowest likelihood of being enrolled in a private school, with 1,367 (70.0% in the age bracket) attending a public institution.
| Age Bracket | Public School | Private School |
| 3 to 4 Year Olds | 109 (31.3%) | 239 (68.7%) |
| 5 to 9 Year Old | 1,367 (70.0%) | 587 (30.0%) |
| 10 to 14 Year Olds | 1,584 (69.6%) | 693 (30.4%) |
| 15 to 17 Year Olds | 804 (58.1%) | 581 (41.9%) |
| 18 to 19 Year Olds | 447 (48.4%) | 477 (51.6%) |
| 20 to 24 Year Olds | 875 (46.0%) | 1,026 (54.0%) |
| 25 to 34 Year Olds | 312 (30.0%) | 728 (70.0%) |
| 35 Years and over | 101 (15.7%) | 544 (84.3%) |
| Total | 5,604 (53.5%) | 4,870 (46.5%) |
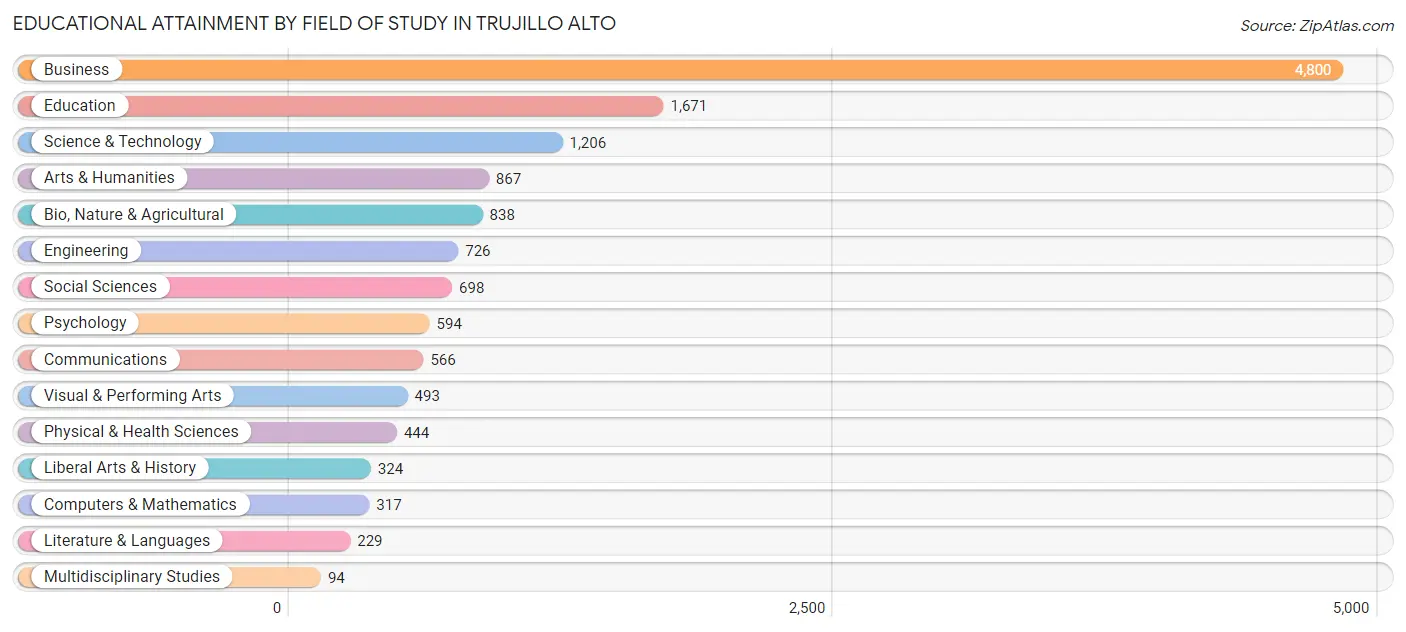
Educational Attainment by Field of Study in Trujillo Alto
Business (4,800 | 34.6%), education (1,671 | 12.0%), science & technology (1,206 | 8.7%), arts & humanities (867 | 6.2%), and bio, nature & agricultural (838 | 6.0%) are the most common fields of study among 13,867 individuals in Trujillo Alto who have obtained a bachelor's degree or higher.
| Field of Study | # Graduates | % Graduates |
| Computers & Mathematics | 317 | 2.3% |
| Bio, Nature & Agricultural | 838 | 6.0% |
| Physical & Health Sciences | 444 | 3.2% |
| Psychology | 594 | 4.3% |
| Social Sciences | 698 | 5.0% |
| Engineering | 726 | 5.2% |
| Multidisciplinary Studies | 94 | 0.7% |
| Science & Technology | 1,206 | 8.7% |
| Business | 4,800 | 34.6% |
| Education | 1,671 | 12.0% |
| Literature & Languages | 229 | 1.7% |
| Liberal Arts & History | 324 | 2.3% |
| Visual & Performing Arts | 493 | 3.6% |
| Communications | 566 | 4.1% |
| Arts & Humanities | 867 | 6.2% |
| Total | 13,867 | 100.0% |
Transportation & Commute in Trujillo Alto
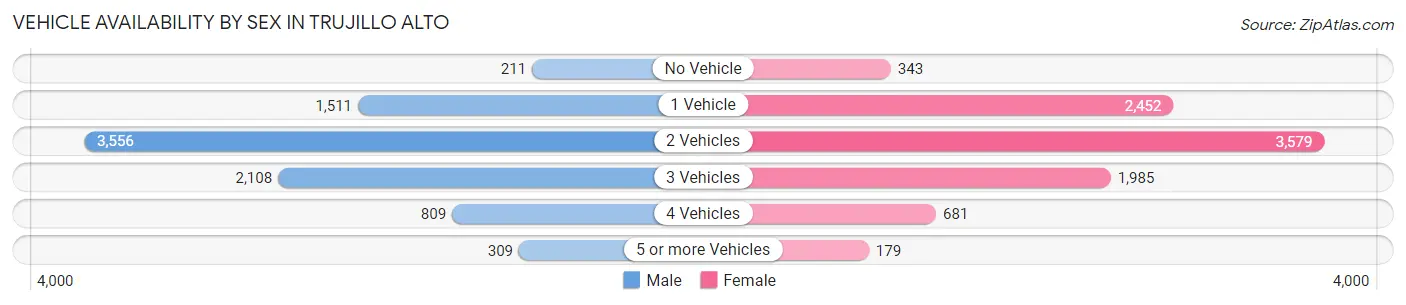
Vehicle Availability by Sex in Trujillo Alto
The most prevalent vehicle ownership categories in Trujillo Alto are males with 2 vehicles (3,556, accounting for 41.8%) and females with 2 vehicles (3,579, making up 38.6%).
| Vehicles Available | Male | Female |
| No Vehicle | 211 (2.5%) | 343 (3.7%) |
| 1 Vehicle | 1,511 (17.8%) | 2,452 (26.6%) |
| 2 Vehicles | 3,556 (41.8%) | 3,579 (38.8%) |
| 3 Vehicles | 2,108 (24.8%) | 1,985 (21.5%) |
| 4 Vehicles | 809 (9.5%) | 681 (7.4%) |
| 5 or more Vehicles | 309 (3.6%) | 179 (1.9%) |
| Total | 8,504 (100.0%) | 9,219 (100.0%) |
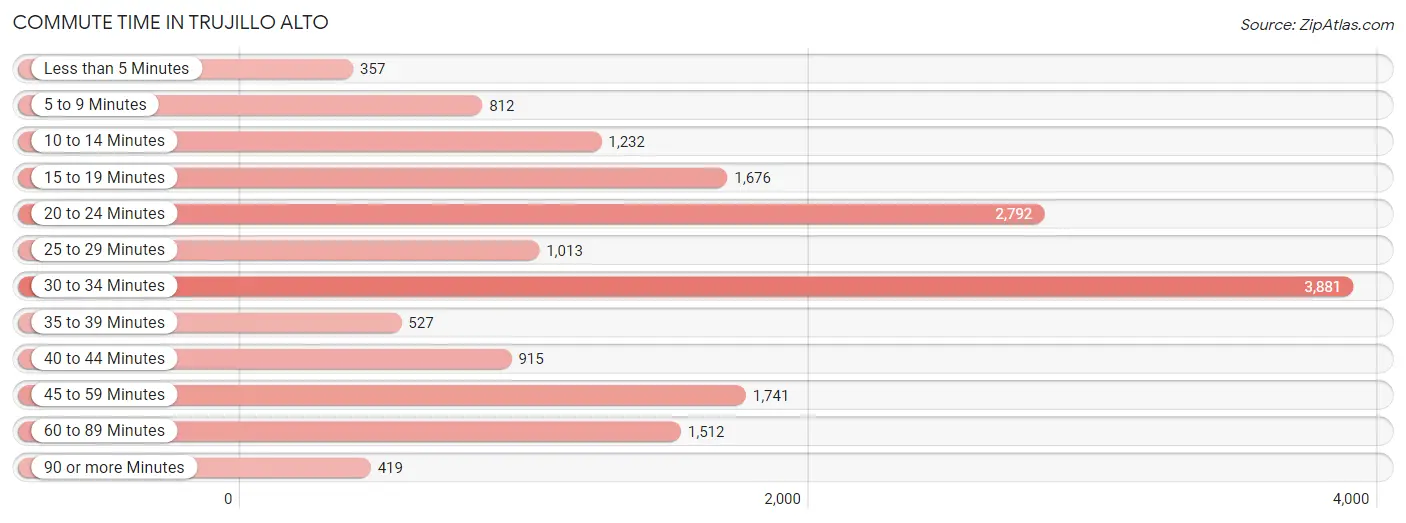
Commute Time in Trujillo Alto
The most frequently occuring commute durations in Trujillo Alto are 30 to 34 minutes (3,881 commuters, 23.0%), 20 to 24 minutes (2,792 commuters, 16.5%), and 45 to 59 minutes (1,741 commuters, 10.3%).
| Commute Time | # Commuters | % Commuters |
| Less than 5 Minutes | 357 | 2.1% |
| 5 to 9 Minutes | 812 | 4.8% |
| 10 to 14 Minutes | 1,232 | 7.3% |
| 15 to 19 Minutes | 1,676 | 9.9% |
| 20 to 24 Minutes | 2,792 | 16.5% |
| 25 to 29 Minutes | 1,013 | 6.0% |
| 30 to 34 Minutes | 3,881 | 23.0% |
| 35 to 39 Minutes | 527 | 3.1% |
| 40 to 44 Minutes | 915 | 5.4% |
| 45 to 59 Minutes | 1,741 | 10.3% |
| 60 to 89 Minutes | 1,512 | 9.0% |
| 90 or more Minutes | 419 | 2.5% |
Commute Time by Sex in Trujillo Alto
The most common commute times in Trujillo Alto are 30 to 34 minutes (1,754 commuters, 21.7%) for males and 30 to 34 minutes (2,127 commuters, 24.2%) for females.
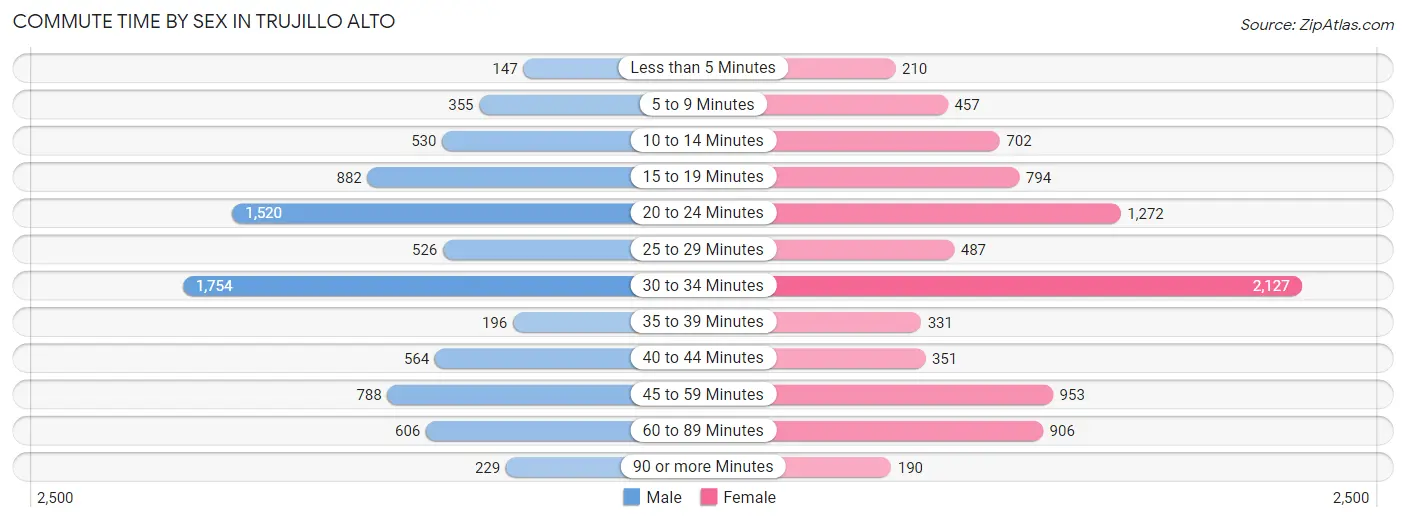
| Commute Time | Male | Female |
| Less than 5 Minutes | 147 (1.8%) | 210 (2.4%) |
| 5 to 9 Minutes | 355 (4.4%) | 457 (5.2%) |
| 10 to 14 Minutes | 530 (6.6%) | 702 (8.0%) |
| 15 to 19 Minutes | 882 (10.9%) | 794 (9.0%) |
| 20 to 24 Minutes | 1,520 (18.8%) | 1,272 (14.5%) |
| 25 to 29 Minutes | 526 (6.5%) | 487 (5.6%) |
| 30 to 34 Minutes | 1,754 (21.7%) | 2,127 (24.2%) |
| 35 to 39 Minutes | 196 (2.4%) | 331 (3.8%) |
| 40 to 44 Minutes | 564 (7.0%) | 351 (4.0%) |
| 45 to 59 Minutes | 788 (9.7%) | 953 (10.8%) |
| 60 to 89 Minutes | 606 (7.5%) | 906 (10.3%) |
| 90 or more Minutes | 229 (2.8%) | 190 (2.2%) |
Time of Departure to Work by Sex in Trujillo Alto
The most frequent times of departure to work in Trujillo Alto are 7:00 AM to 7:29 AM (1,227, 15.1%) for males and 6:30 AM to 6:59 AM (1,711, 19.5%) for females.
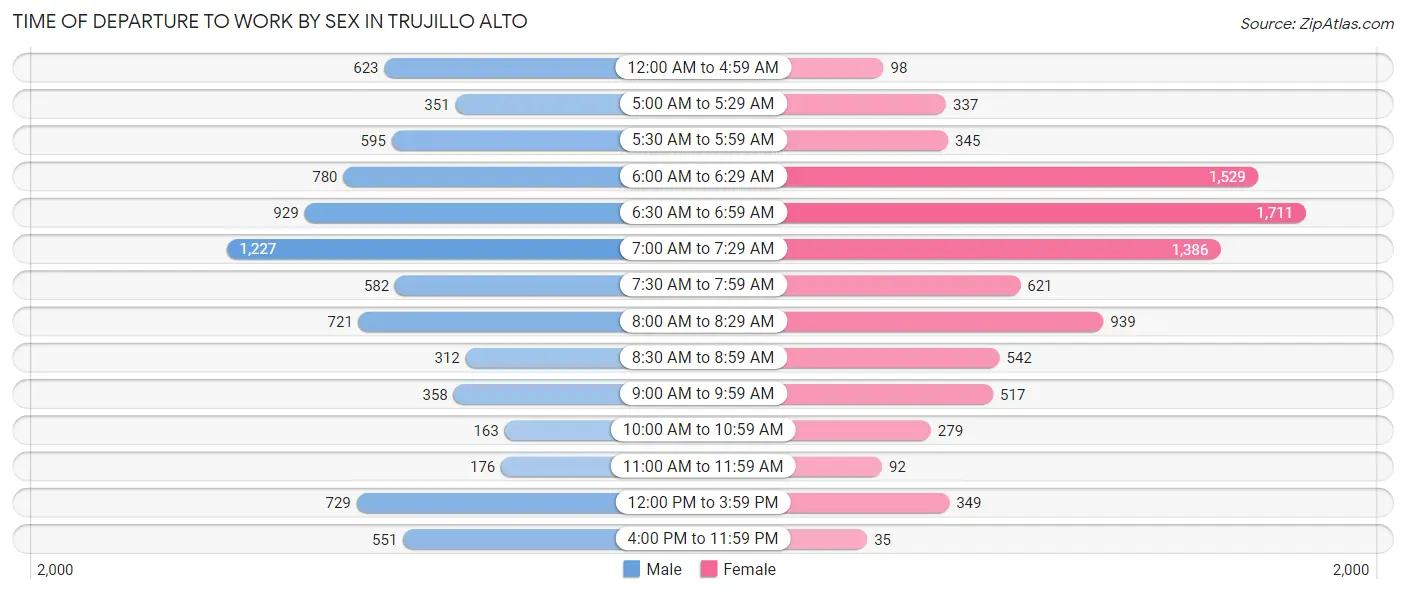
| Time of Departure | Male | Female |
| 12:00 AM to 4:59 AM | 623 (7.7%) | 98 (1.1%) |
| 5:00 AM to 5:29 AM | 351 (4.3%) | 337 (3.8%) |
| 5:30 AM to 5:59 AM | 595 (7.3%) | 345 (3.9%) |
| 6:00 AM to 6:29 AM | 780 (9.6%) | 1,529 (17.4%) |
| 6:30 AM to 6:59 AM | 929 (11.5%) | 1,711 (19.5%) |
| 7:00 AM to 7:29 AM | 1,227 (15.1%) | 1,386 (15.8%) |
| 7:30 AM to 7:59 AM | 582 (7.2%) | 621 (7.1%) |
| 8:00 AM to 8:29 AM | 721 (8.9%) | 939 (10.7%) |
| 8:30 AM to 8:59 AM | 312 (3.8%) | 542 (6.2%) |
| 9:00 AM to 9:59 AM | 358 (4.4%) | 517 (5.9%) |
| 10:00 AM to 10:59 AM | 163 (2.0%) | 279 (3.2%) |
| 11:00 AM to 11:59 AM | 176 (2.2%) | 92 (1.1%) |
| 12:00 PM to 3:59 PM | 729 (9.0%) | 349 (4.0%) |
| 4:00 PM to 11:59 PM | 551 (6.8%) | 35 (0.4%) |
| Total | 8,097 (100.0%) | 8,780 (100.0%) |
Housing Occupancy in Trujillo Alto
Occupancy by Ownership in Trujillo Alto
Of the total 16,940 dwellings in Trujillo Alto, owner-occupied units account for 11,838 (69.9%), while renter-occupied units make up 5,102 (30.1%).
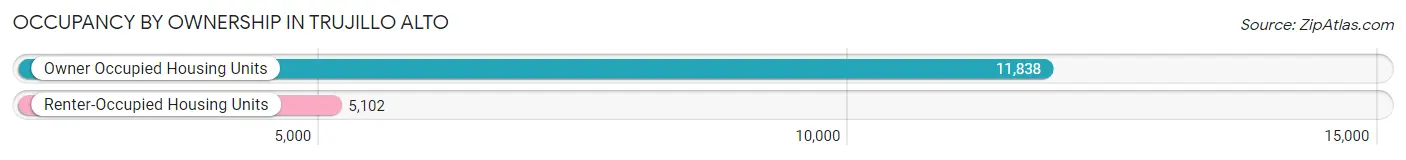
| Occupancy | # Housing Units | % Housing Units |
| Owner Occupied Housing Units | 11,838 | 69.9% |
| Renter-Occupied Housing Units | 5,102 | 30.1% |
| Total Occupied Housing Units | 16,940 | 100.0% |
Occupancy by Household Size in Trujillo Alto
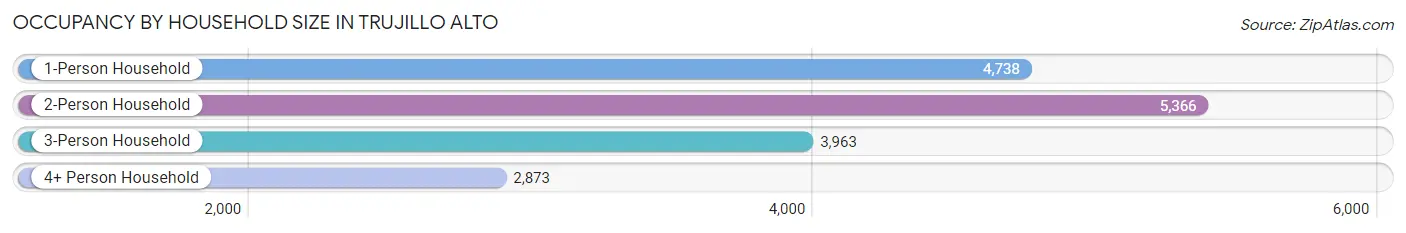
| Household Size | # Housing Units | % Housing Units |
| 1-Person Household | 4,738 | 28.0% |
| 2-Person Household | 5,366 | 31.7% |
| 3-Person Household | 3,963 | 23.4% |
| 4+ Person Household | 2,873 | 17.0% |
| Total Housing Units | 16,940 | 100.0% |
Occupancy by Ownership by Household Size in Trujillo Alto
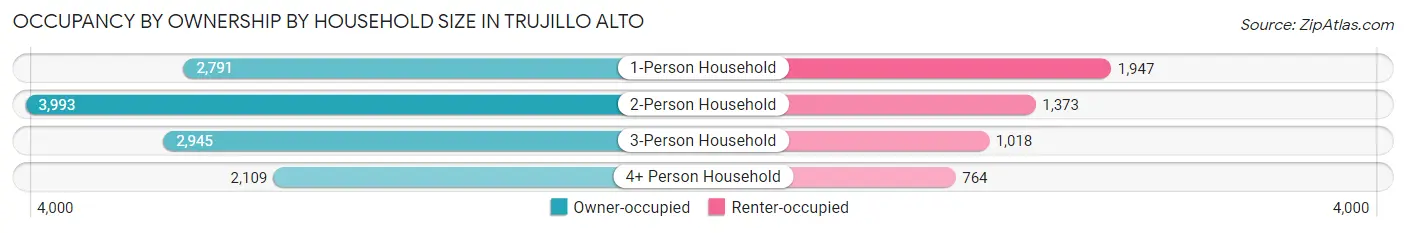
| Household Size | Owner-occupied | Renter-occupied |
| 1-Person Household | 2,791 (58.9%) | 1,947 (41.1%) |
| 2-Person Household | 3,993 (74.4%) | 1,373 (25.6%) |
| 3-Person Household | 2,945 (74.3%) | 1,018 (25.7%) |
| 4+ Person Household | 2,109 (73.4%) | 764 (26.6%) |
| Total Housing Units | 11,838 (69.9%) | 5,102 (30.1%) |
Occupancy by Educational Attainment in Trujillo Alto
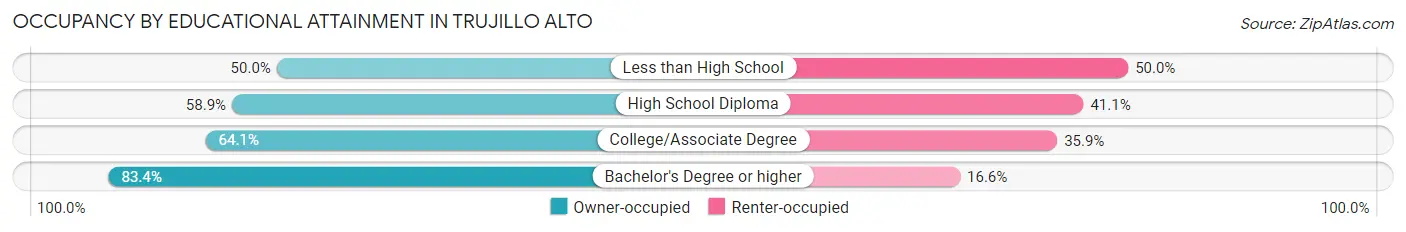
| Household Size | Owner-occupied | Renter-occupied |
| Less than High School | 888 (50.0%) | 887 (50.0%) |
| High School Diploma | 1,827 (58.9%) | 1,275 (41.1%) |
| College/Associate Degree | 3,106 (64.1%) | 1,739 (35.9%) |
| Bachelor's Degree or higher | 6,017 (83.4%) | 1,201 (16.6%) |
Occupancy by Age of Householder in Trujillo Alto
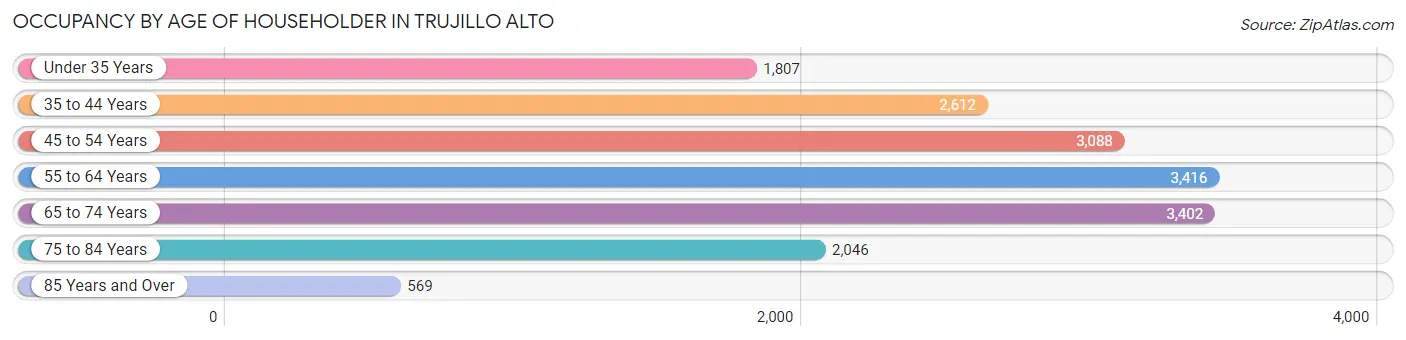
| Age Bracket | # Households | % Households |
| Under 35 Years | 1,807 | 10.7% |
| 35 to 44 Years | 2,612 | 15.4% |
| 45 to 54 Years | 3,088 | 18.2% |
| 55 to 64 Years | 3,416 | 20.2% |
| 65 to 74 Years | 3,402 | 20.1% |
| 75 to 84 Years | 2,046 | 12.1% |
| 85 Years and Over | 569 | 3.4% |
| Total | 16,940 | 100.0% |
Housing Finances in Trujillo Alto
Median Income by Occupancy in Trujillo Alto
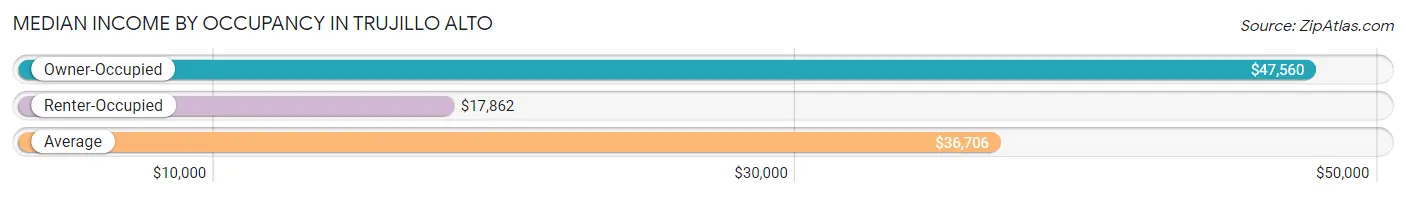
| Occupancy Type | # Households | Median Income |
| Owner-Occupied | 11,838 (69.9%) | $47,560 |
| Renter-Occupied | 5,102 (30.1%) | $17,862 |
| Average | 16,940 (100.0%) | $36,706 |
Occupancy by Householder Income Bracket in Trujillo Alto
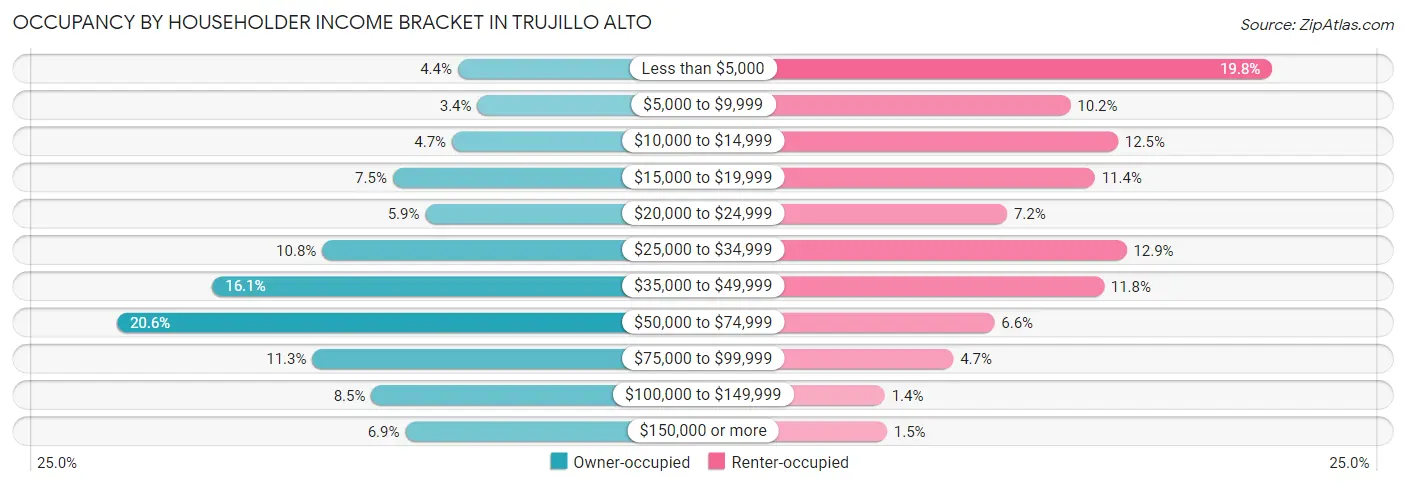
| Income Bracket | Owner-occupied | Renter-occupied |
| Less than $5,000 | 517 (4.4%) | 1,012 (19.8%) |
| $5,000 to $9,999 | 407 (3.4%) | 522 (10.2%) |
| $10,000 to $14,999 | 551 (4.6%) | 637 (12.5%) |
| $15,000 to $19,999 | 884 (7.5%) | 581 (11.4%) |
| $20,000 to $24,999 | 701 (5.9%) | 368 (7.2%) |
| $25,000 to $34,999 | 1,282 (10.8%) | 658 (12.9%) |
| $35,000 to $49,999 | 1,901 (16.1%) | 603 (11.8%) |
| $50,000 to $74,999 | 2,439 (20.6%) | 337 (6.6%) |
| $75,000 to $99,999 | 1,338 (11.3%) | 237 (4.6%) |
| $100,000 to $149,999 | 1,005 (8.5%) | 71 (1.4%) |
| $150,000 or more | 813 (6.9%) | 76 (1.5%) |
| Total | 11,838 (100.0%) | 5,102 (100.0%) |
Monthly Housing Cost Tiers in Trujillo Alto
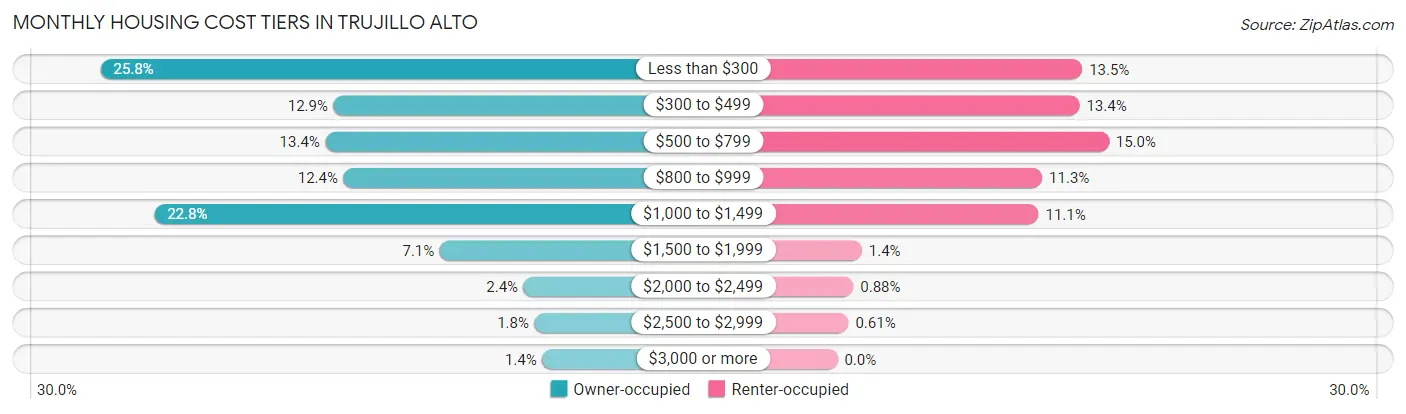
| Monthly Cost | Owner-occupied | Renter-occupied |
| Less than $300 | 3,055 (25.8%) | 690 (13.5%) |
| $300 to $499 | 1,530 (12.9%) | 682 (13.4%) |
| $500 to $799 | 1,583 (13.4%) | 765 (15.0%) |
| $800 to $999 | 1,464 (12.4%) | 577 (11.3%) |
| $1,000 to $1,499 | 2,704 (22.8%) | 567 (11.1%) |
| $1,500 to $1,999 | 835 (7.0%) | 69 (1.3%) |
| $2,000 to $2,499 | 287 (2.4%) | 45 (0.9%) |
| $2,500 to $2,999 | 215 (1.8%) | 31 (0.6%) |
| $3,000 or more | 165 (1.4%) | 0 (0.0%) |
| Total | 11,838 (100.0%) | 5,102 (100.0%) |
Physical Housing Characteristics in Trujillo Alto
Housing Structures in Trujillo Alto
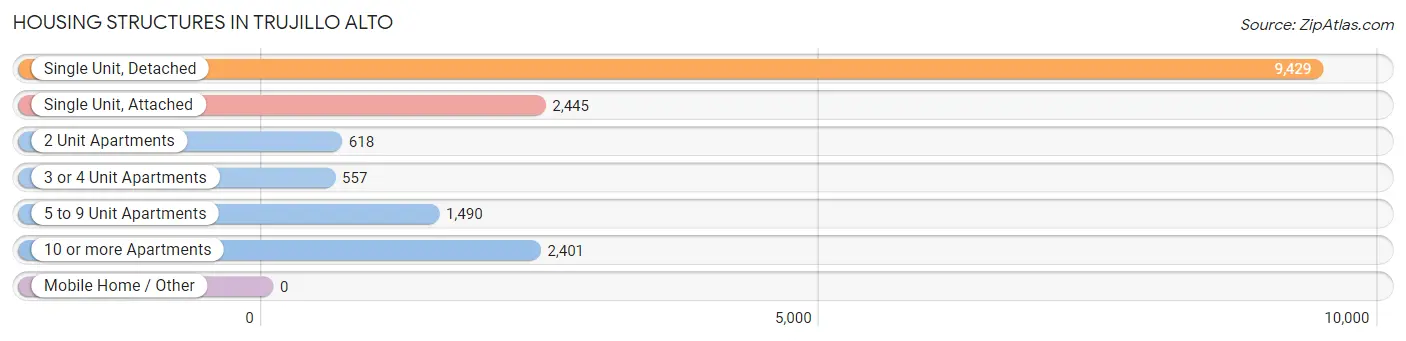
| Structure Type | # Housing Units | % Housing Units |
| Single Unit, Detached | 9,429 | 55.7% |
| Single Unit, Attached | 2,445 | 14.4% |
| 2 Unit Apartments | 618 | 3.6% |
| 3 or 4 Unit Apartments | 557 | 3.3% |
| 5 to 9 Unit Apartments | 1,490 | 8.8% |
| 10 or more Apartments | 2,401 | 14.2% |
| Mobile Home / Other | 0 | 0.0% |
| Total | 16,940 | 100.0% |
Housing Structures by Occupancy in Trujillo Alto
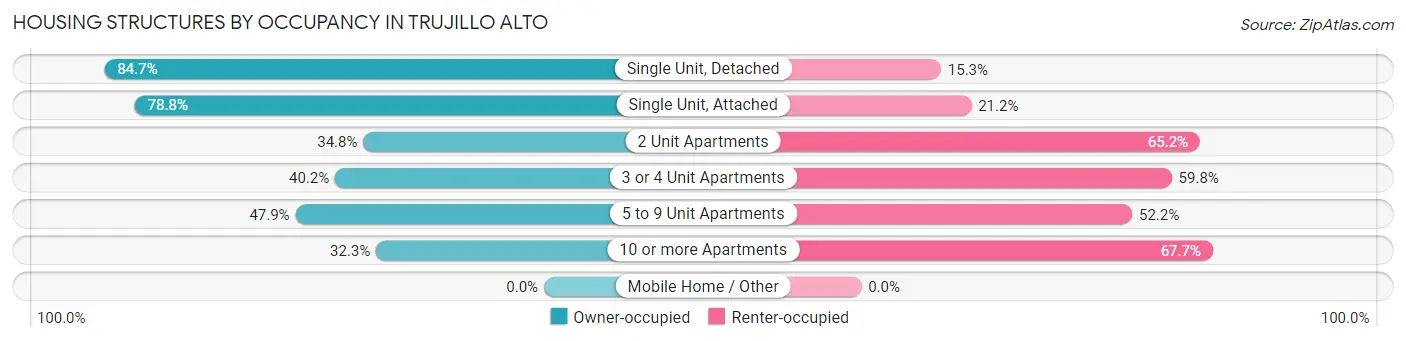
| Structure Type | Owner-occupied | Renter-occupied |
| Single Unit, Detached | 7,983 (84.7%) | 1,446 (15.3%) |
| Single Unit, Attached | 1,927 (78.8%) | 518 (21.2%) |
| 2 Unit Apartments | 215 (34.8%) | 403 (65.2%) |
| 3 or 4 Unit Apartments | 224 (40.2%) | 333 (59.8%) |
| 5 to 9 Unit Apartments | 713 (47.8%) | 777 (52.1%) |
| 10 or more Apartments | 776 (32.3%) | 1,625 (67.7%) |
| Mobile Home / Other | 0 (0.0%) | 0 (0.0%) |
| Total | 11,838 (69.9%) | 5,102 (30.1%) |
Housing Structures by Number of Rooms in Trujillo Alto
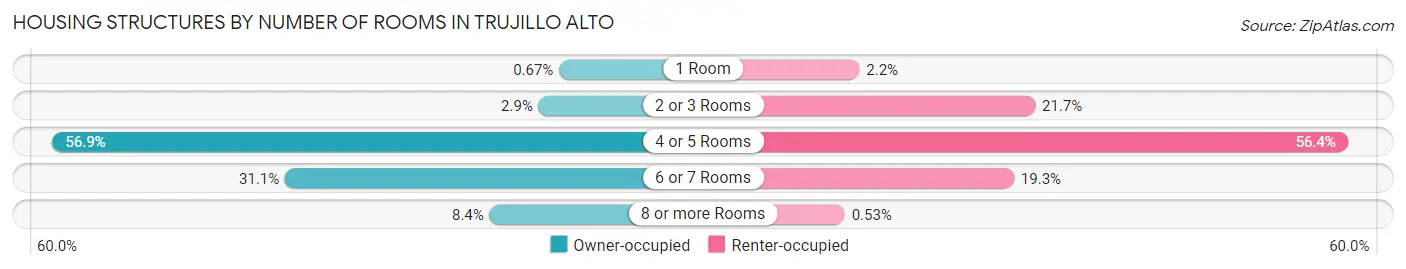
| Number of Rooms | Owner-occupied | Renter-occupied |
| 1 Room | 79 (0.7%) | 110 (2.2%) |
| 2 or 3 Rooms | 348 (2.9%) | 1,105 (21.7%) |
| 4 or 5 Rooms | 6,737 (56.9%) | 2,875 (56.4%) |
| 6 or 7 Rooms | 3,681 (31.1%) | 985 (19.3%) |
| 8 or more Rooms | 993 (8.4%) | 27 (0.5%) |
| Total | 11,838 (100.0%) | 5,102 (100.0%) |
Housing Structure by Heating Type in Trujillo Alto
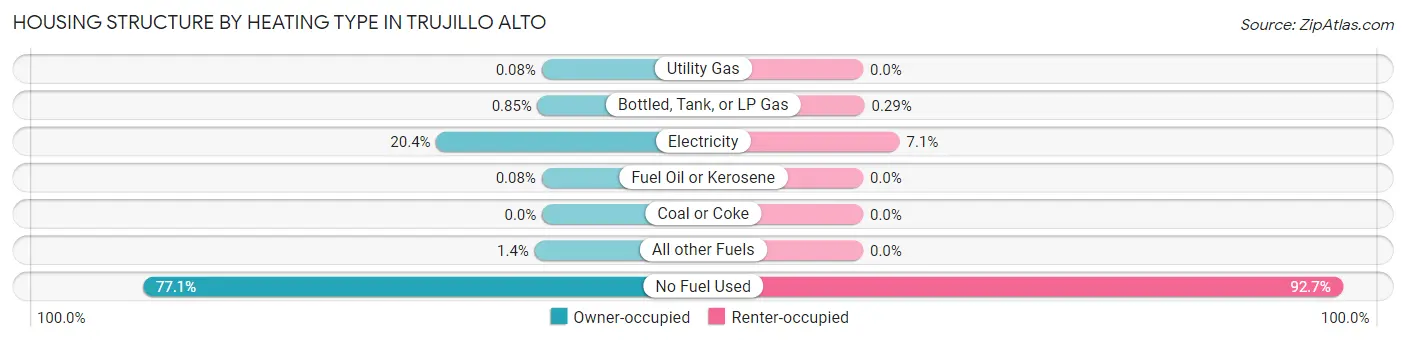
| Heating Type | Owner-occupied | Renter-occupied |
| Utility Gas | 9 (0.1%) | 0 (0.0%) |
| Bottled, Tank, or LP Gas | 101 (0.9%) | 15 (0.3%) |
| Electricity | 2,417 (20.4%) | 360 (7.1%) |
| Fuel Oil or Kerosene | 10 (0.1%) | 0 (0.0%) |
| Coal or Coke | 0 (0.0%) | 0 (0.0%) |
| All other Fuels | 169 (1.4%) | 0 (0.0%) |
| No Fuel Used | 9,132 (77.1%) | 4,727 (92.6%) |
| Total | 11,838 (100.0%) | 5,102 (100.0%) |
Household Vehicle Usage in Trujillo Alto
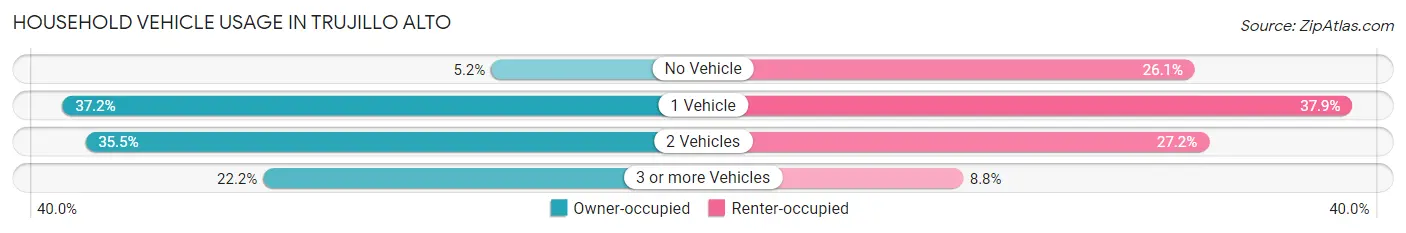
| Vehicles per Household | Owner-occupied | Renter-occupied |
| No Vehicle | 611 (5.2%) | 1,333 (26.1%) |
| 1 Vehicle | 4,401 (37.2%) | 1,933 (37.9%) |
| 2 Vehicles | 4,199 (35.5%) | 1,387 (27.2%) |
| 3 or more Vehicles | 2,627 (22.2%) | 449 (8.8%) |
| Total | 11,838 (100.0%) | 5,102 (100.0%) |
Real Estate & Mortgages in Trujillo Alto
Real Estate and Mortgage Overview in Trujillo Alto
| Characteristic | Without Mortgage | With Mortgage |
| Housing Units | 5,016 | 6,822 |
| Median Property Value | $150,900 | $163,100 |
| Median Household Income | $35,179 | $673 |
| Monthly Housing Costs | $256 | $165 |
| Real Estate Taxes | $741 | $5,146 |
Property Value by Mortgage Status in Trujillo Alto
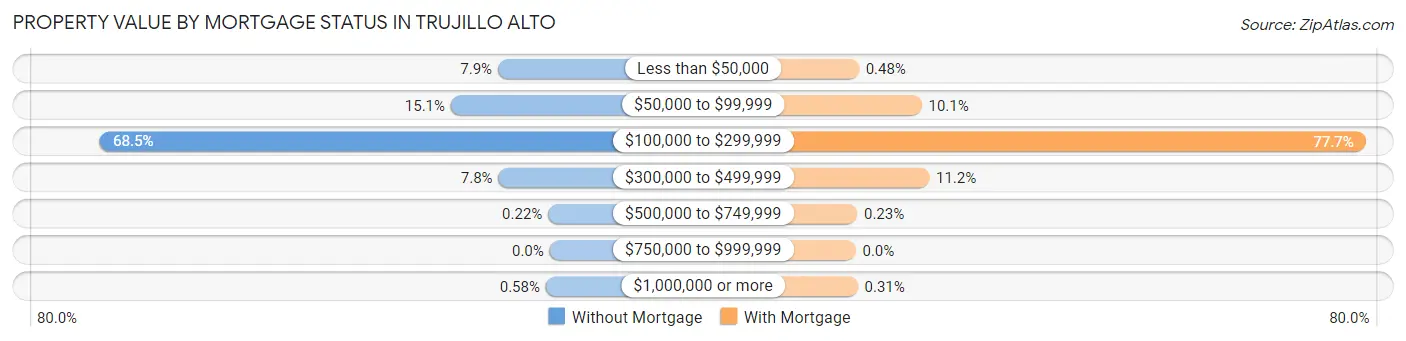
| Property Value | Without Mortgage | With Mortgage |
| Less than $50,000 | 395 (7.9%) | 33 (0.5%) |
| $50,000 to $99,999 | 755 (15.0%) | 686 (10.1%) |
| $100,000 to $299,999 | 3,435 (68.5%) | 5,302 (77.7%) |
| $300,000 to $499,999 | 391 (7.8%) | 764 (11.2%) |
| $500,000 to $749,999 | 11 (0.2%) | 16 (0.2%) |
| $750,000 to $999,999 | 0 (0.0%) | 0 (0.0%) |
| $1,000,000 or more | 29 (0.6%) | 21 (0.3%) |
| Total | 5,016 (100.0%) | 6,822 (100.0%) |
Household Income by Mortgage Status in Trujillo Alto
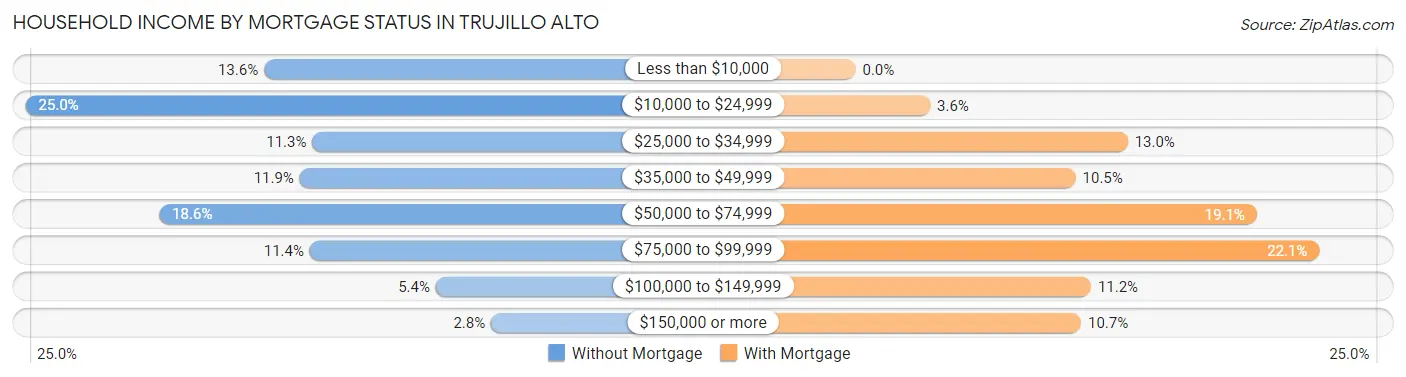
| Household Income | Without Mortgage | With Mortgage |
| Less than $10,000 | 682 (13.6%) | 0 (0.0%) |
| $10,000 to $24,999 | 1,252 (25.0%) | 242 (3.5%) |
| $25,000 to $34,999 | 567 (11.3%) | 884 (13.0%) |
| $35,000 to $49,999 | 597 (11.9%) | 715 (10.5%) |
| $50,000 to $74,999 | 933 (18.6%) | 1,304 (19.1%) |
| $75,000 to $99,999 | 573 (11.4%) | 1,506 (22.1%) |
| $100,000 to $149,999 | 272 (5.4%) | 765 (11.2%) |
| $150,000 or more | 140 (2.8%) | 733 (10.7%) |
| Total | 5,016 (100.0%) | 6,822 (100.0%) |
Property Value to Household Income Ratio in Trujillo Alto
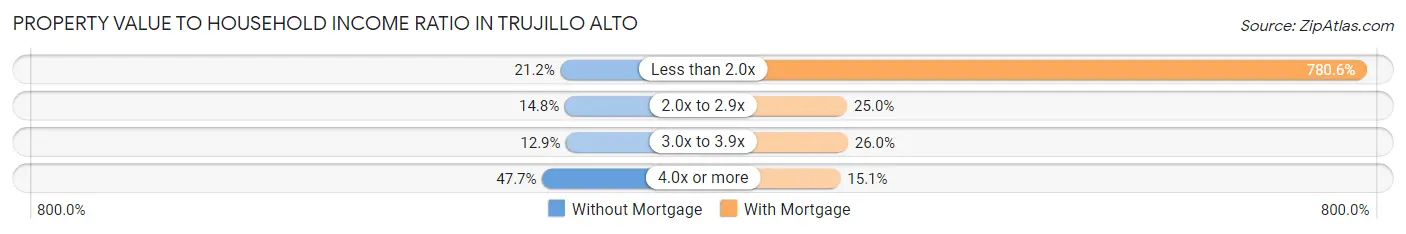
| Value-to-Income Ratio | Without Mortgage | With Mortgage |
| Less than 2.0x | 1,065 (21.2%) | 53,255 (780.6%) |
| 2.0x to 2.9x | 741 (14.8%) | 1,708 (25.0%) |
| 3.0x to 3.9x | 647 (12.9%) | 1,774 (26.0%) |
| 4.0x or more | 2,394 (47.7%) | 1,033 (15.1%) |
| Total | 5,016 (100.0%) | 6,822 (100.0%) |
Real Estate Taxes by Mortgage Status in Trujillo Alto
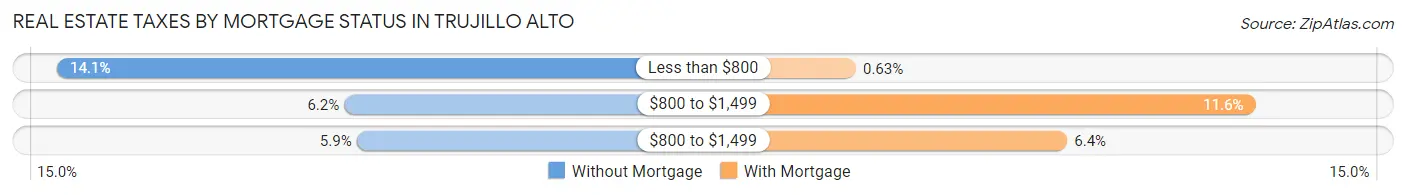
| Property Taxes | Without Mortgage | With Mortgage |
| Less than $800 | 708 (14.1%) | 43 (0.6%) |
| $800 to $1,499 | 312 (6.2%) | 789 (11.6%) |
| $800 to $1,499 | 295 (5.9%) | 438 (6.4%) |
| Total | 5,016 (100.0%) | 6,822 (100.0%) |
Health & Disability in Trujillo Alto
Health Insurance Coverage by Age in Trujillo Alto
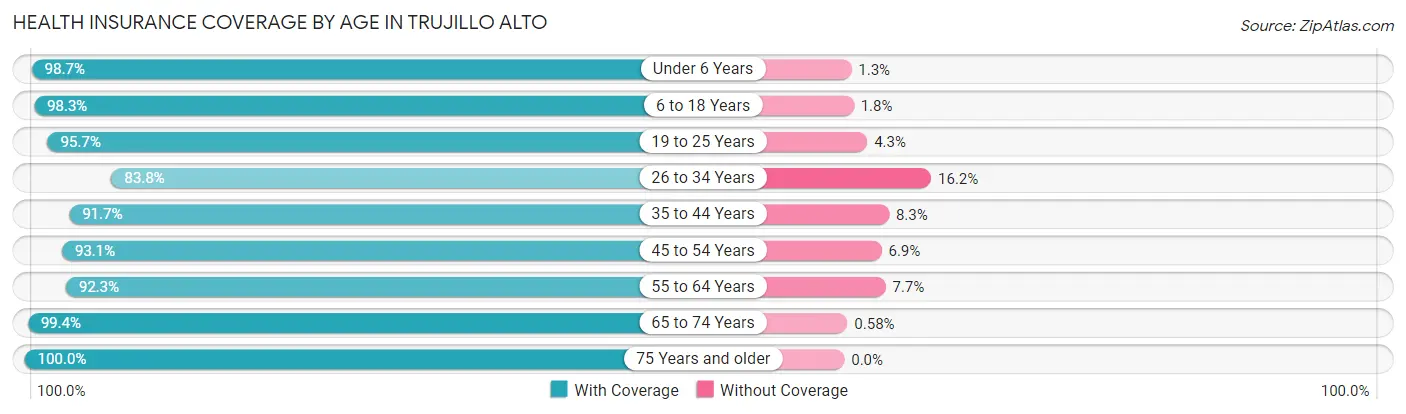
| Age Bracket | With Coverage | Without Coverage |
| Under 6 Years | 1,279 (98.7%) | 17 (1.3%) |
| 6 to 18 Years | 5,955 (98.3%) | 106 (1.8%) |
| 19 to 25 Years | 4,421 (95.7%) | 197 (4.3%) |
| 26 to 34 Years | 4,234 (83.8%) | 818 (16.2%) |
| 35 to 44 Years | 4,797 (91.7%) | 436 (8.3%) |
| 45 to 54 Years | 5,283 (93.1%) | 394 (6.9%) |
| 55 to 64 Years | 5,391 (92.3%) | 449 (7.7%) |
| 65 to 74 Years | 4,937 (99.4%) | 29 (0.6%) |
| 75 Years and older | 4,295 (100.0%) | 0 (0.0%) |
| Total | 40,592 (94.3%) | 2,446 (5.7%) |
Health Insurance Coverage by Citizenship Status in Trujillo Alto
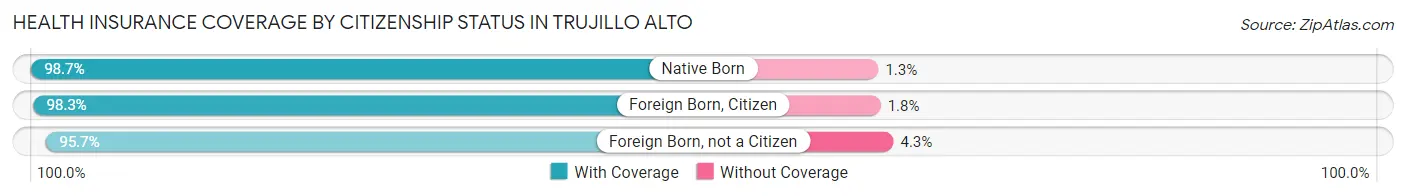
| Citizenship Status | With Coverage | Without Coverage |
| Native Born | 1,279 (98.7%) | 17 (1.3%) |
| Foreign Born, Citizen | 5,955 (98.3%) | 106 (1.8%) |
| Foreign Born, not a Citizen | 4,421 (95.7%) | 197 (4.3%) |
Health Insurance Coverage by Household Income in Trujillo Alto
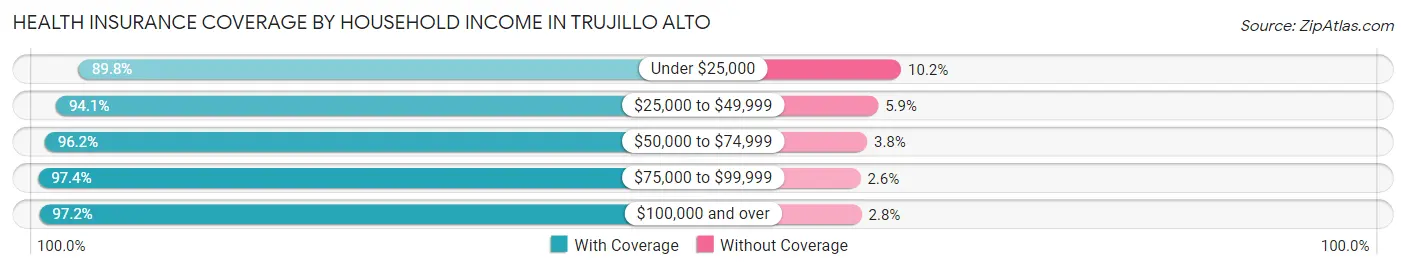
| Household Income | With Coverage | Without Coverage |
| Under $25,000 | 9,913 (89.8%) | 1,124 (10.2%) |
| $25,000 to $49,999 | 11,146 (94.1%) | 698 (5.9%) |
| $50,000 to $74,999 | 7,814 (96.2%) | 308 (3.8%) |
| $75,000 to $99,999 | 5,070 (97.4%) | 133 (2.6%) |
| $100,000 and over | 6,399 (97.2%) | 183 (2.8%) |
Public vs Private Health Insurance Coverage by Age in Trujillo Alto
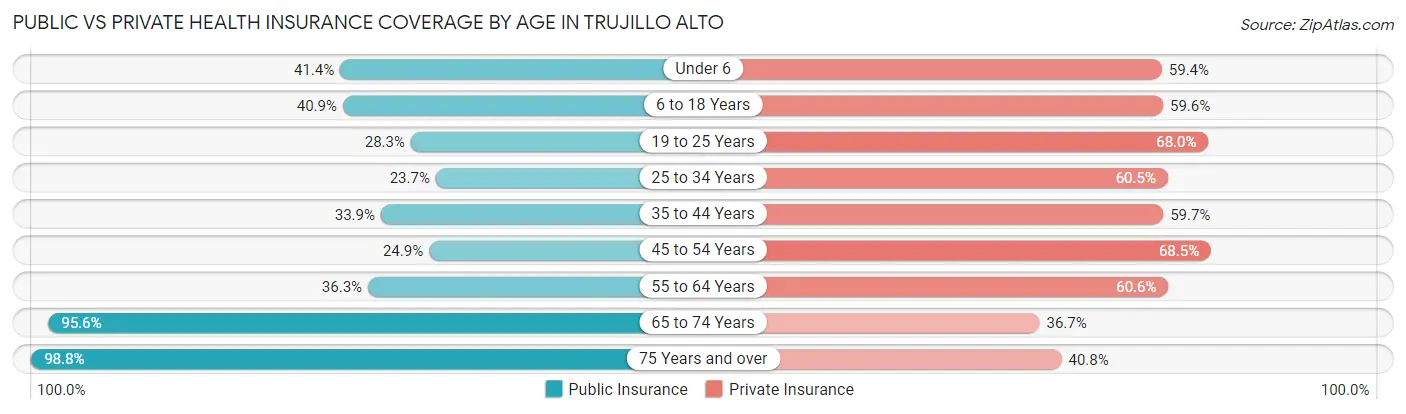
| Age Bracket | Public Insurance | Private Insurance |
| Under 6 | 537 (41.4%) | 770 (59.4%) |
| 6 to 18 Years | 2,481 (40.9%) | 3,614 (59.6%) |
| 19 to 25 Years | 1,308 (28.3%) | 3,141 (68.0%) |
| 25 to 34 Years | 1,197 (23.7%) | 3,056 (60.5%) |
| 35 to 44 Years | 1,773 (33.9%) | 3,122 (59.7%) |
| 45 to 54 Years | 1,416 (24.9%) | 3,890 (68.5%) |
| 55 to 64 Years | 2,119 (36.3%) | 3,539 (60.6%) |
| 65 to 74 Years | 4,747 (95.6%) | 1,823 (36.7%) |
| 75 Years and over | 4,242 (98.8%) | 1,752 (40.8%) |
| Total | 19,820 (46.1%) | 24,707 (57.4%) |
Disability Status by Sex by Age in Trujillo Alto
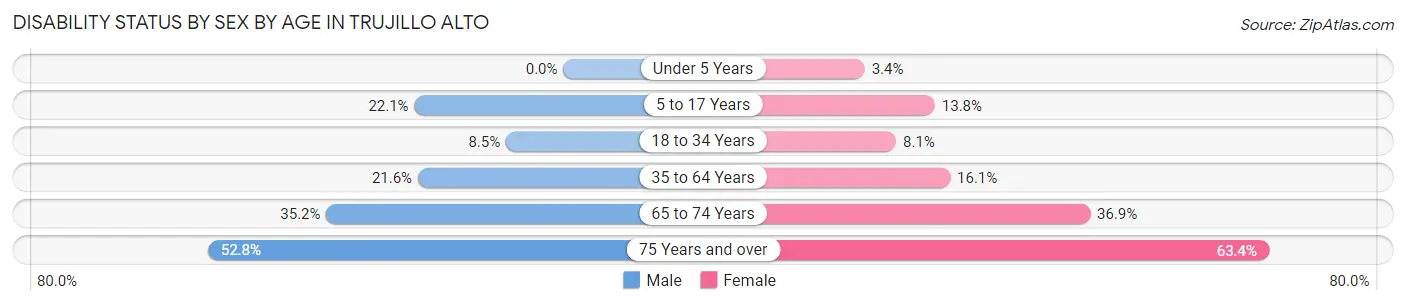
| Age Bracket | Male | Female |
| Under 5 Years | 0 (0.0%) | 21 (3.4%) |
| 5 to 17 Years | 653 (22.1%) | 368 (13.8%) |
| 18 to 34 Years | 439 (8.5%) | 410 (8.1%) |
| 35 to 64 Years | 1,592 (21.6%) | 1,508 (16.1%) |
| 65 to 74 Years | 709 (35.2%) | 1,088 (36.9%) |
| 75 Years and over | 861 (52.8%) | 1,689 (63.4%) |
Disability Class by Sex by Age in Trujillo Alto
Disability Class: Hearing Difficulty
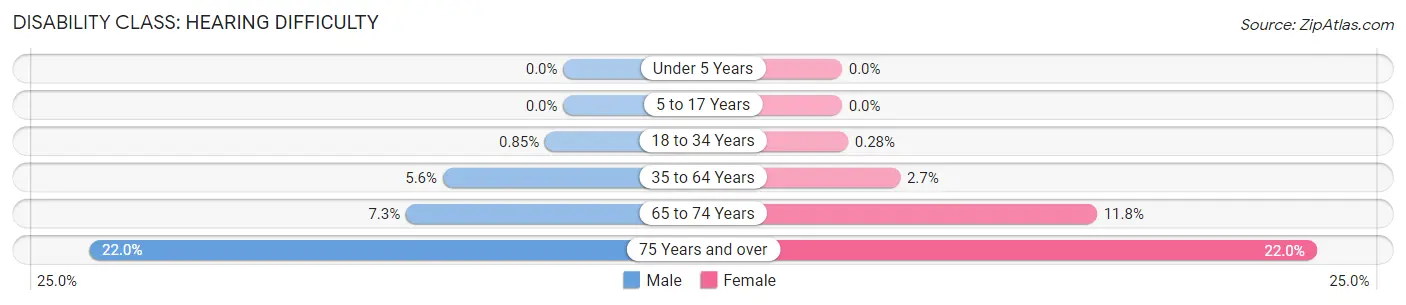
| Age Bracket | Male | Female |
| Under 5 Years | 0 (0.0%) | 0 (0.0%) |
| 5 to 17 Years | 0 (0.0%) | 0 (0.0%) |
| 18 to 34 Years | 44 (0.9%) | 14 (0.3%) |
| 35 to 64 Years | 412 (5.6%) | 253 (2.7%) |
| 65 to 74 Years | 147 (7.3%) | 349 (11.8%) |
| 75 Years and over | 359 (22.0%) | 587 (22.0%) |
Disability Class: Vision Difficulty
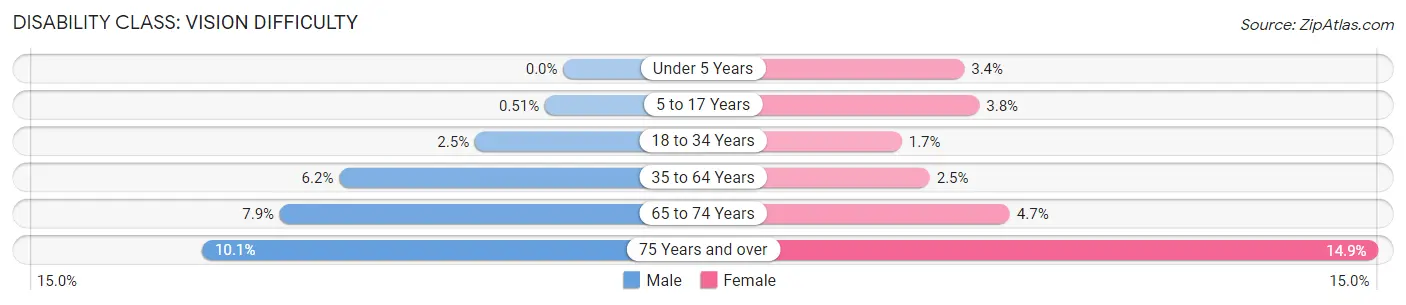
| Age Bracket | Male | Female |
| Under 5 Years | 0 (0.0%) | 21 (3.4%) |
| 5 to 17 Years | 15 (0.5%) | 102 (3.8%) |
| 18 to 34 Years | 127 (2.5%) | 85 (1.7%) |
| 35 to 64 Years | 460 (6.2%) | 230 (2.5%) |
| 65 to 74 Years | 159 (7.9%) | 138 (4.7%) |
| 75 Years and over | 164 (10.1%) | 398 (14.9%) |
Disability Class: Cognitive Difficulty
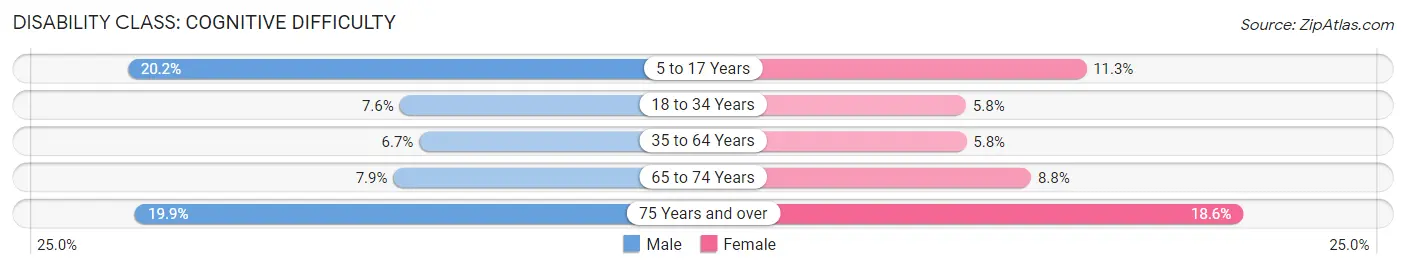
| Age Bracket | Male | Female |
| 5 to 17 Years | 597 (20.2%) | 302 (11.3%) |
| 18 to 34 Years | 392 (7.6%) | 293 (5.8%) |
| 35 to 64 Years | 493 (6.7%) | 542 (5.8%) |
| 65 to 74 Years | 159 (7.9%) | 259 (8.8%) |
| 75 Years and over | 324 (19.9%) | 496 (18.6%) |
Disability Class: Ambulatory Difficulty
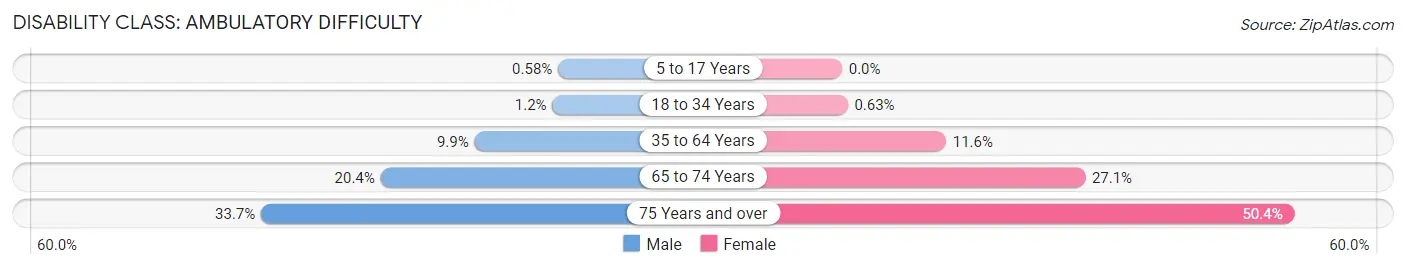
| Age Bracket | Male | Female |
| 5 to 17 Years | 17 (0.6%) | 0 (0.0%) |
| 18 to 34 Years | 63 (1.2%) | 32 (0.6%) |
| 35 to 64 Years | 729 (9.9%) | 1,086 (11.6%) |
| 65 to 74 Years | 410 (20.3%) | 799 (27.1%) |
| 75 Years and over | 549 (33.7%) | 1,343 (50.4%) |
Disability Class: Self-Care Difficulty
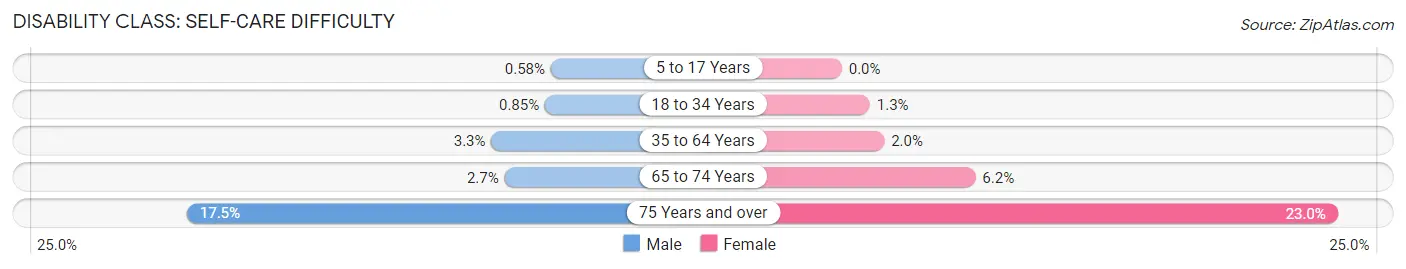
| Age Bracket | Male | Female |
| 5 to 17 Years | 17 (0.6%) | 0 (0.0%) |
| 18 to 34 Years | 44 (0.9%) | 66 (1.3%) |
| 35 to 64 Years | 246 (3.3%) | 185 (2.0%) |
| 65 to 74 Years | 55 (2.7%) | 183 (6.2%) |
| 75 Years and over | 285 (17.5%) | 613 (23.0%) |
Technology Access in Trujillo Alto
Computing Device Access in Trujillo Alto
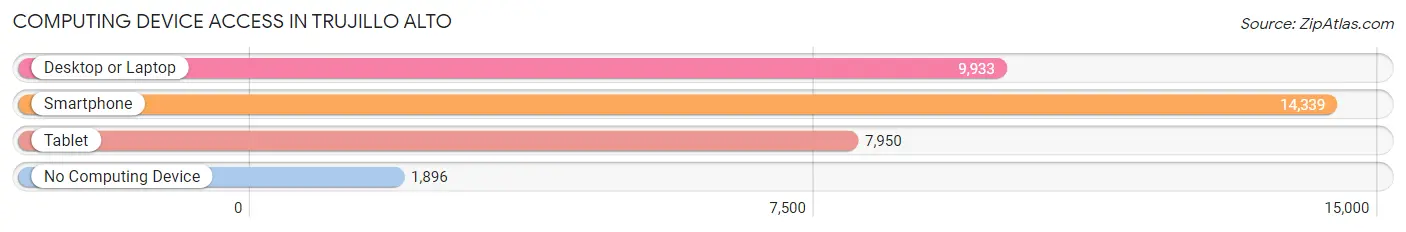
| Device Type | # Households | % Households |
| Desktop or Laptop | 9,933 | 58.6% |
| Smartphone | 14,339 | 84.7% |
| Tablet | 7,950 | 46.9% |
| No Computing Device | 1,896 | 11.2% |
| Total | 16,940 | 100.0% |
Internet Access in Trujillo Alto
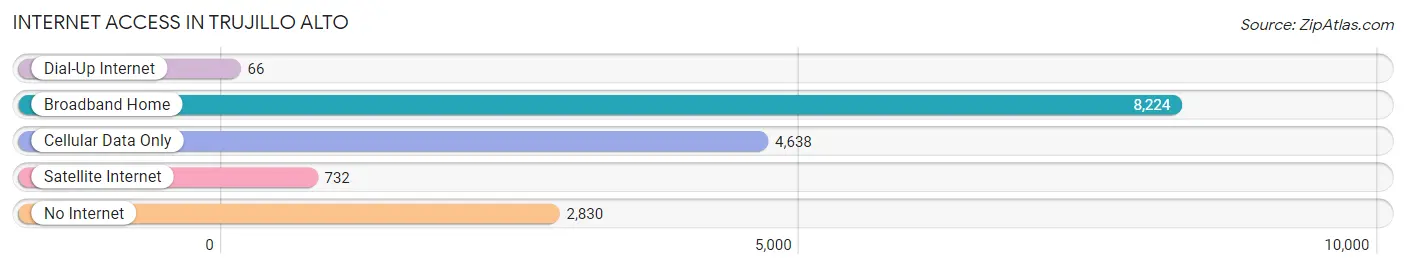
| Internet Type | # Households | % Households |
| Dial-Up Internet | 66 | 0.4% |
| Broadband Home | 8,224 | 48.5% |
| Cellular Data Only | 4,638 | 27.4% |
| Satellite Internet | 732 | 4.3% |
| No Internet | 2,830 | 16.7% |
| Total | 16,940 | 100.0% |
Trujillo Alto Summary
Trujillo Alto is a municipality located in the northern part of Puerto Rico, in the San Juan-Caguas-Guaynabo metropolitan area. It is bordered by the municipalities of San Juan, Carolina, Caguas, and Toa Baja. The municipality is named after the city of Trujillo in Spain, and was founded in 1797. As of the 2010 census, the population of Trujillo Alto was 73,743.
History
Trujillo Alto was founded in 1797, and was originally part of the municipality of San Juan. It was named after the city of Trujillo in Spain, and was officially established as a municipality in 1801. The municipality was originally part of the district of San Juan, but was later annexed to the district of Carolina.
In the 19th century, Trujillo Alto was a rural area, with most of its population living in small villages. The economy was based on agriculture, with the main crops being sugar cane, coffee, and tobacco. In the early 20th century, the economy began to diversify, with the development of industries such as textiles, leather, and food processing.
Geography
Trujillo Alto is located in the northern part of Puerto Rico, in the San Juan-Caguas-Guaynabo metropolitan area. It is bordered by the municipalities of San Juan, Carolina, Caguas, and Toa Baja. The municipality covers an area of 24.7 square miles (63.9 km2), and has a population density of 2,988.7 people per square mile (1,154.7/km2).
The terrain of Trujillo Alto is mostly flat, with some hills in the northern part of the municipality. The highest point is Cerro La Torre, which has an elevation of 1,067 feet (325 m). The climate is tropical, with an average temperature of 79°F (26°C).
Economy
The economy of Trujillo Alto is mainly based on services and manufacturing. The main industries are food processing, textiles, leather, and electronics. The municipality is also home to several shopping centers, including Plaza del Sol, Plaza Carolina, and Plaza Las Americas.
The unemployment rate in Trujillo Alto is 8.2%, which is slightly higher than the national average of 7.4%. The median household income is $20,845, which is lower than the national average of $25,928.
Demographics
As of the 2010 census, the population of Trujillo Alto was 73,743. The population is mostly of Puerto Rican descent, with a small minority of other ethnicities. The racial makeup of the municipality is 79.2% White, 12.3% Black, 4.2% Asian, and 4.3% other.
The majority of the population (90.2%) speaks Spanish as their first language, while the remaining 9.8% speaks English. The median age is 38.3 years, and the median household size is 3.3 people. The population is mostly Catholic (90.2%), with a small minority of other religions.
Common Questions
What is Per Capita Income in Trujillo Alto?
Per Capita income in Trujillo Alto is $20,531.
What is the Median Family Income in Trujillo Alto?
Median Family Income in Trujillo Alto is $44,505.
What is the Median Household income in Trujillo Alto?
Median Household Income in Trujillo Alto is $36,706.
What is Income or Wage Gap in Trujillo Alto?
Income or Wage Gap in Trujillo Alto is 5.2%.
Women in Trujillo Alto earn 94.8 cents for every dollar earned by a man.
What is Family Income Deficit in Trujillo Alto?
Family Income Deficit in Trujillo Alto is $9,211.
Families that are below poverty line in Trujillo Alto earn $9,211 less on average than the poverty threshold level.
What is Inequality or Gini Index in Trujillo Alto?
Inequality or Gini Index in Trujillo Alto is 0.49.
What is the Total Population of Trujillo Alto?
Total Population of Trujillo Alto is 43,192.
What is the Total Male Population of Trujillo Alto?
Total Male Population of Trujillo Alto is 19,792.
What is the Total Female Population of Trujillo Alto?
Total Female Population of Trujillo Alto is 23,400.
What is the Ratio of Males per 100 Females in Trujillo Alto?
There are 84.58 Males per 100 Females in Trujillo Alto.
What is the Ratio of Females per 100 Males in Trujillo Alto?
There are 118.23 Females per 100 Males in Trujillo Alto.
What is the Median Population Age in Trujillo Alto?
Median Population Age in Trujillo Alto is 43.6 Years.
What is the Average Family Size in Trujillo Alto
Average Family Size in Trujillo Alto is 3.0 People.
What is the Average Household Size in Trujillo Alto
Average Household Size in Trujillo Alto is 2.5 People.
How Large is the Labor Force in Trujillo Alto?
There are 19,712 People in the Labor Forcein in Trujillo Alto.
What is the Percentage of People in the Labor Force in Trujillo Alto?
52.7% of People are in the Labor Force in Trujillo Alto.
What is the Unemployment Rate in Trujillo Alto?
Unemployment Rate in Trujillo Alto is 7.7%.