San Sebastian, PR Map & Demographics
San Sebastian Overview
$13,835
PER CAPITA INCOME
$26,585
AVG FAMILY INCOME
$18,806
AVG HOUSEHOLD INCOME
22.9%
WAGE / INCOME GAP [ % ]
77.1¢/ $1
WAGE / INCOME GAP [ $ ]
$12,724
FAMILY INCOME DEFICIT
0.59
INEQUALITY / GINI INDEX
9,041
TOTAL POPULATION
4,075
MALE POPULATION
4,966
FEMALE POPULATION
82.06
MALES / 100 FEMALES
121.87
FEMALES / 100 MALES
43.9
MEDIAN AGE
3.6
AVG FAMILY SIZE
2.8
AVG HOUSEHOLD SIZE
2,746
LABOR FORCE [ PEOPLE ]
36.6%
PERCENT IN LABOR FORCE
17.4%
UNEMPLOYMENT RATE
San Sebastian Zip Codes
San Sebastian Area Codes
Income in San Sebastian
Income Overview in San Sebastian
Per Capita Income in San Sebastian is $13,835, while median incomes of families and households are $26,585 and $18,806 respectively.
| Characteristic | Number | Measure |
| Per Capita Income | 9,041 | $13,835 |
| Median Family Income | 2,093 | $26,585 |
| Mean Family Income | 2,093 | $40,782 |
| Median Household Income | 3,191 | $18,806 |
| Mean Household Income | 3,191 | $32,470 |
| Income Deficit | 2,093 | $12,724 |
| Wage / Income Gap (%) | 9,041 | 22.91% |
| Wage / Income Gap ($) | 9,041 | 77.09¢ per $1 |
| Gini / Inequality Index | 9,041 | 0.59 |
Earnings by Sex in San Sebastian
Average Earnings in San Sebastian are $16,595, $14,673 for men and $19,033 for women, a difference of 22.9%.
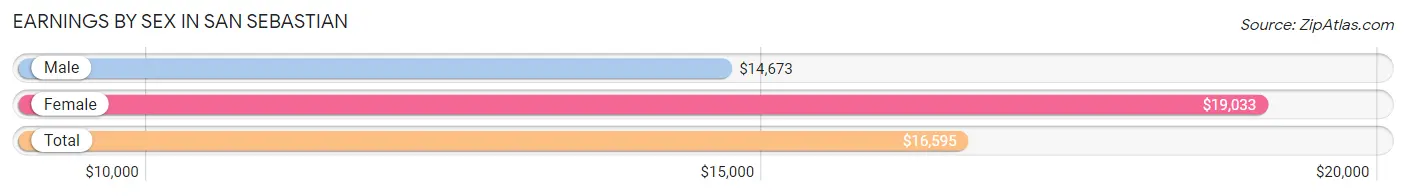
| Sex | Number | Average Earnings |
| Male | 1,576 (59.8%) | $14,673 |
| Female | 1,061 (40.2%) | $19,033 |
| Total | 2,637 (100.0%) | $16,595 |
Earnings by Sex by Income Bracket in San Sebastian
The most common earnings brackets in San Sebastian are $12,500 to $14,999 for men (237 | 15.0%) and $25,000 to $29,999 for women (204 | 19.2%).
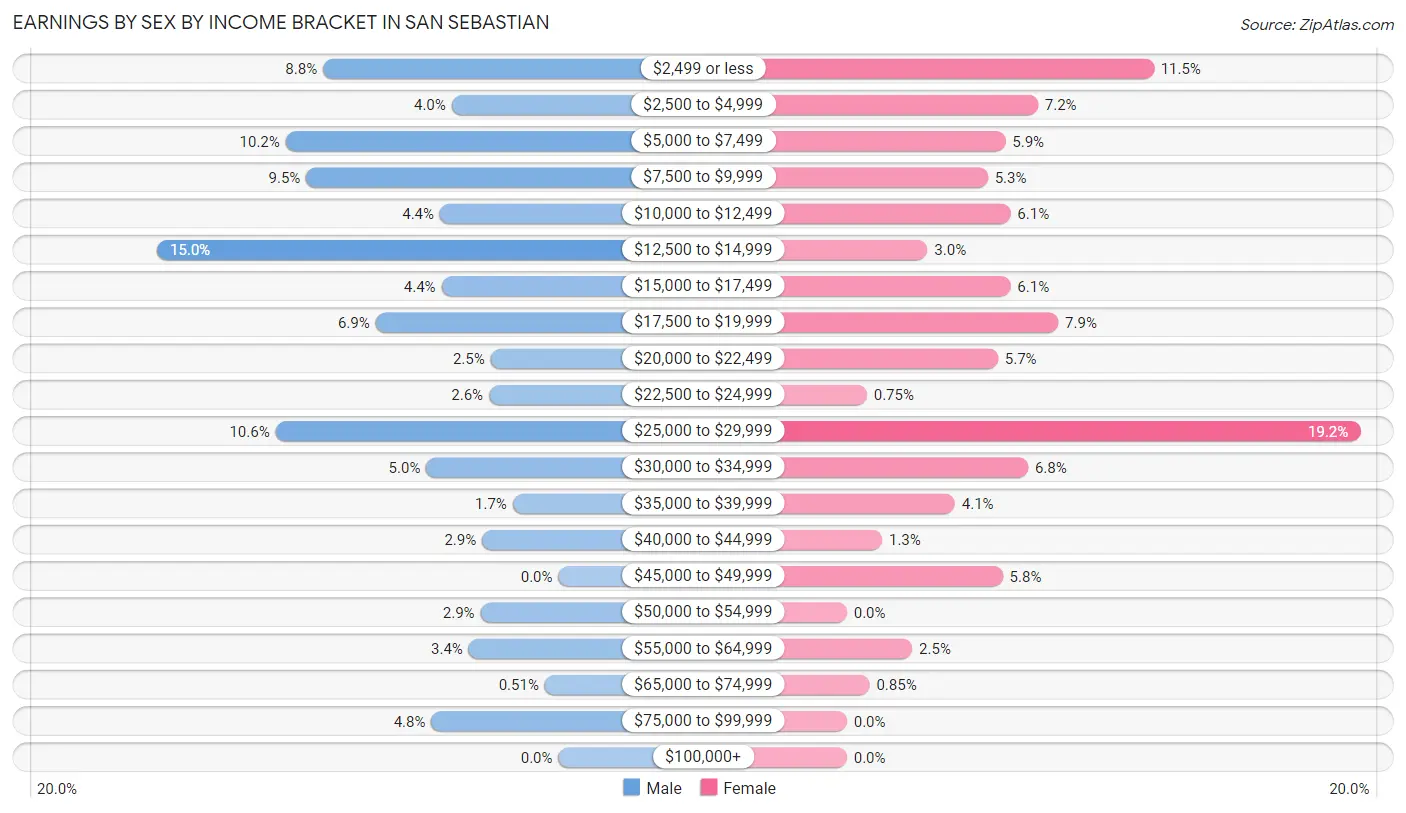
| Income | Male | Female |
| $2,499 or less | 139 (8.8%) | 122 (11.5%) |
| $2,500 to $4,999 | 63 (4.0%) | 76 (7.2%) |
| $5,000 to $7,499 | 161 (10.2%) | 63 (5.9%) |
| $7,500 to $9,999 | 149 (9.5%) | 56 (5.3%) |
| $10,000 to $12,499 | 70 (4.4%) | 65 (6.1%) |
| $12,500 to $14,999 | 237 (15.0%) | 32 (3.0%) |
| $15,000 to $17,499 | 69 (4.4%) | 65 (6.1%) |
| $17,500 to $19,999 | 108 (6.9%) | 84 (7.9%) |
| $20,000 to $22,499 | 40 (2.5%) | 60 (5.7%) |
| $22,500 to $24,999 | 41 (2.6%) | 8 (0.7%) |
| $25,000 to $29,999 | 167 (10.6%) | 204 (19.2%) |
| $30,000 to $34,999 | 78 (5.0%) | 72 (6.8%) |
| $35,000 to $39,999 | 27 (1.7%) | 43 (4.1%) |
| $40,000 to $44,999 | 45 (2.9%) | 14 (1.3%) |
| $45,000 to $49,999 | 0 (0.0%) | 62 (5.8%) |
| $50,000 to $54,999 | 46 (2.9%) | 0 (0.0%) |
| $55,000 to $64,999 | 53 (3.4%) | 26 (2.5%) |
| $65,000 to $74,999 | 8 (0.5%) | 9 (0.9%) |
| $75,000 to $99,999 | 75 (4.8%) | 0 (0.0%) |
| $100,000+ | 0 (0.0%) | 0 (0.0%) |
| Total | 1,576 (100.0%) | 1,061 (100.0%) |
Earnings by Sex by Educational Attainment in San Sebastian
Average earnings in San Sebastian are $16,014 for men and $19,420 for women, a difference of 17.5%. Men with an educational attainment of bachelor's degree enjoy the highest average annual earnings of $26,675, while those with high school diploma education earn the least with $14,236. Women with an educational attainment of graduate degree earn the most with the average annual earnings of $32,024, while those with less than high school education have the smallest earnings of $6,890.
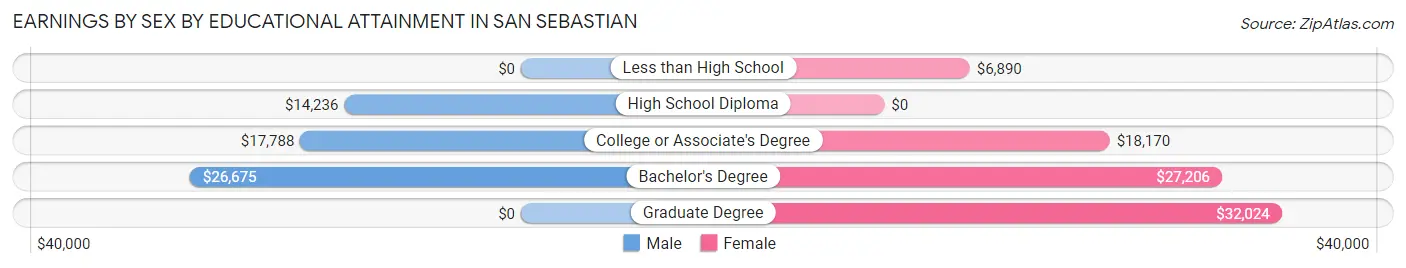
| Educational Attainment | Male Income | Female Income |
| Less than High School | - | - |
| High School Diploma | $14,236 | $0 |
| College or Associate's Degree | $17,788 | $18,170 |
| Bachelor's Degree | $26,675 | $27,206 |
| Graduate Degree | - | - |
| Total | $16,014 | $19,420 |
Family Income in San Sebastian
Family Income Brackets in San Sebastian
According to the San Sebastian family income data, there are 544 families falling into the less than $10,000 income range, which is the most common income bracket and makes up 26.0% of all families.
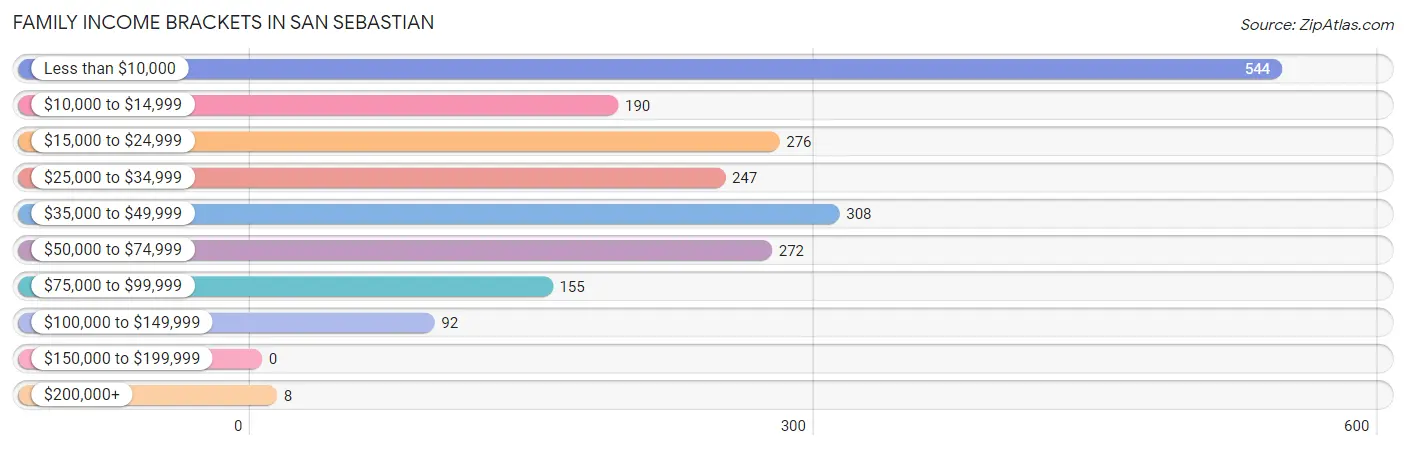
| Income Bracket | # Families | % Families |
| Less than $10,000 | 544 | 26.0% |
| $10,000 to $14,999 | 190 | 9.1% |
| $15,000 to $24,999 | 276 | 13.2% |
| $25,000 to $34,999 | 247 | 11.8% |
| $35,000 to $49,999 | 308 | 14.7% |
| $50,000 to $74,999 | 272 | 13.0% |
| $75,000 to $99,999 | 155 | 7.4% |
| $100,000 to $149,999 | 92 | 4.4% |
| $150,000 to $199,999 | 0 | 0.0% |
| $200,000+ | 8 | 0.4% |
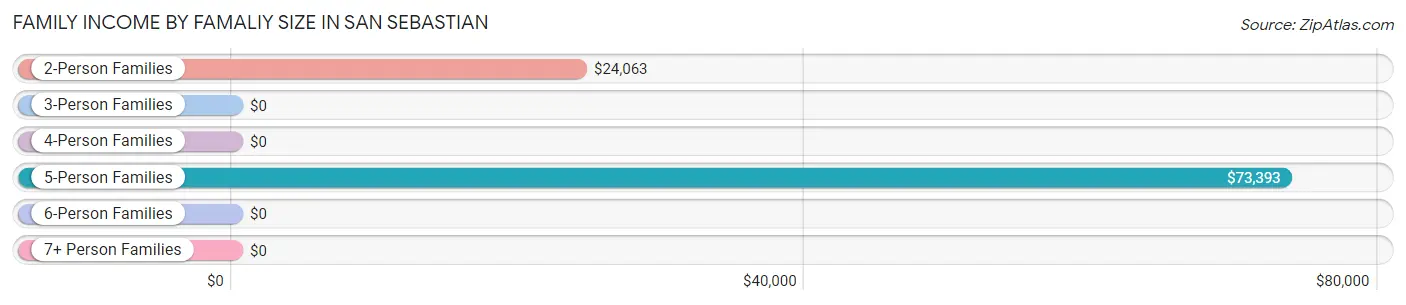
Family Income by Famaliy Size in San Sebastian
5-person families (55 | 2.6%) account for the highest median family income in San Sebastian with $73,393 per family, while 5-person families (55 | 2.6%) have the highest median income of $14,679 per family member.
| Income Bracket | # Families | Median Income |
| 2-Person Families | 1,169 (55.8%) | $24,063 |
| 3-Person Families | 503 (24.0%) | $0 |
| 4-Person Families | 333 (15.9%) | $0 |
| 5-Person Families | 55 (2.6%) | $73,393 |
| 6-Person Families | 14 (0.7%) | $0 |
| 7+ Person Families | 19 (0.9%) | $0 |
| Total | 2,093 (100.0%) | $26,585 |
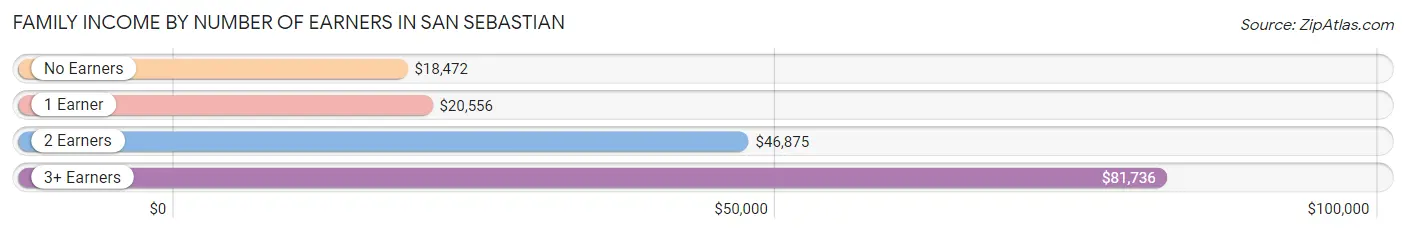
Family Income by Number of Earners in San Sebastian
The median family income in San Sebastian is $26,585, with families comprising 3+ earners (73) having the highest median family income of $81,736, while families with no earners (1,105) have the lowest median family income of $18,472, accounting for 3.5% and 52.8% of families, respectively.
| Number of Earners | # Families | Median Income |
| No Earners | 1,105 (52.8%) | $18,472 |
| 1 Earner | 560 (26.8%) | $20,556 |
| 2 Earners | 355 (17.0%) | $46,875 |
| 3+ Earners | 73 (3.5%) | $81,736 |
| Total | 2,093 (100.0%) | $26,585 |
Household Income in San Sebastian
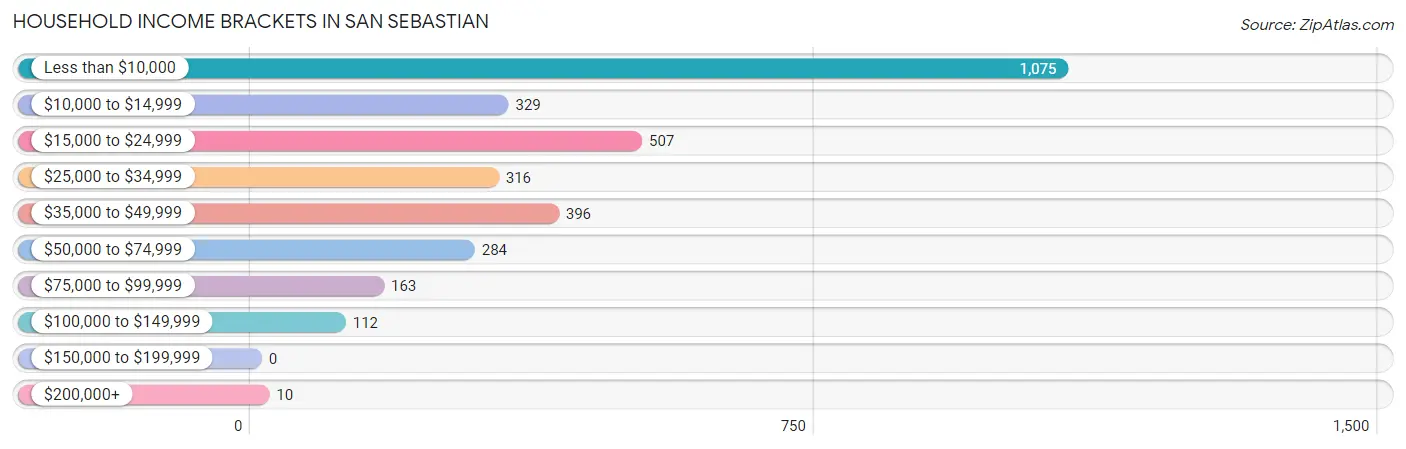
Household Income Brackets in San Sebastian
With 1,075 households falling in the category, the less than $10,000 income range is the most frequent in San Sebastian, accounting for 33.7% of all households.
| Income Bracket | # Households | % Households |
| Less than $10,000 | 1,075 | 33.7% |
| $10,000 to $14,999 | 329 | 10.3% |
| $15,000 to $24,999 | 507 | 15.9% |
| $25,000 to $34,999 | 316 | 9.9% |
| $35,000 to $49,999 | 396 | 12.4% |
| $50,000 to $74,999 | 284 | 8.9% |
| $75,000 to $99,999 | 163 | 5.1% |
| $100,000 to $149,999 | 112 | 3.5% |
| $150,000 to $199,999 | 0 | 0.0% |
| $200,000+ | 10 | 0.3% |
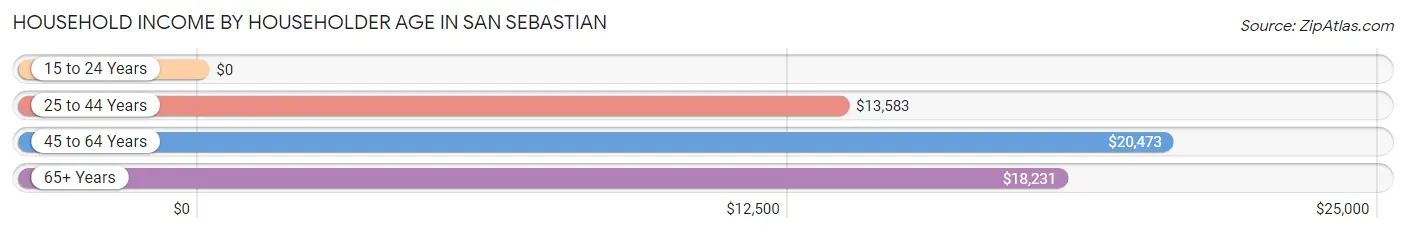
Household Income by Householder Age in San Sebastian
The median household income in San Sebastian is $18,806, with the highest median household income of $20,473 found in the 45 to 64 years age bracket for the primary householder. A total of 1,061 households (33.3%) fall into this category. Meanwhile, the 15 to 24 years age bracket for the primary householder has the lowest median household income of $0, with 22 households (0.7%) in this group.
| Income Bracket | # Households | Median Income |
| 15 to 24 Years | 22 (0.7%) | $0 |
| 25 to 44 Years | 635 (19.9%) | $13,583 |
| 45 to 64 Years | 1,061 (33.3%) | $20,473 |
| 65+ Years | 1,473 (46.2%) | $18,231 |
| Total | 3,191 (100.0%) | $18,806 |
Poverty in San Sebastian
Income Below Poverty by Sex and Age in San Sebastian
With 46.0% poverty level for males and 53.9% for females among the residents of San Sebastian, 5 year old males and 5 year old females are the most vulnerable to poverty, with 46 males (100.0%) and 47 females (100.0%) in their respective age groups living below the poverty level.
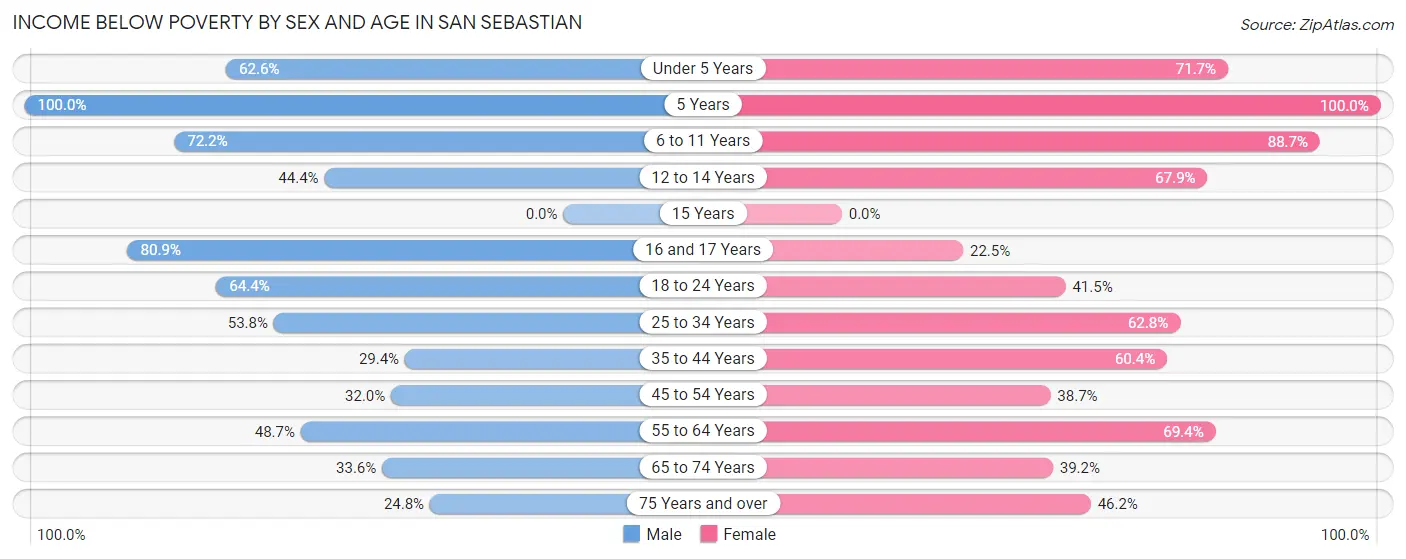
| Age Bracket | Male | Female |
| Under 5 Years | 97 (62.6%) | 230 (71.7%) |
| 5 Years | 46 (100.0%) | 47 (100.0%) |
| 6 to 11 Years | 252 (72.2%) | 236 (88.7%) |
| 12 to 14 Years | 55 (44.4%) | 114 (67.9%) |
| 15 Years | 0 (0.0%) | 0 (0.0%) |
| 16 and 17 Years | 93 (80.9%) | 18 (22.5%) |
| 18 to 24 Years | 264 (64.4%) | 191 (41.5%) |
| 25 to 34 Years | 287 (53.7%) | 317 (62.8%) |
| 35 to 44 Years | 122 (29.4%) | 338 (60.4%) |
| 45 to 54 Years | 172 (32.0%) | 223 (38.7%) |
| 55 to 64 Years | 211 (48.7%) | 360 (69.4%) |
| 65 to 74 Years | 145 (33.6%) | 260 (39.2%) |
| 75 Years and over | 130 (24.8%) | 340 (46.2%) |
| Total | 1,874 (46.0%) | 2,674 (53.9%) |
Income Above Poverty by Sex and Age in San Sebastian
According to the poverty statistics in San Sebastian, males aged 75 years and over and females aged 15 years are the age groups that are most secure financially, with 75.2% of males and 100.0% of females in these age groups living above the poverty line.
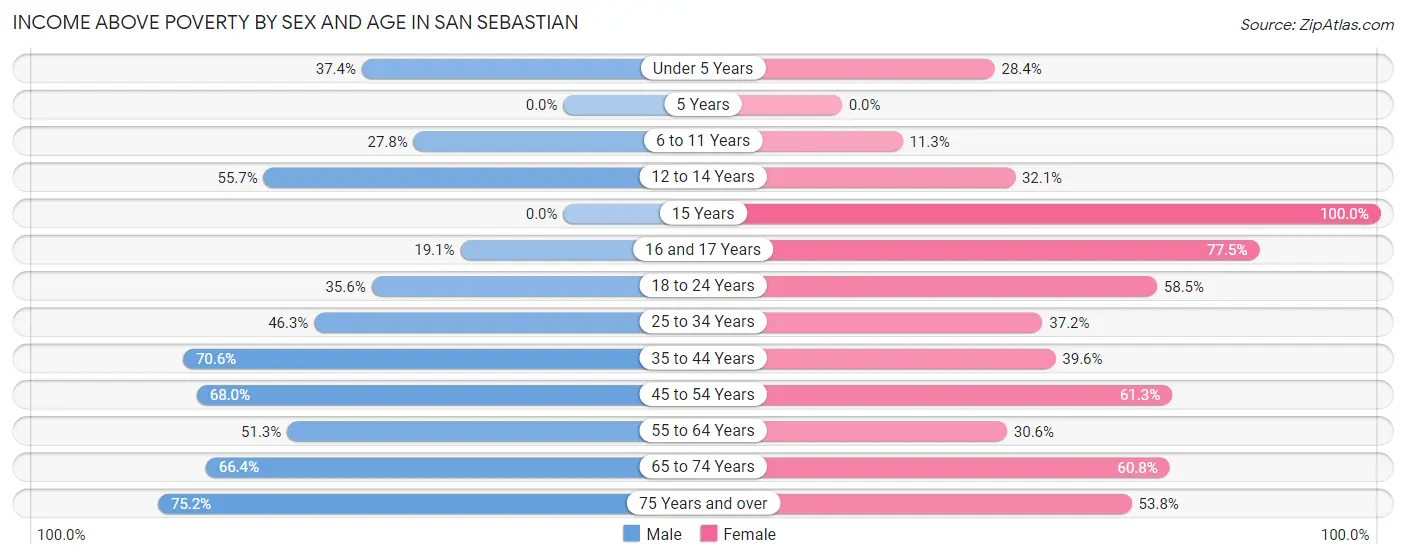
| Age Bracket | Male | Female |
| Under 5 Years | 58 (37.4%) | 91 (28.3%) |
| 5 Years | 0 (0.0%) | 0 (0.0%) |
| 6 to 11 Years | 97 (27.8%) | 30 (11.3%) |
| 12 to 14 Years | 69 (55.6%) | 54 (32.1%) |
| 15 Years | 0 (0.0%) | 61 (100.0%) |
| 16 and 17 Years | 22 (19.1%) | 62 (77.5%) |
| 18 to 24 Years | 146 (35.6%) | 269 (58.5%) |
| 25 to 34 Years | 247 (46.3%) | 188 (37.2%) |
| 35 to 44 Years | 293 (70.6%) | 222 (39.6%) |
| 45 to 54 Years | 366 (68.0%) | 353 (61.3%) |
| 55 to 64 Years | 222 (51.3%) | 159 (30.6%) |
| 65 to 74 Years | 286 (66.4%) | 404 (60.8%) |
| 75 Years and over | 395 (75.2%) | 396 (53.8%) |
| Total | 2,201 (54.0%) | 2,289 (46.1%) |
Income Below Poverty Among Married-Couple Families in San Sebastian
The poverty statistics for married-couple families in San Sebastian show that 26.3% or 301 of the total 1,143 families live below the poverty line. Families with 3 or 4 children have the highest poverty rate of 45.2%, comprising of 19 families. On the other hand, families with 1 or 2 children have the lowest poverty rate of 18.1%, which includes 37 families.
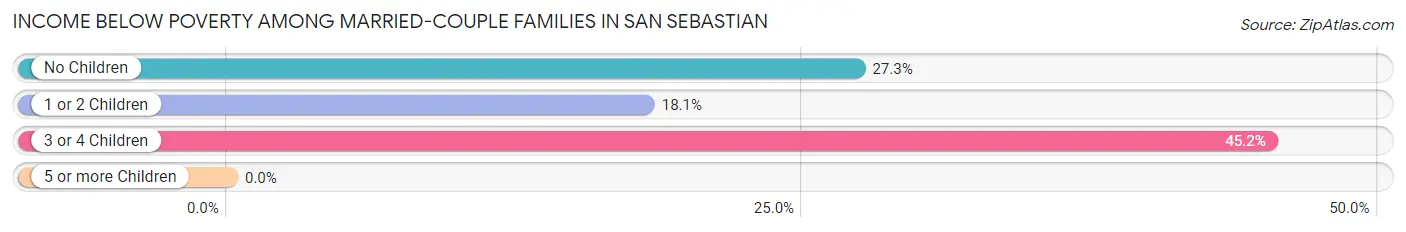
| Children | Above Poverty | Below Poverty |
| No Children | 652 (72.7%) | 245 (27.3%) |
| 1 or 2 Children | 167 (81.9%) | 37 (18.1%) |
| 3 or 4 Children | 23 (54.8%) | 19 (45.2%) |
| 5 or more Children | 0 (0.0%) | 0 (0.0%) |
| Total | 842 (73.7%) | 301 (26.3%) |
Income Below Poverty Among Single-Parent Households in San Sebastian
According to the poverty data in San Sebastian, 73.6% or 67 single-father households and 66.9% or 575 single-mother households are living below the poverty line. Among single-father households, those with no children have the highest poverty rate, with 15 households (100.0%) experiencing poverty. Likewise, among single-mother households, those with 3 or 4 children have the highest poverty rate, with 48 households (100.0%) falling below the poverty line.
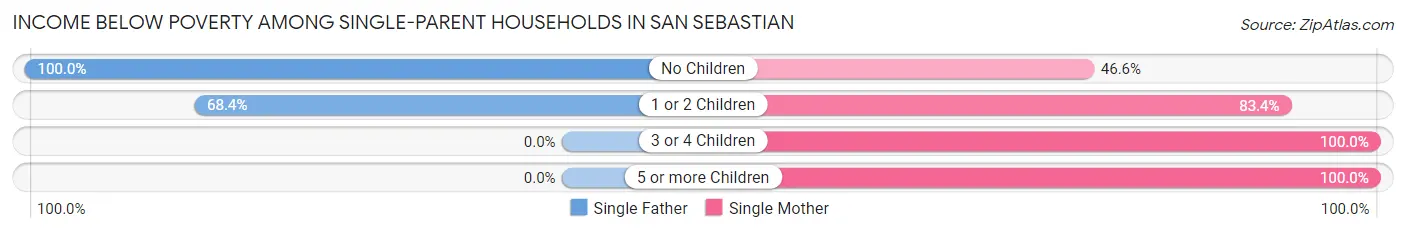
| Children | Single Father | Single Mother |
| No Children | 15 (100.0%) | 192 (46.6%) |
| 1 or 2 Children | 52 (68.4%) | 321 (83.4%) |
| 3 or 4 Children | 0 (0.0%) | 48 (100.0%) |
| 5 or more Children | 0 (0.0%) | 14 (100.0%) |
| Total | 67 (73.6%) | 575 (66.9%) |
Income Below Poverty Among Married-Couple vs Single-Parent Households in San Sebastian
The poverty data for San Sebastian shows that 301 of the married-couple family households (26.3%) and 642 of the single-parent households (67.6%) are living below the poverty level. Within the married-couple family households, those with 3 or 4 children have the highest poverty rate, with 19 households (45.2%) falling below the poverty line. Among the single-parent households, those with 3 or 4 children have the highest poverty rate, with 48 household (100.0%) living below poverty.
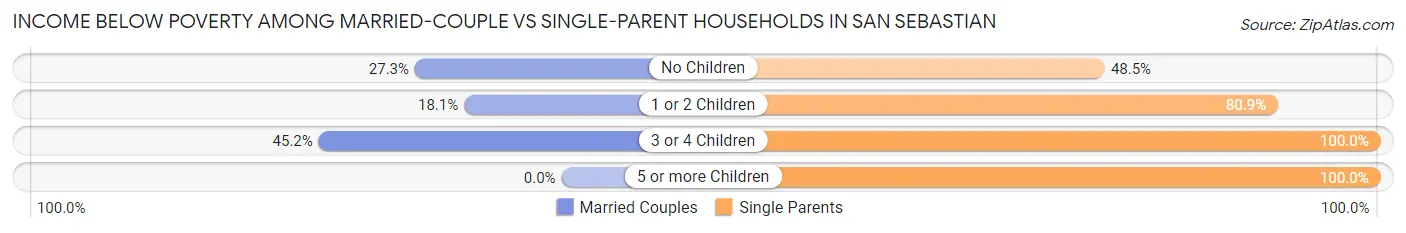
| Children | Married-Couple Families | Single-Parent Households |
| No Children | 245 (27.3%) | 207 (48.5%) |
| 1 or 2 Children | 37 (18.1%) | 373 (80.9%) |
| 3 or 4 Children | 19 (45.2%) | 48 (100.0%) |
| 5 or more Children | 0 (0.0%) | 14 (100.0%) |
| Total | 301 (26.3%) | 642 (67.6%) |
Race in San Sebastian
The most populous races in San Sebastian are Hispanic or Latino (8,758 | 96.9%), White / Caucasian (6,699 | 74.1%), and Some other Race (1,066 | 11.8%).
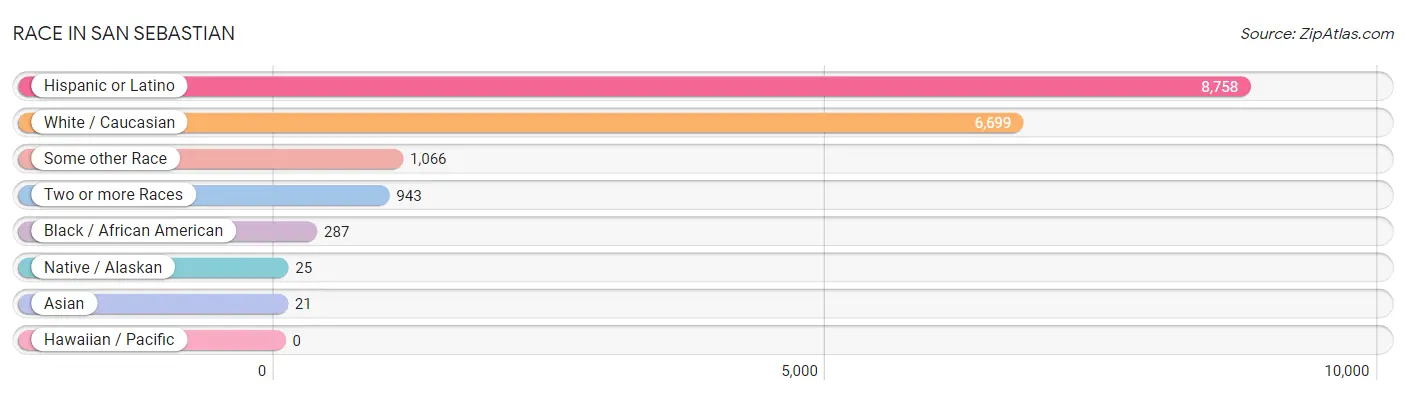
| Race | # Population | % Population |
| Asian | 21 | 0.2% |
| Black / African American | 287 | 3.2% |
| Hawaiian / Pacific | 0 | 0.0% |
| Hispanic or Latino | 8,758 | 96.9% |
| Native / Alaskan | 25 | 0.3% |
| White / Caucasian | 6,699 | 74.1% |
| Two or more Races | 943 | 10.4% |
| Some other Race | 1,066 | 11.8% |
| Total | 9,041 | 100.0% |
Ancestry in San Sebastian
The most populous ancestries reported in San Sebastian are Puerto Rican (8,580 | 94.9%), Central American Indian (524 | 5.8%), Mexican (90 | 1.0%), American (84 | 0.9%), and Dominican (48 | 0.5%), together accounting for 103.2% of all San Sebastian residents.
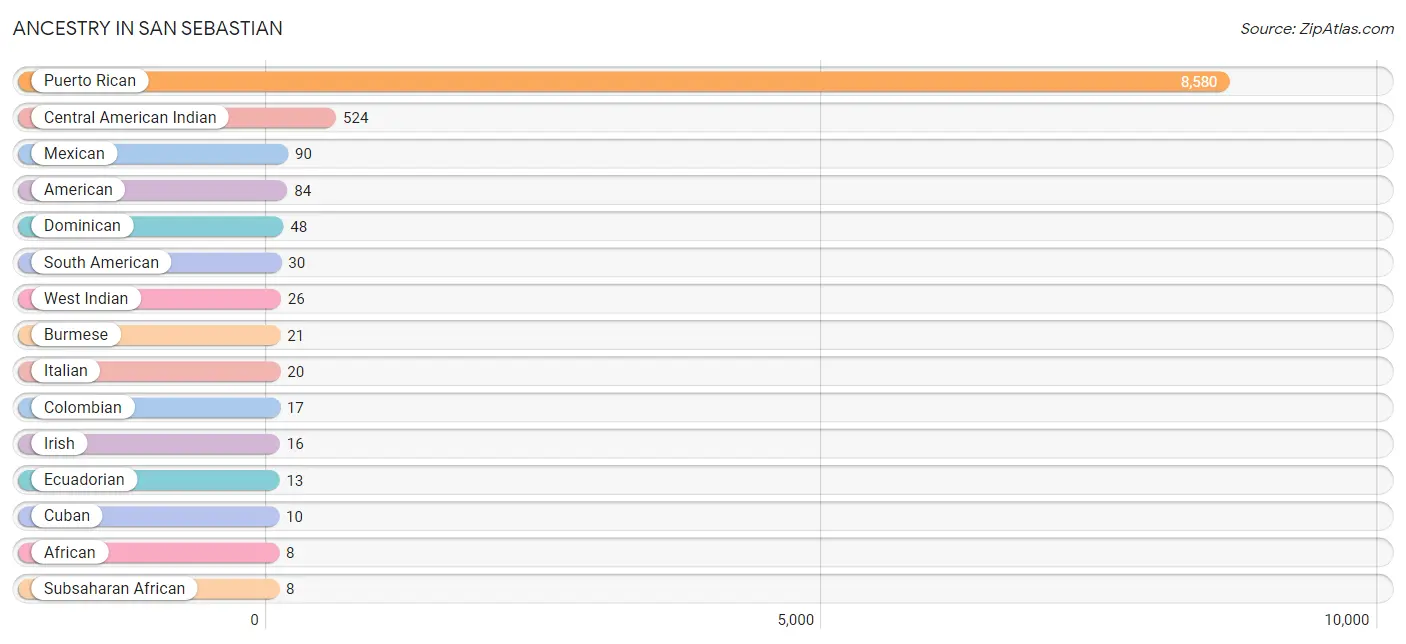
| Ancestry | # Population | % Population |
| African | 8 | 0.1% |
| American | 84 | 0.9% |
| Burmese | 21 | 0.2% |
| Central American Indian | 524 | 5.8% |
| Colombian | 17 | 0.2% |
| Cuban | 10 | 0.1% |
| Dominican | 48 | 0.5% |
| Ecuadorian | 13 | 0.1% |
| Irish | 16 | 0.2% |
| Italian | 20 | 0.2% |
| Mexican | 90 | 1.0% |
| Puerto Rican | 8,580 | 94.9% |
| South American | 30 | 0.3% |
| Subsaharan African | 8 | 0.1% |
| West Indian | 26 | 0.3% | View All 15 Rows |
Immigrants in San Sebastian

| Immigration Origin | # Population | % Population | View All 0 Rows |
Sex and Age in San Sebastian
Sex and Age in San Sebastian
The most populous age groups in San Sebastian are 25 to 29 Years (395 | 9.7%) for men and 65 to 69 Years (367 | 7.4%) for women.
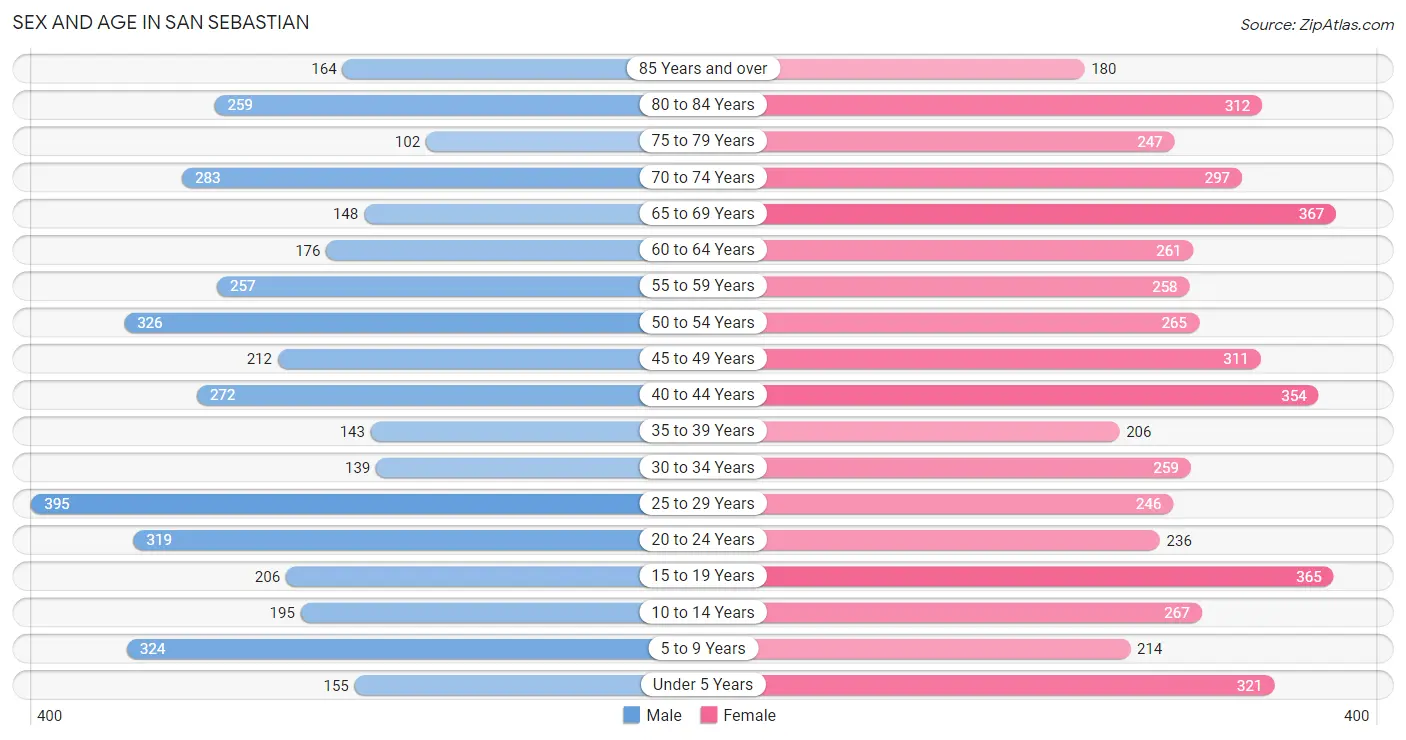
| Age Bracket | Male | Female |
| Under 5 Years | 155 (3.8%) | 321 (6.5%) |
| 5 to 9 Years | 324 (8.0%) | 214 (4.3%) |
| 10 to 14 Years | 195 (4.8%) | 267 (5.4%) |
| 15 to 19 Years | 206 (5.1%) | 365 (7.3%) |
| 20 to 24 Years | 319 (7.8%) | 236 (4.8%) |
| 25 to 29 Years | 395 (9.7%) | 246 (5.0%) |
| 30 to 34 Years | 139 (3.4%) | 259 (5.2%) |
| 35 to 39 Years | 143 (3.5%) | 206 (4.2%) |
| 40 to 44 Years | 272 (6.7%) | 354 (7.1%) |
| 45 to 49 Years | 212 (5.2%) | 311 (6.3%) |
| 50 to 54 Years | 326 (8.0%) | 265 (5.3%) |
| 55 to 59 Years | 257 (6.3%) | 258 (5.2%) |
| 60 to 64 Years | 176 (4.3%) | 261 (5.3%) |
| 65 to 69 Years | 148 (3.6%) | 367 (7.4%) |
| 70 to 74 Years | 283 (6.9%) | 297 (6.0%) |
| 75 to 79 Years | 102 (2.5%) | 247 (5.0%) |
| 80 to 84 Years | 259 (6.4%) | 312 (6.3%) |
| 85 Years and over | 164 (4.0%) | 180 (3.6%) |
| Total | 4,075 (100.0%) | 4,966 (100.0%) |
Families and Households in San Sebastian
Median Family Size in San Sebastian
The median family size in San Sebastian is 3.62 persons per family, with single female/mother families (859 | 41.0%) accounting for the largest median family size of 4.14 persons per family. On the other hand, married-couple families (1,143 | 54.6%) represent the smallest median family size with 3.26 persons per family.
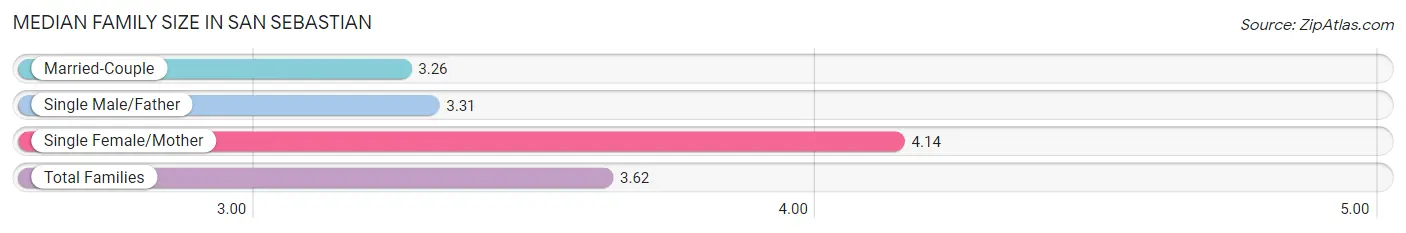
| Family Type | # Families | Family Size |
| Married-Couple | 1,143 (54.6%) | 3.26 |
| Single Male/Father | 91 (4.3%) | 3.31 |
| Single Female/Mother | 859 (41.0%) | 4.14 |
| Total Families | 2,093 (100.0%) | 3.62 |
Median Household Size in San Sebastian
The median household size in San Sebastian is 2.83 persons per household, with single female/mother households (859 | 26.9%) accounting for the largest median household size of 4.29 persons per household. non-family households (1,098 | 34.4%) represent the smallest median household size with 1.14 persons per household.
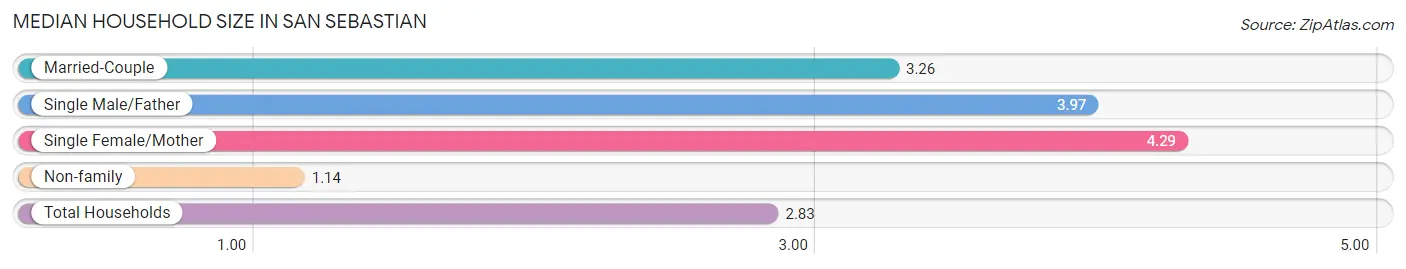
| Household Type | # Households | Household Size |
| Married-Couple | 1,143 (35.8%) | 3.26 |
| Single Male/Father | 91 (2.9%) | 3.97 |
| Single Female/Mother | 859 (26.9%) | 4.29 |
| Non-family | 1,098 (34.4%) | 1.14 |
| Total Households | 3,191 (100.0%) | 2.83 |
Household Size by Marriage Status in San Sebastian
Out of a total of 3,191 households in San Sebastian, 2,093 (65.6%) are family households, while 1,098 (34.4%) are nonfamily households. The most numerous type of family households are 2-person households, comprising 1,074, and the most common type of nonfamily households are 1-person households, comprising 963.
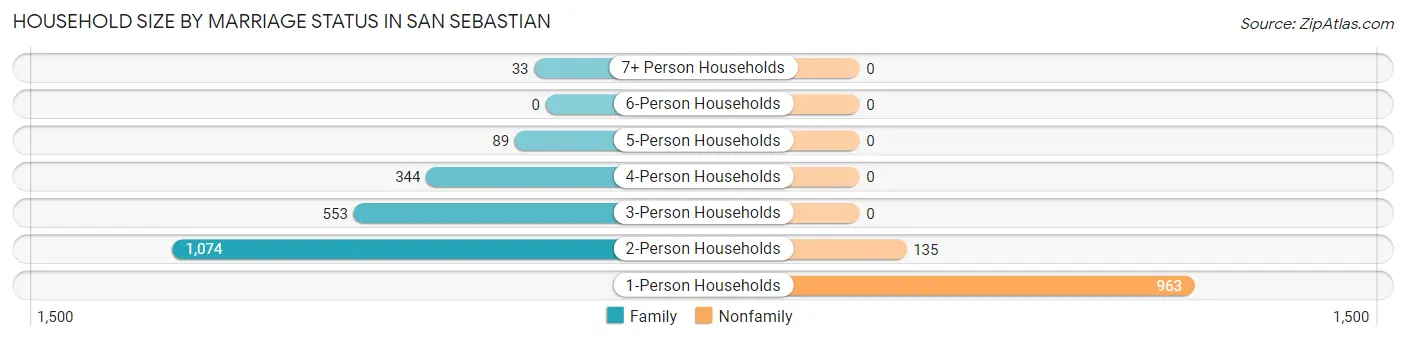
| Household Size | Family Households | Nonfamily Households |
| 1-Person Households | - | 963 (30.2%) |
| 2-Person Households | 1,074 (33.7%) | 135 (4.2%) |
| 3-Person Households | 553 (17.3%) | 0 (0.0%) |
| 4-Person Households | 344 (10.8%) | 0 (0.0%) |
| 5-Person Households | 89 (2.8%) | 0 (0.0%) |
| 6-Person Households | 0 (0.0%) | 0 (0.0%) |
| 7+ Person Households | 33 (1.0%) | 0 (0.0%) |
| Total | 2,093 (65.6%) | 1,098 (34.4%) |
Female Fertility in San Sebastian
Fertility by Age in San Sebastian
Average fertility rate in San Sebastian is 27.0 births per 1,000 women. Women in the age bracket of 15 to 19 years have the highest fertility rate with 77.0 births per 1,000 women. Women in the age bracket of 15 to 19 years acount for 50.0% of all women with births.
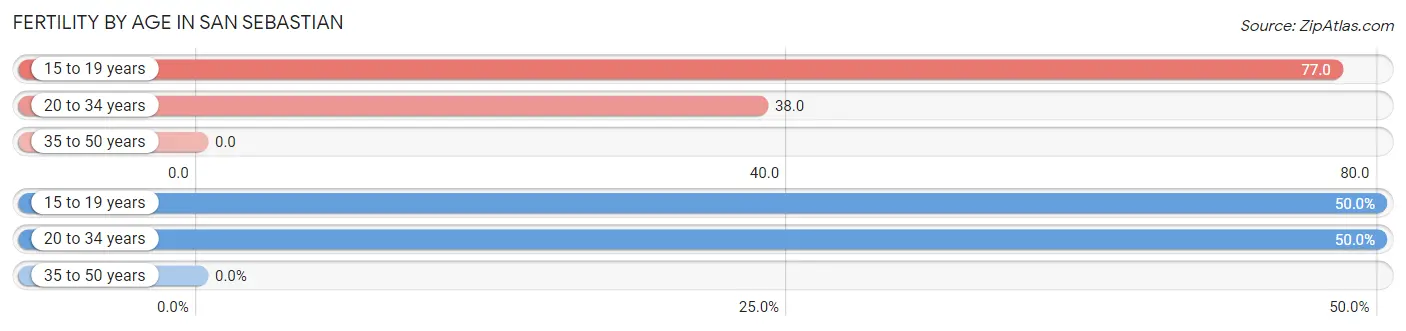
| Age Bracket | Women with Births | Births / 1,000 Women |
| 15 to 19 years | 28 (50.0%) | 77.0 |
| 20 to 34 years | 28 (50.0%) | 38.0 |
| 35 to 50 years | 0 (0.0%) | 0.0 |
| Total | 56 (100.0%) | 27.0 |
Fertility by Age by Marriage Status in San Sebastian
50.0% of women with births (56) in San Sebastian are married. The highest percentage of unmarried women with births falls into 15 to 19 years age bracket with 100.0% of them unmarried at the time of birth, while the lowest percentage of unmarried women with births belong to 20 to 34 years age bracket with 0.0% of them unmarried.
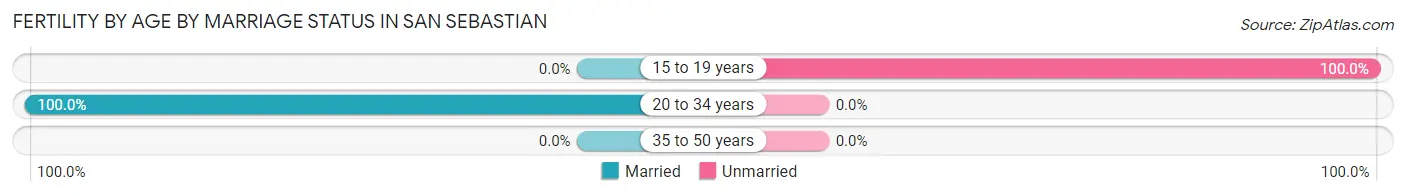
| Age Bracket | Married | Unmarried |
| 15 to 19 years | 0 (0.0%) | 28 (100.0%) |
| 20 to 34 years | 28 (100.0%) | 0 (0.0%) |
| 35 to 50 years | 0 (0.0%) | 0 (0.0%) |
| Total | 28 (50.0%) | 28 (50.0%) |
Fertility by Education in San Sebastian
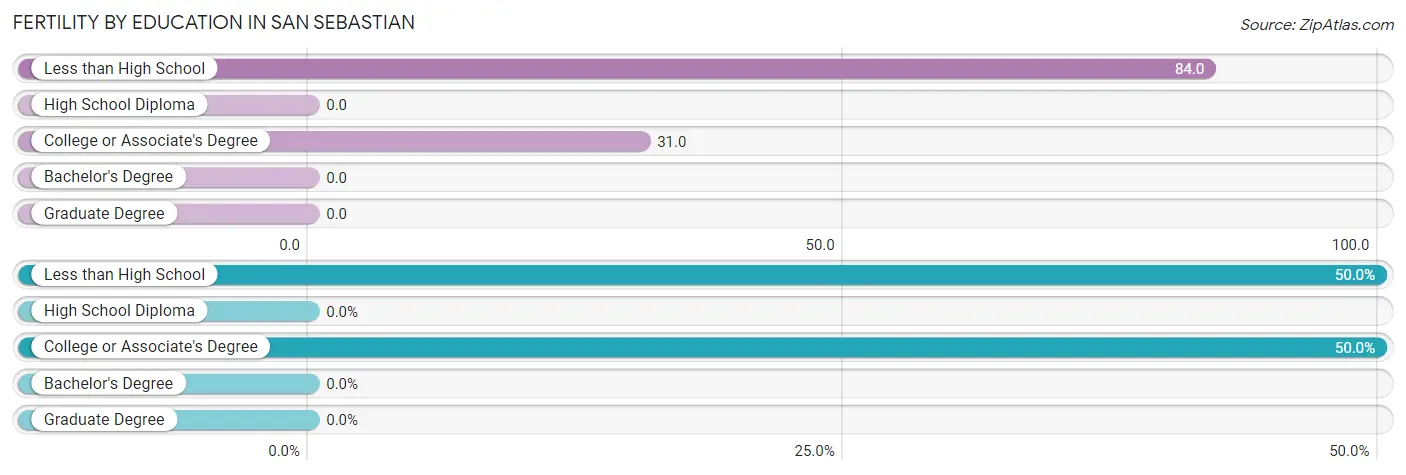
| Educational Attainment | Women with Births | Births / 1,000 Women |
| Less than High School | 28 (50.0%) | 84.0 |
| High School Diploma | 0 (0.0%) | 0.0 |
| College or Associate's Degree | 28 (50.0%) | 31.0 |
| Bachelor's Degree | 0 (0.0%) | 0.0 |
| Graduate Degree | 0 (0.0%) | 0.0 |
| Total | 56 (100.0%) | 27.0 |
Fertility by Education by Marriage Status in San Sebastian
50.0% of women with births in San Sebastian are unmarried. Women with the educational attainment of college or associate's degree are most likely to be married with 100.0% of them married at childbirth, while women with the educational attainment of less than high school are least likely to be married with 100.0% of them unmarried at childbirth.
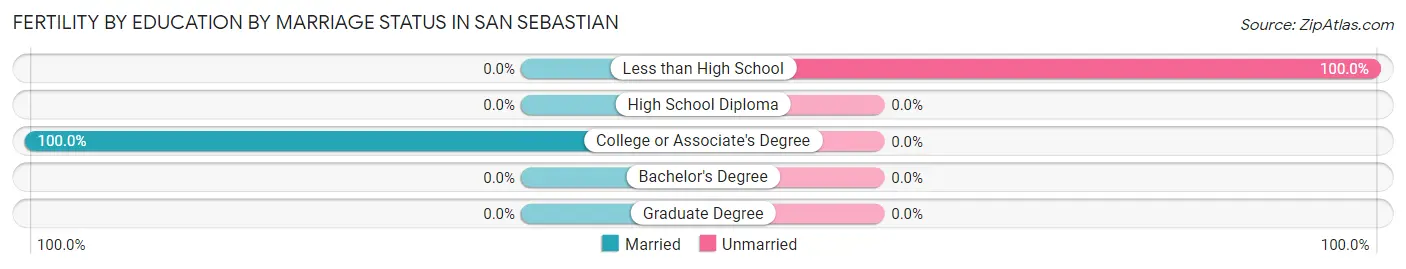
| Educational Attainment | Married | Unmarried |
| Less than High School | 0 (0.0%) | 28 (100.0%) |
| High School Diploma | 0 (0.0%) | 0 (0.0%) |
| College or Associate's Degree | 28 (100.0%) | 0 (0.0%) |
| Bachelor's Degree | 0 (0.0%) | 0 (0.0%) |
| Graduate Degree | 0 (0.0%) | 0 (0.0%) |
| Total | 28 (50.0%) | 28 (50.0%) |
Employment Characteristics in San Sebastian
Employment by Class of Employer in San Sebastian
Among the 2,213 employed individuals in San Sebastian, private company employees (1,283 | 58.0%), state government employees (364 | 16.5%), and local government employees (211 | 9.5%) make up the most common classes of employment.
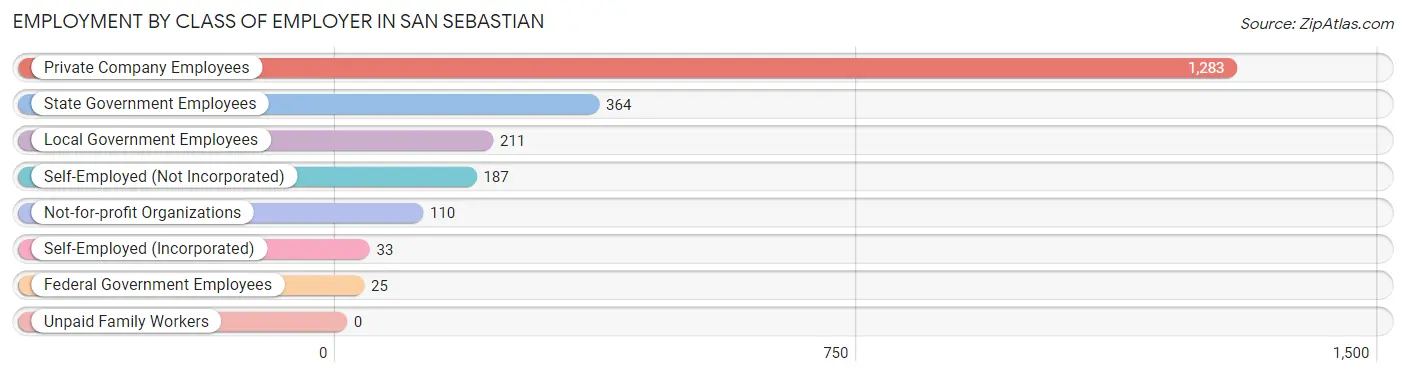
| Employer Class | # Employees | % Employees |
| Private Company Employees | 1,283 | 58.0% |
| Self-Employed (Incorporated) | 33 | 1.5% |
| Self-Employed (Not Incorporated) | 187 | 8.5% |
| Not-for-profit Organizations | 110 | 5.0% |
| Local Government Employees | 211 | 9.5% |
| State Government Employees | 364 | 16.5% |
| Federal Government Employees | 25 | 1.1% |
| Unpaid Family Workers | 0 | 0.0% |
| Total | 2,213 | 100.0% |
Employment Status by Age in San Sebastian
According to the labor force statistics for San Sebastian, out of the total population over 16 years of age (7,504), 36.6% or 2,746 individuals are in the labor force, with 17.4% or 478 of them unemployed. The age group with the highest labor force participation rate is 35 to 44 years, with 77.0% or 751 individuals in the labor force. Within the labor force, the 25 to 29 years age range has the highest percentage of unemployed individuals, with 29.9% or 114 of them being unemployed.
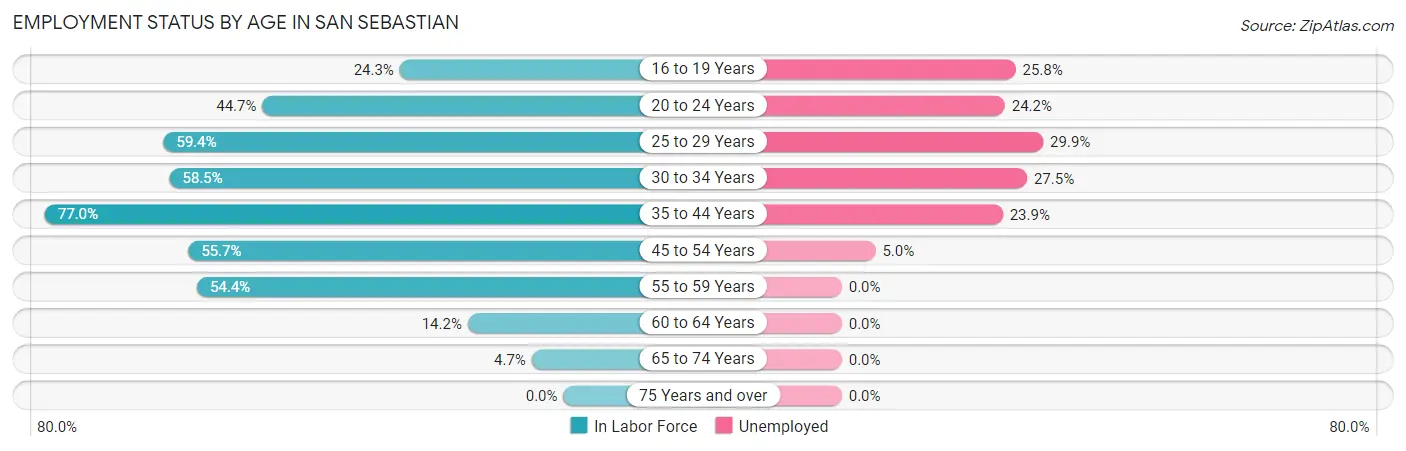
| Age Bracket | In Labor Force | Unemployed |
| 16 to 19 Years | 124 (24.3%) | 32 (25.8%) |
| 20 to 24 Years | 248 (44.7%) | 60 (24.2%) |
| 25 to 29 Years | 381 (59.4%) | 114 (29.9%) |
| 30 to 34 Years | 233 (58.5%) | 64 (27.5%) |
| 35 to 44 Years | 751 (77.0%) | 179 (23.9%) |
| 45 to 54 Years | 620 (55.7%) | 31 (5.0%) |
| 55 to 59 Years | 280 (54.4%) | 0 (0.0%) |
| 60 to 64 Years | 62 (14.2%) | 0 (0.0%) |
| 65 to 74 Years | 51 (4.7%) | 0 (0.0%) |
| 75 Years and over | 0 (0.0%) | 0 (0.0%) |
| Total | 2,746 (36.6%) | 478 (17.4%) |
Employment Status by Educational Attainment in San Sebastian
According to labor force statistics for San Sebastian, 57.0% of individuals (2,326) out of the total population between 25 and 64 years of age (4,080) are in the labor force, with 16.6% or 386 of them being unemployed. The group with the highest labor force participation rate are those with the educational attainment of bachelor's degree or higher, with 87.5% or 783 individuals in the labor force. Within the labor force, individuals with college / associate degree education have the highest percentage of unemployment, with 33.0% or 224 of them being unemployed.
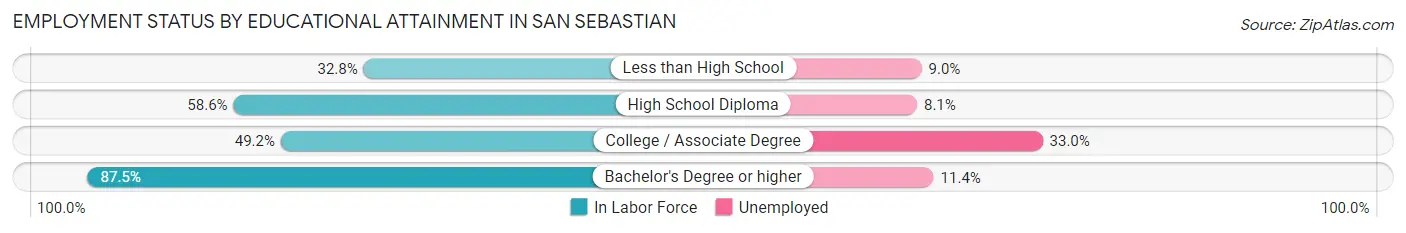
| Educational Attainment | In Labor Force | Unemployed |
| Less than High School | 244 (32.8%) | 67 (9.0%) |
| High School Diploma | 619 (58.6%) | 86 (8.1%) |
| College / Associate Degree | 680 (49.2%) | 456 (33.0%) |
| Bachelor's Degree or higher | 783 (87.5%) | 102 (11.4%) |
| Total | 2,326 (57.0%) | 677 (16.6%) |
Employment Occupations by Sex in San Sebastian
Management, Business, Science and Arts Occupations
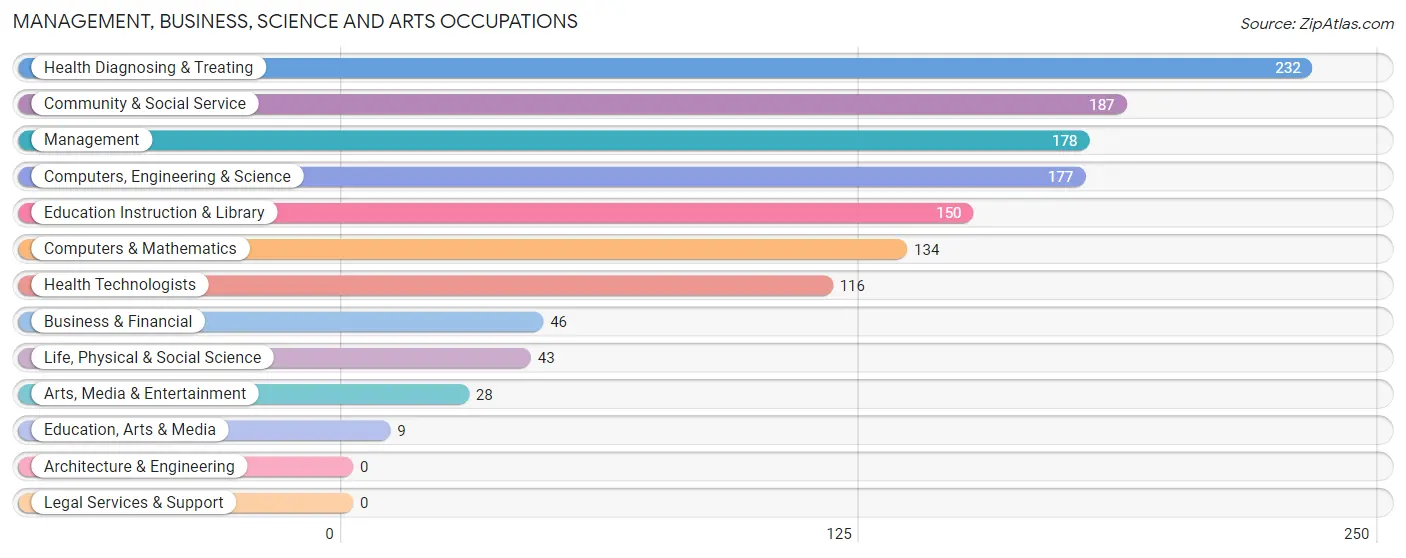
The most common Management, Business, Science and Arts occupations in San Sebastian are Health Diagnosing & Treating (232 | 10.3%), Community & Social Service (187 | 8.3%), Management (178 | 7.9%), Computers, Engineering & Science (177 | 7.9%), and Education Instruction & Library (150 | 6.7%).
Management, Business, Science and Arts Occupations by Sex
Within the Management, Business, Science and Arts occupations in San Sebastian, the most male-oriented occupations are Computers & Mathematics (100.0%), Education, Arts & Media (100.0%), and Computers, Engineering & Science (96.1%), while the most female-oriented occupations are Health Diagnosing & Treating (77.6%), Arts, Media & Entertainment (75.0%), and Health Technologists (66.4%).
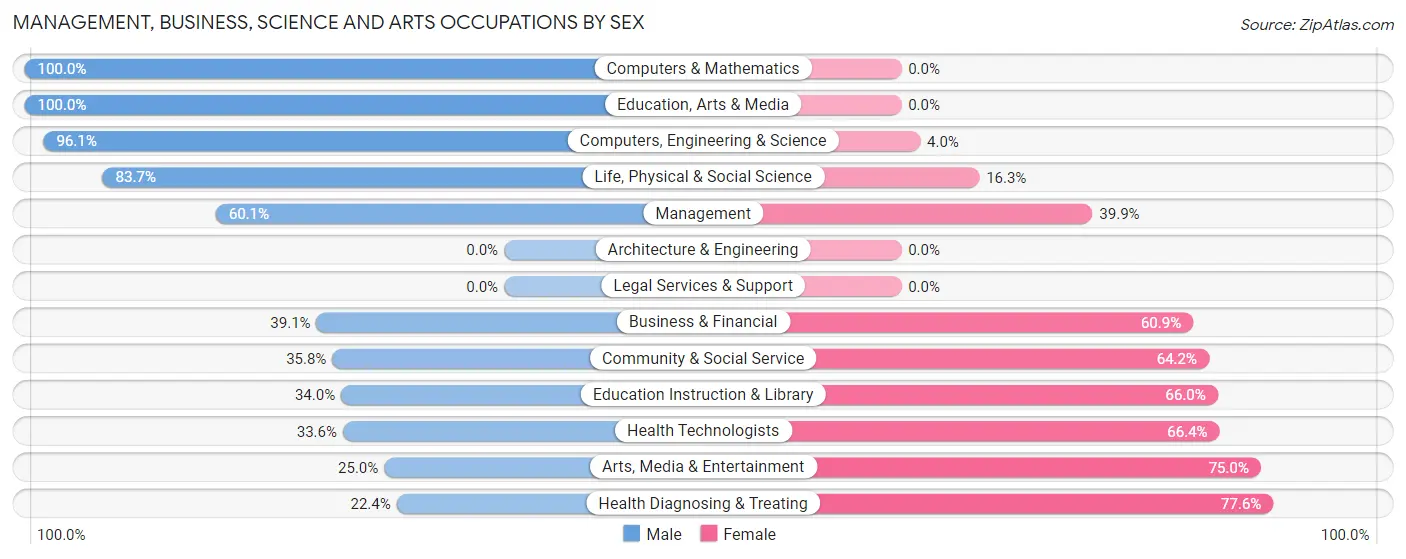
| Occupation | Male | Female |
| Management | 107 (60.1%) | 71 (39.9%) |
| Business & Financial | 18 (39.1%) | 28 (60.9%) |
| Computers, Engineering & Science | 170 (96.1%) | 7 (4.0%) |
| Computers & Mathematics | 134 (100.0%) | 0 (0.0%) |
| Architecture & Engineering | 0 (0.0%) | 0 (0.0%) |
| Life, Physical & Social Science | 36 (83.7%) | 7 (16.3%) |
| Community & Social Service | 67 (35.8%) | 120 (64.2%) |
| Education, Arts & Media | 9 (100.0%) | 0 (0.0%) |
| Legal Services & Support | 0 (0.0%) | 0 (0.0%) |
| Education Instruction & Library | 51 (34.0%) | 99 (66.0%) |
| Arts, Media & Entertainment | 7 (25.0%) | 21 (75.0%) |
| Health Diagnosing & Treating | 52 (22.4%) | 180 (77.6%) |
| Health Technologists | 39 (33.6%) | 77 (66.4%) |
| Total (Category) | 414 (50.5%) | 406 (49.5%) |
| Total (Overall) | 1,402 (62.2%) | 853 (37.8%) |
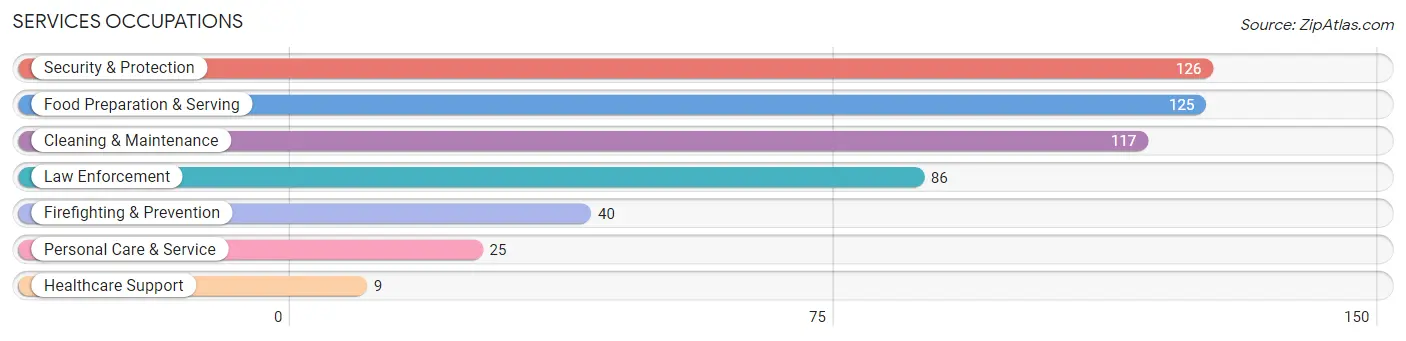
Services Occupations
The most common Services occupations in San Sebastian are Security & Protection (126 | 5.6%), Food Preparation & Serving (125 | 5.5%), Cleaning & Maintenance (117 | 5.2%), Law Enforcement (86 | 3.8%), and Firefighting & Prevention (40 | 1.8%).
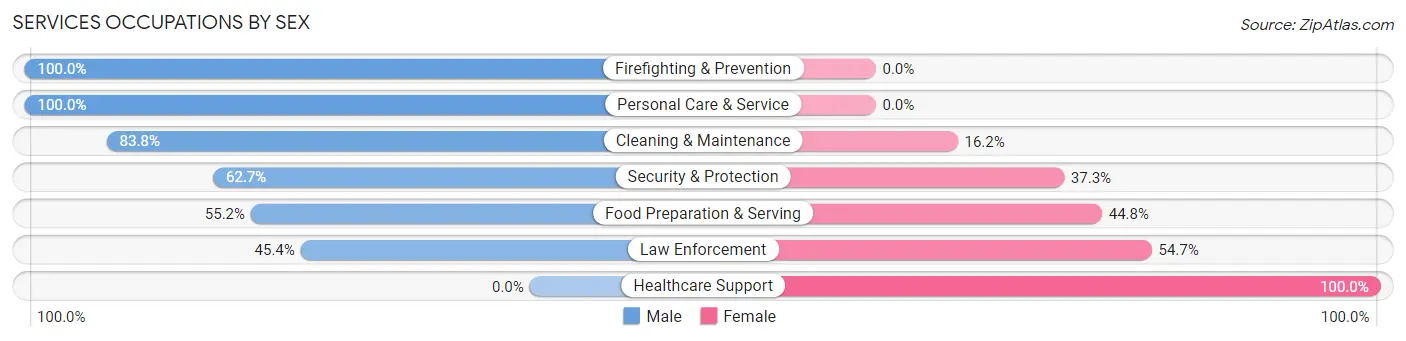
Services Occupations by Sex
Within the Services occupations in San Sebastian, the most male-oriented occupations are Firefighting & Prevention (100.0%), Personal Care & Service (100.0%), and Cleaning & Maintenance (83.8%), while the most female-oriented occupations are Healthcare Support (100.0%), Law Enforcement (54.6%), and Food Preparation & Serving (44.8%).
| Occupation | Male | Female |
| Healthcare Support | 0 (0.0%) | 9 (100.0%) |
| Security & Protection | 79 (62.7%) | 47 (37.3%) |
| Firefighting & Prevention | 40 (100.0%) | 0 (0.0%) |
| Law Enforcement | 39 (45.4%) | 47 (54.6%) |
| Food Preparation & Serving | 69 (55.2%) | 56 (44.8%) |
| Cleaning & Maintenance | 98 (83.8%) | 19 (16.2%) |
| Personal Care & Service | 25 (100.0%) | 0 (0.0%) |
| Total (Category) | 271 (67.4%) | 131 (32.6%) |
| Total (Overall) | 1,402 (62.2%) | 853 (37.8%) |
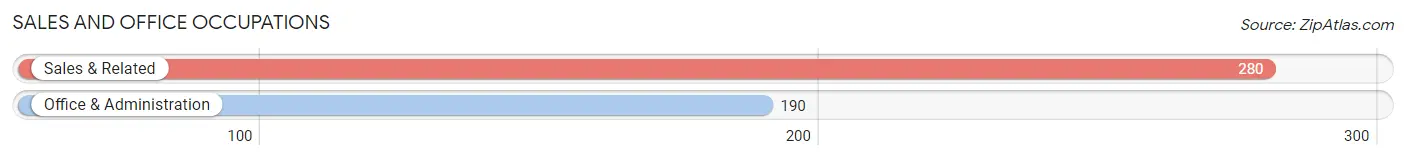
Sales and Office Occupations
The most common Sales and Office occupations in San Sebastian are Sales & Related (280 | 12.4%), and Office & Administration (190 | 8.4%).
Sales and Office Occupations by Sex
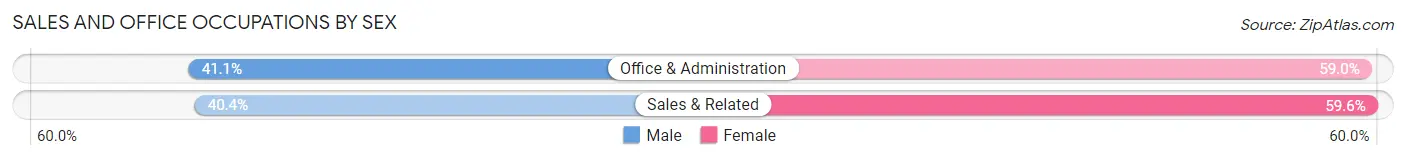
| Occupation | Male | Female |
| Sales & Related | 113 (40.4%) | 167 (59.6%) |
| Office & Administration | 78 (41.0%) | 112 (59.0%) |
| Total (Category) | 191 (40.6%) | 279 (59.4%) |
| Total (Overall) | 1,402 (62.2%) | 853 (37.8%) |
Natural Resources, Construction and Maintenance Occupations
The most common Natural Resources, Construction and Maintenance occupations in San Sebastian are Construction & Extraction (150 | 6.7%), Installation, Maintenance & Repair (103 | 4.6%), and Farming, Fishing & Forestry (66 | 2.9%).
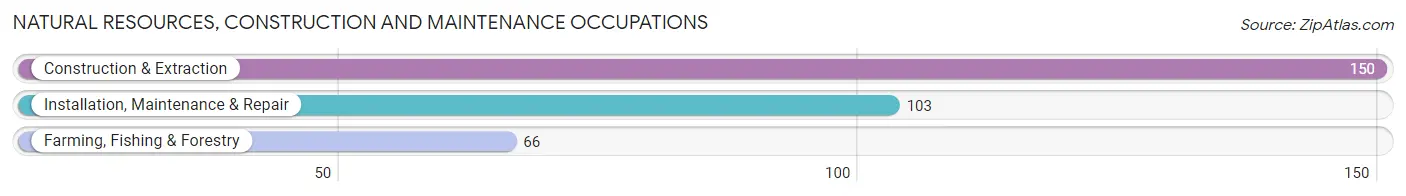
Natural Resources, Construction and Maintenance Occupations by Sex

| Occupation | Male | Female |
| Farming, Fishing & Forestry | 66 (100.0%) | 0 (0.0%) |
| Construction & Extraction | 150 (100.0%) | 0 (0.0%) |
| Installation, Maintenance & Repair | 103 (100.0%) | 0 (0.0%) |
| Total (Category) | 319 (100.0%) | 0 (0.0%) |
| Total (Overall) | 1,402 (62.2%) | 853 (37.8%) |
Production, Transportation and Moving Occupations
The most common Production, Transportation and Moving occupations in San Sebastian are Transportation (123 | 5.4%), Production (78 | 3.5%), and Material Moving (43 | 1.9%).
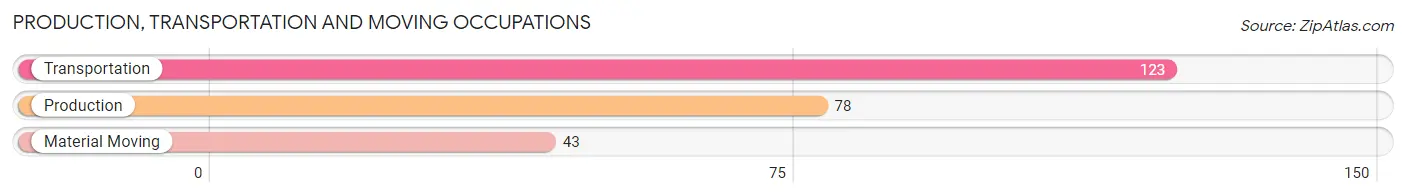
Production, Transportation and Moving Occupations by Sex
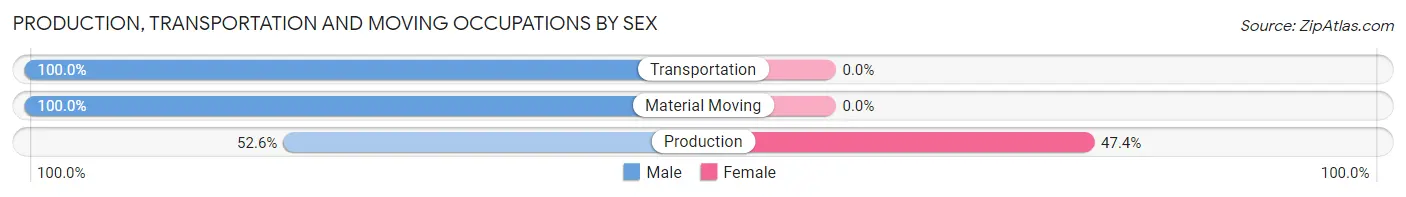
| Occupation | Male | Female |
| Production | 41 (52.6%) | 37 (47.4%) |
| Transportation | 123 (100.0%) | 0 (0.0%) |
| Material Moving | 43 (100.0%) | 0 (0.0%) |
| Total (Category) | 207 (84.8%) | 37 (15.2%) |
| Total (Overall) | 1,402 (62.2%) | 853 (37.8%) |
Employment Industries by Sex in San Sebastian
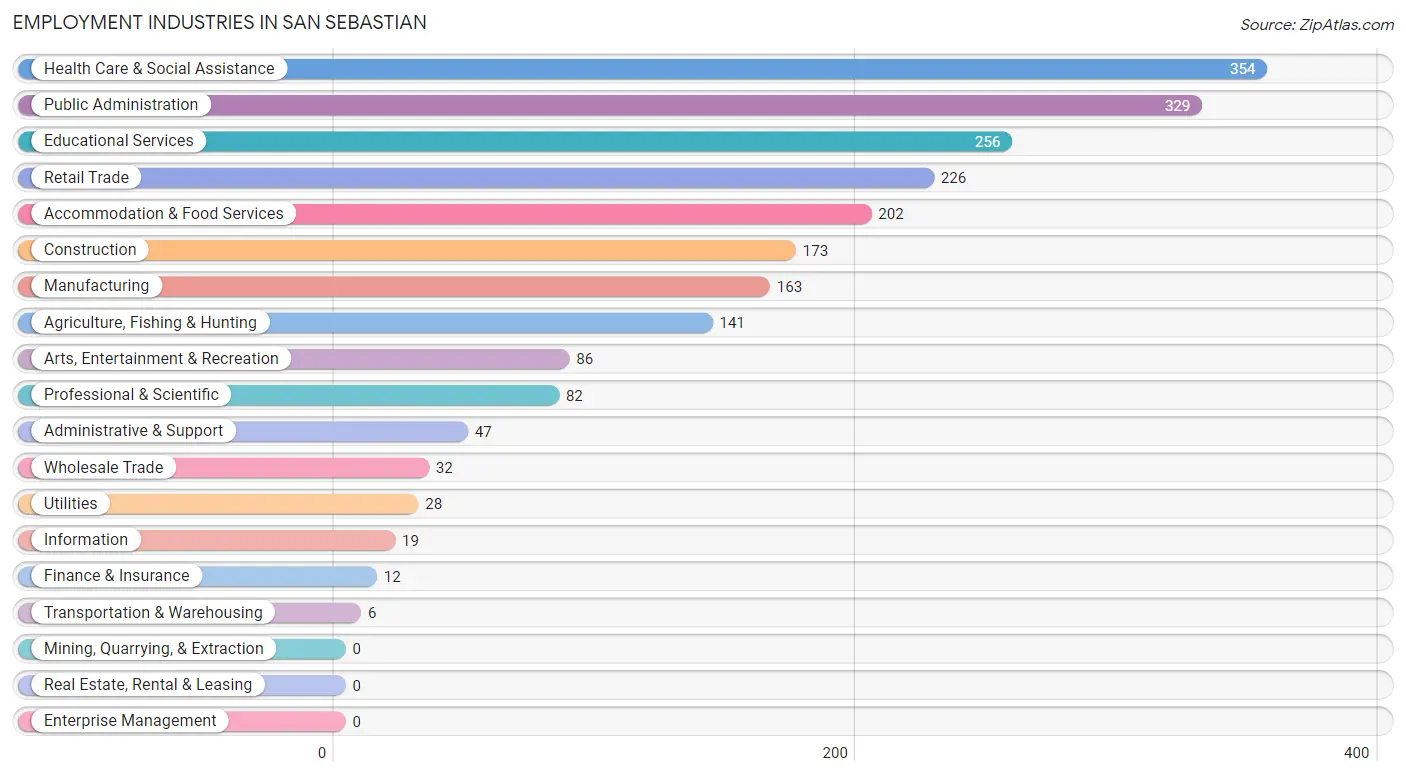
Employment Industries in San Sebastian
The major employment industries in San Sebastian include Health Care & Social Assistance (354 | 15.7%), Public Administration (329 | 14.6%), Educational Services (256 | 11.4%), Retail Trade (226 | 10.0%), and Accommodation & Food Services (202 | 9.0%).
Employment Industries by Sex in San Sebastian
The San Sebastian industries that see more men than women are Construction (100.0%), Transportation & Warehousing (100.0%), and Finance & Insurance (100.0%), whereas the industries that tend to have a higher number of women are Wholesale Trade (100.0%), Utilities (100.0%), and Information (100.0%).
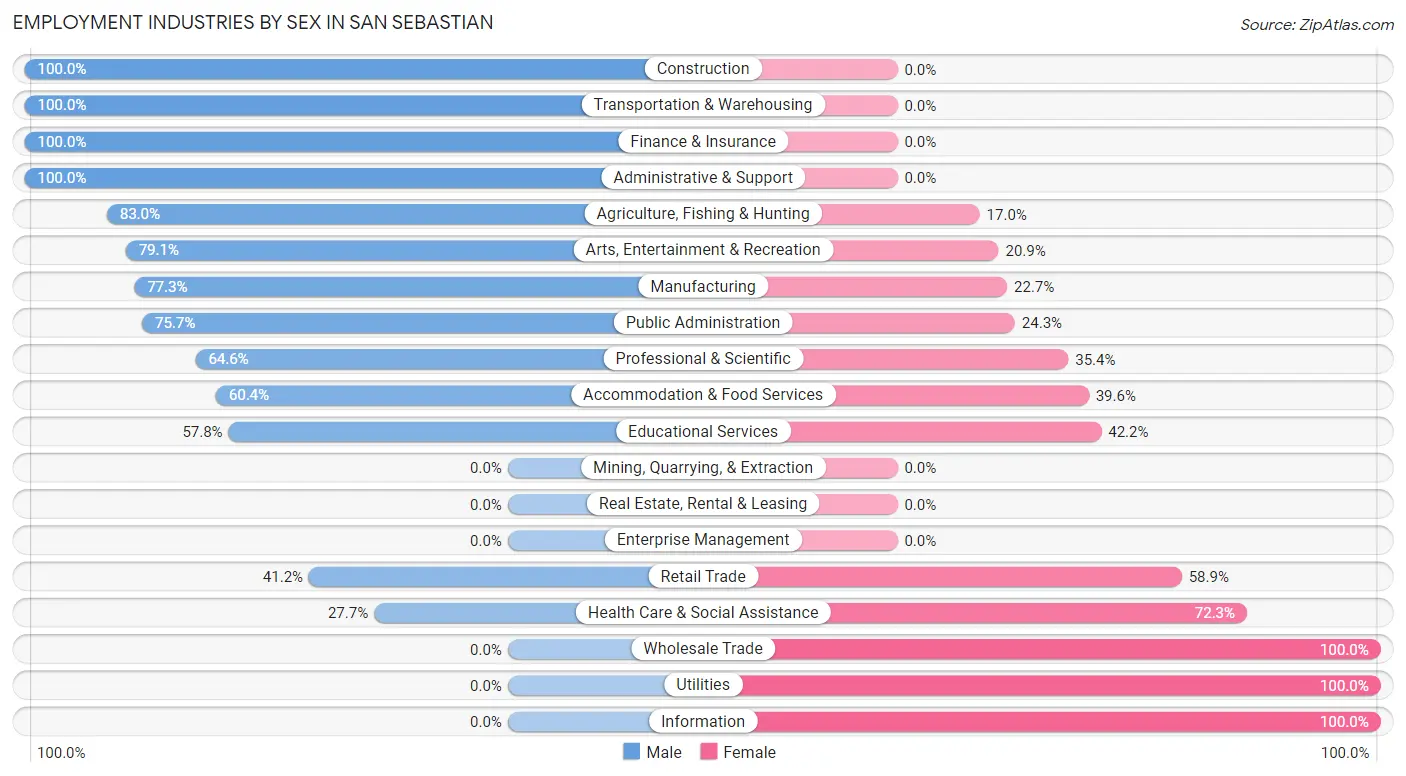
| Industry | Male | Female |
| Agriculture, Fishing & Hunting | 117 (83.0%) | 24 (17.0%) |
| Mining, Quarrying, & Extraction | 0 (0.0%) | 0 (0.0%) |
| Construction | 173 (100.0%) | 0 (0.0%) |
| Manufacturing | 126 (77.3%) | 37 (22.7%) |
| Wholesale Trade | 0 (0.0%) | 32 (100.0%) |
| Retail Trade | 93 (41.1%) | 133 (58.9%) |
| Transportation & Warehousing | 6 (100.0%) | 0 (0.0%) |
| Utilities | 0 (0.0%) | 28 (100.0%) |
| Information | 0 (0.0%) | 19 (100.0%) |
| Finance & Insurance | 12 (100.0%) | 0 (0.0%) |
| Real Estate, Rental & Leasing | 0 (0.0%) | 0 (0.0%) |
| Professional & Scientific | 53 (64.6%) | 29 (35.4%) |
| Enterprise Management | 0 (0.0%) | 0 (0.0%) |
| Administrative & Support | 47 (100.0%) | 0 (0.0%) |
| Educational Services | 148 (57.8%) | 108 (42.2%) |
| Health Care & Social Assistance | 98 (27.7%) | 256 (72.3%) |
| Arts, Entertainment & Recreation | 68 (79.1%) | 18 (20.9%) |
| Accommodation & Food Services | 122 (60.4%) | 80 (39.6%) |
| Public Administration | 249 (75.7%) | 80 (24.3%) |
| Total | 1,402 (62.2%) | 853 (37.8%) |
Education in San Sebastian
School Enrollment in San Sebastian
The most common levels of schooling among the 2,026 students in San Sebastian are college / undergraduate (561 | 27.7%), elementary school (404 | 19.9%), and middle school (399 | 19.7%).
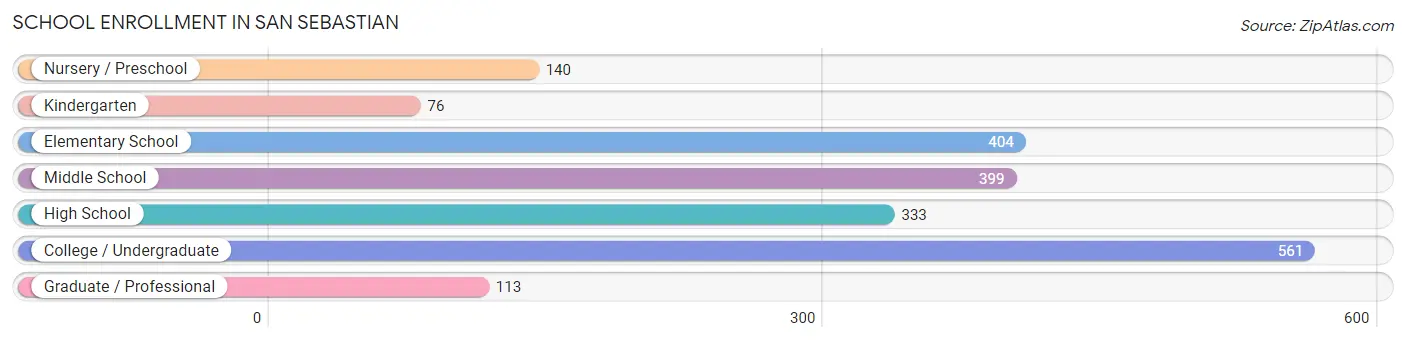
| School Level | # Students | % Students |
| Nursery / Preschool | 140 | 6.9% |
| Kindergarten | 76 | 3.7% |
| Elementary School | 404 | 19.9% |
| Middle School | 399 | 19.7% |
| High School | 333 | 16.4% |
| College / Undergraduate | 561 | 27.7% |
| Graduate / Professional | 113 | 5.6% |
| Total | 2,026 | 100.0% |
School Enrollment by Age by Funding Source in San Sebastian
Out of a total of 2,026 students who are enrolled in schools in San Sebastian, 723 (35.7%) attend a private institution, while the remaining 1,303 (64.3%) are enrolled in public schools. The age group of 25 to 34 year olds has the highest likelihood of being enrolled in private schools, with 136 (100.0% in the age bracket) enrolled. Conversely, the age group of 15 to 17 year olds has the lowest likelihood of being enrolled in a private school, with 245 (95.7% in the age bracket) attending a public institution.
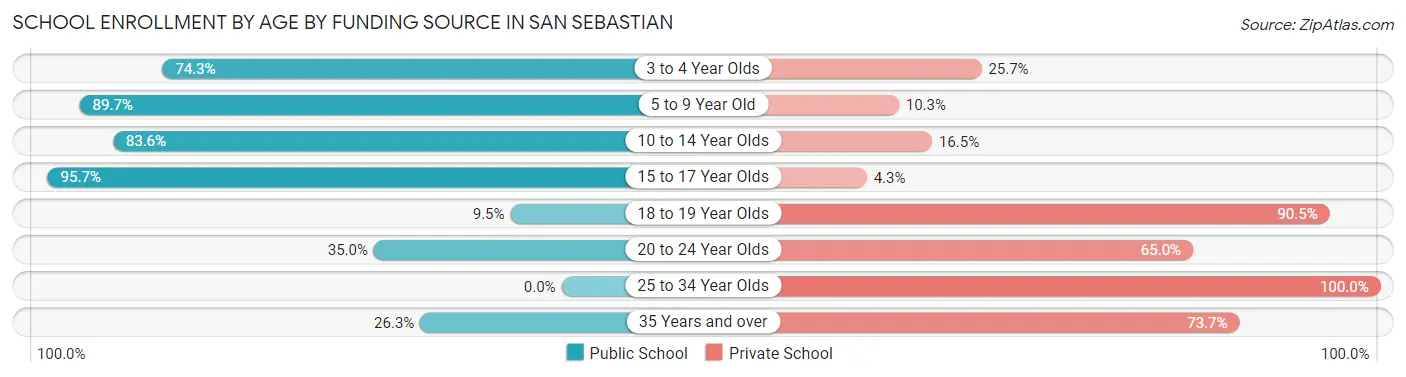
| Age Bracket | Public School | Private School |
| 3 to 4 Year Olds | 84 (74.3%) | 29 (25.7%) |
| 5 to 9 Year Old | 455 (89.7%) | 52 (10.3%) |
| 10 to 14 Year Olds | 386 (83.6%) | 76 (16.5%) |
| 15 to 17 Year Olds | 245 (95.7%) | 11 (4.3%) |
| 18 to 19 Year Olds | 20 (9.5%) | 190 (90.5%) |
| 20 to 24 Year Olds | 93 (35.0%) | 173 (65.0%) |
| 25 to 34 Year Olds | 0 (0.0%) | 136 (100.0%) |
| 35 Years and over | 20 (26.3%) | 56 (73.7%) |
| Total | 1,303 (64.3%) | 723 (35.7%) |
Educational Attainment by Field of Study in San Sebastian
Business (355 | 28.1%), education (311 | 24.7%), science & technology (277 | 22.0%), bio, nature & agricultural (98 | 7.8%), and psychology (63 | 5.0%) are the most common fields of study among 1,261 individuals in San Sebastian who have obtained a bachelor's degree or higher.
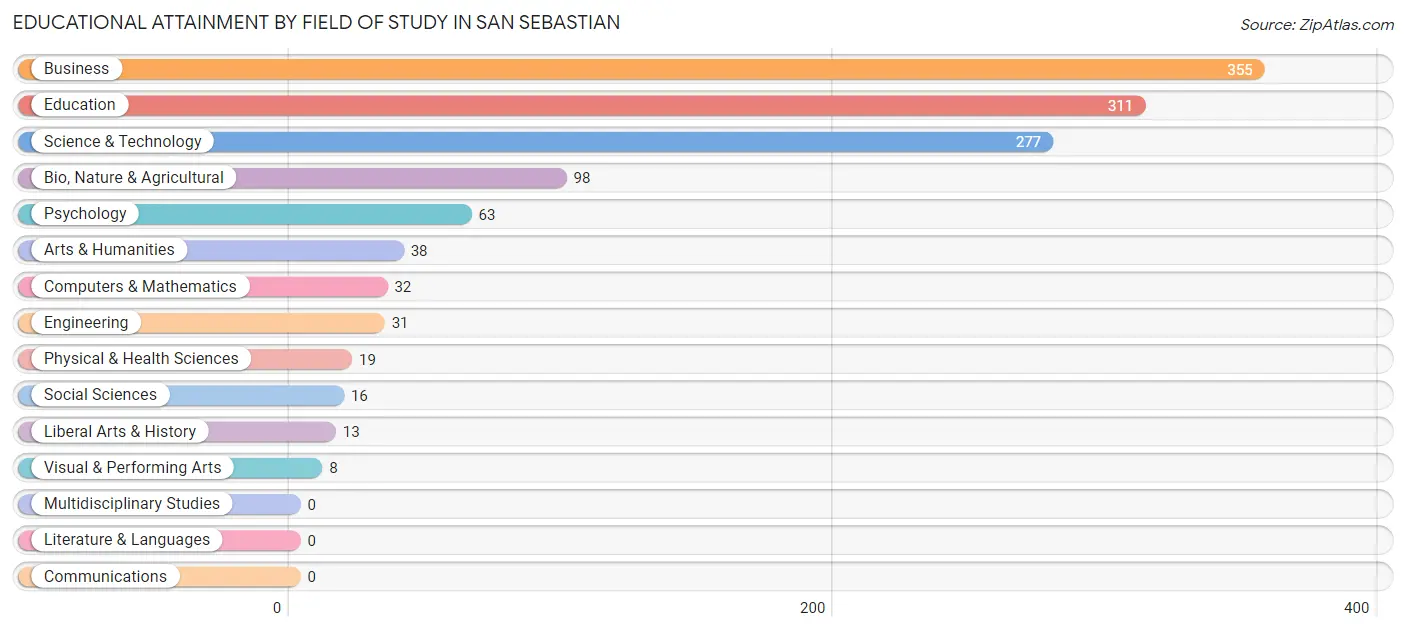
| Field of Study | # Graduates | % Graduates |
| Computers & Mathematics | 32 | 2.5% |
| Bio, Nature & Agricultural | 98 | 7.8% |
| Physical & Health Sciences | 19 | 1.5% |
| Psychology | 63 | 5.0% |
| Social Sciences | 16 | 1.3% |
| Engineering | 31 | 2.5% |
| Multidisciplinary Studies | 0 | 0.0% |
| Science & Technology | 277 | 22.0% |
| Business | 355 | 28.1% |
| Education | 311 | 24.7% |
| Literature & Languages | 0 | 0.0% |
| Liberal Arts & History | 13 | 1.0% |
| Visual & Performing Arts | 8 | 0.6% |
| Communications | 0 | 0.0% |
| Arts & Humanities | 38 | 3.0% |
| Total | 1,261 | 100.0% |
Transportation & Commute in San Sebastian
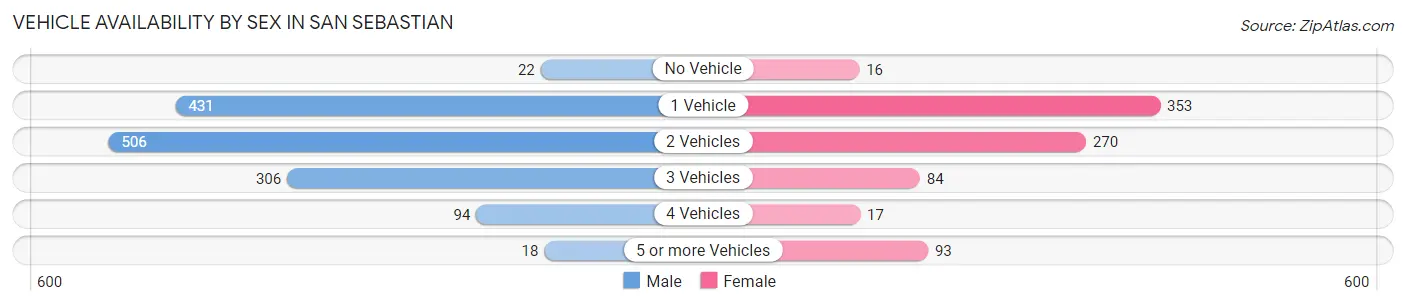
Vehicle Availability by Sex in San Sebastian
The most prevalent vehicle ownership categories in San Sebastian are males with 2 vehicles (506, accounting for 36.7%) and females with 2 vehicles (270, making up 60.7%).
| Vehicles Available | Male | Female |
| No Vehicle | 22 (1.6%) | 16 (1.9%) |
| 1 Vehicle | 431 (31.3%) | 353 (42.4%) |
| 2 Vehicles | 506 (36.7%) | 270 (32.4%) |
| 3 Vehicles | 306 (22.2%) | 84 (10.1%) |
| 4 Vehicles | 94 (6.8%) | 17 (2.0%) |
| 5 or more Vehicles | 18 (1.3%) | 93 (11.2%) |
| Total | 1,377 (100.0%) | 833 (100.0%) |
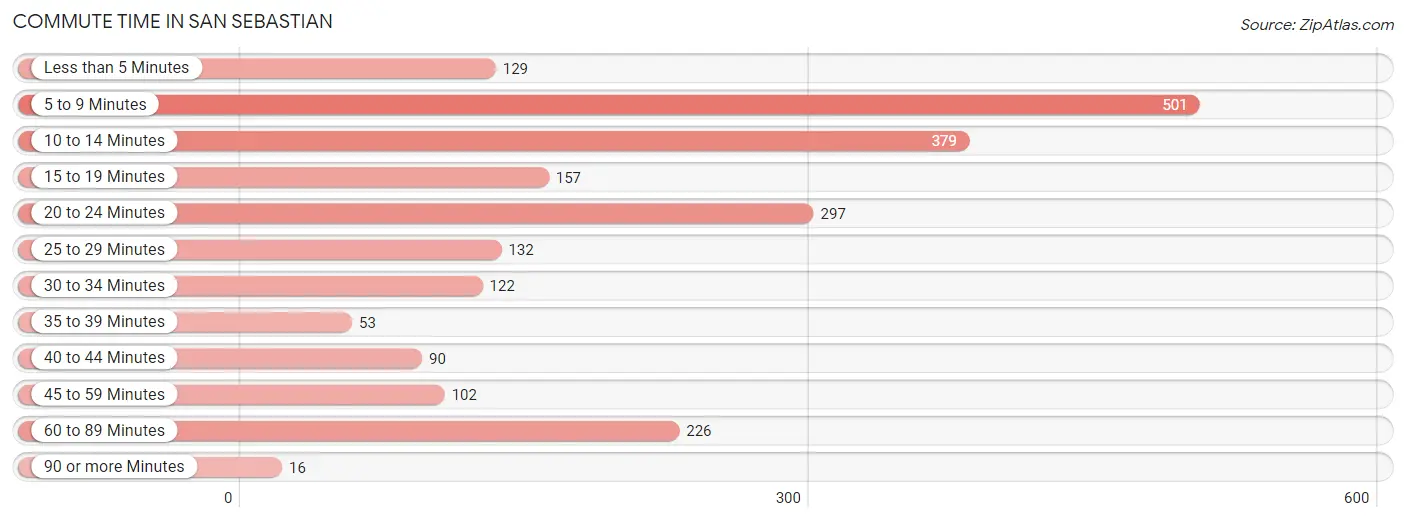
Commute Time in San Sebastian
The most frequently occuring commute durations in San Sebastian are 5 to 9 minutes (501 commuters, 22.7%), 10 to 14 minutes (379 commuters, 17.2%), and 20 to 24 minutes (297 commuters, 13.5%).
| Commute Time | # Commuters | % Commuters |
| Less than 5 Minutes | 129 | 5.9% |
| 5 to 9 Minutes | 501 | 22.7% |
| 10 to 14 Minutes | 379 | 17.2% |
| 15 to 19 Minutes | 157 | 7.1% |
| 20 to 24 Minutes | 297 | 13.5% |
| 25 to 29 Minutes | 132 | 6.0% |
| 30 to 34 Minutes | 122 | 5.5% |
| 35 to 39 Minutes | 53 | 2.4% |
| 40 to 44 Minutes | 90 | 4.1% |
| 45 to 59 Minutes | 102 | 4.6% |
| 60 to 89 Minutes | 226 | 10.2% |
| 90 or more Minutes | 16 | 0.7% |
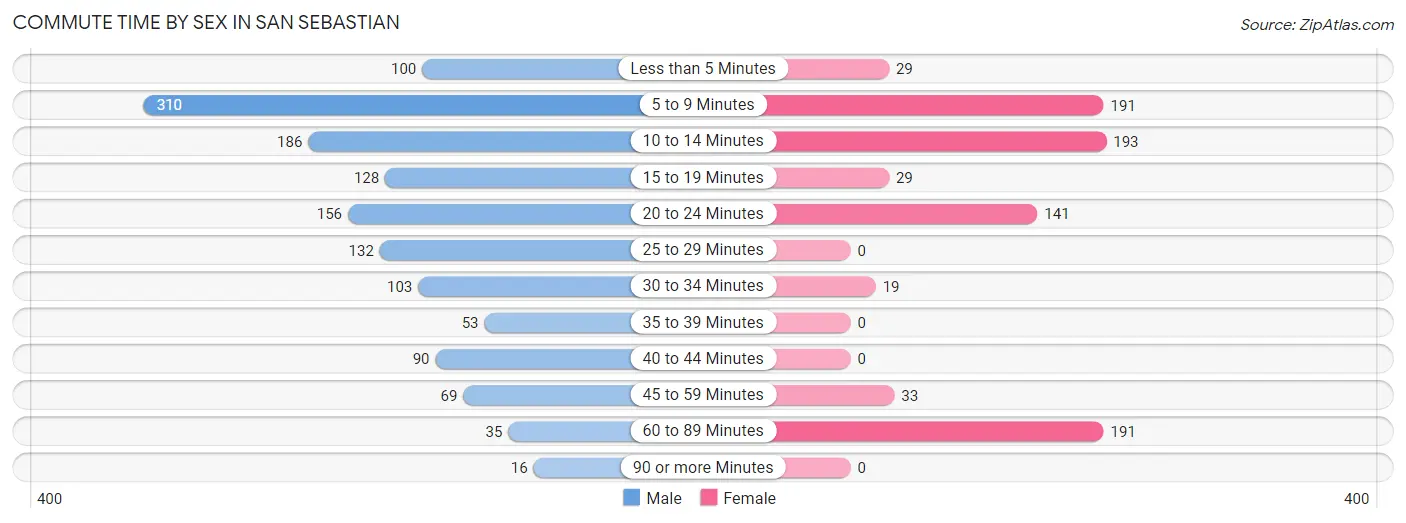
Commute Time by Sex in San Sebastian
The most common commute times in San Sebastian are 5 to 9 minutes (310 commuters, 22.5%) for males and 10 to 14 minutes (193 commuters, 23.4%) for females.
| Commute Time | Male | Female |
| Less than 5 Minutes | 100 (7.3%) | 29 (3.5%) |
| 5 to 9 Minutes | 310 (22.5%) | 191 (23.1%) |
| 10 to 14 Minutes | 186 (13.5%) | 193 (23.4%) |
| 15 to 19 Minutes | 128 (9.3%) | 29 (3.5%) |
| 20 to 24 Minutes | 156 (11.3%) | 141 (17.1%) |
| 25 to 29 Minutes | 132 (9.6%) | 0 (0.0%) |
| 30 to 34 Minutes | 103 (7.5%) | 19 (2.3%) |
| 35 to 39 Minutes | 53 (3.8%) | 0 (0.0%) |
| 40 to 44 Minutes | 90 (6.5%) | 0 (0.0%) |
| 45 to 59 Minutes | 69 (5.0%) | 33 (4.0%) |
| 60 to 89 Minutes | 35 (2.5%) | 191 (23.1%) |
| 90 or more Minutes | 16 (1.2%) | 0 (0.0%) |
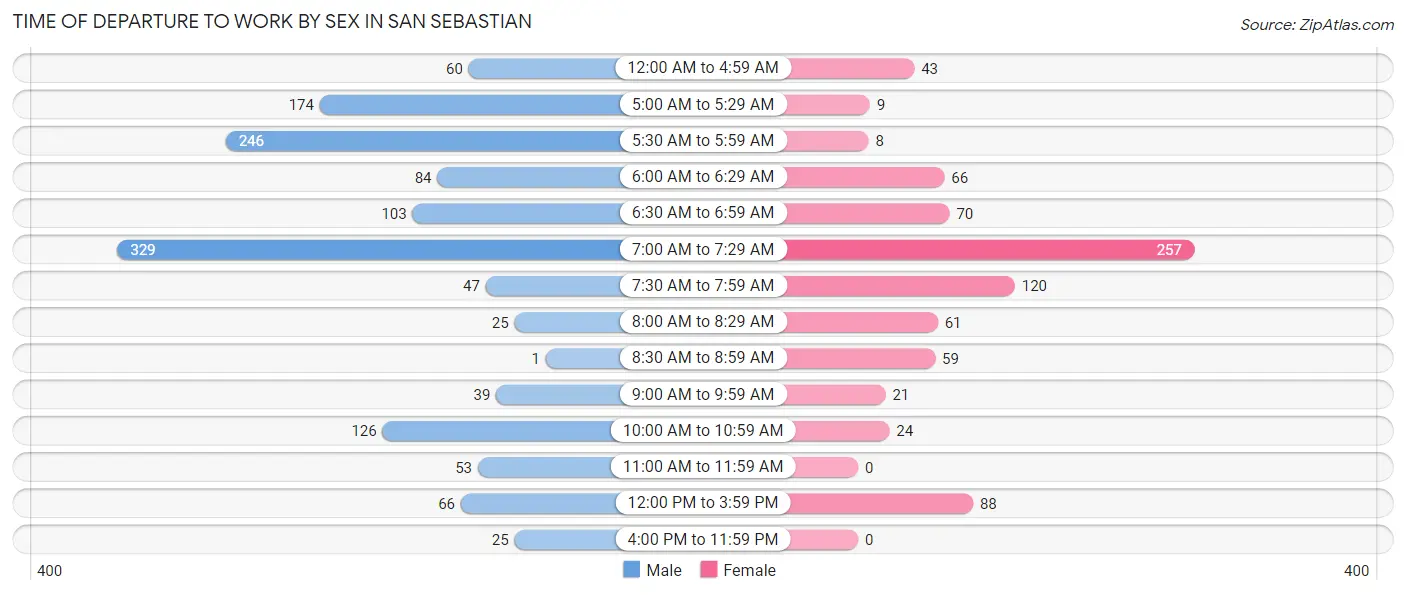
Time of Departure to Work by Sex in San Sebastian
The most frequent times of departure to work in San Sebastian are 7:00 AM to 7:29 AM (329, 23.9%) for males and 7:00 AM to 7:29 AM (257, 31.1%) for females.
| Time of Departure | Male | Female |
| 12:00 AM to 4:59 AM | 60 (4.3%) | 43 (5.2%) |
| 5:00 AM to 5:29 AM | 174 (12.6%) | 9 (1.1%) |
| 5:30 AM to 5:59 AM | 246 (17.8%) | 8 (1.0%) |
| 6:00 AM to 6:29 AM | 84 (6.1%) | 66 (8.0%) |
| 6:30 AM to 6:59 AM | 103 (7.5%) | 70 (8.5%) |
| 7:00 AM to 7:29 AM | 329 (23.9%) | 257 (31.1%) |
| 7:30 AM to 7:59 AM | 47 (3.4%) | 120 (14.5%) |
| 8:00 AM to 8:29 AM | 25 (1.8%) | 61 (7.4%) |
| 8:30 AM to 8:59 AM | 1 (0.1%) | 59 (7.1%) |
| 9:00 AM to 9:59 AM | 39 (2.8%) | 21 (2.5%) |
| 10:00 AM to 10:59 AM | 126 (9.1%) | 24 (2.9%) |
| 11:00 AM to 11:59 AM | 53 (3.8%) | 0 (0.0%) |
| 12:00 PM to 3:59 PM | 66 (4.8%) | 88 (10.6%) |
| 4:00 PM to 11:59 PM | 25 (1.8%) | 0 (0.0%) |
| Total | 1,378 (100.0%) | 826 (100.0%) |
Housing Occupancy in San Sebastian
Occupancy by Ownership in San Sebastian
Of the total 3,191 dwellings in San Sebastian, owner-occupied units account for 1,891 (59.3%), while renter-occupied units make up 1,300 (40.7%).
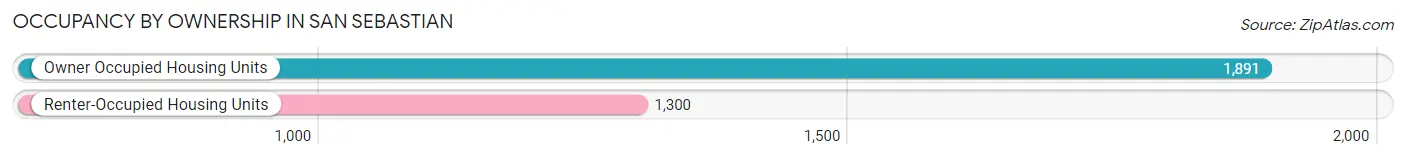
| Occupancy | # Housing Units | % Housing Units |
| Owner Occupied Housing Units | 1,891 | 59.3% |
| Renter-Occupied Housing Units | 1,300 | 40.7% |
| Total Occupied Housing Units | 3,191 | 100.0% |
Occupancy by Household Size in San Sebastian
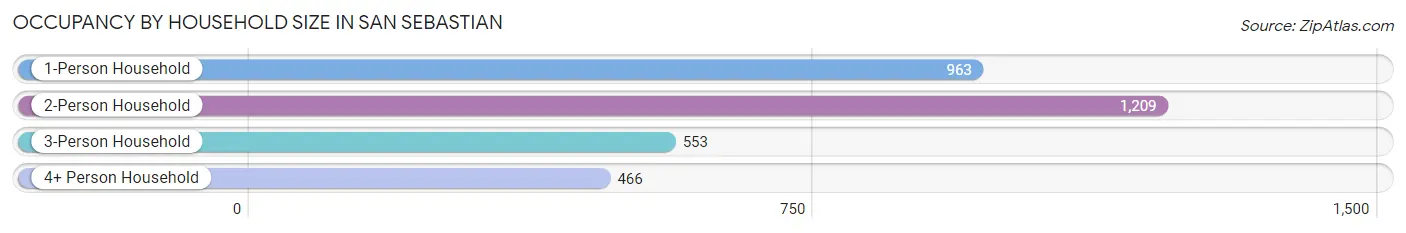
| Household Size | # Housing Units | % Housing Units |
| 1-Person Household | 963 | 30.2% |
| 2-Person Household | 1,209 | 37.9% |
| 3-Person Household | 553 | 17.3% |
| 4+ Person Household | 466 | 14.6% |
| Total Housing Units | 3,191 | 100.0% |
Occupancy by Ownership by Household Size in San Sebastian
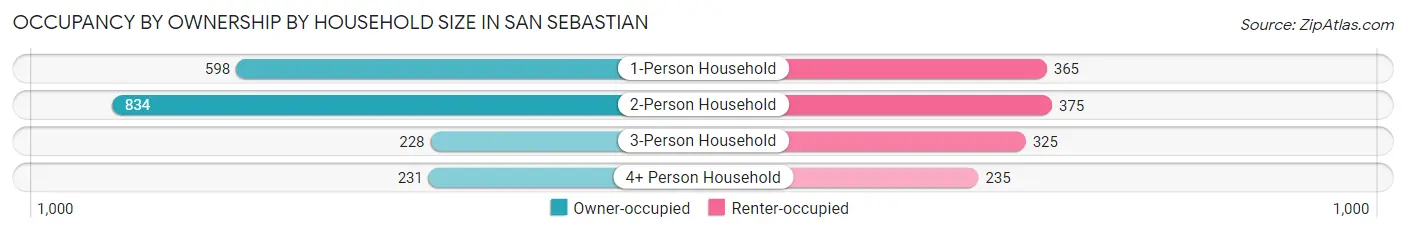
| Household Size | Owner-occupied | Renter-occupied |
| 1-Person Household | 598 (62.1%) | 365 (37.9%) |
| 2-Person Household | 834 (69.0%) | 375 (31.0%) |
| 3-Person Household | 228 (41.2%) | 325 (58.8%) |
| 4+ Person Household | 231 (49.6%) | 235 (50.4%) |
| Total Housing Units | 1,891 (59.3%) | 1,300 (40.7%) |
Occupancy by Educational Attainment in San Sebastian
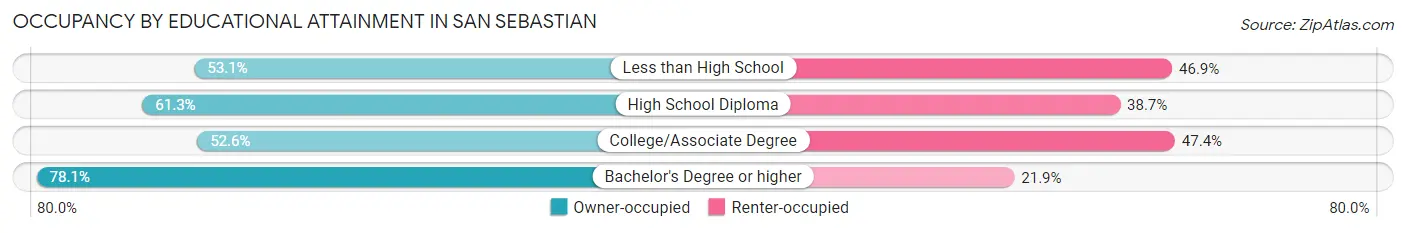
| Household Size | Owner-occupied | Renter-occupied |
| Less than High School | 580 (53.1%) | 513 (46.9%) |
| High School Diploma | 485 (61.3%) | 306 (38.7%) |
| College/Associate Degree | 402 (52.6%) | 362 (47.4%) |
| Bachelor's Degree or higher | 424 (78.1%) | 119 (21.9%) |
Occupancy by Age of Householder in San Sebastian
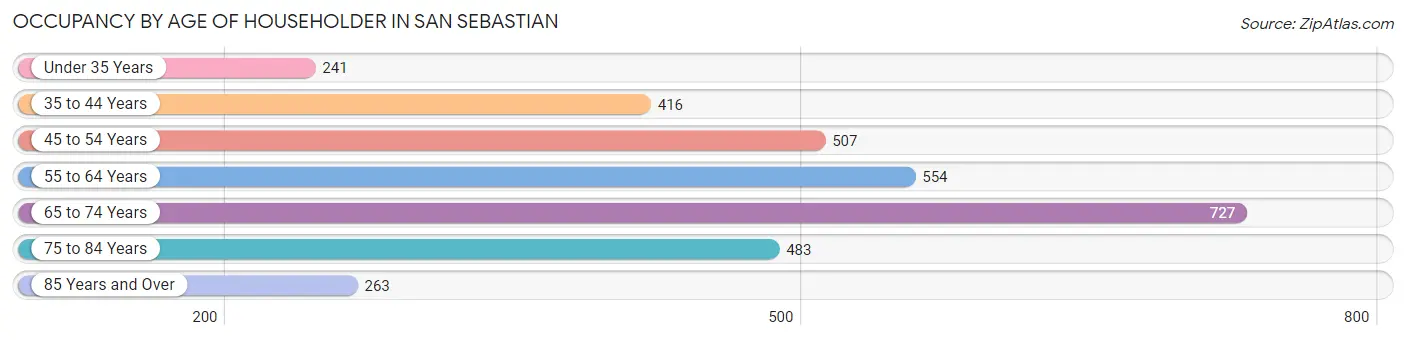
| Age Bracket | # Households | % Households |
| Under 35 Years | 241 | 7.5% |
| 35 to 44 Years | 416 | 13.0% |
| 45 to 54 Years | 507 | 15.9% |
| 55 to 64 Years | 554 | 17.4% |
| 65 to 74 Years | 727 | 22.8% |
| 75 to 84 Years | 483 | 15.1% |
| 85 Years and Over | 263 | 8.2% |
| Total | 3,191 | 100.0% |
Housing Finances in San Sebastian
Median Income by Occupancy in San Sebastian
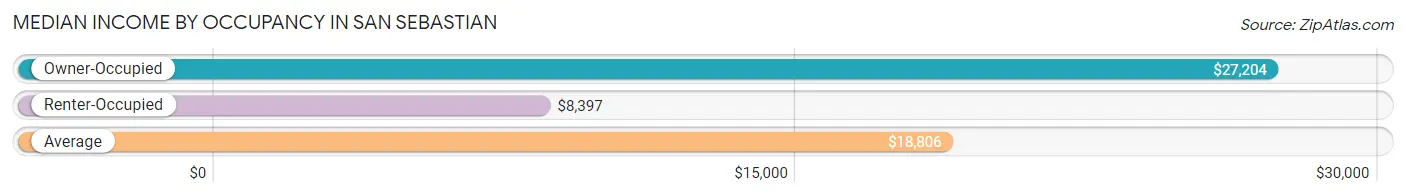
| Occupancy Type | # Households | Median Income |
| Owner-Occupied | 1,891 (59.3%) | $27,204 |
| Renter-Occupied | 1,300 (40.7%) | $8,397 |
| Average | 3,191 (100.0%) | $18,806 |
Occupancy by Householder Income Bracket in San Sebastian
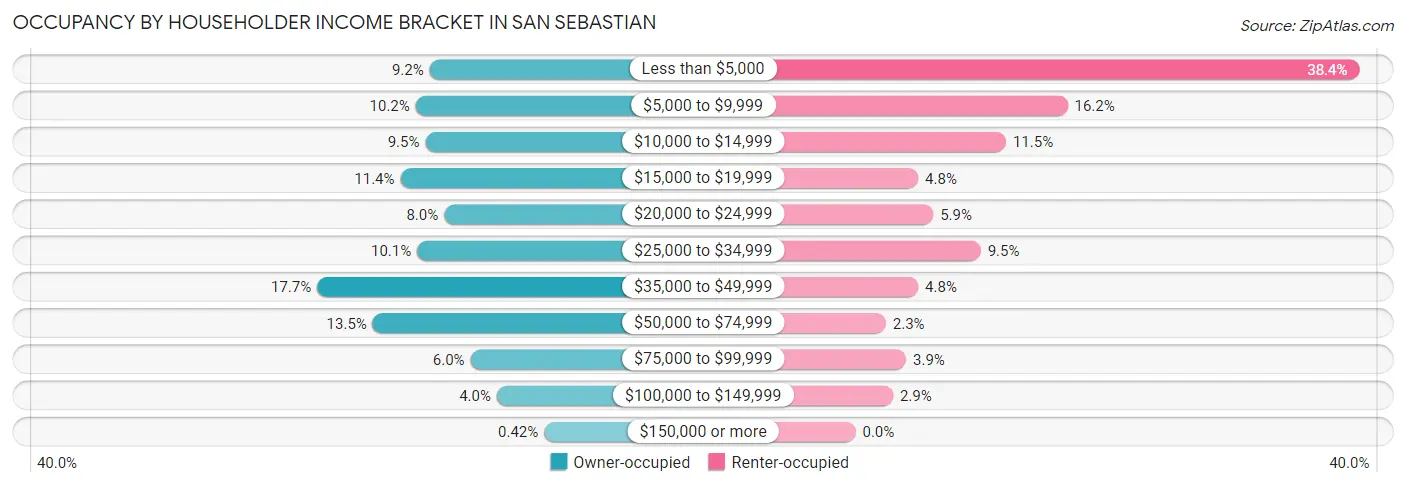
| Income Bracket | Owner-occupied | Renter-occupied |
| Less than $5,000 | 173 (9.1%) | 499 (38.4%) |
| $5,000 to $9,999 | 193 (10.2%) | 210 (16.2%) |
| $10,000 to $14,999 | 179 (9.5%) | 149 (11.5%) |
| $15,000 to $19,999 | 215 (11.4%) | 62 (4.8%) |
| $20,000 to $24,999 | 152 (8.0%) | 77 (5.9%) |
| $25,000 to $34,999 | 191 (10.1%) | 124 (9.5%) |
| $35,000 to $49,999 | 335 (17.7%) | 62 (4.8%) |
| $50,000 to $74,999 | 255 (13.5%) | 30 (2.3%) |
| $75,000 to $99,999 | 114 (6.0%) | 50 (3.8%) |
| $100,000 to $149,999 | 76 (4.0%) | 37 (2.9%) |
| $150,000 or more | 8 (0.4%) | 0 (0.0%) |
| Total | 1,891 (100.0%) | 1,300 (100.0%) |
Monthly Housing Cost Tiers in San Sebastian
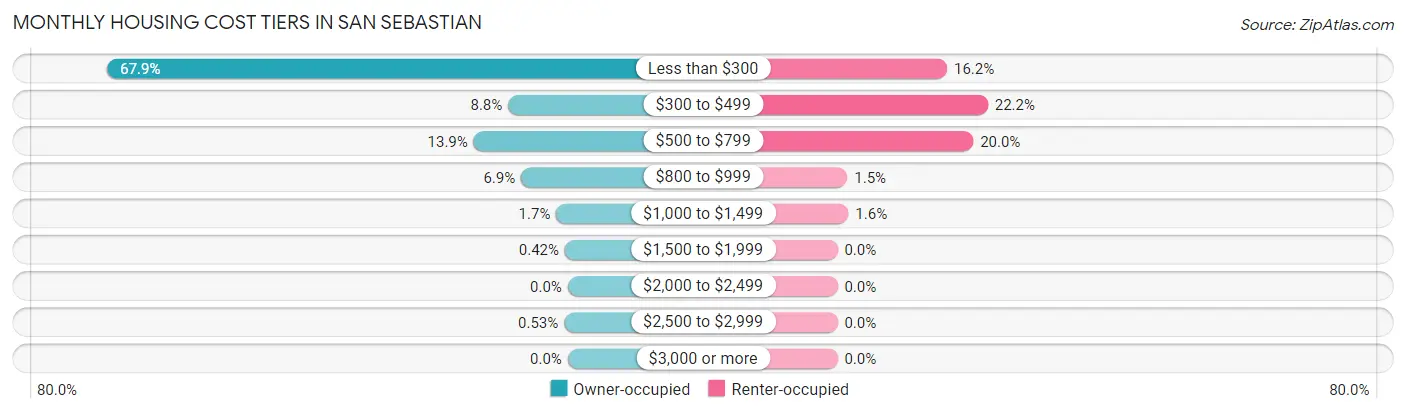
| Monthly Cost | Owner-occupied | Renter-occupied |
| Less than $300 | 1,283 (67.8%) | 210 (16.2%) |
| $300 to $499 | 166 (8.8%) | 288 (22.2%) |
| $500 to $799 | 262 (13.9%) | 260 (20.0%) |
| $800 to $999 | 130 (6.9%) | 19 (1.5%) |
| $1,000 to $1,499 | 32 (1.7%) | 21 (1.6%) |
| $1,500 to $1,999 | 8 (0.4%) | 0 (0.0%) |
| $2,000 to $2,499 | 0 (0.0%) | 0 (0.0%) |
| $2,500 to $2,999 | 10 (0.5%) | 0 (0.0%) |
| $3,000 or more | 0 (0.0%) | 0 (0.0%) |
| Total | 1,891 (100.0%) | 1,300 (100.0%) |
Physical Housing Characteristics in San Sebastian
Housing Structures in San Sebastian
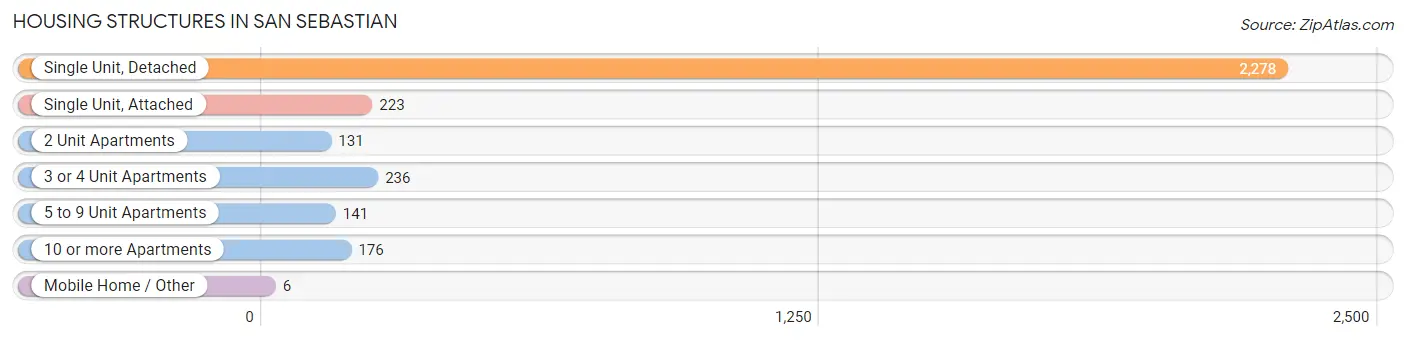
| Structure Type | # Housing Units | % Housing Units |
| Single Unit, Detached | 2,278 | 71.4% |
| Single Unit, Attached | 223 | 7.0% |
| 2 Unit Apartments | 131 | 4.1% |
| 3 or 4 Unit Apartments | 236 | 7.4% |
| 5 to 9 Unit Apartments | 141 | 4.4% |
| 10 or more Apartments | 176 | 5.5% |
| Mobile Home / Other | 6 | 0.2% |
| Total | 3,191 | 100.0% |
Housing Structures by Occupancy in San Sebastian
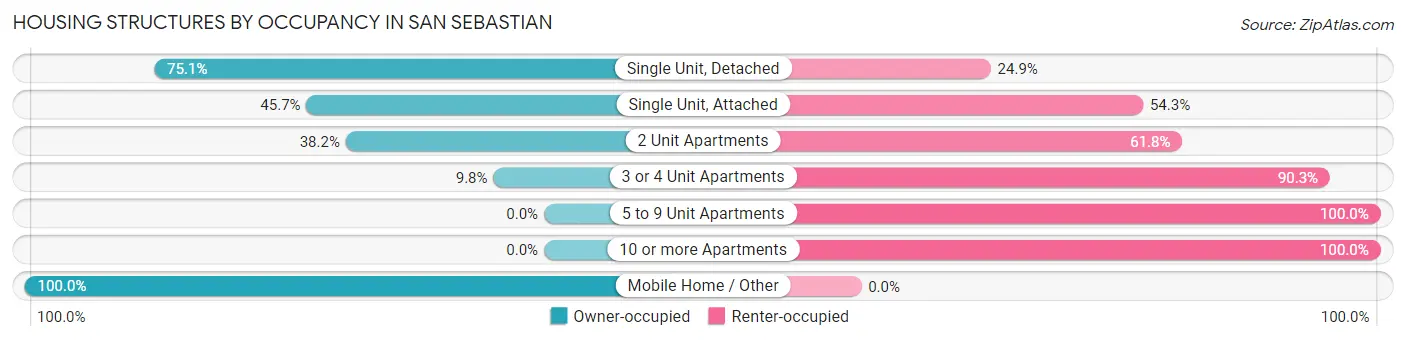
| Structure Type | Owner-occupied | Renter-occupied |
| Single Unit, Detached | 1,710 (75.1%) | 568 (24.9%) |
| Single Unit, Attached | 102 (45.7%) | 121 (54.3%) |
| 2 Unit Apartments | 50 (38.2%) | 81 (61.8%) |
| 3 or 4 Unit Apartments | 23 (9.8%) | 213 (90.2%) |
| 5 to 9 Unit Apartments | 0 (0.0%) | 141 (100.0%) |
| 10 or more Apartments | 0 (0.0%) | 176 (100.0%) |
| Mobile Home / Other | 6 (100.0%) | 0 (0.0%) |
| Total | 1,891 (59.3%) | 1,300 (40.7%) |
Housing Structures by Number of Rooms in San Sebastian
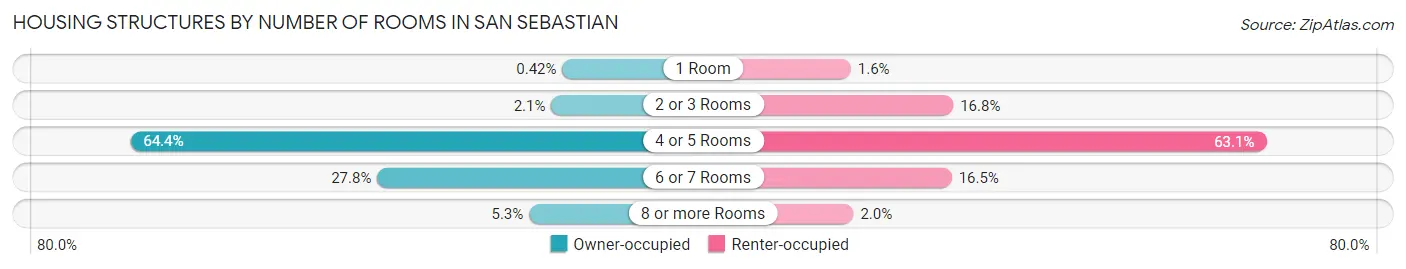
| Number of Rooms | Owner-occupied | Renter-occupied |
| 1 Room | 8 (0.4%) | 21 (1.6%) |
| 2 or 3 Rooms | 39 (2.1%) | 218 (16.8%) |
| 4 or 5 Rooms | 1,217 (64.4%) | 820 (63.1%) |
| 6 or 7 Rooms | 526 (27.8%) | 215 (16.5%) |
| 8 or more Rooms | 101 (5.3%) | 26 (2.0%) |
| Total | 1,891 (100.0%) | 1,300 (100.0%) |
Housing Structure by Heating Type in San Sebastian
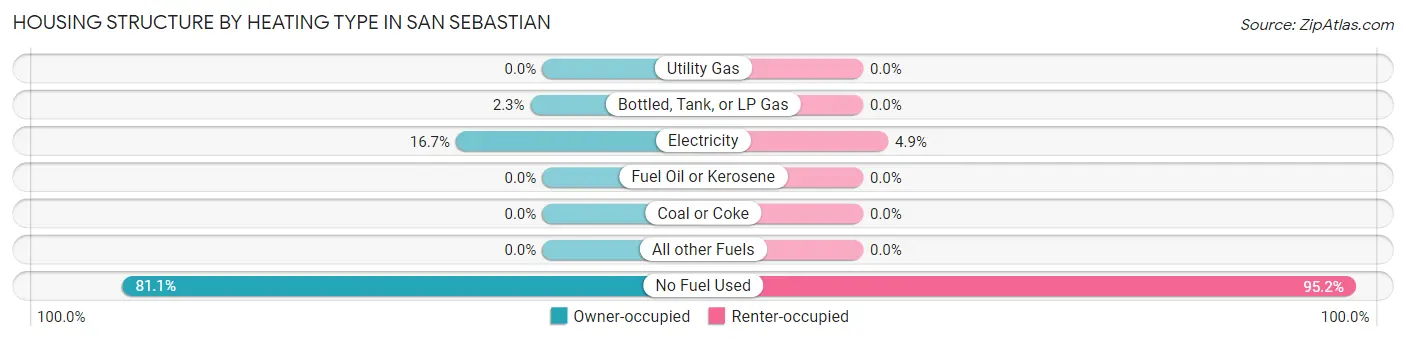
| Heating Type | Owner-occupied | Renter-occupied |
| Utility Gas | 0 (0.0%) | 0 (0.0%) |
| Bottled, Tank, or LP Gas | 43 (2.3%) | 0 (0.0%) |
| Electricity | 315 (16.7%) | 63 (4.9%) |
| Fuel Oil or Kerosene | 0 (0.0%) | 0 (0.0%) |
| Coal or Coke | 0 (0.0%) | 0 (0.0%) |
| All other Fuels | 0 (0.0%) | 0 (0.0%) |
| No Fuel Used | 1,533 (81.1%) | 1,237 (95.2%) |
| Total | 1,891 (100.0%) | 1,300 (100.0%) |
Household Vehicle Usage in San Sebastian
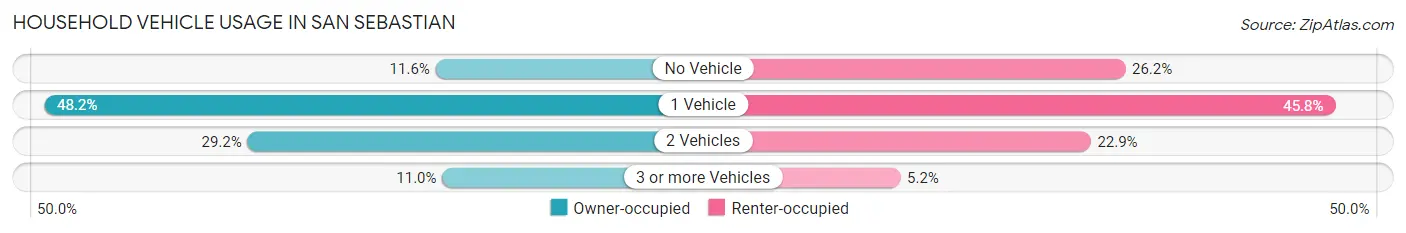
| Vehicles per Household | Owner-occupied | Renter-occupied |
| No Vehicle | 220 (11.6%) | 340 (26.2%) |
| 1 Vehicle | 911 (48.2%) | 595 (45.8%) |
| 2 Vehicles | 552 (29.2%) | 298 (22.9%) |
| 3 or more Vehicles | 208 (11.0%) | 67 (5.1%) |
| Total | 1,891 (100.0%) | 1,300 (100.0%) |
Real Estate & Mortgages in San Sebastian
Real Estate and Mortgage Overview in San Sebastian
| Characteristic | Without Mortgage | With Mortgage |
| Housing Units | 1,423 | 468 |
| Median Property Value | $97,900 | $127,800 |
| Median Household Income | $24,663 | $8 |
| Monthly Housing Costs | $140 | $0 |
| Real Estate Taxes | $607 | $388 |
Property Value by Mortgage Status in San Sebastian
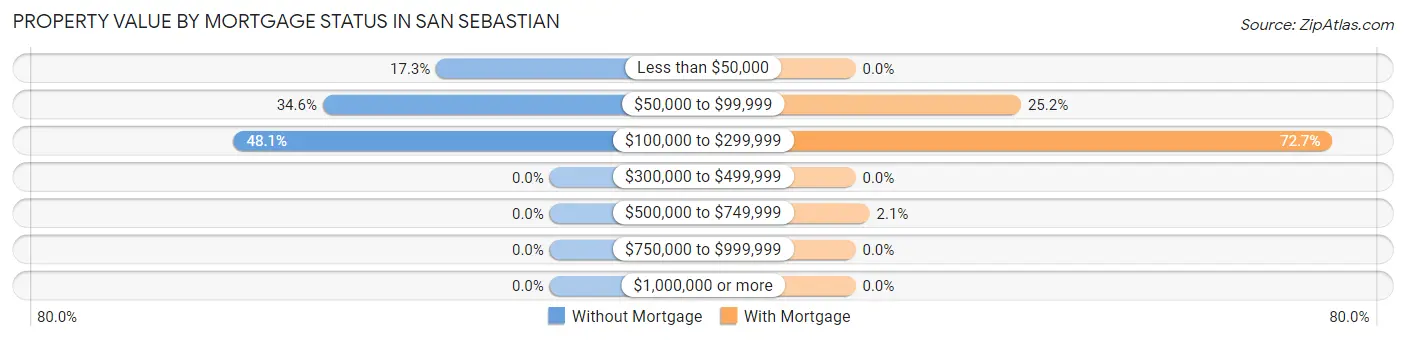
| Property Value | Without Mortgage | With Mortgage |
| Less than $50,000 | 246 (17.3%) | 0 (0.0%) |
| $50,000 to $99,999 | 492 (34.6%) | 118 (25.2%) |
| $100,000 to $299,999 | 685 (48.1%) | 340 (72.7%) |
| $300,000 to $499,999 | 0 (0.0%) | 0 (0.0%) |
| $500,000 to $749,999 | 0 (0.0%) | 10 (2.1%) |
| $750,000 to $999,999 | 0 (0.0%) | 0 (0.0%) |
| $1,000,000 or more | 0 (0.0%) | 0 (0.0%) |
| Total | 1,423 (100.0%) | 468 (100.0%) |
Household Income by Mortgage Status in San Sebastian
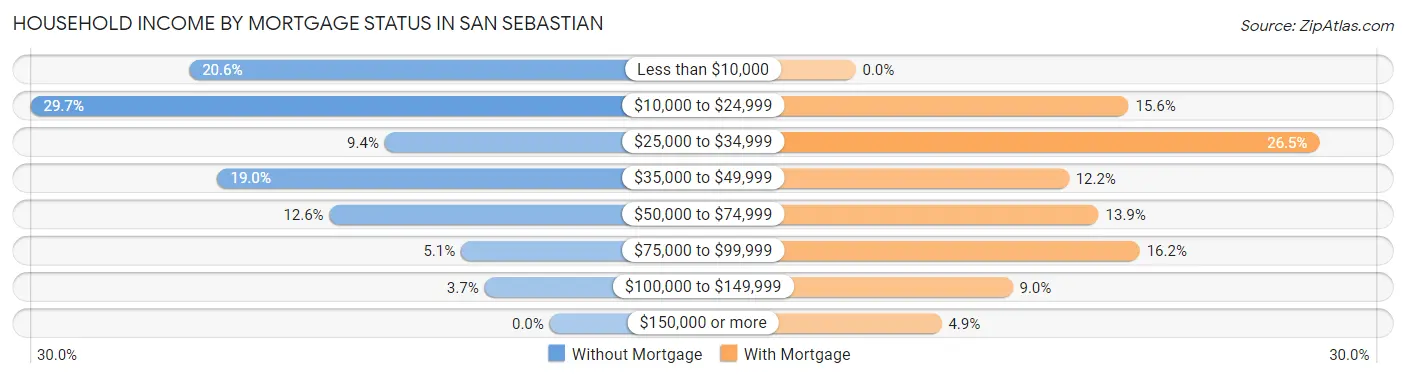
| Household Income | Without Mortgage | With Mortgage |
| Less than $10,000 | 293 (20.6%) | 0 (0.0%) |
| $10,000 to $24,999 | 422 (29.7%) | 73 (15.6%) |
| $25,000 to $34,999 | 134 (9.4%) | 124 (26.5%) |
| $35,000 to $49,999 | 270 (19.0%) | 57 (12.2%) |
| $50,000 to $74,999 | 179 (12.6%) | 65 (13.9%) |
| $75,000 to $99,999 | 72 (5.1%) | 76 (16.2%) |
| $100,000 to $149,999 | 53 (3.7%) | 42 (9.0%) |
| $150,000 or more | 0 (0.0%) | 23 (4.9%) |
| Total | 1,423 (100.0%) | 468 (100.0%) |
Property Value to Household Income Ratio in San Sebastian
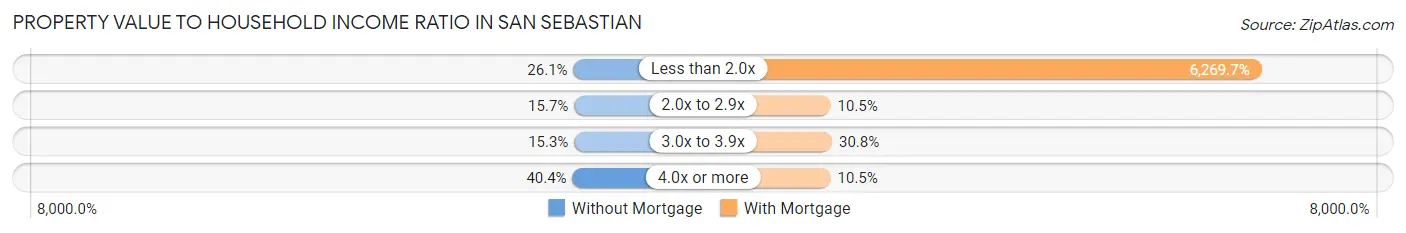
| Value-to-Income Ratio | Without Mortgage | With Mortgage |
| Less than 2.0x | 372 (26.1%) | 29,342 (6,269.7%) |
| 2.0x to 2.9x | 223 (15.7%) | 49 (10.5%) |
| 3.0x to 3.9x | 217 (15.2%) | 144 (30.8%) |
| 4.0x or more | 575 (40.4%) | 49 (10.5%) |
| Total | 1,423 (100.0%) | 468 (100.0%) |
Real Estate Taxes by Mortgage Status in San Sebastian
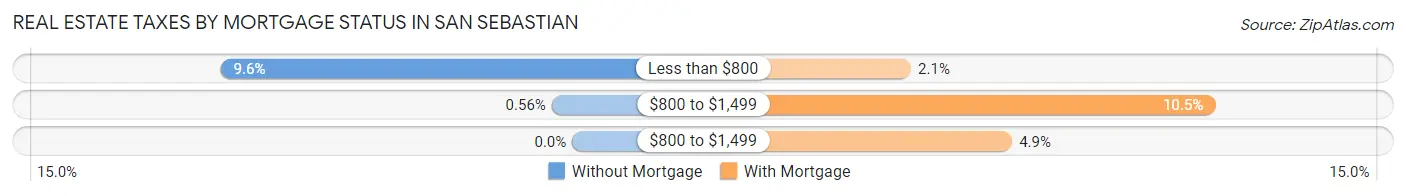
| Property Taxes | Without Mortgage | With Mortgage |
| Less than $800 | 137 (9.6%) | 10 (2.1%) |
| $800 to $1,499 | 8 (0.6%) | 49 (10.5%) |
| $800 to $1,499 | 0 (0.0%) | 23 (4.9%) |
| Total | 1,423 (100.0%) | 468 (100.0%) |
Health & Disability in San Sebastian
Health Insurance Coverage by Age in San Sebastian
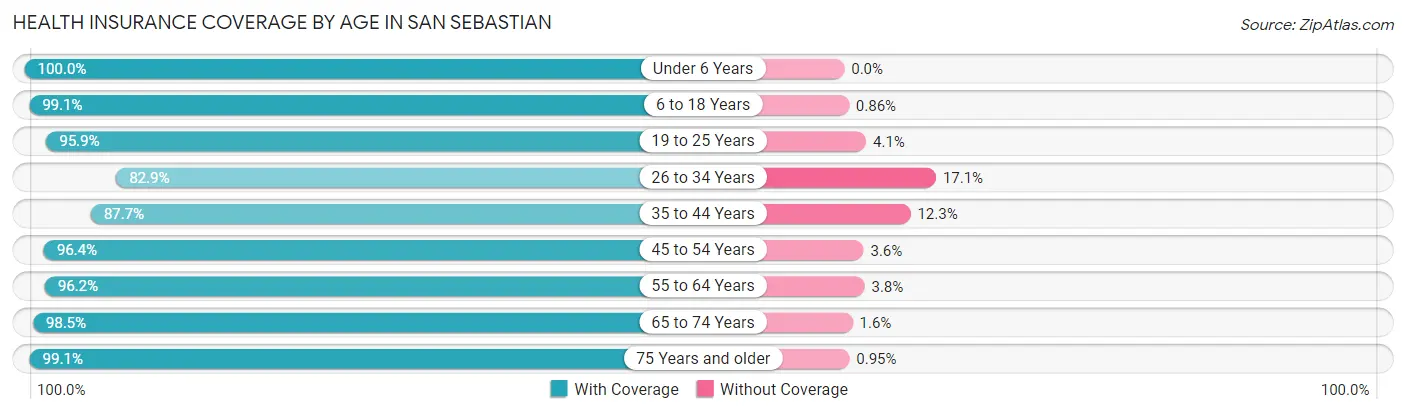
| Age Bracket | With Coverage | Without Coverage |
| Under 6 Years | 569 (100.0%) | 0 (0.0%) |
| 6 to 18 Years | 1,270 (99.1%) | 11 (0.9%) |
| 19 to 25 Years | 803 (95.9%) | 34 (4.1%) |
| 26 to 34 Years | 791 (82.9%) | 163 (17.1%) |
| 35 to 44 Years | 838 (87.7%) | 118 (12.3%) |
| 45 to 54 Years | 1,074 (96.4%) | 40 (3.6%) |
| 55 to 64 Years | 916 (96.2%) | 36 (3.8%) |
| 65 to 74 Years | 1,078 (98.5%) | 17 (1.5%) |
| 75 Years and older | 1,249 (99.1%) | 12 (0.9%) |
| Total | 8,588 (95.2%) | 431 (4.8%) |
Health Insurance Coverage by Citizenship Status in San Sebastian
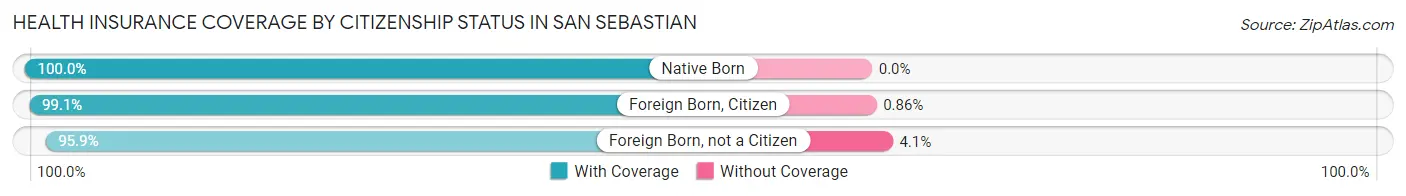
| Citizenship Status | With Coverage | Without Coverage |
| Native Born | 569 (100.0%) | 0 (0.0%) |
| Foreign Born, Citizen | 1,270 (99.1%) | 11 (0.9%) |
| Foreign Born, not a Citizen | 803 (95.9%) | 34 (4.1%) |
Health Insurance Coverage by Household Income in San Sebastian
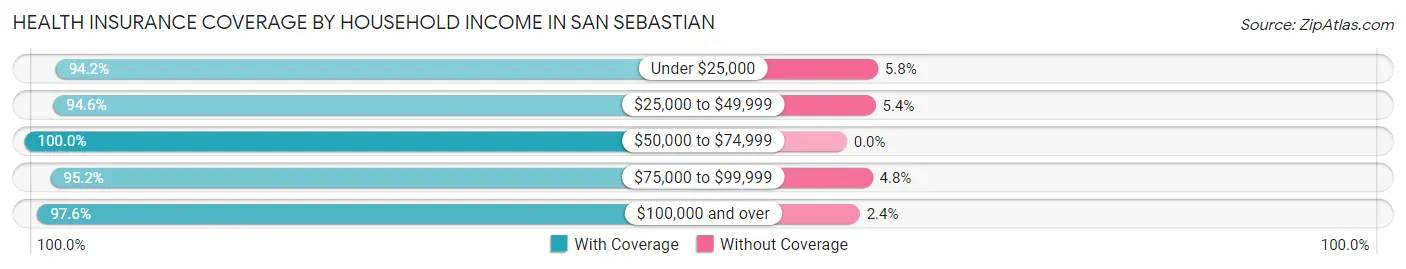
| Household Income | With Coverage | Without Coverage |
| Under $25,000 | 4,170 (94.2%) | 258 (5.8%) |
| $25,000 to $49,999 | 2,322 (94.6%) | 132 (5.4%) |
| $50,000 to $74,999 | 1,016 (100.0%) | 0 (0.0%) |
| $75,000 to $99,999 | 550 (95.2%) | 28 (4.8%) |
| $100,000 and over | 525 (97.6%) | 13 (2.4%) |
Public vs Private Health Insurance Coverage by Age in San Sebastian
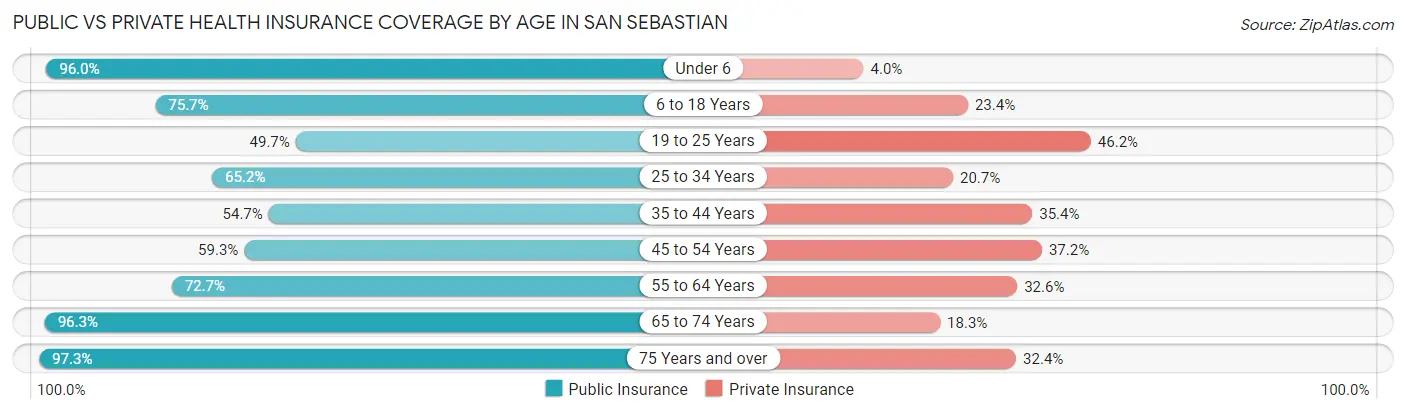
| Age Bracket | Public Insurance | Private Insurance |
| Under 6 | 546 (96.0%) | 23 (4.0%) |
| 6 to 18 Years | 970 (75.7%) | 300 (23.4%) |
| 19 to 25 Years | 416 (49.7%) | 387 (46.2%) |
| 25 to 34 Years | 622 (65.2%) | 197 (20.6%) |
| 35 to 44 Years | 523 (54.7%) | 338 (35.4%) |
| 45 to 54 Years | 660 (59.3%) | 414 (37.2%) |
| 55 to 64 Years | 692 (72.7%) | 310 (32.6%) |
| 65 to 74 Years | 1,054 (96.3%) | 200 (18.3%) |
| 75 Years and over | 1,227 (97.3%) | 408 (32.4%) |
| Total | 6,710 (74.4%) | 2,577 (28.6%) |
Disability Status by Sex by Age in San Sebastian
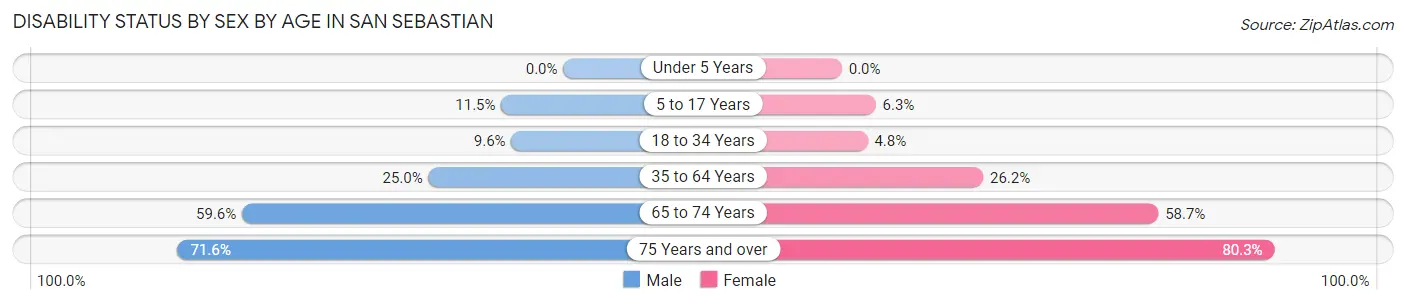
| Age Bracket | Male | Female |
| Under 5 Years | 0 (0.0%) | 0 (0.0%) |
| 5 to 17 Years | 73 (11.5%) | 39 (6.3%) |
| 18 to 34 Years | 91 (9.6%) | 46 (4.8%) |
| 35 to 64 Years | 342 (25.0%) | 434 (26.2%) |
| 65 to 74 Years | 257 (59.6%) | 390 (58.7%) |
| 75 Years and over | 376 (71.6%) | 591 (80.3%) |
Disability Class by Sex by Age in San Sebastian
Disability Class: Hearing Difficulty
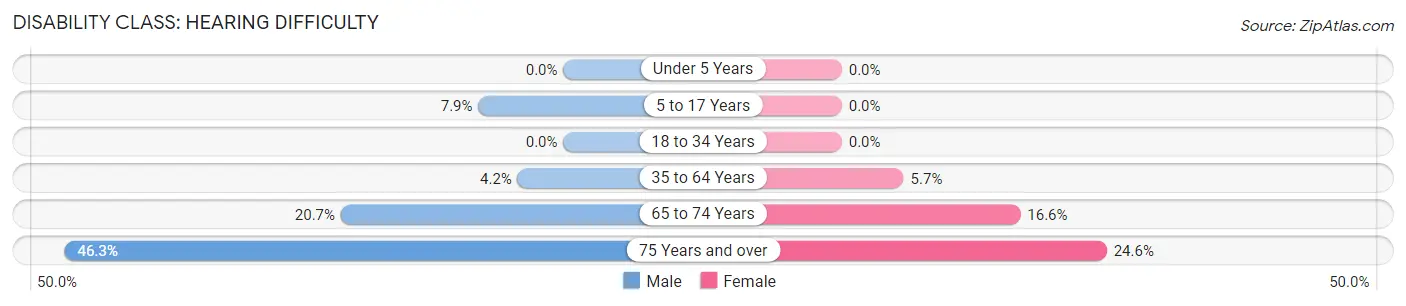
| Age Bracket | Male | Female |
| Under 5 Years | 0 (0.0%) | 0 (0.0%) |
| 5 to 17 Years | 50 (7.9%) | 0 (0.0%) |
| 18 to 34 Years | 0 (0.0%) | 0 (0.0%) |
| 35 to 64 Years | 58 (4.2%) | 95 (5.7%) |
| 65 to 74 Years | 89 (20.6%) | 110 (16.6%) |
| 75 Years and over | 243 (46.3%) | 181 (24.6%) |
Disability Class: Vision Difficulty
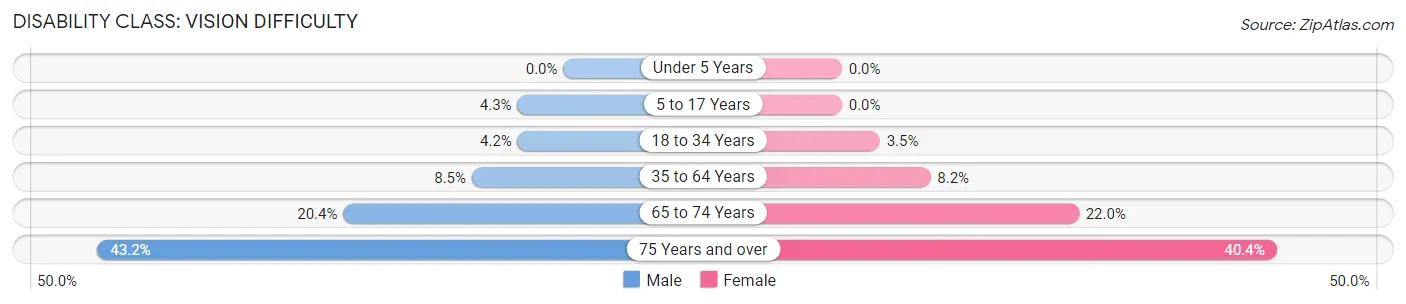
| Age Bracket | Male | Female |
| Under 5 Years | 0 (0.0%) | 0 (0.0%) |
| 5 to 17 Years | 27 (4.3%) | 0 (0.0%) |
| 18 to 34 Years | 40 (4.2%) | 34 (3.5%) |
| 35 to 64 Years | 116 (8.5%) | 136 (8.2%) |
| 65 to 74 Years | 88 (20.4%) | 146 (22.0%) |
| 75 Years and over | 227 (43.2%) | 297 (40.4%) |
Disability Class: Cognitive Difficulty
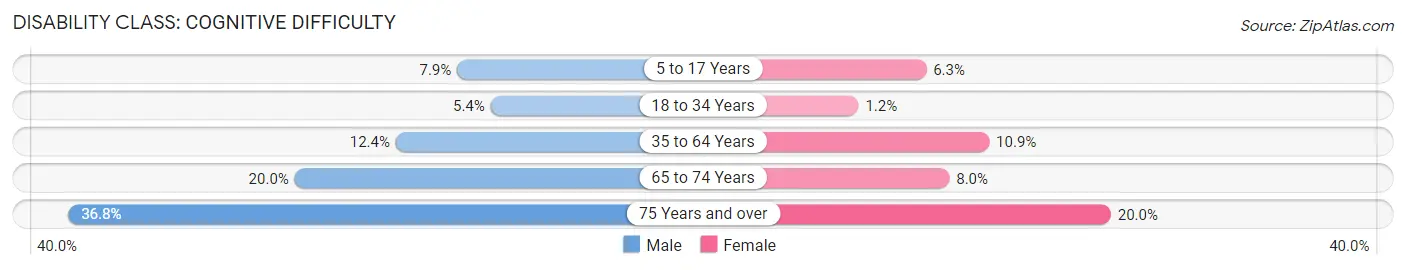
| Age Bracket | Male | Female |
| 5 to 17 Years | 50 (7.9%) | 39 (6.3%) |
| 18 to 34 Years | 51 (5.4%) | 12 (1.2%) |
| 35 to 64 Years | 170 (12.4%) | 181 (10.9%) |
| 65 to 74 Years | 86 (20.0%) | 53 (8.0%) |
| 75 Years and over | 193 (36.8%) | 147 (20.0%) |
Disability Class: Ambulatory Difficulty
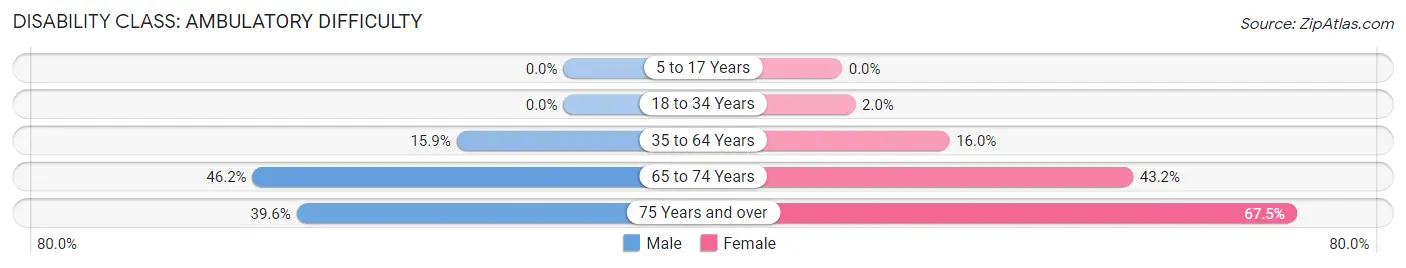
| Age Bracket | Male | Female |
| 5 to 17 Years | 0 (0.0%) | 0 (0.0%) |
| 18 to 34 Years | 0 (0.0%) | 19 (2.0%) |
| 35 to 64 Years | 217 (15.9%) | 264 (16.0%) |
| 65 to 74 Years | 199 (46.2%) | 287 (43.2%) |
| 75 Years and over | 208 (39.6%) | 497 (67.5%) |
Disability Class: Self-Care Difficulty
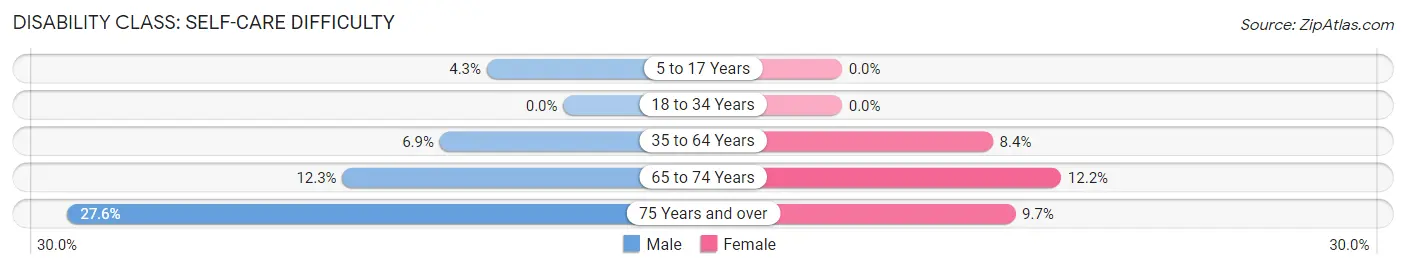
| Age Bracket | Male | Female |
| 5 to 17 Years | 27 (4.3%) | 0 (0.0%) |
| 18 to 34 Years | 0 (0.0%) | 0 (0.0%) |
| 35 to 64 Years | 94 (6.9%) | 139 (8.4%) |
| 65 to 74 Years | 53 (12.3%) | 81 (12.2%) |
| 75 Years and over | 145 (27.6%) | 71 (9.7%) |
Technology Access in San Sebastian
Computing Device Access in San Sebastian
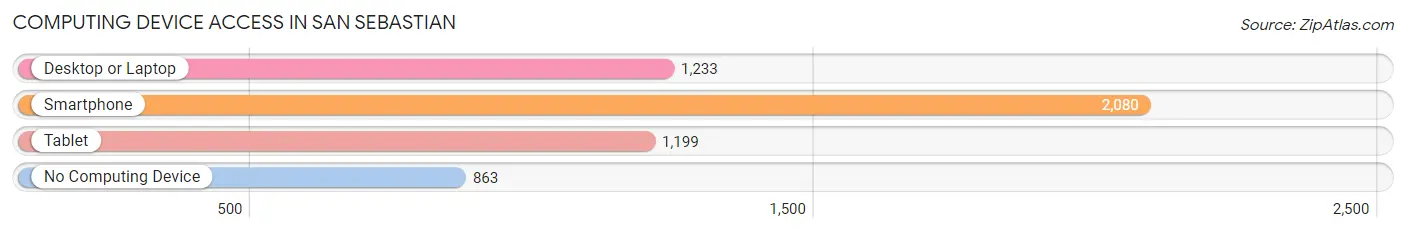
| Device Type | # Households | % Households |
| Desktop or Laptop | 1,233 | 38.6% |
| Smartphone | 2,080 | 65.2% |
| Tablet | 1,199 | 37.6% |
| No Computing Device | 863 | 27.0% |
| Total | 3,191 | 100.0% |
Internet Access in San Sebastian
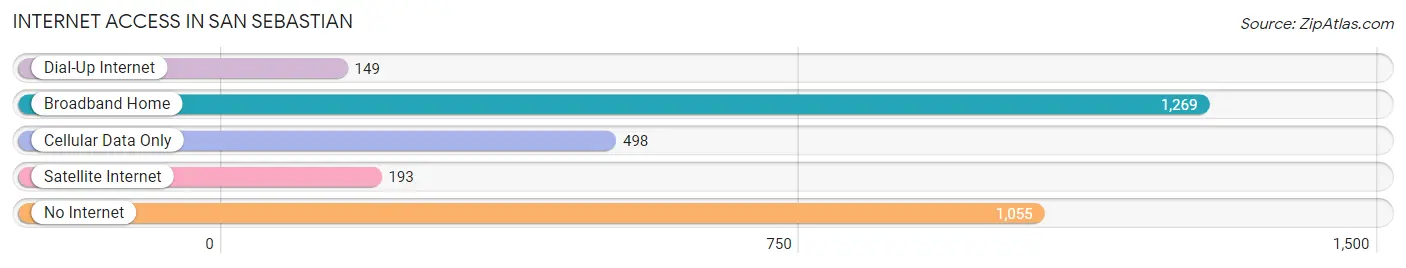
| Internet Type | # Households | % Households |
| Dial-Up Internet | 149 | 4.7% |
| Broadband Home | 1,269 | 39.8% |
| Cellular Data Only | 498 | 15.6% |
| Satellite Internet | 193 | 6.0% |
| No Internet | 1,055 | 33.1% |
| Total | 3,191 | 100.0% |
San Sebastian Summary
San Sebastian is a municipality located in the northwest of Puerto Rico, in the region known as the Western Region. It is bordered by the municipalities of Las Marias, Moca, and Añasco. San Sebastian is known as the “Ciudad de los Artesanos” (City of Artisans) due to its rich history of craftsmanship and artistry.
History
San Sebastian was founded in 1752 by Don Juan de Aponte y Díaz, a Spanish military officer. The town was originally named “San Sebastian de la Cruz” after the patron saint of the town, Saint Sebastian. The town was officially recognized by the Spanish government in 1776.
During the 19th century, San Sebastian was an important center of commerce and industry. The town was home to several factories, including a sugar mill, a tobacco factory, and a textile mill. The town was also home to several artisans, including carpenters, blacksmiths, and potters.
In 1898, San Sebastian was occupied by the United States during the Spanish-American War. After the war, the town was incorporated into the newly formed Commonwealth of Puerto Rico.
Geography
San Sebastian is located in the northwest of Puerto Rico, in the region known as the Western Region. It is bordered by the municipalities of Las Marias, Moca, and Añasco. The town is situated in the foothills of the Cordillera Central mountain range.
The town has a total area of 24.2 square miles (62.6 km2). The terrain is mostly hilly, with some flat areas. The highest point in the town is Cerro de la Cruz, which has an elevation of 1,890 feet (576 m).
Economy
San Sebastian’s economy is largely based on agriculture and tourism. The town is home to several farms, which produce a variety of crops, including coffee, bananas, and plantains. The town is also home to several tourist attractions, including the San Sebastian Historical Museum and the San Sebastian Artisans’ Market.
The town is also home to several manufacturing companies, including a pharmaceutical company, a plastics factory, and a furniture factory.
Demographics
As of the 2010 census, San Sebastian had a population of 33,844. The population is mostly of Puerto Rican descent, with a small minority of African and European descent. The town has a median age of 36.7 years.
The town has a literacy rate of 97.2%, which is higher than the national average. The town also has a high rate of employment, with an unemployment rate of only 4.2%.
San Sebastian is a vibrant and diverse town with a rich history and culture. The town is home to a variety of industries and attractions, making it an ideal place to live and work.
Common Questions
What is Per Capita Income in San Sebastian?
Per Capita income in San Sebastian is $13,835.
What is the Median Family Income in San Sebastian?
Median Family Income in San Sebastian is $26,585.
What is the Median Household income in San Sebastian?
Median Household Income in San Sebastian is $18,806.
What is Income or Wage Gap in San Sebastian?
Income or Wage Gap in San Sebastian is 22.9%.
Women in San Sebastian earn 77.1 cents for every dollar earned by a man.
What is Family Income Deficit in San Sebastian?
Family Income Deficit in San Sebastian is $12,724.
Families that are below poverty line in San Sebastian earn $12,724 less on average than the poverty threshold level.
What is Inequality or Gini Index in San Sebastian?
Inequality or Gini Index in San Sebastian is 0.59.
What is the Total Population of San Sebastian?
Total Population of San Sebastian is 9,041.
What is the Total Male Population of San Sebastian?
Total Male Population of San Sebastian is 4,075.
What is the Total Female Population of San Sebastian?
Total Female Population of San Sebastian is 4,966.
What is the Ratio of Males per 100 Females in San Sebastian?
There are 82.06 Males per 100 Females in San Sebastian.
What is the Ratio of Females per 100 Males in San Sebastian?
There are 121.87 Females per 100 Males in San Sebastian.
What is the Median Population Age in San Sebastian?
Median Population Age in San Sebastian is 43.9 Years.
What is the Average Family Size in San Sebastian
Average Family Size in San Sebastian is 3.6 People.
What is the Average Household Size in San Sebastian
Average Household Size in San Sebastian is 2.8 People.
How Large is the Labor Force in San Sebastian?
There are 2,746 People in the Labor Forcein in San Sebastian.
What is the Percentage of People in the Labor Force in San Sebastian?
36.6% of People are in the Labor Force in San Sebastian.
What is the Unemployment Rate in San Sebastian?
Unemployment Rate in San Sebastian is 17.4%.