Vega Alta, PR Map & Demographics
Vega Alta Map
Vega Alta Overview
$13,259
PER CAPITA INCOME
$24,623
AVG FAMILY INCOME
$24,231
AVG HOUSEHOLD INCOME
8.3%
WAGE / INCOME GAP [ % ]
91.7¢/ $1
WAGE / INCOME GAP [ $ ]
$13,108
FAMILY INCOME DEFICIT
0.49
INEQUALITY / GINI INDEX
9,179
TOTAL POPULATION
4,311
MALE POPULATION
4,868
FEMALE POPULATION
88.56
MALES / 100 FEMALES
112.92
FEMALES / 100 MALES
43.0
MEDIAN AGE
3.1
AVG FAMILY SIZE
2.7
AVG HOUSEHOLD SIZE
3,824
LABOR FORCE [ PEOPLE ]
47.8%
PERCENT IN LABOR FORCE
23.8%
UNEMPLOYMENT RATE
Vega Alta Zip Codes
Vega Alta Area Codes
Income in Vega Alta
Income Overview in Vega Alta
Per Capita Income in Vega Alta is $13,259, while median incomes of families and households are $24,623 and $24,231 respectively.
| Characteristic | Number | Measure |
| Per Capita Income | 9,179 | $13,259 |
| Median Family Income | 2,427 | $24,623 |
| Mean Family Income | 2,427 | $32,453 |
| Median Household Income | 3,327 | $24,231 |
| Mean Household Income | 3,327 | $33,694 |
| Income Deficit | 2,427 | $13,108 |
| Wage / Income Gap (%) | 9,179 | 8.26% |
| Wage / Income Gap ($) | 9,179 | 91.74¢ per $1 |
| Gini / Inequality Index | 9,179 | 0.49 |
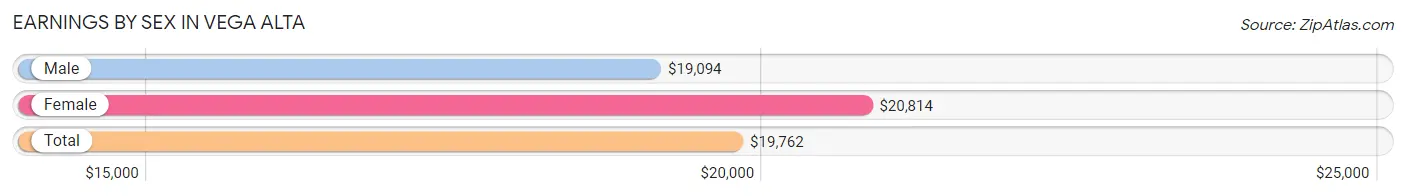
Earnings by Sex in Vega Alta
Average Earnings in Vega Alta are $19,762, $19,094 for men and $20,814 for women, a difference of 8.3%.
| Sex | Number | Average Earnings |
| Male | 1,650 (53.8%) | $19,094 |
| Female | 1,417 (46.2%) | $20,814 |
| Total | 3,067 (100.0%) | $19,762 |
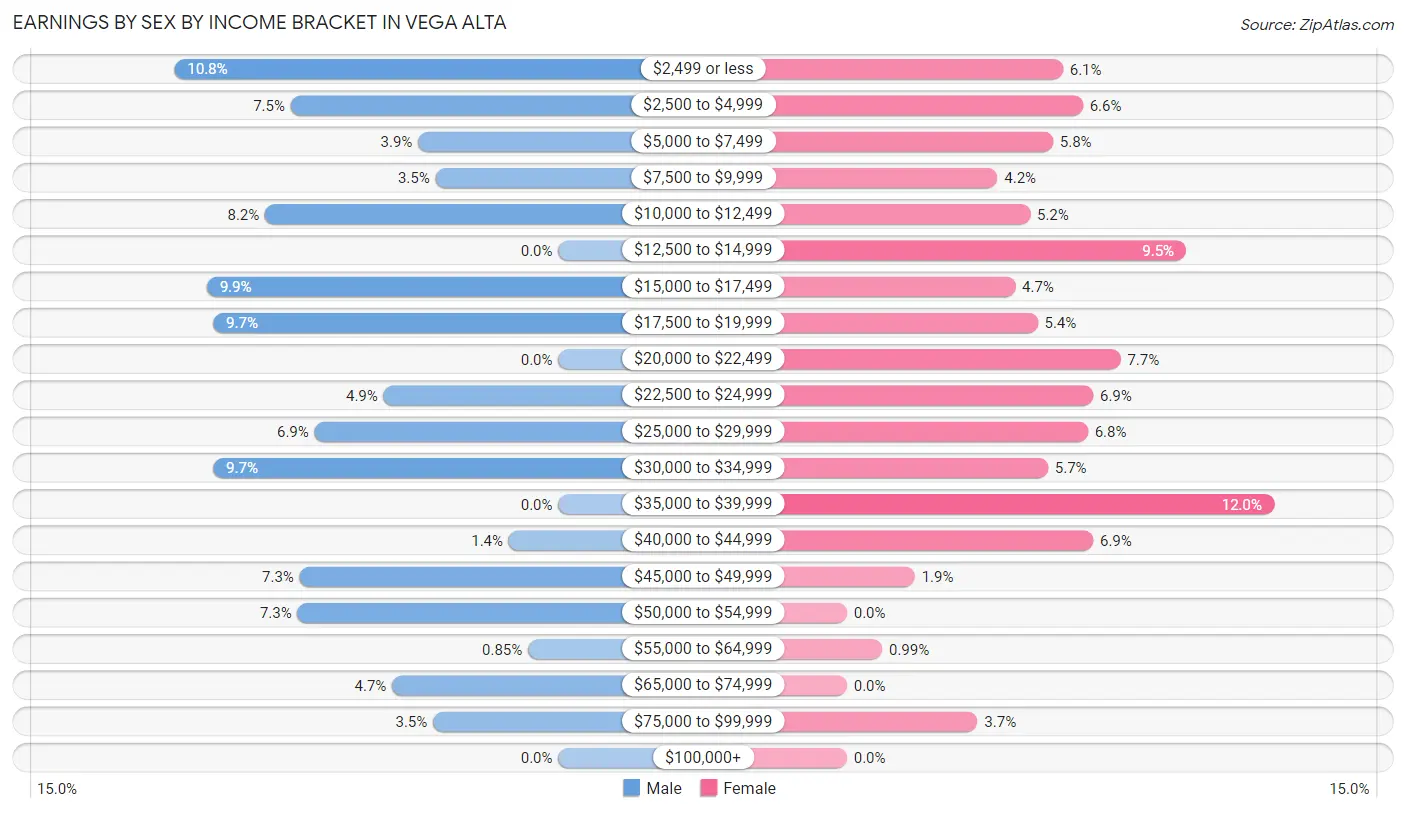
Earnings by Sex by Income Bracket in Vega Alta
The most common earnings brackets in Vega Alta are $2,499 or less for men (178 | 10.8%) and $35,000 to $39,999 for women (170 | 12.0%).
| Income | Male | Female |
| $2,499 or less | 178 (10.8%) | 86 (6.1%) |
| $2,500 to $4,999 | 124 (7.5%) | 94 (6.6%) |
| $5,000 to $7,499 | 65 (3.9%) | 82 (5.8%) |
| $7,500 to $9,999 | 57 (3.5%) | 60 (4.2%) |
| $10,000 to $12,499 | 136 (8.2%) | 73 (5.1%) |
| $12,500 to $14,999 | 0 (0.0%) | 135 (9.5%) |
| $15,000 to $17,499 | 163 (9.9%) | 67 (4.7%) |
| $17,500 to $19,999 | 160 (9.7%) | 76 (5.4%) |
| $20,000 to $22,499 | 0 (0.0%) | 109 (7.7%) |
| $22,500 to $24,999 | 81 (4.9%) | 98 (6.9%) |
| $25,000 to $29,999 | 113 (6.9%) | 96 (6.8%) |
| $30,000 to $34,999 | 160 (9.7%) | 80 (5.7%) |
| $35,000 to $39,999 | 0 (0.0%) | 170 (12.0%) |
| $40,000 to $44,999 | 23 (1.4%) | 98 (6.9%) |
| $45,000 to $49,999 | 120 (7.3%) | 27 (1.9%) |
| $50,000 to $54,999 | 121 (7.3%) | 0 (0.0%) |
| $55,000 to $64,999 | 14 (0.9%) | 14 (1.0%) |
| $65,000 to $74,999 | 77 (4.7%) | 0 (0.0%) |
| $75,000 to $99,999 | 58 (3.5%) | 52 (3.7%) |
| $100,000+ | 0 (0.0%) | 0 (0.0%) |
| Total | 1,650 (100.0%) | 1,417 (100.0%) |
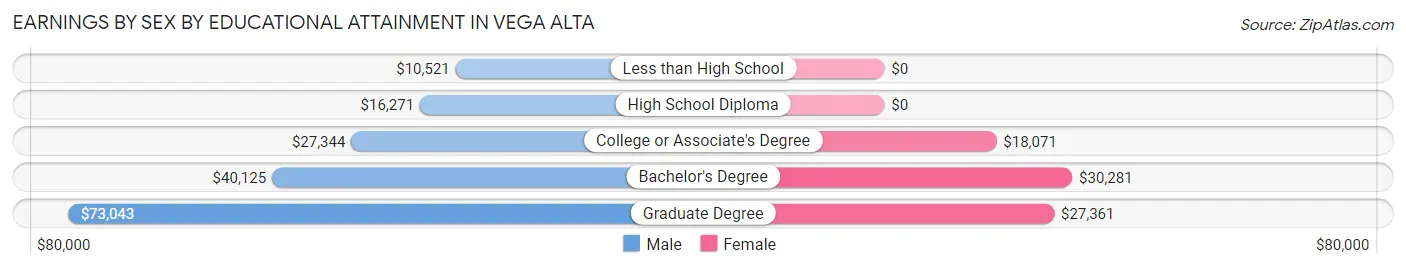
Earnings by Sex by Educational Attainment in Vega Alta
Average earnings in Vega Alta are $23,276 for men and $21,720 for women, a difference of 6.7%. Men with an educational attainment of graduate degree enjoy the highest average annual earnings of $73,043, while those with less than high school education earn the least with $10,521. Women with an educational attainment of bachelor's degree earn the most with the average annual earnings of $30,281, while those with college or associate's degree education have the smallest earnings of $18,071.
| Educational Attainment | Male Income | Female Income |
| Less than High School | $10,521 | $0 |
| High School Diploma | $16,271 | $0 |
| College or Associate's Degree | $27,344 | $18,071 |
| Bachelor's Degree | $40,125 | $30,281 |
| Graduate Degree | $73,043 | $27,361 |
| Total | $23,276 | $21,720 |
Family Income in Vega Alta
Family Income Brackets in Vega Alta
According to the Vega Alta family income data, there are 590 families falling into the less than $10,000 income range, which is the most common income bracket and makes up 24.3% of all families.
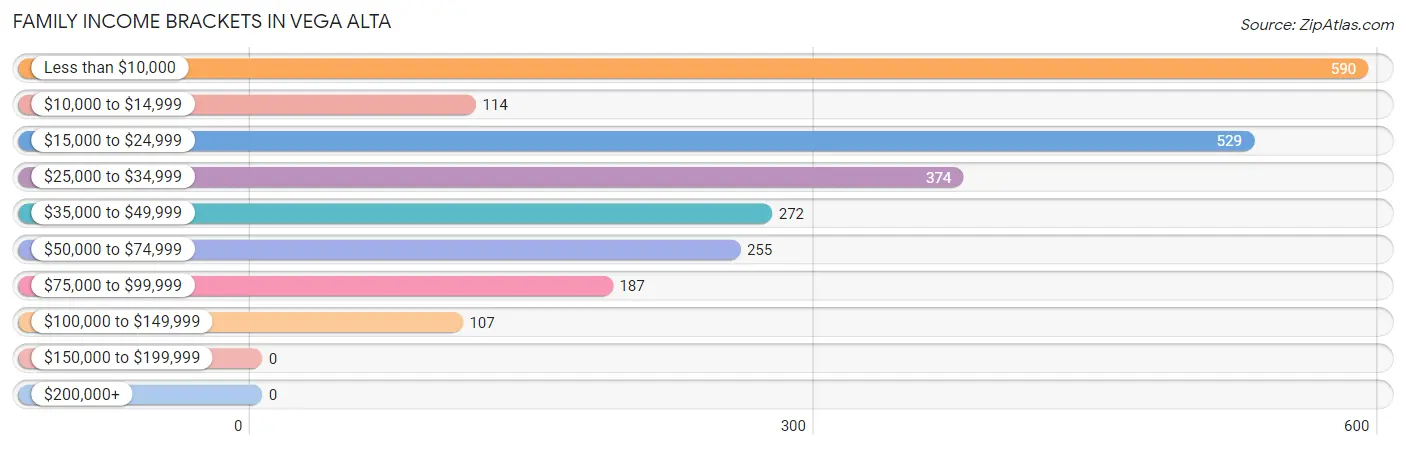
| Income Bracket | # Families | % Families |
| Less than $10,000 | 590 | 24.3% |
| $10,000 to $14,999 | 114 | 4.7% |
| $15,000 to $24,999 | 529 | 21.8% |
| $25,000 to $34,999 | 374 | 15.4% |
| $35,000 to $49,999 | 272 | 11.2% |
| $50,000 to $74,999 | 255 | 10.5% |
| $75,000 to $99,999 | 187 | 7.7% |
| $100,000 to $149,999 | 107 | 4.4% |
| $150,000 to $199,999 | 0 | 0.0% |
| $200,000+ | 0 | 0.0% |
Family Income by Famaliy Size in Vega Alta
5-person families (167 | 6.9%) account for the highest median family income in Vega Alta with $44,954 per family, while 2-person families (1,265 | 52.1%) have the highest median income of $11,313 per family member.
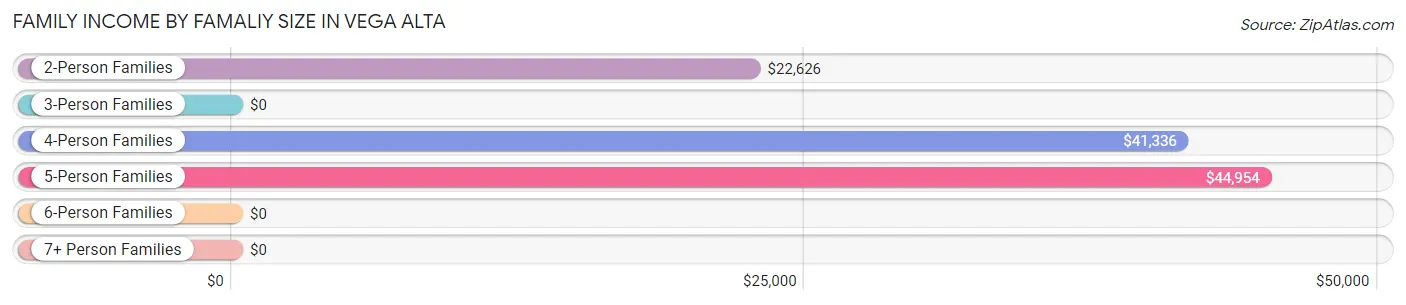
| Income Bracket | # Families | Median Income |
| 2-Person Families | 1,265 (52.1%) | $22,626 |
| 3-Person Families | 637 (26.3%) | $0 |
| 4-Person Families | 301 (12.4%) | $41,336 |
| 5-Person Families | 167 (6.9%) | $44,954 |
| 6-Person Families | 57 (2.4%) | $0 |
| 7+ Person Families | 0 (0.0%) | $0 |
| Total | 2,427 (100.0%) | $24,623 |
Family Income by Number of Earners in Vega Alta
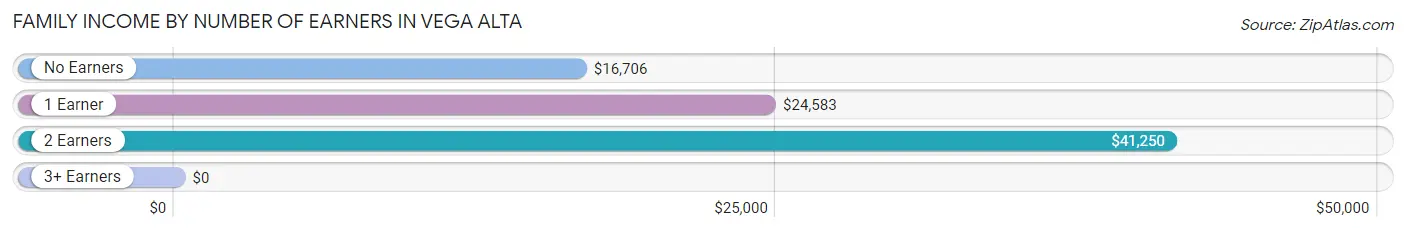
| Number of Earners | # Families | Median Income |
| No Earners | 1,060 (43.7%) | $16,706 |
| 1 Earner | 812 (33.5%) | $24,583 |
| 2 Earners | 408 (16.8%) | $41,250 |
| 3+ Earners | 147 (6.1%) | $0 |
| Total | 2,427 (100.0%) | $24,623 |
Household Income in Vega Alta
Household Income Brackets in Vega Alta
With 788 households falling in the category, the less than $10,000 income range is the most frequent in Vega Alta, accounting for 23.7% of all households.
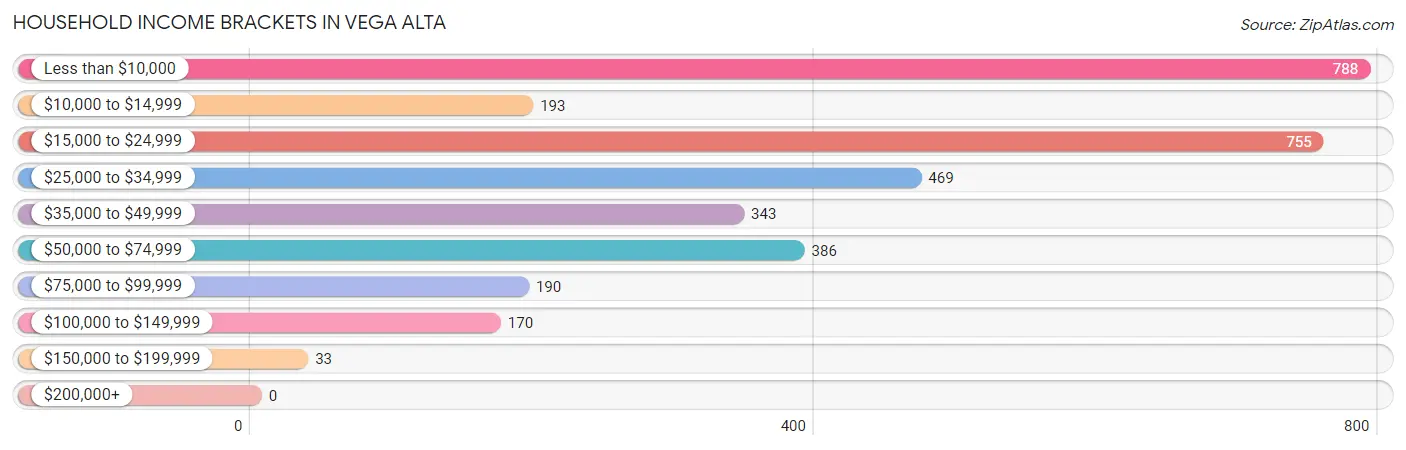
| Income Bracket | # Households | % Households |
| Less than $10,000 | 788 | 23.7% |
| $10,000 to $14,999 | 193 | 5.8% |
| $15,000 to $24,999 | 755 | 22.7% |
| $25,000 to $34,999 | 469 | 14.1% |
| $35,000 to $49,999 | 343 | 10.3% |
| $50,000 to $74,999 | 386 | 11.6% |
| $75,000 to $99,999 | 190 | 5.7% |
| $100,000 to $149,999 | 170 | 5.1% |
| $150,000 to $199,999 | 33 | 1.0% |
| $200,000+ | 0 | 0.0% |
Household Income by Householder Age in Vega Alta
The median household income in Vega Alta is $24,231, with the highest median household income of $30,703 found in the 25 to 44 years age bracket for the primary householder. A total of 804 households (24.2%) fall into this category. Meanwhile, the 15 to 24 years age bracket for the primary householder has the lowest median household income of $0, with 42 households (1.3%) in this group.
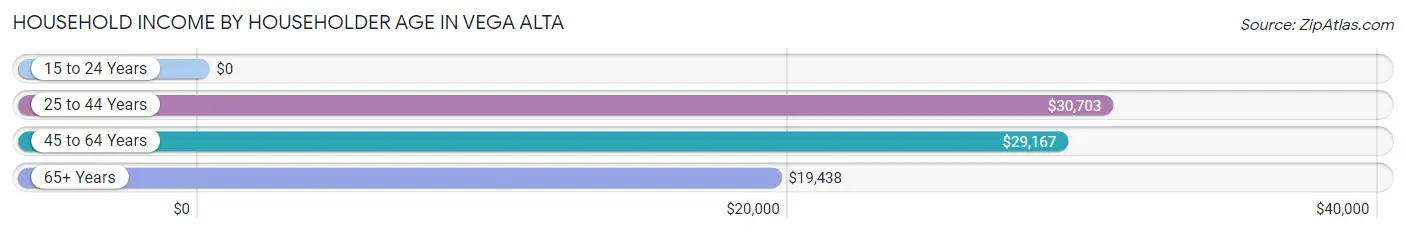
| Income Bracket | # Households | Median Income |
| 15 to 24 Years | 42 (1.3%) | $0 |
| 25 to 44 Years | 804 (24.2%) | $30,703 |
| 45 to 64 Years | 1,286 (38.7%) | $29,167 |
| 65+ Years | 1,195 (35.9%) | $19,438 |
| Total | 3,327 (100.0%) | $24,231 |
Poverty in Vega Alta
Income Below Poverty by Sex and Age in Vega Alta
With 44.5% poverty level for males and 40.2% for females among the residents of Vega Alta, 12 to 14 year old males and 15 year old females are the most vulnerable to poverty, with 159 males (82.8%) and 24 females (100.0%) in their respective age groups living below the poverty level.
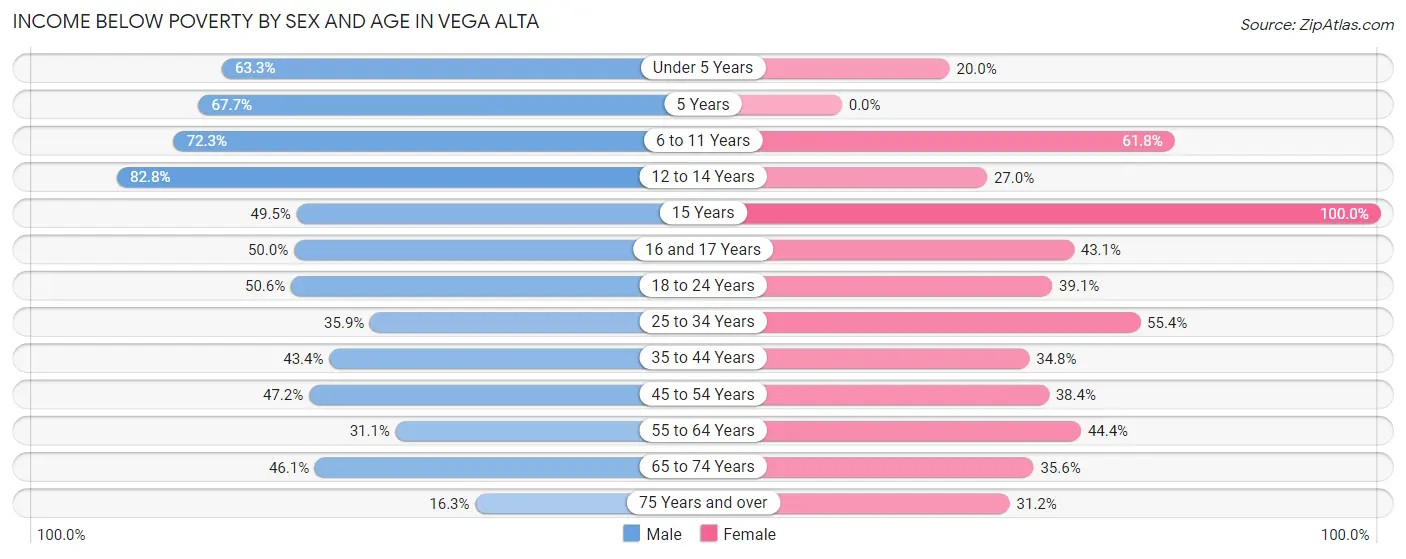
| Age Bracket | Male | Female |
| Under 5 Years | 95 (63.3%) | 21 (20.0%) |
| 5 Years | 44 (67.7%) | 0 (0.0%) |
| 6 to 11 Years | 217 (72.3%) | 63 (61.8%) |
| 12 to 14 Years | 159 (82.8%) | 38 (27.0%) |
| 15 Years | 50 (49.5%) | 24 (100.0%) |
| 16 and 17 Years | 11 (50.0%) | 62 (43.1%) |
| 18 to 24 Years | 228 (50.5%) | 180 (39.1%) |
| 25 to 34 Years | 251 (35.9%) | 361 (55.4%) |
| 35 to 44 Years | 222 (43.4%) | 156 (34.8%) |
| 45 to 54 Years | 194 (47.2%) | 247 (38.4%) |
| 55 to 64 Years | 206 (31.1%) | 293 (44.4%) |
| 65 to 74 Years | 183 (46.1%) | 195 (35.6%) |
| 75 Years and over | 57 (16.3%) | 214 (31.1%) |
| Total | 1,917 (44.5%) | 1,854 (40.2%) |
Income Above Poverty by Sex and Age in Vega Alta
According to the poverty statistics in Vega Alta, males aged 75 years and over and females aged under 5 years are the age groups that are most secure financially, with 83.7% of males and 80.0% of females in these age groups living above the poverty line.
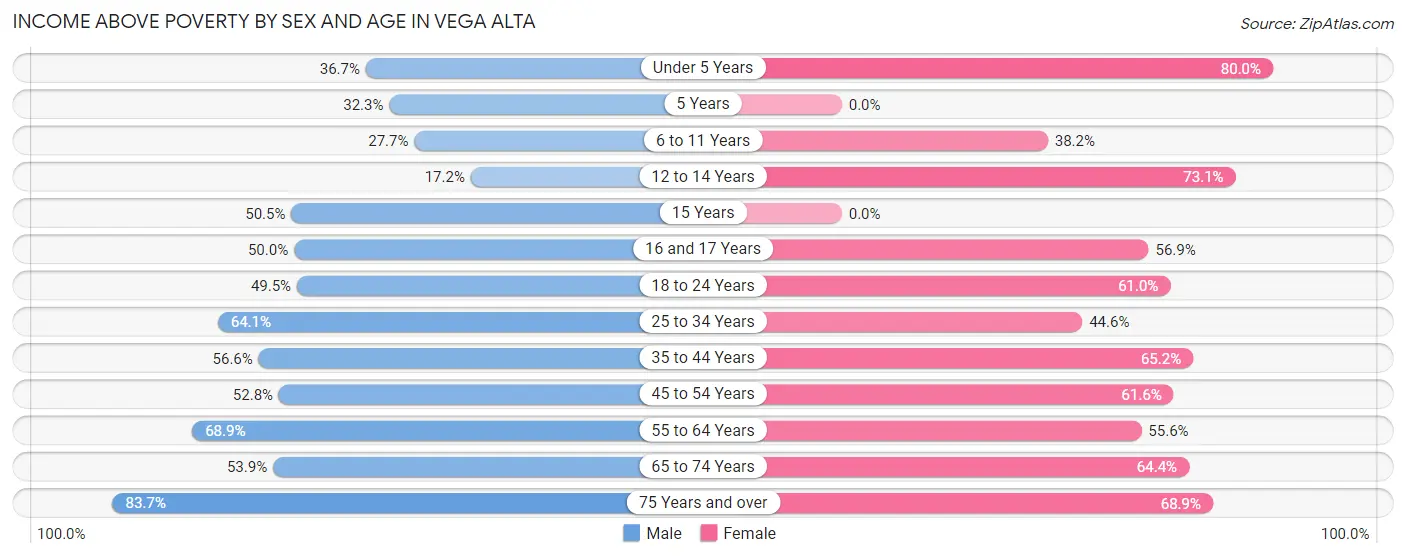
| Age Bracket | Male | Female |
| Under 5 Years | 55 (36.7%) | 84 (80.0%) |
| 5 Years | 21 (32.3%) | 0 (0.0%) |
| 6 to 11 Years | 83 (27.7%) | 39 (38.2%) |
| 12 to 14 Years | 33 (17.2%) | 103 (73.1%) |
| 15 Years | 51 (50.5%) | 0 (0.0%) |
| 16 and 17 Years | 11 (50.0%) | 82 (56.9%) |
| 18 to 24 Years | 223 (49.4%) | 281 (61.0%) |
| 25 to 34 Years | 449 (64.1%) | 291 (44.6%) |
| 35 to 44 Years | 289 (56.6%) | 292 (65.2%) |
| 45 to 54 Years | 217 (52.8%) | 396 (61.6%) |
| 55 to 64 Years | 456 (68.9%) | 367 (55.6%) |
| 65 to 74 Years | 214 (53.9%) | 353 (64.4%) |
| 75 Years and over | 292 (83.7%) | 473 (68.9%) |
| Total | 2,394 (55.5%) | 2,761 (59.8%) |
Income Below Poverty Among Married-Couple Families in Vega Alta
The poverty statistics for married-couple families in Vega Alta show that 33.7% or 459 of the total 1,362 families live below the poverty line. Families with 3 or 4 children have the highest poverty rate of 50.7%, comprising of 36 families. On the other hand, families with 1 or 2 children have the lowest poverty rate of 28.9%, which includes 110 families.
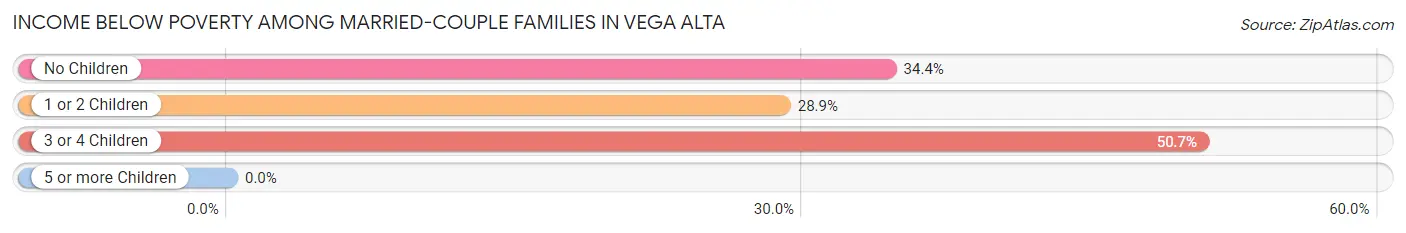
| Children | Above Poverty | Below Poverty |
| No Children | 597 (65.6%) | 313 (34.4%) |
| 1 or 2 Children | 271 (71.1%) | 110 (28.9%) |
| 3 or 4 Children | 35 (49.3%) | 36 (50.7%) |
| 5 or more Children | 0 (0.0%) | 0 (0.0%) |
| Total | 903 (66.3%) | 459 (33.7%) |
Income Below Poverty Among Single-Parent Households in Vega Alta
According to the poverty data in Vega Alta, 48.7% or 191 single-father households and 59.0% or 397 single-mother households are living below the poverty line. Among single-father households, those with 1 or 2 children have the highest poverty rate, with 161 households (89.9%) experiencing poverty. Likewise, among single-mother households, those with 3 or 4 children have the highest poverty rate, with 61 households (100.0%) falling below the poverty line.
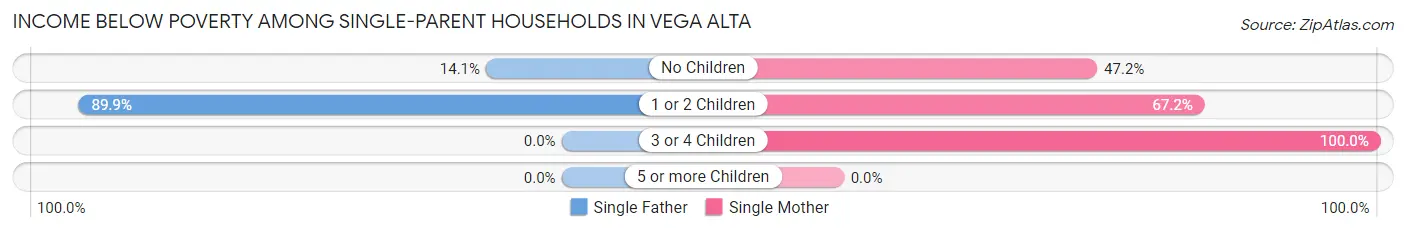
| Children | Single Father | Single Mother |
| No Children | 30 (14.1%) | 178 (47.2%) |
| 1 or 2 Children | 161 (89.9%) | 158 (67.2%) |
| 3 or 4 Children | 0 (0.0%) | 61 (100.0%) |
| 5 or more Children | 0 (0.0%) | 0 (0.0%) |
| Total | 191 (48.7%) | 397 (59.0%) |
Income Below Poverty Among Married-Couple vs Single-Parent Households in Vega Alta
The poverty data for Vega Alta shows that 459 of the married-couple family households (33.7%) and 588 of the single-parent households (55.2%) are living below the poverty level. Within the married-couple family households, those with 3 or 4 children have the highest poverty rate, with 36 households (50.7%) falling below the poverty line. Among the single-parent households, those with 3 or 4 children have the highest poverty rate, with 61 household (100.0%) living below poverty.
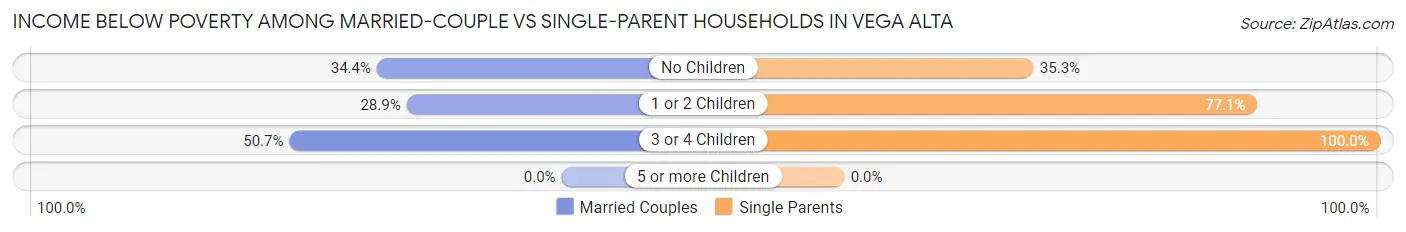
| Children | Married-Couple Families | Single-Parent Households |
| No Children | 313 (34.4%) | 208 (35.2%) |
| 1 or 2 Children | 110 (28.9%) | 319 (77.0%) |
| 3 or 4 Children | 36 (50.7%) | 61 (100.0%) |
| 5 or more Children | 0 (0.0%) | 0 (0.0%) |
| Total | 459 (33.7%) | 588 (55.2%) |
Race in Vega Alta
The most populous races in Vega Alta are Hispanic or Latino (9,081 | 98.9%), White / Caucasian (3,237 | 35.3%), and Two or more Races (3,004 | 32.7%).
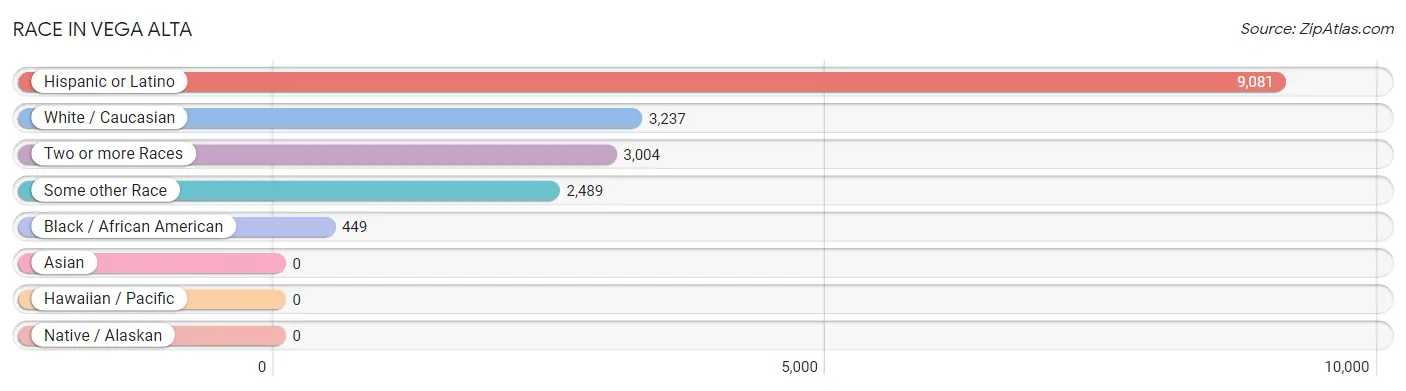
| Race | # Population | % Population |
| Asian | 0 | 0.0% |
| Black / African American | 449 | 4.9% |
| Hawaiian / Pacific | 0 | 0.0% |
| Hispanic or Latino | 9,081 | 98.9% |
| Native / Alaskan | 0 | 0.0% |
| White / Caucasian | 3,237 | 35.3% |
| Two or more Races | 3,004 | 32.7% |
| Some other Race | 2,489 | 27.1% |
| Total | 9,179 | 100.0% |
Ancestry in Vega Alta
The most populous ancestries reported in Vega Alta are Puerto Rican (8,789 | 95.8%), American (268 | 2.9%), Dominican (109 | 1.2%), Central American (80 | 0.9%), and Arab (45 | 0.5%), together accounting for 101.2% of all Vega Alta residents.
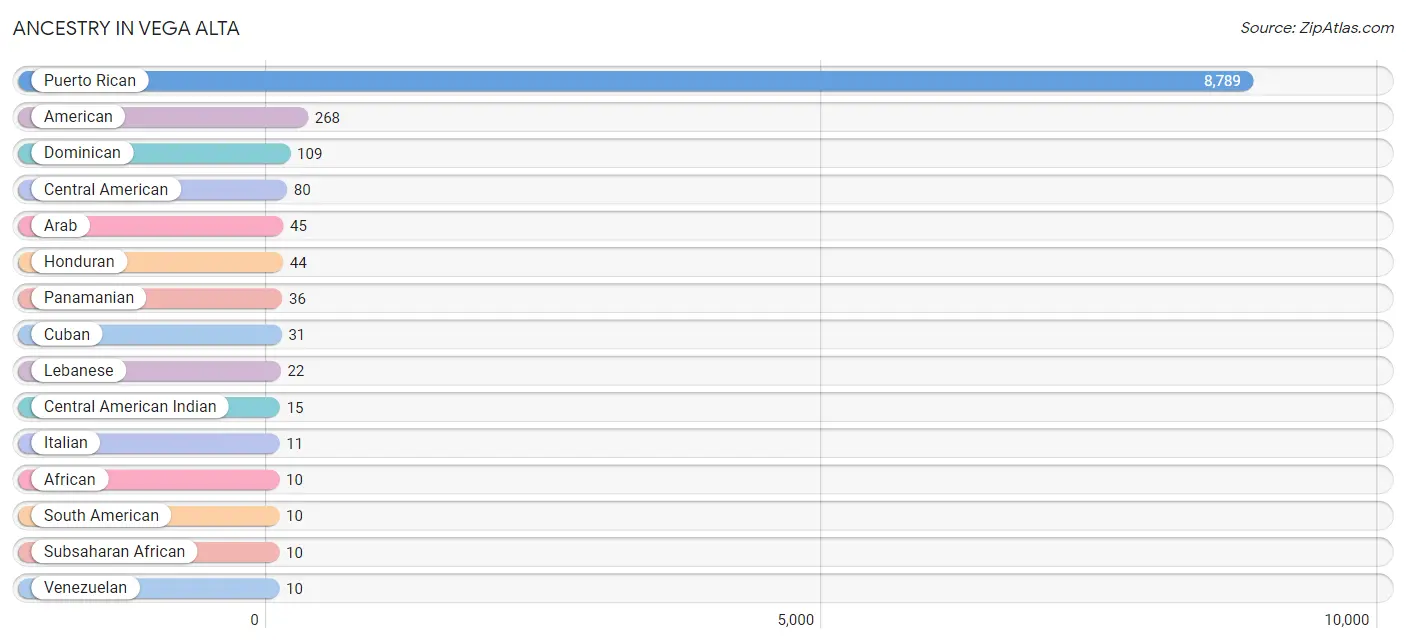
| Ancestry | # Population | % Population |
| African | 10 | 0.1% |
| American | 268 | 2.9% |
| Arab | 45 | 0.5% |
| Central American | 80 | 0.9% |
| Central American Indian | 15 | 0.2% |
| Cuban | 31 | 0.3% |
| Dominican | 109 | 1.2% |
| Honduran | 44 | 0.5% |
| Italian | 11 | 0.1% |
| Lebanese | 22 | 0.2% |
| Panamanian | 36 | 0.4% |
| Puerto Rican | 8,789 | 95.8% |
| South American | 10 | 0.1% |
| Subsaharan African | 10 | 0.1% |
| Venezuelan | 10 | 0.1% |
| West Indian | 9 | 0.1% | View All 16 Rows |
Immigrants in Vega Alta

| Immigration Origin | # Population | % Population | View All 0 Rows |
Sex and Age in Vega Alta
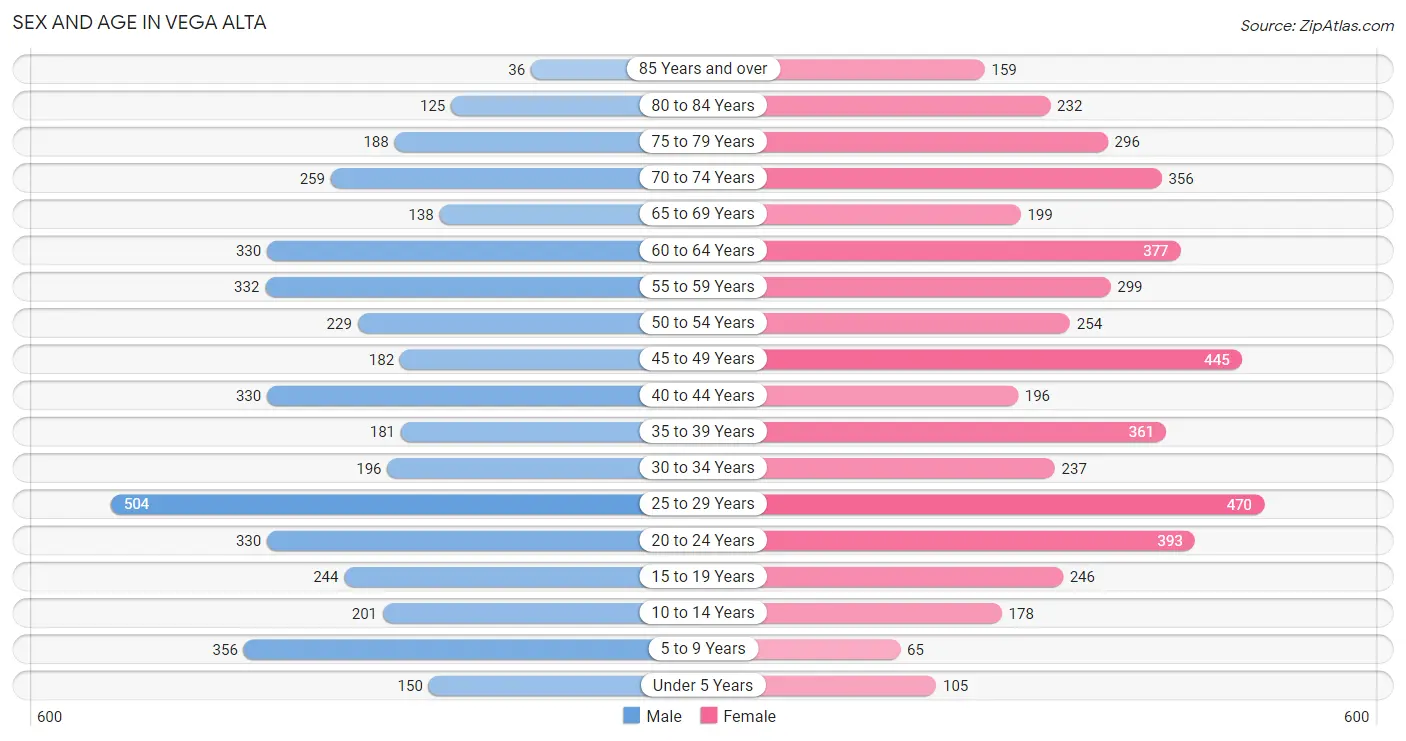
Sex and Age in Vega Alta
The most populous age groups in Vega Alta are 25 to 29 Years (504 | 11.7%) for men and 25 to 29 Years (470 | 9.7%) for women.
| Age Bracket | Male | Female |
| Under 5 Years | 150 (3.5%) | 105 (2.2%) |
| 5 to 9 Years | 356 (8.3%) | 65 (1.3%) |
| 10 to 14 Years | 201 (4.7%) | 178 (3.7%) |
| 15 to 19 Years | 244 (5.7%) | 246 (5.1%) |
| 20 to 24 Years | 330 (7.6%) | 393 (8.1%) |
| 25 to 29 Years | 504 (11.7%) | 470 (9.7%) |
| 30 to 34 Years | 196 (4.5%) | 237 (4.9%) |
| 35 to 39 Years | 181 (4.2%) | 361 (7.4%) |
| 40 to 44 Years | 330 (7.6%) | 196 (4.0%) |
| 45 to 49 Years | 182 (4.2%) | 445 (9.1%) |
| 50 to 54 Years | 229 (5.3%) | 254 (5.2%) |
| 55 to 59 Years | 332 (7.7%) | 299 (6.1%) |
| 60 to 64 Years | 330 (7.6%) | 377 (7.7%) |
| 65 to 69 Years | 138 (3.2%) | 199 (4.1%) |
| 70 to 74 Years | 259 (6.0%) | 356 (7.3%) |
| 75 to 79 Years | 188 (4.4%) | 296 (6.1%) |
| 80 to 84 Years | 125 (2.9%) | 232 (4.8%) |
| 85 Years and over | 36 (0.8%) | 159 (3.3%) |
| Total | 4,311 (100.0%) | 4,868 (100.0%) |
Families and Households in Vega Alta
Median Family Size in Vega Alta
The median family size in Vega Alta is 3.10 persons per family, with married-couple families (1,362 | 56.1%) accounting for the largest median family size of 3.17 persons per family. On the other hand, single female/mother families (673 | 27.7%) represent the smallest median family size with 2.92 persons per family.
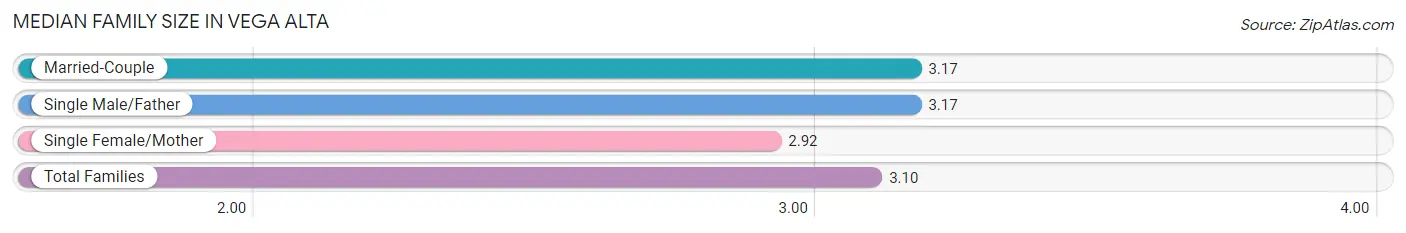
| Family Type | # Families | Family Size |
| Married-Couple | 1,362 (56.1%) | 3.17 |
| Single Male/Father | 392 (16.2%) | 3.17 |
| Single Female/Mother | 673 (27.7%) | 2.92 |
| Total Families | 2,427 (100.0%) | 3.10 |
Median Household Size in Vega Alta
The median household size in Vega Alta is 2.68 persons per household, with single male/father households (392 | 11.8%) accounting for the largest median household size of 3.66 persons per household. non-family households (900 | 27.1%) represent the smallest median household size with 1.16 persons per household.
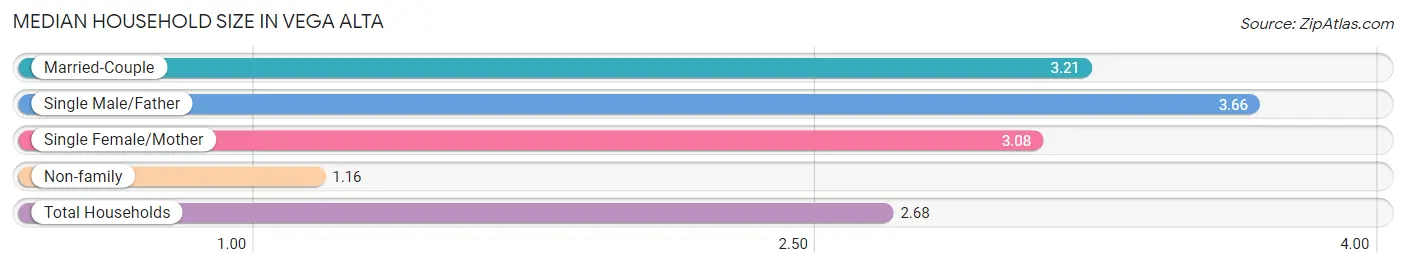
| Household Type | # Households | Household Size |
| Married-Couple | 1,362 (40.9%) | 3.21 |
| Single Male/Father | 392 (11.8%) | 3.66 |
| Single Female/Mother | 673 (20.2%) | 3.08 |
| Non-family | 900 (27.1%) | 1.16 |
| Total Households | 3,327 (100.0%) | 2.68 |
Household Size by Marriage Status in Vega Alta
Out of a total of 3,327 households in Vega Alta, 2,427 (73.0%) are family households, while 900 (27.1%) are nonfamily households. The most numerous type of family households are 2-person households, comprising 1,146, and the most common type of nonfamily households are 1-person households, comprising 765.
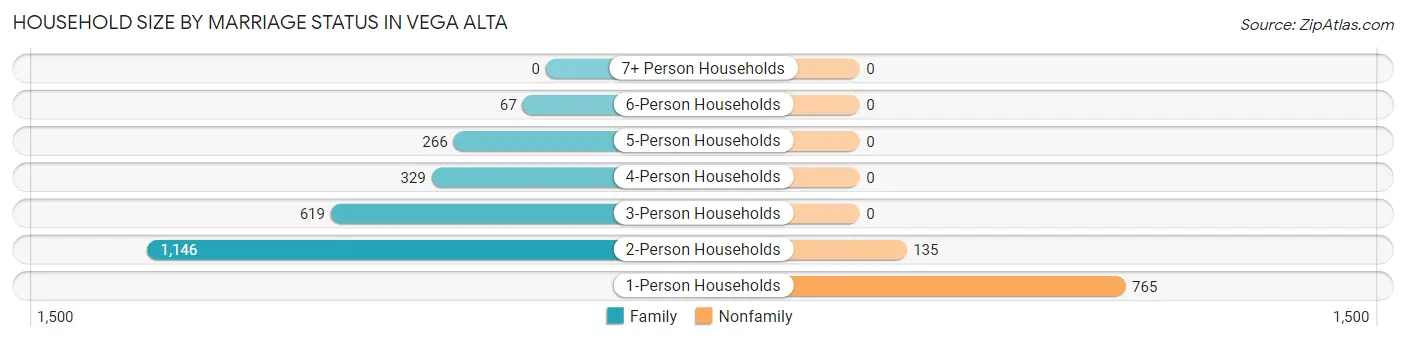
| Household Size | Family Households | Nonfamily Households |
| 1-Person Households | - | 765 (23.0%) |
| 2-Person Households | 1,146 (34.4%) | 135 (4.1%) |
| 3-Person Households | 619 (18.6%) | 0 (0.0%) |
| 4-Person Households | 329 (9.9%) | 0 (0.0%) |
| 5-Person Households | 266 (8.0%) | 0 (0.0%) |
| 6-Person Households | 67 (2.0%) | 0 (0.0%) |
| 7+ Person Households | 0 (0.0%) | 0 (0.0%) |
| Total | 2,427 (73.0%) | 900 (27.1%) |
Female Fertility in Vega Alta
Fertility by Age in Vega Alta
Average fertility rate in Vega Alta is 27.0 births per 1,000 women. Women in the age bracket of 20 to 34 years have the highest fertility rate with 36.0 births per 1,000 women. Women in the age bracket of 20 to 34 years acount for 61.5% of all women with births.
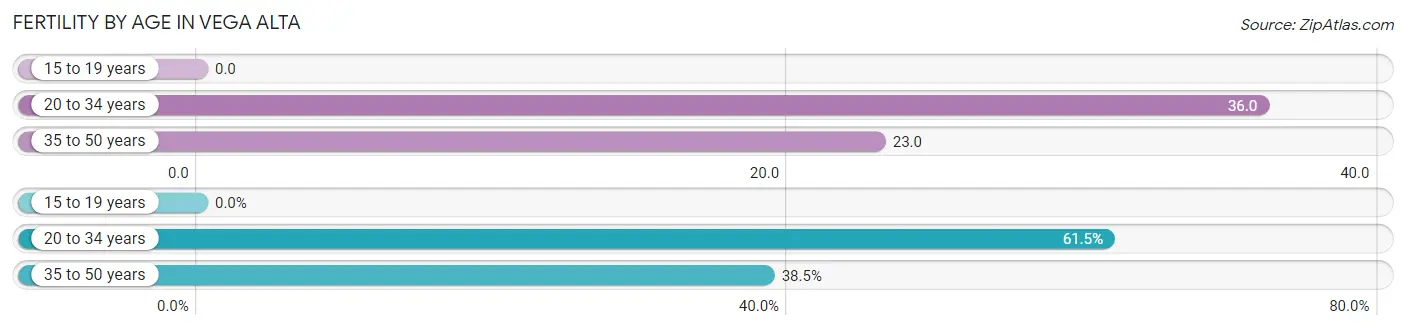
| Age Bracket | Women with Births | Births / 1,000 Women |
| 15 to 19 years | 0 (0.0%) | 0.0 |
| 20 to 34 years | 40 (61.5%) | 36.0 |
| 35 to 50 years | 25 (38.5%) | 23.0 |
| Total | 65 (100.0%) | 27.0 |
Fertility by Age by Marriage Status in Vega Alta
46.2% of women with births (65) in Vega Alta are married. The highest percentage of unmarried women with births falls into 20 to 34 years age bracket with 57.5% of them unmarried at the time of birth, while the lowest percentage of unmarried women with births belong to 35 to 50 years age bracket with 48.0% of them unmarried.
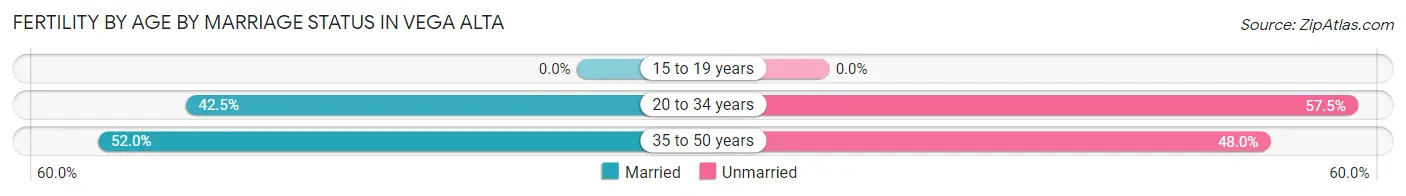
| Age Bracket | Married | Unmarried |
| 15 to 19 years | 0 (0.0%) | 0 (0.0%) |
| 20 to 34 years | 17 (42.5%) | 23 (57.5%) |
| 35 to 50 years | 13 (52.0%) | 12 (48.0%) |
| Total | 30 (46.2%) | 35 (53.8%) |
Fertility by Education in Vega Alta
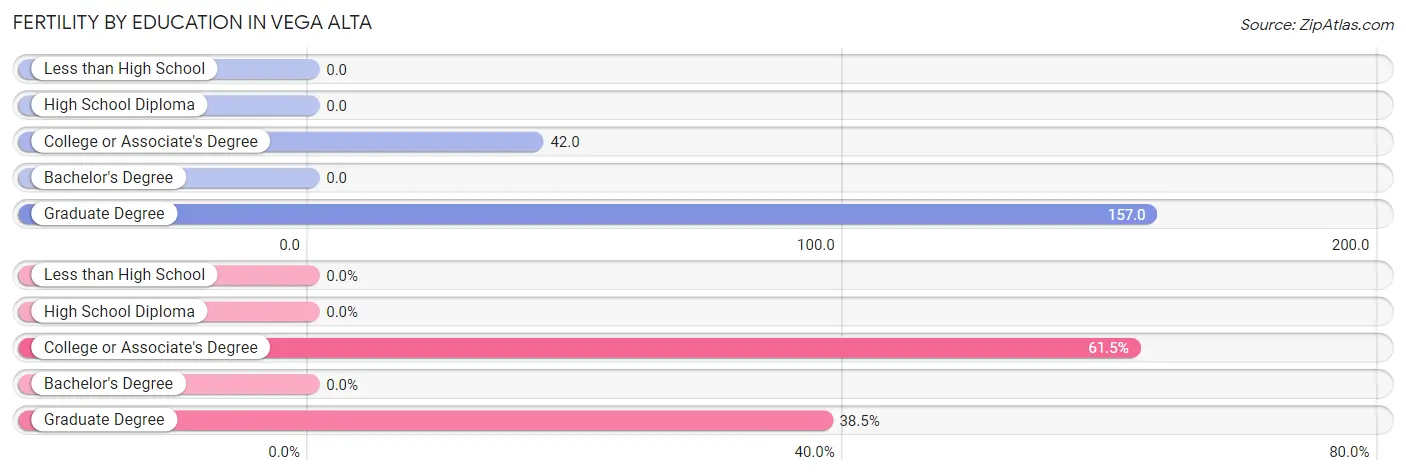
| Educational Attainment | Women with Births | Births / 1,000 Women |
| Less than High School | 0 (0.0%) | 0.0 |
| High School Diploma | 0 (0.0%) | 0.0 |
| College or Associate's Degree | 40 (61.5%) | 42.0 |
| Bachelor's Degree | 0 (0.0%) | 0.0 |
| Graduate Degree | 25 (38.5%) | 157.0 |
| Total | 65 (100.0%) | 27.0 |
Fertility by Education by Marriage Status in Vega Alta
53.8% of women with births in Vega Alta are unmarried. Women with the educational attainment of graduate degree are most likely to be married with 52.0% of them married at childbirth, while women with the educational attainment of college or associate's degree are least likely to be married with 57.5% of them unmarried at childbirth.
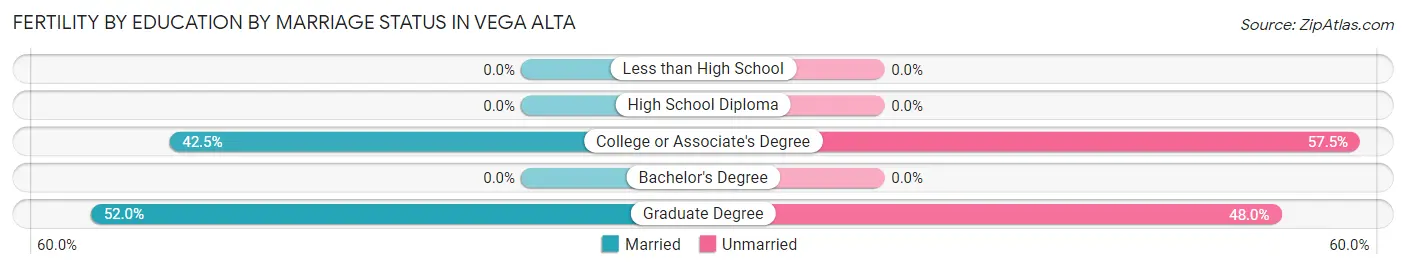
| Educational Attainment | Married | Unmarried |
| Less than High School | 0 (0.0%) | 0 (0.0%) |
| High School Diploma | 0 (0.0%) | 0 (0.0%) |
| College or Associate's Degree | 17 (42.5%) | 23 (57.5%) |
| Bachelor's Degree | 0 (0.0%) | 0 (0.0%) |
| Graduate Degree | 13 (52.0%) | 12 (48.0%) |
| Total | 30 (46.2%) | 35 (53.8%) |
Employment Characteristics in Vega Alta
Employment by Class of Employer in Vega Alta
Among the 2,895 employed individuals in Vega Alta, private company employees (1,783 | 61.6%), state government employees (380 | 13.1%), and local government employees (269 | 9.3%) make up the most common classes of employment.
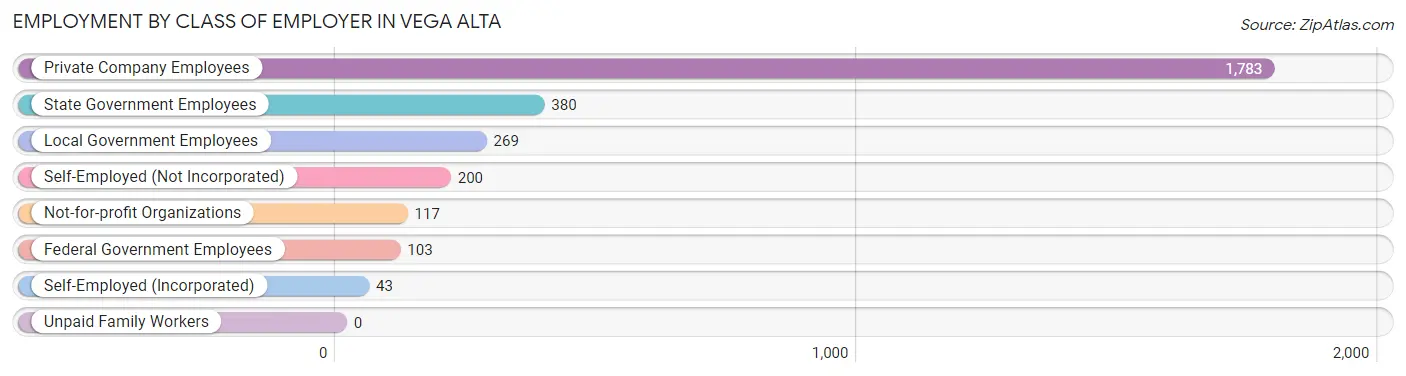
| Employer Class | # Employees | % Employees |
| Private Company Employees | 1,783 | 61.6% |
| Self-Employed (Incorporated) | 43 | 1.5% |
| Self-Employed (Not Incorporated) | 200 | 6.9% |
| Not-for-profit Organizations | 117 | 4.0% |
| Local Government Employees | 269 | 9.3% |
| State Government Employees | 380 | 13.1% |
| Federal Government Employees | 103 | 3.6% |
| Unpaid Family Workers | 0 | 0.0% |
| Total | 2,895 | 100.0% |
Employment Status by Age in Vega Alta
According to the labor force statistics for Vega Alta, out of the total population over 16 years of age (7,999), 47.8% or 3,824 individuals are in the labor force, with 23.8% or 910 of them unemployed. The age group with the highest labor force participation rate is 30 to 34 years, with 80.8% or 350 individuals in the labor force. Within the labor force, the 16 to 19 years age range has the highest percentage of unemployed individuals, with 100.0% or 84 of them being unemployed.
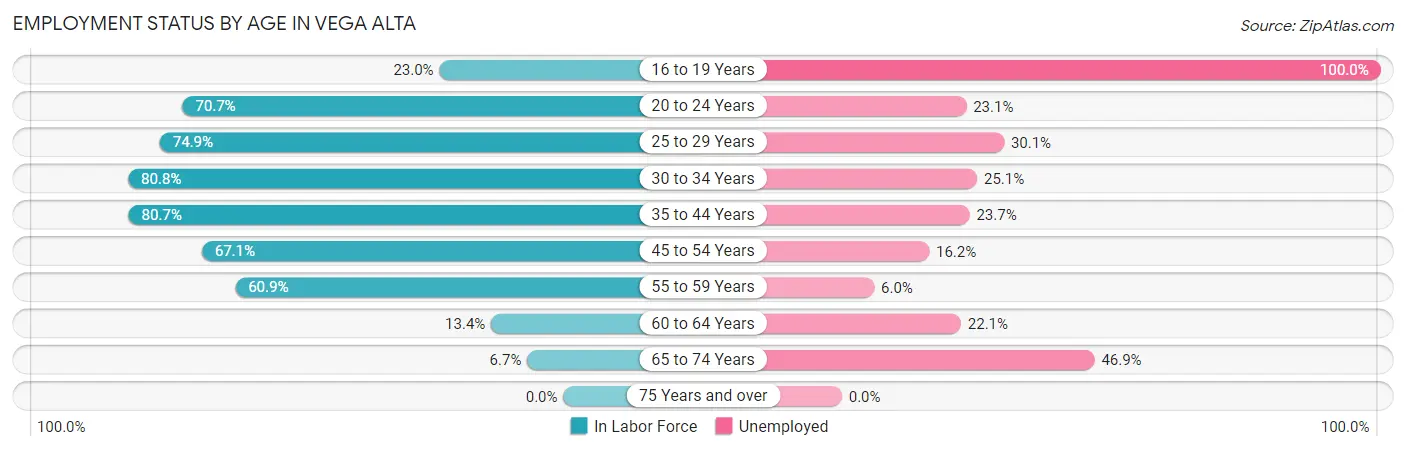
| Age Bracket | In Labor Force | Unemployed |
| 16 to 19 Years | 84 (23.0%) | 84 (100.0%) |
| 20 to 24 Years | 511 (70.7%) | 118 (23.1%) |
| 25 to 29 Years | 730 (74.9%) | 220 (30.1%) |
| 30 to 34 Years | 350 (80.8%) | 88 (25.1%) |
| 35 to 44 Years | 862 (80.7%) | 204 (23.7%) |
| 45 to 54 Years | 745 (67.1%) | 121 (16.2%) |
| 55 to 59 Years | 384 (60.9%) | 23 (6.0%) |
| 60 to 64 Years | 95 (13.4%) | 21 (22.1%) |
| 65 to 74 Years | 64 (6.7%) | 30 (46.9%) |
| 75 Years and over | 0 (0.0%) | 0 (0.0%) |
| Total | 3,824 (47.8%) | 910 (23.8%) |
Employment Status by Educational Attainment in Vega Alta
According to labor force statistics for Vega Alta, 64.3% of individuals (3,165) out of the total population between 25 and 64 years of age (4,923) are in the labor force, with 21.4% or 677 of them being unemployed. The group with the highest labor force participation rate are those with the educational attainment of bachelor's degree or higher, with 77.4% or 926 individuals in the labor force. Within the labor force, individuals with less than high school education have the highest percentage of unemployment, with 49.4% or 122 of them being unemployed.
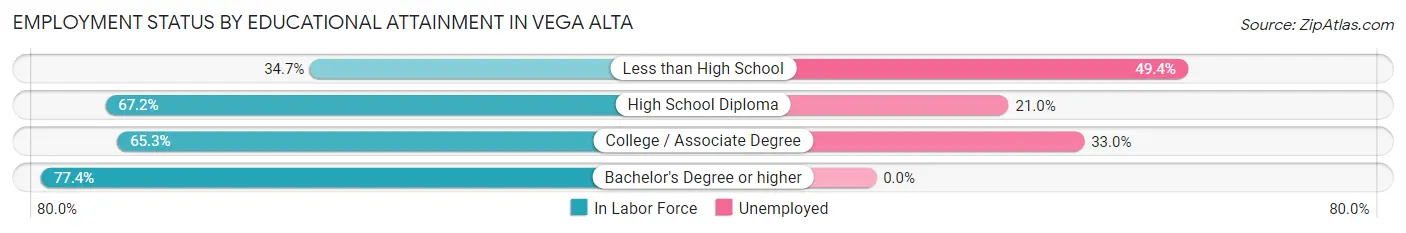
| Educational Attainment | In Labor Force | Unemployed |
| Less than High School | 247 (34.7%) | 352 (49.4%) |
| High School Diploma | 855 (67.2%) | 267 (21.0%) |
| College / Associate Degree | 1,137 (65.3%) | 575 (33.0%) |
| Bachelor's Degree or higher | 926 (77.4%) | 0 (0.0%) |
| Total | 3,165 (64.3%) | 1,054 (21.4%) |
Employment Occupations by Sex in Vega Alta
Management, Business, Science and Arts Occupations
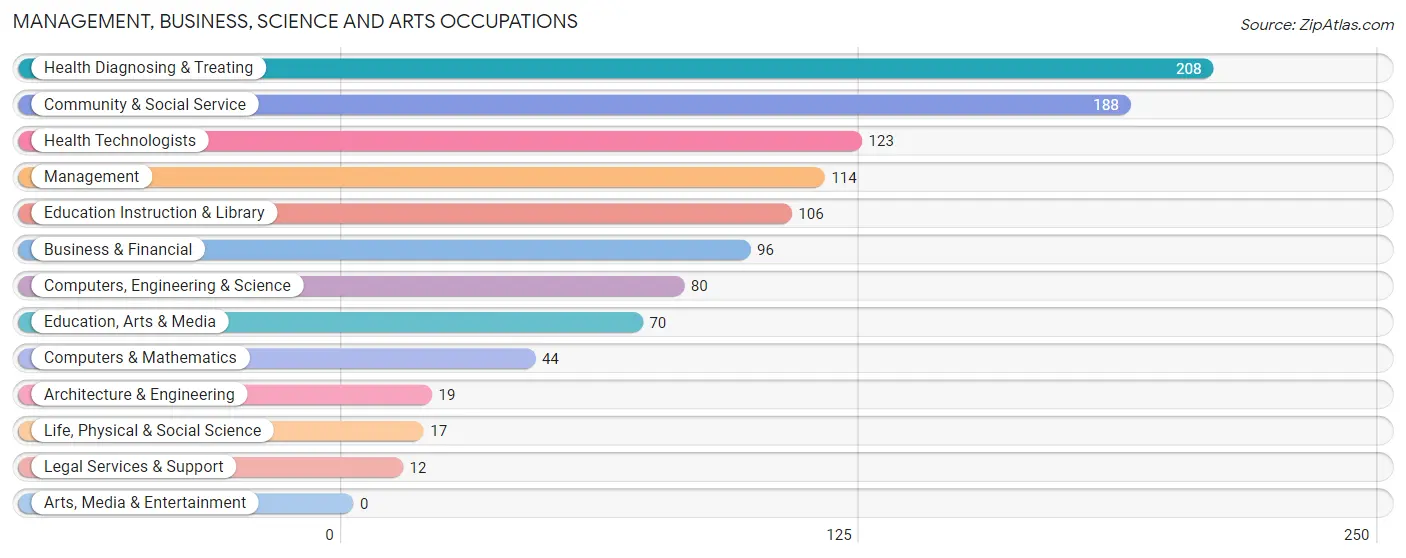
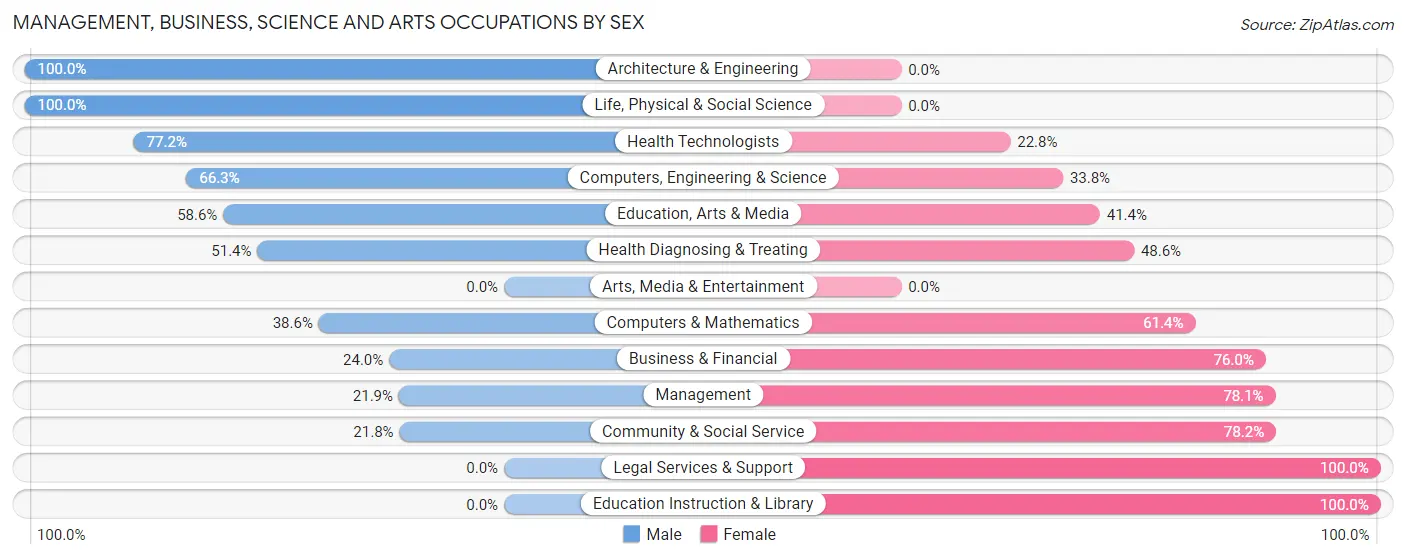
The most common Management, Business, Science and Arts occupations in Vega Alta are Health Diagnosing & Treating (208 | 7.1%), Community & Social Service (188 | 6.5%), Health Technologists (123 | 4.2%), Management (114 | 3.9%), and Education Instruction & Library (106 | 3.6%).
Management, Business, Science and Arts Occupations by Sex
Within the Management, Business, Science and Arts occupations in Vega Alta, the most male-oriented occupations are Architecture & Engineering (100.0%), Life, Physical & Social Science (100.0%), and Health Technologists (77.2%), while the most female-oriented occupations are Legal Services & Support (100.0%), Education Instruction & Library (100.0%), and Community & Social Service (78.2%).
| Occupation | Male | Female |
| Management | 25 (21.9%) | 89 (78.1%) |
| Business & Financial | 23 (24.0%) | 73 (76.0%) |
| Computers, Engineering & Science | 53 (66.2%) | 27 (33.8%) |
| Computers & Mathematics | 17 (38.6%) | 27 (61.4%) |
| Architecture & Engineering | 19 (100.0%) | 0 (0.0%) |
| Life, Physical & Social Science | 17 (100.0%) | 0 (0.0%) |
| Community & Social Service | 41 (21.8%) | 147 (78.2%) |
| Education, Arts & Media | 41 (58.6%) | 29 (41.4%) |
| Legal Services & Support | 0 (0.0%) | 12 (100.0%) |
| Education Instruction & Library | 0 (0.0%) | 106 (100.0%) |
| Arts, Media & Entertainment | 0 (0.0%) | 0 (0.0%) |
| Health Diagnosing & Treating | 107 (51.4%) | 101 (48.6%) |
| Health Technologists | 95 (77.2%) | 28 (22.8%) |
| Total (Category) | 249 (36.3%) | 437 (63.7%) |
| Total (Overall) | 1,537 (52.7%) | 1,379 (47.3%) |
Services Occupations
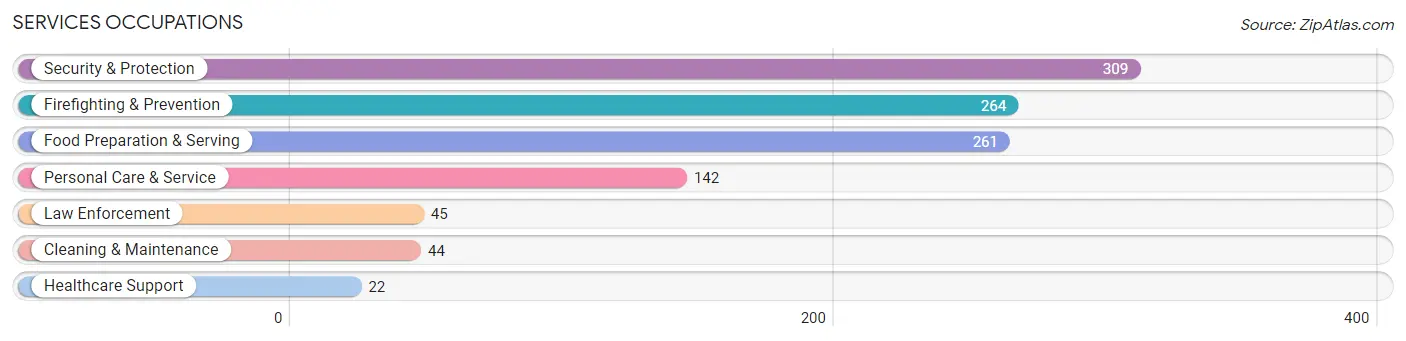
The most common Services occupations in Vega Alta are Security & Protection (309 | 10.6%), Firefighting & Prevention (264 | 9.0%), Food Preparation & Serving (261 | 8.9%), Personal Care & Service (142 | 4.9%), and Law Enforcement (45 | 1.5%).
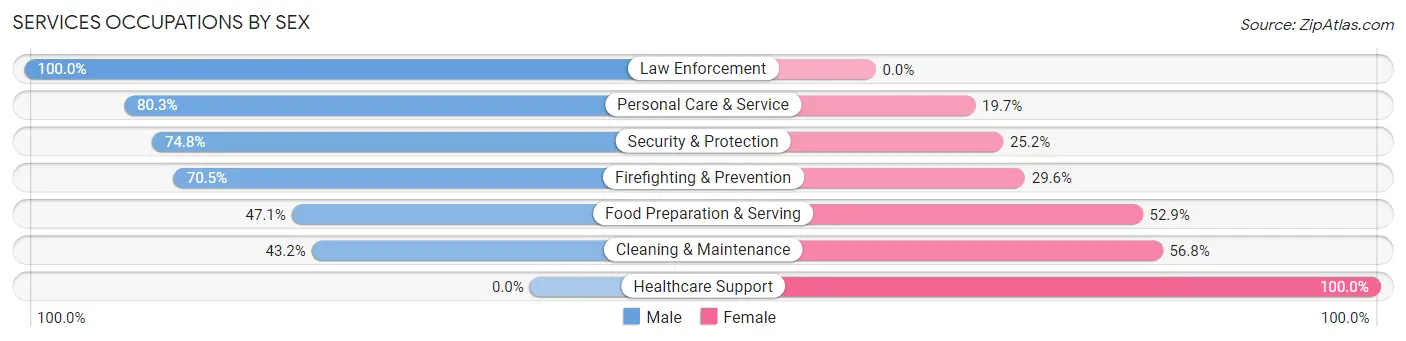
Services Occupations by Sex
Within the Services occupations in Vega Alta, the most male-oriented occupations are Law Enforcement (100.0%), Personal Care & Service (80.3%), and Security & Protection (74.8%), while the most female-oriented occupations are Healthcare Support (100.0%), Cleaning & Maintenance (56.8%), and Food Preparation & Serving (52.9%).
| Occupation | Male | Female |
| Healthcare Support | 0 (0.0%) | 22 (100.0%) |
| Security & Protection | 231 (74.8%) | 78 (25.2%) |
| Firefighting & Prevention | 186 (70.5%) | 78 (29.5%) |
| Law Enforcement | 45 (100.0%) | 0 (0.0%) |
| Food Preparation & Serving | 123 (47.1%) | 138 (52.9%) |
| Cleaning & Maintenance | 19 (43.2%) | 25 (56.8%) |
| Personal Care & Service | 114 (80.3%) | 28 (19.7%) |
| Total (Category) | 487 (62.6%) | 291 (37.4%) |
| Total (Overall) | 1,537 (52.7%) | 1,379 (47.3%) |
Sales and Office Occupations
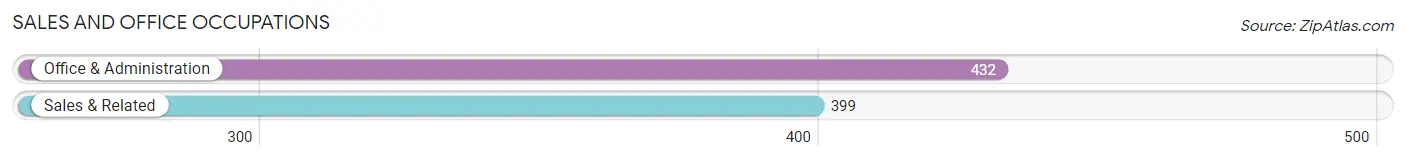
The most common Sales and Office occupations in Vega Alta are Office & Administration (432 | 14.8%), and Sales & Related (399 | 13.7%).
Sales and Office Occupations by Sex
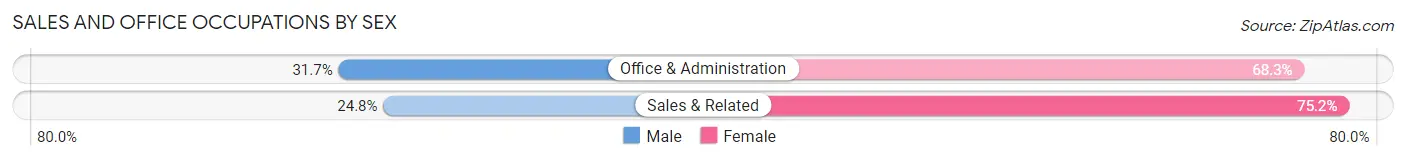
| Occupation | Male | Female |
| Sales & Related | 99 (24.8%) | 300 (75.2%) |
| Office & Administration | 137 (31.7%) | 295 (68.3%) |
| Total (Category) | 236 (28.4%) | 595 (71.6%) |
| Total (Overall) | 1,537 (52.7%) | 1,379 (47.3%) |
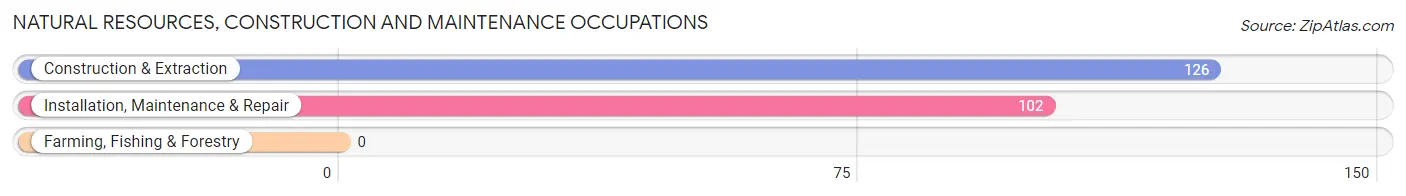
Natural Resources, Construction and Maintenance Occupations
The most common Natural Resources, Construction and Maintenance occupations in Vega Alta are Construction & Extraction (126 | 4.3%), and Installation, Maintenance & Repair (102 | 3.5%).
Natural Resources, Construction and Maintenance Occupations by Sex
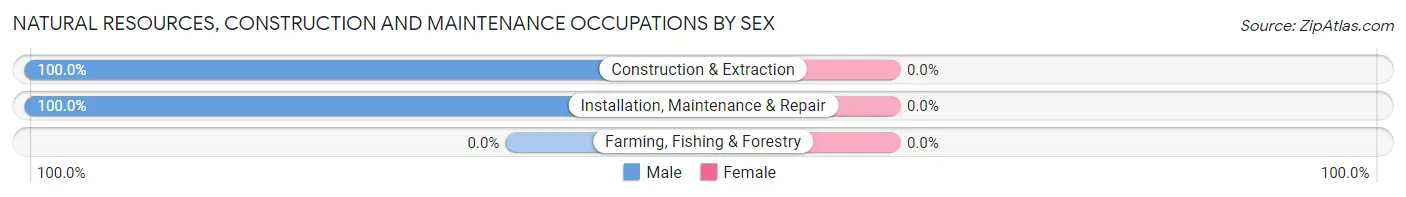
| Occupation | Male | Female |
| Farming, Fishing & Forestry | 0 (0.0%) | 0 (0.0%) |
| Construction & Extraction | 126 (100.0%) | 0 (0.0%) |
| Installation, Maintenance & Repair | 102 (100.0%) | 0 (0.0%) |
| Total (Category) | 228 (100.0%) | 0 (0.0%) |
| Total (Overall) | 1,537 (52.7%) | 1,379 (47.3%) |
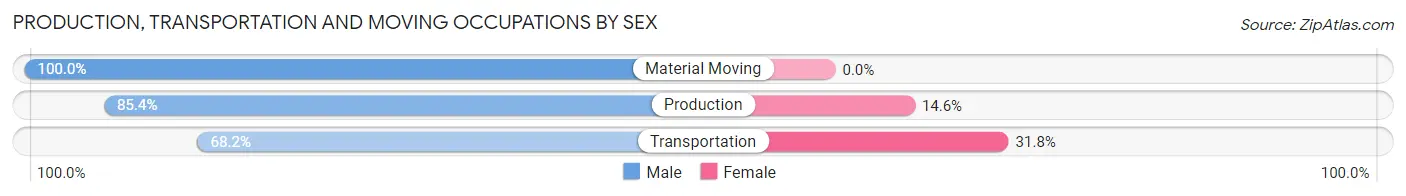
Production, Transportation and Moving Occupations
The most common Production, Transportation and Moving occupations in Vega Alta are Production (199 | 6.8%), Material Moving (109 | 3.7%), and Transportation (85 | 2.9%).
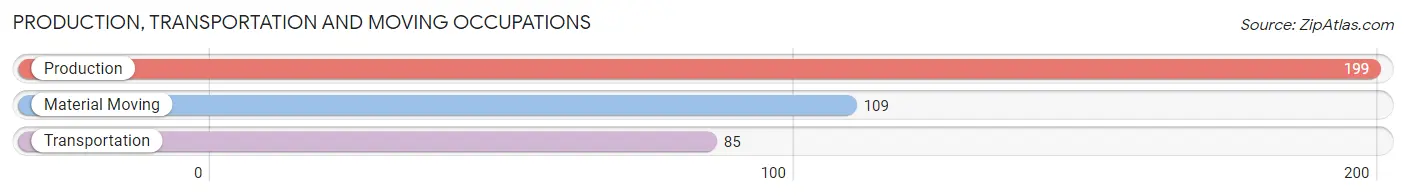
Production, Transportation and Moving Occupations by Sex
| Occupation | Male | Female |
| Production | 170 (85.4%) | 29 (14.6%) |
| Transportation | 58 (68.2%) | 27 (31.8%) |
| Material Moving | 109 (100.0%) | 0 (0.0%) |
| Total (Category) | 337 (85.8%) | 56 (14.2%) |
| Total (Overall) | 1,537 (52.7%) | 1,379 (47.3%) |
Employment Industries by Sex in Vega Alta
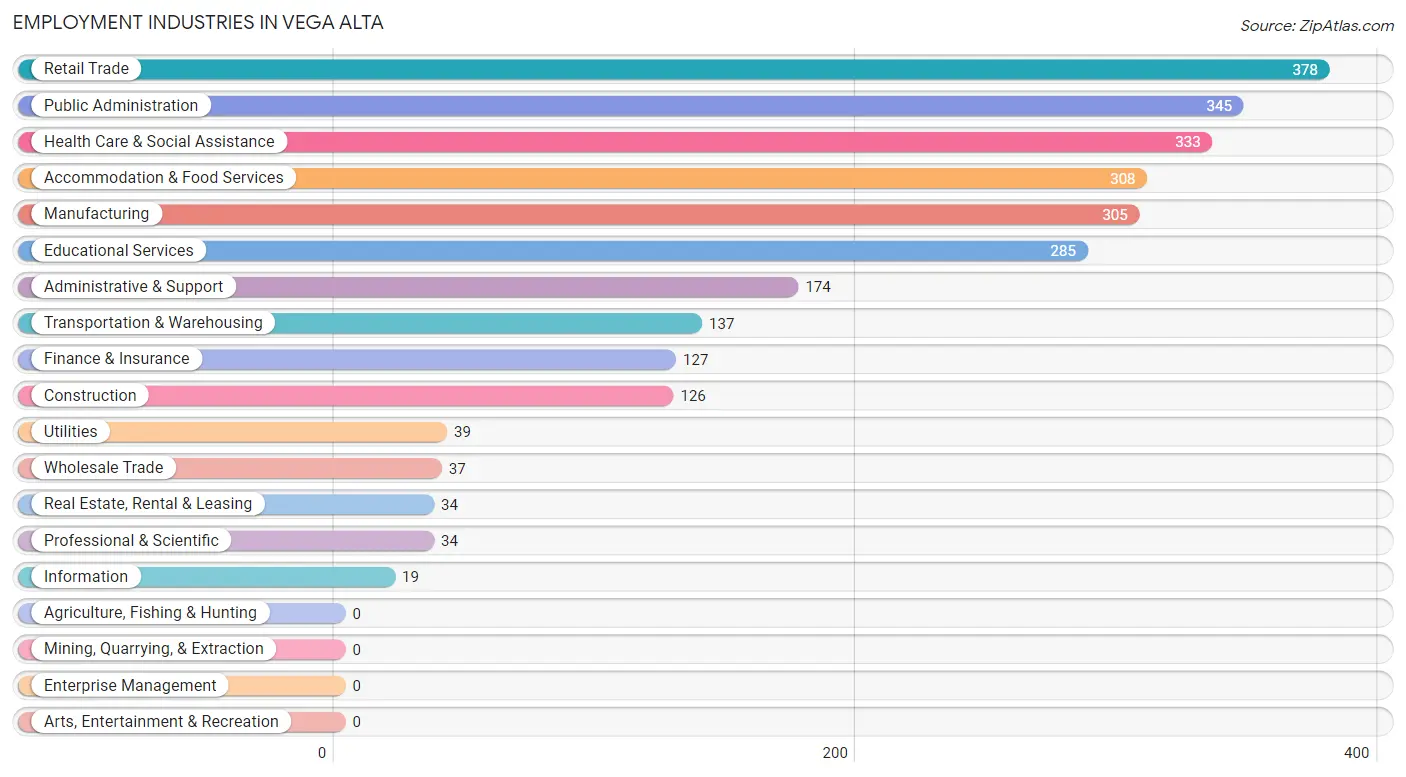
Employment Industries in Vega Alta
The major employment industries in Vega Alta include Retail Trade (378 | 13.0%), Public Administration (345 | 11.8%), Health Care & Social Assistance (333 | 11.4%), Accommodation & Food Services (308 | 10.6%), and Manufacturing (305 | 10.5%).
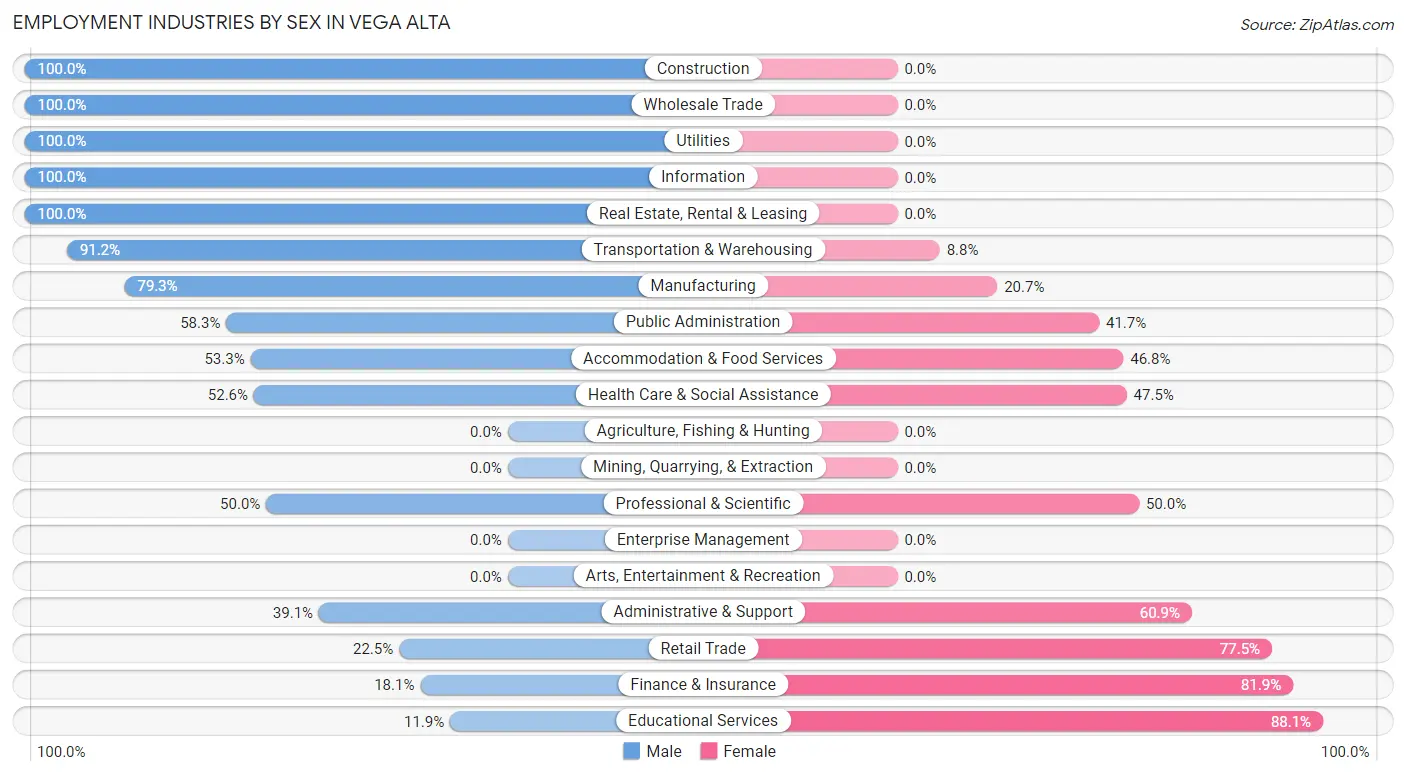
Employment Industries by Sex in Vega Alta
The Vega Alta industries that see more men than women are Construction (100.0%), Wholesale Trade (100.0%), and Utilities (100.0%), whereas the industries that tend to have a higher number of women are Educational Services (88.1%), Finance & Insurance (81.9%), and Retail Trade (77.5%).
| Industry | Male | Female |
| Agriculture, Fishing & Hunting | 0 (0.0%) | 0 (0.0%) |
| Mining, Quarrying, & Extraction | 0 (0.0%) | 0 (0.0%) |
| Construction | 126 (100.0%) | 0 (0.0%) |
| Manufacturing | 242 (79.3%) | 63 (20.7%) |
| Wholesale Trade | 37 (100.0%) | 0 (0.0%) |
| Retail Trade | 85 (22.5%) | 293 (77.5%) |
| Transportation & Warehousing | 125 (91.2%) | 12 (8.8%) |
| Utilities | 39 (100.0%) | 0 (0.0%) |
| Information | 19 (100.0%) | 0 (0.0%) |
| Finance & Insurance | 23 (18.1%) | 104 (81.9%) |
| Real Estate, Rental & Leasing | 34 (100.0%) | 0 (0.0%) |
| Professional & Scientific | 17 (50.0%) | 17 (50.0%) |
| Enterprise Management | 0 (0.0%) | 0 (0.0%) |
| Administrative & Support | 68 (39.1%) | 106 (60.9%) |
| Educational Services | 34 (11.9%) | 251 (88.1%) |
| Health Care & Social Assistance | 175 (52.5%) | 158 (47.4%) |
| Arts, Entertainment & Recreation | 0 (0.0%) | 0 (0.0%) |
| Accommodation & Food Services | 164 (53.2%) | 144 (46.8%) |
| Public Administration | 201 (58.3%) | 144 (41.7%) |
| Total | 1,537 (52.7%) | 1,379 (47.3%) |
Education in Vega Alta
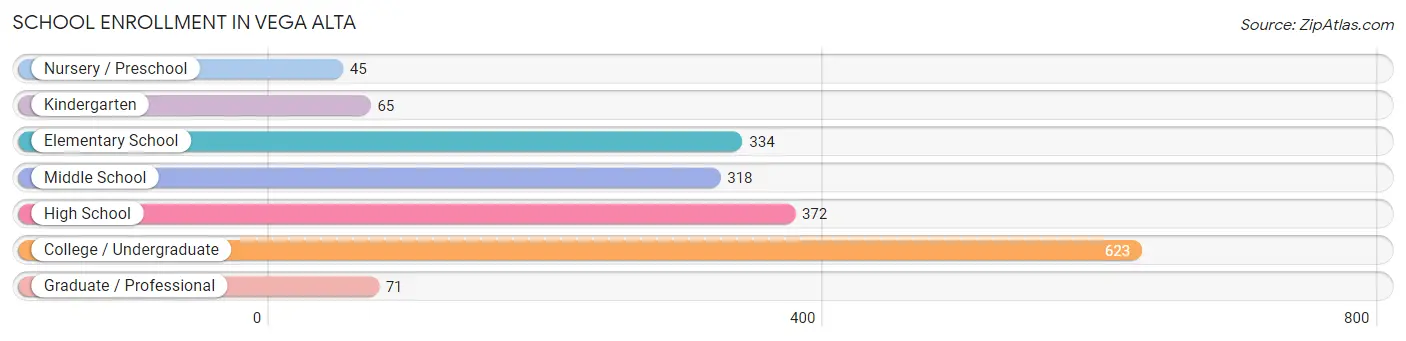
School Enrollment in Vega Alta
The most common levels of schooling among the 1,828 students in Vega Alta are college / undergraduate (623 | 34.1%), high school (372 | 20.3%), and elementary school (334 | 18.3%).
| School Level | # Students | % Students |
| Nursery / Preschool | 45 | 2.5% |
| Kindergarten | 65 | 3.6% |
| Elementary School | 334 | 18.3% |
| Middle School | 318 | 17.4% |
| High School | 372 | 20.3% |
| College / Undergraduate | 623 | 34.1% |
| Graduate / Professional | 71 | 3.9% |
| Total | 1,828 | 100.0% |
School Enrollment by Age by Funding Source in Vega Alta
Out of a total of 1,828 students who are enrolled in schools in Vega Alta, 700 (38.3%) attend a private institution, while the remaining 1,128 (61.7%) are enrolled in public schools. The age group of 3 to 4 year olds has the highest likelihood of being enrolled in private schools, with 45 (100.0% in the age bracket) enrolled. Conversely, the age group of 10 to 14 year olds has the lowest likelihood of being enrolled in a private school, with 364 (96.0% in the age bracket) attending a public institution.
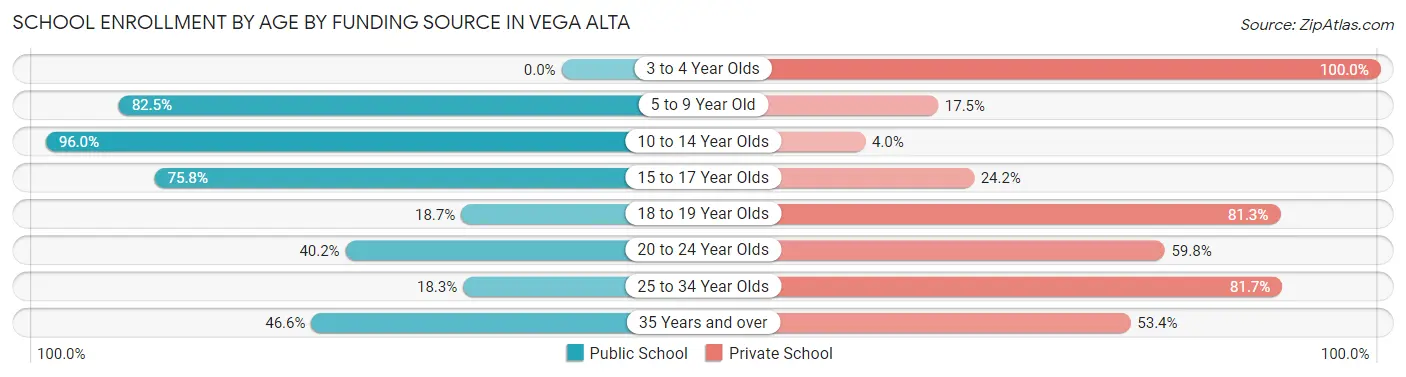
| Age Bracket | Public School | Private School |
| 3 to 4 Year Olds | 0 (0.0%) | 45 (100.0%) |
| 5 to 9 Year Old | 329 (82.5%) | 70 (17.5%) |
| 10 to 14 Year Olds | 364 (96.0%) | 15 (4.0%) |
| 15 to 17 Year Olds | 194 (75.8%) | 62 (24.2%) |
| 18 to 19 Year Olds | 26 (18.7%) | 113 (81.3%) |
| 20 to 24 Year Olds | 136 (40.2%) | 202 (59.8%) |
| 25 to 34 Year Olds | 31 (18.3%) | 138 (81.7%) |
| 35 Years and over | 48 (46.6%) | 55 (53.4%) |
| Total | 1,128 (61.7%) | 700 (38.3%) |
Educational Attainment by Field of Study in Vega Alta
Business (392 | 25.4%), education (343 | 22.2%), arts & humanities (309 | 20.0%), science & technology (165 | 10.7%), and bio, nature & agricultural (73 | 4.7%) are the most common fields of study among 1,545 individuals in Vega Alta who have obtained a bachelor's degree or higher.
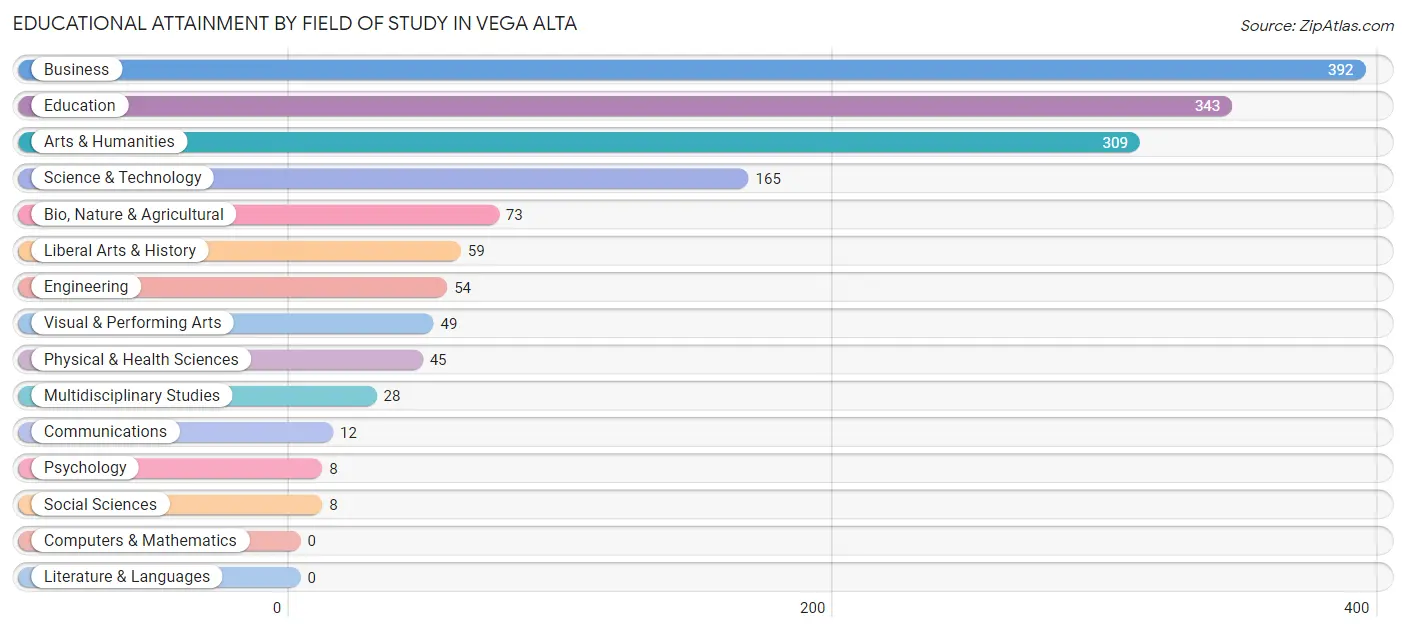
| Field of Study | # Graduates | % Graduates |
| Computers & Mathematics | 0 | 0.0% |
| Bio, Nature & Agricultural | 73 | 4.7% |
| Physical & Health Sciences | 45 | 2.9% |
| Psychology | 8 | 0.5% |
| Social Sciences | 8 | 0.5% |
| Engineering | 54 | 3.5% |
| Multidisciplinary Studies | 28 | 1.8% |
| Science & Technology | 165 | 10.7% |
| Business | 392 | 25.4% |
| Education | 343 | 22.2% |
| Literature & Languages | 0 | 0.0% |
| Liberal Arts & History | 59 | 3.8% |
| Visual & Performing Arts | 49 | 3.2% |
| Communications | 12 | 0.8% |
| Arts & Humanities | 309 | 20.0% |
| Total | 1,545 | 100.0% |
Transportation & Commute in Vega Alta
Vehicle Availability by Sex in Vega Alta
The most prevalent vehicle ownership categories in Vega Alta are males with 2 vehicles (636, accounting for 42.0%) and females with 2 vehicles (702, making up 46.1%).
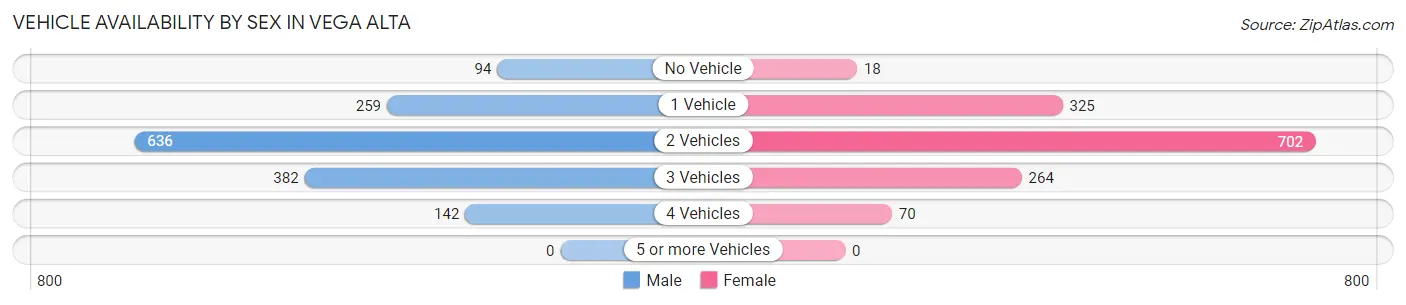
| Vehicles Available | Male | Female |
| No Vehicle | 94 (6.2%) | 18 (1.3%) |
| 1 Vehicle | 259 (17.1%) | 325 (23.6%) |
| 2 Vehicles | 636 (42.0%) | 702 (50.9%) |
| 3 Vehicles | 382 (25.3%) | 264 (19.1%) |
| 4 Vehicles | 142 (9.4%) | 70 (5.1%) |
| 5 or more Vehicles | 0 (0.0%) | 0 (0.0%) |
| Total | 1,513 (100.0%) | 1,379 (100.0%) |
Commute Time in Vega Alta
The most frequently occuring commute durations in Vega Alta are 30 to 34 minutes (550 commuters, 19.9%), 20 to 24 minutes (342 commuters, 12.4%), and 15 to 19 minutes (330 commuters, 11.9%).
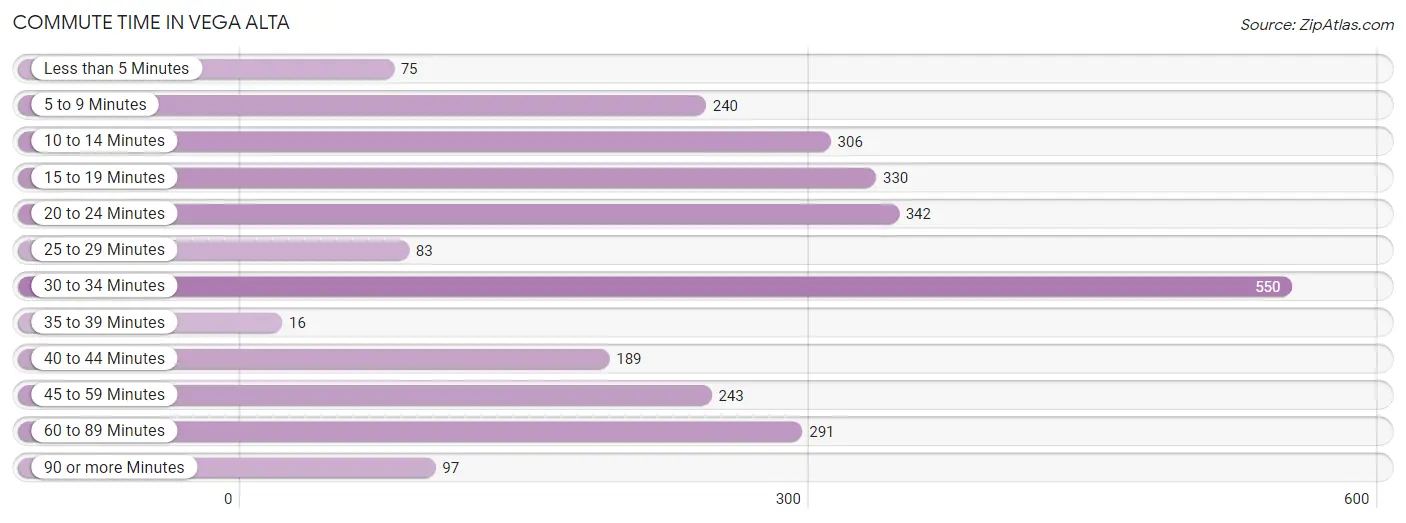
| Commute Time | # Commuters | % Commuters |
| Less than 5 Minutes | 75 | 2.7% |
| 5 to 9 Minutes | 240 | 8.7% |
| 10 to 14 Minutes | 306 | 11.1% |
| 15 to 19 Minutes | 330 | 11.9% |
| 20 to 24 Minutes | 342 | 12.4% |
| 25 to 29 Minutes | 83 | 3.0% |
| 30 to 34 Minutes | 550 | 19.9% |
| 35 to 39 Minutes | 16 | 0.6% |
| 40 to 44 Minutes | 189 | 6.8% |
| 45 to 59 Minutes | 243 | 8.8% |
| 60 to 89 Minutes | 291 | 10.5% |
| 90 or more Minutes | 97 | 3.5% |
Commute Time by Sex in Vega Alta
The most common commute times in Vega Alta are 30 to 34 minutes (298 commuters, 21.0%) for males and 30 to 34 minutes (252 commuters, 18.7%) for females.
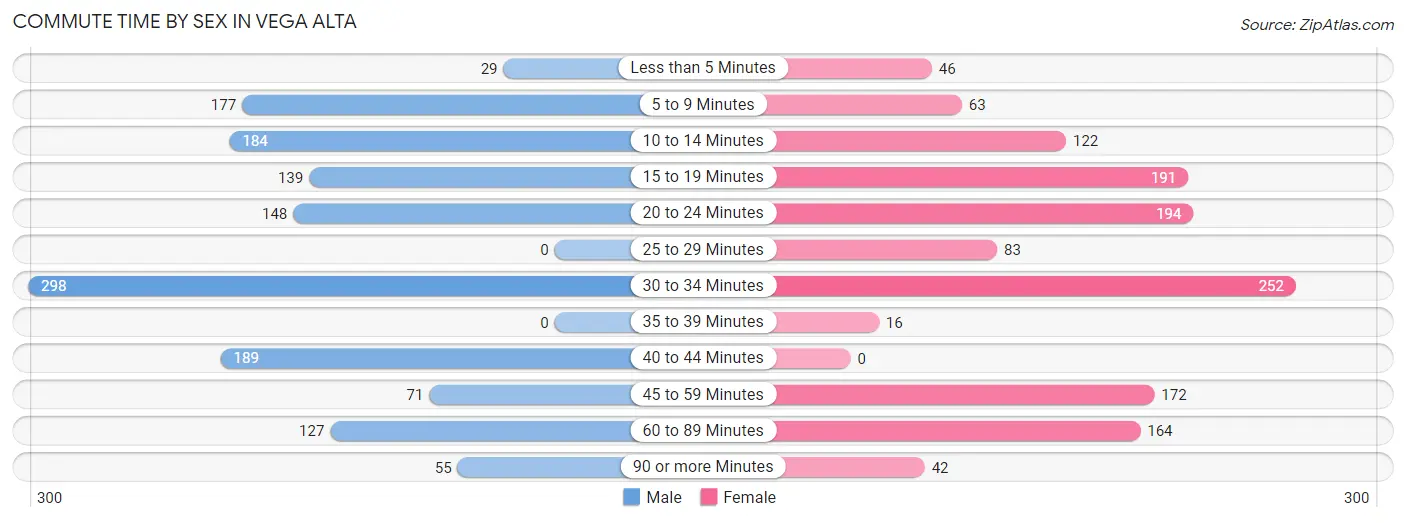
| Commute Time | Male | Female |
| Less than 5 Minutes | 29 (2.1%) | 46 (3.4%) |
| 5 to 9 Minutes | 177 (12.5%) | 63 (4.7%) |
| 10 to 14 Minutes | 184 (13.0%) | 122 (9.1%) |
| 15 to 19 Minutes | 139 (9.8%) | 191 (14.2%) |
| 20 to 24 Minutes | 148 (10.4%) | 194 (14.4%) |
| 25 to 29 Minutes | 0 (0.0%) | 83 (6.2%) |
| 30 to 34 Minutes | 298 (21.0%) | 252 (18.7%) |
| 35 to 39 Minutes | 0 (0.0%) | 16 (1.2%) |
| 40 to 44 Minutes | 189 (13.3%) | 0 (0.0%) |
| 45 to 59 Minutes | 71 (5.0%) | 172 (12.8%) |
| 60 to 89 Minutes | 127 (9.0%) | 164 (12.2%) |
| 90 or more Minutes | 55 (3.9%) | 42 (3.1%) |
Time of Departure to Work by Sex in Vega Alta
The most frequent times of departure to work in Vega Alta are 12:00 AM to 4:59 AM (226, 16.0%) for males and 6:00 AM to 6:29 AM (250, 18.6%) for females.
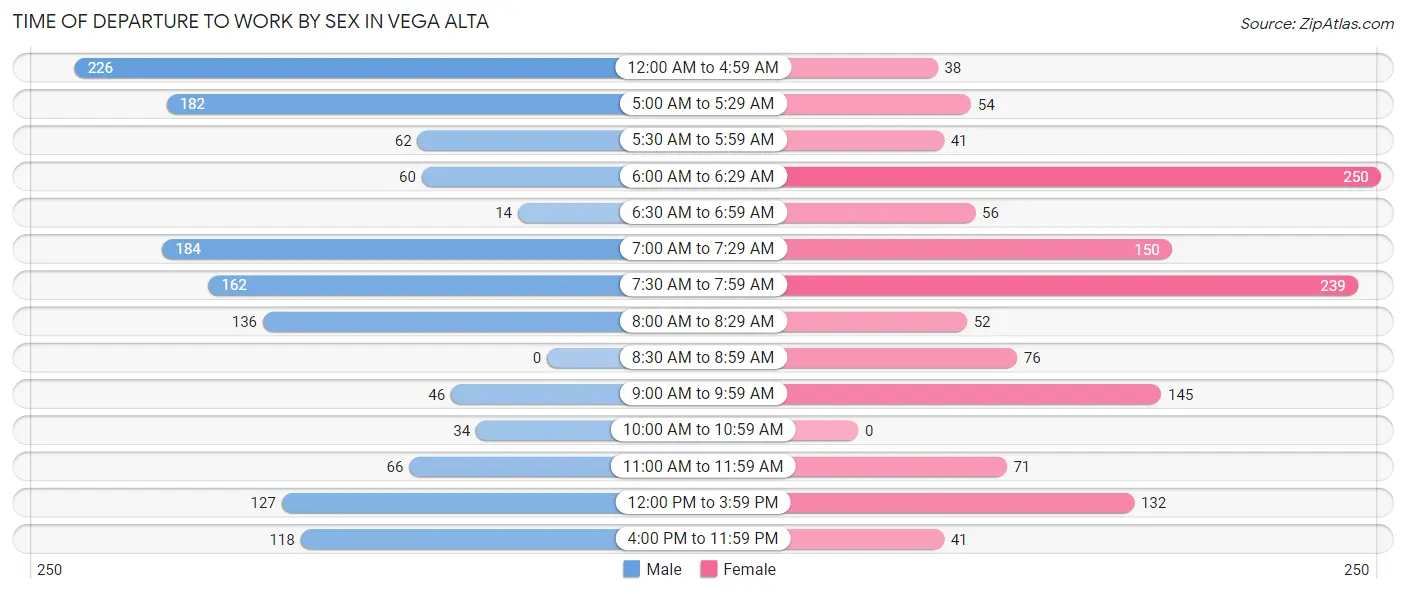
| Time of Departure | Male | Female |
| 12:00 AM to 4:59 AM | 226 (16.0%) | 38 (2.8%) |
| 5:00 AM to 5:29 AM | 182 (12.8%) | 54 (4.0%) |
| 5:30 AM to 5:59 AM | 62 (4.4%) | 41 (3.0%) |
| 6:00 AM to 6:29 AM | 60 (4.2%) | 250 (18.6%) |
| 6:30 AM to 6:59 AM | 14 (1.0%) | 56 (4.2%) |
| 7:00 AM to 7:29 AM | 184 (13.0%) | 150 (11.2%) |
| 7:30 AM to 7:59 AM | 162 (11.4%) | 239 (17.8%) |
| 8:00 AM to 8:29 AM | 136 (9.6%) | 52 (3.9%) |
| 8:30 AM to 8:59 AM | 0 (0.0%) | 76 (5.7%) |
| 9:00 AM to 9:59 AM | 46 (3.3%) | 145 (10.8%) |
| 10:00 AM to 10:59 AM | 34 (2.4%) | 0 (0.0%) |
| 11:00 AM to 11:59 AM | 66 (4.7%) | 71 (5.3%) |
| 12:00 PM to 3:59 PM | 127 (9.0%) | 132 (9.8%) |
| 4:00 PM to 11:59 PM | 118 (8.3%) | 41 (3.0%) |
| Total | 1,417 (100.0%) | 1,345 (100.0%) |
Housing Occupancy in Vega Alta
Occupancy by Ownership in Vega Alta
Of the total 3,327 dwellings in Vega Alta, owner-occupied units account for 1,933 (58.1%), while renter-occupied units make up 1,394 (41.9%).
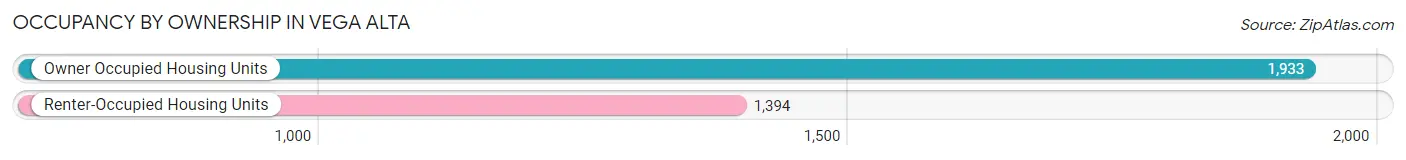
| Occupancy | # Housing Units | % Housing Units |
| Owner Occupied Housing Units | 1,933 | 58.1% |
| Renter-Occupied Housing Units | 1,394 | 41.9% |
| Total Occupied Housing Units | 3,327 | 100.0% |
Occupancy by Household Size in Vega Alta
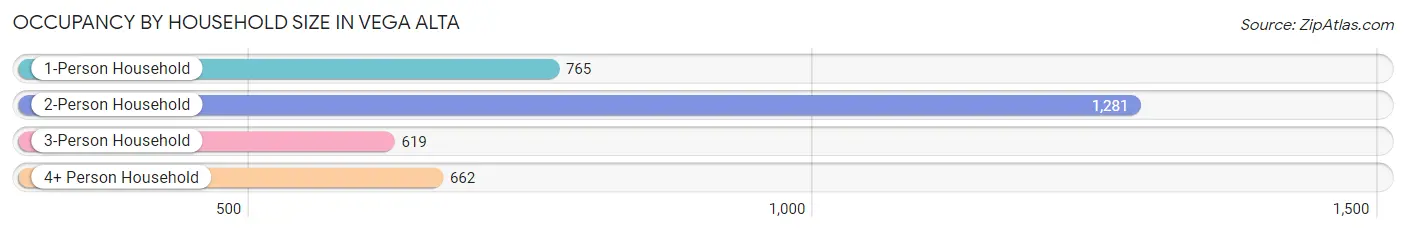
| Household Size | # Housing Units | % Housing Units |
| 1-Person Household | 765 | 23.0% |
| 2-Person Household | 1,281 | 38.5% |
| 3-Person Household | 619 | 18.6% |
| 4+ Person Household | 662 | 19.9% |
| Total Housing Units | 3,327 | 100.0% |
Occupancy by Ownership by Household Size in Vega Alta
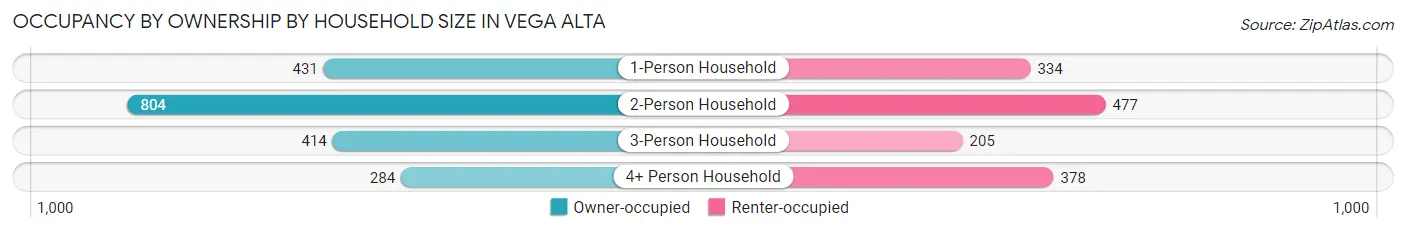
| Household Size | Owner-occupied | Renter-occupied |
| 1-Person Household | 431 (56.3%) | 334 (43.7%) |
| 2-Person Household | 804 (62.8%) | 477 (37.2%) |
| 3-Person Household | 414 (66.9%) | 205 (33.1%) |
| 4+ Person Household | 284 (42.9%) | 378 (57.1%) |
| Total Housing Units | 1,933 (58.1%) | 1,394 (41.9%) |
Occupancy by Educational Attainment in Vega Alta
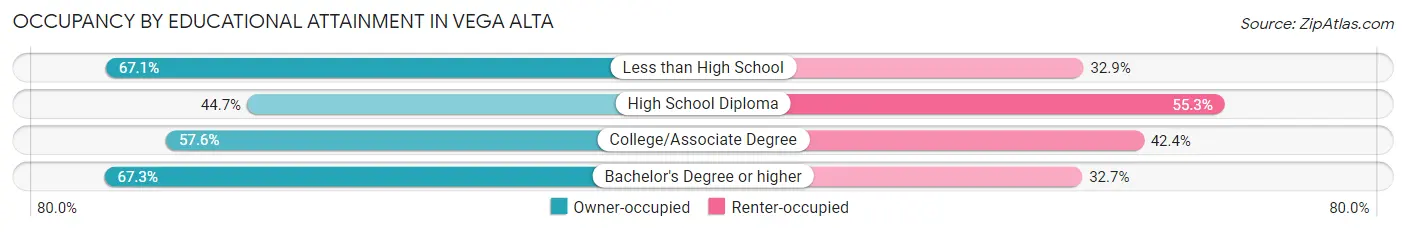
| Household Size | Owner-occupied | Renter-occupied |
| Less than High School | 494 (67.1%) | 242 (32.9%) |
| High School Diploma | 425 (44.7%) | 525 (55.3%) |
| College/Associate Degree | 536 (57.6%) | 395 (42.4%) |
| Bachelor's Degree or higher | 478 (67.3%) | 232 (32.7%) |
Occupancy by Age of Householder in Vega Alta
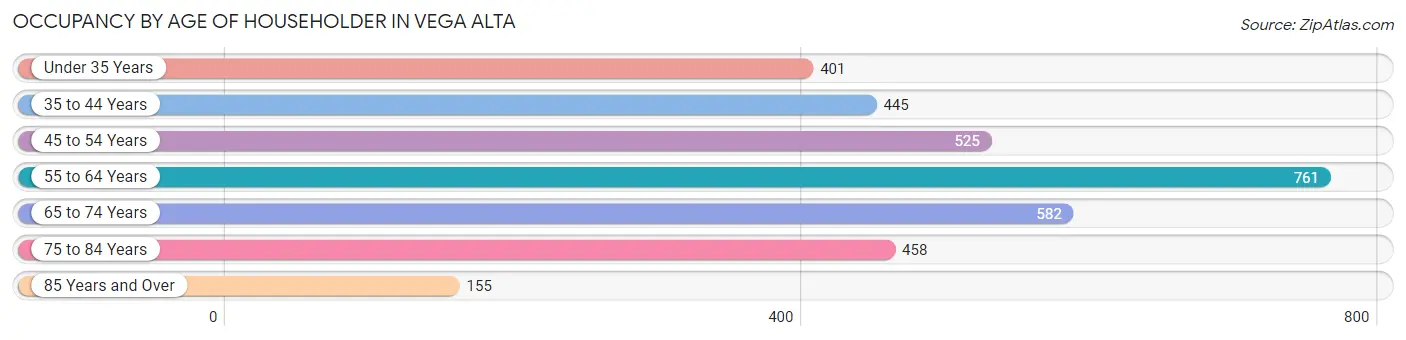
| Age Bracket | # Households | % Households |
| Under 35 Years | 401 | 12.0% |
| 35 to 44 Years | 445 | 13.4% |
| 45 to 54 Years | 525 | 15.8% |
| 55 to 64 Years | 761 | 22.9% |
| 65 to 74 Years | 582 | 17.5% |
| 75 to 84 Years | 458 | 13.8% |
| 85 Years and Over | 155 | 4.7% |
| Total | 3,327 | 100.0% |
Housing Finances in Vega Alta
Median Income by Occupancy in Vega Alta
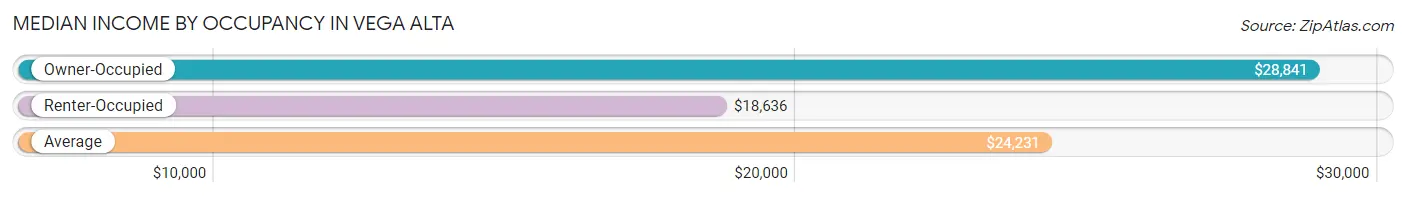
| Occupancy Type | # Households | Median Income |
| Owner-Occupied | 1,933 (58.1%) | $28,841 |
| Renter-Occupied | 1,394 (41.9%) | $18,636 |
| Average | 3,327 (100.0%) | $24,231 |
Occupancy by Householder Income Bracket in Vega Alta
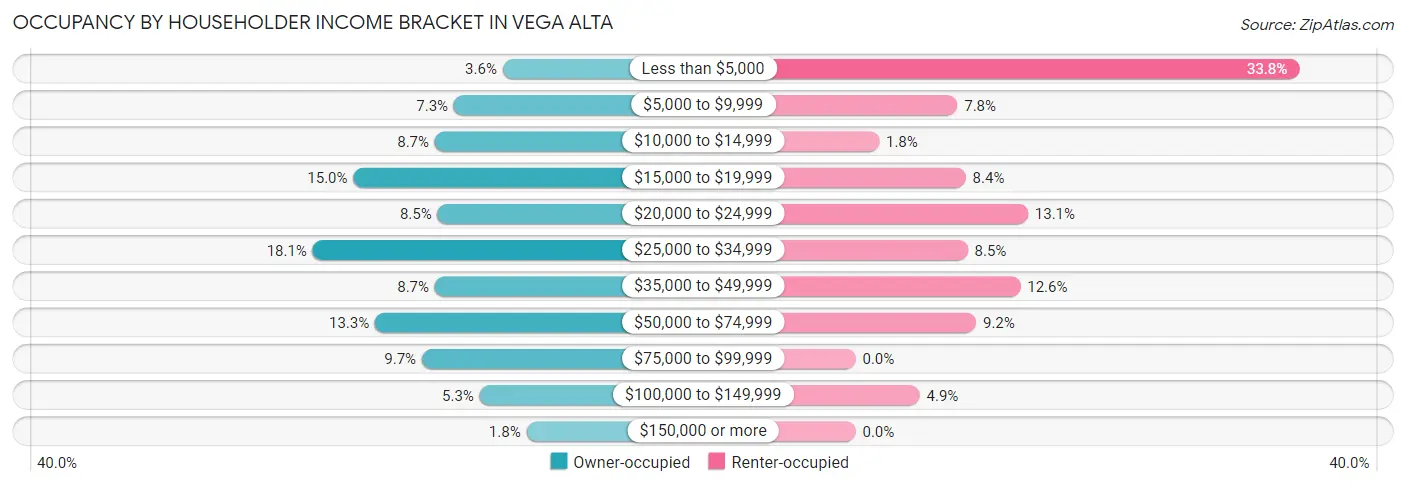
| Income Bracket | Owner-occupied | Renter-occupied |
| Less than $5,000 | 69 (3.6%) | 471 (33.8%) |
| $5,000 to $9,999 | 141 (7.3%) | 108 (7.7%) |
| $10,000 to $14,999 | 169 (8.7%) | 25 (1.8%) |
| $15,000 to $19,999 | 289 (14.9%) | 117 (8.4%) |
| $20,000 to $24,999 | 165 (8.5%) | 183 (13.1%) |
| $25,000 to $34,999 | 349 (18.0%) | 119 (8.5%) |
| $35,000 to $49,999 | 169 (8.7%) | 175 (12.6%) |
| $50,000 to $74,999 | 257 (13.3%) | 128 (9.2%) |
| $75,000 to $99,999 | 188 (9.7%) | 0 (0.0%) |
| $100,000 to $149,999 | 103 (5.3%) | 68 (4.9%) |
| $150,000 or more | 34 (1.8%) | 0 (0.0%) |
| Total | 1,933 (100.0%) | 1,394 (100.0%) |
Monthly Housing Cost Tiers in Vega Alta
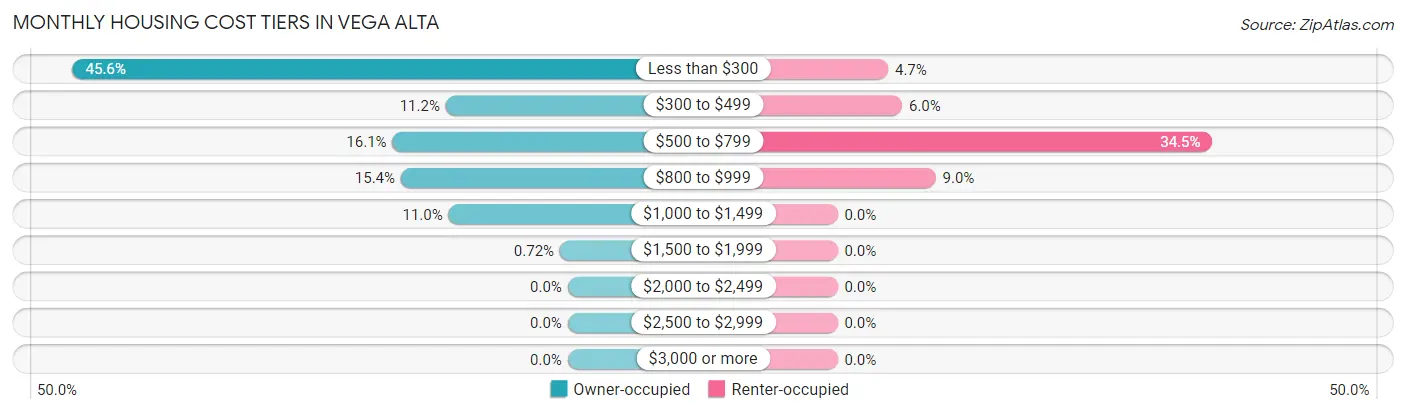
| Monthly Cost | Owner-occupied | Renter-occupied |
| Less than $300 | 881 (45.6%) | 65 (4.7%) |
| $300 to $499 | 217 (11.2%) | 83 (5.9%) |
| $500 to $799 | 312 (16.1%) | 481 (34.5%) |
| $800 to $999 | 297 (15.4%) | 126 (9.0%) |
| $1,000 to $1,499 | 212 (11.0%) | 0 (0.0%) |
| $1,500 to $1,999 | 14 (0.7%) | 0 (0.0%) |
| $2,000 to $2,499 | 0 (0.0%) | 0 (0.0%) |
| $2,500 to $2,999 | 0 (0.0%) | 0 (0.0%) |
| $3,000 or more | 0 (0.0%) | 0 (0.0%) |
| Total | 1,933 (100.0%) | 1,394 (100.0%) |
Physical Housing Characteristics in Vega Alta
Housing Structures in Vega Alta
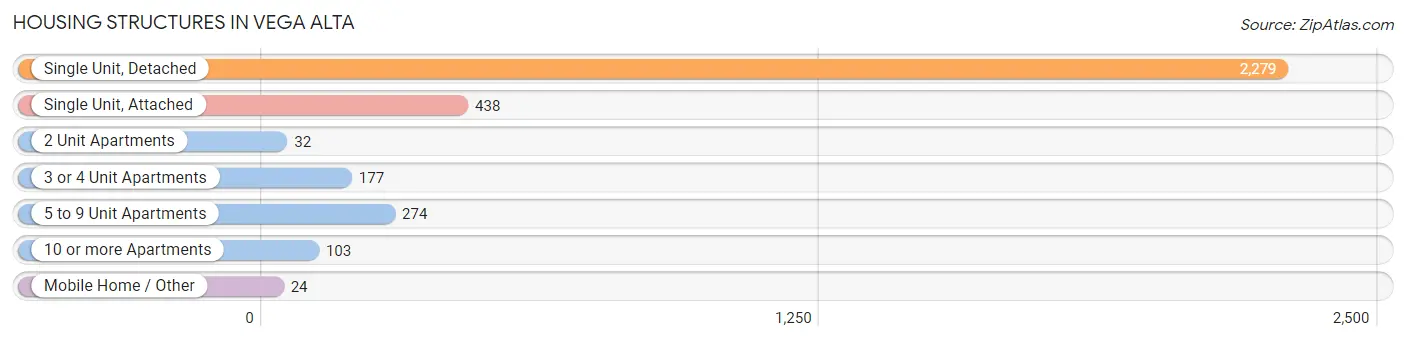
| Structure Type | # Housing Units | % Housing Units |
| Single Unit, Detached | 2,279 | 68.5% |
| Single Unit, Attached | 438 | 13.2% |
| 2 Unit Apartments | 32 | 1.0% |
| 3 or 4 Unit Apartments | 177 | 5.3% |
| 5 to 9 Unit Apartments | 274 | 8.2% |
| 10 or more Apartments | 103 | 3.1% |
| Mobile Home / Other | 24 | 0.7% |
| Total | 3,327 | 100.0% |
Housing Structures by Occupancy in Vega Alta
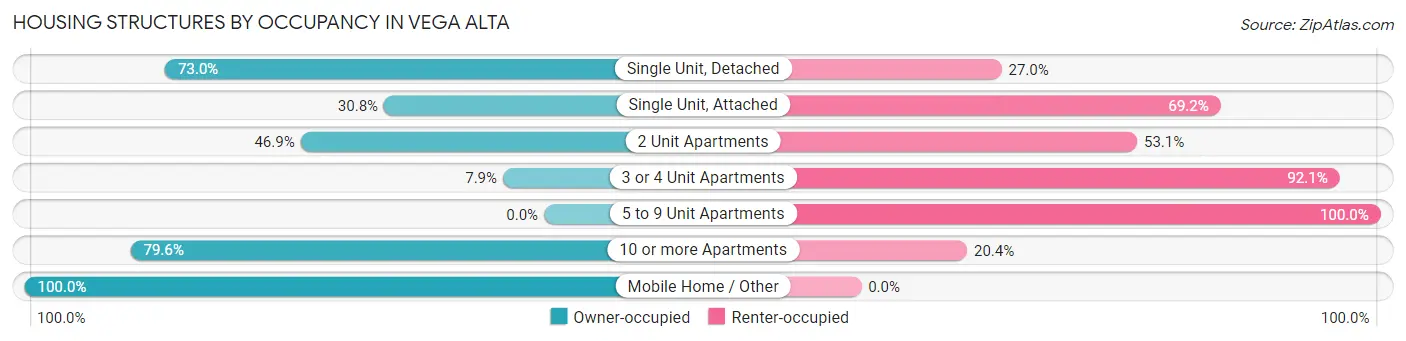
| Structure Type | Owner-occupied | Renter-occupied |
| Single Unit, Detached | 1,663 (73.0%) | 616 (27.0%) |
| Single Unit, Attached | 135 (30.8%) | 303 (69.2%) |
| 2 Unit Apartments | 15 (46.9%) | 17 (53.1%) |
| 3 or 4 Unit Apartments | 14 (7.9%) | 163 (92.1%) |
| 5 to 9 Unit Apartments | 0 (0.0%) | 274 (100.0%) |
| 10 or more Apartments | 82 (79.6%) | 21 (20.4%) |
| Mobile Home / Other | 24 (100.0%) | 0 (0.0%) |
| Total | 1,933 (58.1%) | 1,394 (41.9%) |
Housing Structures by Number of Rooms in Vega Alta
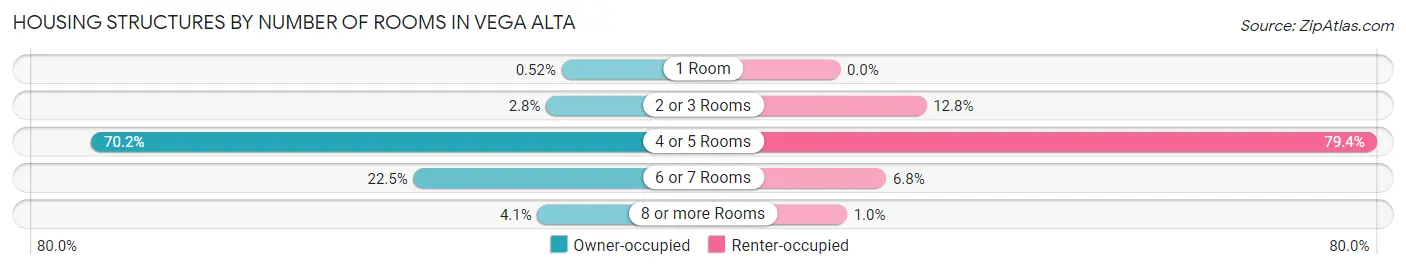
| Number of Rooms | Owner-occupied | Renter-occupied |
| 1 Room | 10 (0.5%) | 0 (0.0%) |
| 2 or 3 Rooms | 54 (2.8%) | 178 (12.8%) |
| 4 or 5 Rooms | 1,356 (70.2%) | 1,107 (79.4%) |
| 6 or 7 Rooms | 434 (22.5%) | 95 (6.8%) |
| 8 or more Rooms | 79 (4.1%) | 14 (1.0%) |
| Total | 1,933 (100.0%) | 1,394 (100.0%) |
Housing Structure by Heating Type in Vega Alta
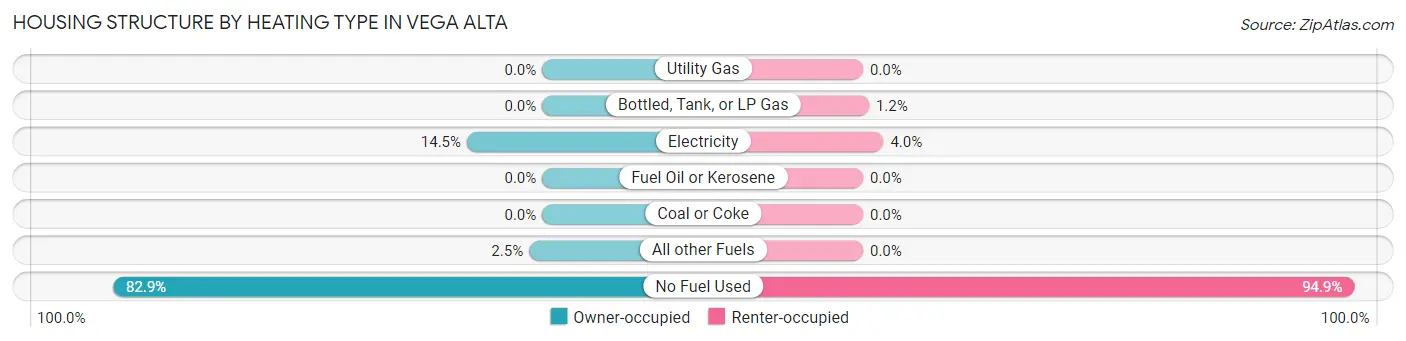
| Heating Type | Owner-occupied | Renter-occupied |
| Utility Gas | 0 (0.0%) | 0 (0.0%) |
| Bottled, Tank, or LP Gas | 0 (0.0%) | 16 (1.1%) |
| Electricity | 281 (14.5%) | 55 (4.0%) |
| Fuel Oil or Kerosene | 0 (0.0%) | 0 (0.0%) |
| Coal or Coke | 0 (0.0%) | 0 (0.0%) |
| All other Fuels | 49 (2.5%) | 0 (0.0%) |
| No Fuel Used | 1,603 (82.9%) | 1,323 (94.9%) |
| Total | 1,933 (100.0%) | 1,394 (100.0%) |
Household Vehicle Usage in Vega Alta
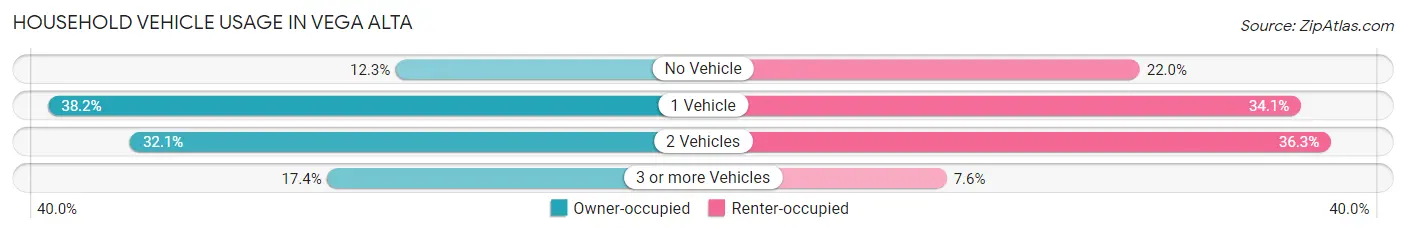
| Vehicles per Household | Owner-occupied | Renter-occupied |
| No Vehicle | 237 (12.3%) | 307 (22.0%) |
| 1 Vehicle | 739 (38.2%) | 475 (34.1%) |
| 2 Vehicles | 621 (32.1%) | 506 (36.3%) |
| 3 or more Vehicles | 336 (17.4%) | 106 (7.6%) |
| Total | 1,933 (100.0%) | 1,394 (100.0%) |
Real Estate & Mortgages in Vega Alta
Real Estate and Mortgage Overview in Vega Alta
| Characteristic | Without Mortgage | With Mortgage |
| Housing Units | 1,099 | 834 |
| Median Property Value | $116,900 | $133,500 |
| Median Household Income | $28,519 | $0 |
| Monthly Housing Costs | $191 | $0 |
| Real Estate Taxes | $199 | $824 |
Property Value by Mortgage Status in Vega Alta
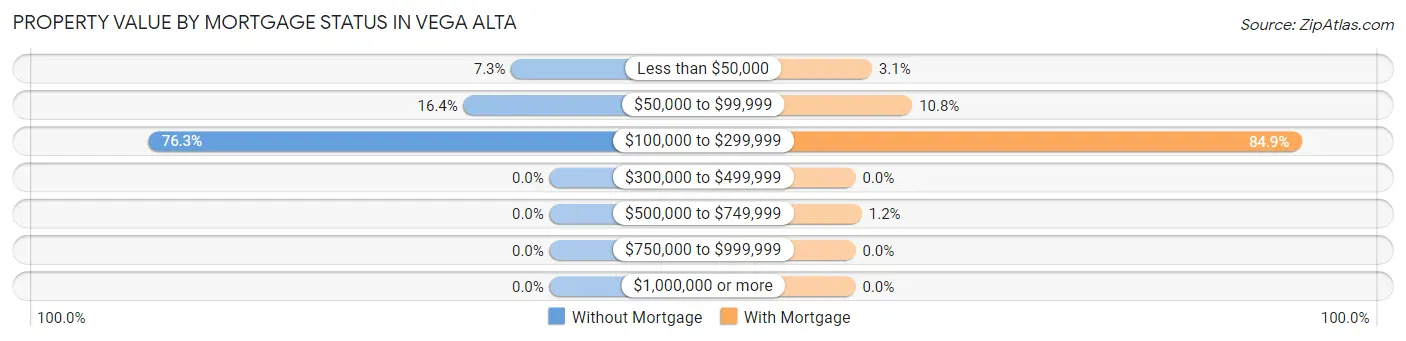
| Property Value | Without Mortgage | With Mortgage |
| Less than $50,000 | 80 (7.3%) | 26 (3.1%) |
| $50,000 to $99,999 | 180 (16.4%) | 90 (10.8%) |
| $100,000 to $299,999 | 839 (76.3%) | 708 (84.9%) |
| $300,000 to $499,999 | 0 (0.0%) | 0 (0.0%) |
| $500,000 to $749,999 | 0 (0.0%) | 10 (1.2%) |
| $750,000 to $999,999 | 0 (0.0%) | 0 (0.0%) |
| $1,000,000 or more | 0 (0.0%) | 0 (0.0%) |
| Total | 1,099 (100.0%) | 834 (100.0%) |
Household Income by Mortgage Status in Vega Alta
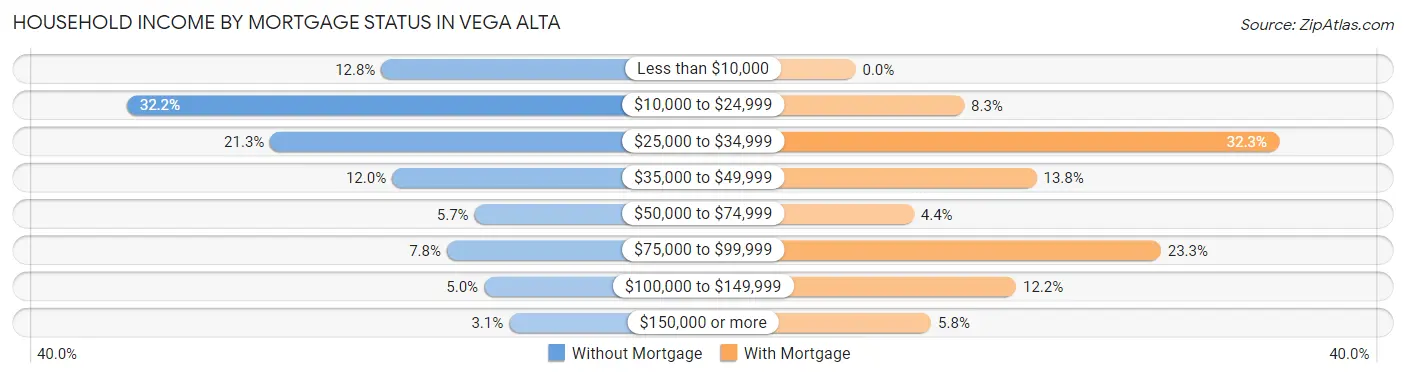
| Household Income | Without Mortgage | With Mortgage |
| Less than $10,000 | 141 (12.8%) | 0 (0.0%) |
| $10,000 to $24,999 | 354 (32.2%) | 69 (8.3%) |
| $25,000 to $34,999 | 234 (21.3%) | 269 (32.3%) |
| $35,000 to $49,999 | 132 (12.0%) | 115 (13.8%) |
| $50,000 to $74,999 | 63 (5.7%) | 37 (4.4%) |
| $75,000 to $99,999 | 86 (7.8%) | 194 (23.3%) |
| $100,000 to $149,999 | 55 (5.0%) | 102 (12.2%) |
| $150,000 or more | 34 (3.1%) | 48 (5.8%) |
| Total | 1,099 (100.0%) | 834 (100.0%) |
Property Value to Household Income Ratio in Vega Alta
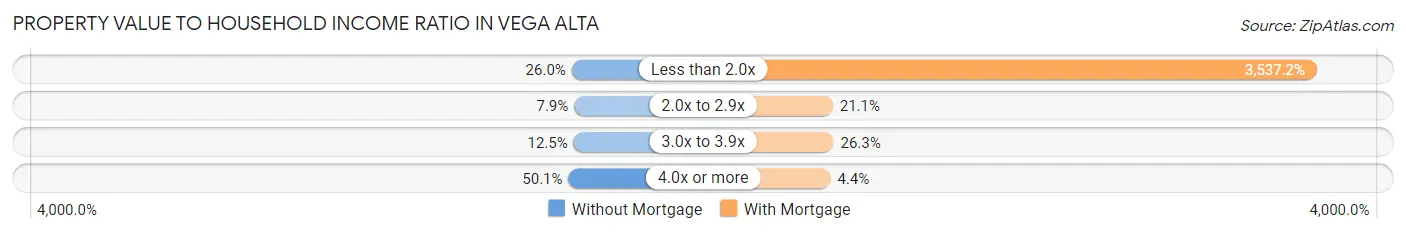
| Value-to-Income Ratio | Without Mortgage | With Mortgage |
| Less than 2.0x | 286 (26.0%) | 29,500 (3,537.2%) |
| 2.0x to 2.9x | 87 (7.9%) | 176 (21.1%) |
| 3.0x to 3.9x | 137 (12.5%) | 219 (26.3%) |
| 4.0x or more | 550 (50.0%) | 37 (4.4%) |
| Total | 1,099 (100.0%) | 834 (100.0%) |
Real Estate Taxes by Mortgage Status in Vega Alta
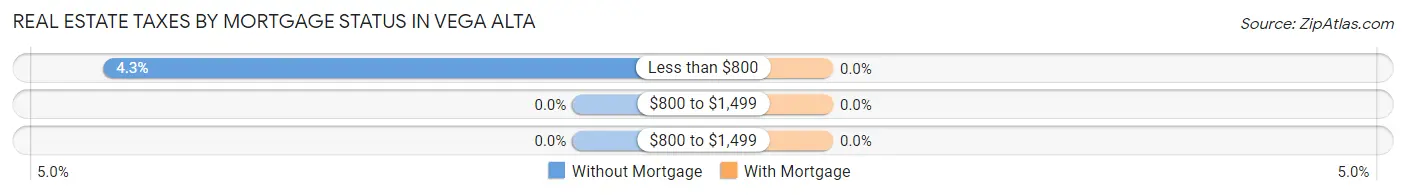
| Property Taxes | Without Mortgage | With Mortgage |
| Less than $800 | 47 (4.3%) | 0 (0.0%) |
| $800 to $1,499 | 0 (0.0%) | 0 (0.0%) |
| $800 to $1,499 | 0 (0.0%) | 0 (0.0%) |
| Total | 1,099 (100.0%) | 834 (100.0%) |
Health & Disability in Vega Alta
Health Insurance Coverage by Age in Vega Alta
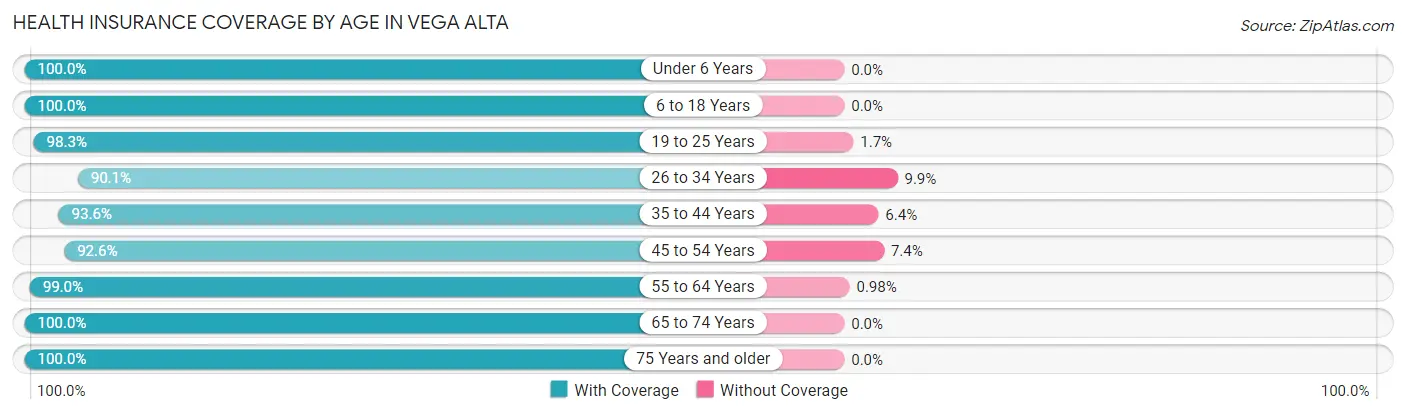
| Age Bracket | With Coverage | Without Coverage |
| Under 6 Years | 320 (100.0%) | 0 (0.0%) |
| 6 to 18 Years | 1,183 (100.0%) | 0 (0.0%) |
| 19 to 25 Years | 873 (98.3%) | 15 (1.7%) |
| 26 to 34 Years | 1,098 (90.1%) | 121 (9.9%) |
| 35 to 44 Years | 898 (93.6%) | 61 (6.4%) |
| 45 to 54 Years | 976 (92.6%) | 78 (7.4%) |
| 55 to 64 Years | 1,309 (99.0%) | 13 (1.0%) |
| 65 to 74 Years | 945 (100.0%) | 0 (0.0%) |
| 75 Years and older | 1,036 (100.0%) | 0 (0.0%) |
| Total | 8,638 (96.8%) | 288 (3.2%) |
Health Insurance Coverage by Citizenship Status in Vega Alta
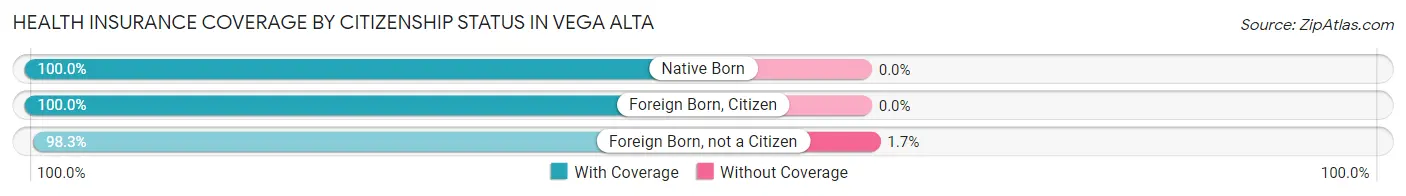
| Citizenship Status | With Coverage | Without Coverage |
| Native Born | 320 (100.0%) | 0 (0.0%) |
| Foreign Born, Citizen | 1,183 (100.0%) | 0 (0.0%) |
| Foreign Born, not a Citizen | 873 (98.3%) | 15 (1.7%) |
Health Insurance Coverage by Household Income in Vega Alta
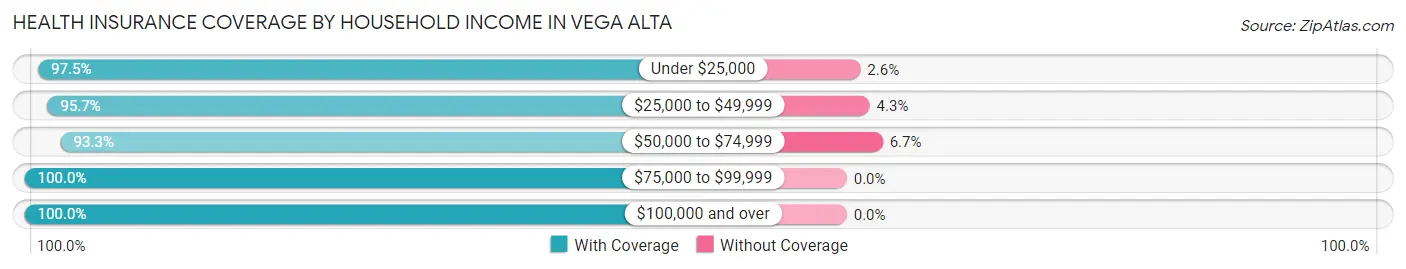
| Household Income | With Coverage | Without Coverage |
| Under $25,000 | 3,853 (97.5%) | 101 (2.5%) |
| $25,000 to $49,999 | 2,349 (95.7%) | 105 (4.3%) |
| $50,000 to $74,999 | 1,136 (93.3%) | 82 (6.7%) |
| $75,000 to $99,999 | 624 (100.0%) | 0 (0.0%) |
| $100,000 and over | 671 (100.0%) | 0 (0.0%) |
Public vs Private Health Insurance Coverage by Age in Vega Alta
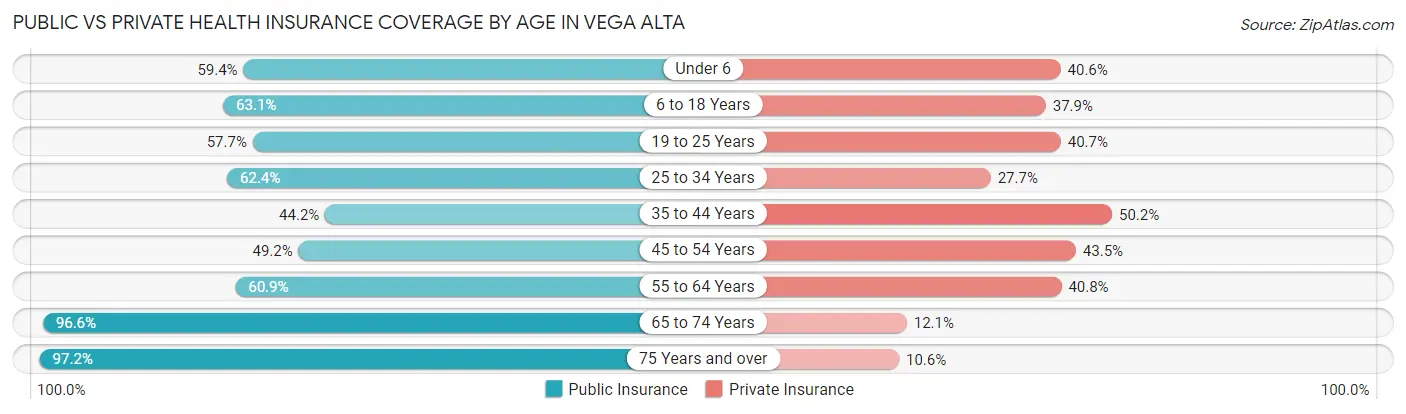
| Age Bracket | Public Insurance | Private Insurance |
| Under 6 | 190 (59.4%) | 130 (40.6%) |
| 6 to 18 Years | 747 (63.1%) | 448 (37.9%) |
| 19 to 25 Years | 512 (57.7%) | 361 (40.6%) |
| 25 to 34 Years | 761 (62.4%) | 337 (27.7%) |
| 35 to 44 Years | 424 (44.2%) | 481 (50.2%) |
| 45 to 54 Years | 518 (49.1%) | 458 (43.4%) |
| 55 to 64 Years | 805 (60.9%) | 539 (40.8%) |
| 65 to 74 Years | 913 (96.6%) | 114 (12.1%) |
| 75 Years and over | 1,007 (97.2%) | 110 (10.6%) |
| Total | 5,877 (65.8%) | 2,978 (33.4%) |
Disability Status by Sex by Age in Vega Alta
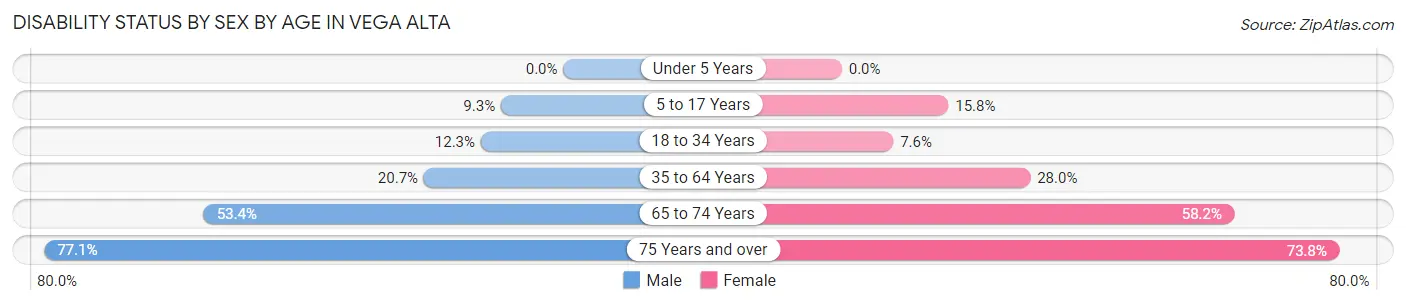
| Age Bracket | Male | Female |
| Under 5 Years | 0 (0.0%) | 0 (0.0%) |
| 5 to 17 Years | 63 (9.3%) | 65 (15.8%) |
| 18 to 34 Years | 141 (12.2%) | 85 (7.6%) |
| 35 to 64 Years | 328 (20.7%) | 490 (28.0%) |
| 65 to 74 Years | 212 (53.4%) | 319 (58.2%) |
| 75 Years and over | 269 (77.1%) | 507 (73.8%) |
Disability Class by Sex by Age in Vega Alta
Disability Class: Hearing Difficulty
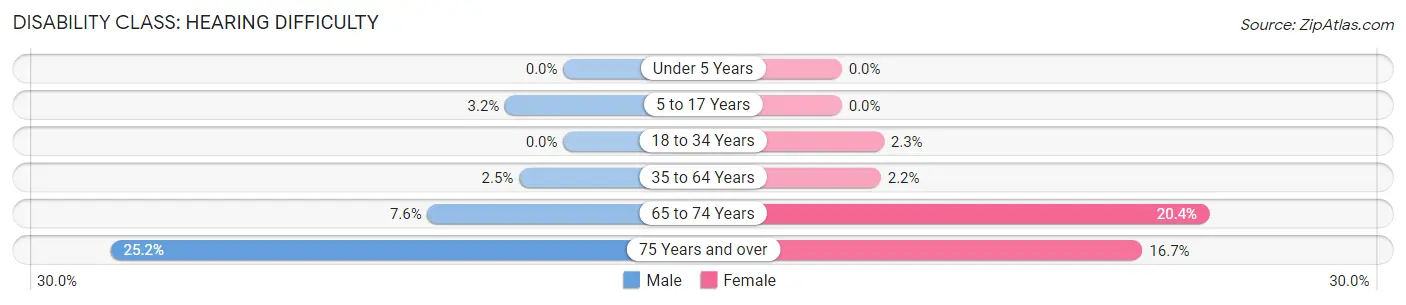
| Age Bracket | Male | Female |
| Under 5 Years | 0 (0.0%) | 0 (0.0%) |
| 5 to 17 Years | 22 (3.2%) | 0 (0.0%) |
| 18 to 34 Years | 0 (0.0%) | 26 (2.3%) |
| 35 to 64 Years | 39 (2.5%) | 38 (2.2%) |
| 65 to 74 Years | 30 (7.6%) | 112 (20.4%) |
| 75 Years and over | 88 (25.2%) | 115 (16.7%) |
Disability Class: Vision Difficulty
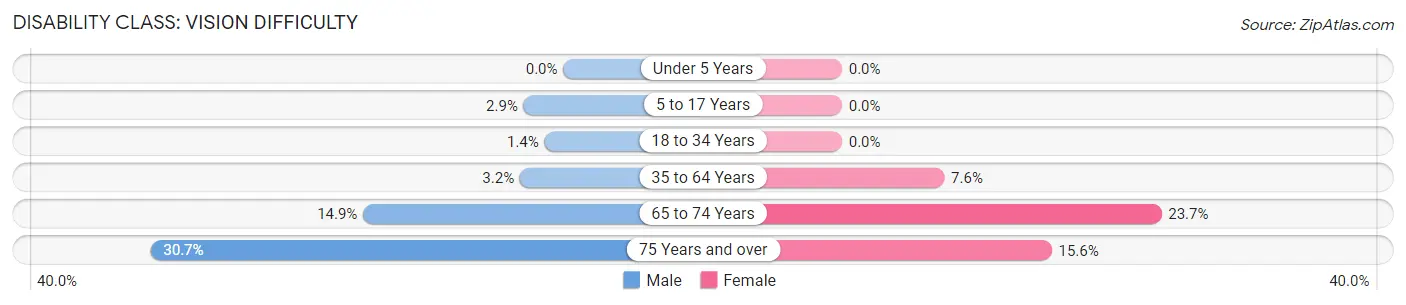
| Age Bracket | Male | Female |
| Under 5 Years | 0 (0.0%) | 0 (0.0%) |
| 5 to 17 Years | 20 (2.9%) | 0 (0.0%) |
| 18 to 34 Years | 16 (1.4%) | 0 (0.0%) |
| 35 to 64 Years | 51 (3.2%) | 133 (7.6%) |
| 65 to 74 Years | 59 (14.9%) | 130 (23.7%) |
| 75 Years and over | 107 (30.7%) | 107 (15.6%) |
Disability Class: Cognitive Difficulty
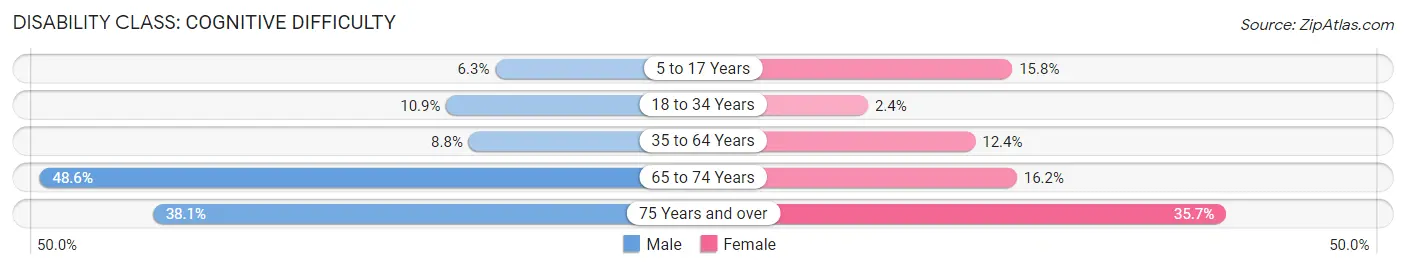
| Age Bracket | Male | Female |
| 5 to 17 Years | 43 (6.3%) | 65 (15.8%) |
| 18 to 34 Years | 125 (10.9%) | 27 (2.4%) |
| 35 to 64 Years | 139 (8.8%) | 217 (12.4%) |
| 65 to 74 Years | 193 (48.6%) | 89 (16.2%) |
| 75 Years and over | 133 (38.1%) | 245 (35.7%) |
Disability Class: Ambulatory Difficulty
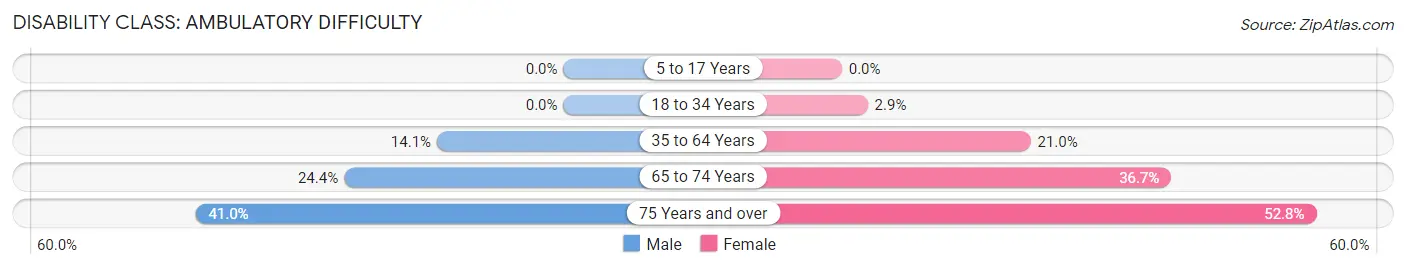
| Age Bracket | Male | Female |
| 5 to 17 Years | 0 (0.0%) | 0 (0.0%) |
| 18 to 34 Years | 0 (0.0%) | 32 (2.9%) |
| 35 to 64 Years | 223 (14.1%) | 368 (21.0%) |
| 65 to 74 Years | 97 (24.4%) | 201 (36.7%) |
| 75 Years and over | 143 (41.0%) | 363 (52.8%) |
Disability Class: Self-Care Difficulty
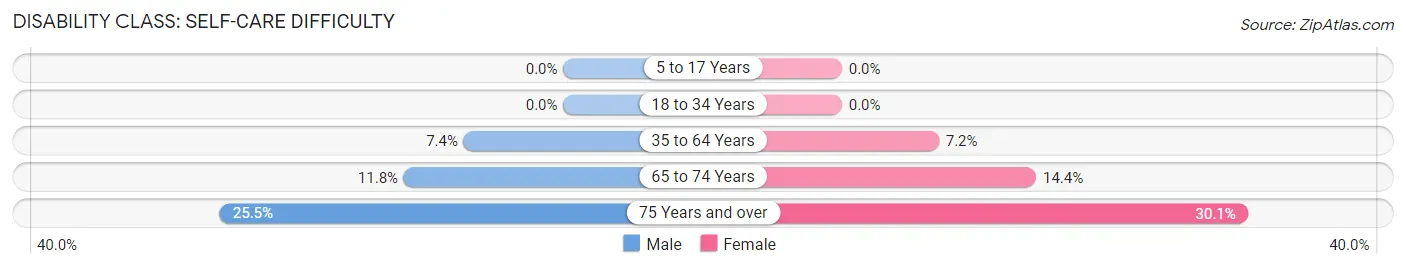
| Age Bracket | Male | Female |
| 5 to 17 Years | 0 (0.0%) | 0 (0.0%) |
| 18 to 34 Years | 0 (0.0%) | 0 (0.0%) |
| 35 to 64 Years | 117 (7.4%) | 126 (7.2%) |
| 65 to 74 Years | 47 (11.8%) | 79 (14.4%) |
| 75 Years and over | 89 (25.5%) | 207 (30.1%) |
Technology Access in Vega Alta
Computing Device Access in Vega Alta
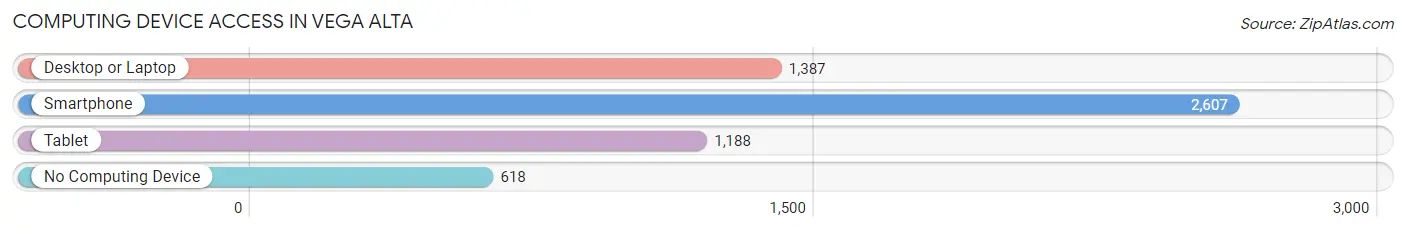
| Device Type | # Households | % Households |
| Desktop or Laptop | 1,387 | 41.7% |
| Smartphone | 2,607 | 78.4% |
| Tablet | 1,188 | 35.7% |
| No Computing Device | 618 | 18.6% |
| Total | 3,327 | 100.0% |
Internet Access in Vega Alta
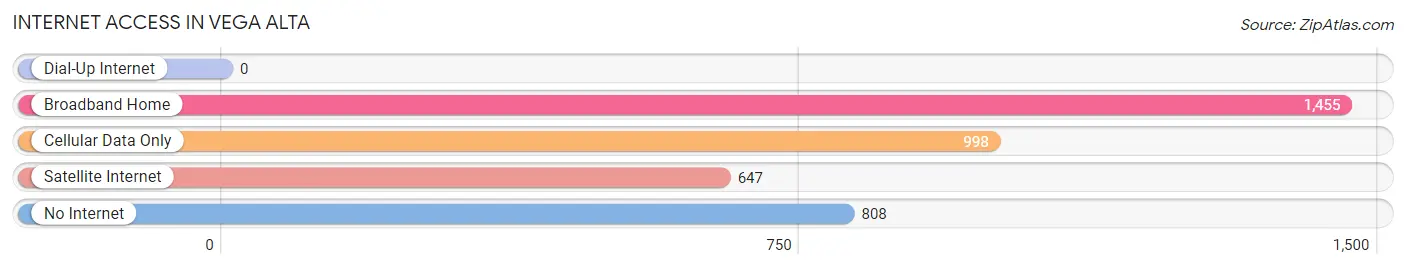
| Internet Type | # Households | % Households |
| Dial-Up Internet | 0 | 0.0% |
| Broadband Home | 1,455 | 43.7% |
| Cellular Data Only | 998 | 30.0% |
| Satellite Internet | 647 | 19.5% |
| No Internet | 808 | 24.3% |
| Total | 3,327 | 100.0% |
Vega Alta Summary
Vega Alta is a municipality located in the northern coast of Puerto Rico, in the northern part of the island. It is part of the San Juan-Caguas-Guaynabo Metropolitan Statistical Area. The town is bordered by Dorado to the north, Toa Alta to the south, Vega Baja to the east, and the Atlantic Ocean to the west. As of the 2010 census, the population of Vega Alta was 33,660.
History
Vega Alta was founded in 1775 by Don Tomás de Abadía, who named it after the Vega Alta River. The town was officially recognized in 1777, and it was the first town in the northern coast of Puerto Rico to be recognized. The town was originally part of the municipality of Dorado, but it was separated in 1806.
Geography
Vega Alta is located in the northern coast of Puerto Rico, in the northern part of the island. It is bordered by Dorado to the north, Toa Alta to the south, Vega Baja to the east, and the Atlantic Ocean to the west. The town has a total area of 39.9 square miles, of which 39.3 square miles is land and 0.6 square miles is water.
Economy
The economy of Vega Alta is mainly based on agriculture and tourism. The town is known for its production of sugar cane, coffee, and tobacco. It is also home to several industrial parks, including the Vega Alta Industrial Park, which is home to several manufacturing companies. Tourism is also an important part of the economy, with the town being home to several beaches and resorts.
Demographics
As of the 2010 census, the population of Vega Alta was 33,660. The population is mostly of Puerto Rican descent, with a small percentage of other ethnicities. The median household income is $20,845, and the median age is 38. The town has a high rate of poverty, with 33.3% of the population living below the poverty line.
Conclusion
Vega Alta is a municipality located in the northern coast of Puerto Rico, in the northern part of the island. It was founded in 1775 and officially recognized in 1777. The town has a total area of 39.9 square miles, and the population is mostly of Puerto Rican descent. The economy of Vega Alta is mainly based on agriculture and tourism, and the median household income is $20,845. The town has a high rate of poverty, with 33.3% of the population living below the poverty line.
Common Questions
What is Per Capita Income in Vega Alta?
Per Capita income in Vega Alta is $13,259.
What is the Median Family Income in Vega Alta?
Median Family Income in Vega Alta is $24,623.
What is the Median Household income in Vega Alta?
Median Household Income in Vega Alta is $24,231.
What is Income or Wage Gap in Vega Alta?
Income or Wage Gap in Vega Alta is 8.3%.
Women in Vega Alta earn 91.7 cents for every dollar earned by a man.
What is Family Income Deficit in Vega Alta?
Family Income Deficit in Vega Alta is $13,108.
Families that are below poverty line in Vega Alta earn $13,108 less on average than the poverty threshold level.
What is Inequality or Gini Index in Vega Alta?
Inequality or Gini Index in Vega Alta is 0.49.
What is the Total Population of Vega Alta?
Total Population of Vega Alta is 9,179.
What is the Total Male Population of Vega Alta?
Total Male Population of Vega Alta is 4,311.
What is the Total Female Population of Vega Alta?
Total Female Population of Vega Alta is 4,868.
What is the Ratio of Males per 100 Females in Vega Alta?
There are 88.56 Males per 100 Females in Vega Alta.
What is the Ratio of Females per 100 Males in Vega Alta?
There are 112.92 Females per 100 Males in Vega Alta.
What is the Median Population Age in Vega Alta?
Median Population Age in Vega Alta is 43.0 Years.
What is the Average Family Size in Vega Alta
Average Family Size in Vega Alta is 3.1 People.
What is the Average Household Size in Vega Alta
Average Household Size in Vega Alta is 2.7 People.
How Large is the Labor Force in Vega Alta?
There are 3,824 People in the Labor Forcein in Vega Alta.
What is the Percentage of People in the Labor Force in Vega Alta?
47.8% of People are in the Labor Force in Vega Alta.
What is the Unemployment Rate in Vega Alta?
Unemployment Rate in Vega Alta is 23.8%.