Toa Baja, PR Map & Demographics
Toa Baja Map
Toa Baja Overview
$13,238
PER CAPITA INCOME
$20,750
AVG FAMILY INCOME
$21,652
AVG HOUSEHOLD INCOME
28.8%
WAGE / INCOME GAP [ % ]
71.2¢/ $1
WAGE / INCOME GAP [ $ ]
0.52
INEQUALITY / GINI INDEX
999
TOTAL POPULATION
529
MALE POPULATION
470
FEMALE POPULATION
112.55
MALES / 100 FEMALES
88.85
FEMALES / 100 MALES
45.8
MEDIAN AGE
2.9
AVG FAMILY SIZE
2.4
AVG HOUSEHOLD SIZE
365
LABOR FORCE [ PEOPLE ]
41.4%
PERCENT IN LABOR FORCE
9.0%
UNEMPLOYMENT RATE
Income in Toa Baja
Income Overview in Toa Baja
Per Capita Income in Toa Baja is $13,238, while median incomes of families and households are $20,750 and $21,652 respectively.
| Characteristic | Number | Measure |
| Per Capita Income | 999 | $13,238 |
| Median Family Income | 266 | $20,750 |
| Mean Family Income | 266 | $32,165 |
| Median Household Income | 395 | $21,652 |
| Mean Household Income | 395 | $29,398 |
| Income Deficit | 266 | $0 |
| Wage / Income Gap (%) | 999 | 28.85% |
| Wage / Income Gap ($) | 999 | 71.15¢ per $1 |
| Gini / Inequality Index | 999 | 0.52 |
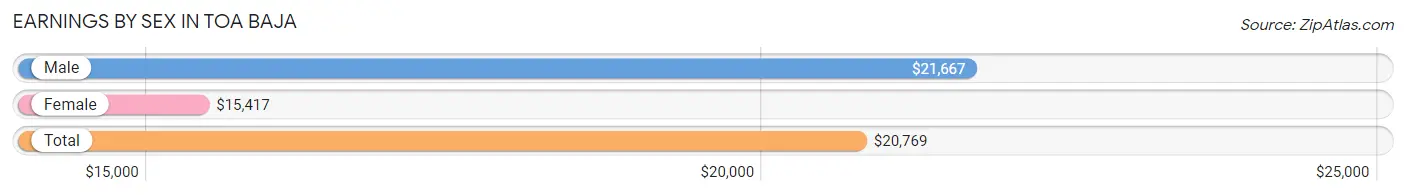
Earnings by Sex in Toa Baja
Average Earnings in Toa Baja are $20,769, $21,667 for men and $15,417 for women, a difference of 28.8%.
| Sex | Number | Average Earnings |
| Male | 182 (53.8%) | $21,667 |
| Female | 156 (46.2%) | $15,417 |
| Total | 338 (100.0%) | $20,769 |
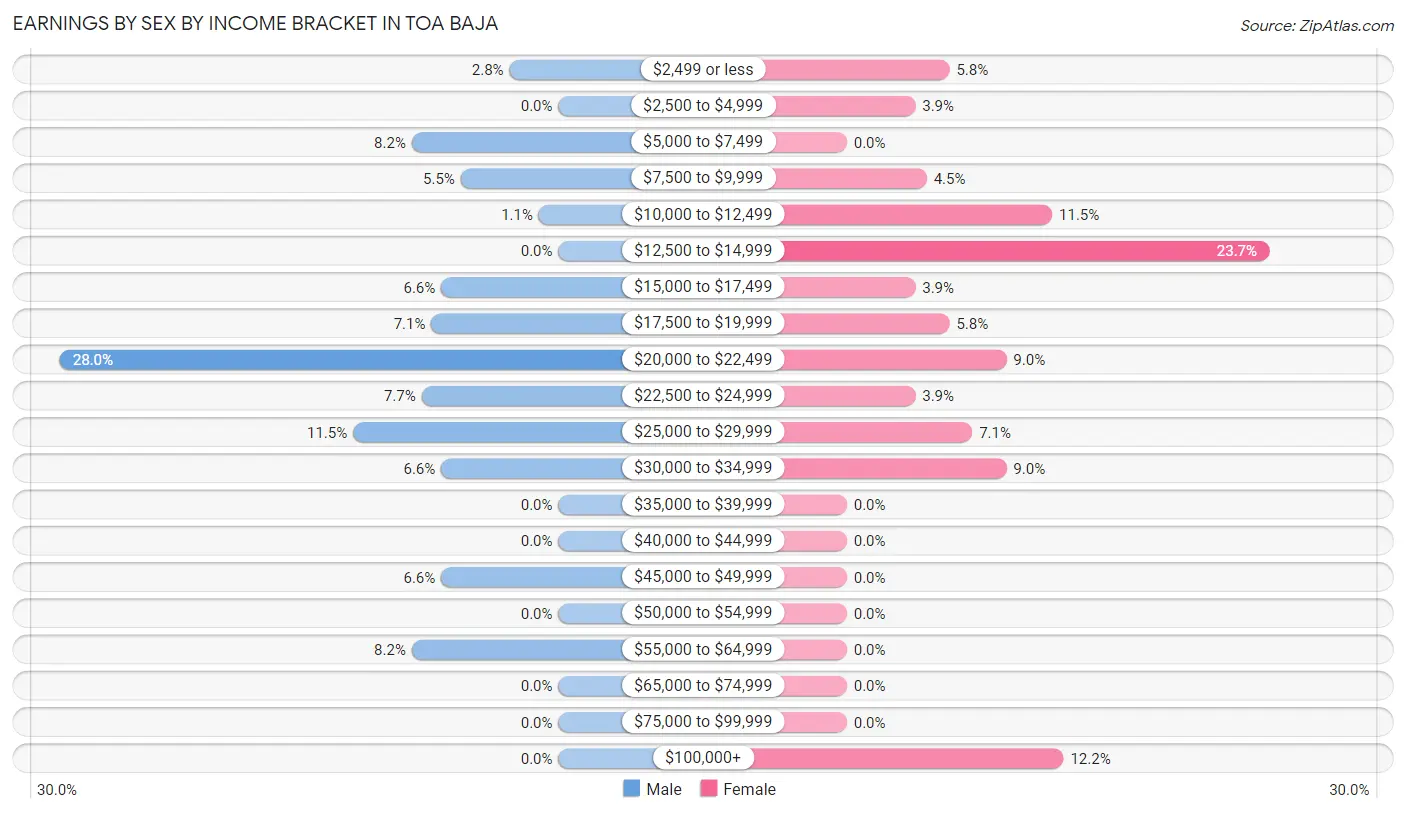
Earnings by Sex by Income Bracket in Toa Baja
The most common earnings brackets in Toa Baja are $20,000 to $22,499 for men (51 | 28.0%) and $12,500 to $14,999 for women (37 | 23.7%).
| Income | Male | Female |
| $2,499 or less | 5 (2.8%) | 9 (5.8%) |
| $2,500 to $4,999 | 0 (0.0%) | 6 (3.8%) |
| $5,000 to $7,499 | 15 (8.2%) | 0 (0.0%) |
| $7,500 to $9,999 | 10 (5.5%) | 7 (4.5%) |
| $10,000 to $12,499 | 2 (1.1%) | 18 (11.5%) |
| $12,500 to $14,999 | 0 (0.0%) | 37 (23.7%) |
| $15,000 to $17,499 | 12 (6.6%) | 6 (3.8%) |
| $17,500 to $19,999 | 13 (7.1%) | 9 (5.8%) |
| $20,000 to $22,499 | 51 (28.0%) | 14 (9.0%) |
| $22,500 to $24,999 | 14 (7.7%) | 6 (3.8%) |
| $25,000 to $29,999 | 21 (11.5%) | 11 (7.0%) |
| $30,000 to $34,999 | 12 (6.6%) | 14 (9.0%) |
| $35,000 to $39,999 | 0 (0.0%) | 0 (0.0%) |
| $40,000 to $44,999 | 0 (0.0%) | 0 (0.0%) |
| $45,000 to $49,999 | 12 (6.6%) | 0 (0.0%) |
| $50,000 to $54,999 | 0 (0.0%) | 0 (0.0%) |
| $55,000 to $64,999 | 15 (8.2%) | 0 (0.0%) |
| $65,000 to $74,999 | 0 (0.0%) | 0 (0.0%) |
| $75,000 to $99,999 | 0 (0.0%) | 0 (0.0%) |
| $100,000+ | 0 (0.0%) | 19 (12.2%) |
| Total | 182 (100.0%) | 156 (100.0%) |
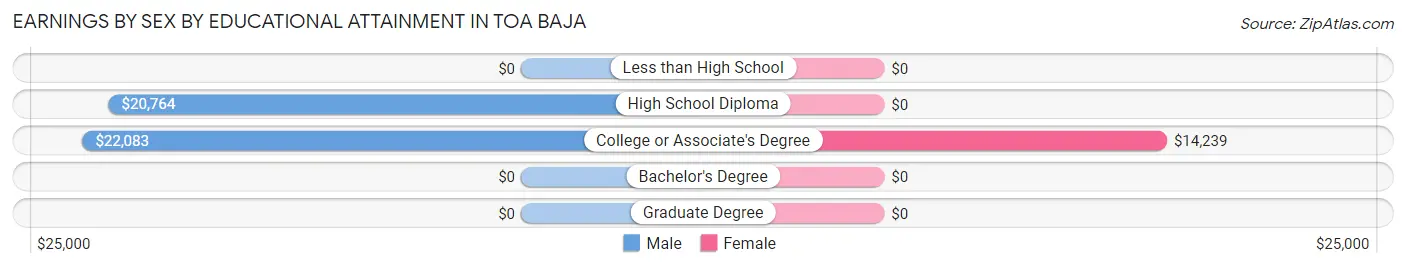
Earnings by Sex by Educational Attainment in Toa Baja
Average earnings in Toa Baja are $21,275 for men and $16,667 for women, a difference of 21.7%. Men with an educational attainment of college or associate's degree enjoy the highest average annual earnings of $22,083, while those with high school diploma education earn the least with $20,764. Women with an educational attainment of college or associate's degree earn the most with the average annual earnings of $14,239, while those with college or associate's degree education have the smallest earnings of $14,239.
| Educational Attainment | Male Income | Female Income |
| Less than High School | - | - |
| High School Diploma | $20,764 | $0 |
| College or Associate's Degree | $22,083 | $14,239 |
| Bachelor's Degree | - | - |
| Graduate Degree | - | - |
| Total | $21,275 | $16,667 |
Family Income in Toa Baja
Family Income Brackets in Toa Baja
According to the Toa Baja family income data, there are 90 families falling into the $15,000 to $24,999 income range, which is the most common income bracket and makes up 33.8% of all families.
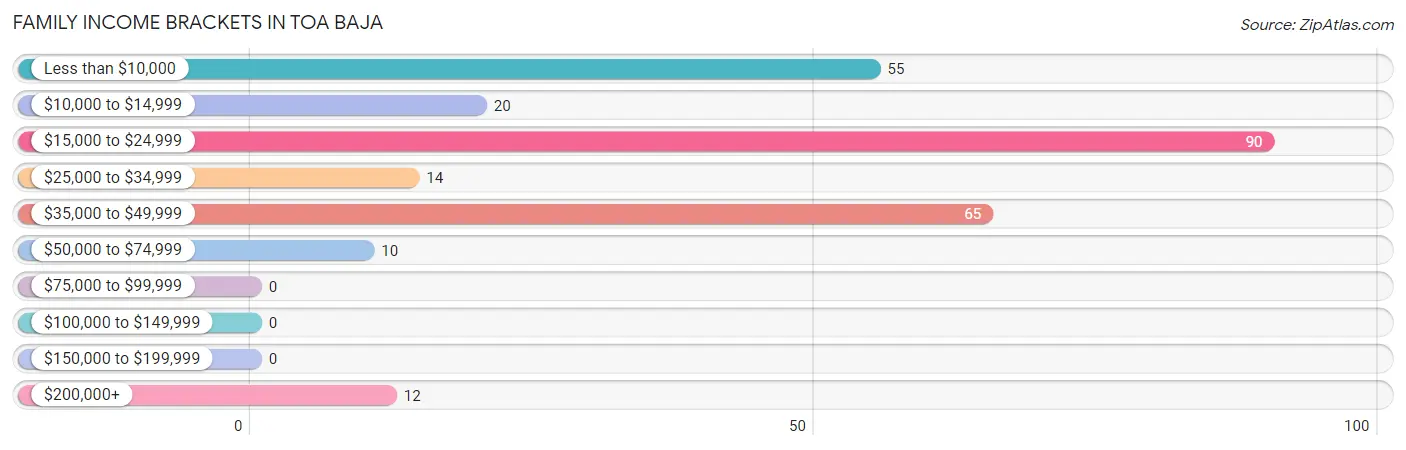
| Income Bracket | # Families | % Families |
| Less than $10,000 | 55 | 20.7% |
| $10,000 to $14,999 | 20 | 7.5% |
| $15,000 to $24,999 | 90 | 33.8% |
| $25,000 to $34,999 | 14 | 5.3% |
| $35,000 to $49,999 | 65 | 24.4% |
| $50,000 to $74,999 | 10 | 3.8% |
| $75,000 to $99,999 | 0 | 0.0% |
| $100,000 to $149,999 | 0 | 0.0% |
| $150,000 to $199,999 | 0 | 0.0% |
| $200,000+ | 12 | 4.5% |
Family Income by Famaliy Size in Toa Baja
2-person families (146 | 54.9%) account for the highest median family income in Toa Baja with $21,607 per family, while 2-person families (146 | 54.9%) have the highest median income of $10,804 per family member.
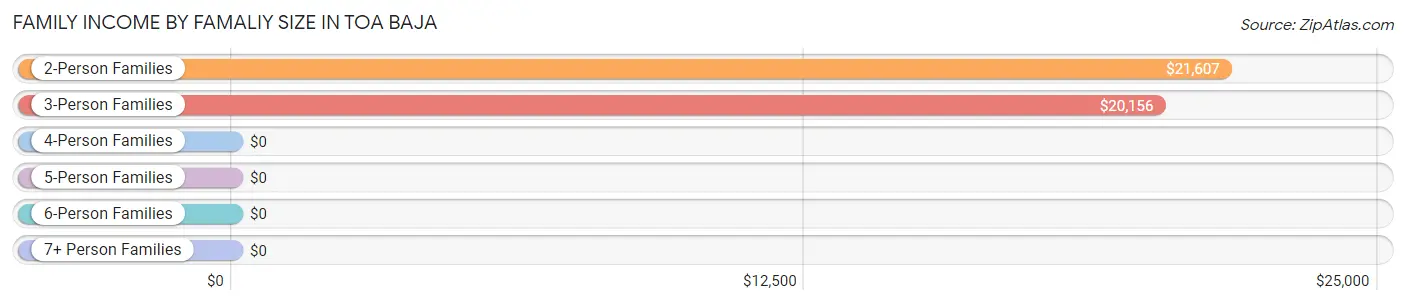
| Income Bracket | # Families | Median Income |
| 2-Person Families | 146 (54.9%) | $21,607 |
| 3-Person Families | 84 (31.6%) | $20,156 |
| 4-Person Families | 31 (11.7%) | $0 |
| 5-Person Families | 5 (1.9%) | $0 |
| 6-Person Families | 0 (0.0%) | $0 |
| 7+ Person Families | 0 (0.0%) | $0 |
| Total | 266 (100.0%) | $20,750 |
Family Income by Number of Earners in Toa Baja
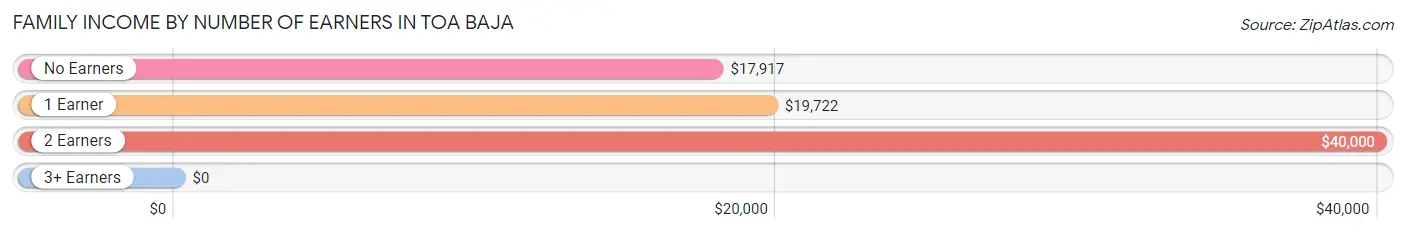
| Number of Earners | # Families | Median Income |
| No Earners | 120 (45.1%) | $17,917 |
| 1 Earner | 94 (35.3%) | $19,722 |
| 2 Earners | 40 (15.0%) | $40,000 |
| 3+ Earners | 12 (4.5%) | $0 |
| Total | 266 (100.0%) | $20,750 |
Household Income in Toa Baja
Household Income Brackets in Toa Baja
With 118 households falling in the category, the less than $10,000 income range is the most frequent in Toa Baja, accounting for 29.9% of all households.
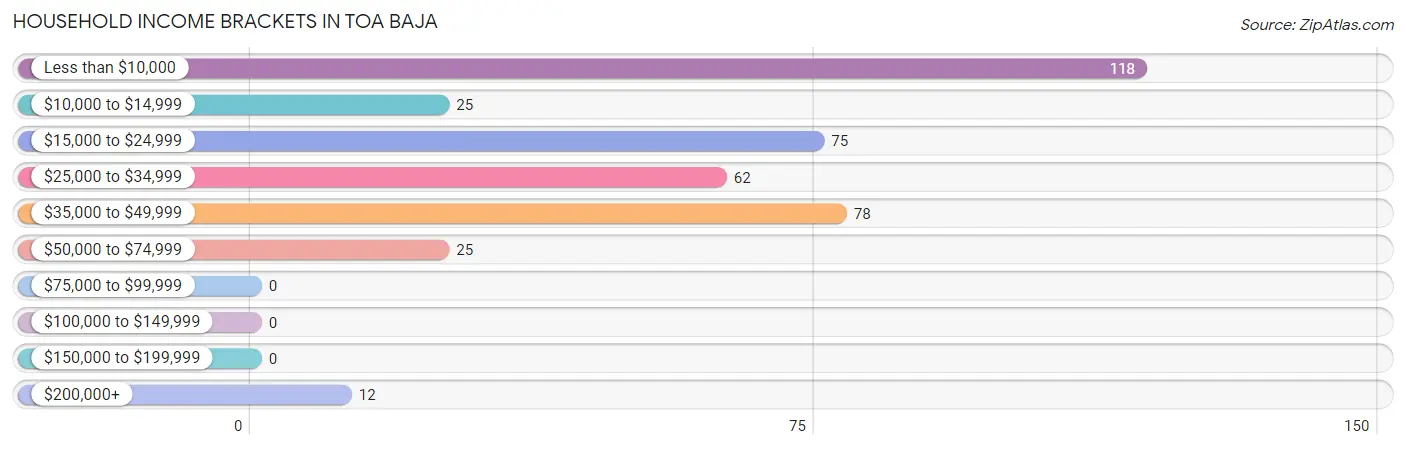
| Income Bracket | # Households | % Households |
| Less than $10,000 | 118 | 29.9% |
| $10,000 to $14,999 | 25 | 6.3% |
| $15,000 to $24,999 | 75 | 19.0% |
| $25,000 to $34,999 | 62 | 15.7% |
| $35,000 to $49,999 | 78 | 19.7% |
| $50,000 to $74,999 | 25 | 6.3% |
| $75,000 to $99,999 | 0 | 0.0% |
| $100,000 to $149,999 | 0 | 0.0% |
| $150,000 to $199,999 | 0 | 0.0% |
| $200,000+ | 12 | 3.0% |
Household Income by Householder Age in Toa Baja
The median household income in Toa Baja is $21,652, with the highest median household income of $31,161 found in the 25 to 44 years age bracket for the primary householder. A total of 66 households (16.7%) fall into this category.
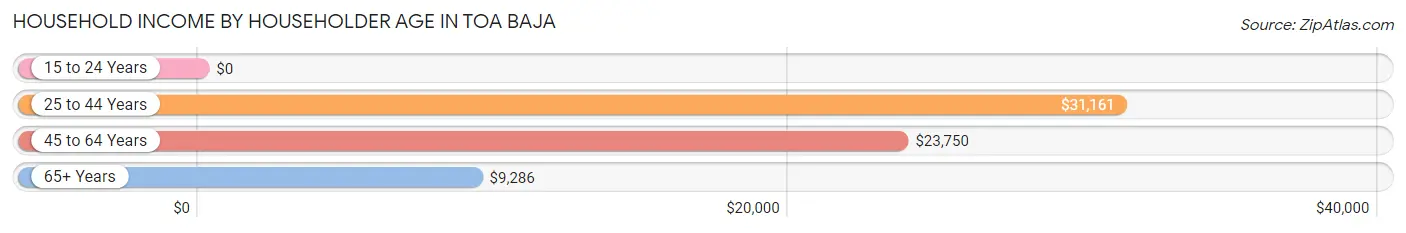
| Income Bracket | # Households | Median Income |
| 15 to 24 Years | 0 (0.0%) | $0 |
| 25 to 44 Years | 66 (16.7%) | $31,161 |
| 45 to 64 Years | 203 (51.4%) | $23,750 |
| 65+ Years | 126 (31.9%) | $9,286 |
| Total | 395 (100.0%) | $21,652 |
Poverty in Toa Baja
Income Below Poverty by Sex and Age in Toa Baja
With 59.4% poverty level for males and 50.4% for females among the residents of Toa Baja, under 5 year old males and under 5 year old females are the most vulnerable to poverty, with 10 males (100.0%) and 11 females (100.0%) in their respective age groups living below the poverty level.
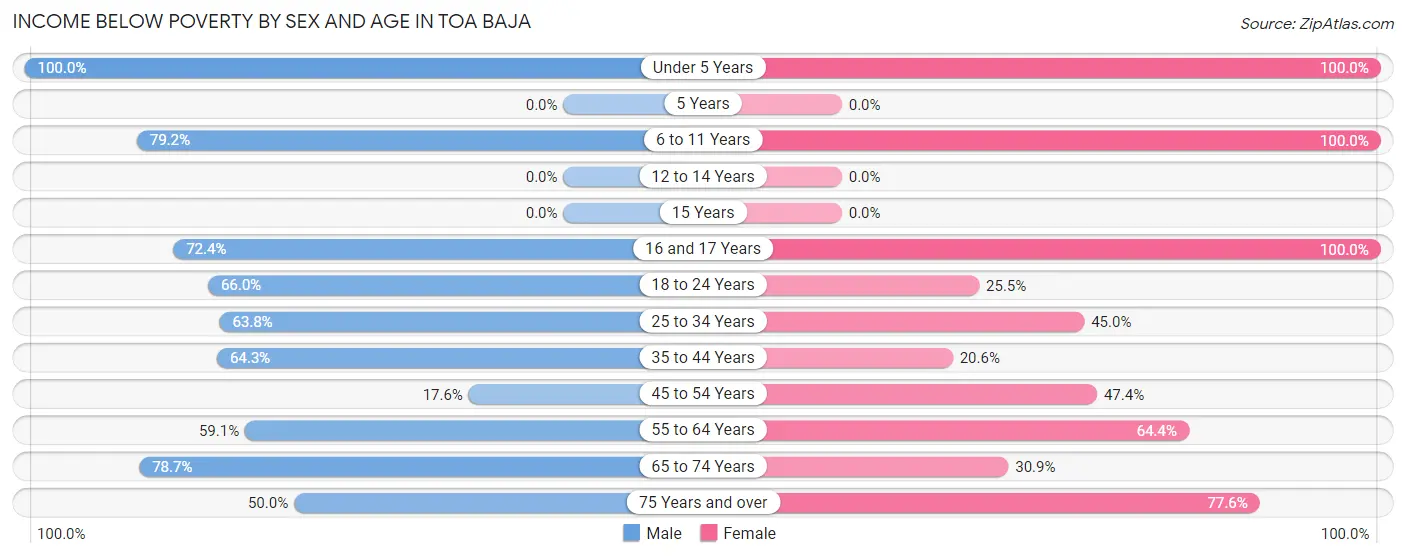
| Age Bracket | Male | Female |
| Under 5 Years | 10 (100.0%) | 11 (100.0%) |
| 5 Years | 0 (0.0%) | 0 (0.0%) |
| 6 to 11 Years | 38 (79.2%) | 34 (100.0%) |
| 12 to 14 Years | 0 (0.0%) | 0 (0.0%) |
| 15 Years | 0 (0.0%) | 0 (0.0%) |
| 16 and 17 Years | 21 (72.4%) | 7 (100.0%) |
| 18 to 24 Years | 31 (66.0%) | 13 (25.5%) |
| 25 to 34 Years | 60 (63.8%) | 27 (45.0%) |
| 35 to 44 Years | 27 (64.3%) | 7 (20.6%) |
| 45 to 54 Years | 13 (17.6%) | 45 (47.4%) |
| 55 to 64 Years | 52 (59.1%) | 38 (64.4%) |
| 65 to 74 Years | 37 (78.7%) | 17 (30.9%) |
| 75 Years and over | 25 (50.0%) | 38 (77.5%) |
| Total | 314 (59.4%) | 237 (50.4%) |
Income Above Poverty by Sex and Age in Toa Baja
According to the poverty statistics in Toa Baja, males aged 45 to 54 years and females aged 12 to 14 years are the age groups that are most secure financially, with 82.4% of males and 100.0% of females in these age groups living above the poverty line.
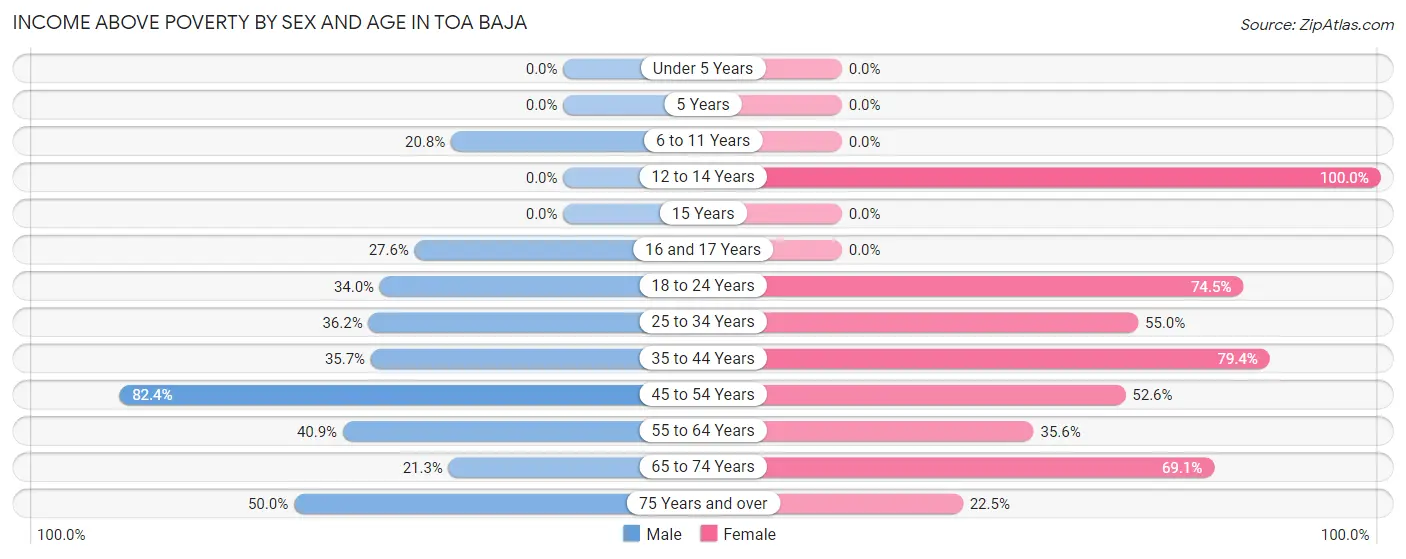
| Age Bracket | Male | Female |
| Under 5 Years | 0 (0.0%) | 0 (0.0%) |
| 5 Years | 0 (0.0%) | 0 (0.0%) |
| 6 to 11 Years | 10 (20.8%) | 0 (0.0%) |
| 12 to 14 Years | 0 (0.0%) | 15 (100.0%) |
| 15 Years | 0 (0.0%) | 0 (0.0%) |
| 16 and 17 Years | 8 (27.6%) | 0 (0.0%) |
| 18 to 24 Years | 16 (34.0%) | 38 (74.5%) |
| 25 to 34 Years | 34 (36.2%) | 33 (55.0%) |
| 35 to 44 Years | 15 (35.7%) | 27 (79.4%) |
| 45 to 54 Years | 61 (82.4%) | 50 (52.6%) |
| 55 to 64 Years | 36 (40.9%) | 21 (35.6%) |
| 65 to 74 Years | 10 (21.3%) | 38 (69.1%) |
| 75 Years and over | 25 (50.0%) | 11 (22.5%) |
| Total | 215 (40.6%) | 233 (49.6%) |
Income Below Poverty Among Married-Couple Families in Toa Baja
The poverty statistics for married-couple families in Toa Baja show that 35.1% or 46 of the total 131 families live below the poverty line. Families with 1 or 2 children have the highest poverty rate of 71.1%, comprising of 32 families. On the other hand, families with no children have the lowest poverty rate of 16.3%, which includes 14 families.
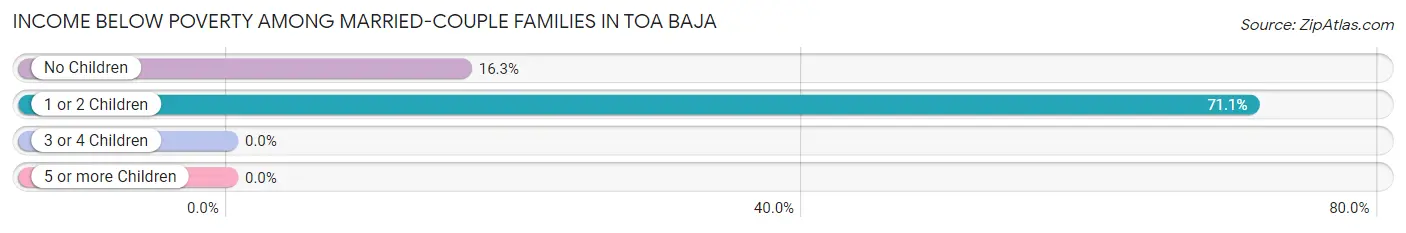
| Children | Above Poverty | Below Poverty |
| No Children | 72 (83.7%) | 14 (16.3%) |
| 1 or 2 Children | 13 (28.9%) | 32 (71.1%) |
| 3 or 4 Children | 0 (0.0%) | 0 (0.0%) |
| 5 or more Children | 0 (0.0%) | 0 (0.0%) |
| Total | 85 (64.9%) | 46 (35.1%) |
Income Below Poverty Among Single-Parent Households in Toa Baja
According to the poverty data in Toa Baja, 80.0% or 20 single-father households and 61.8% or 68 single-mother households are living below the poverty line. Among single-father households, those with 1 or 2 children have the highest poverty rate, with 8 households (100.0%) experiencing poverty. Likewise, among single-mother households, those with 1 or 2 children have the highest poverty rate, with 30 households (68.2%) falling below the poverty line.
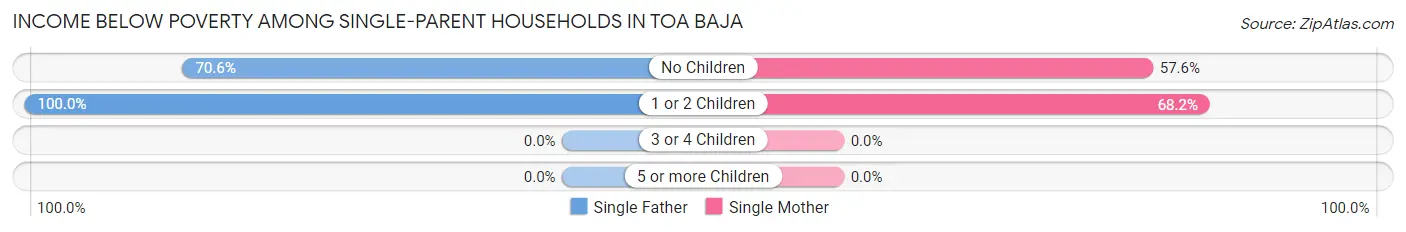
| Children | Single Father | Single Mother |
| No Children | 12 (70.6%) | 38 (57.6%) |
| 1 or 2 Children | 8 (100.0%) | 30 (68.2%) |
| 3 or 4 Children | 0 (0.0%) | 0 (0.0%) |
| 5 or more Children | 0 (0.0%) | 0 (0.0%) |
| Total | 20 (80.0%) | 68 (61.8%) |
Income Below Poverty Among Married-Couple vs Single-Parent Households in Toa Baja
The poverty data for Toa Baja shows that 46 of the married-couple family households (35.1%) and 88 of the single-parent households (65.2%) are living below the poverty level. Within the married-couple family households, those with 1 or 2 children have the highest poverty rate, with 32 households (71.1%) falling below the poverty line. Among the single-parent households, those with 1 or 2 children have the highest poverty rate, with 38 household (73.1%) living below poverty.
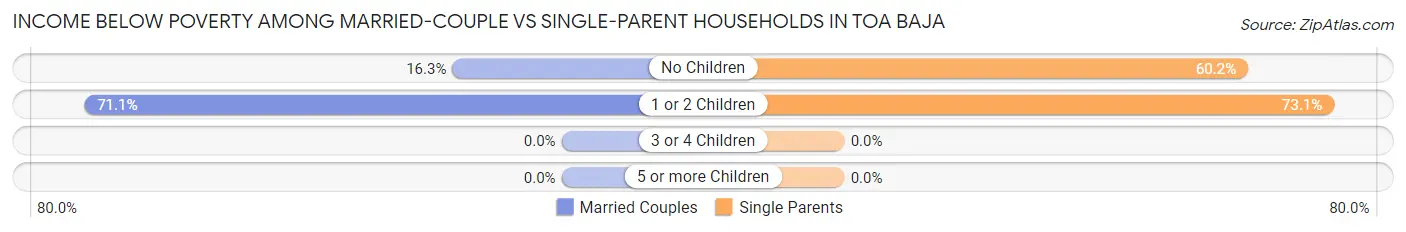
| Children | Married-Couple Families | Single-Parent Households |
| No Children | 14 (16.3%) | 50 (60.2%) |
| 1 or 2 Children | 32 (71.1%) | 38 (73.1%) |
| 3 or 4 Children | 0 (0.0%) | 0 (0.0%) |
| 5 or more Children | 0 (0.0%) | 0 (0.0%) |
| Total | 46 (35.1%) | 88 (65.2%) |
Race in Toa Baja
The most populous races in Toa Baja are Hispanic or Latino (985 | 98.6%), White / Caucasian (407 | 40.7%), and Two or more Races (244 | 24.4%).
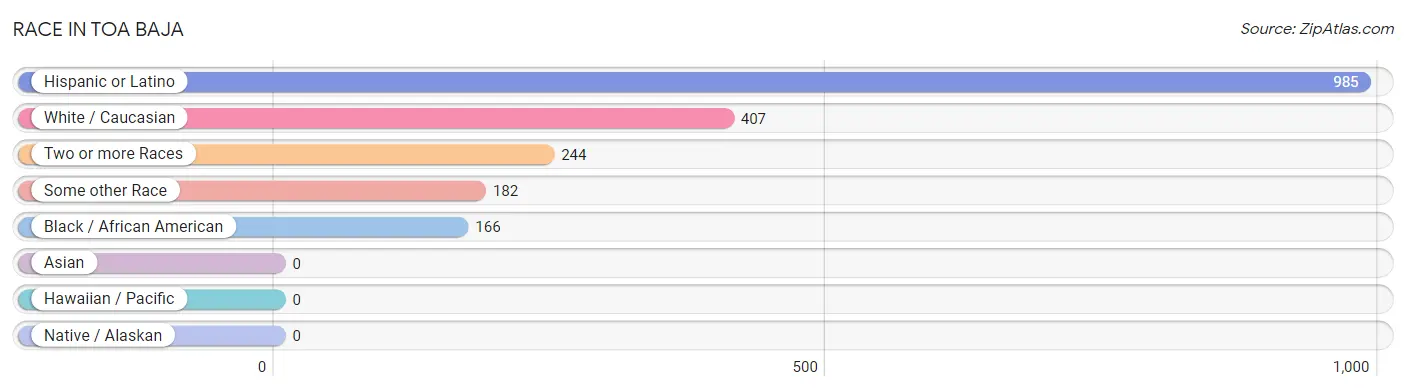
| Race | # Population | % Population |
| Asian | 0 | 0.0% |
| Black / African American | 166 | 16.6% |
| Hawaiian / Pacific | 0 | 0.0% |
| Hispanic or Latino | 985 | 98.6% |
| Native / Alaskan | 0 | 0.0% |
| White / Caucasian | 407 | 40.7% |
| Two or more Races | 244 | 24.4% |
| Some other Race | 182 | 18.2% |
| Total | 999 | 100.0% |
Ancestry in Toa Baja
The most populous ancestries reported in Toa Baja are , and Puerto Rican (985 | 98.6%), together accounting for 98.6% of all Toa Baja residents.

| Ancestry | # Population | % Population |
| Puerto Rican | 985 | 98.6% | View All 1 Rows |
Immigrants in Toa Baja

| Immigration Origin | # Population | % Population | View All 0 Rows |
Sex and Age in Toa Baja
Sex and Age in Toa Baja
The most populous age groups in Toa Baja are 60 to 64 Years (51 | 9.6%) for men and 50 to 54 Years (50 | 10.6%) for women.
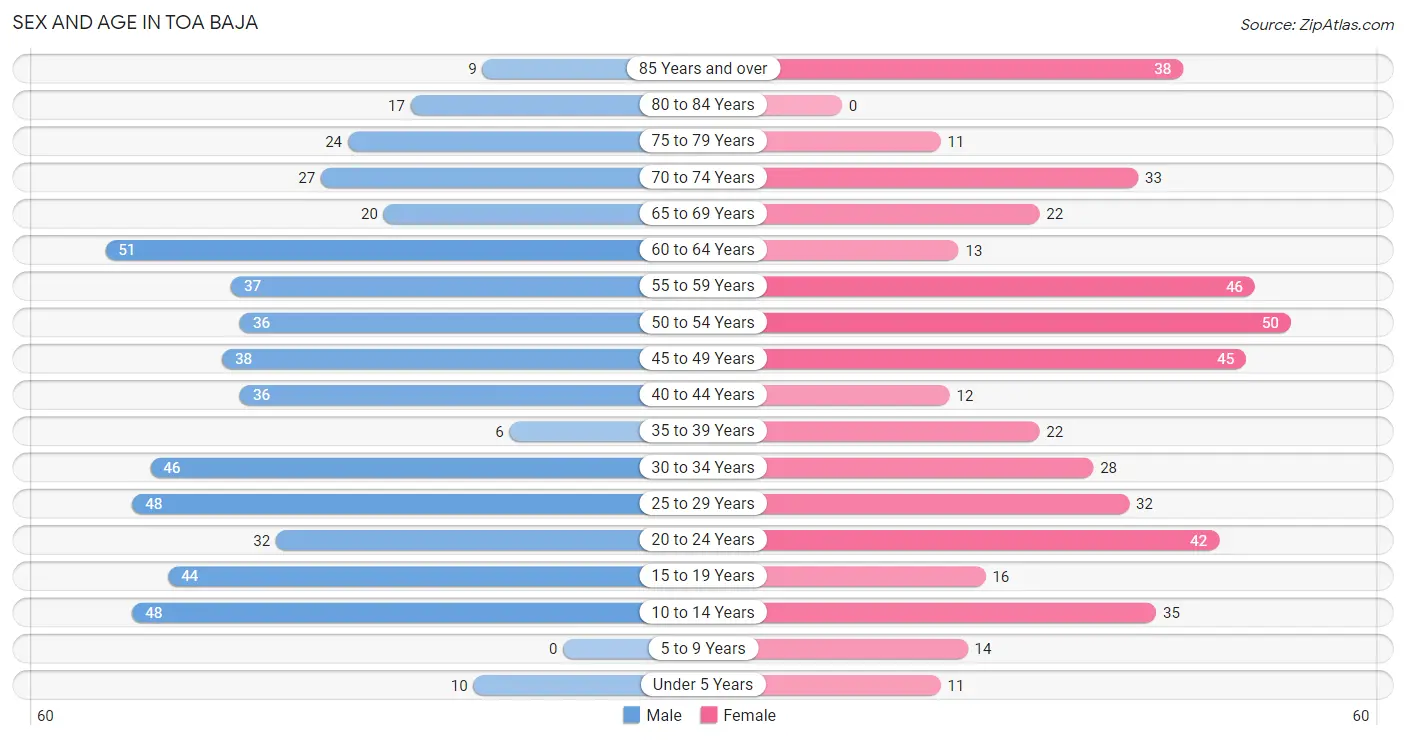
| Age Bracket | Male | Female |
| Under 5 Years | 10 (1.9%) | 11 (2.3%) |
| 5 to 9 Years | 0 (0.0%) | 14 (3.0%) |
| 10 to 14 Years | 48 (9.1%) | 35 (7.4%) |
| 15 to 19 Years | 44 (8.3%) | 16 (3.4%) |
| 20 to 24 Years | 32 (6.0%) | 42 (8.9%) |
| 25 to 29 Years | 48 (9.1%) | 32 (6.8%) |
| 30 to 34 Years | 46 (8.7%) | 28 (6.0%) |
| 35 to 39 Years | 6 (1.1%) | 22 (4.7%) |
| 40 to 44 Years | 36 (6.8%) | 12 (2.5%) |
| 45 to 49 Years | 38 (7.2%) | 45 (9.6%) |
| 50 to 54 Years | 36 (6.8%) | 50 (10.6%) |
| 55 to 59 Years | 37 (7.0%) | 46 (9.8%) |
| 60 to 64 Years | 51 (9.6%) | 13 (2.8%) |
| 65 to 69 Years | 20 (3.8%) | 22 (4.7%) |
| 70 to 74 Years | 27 (5.1%) | 33 (7.0%) |
| 75 to 79 Years | 24 (4.5%) | 11 (2.3%) |
| 80 to 84 Years | 17 (3.2%) | 0 (0.0%) |
| 85 Years and over | 9 (1.7%) | 38 (8.1%) |
| Total | 529 (100.0%) | 470 (100.0%) |
Families and Households in Toa Baja
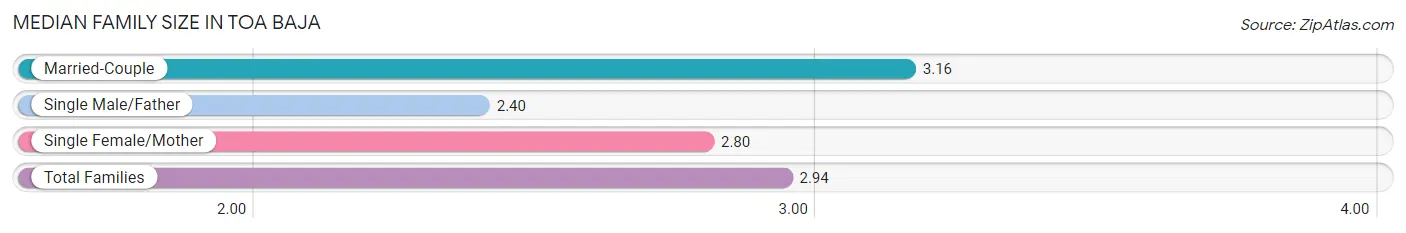
Median Family Size in Toa Baja
The median family size in Toa Baja is 2.94 persons per family, with married-couple families (131 | 49.2%) accounting for the largest median family size of 3.16 persons per family. On the other hand, single male/father families (25 | 9.4%) represent the smallest median family size with 2.40 persons per family.
| Family Type | # Families | Family Size |
| Married-Couple | 131 (49.2%) | 3.16 |
| Single Male/Father | 25 (9.4%) | 2.40 |
| Single Female/Mother | 110 (41.3%) | 2.80 |
| Total Families | 266 (100.0%) | 2.94 |
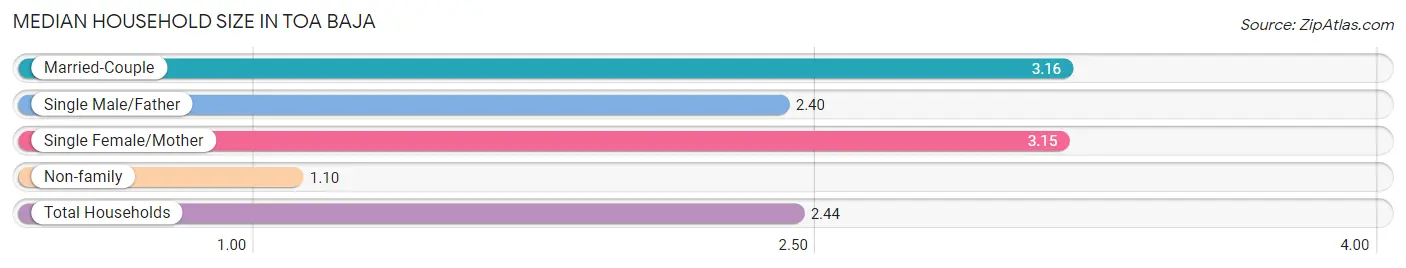
Median Household Size in Toa Baja
The median household size in Toa Baja is 2.44 persons per household, with married-couple households (131 | 33.2%) accounting for the largest median household size of 3.16 persons per household. non-family households (129 | 32.7%) represent the smallest median household size with 1.10 persons per household.
| Household Type | # Households | Household Size |
| Married-Couple | 131 (33.2%) | 3.16 |
| Single Male/Father | 25 (6.3%) | 2.40 |
| Single Female/Mother | 110 (27.9%) | 3.15 |
| Non-family | 129 (32.7%) | 1.10 |
| Total Households | 395 (100.0%) | 2.44 |
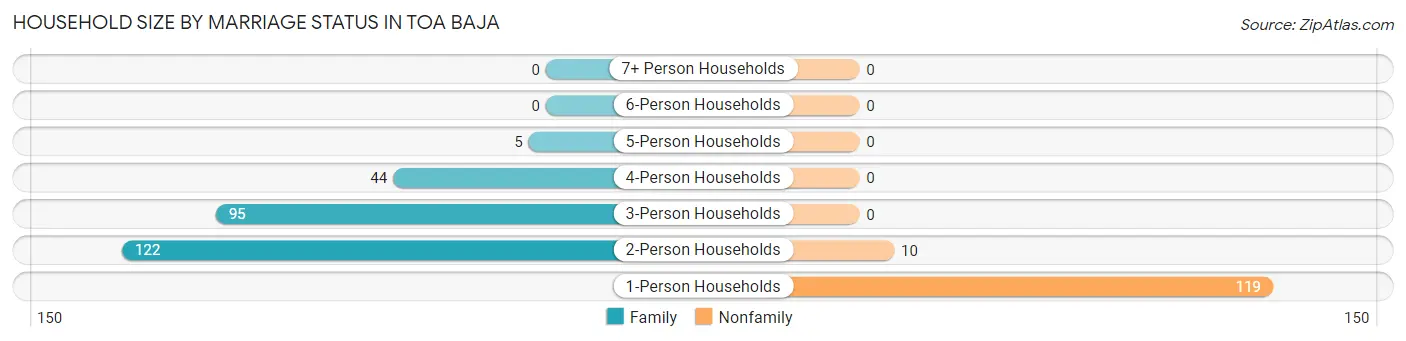
Household Size by Marriage Status in Toa Baja
Out of a total of 395 households in Toa Baja, 266 (67.3%) are family households, while 129 (32.7%) are nonfamily households. The most numerous type of family households are 2-person households, comprising 122, and the most common type of nonfamily households are 1-person households, comprising 119.
| Household Size | Family Households | Nonfamily Households |
| 1-Person Households | - | 119 (30.1%) |
| 2-Person Households | 122 (30.9%) | 10 (2.5%) |
| 3-Person Households | 95 (24.0%) | 0 (0.0%) |
| 4-Person Households | 44 (11.1%) | 0 (0.0%) |
| 5-Person Households | 5 (1.3%) | 0 (0.0%) |
| 6-Person Households | 0 (0.0%) | 0 (0.0%) |
| 7+ Person Households | 0 (0.0%) | 0 (0.0%) |
| Total | 266 (67.3%) | 129 (32.7%) |
Female Fertility in Toa Baja
Fertility by Age in Toa Baja
Average fertility rate in Toa Baja is 63.0 births per 1,000 women. Women in the age bracket of 20 to 34 years have the highest fertility rate with 127.0 births per 1,000 women. Women in the age bracket of 20 to 34 years acount for 100.0% of all women with births.

| Age Bracket | Women with Births | Births / 1,000 Women |
| 15 to 19 years | 0 (0.0%) | 0.0 |
| 20 to 34 years | 13 (100.0%) | 127.0 |
| 35 to 50 years | 0 (0.0%) | 0.0 |
| Total | 13 (100.0%) | 63.0 |
Fertility by Age by Marriage Status in Toa Baja
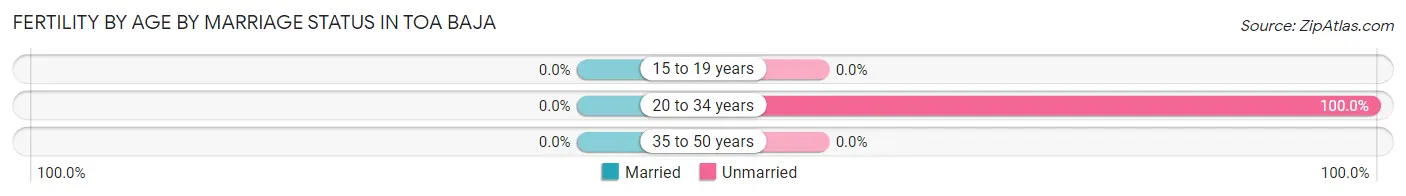
| Age Bracket | Married | Unmarried |
| 15 to 19 years | 0 (0.0%) | 0 (0.0%) |
| 20 to 34 years | 0 (0.0%) | 13 (100.0%) |
| 35 to 50 years | 0 (0.0%) | 0 (0.0%) |
| Total | 0 (0.0%) | 13 (100.0%) |
Fertility by Education in Toa Baja
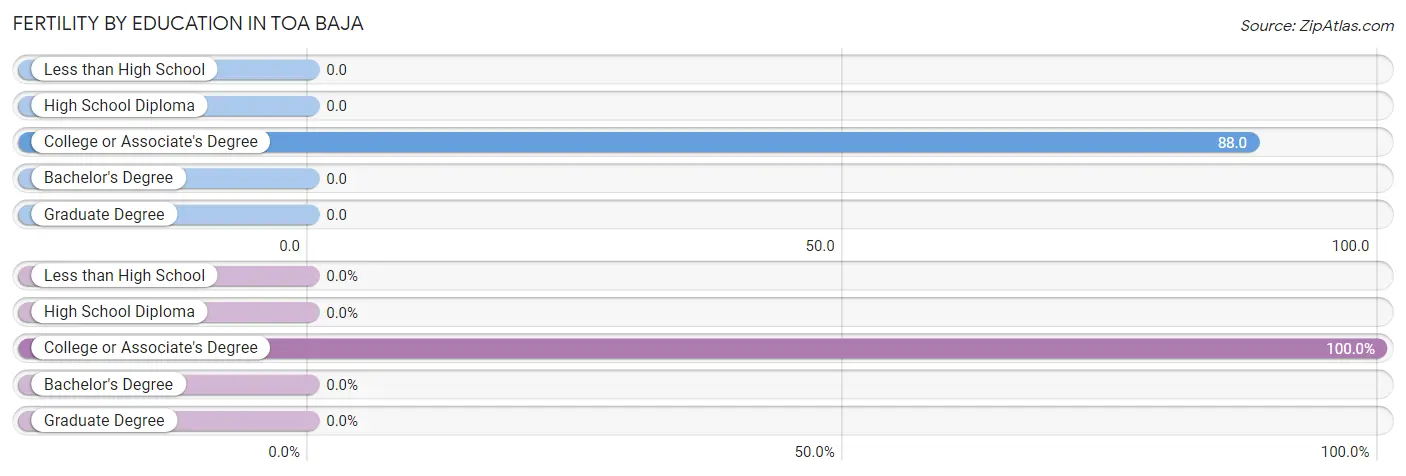
| Educational Attainment | Women with Births | Births / 1,000 Women |
| Less than High School | 0 (0.0%) | 0.0 |
| High School Diploma | 0 (0.0%) | 0.0 |
| College or Associate's Degree | 13 (100.0%) | 88.0 |
| Bachelor's Degree | 0 (0.0%) | 0.0 |
| Graduate Degree | 0 (0.0%) | 0.0 |
| Total | 13 (100.0%) | 63.0 |
Fertility by Education by Marriage Status in Toa Baja
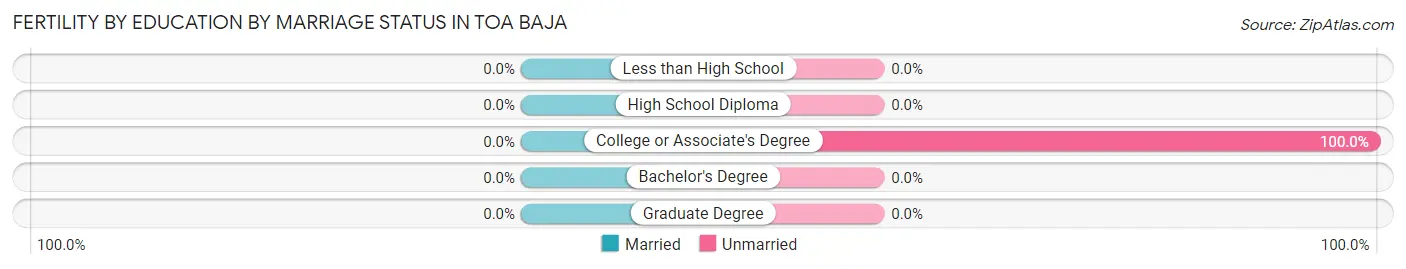
| Educational Attainment | Married | Unmarried |
| Less than High School | 0 (0.0%) | 0 (0.0%) |
| High School Diploma | 0 (0.0%) | 0 (0.0%) |
| College or Associate's Degree | 0 (0.0%) | 13 (100.0%) |
| Bachelor's Degree | 0 (0.0%) | 0 (0.0%) |
| Graduate Degree | 0 (0.0%) | 0 (0.0%) |
| Total | 0 (0.0%) | 13 (100.0%) |
Employment Characteristics in Toa Baja
Employment by Class of Employer in Toa Baja
Among the 298 employed individuals in Toa Baja, private company employees (199 | 66.8%), not-for-profit organizations (32 | 10.7%), and local government employees (31 | 10.4%) make up the most common classes of employment.
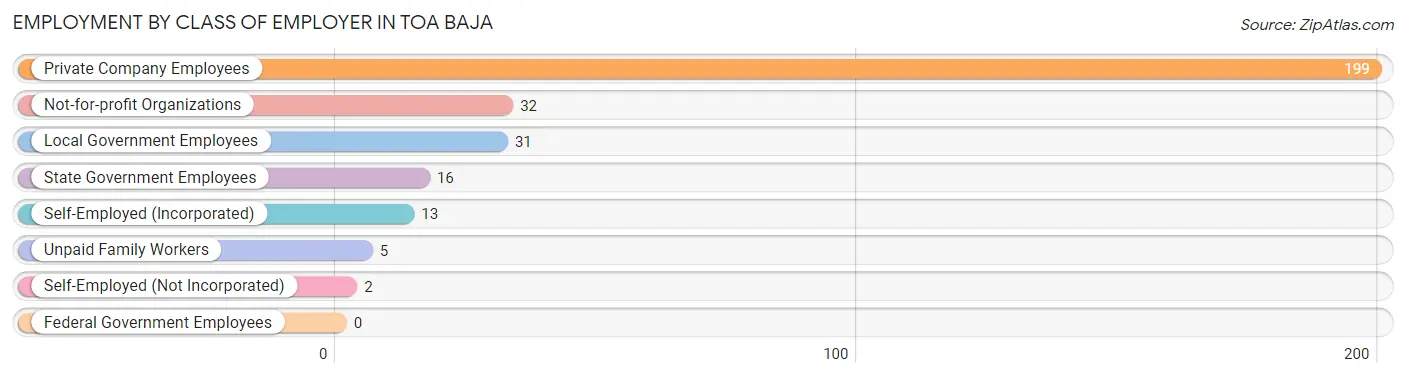
| Employer Class | # Employees | % Employees |
| Private Company Employees | 199 | 66.8% |
| Self-Employed (Incorporated) | 13 | 4.4% |
| Self-Employed (Not Incorporated) | 2 | 0.7% |
| Not-for-profit Organizations | 32 | 10.7% |
| Local Government Employees | 31 | 10.4% |
| State Government Employees | 16 | 5.4% |
| Federal Government Employees | 0 | 0.0% |
| Unpaid Family Workers | 5 | 1.7% |
| Total | 298 | 100.0% |
Employment Status by Age in Toa Baja
According to the labor force statistics for Toa Baja, out of the total population over 16 years of age (881), 41.4% or 365 individuals are in the labor force, with 9.0% or 33 of them unemployed. The age group with the highest labor force participation rate is 30 to 34 years, with 78.4% or 58 individuals in the labor force. Within the labor force, the 35 to 44 years age range has the highest percentage of unemployed individuals, with 35.7% or 15 of them being unemployed.
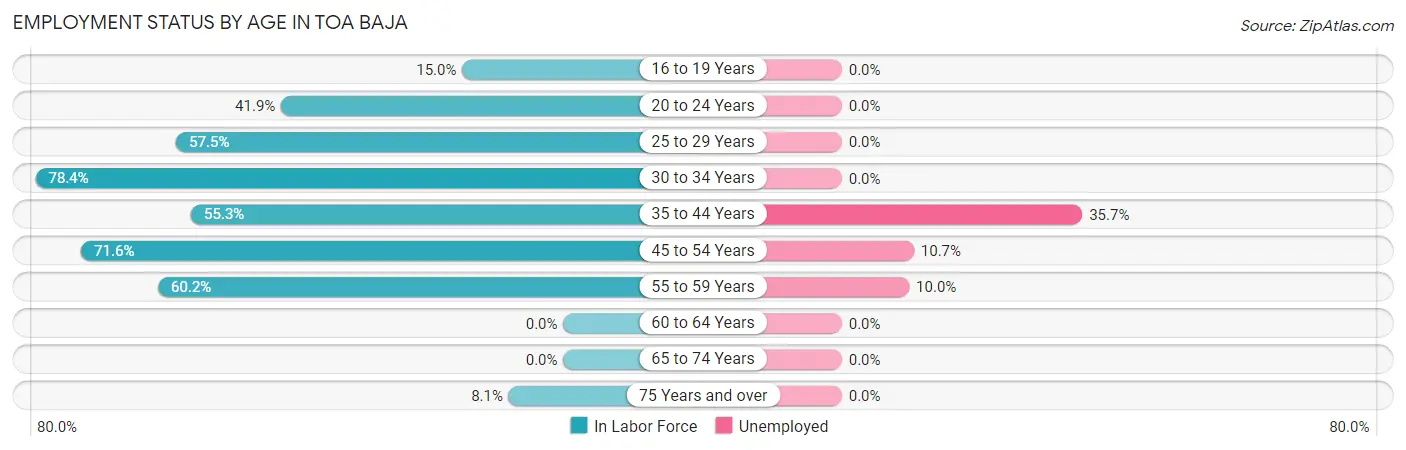
| Age Bracket | In Labor Force | Unemployed |
| 16 to 19 Years | 9 (15.0%) | 0 (0.0%) |
| 20 to 24 Years | 31 (41.9%) | 0 (0.0%) |
| 25 to 29 Years | 46 (57.5%) | 0 (0.0%) |
| 30 to 34 Years | 58 (78.4%) | 0 (0.0%) |
| 35 to 44 Years | 42 (55.3%) | 15 (35.7%) |
| 45 to 54 Years | 121 (71.6%) | 13 (10.7%) |
| 55 to 59 Years | 50 (60.2%) | 5 (10.0%) |
| 60 to 64 Years | 0 (0.0%) | 0 (0.0%) |
| 65 to 74 Years | 0 (0.0%) | 0 (0.0%) |
| 75 Years and over | 8 (8.1%) | 0 (0.0%) |
| Total | 365 (41.4%) | 33 (9.0%) |
Employment Status by Educational Attainment in Toa Baja
According to labor force statistics for Toa Baja, 58.1% of individuals (317) out of the total population between 25 and 64 years of age (546) are in the labor force, with 10.4% or 33 of them being unemployed. The group with the highest labor force participation rate are those with the educational attainment of bachelor's degree or higher, with 84.5% or 49 individuals in the labor force. Within the labor force, individuals with bachelor's degree or higher education have the highest percentage of unemployment, with 28.6% or 14 of them being unemployed.
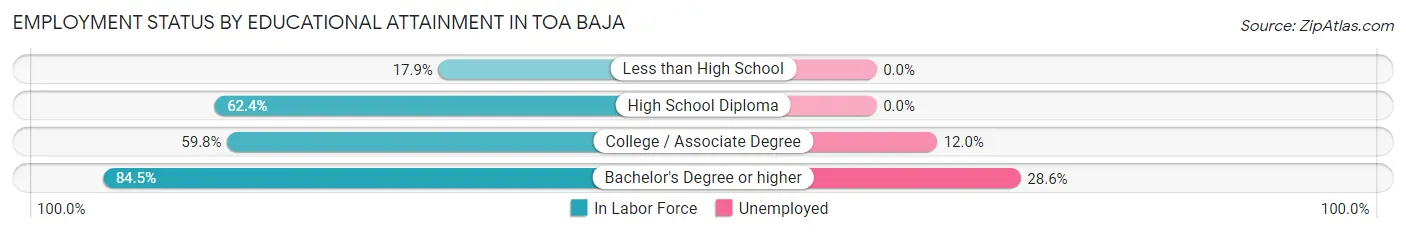
| Educational Attainment | In Labor Force | Unemployed |
| Less than High School | 12 (17.9%) | 0 (0.0%) |
| High School Diploma | 98 (62.4%) | 0 (0.0%) |
| College / Associate Degree | 158 (59.8%) | 32 (12.0%) |
| Bachelor's Degree or higher | 49 (84.5%) | 17 (28.6%) |
| Total | 317 (58.1%) | 57 (10.4%) |
Employment Occupations by Sex in Toa Baja
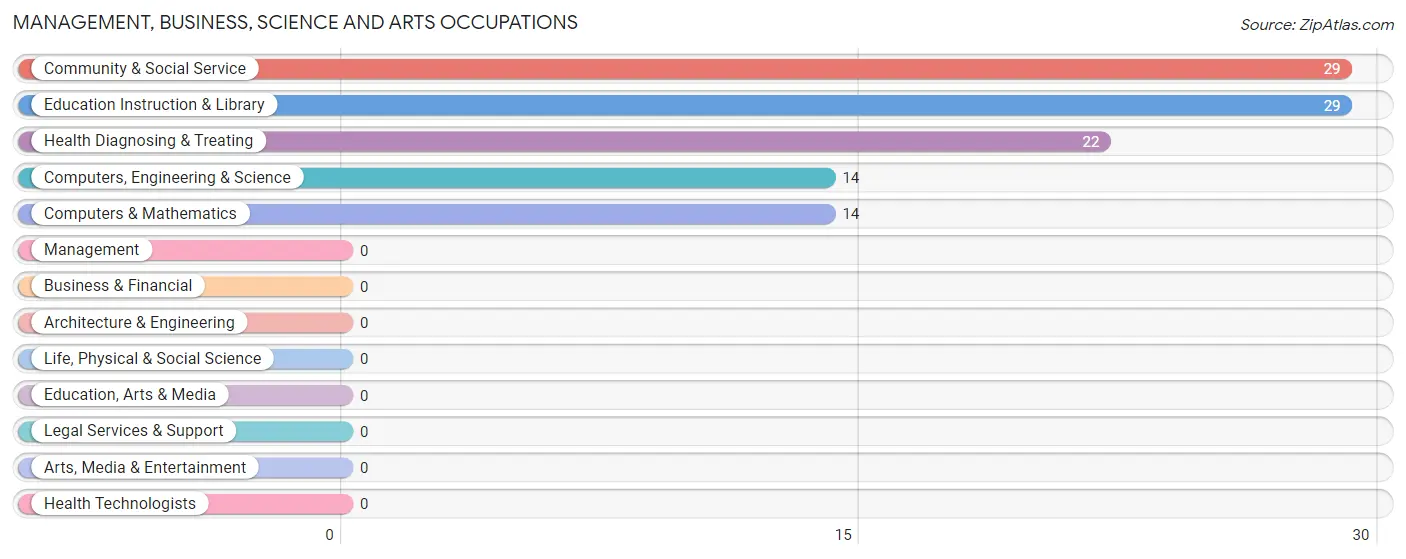
Management, Business, Science and Arts Occupations
The most common Management, Business, Science and Arts occupations in Toa Baja are Community & Social Service (29 | 8.7%), Education Instruction & Library (29 | 8.7%), Health Diagnosing & Treating (22 | 6.6%), Computers, Engineering & Science (14 | 4.2%), and Computers & Mathematics (14 | 4.2%).
Management, Business, Science and Arts Occupations by Sex
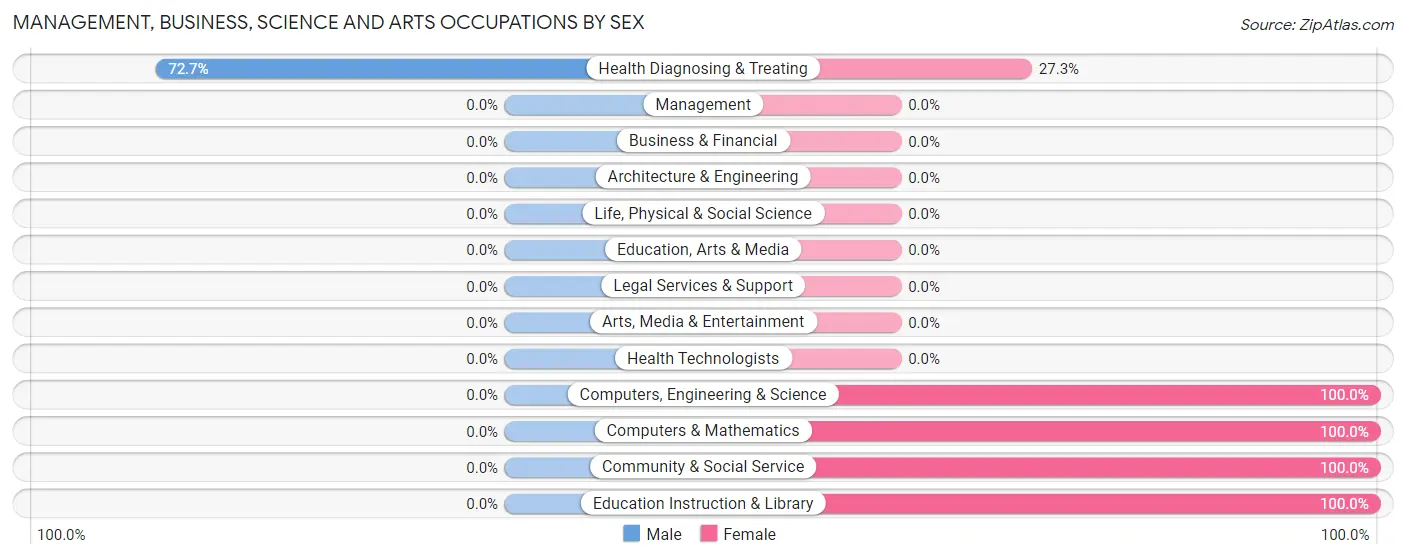
| Occupation | Male | Female |
| Management | 0 (0.0%) | 0 (0.0%) |
| Business & Financial | 0 (0.0%) | 0 (0.0%) |
| Computers, Engineering & Science | 0 (0.0%) | 14 (100.0%) |
| Computers & Mathematics | 0 (0.0%) | 14 (100.0%) |
| Architecture & Engineering | 0 (0.0%) | 0 (0.0%) |
| Life, Physical & Social Science | 0 (0.0%) | 0 (0.0%) |
| Community & Social Service | 0 (0.0%) | 29 (100.0%) |
| Education, Arts & Media | 0 (0.0%) | 0 (0.0%) |
| Legal Services & Support | 0 (0.0%) | 0 (0.0%) |
| Education Instruction & Library | 0 (0.0%) | 29 (100.0%) |
| Arts, Media & Entertainment | 0 (0.0%) | 0 (0.0%) |
| Health Diagnosing & Treating | 16 (72.7%) | 6 (27.3%) |
| Health Technologists | 0 (0.0%) | 0 (0.0%) |
| Total (Category) | 16 (24.6%) | 49 (75.4%) |
| Total (Overall) | 176 (53.0%) | 156 (47.0%) |
Services Occupations
The most common Services occupations in Toa Baja are Food Preparation & Serving (39 | 11.7%), Healthcare Support (20 | 6.0%), Cleaning & Maintenance (15 | 4.5%), Security & Protection (9 | 2.7%), and Firefighting & Prevention (9 | 2.7%).
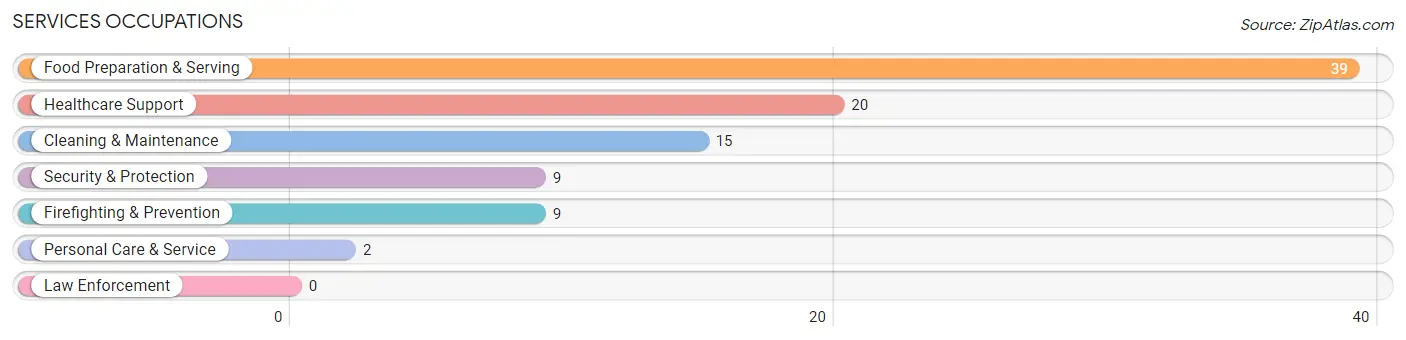
Services Occupations by Sex
Within the Services occupations in Toa Baja, the most male-oriented occupations are Security & Protection (100.0%), Firefighting & Prevention (100.0%), and Personal Care & Service (100.0%), while the most female-oriented occupations are Cleaning & Maintenance (53.3%), Food Preparation & Serving (48.7%), and Healthcare Support (35.0%).
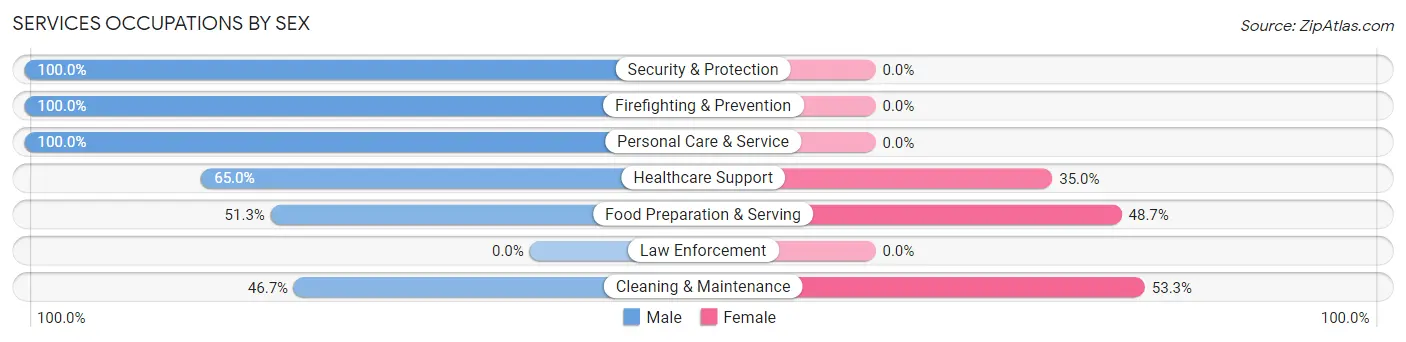
| Occupation | Male | Female |
| Healthcare Support | 13 (65.0%) | 7 (35.0%) |
| Security & Protection | 9 (100.0%) | 0 (0.0%) |
| Firefighting & Prevention | 9 (100.0%) | 0 (0.0%) |
| Law Enforcement | 0 (0.0%) | 0 (0.0%) |
| Food Preparation & Serving | 20 (51.3%) | 19 (48.7%) |
| Cleaning & Maintenance | 7 (46.7%) | 8 (53.3%) |
| Personal Care & Service | 2 (100.0%) | 0 (0.0%) |
| Total (Category) | 51 (60.0%) | 34 (40.0%) |
| Total (Overall) | 176 (53.0%) | 156 (47.0%) |
Sales and Office Occupations
The most common Sales and Office occupations in Toa Baja are Office & Administration (73 | 22.0%), and Sales & Related (27 | 8.1%).
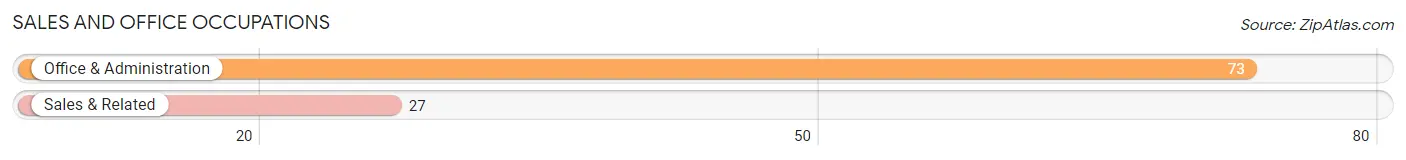
Sales and Office Occupations by Sex
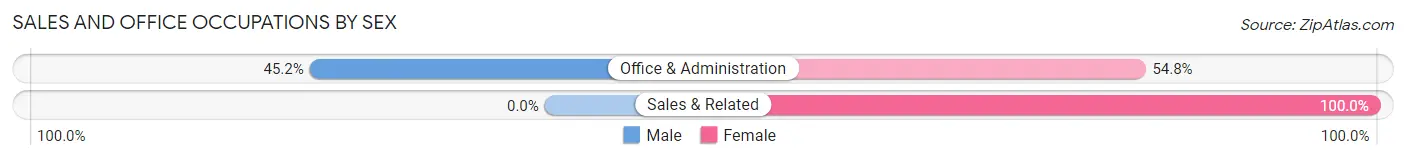
| Occupation | Male | Female |
| Sales & Related | 0 (0.0%) | 27 (100.0%) |
| Office & Administration | 33 (45.2%) | 40 (54.8%) |
| Total (Category) | 33 (33.0%) | 67 (67.0%) |
| Total (Overall) | 176 (53.0%) | 156 (47.0%) |
Natural Resources, Construction and Maintenance Occupations
The most common Natural Resources, Construction and Maintenance occupations in Toa Baja are , and Installation, Maintenance & Repair (39 | 11.7%).
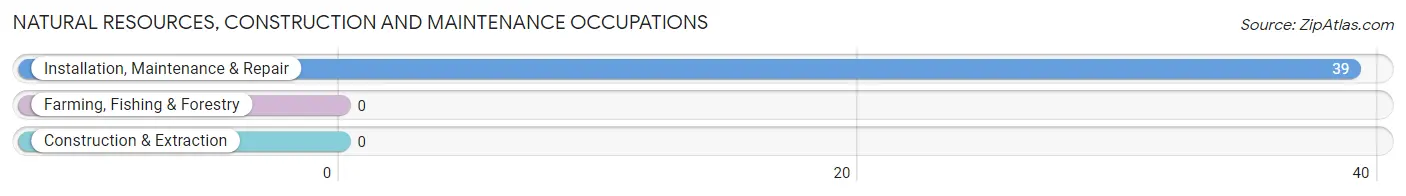
Natural Resources, Construction and Maintenance Occupations by Sex
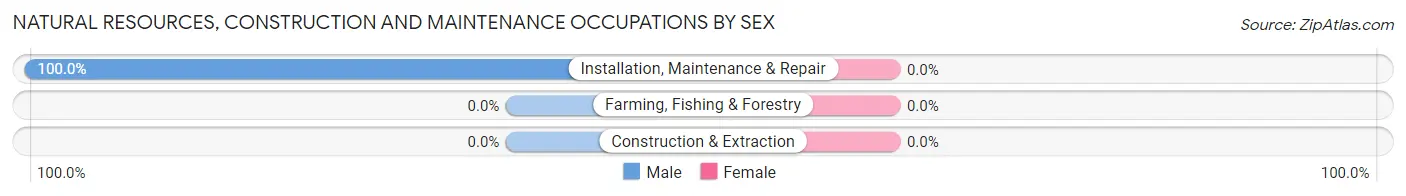
| Occupation | Male | Female |
| Farming, Fishing & Forestry | 0 (0.0%) | 0 (0.0%) |
| Construction & Extraction | 0 (0.0%) | 0 (0.0%) |
| Installation, Maintenance & Repair | 39 (100.0%) | 0 (0.0%) |
| Total (Category) | 39 (100.0%) | 0 (0.0%) |
| Total (Overall) | 176 (53.0%) | 156 (47.0%) |
Production, Transportation and Moving Occupations
The most common Production, Transportation and Moving occupations in Toa Baja are Transportation (27 | 8.1%), Material Moving (10 | 3.0%), and Production (6 | 1.8%).
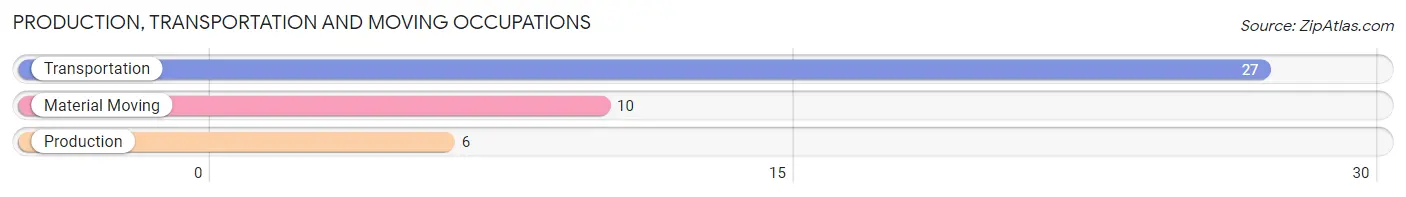
Production, Transportation and Moving Occupations by Sex
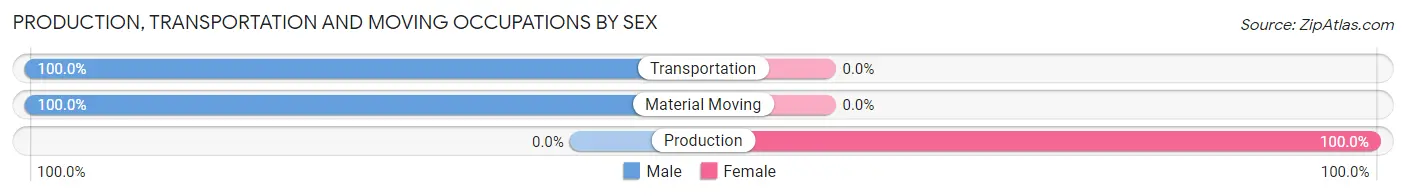
| Occupation | Male | Female |
| Production | 0 (0.0%) | 6 (100.0%) |
| Transportation | 27 (100.0%) | 0 (0.0%) |
| Material Moving | 10 (100.0%) | 0 (0.0%) |
| Total (Category) | 37 (86.1%) | 6 (14.0%) |
| Total (Overall) | 176 (53.0%) | 156 (47.0%) |
Employment Industries by Sex in Toa Baja
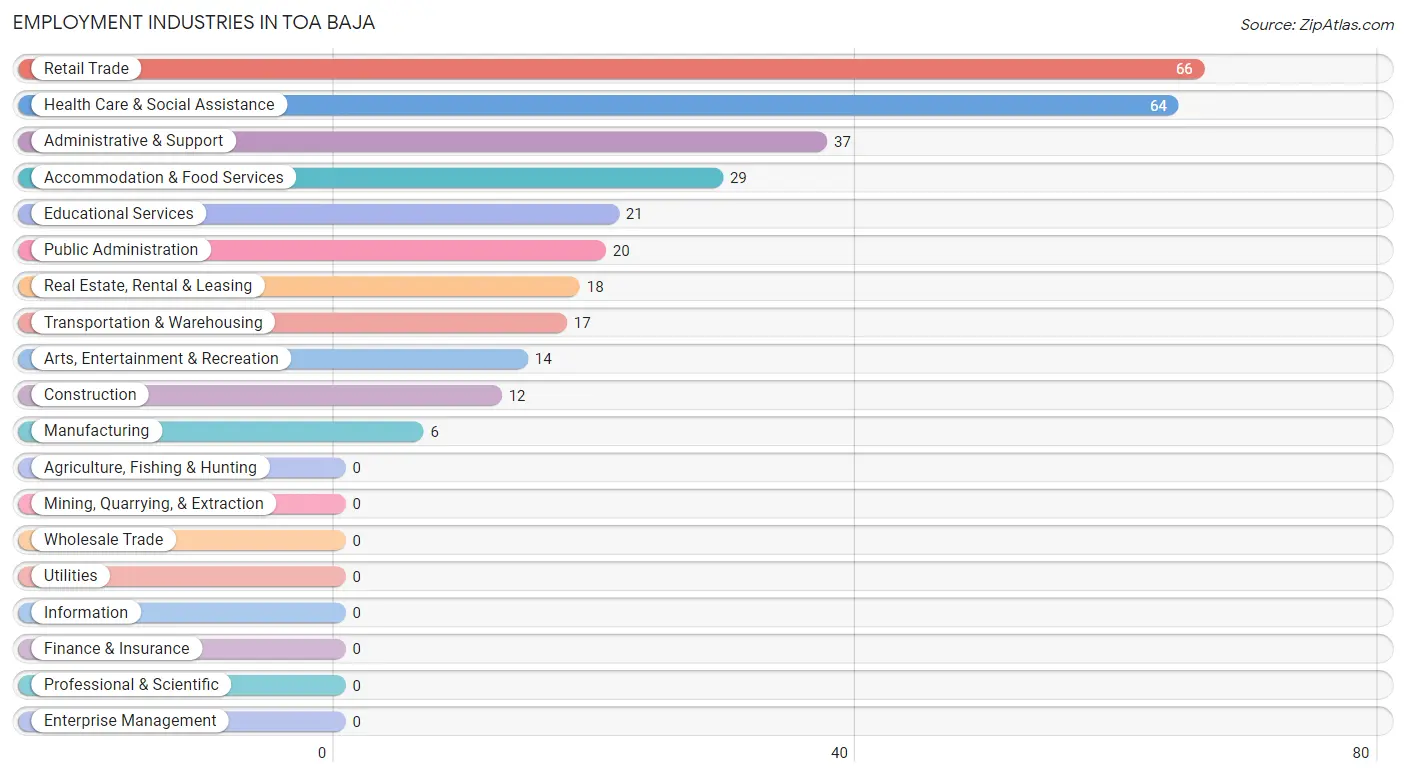
Employment Industries in Toa Baja
The major employment industries in Toa Baja include Retail Trade (66 | 19.9%), Health Care & Social Assistance (64 | 19.3%), Administrative & Support (37 | 11.1%), Accommodation & Food Services (29 | 8.7%), and Educational Services (21 | 6.3%).
Employment Industries by Sex in Toa Baja
The Toa Baja industries that see more men than women are Construction (100.0%), Transportation & Warehousing (100.0%), and Real Estate, Rental & Leasing (100.0%), whereas the industries that tend to have a higher number of women are Manufacturing (100.0%), Public Administration (100.0%), and Educational Services (95.2%).
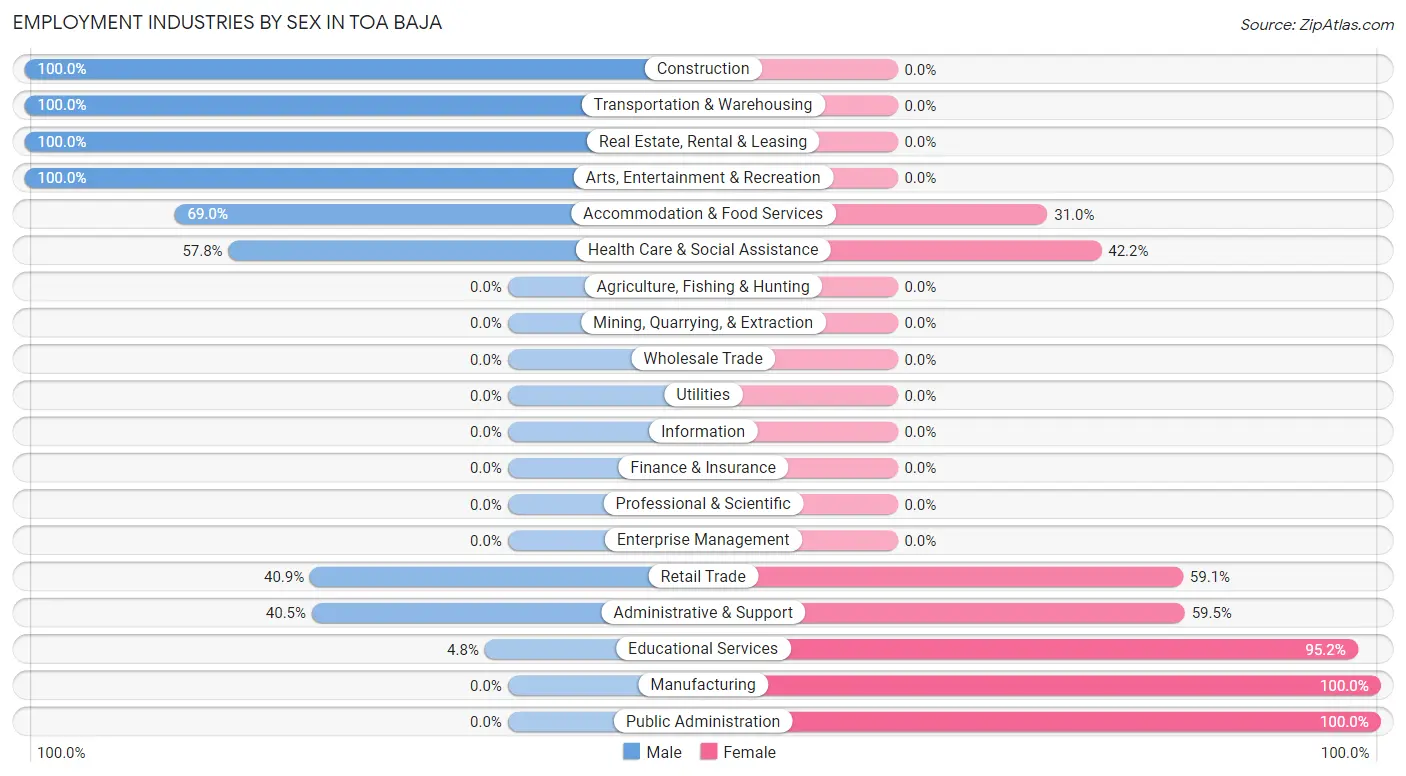
| Industry | Male | Female |
| Agriculture, Fishing & Hunting | 0 (0.0%) | 0 (0.0%) |
| Mining, Quarrying, & Extraction | 0 (0.0%) | 0 (0.0%) |
| Construction | 12 (100.0%) | 0 (0.0%) |
| Manufacturing | 0 (0.0%) | 6 (100.0%) |
| Wholesale Trade | 0 (0.0%) | 0 (0.0%) |
| Retail Trade | 27 (40.9%) | 39 (59.1%) |
| Transportation & Warehousing | 17 (100.0%) | 0 (0.0%) |
| Utilities | 0 (0.0%) | 0 (0.0%) |
| Information | 0 (0.0%) | 0 (0.0%) |
| Finance & Insurance | 0 (0.0%) | 0 (0.0%) |
| Real Estate, Rental & Leasing | 18 (100.0%) | 0 (0.0%) |
| Professional & Scientific | 0 (0.0%) | 0 (0.0%) |
| Enterprise Management | 0 (0.0%) | 0 (0.0%) |
| Administrative & Support | 15 (40.5%) | 22 (59.5%) |
| Educational Services | 1 (4.8%) | 20 (95.2%) |
| Health Care & Social Assistance | 37 (57.8%) | 27 (42.2%) |
| Arts, Entertainment & Recreation | 14 (100.0%) | 0 (0.0%) |
| Accommodation & Food Services | 20 (69.0%) | 9 (31.0%) |
| Public Administration | 0 (0.0%) | 20 (100.0%) |
| Total | 176 (53.0%) | 156 (47.0%) |
Education in Toa Baja
School Enrollment in Toa Baja
The most common levels of schooling among the 222 students in Toa Baja are high school (74 | 33.3%), college / undergraduate (66 | 29.7%), and middle school (57 | 25.7%).
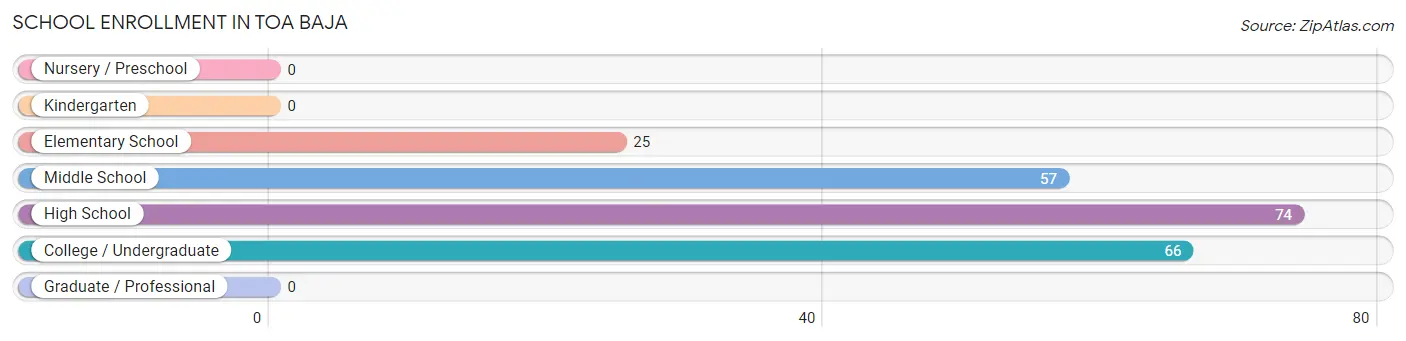
| School Level | # Students | % Students |
| Nursery / Preschool | 0 | 0.0% |
| Kindergarten | 0 | 0.0% |
| Elementary School | 25 | 11.3% |
| Middle School | 57 | 25.7% |
| High School | 74 | 33.3% |
| College / Undergraduate | 66 | 29.7% |
| Graduate / Professional | 0 | 0.0% |
| Total | 222 | 100.0% |
School Enrollment by Age by Funding Source in Toa Baja
Out of a total of 222 students who are enrolled in schools in Toa Baja, 102 (45.9%) attend a private institution, while the remaining 120 (54.1%) are enrolled in public schools. The age group of 25 to 34 year olds has the highest likelihood of being enrolled in private schools, with 14 (100.0% in the age bracket) enrolled. Conversely, the age group of 5 to 9 year old has the lowest likelihood of being enrolled in a private school, with 14 (100.0% in the age bracket) attending a public institution.
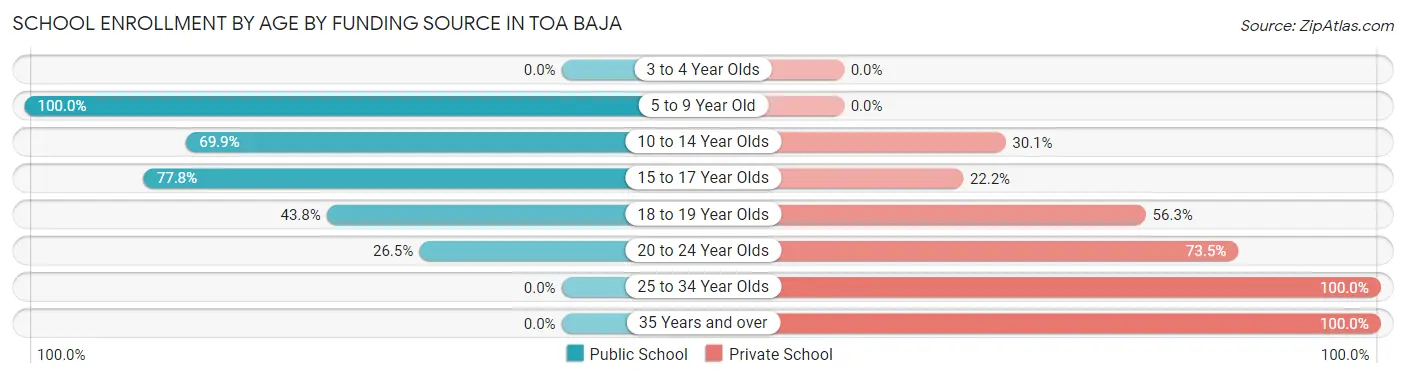
| Age Bracket | Public School | Private School |
| 3 to 4 Year Olds | 0 (0.0%) | 0 (0.0%) |
| 5 to 9 Year Old | 14 (100.0%) | 0 (0.0%) |
| 10 to 14 Year Olds | 58 (69.9%) | 25 (30.1%) |
| 15 to 17 Year Olds | 28 (77.8%) | 8 (22.2%) |
| 18 to 19 Year Olds | 7 (43.8%) | 9 (56.2%) |
| 20 to 24 Year Olds | 13 (26.5%) | 36 (73.5%) |
| 25 to 34 Year Olds | 0 (0.0%) | 14 (100.0%) |
| 35 Years and over | 0 (0.0%) | 10 (100.0%) |
| Total | 120 (54.1%) | 102 (45.9%) |
Educational Attainment by Field of Study in Toa Baja
Business (46 | 62.2%), psychology (9 | 12.2%), social sciences (9 | 12.2%), education (8 | 10.8%), and communications (2 | 2.7%) are the most common fields of study among 74 individuals in Toa Baja who have obtained a bachelor's degree or higher.
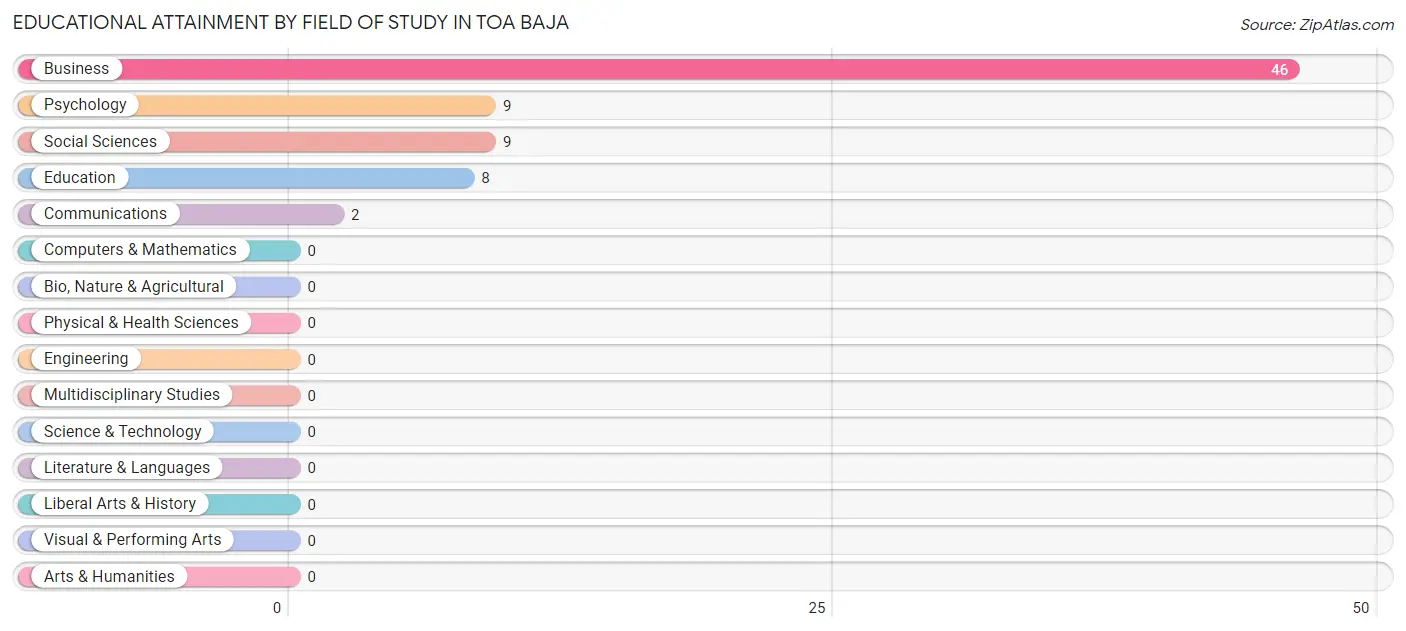
| Field of Study | # Graduates | % Graduates |
| Computers & Mathematics | 0 | 0.0% |
| Bio, Nature & Agricultural | 0 | 0.0% |
| Physical & Health Sciences | 0 | 0.0% |
| Psychology | 9 | 12.2% |
| Social Sciences | 9 | 12.2% |
| Engineering | 0 | 0.0% |
| Multidisciplinary Studies | 0 | 0.0% |
| Science & Technology | 0 | 0.0% |
| Business | 46 | 62.2% |
| Education | 8 | 10.8% |
| Literature & Languages | 0 | 0.0% |
| Liberal Arts & History | 0 | 0.0% |
| Visual & Performing Arts | 0 | 0.0% |
| Communications | 2 | 2.7% |
| Arts & Humanities | 0 | 0.0% |
| Total | 74 | 100.0% |
Transportation & Commute in Toa Baja
Vehicle Availability by Sex in Toa Baja
The most prevalent vehicle ownership categories in Toa Baja are males with 2 vehicles (76, accounting for 44.2%) and females with 2 vehicles (64, making up 62.3%).
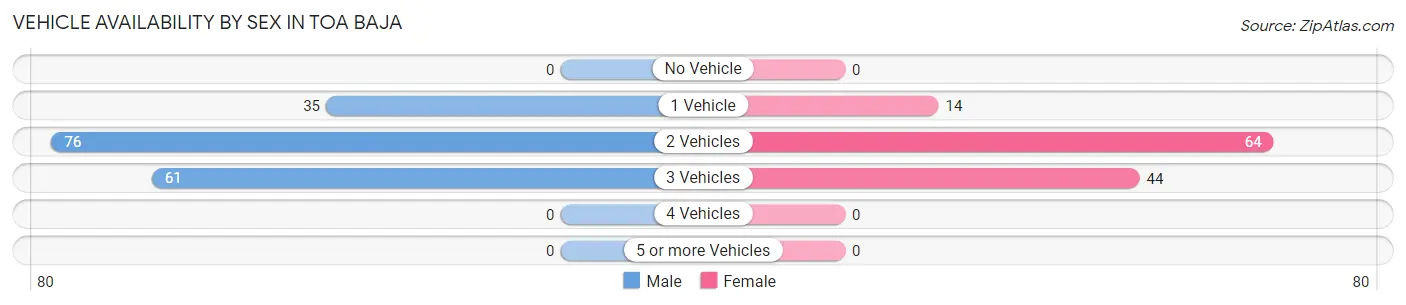
| Vehicles Available | Male | Female |
| No Vehicle | 0 (0.0%) | 0 (0.0%) |
| 1 Vehicle | 35 (20.3%) | 14 (11.5%) |
| 2 Vehicles | 76 (44.2%) | 64 (52.5%) |
| 3 Vehicles | 61 (35.5%) | 44 (36.1%) |
| 4 Vehicles | 0 (0.0%) | 0 (0.0%) |
| 5 or more Vehicles | 0 (0.0%) | 0 (0.0%) |
| Total | 172 (100.0%) | 122 (100.0%) |
Commute Time in Toa Baja
The most frequently occuring commute durations in Toa Baja are 15 to 19 minutes (77 commuters, 26.0%), 30 to 34 minutes (74 commuters, 25.0%), and 45 to 59 minutes (33 commuters, 11.2%).
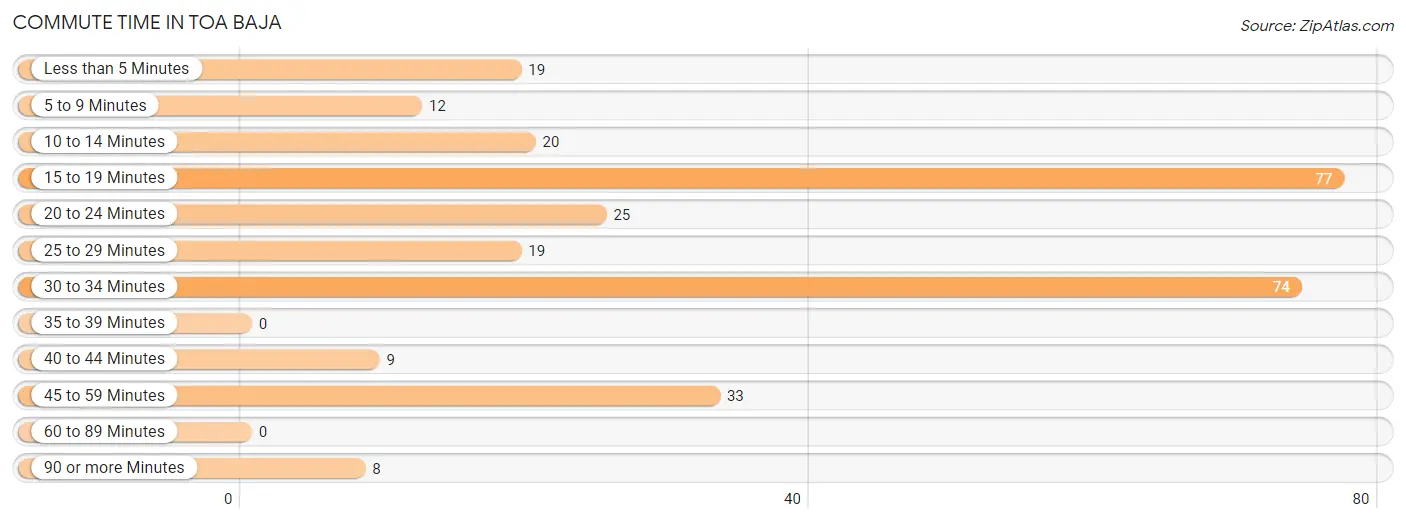
| Commute Time | # Commuters | % Commuters |
| Less than 5 Minutes | 19 | 6.4% |
| 5 to 9 Minutes | 12 | 4.1% |
| 10 to 14 Minutes | 20 | 6.8% |
| 15 to 19 Minutes | 77 | 26.0% |
| 20 to 24 Minutes | 25 | 8.5% |
| 25 to 29 Minutes | 19 | 6.4% |
| 30 to 34 Minutes | 74 | 25.0% |
| 35 to 39 Minutes | 0 | 0.0% |
| 40 to 44 Minutes | 9 | 3.0% |
| 45 to 59 Minutes | 33 | 11.2% |
| 60 to 89 Minutes | 0 | 0.0% |
| 90 or more Minutes | 8 | 2.7% |
Commute Time by Sex in Toa Baja
The most common commute times in Toa Baja are 30 to 34 minutes (52 commuters, 29.9%) for males and 15 to 19 minutes (32 commuters, 26.2%) for females.
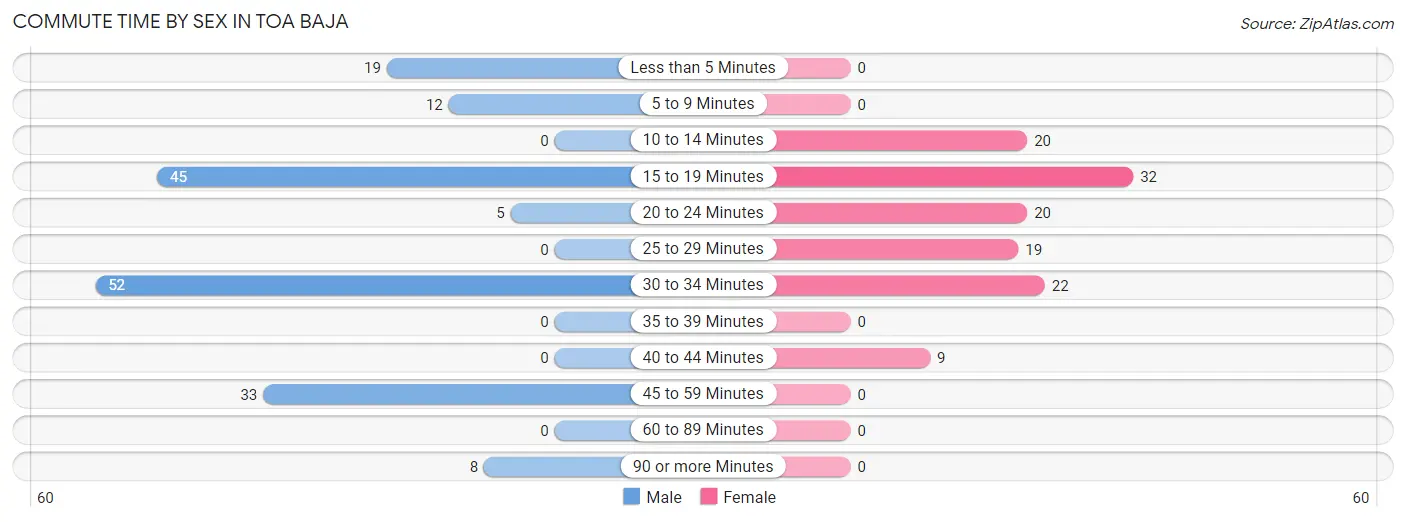
| Commute Time | Male | Female |
| Less than 5 Minutes | 19 (10.9%) | 0 (0.0%) |
| 5 to 9 Minutes | 12 (6.9%) | 0 (0.0%) |
| 10 to 14 Minutes | 0 (0.0%) | 20 (16.4%) |
| 15 to 19 Minutes | 45 (25.9%) | 32 (26.2%) |
| 20 to 24 Minutes | 5 (2.9%) | 20 (16.4%) |
| 25 to 29 Minutes | 0 (0.0%) | 19 (15.6%) |
| 30 to 34 Minutes | 52 (29.9%) | 22 (18.0%) |
| 35 to 39 Minutes | 0 (0.0%) | 0 (0.0%) |
| 40 to 44 Minutes | 0 (0.0%) | 9 (7.4%) |
| 45 to 59 Minutes | 33 (19.0%) | 0 (0.0%) |
| 60 to 89 Minutes | 0 (0.0%) | 0 (0.0%) |
| 90 or more Minutes | 8 (4.6%) | 0 (0.0%) |
Time of Departure to Work by Sex in Toa Baja
The most frequent times of departure to work in Toa Baja are 6:30 AM to 6:59 AM (47, 27.0%) for males and 6:30 AM to 6:59 AM (42, 34.4%) for females.
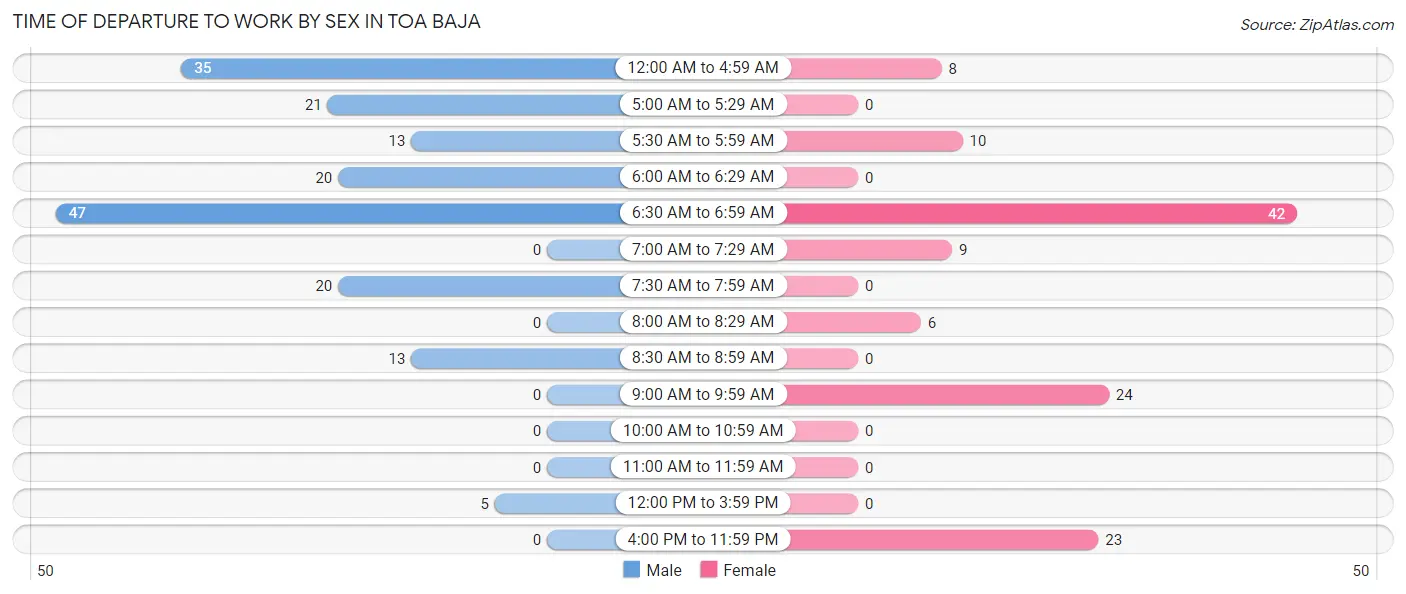
| Time of Departure | Male | Female |
| 12:00 AM to 4:59 AM | 35 (20.1%) | 8 (6.6%) |
| 5:00 AM to 5:29 AM | 21 (12.1%) | 0 (0.0%) |
| 5:30 AM to 5:59 AM | 13 (7.5%) | 10 (8.2%) |
| 6:00 AM to 6:29 AM | 20 (11.5%) | 0 (0.0%) |
| 6:30 AM to 6:59 AM | 47 (27.0%) | 42 (34.4%) |
| 7:00 AM to 7:29 AM | 0 (0.0%) | 9 (7.4%) |
| 7:30 AM to 7:59 AM | 20 (11.5%) | 0 (0.0%) |
| 8:00 AM to 8:29 AM | 0 (0.0%) | 6 (4.9%) |
| 8:30 AM to 8:59 AM | 13 (7.5%) | 0 (0.0%) |
| 9:00 AM to 9:59 AM | 0 (0.0%) | 24 (19.7%) |
| 10:00 AM to 10:59 AM | 0 (0.0%) | 0 (0.0%) |
| 11:00 AM to 11:59 AM | 0 (0.0%) | 0 (0.0%) |
| 12:00 PM to 3:59 PM | 5 (2.9%) | 0 (0.0%) |
| 4:00 PM to 11:59 PM | 0 (0.0%) | 23 (18.9%) |
| Total | 174 (100.0%) | 122 (100.0%) |
Housing Occupancy in Toa Baja
Occupancy by Ownership in Toa Baja
Of the total 395 dwellings in Toa Baja, owner-occupied units account for 159 (40.3%), while renter-occupied units make up 236 (59.8%).
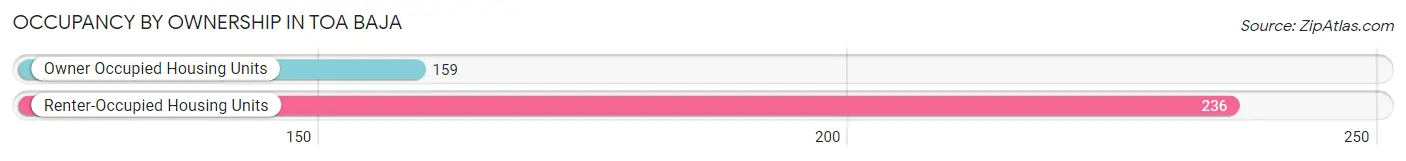
| Occupancy | # Housing Units | % Housing Units |
| Owner Occupied Housing Units | 159 | 40.3% |
| Renter-Occupied Housing Units | 236 | 59.8% |
| Total Occupied Housing Units | 395 | 100.0% |
Occupancy by Household Size in Toa Baja
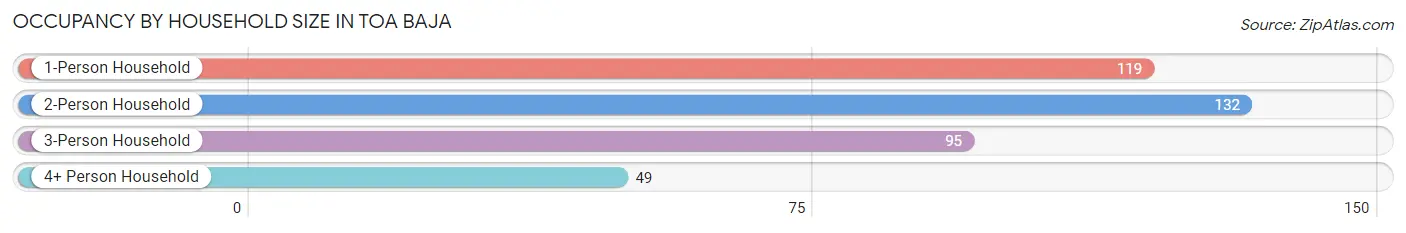
| Household Size | # Housing Units | % Housing Units |
| 1-Person Household | 119 | 30.1% |
| 2-Person Household | 132 | 33.4% |
| 3-Person Household | 95 | 24.0% |
| 4+ Person Household | 49 | 12.4% |
| Total Housing Units | 395 | 100.0% |
Occupancy by Ownership by Household Size in Toa Baja
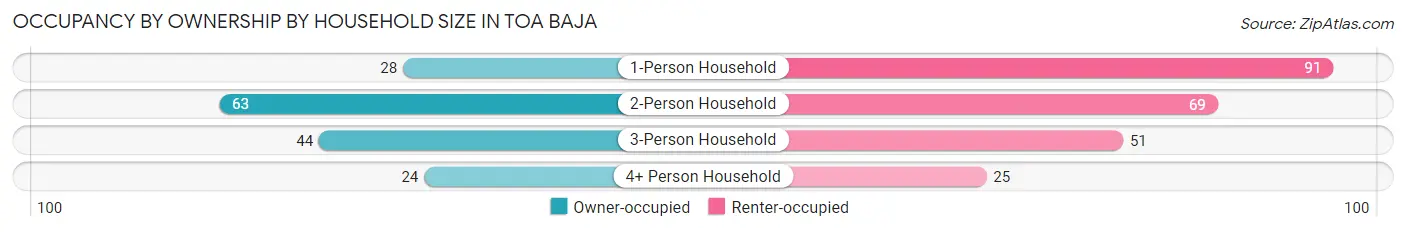
| Household Size | Owner-occupied | Renter-occupied |
| 1-Person Household | 28 (23.5%) | 91 (76.5%) |
| 2-Person Household | 63 (47.7%) | 69 (52.3%) |
| 3-Person Household | 44 (46.3%) | 51 (53.7%) |
| 4+ Person Household | 24 (49.0%) | 25 (51.0%) |
| Total Housing Units | 159 (40.3%) | 236 (59.8%) |
Occupancy by Educational Attainment in Toa Baja
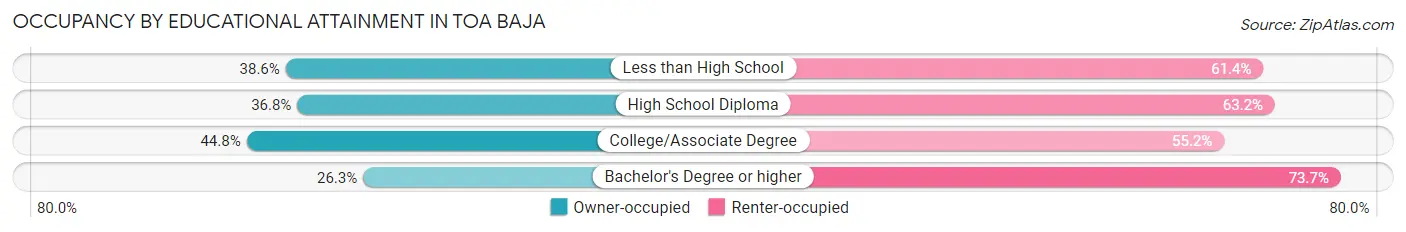
| Household Size | Owner-occupied | Renter-occupied |
| Less than High School | 22 (38.6%) | 35 (61.4%) |
| High School Diploma | 50 (36.8%) | 86 (63.2%) |
| College/Associate Degree | 82 (44.8%) | 101 (55.2%) |
| Bachelor's Degree or higher | 5 (26.3%) | 14 (73.7%) |
Occupancy by Age of Householder in Toa Baja
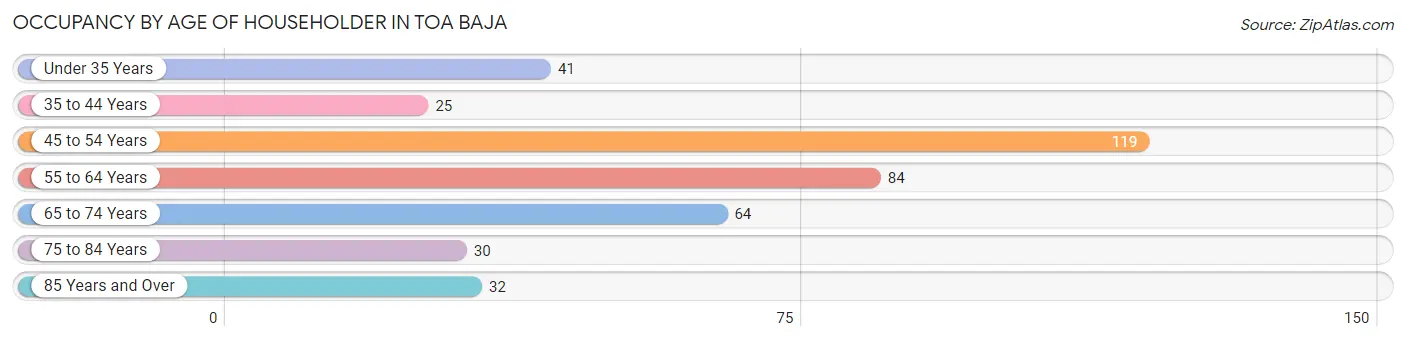
| Age Bracket | # Households | % Households |
| Under 35 Years | 41 | 10.4% |
| 35 to 44 Years | 25 | 6.3% |
| 45 to 54 Years | 119 | 30.1% |
| 55 to 64 Years | 84 | 21.3% |
| 65 to 74 Years | 64 | 16.2% |
| 75 to 84 Years | 30 | 7.6% |
| 85 Years and Over | 32 | 8.1% |
| Total | 395 | 100.0% |
Housing Finances in Toa Baja
Median Income by Occupancy in Toa Baja
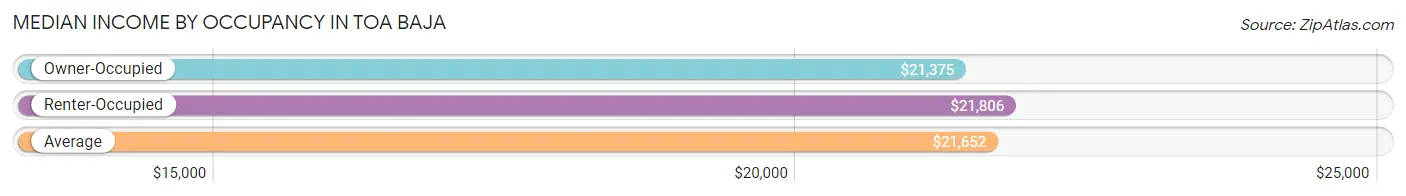
| Occupancy Type | # Households | Median Income |
| Owner-Occupied | 159 (40.3%) | $21,375 |
| Renter-Occupied | 236 (59.8%) | $21,806 |
| Average | 395 (100.0%) | $21,652 |
Occupancy by Householder Income Bracket in Toa Baja
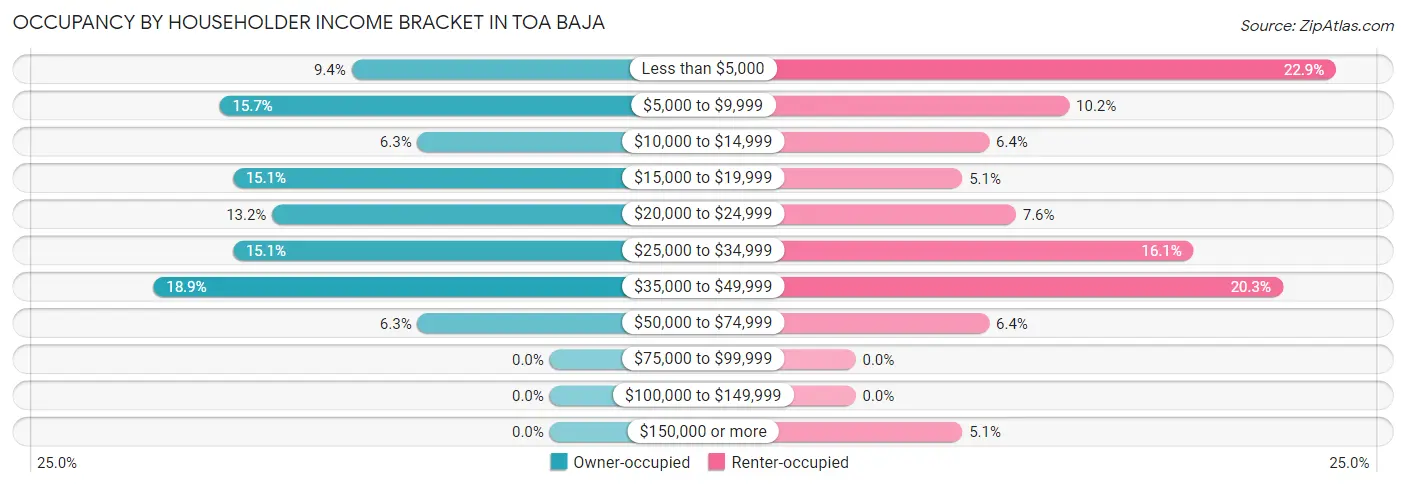
| Income Bracket | Owner-occupied | Renter-occupied |
| Less than $5,000 | 15 (9.4%) | 54 (22.9%) |
| $5,000 to $9,999 | 25 (15.7%) | 24 (10.2%) |
| $10,000 to $14,999 | 10 (6.3%) | 15 (6.4%) |
| $15,000 to $19,999 | 24 (15.1%) | 12 (5.1%) |
| $20,000 to $24,999 | 21 (13.2%) | 18 (7.6%) |
| $25,000 to $34,999 | 24 (15.1%) | 38 (16.1%) |
| $35,000 to $49,999 | 30 (18.9%) | 48 (20.3%) |
| $50,000 to $74,999 | 10 (6.3%) | 15 (6.4%) |
| $75,000 to $99,999 | 0 (0.0%) | 0 (0.0%) |
| $100,000 to $149,999 | 0 (0.0%) | 0 (0.0%) |
| $150,000 or more | 0 (0.0%) | 12 (5.1%) |
| Total | 159 (100.0%) | 236 (100.0%) |
Monthly Housing Cost Tiers in Toa Baja
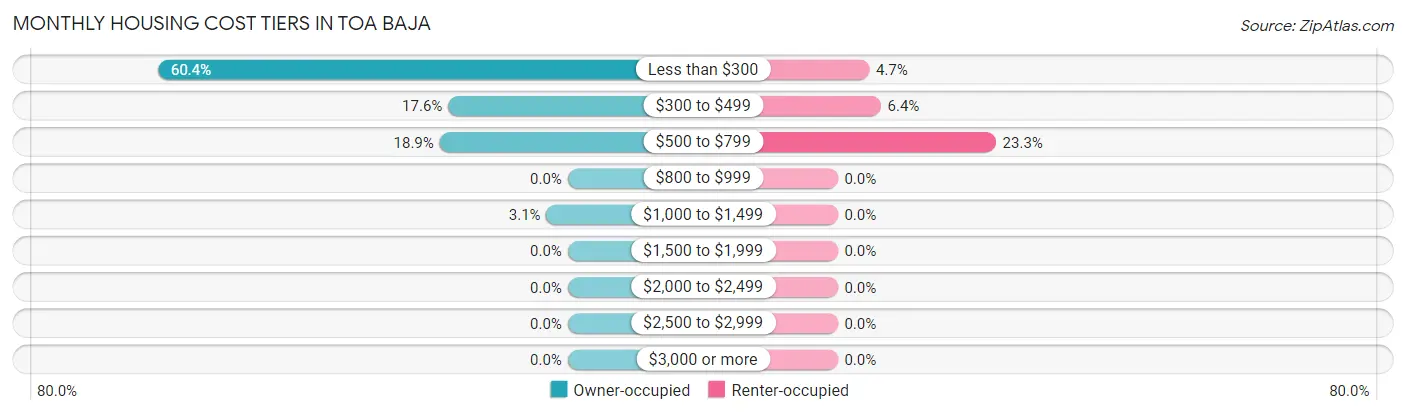
| Monthly Cost | Owner-occupied | Renter-occupied |
| Less than $300 | 96 (60.4%) | 11 (4.7%) |
| $300 to $499 | 28 (17.6%) | 15 (6.4%) |
| $500 to $799 | 30 (18.9%) | 55 (23.3%) |
| $800 to $999 | 0 (0.0%) | 0 (0.0%) |
| $1,000 to $1,499 | 5 (3.1%) | 0 (0.0%) |
| $1,500 to $1,999 | 0 (0.0%) | 0 (0.0%) |
| $2,000 to $2,499 | 0 (0.0%) | 0 (0.0%) |
| $2,500 to $2,999 | 0 (0.0%) | 0 (0.0%) |
| $3,000 or more | 0 (0.0%) | 0 (0.0%) |
| Total | 159 (100.0%) | 236 (100.0%) |
Physical Housing Characteristics in Toa Baja
Housing Structures in Toa Baja
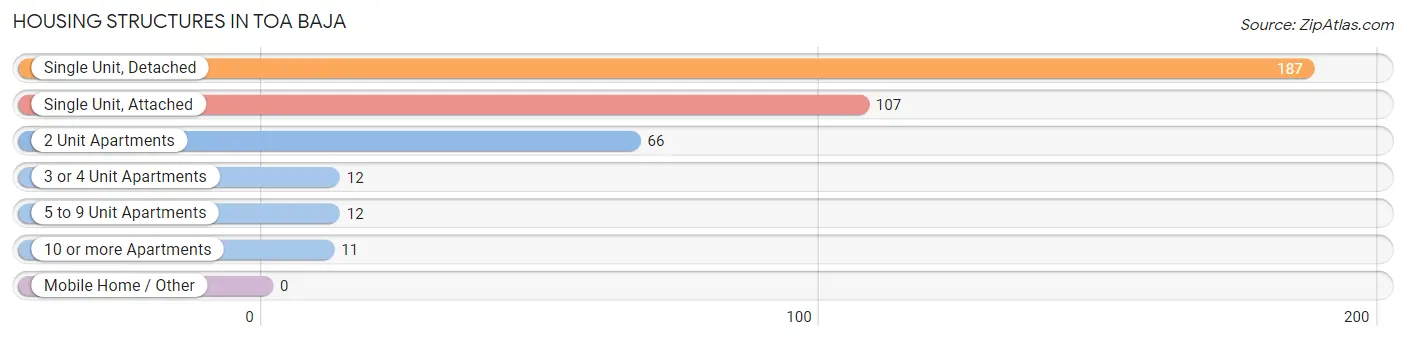
| Structure Type | # Housing Units | % Housing Units |
| Single Unit, Detached | 187 | 47.3% |
| Single Unit, Attached | 107 | 27.1% |
| 2 Unit Apartments | 66 | 16.7% |
| 3 or 4 Unit Apartments | 12 | 3.0% |
| 5 to 9 Unit Apartments | 12 | 3.0% |
| 10 or more Apartments | 11 | 2.8% |
| Mobile Home / Other | 0 | 0.0% |
| Total | 395 | 100.0% |
Housing Structures by Occupancy in Toa Baja
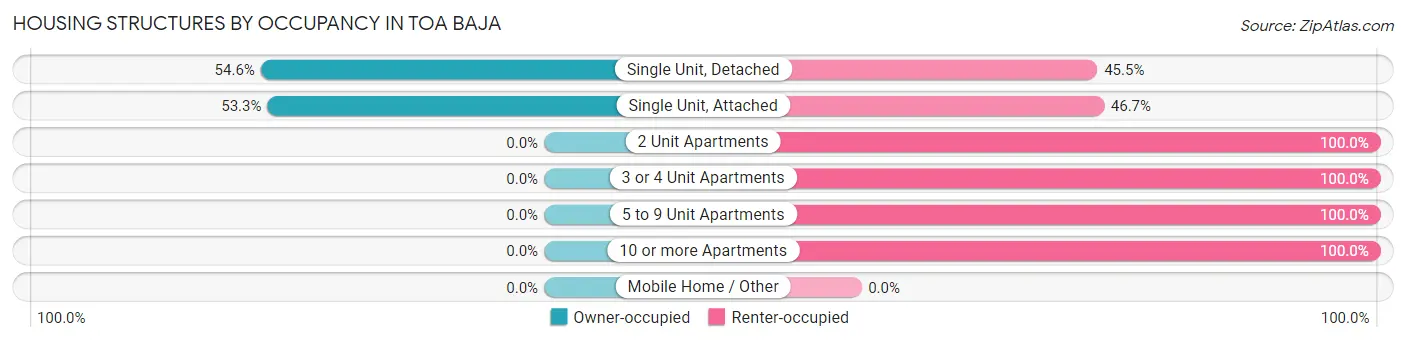
| Structure Type | Owner-occupied | Renter-occupied |
| Single Unit, Detached | 102 (54.5%) | 85 (45.5%) |
| Single Unit, Attached | 57 (53.3%) | 50 (46.7%) |
| 2 Unit Apartments | 0 (0.0%) | 66 (100.0%) |
| 3 or 4 Unit Apartments | 0 (0.0%) | 12 (100.0%) |
| 5 to 9 Unit Apartments | 0 (0.0%) | 12 (100.0%) |
| 10 or more Apartments | 0 (0.0%) | 11 (100.0%) |
| Mobile Home / Other | 0 (0.0%) | 0 (0.0%) |
| Total | 159 (40.3%) | 236 (59.8%) |
Housing Structures by Number of Rooms in Toa Baja
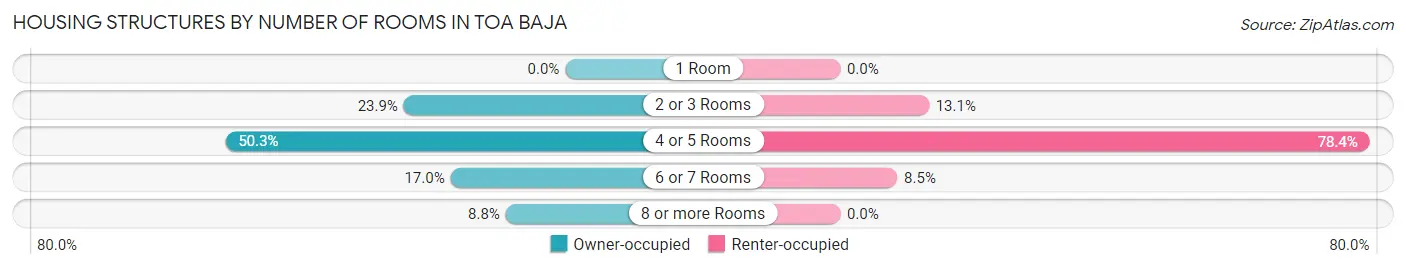
| Number of Rooms | Owner-occupied | Renter-occupied |
| 1 Room | 0 (0.0%) | 0 (0.0%) |
| 2 or 3 Rooms | 38 (23.9%) | 31 (13.1%) |
| 4 or 5 Rooms | 80 (50.3%) | 185 (78.4%) |
| 6 or 7 Rooms | 27 (17.0%) | 20 (8.5%) |
| 8 or more Rooms | 14 (8.8%) | 0 (0.0%) |
| Total | 159 (100.0%) | 236 (100.0%) |
Housing Structure by Heating Type in Toa Baja
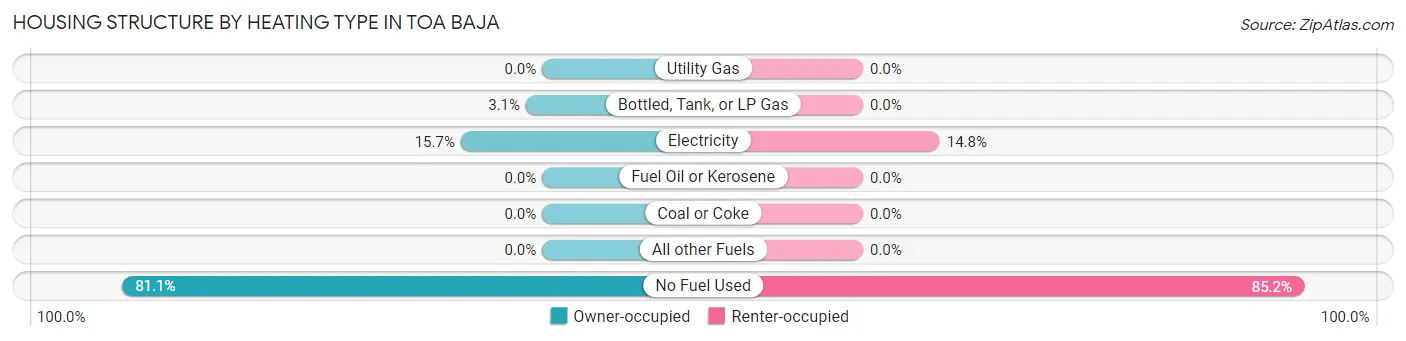
| Heating Type | Owner-occupied | Renter-occupied |
| Utility Gas | 0 (0.0%) | 0 (0.0%) |
| Bottled, Tank, or LP Gas | 5 (3.1%) | 0 (0.0%) |
| Electricity | 25 (15.7%) | 35 (14.8%) |
| Fuel Oil or Kerosene | 0 (0.0%) | 0 (0.0%) |
| Coal or Coke | 0 (0.0%) | 0 (0.0%) |
| All other Fuels | 0 (0.0%) | 0 (0.0%) |
| No Fuel Used | 129 (81.1%) | 201 (85.2%) |
| Total | 159 (100.0%) | 236 (100.0%) |
Household Vehicle Usage in Toa Baja
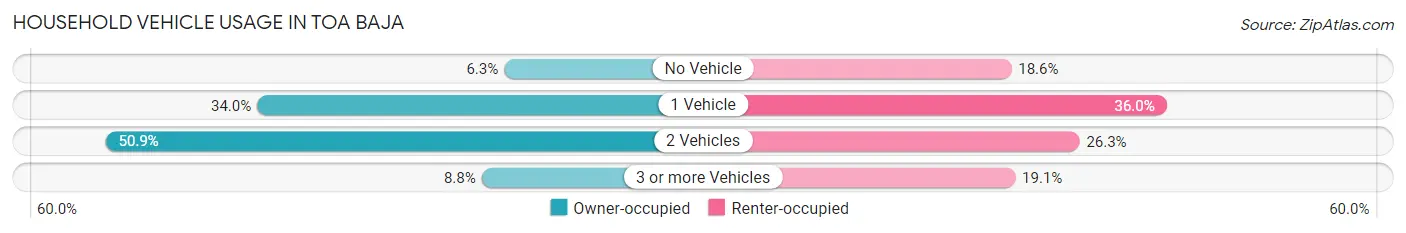
| Vehicles per Household | Owner-occupied | Renter-occupied |
| No Vehicle | 10 (6.3%) | 44 (18.6%) |
| 1 Vehicle | 54 (34.0%) | 85 (36.0%) |
| 2 Vehicles | 81 (50.9%) | 62 (26.3%) |
| 3 or more Vehicles | 14 (8.8%) | 45 (19.1%) |
| Total | 159 (100.0%) | 236 (100.0%) |
Real Estate & Mortgages in Toa Baja
Real Estate and Mortgage Overview in Toa Baja
| Characteristic | Without Mortgage | With Mortgage |
| Housing Units | 123 | 36 |
| Median Property Value | $89,700 | $118,000 |
| Median Household Income | $21,875 | $0 |
| Monthly Housing Costs | $229 | $0 |
| Real Estate Taxes | - | - |
Property Value by Mortgage Status in Toa Baja
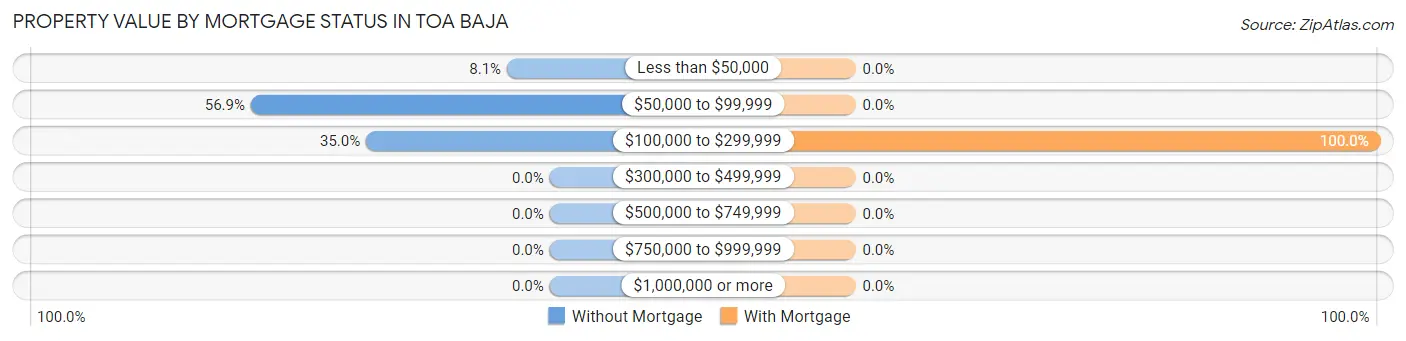
| Property Value | Without Mortgage | With Mortgage |
| Less than $50,000 | 10 (8.1%) | 0 (0.0%) |
| $50,000 to $99,999 | 70 (56.9%) | 0 (0.0%) |
| $100,000 to $299,999 | 43 (35.0%) | 36 (100.0%) |
| $300,000 to $499,999 | 0 (0.0%) | 0 (0.0%) |
| $500,000 to $749,999 | 0 (0.0%) | 0 (0.0%) |
| $750,000 to $999,999 | 0 (0.0%) | 0 (0.0%) |
| $1,000,000 or more | 0 (0.0%) | 0 (0.0%) |
| Total | 123 (100.0%) | 36 (100.0%) |
Household Income by Mortgage Status in Toa Baja
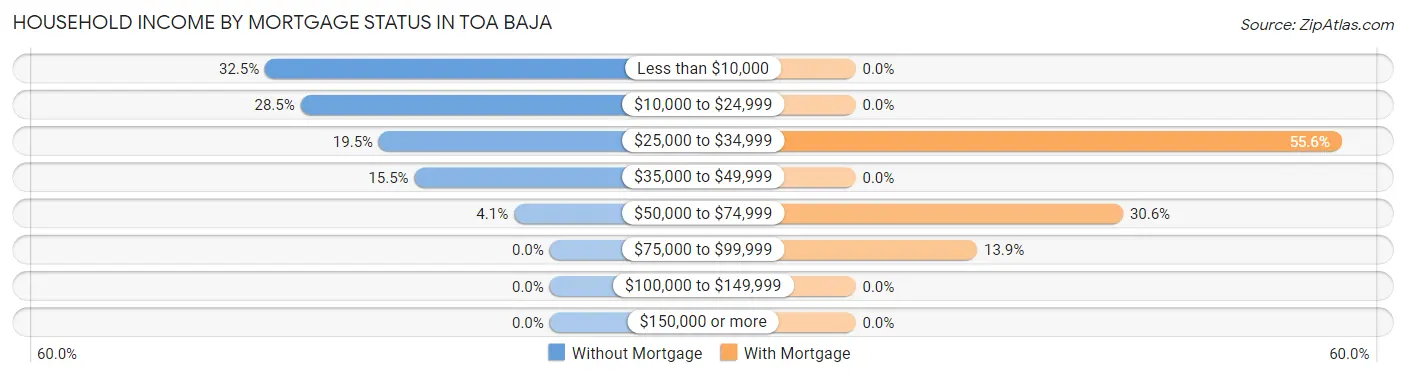
| Household Income | Without Mortgage | With Mortgage |
| Less than $10,000 | 40 (32.5%) | 0 (0.0%) |
| $10,000 to $24,999 | 35 (28.5%) | 0 (0.0%) |
| $25,000 to $34,999 | 24 (19.5%) | 20 (55.6%) |
| $35,000 to $49,999 | 19 (15.4%) | 0 (0.0%) |
| $50,000 to $74,999 | 5 (4.1%) | 11 (30.6%) |
| $75,000 to $99,999 | 0 (0.0%) | 5 (13.9%) |
| $100,000 to $149,999 | 0 (0.0%) | 0 (0.0%) |
| $150,000 or more | 0 (0.0%) | 0 (0.0%) |
| Total | 123 (100.0%) | 36 (100.0%) |
Property Value to Household Income Ratio in Toa Baja
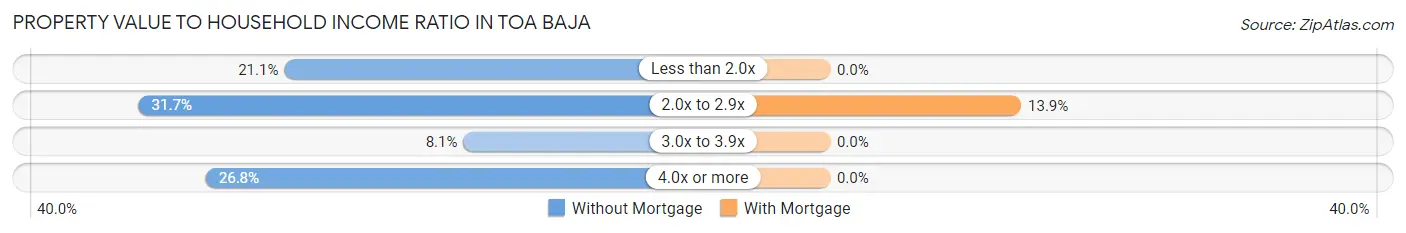
| Value-to-Income Ratio | Without Mortgage | With Mortgage |
| Less than 2.0x | 26 (21.1%) | 0 (0.0%) |
| 2.0x to 2.9x | 39 (31.7%) | 5 (13.9%) |
| 3.0x to 3.9x | 10 (8.1%) | 0 (0.0%) |
| 4.0x or more | 33 (26.8%) | 0 (0.0%) |
| Total | 123 (100.0%) | 36 (100.0%) |
Real Estate Taxes by Mortgage Status in Toa Baja
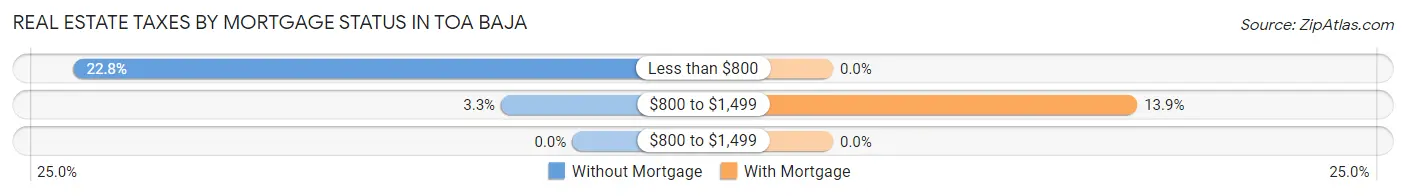
| Property Taxes | Without Mortgage | With Mortgage |
| Less than $800 | 28 (22.8%) | 0 (0.0%) |
| $800 to $1,499 | 4 (3.3%) | 5 (13.9%) |
| $800 to $1,499 | 0 (0.0%) | 0 (0.0%) |
| Total | 123 (100.0%) | 36 (100.0%) |
Health & Disability in Toa Baja
Health Insurance Coverage by Age in Toa Baja
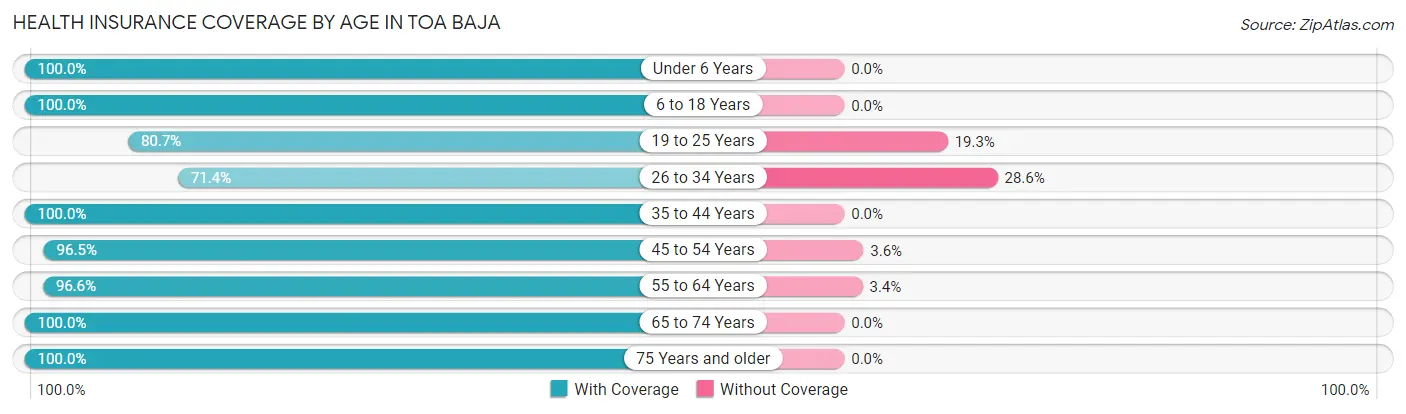
| Age Bracket | With Coverage | Without Coverage |
| Under 6 Years | 21 (100.0%) | 0 (0.0%) |
| 6 to 18 Years | 148 (100.0%) | 0 (0.0%) |
| 19 to 25 Years | 67 (80.7%) | 16 (19.3%) |
| 26 to 34 Years | 110 (71.4%) | 44 (28.6%) |
| 35 to 44 Years | 76 (100.0%) | 0 (0.0%) |
| 45 to 54 Years | 163 (96.5%) | 6 (3.5%) |
| 55 to 64 Years | 142 (96.6%) | 5 (3.4%) |
| 65 to 74 Years | 102 (100.0%) | 0 (0.0%) |
| 75 Years and older | 99 (100.0%) | 0 (0.0%) |
| Total | 928 (92.9%) | 71 (7.1%) |
Health Insurance Coverage by Citizenship Status in Toa Baja
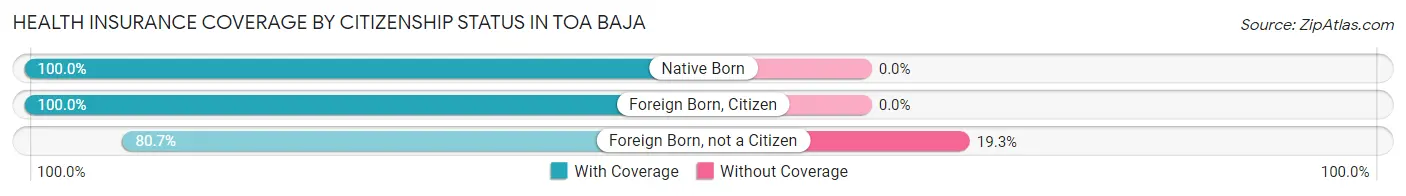
| Citizenship Status | With Coverage | Without Coverage |
| Native Born | 21 (100.0%) | 0 (0.0%) |
| Foreign Born, Citizen | 148 (100.0%) | 0 (0.0%) |
| Foreign Born, not a Citizen | 67 (80.7%) | 16 (19.3%) |
Health Insurance Coverage by Household Income in Toa Baja
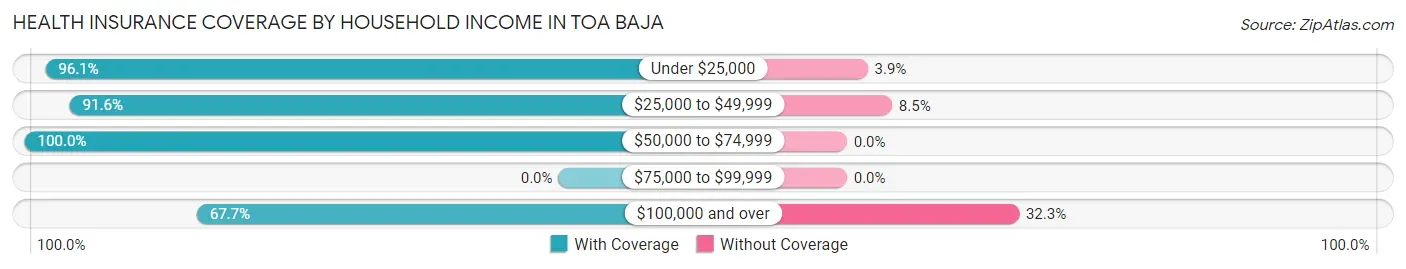
| Household Income | With Coverage | Without Coverage |
| Under $25,000 | 468 (96.1%) | 19 (3.9%) |
| $25,000 to $49,999 | 325 (91.5%) | 30 (8.5%) |
| $50,000 to $74,999 | 58 (100.0%) | 0 (0.0%) |
| $75,000 to $99,999 | 0 (0.0%) | 0 (0.0%) |
| $100,000 and over | 42 (67.7%) | 20 (32.3%) |
Public vs Private Health Insurance Coverage by Age in Toa Baja
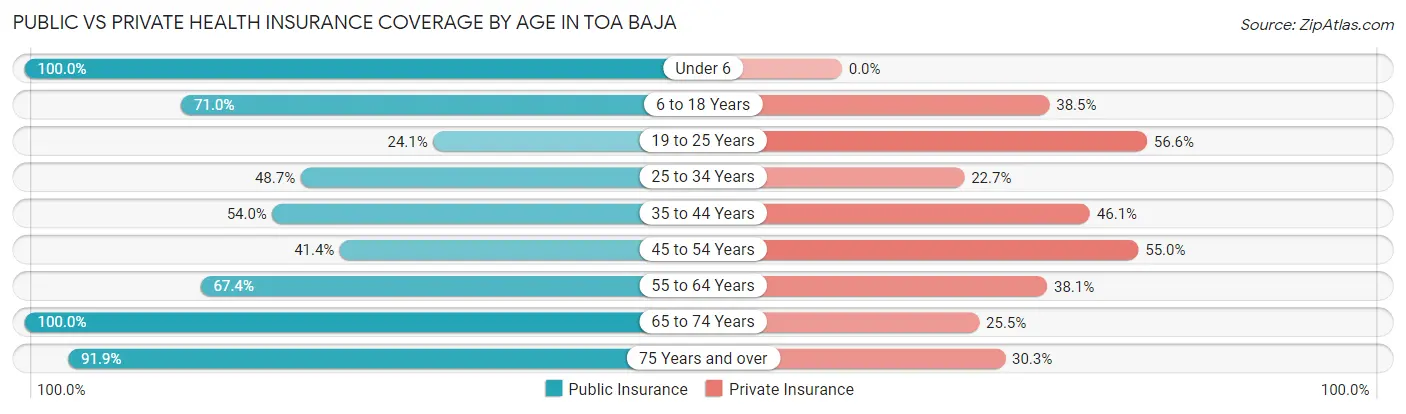
| Age Bracket | Public Insurance | Private Insurance |
| Under 6 | 21 (100.0%) | 0 (0.0%) |
| 6 to 18 Years | 105 (71.0%) | 57 (38.5%) |
| 19 to 25 Years | 20 (24.1%) | 47 (56.6%) |
| 25 to 34 Years | 75 (48.7%) | 35 (22.7%) |
| 35 to 44 Years | 41 (53.9%) | 35 (46.1%) |
| 45 to 54 Years | 70 (41.4%) | 93 (55.0%) |
| 55 to 64 Years | 99 (67.3%) | 56 (38.1%) |
| 65 to 74 Years | 102 (100.0%) | 26 (25.5%) |
| 75 Years and over | 91 (91.9%) | 30 (30.3%) |
| Total | 624 (62.5%) | 379 (37.9%) |
Disability Status by Sex by Age in Toa Baja
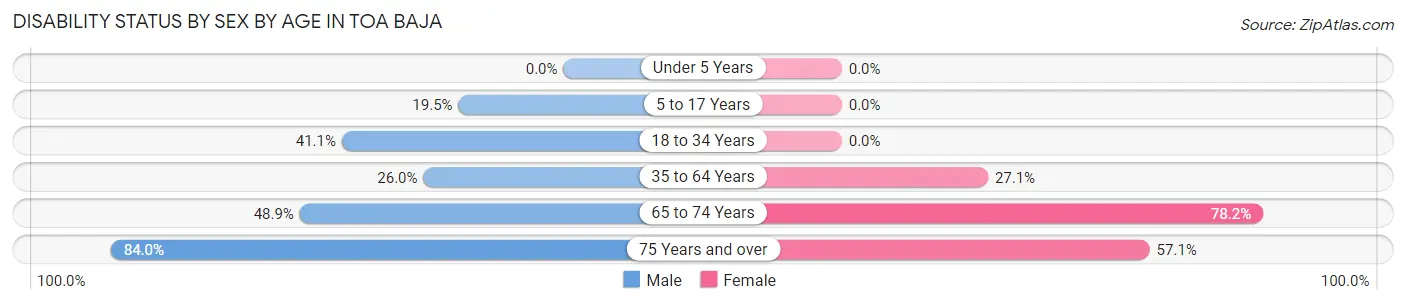
| Age Bracket | Male | Female |
| Under 5 Years | 0 (0.0%) | 0 (0.0%) |
| 5 to 17 Years | 15 (19.5%) | 0 (0.0%) |
| 18 to 34 Years | 58 (41.1%) | 0 (0.0%) |
| 35 to 64 Years | 53 (26.0%) | 51 (27.1%) |
| 65 to 74 Years | 23 (48.9%) | 43 (78.2%) |
| 75 Years and over | 42 (84.0%) | 28 (57.1%) |
Disability Class by Sex by Age in Toa Baja
Disability Class: Hearing Difficulty
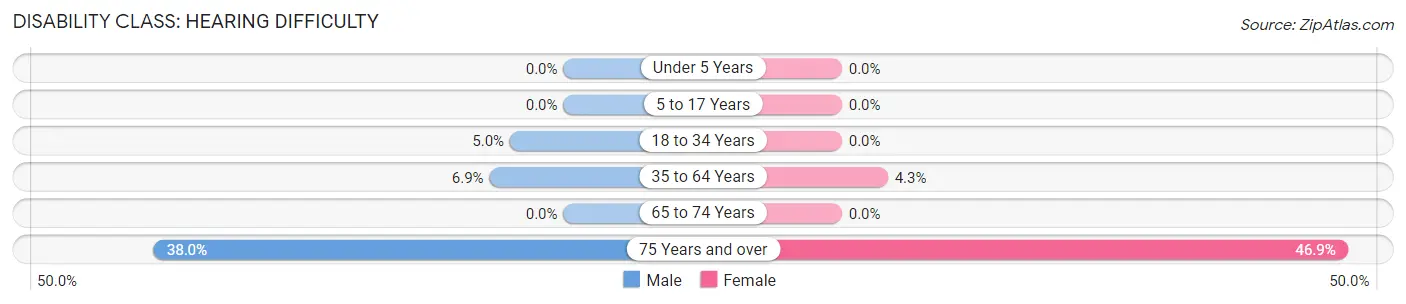
| Age Bracket | Male | Female |
| Under 5 Years | 0 (0.0%) | 0 (0.0%) |
| 5 to 17 Years | 0 (0.0%) | 0 (0.0%) |
| 18 to 34 Years | 7 (5.0%) | 0 (0.0%) |
| 35 to 64 Years | 14 (6.9%) | 8 (4.3%) |
| 65 to 74 Years | 0 (0.0%) | 0 (0.0%) |
| 75 Years and over | 19 (38.0%) | 23 (46.9%) |
Disability Class: Vision Difficulty
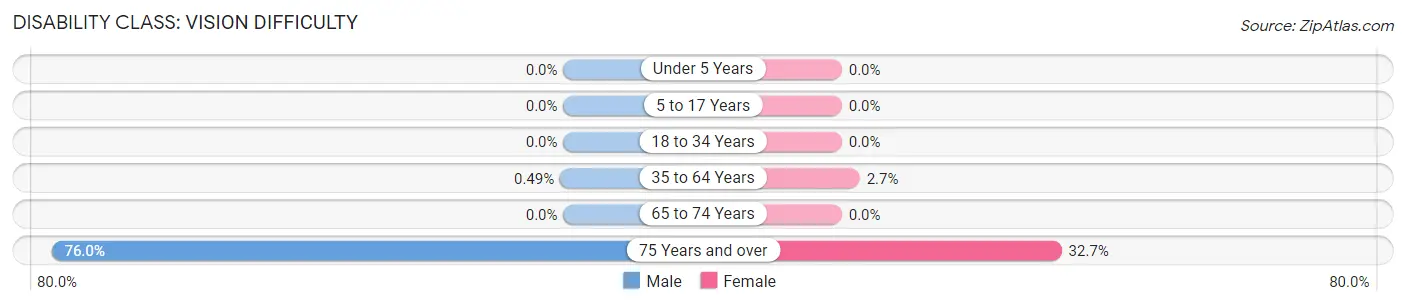
| Age Bracket | Male | Female |
| Under 5 Years | 0 (0.0%) | 0 (0.0%) |
| 5 to 17 Years | 0 (0.0%) | 0 (0.0%) |
| 18 to 34 Years | 0 (0.0%) | 0 (0.0%) |
| 35 to 64 Years | 1 (0.5%) | 5 (2.7%) |
| 65 to 74 Years | 0 (0.0%) | 0 (0.0%) |
| 75 Years and over | 38 (76.0%) | 16 (32.7%) |
Disability Class: Cognitive Difficulty
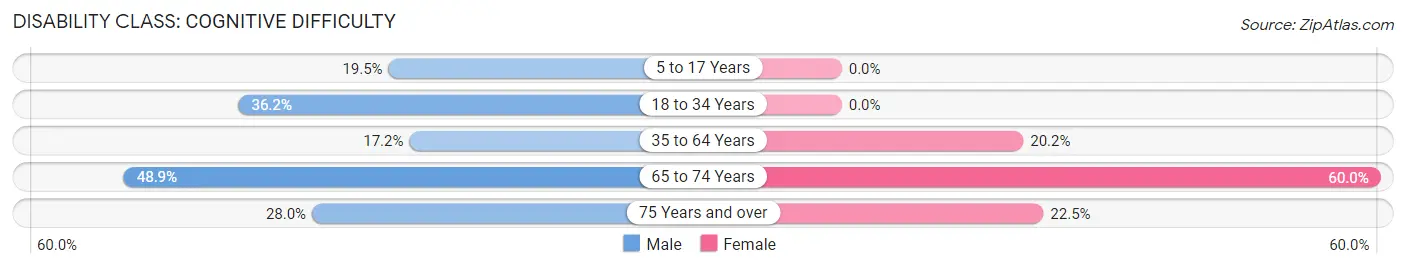
| Age Bracket | Male | Female |
| 5 to 17 Years | 15 (19.5%) | 0 (0.0%) |
| 18 to 34 Years | 51 (36.2%) | 0 (0.0%) |
| 35 to 64 Years | 35 (17.2%) | 38 (20.2%) |
| 65 to 74 Years | 23 (48.9%) | 33 (60.0%) |
| 75 Years and over | 14 (28.0%) | 11 (22.5%) |
Disability Class: Ambulatory Difficulty
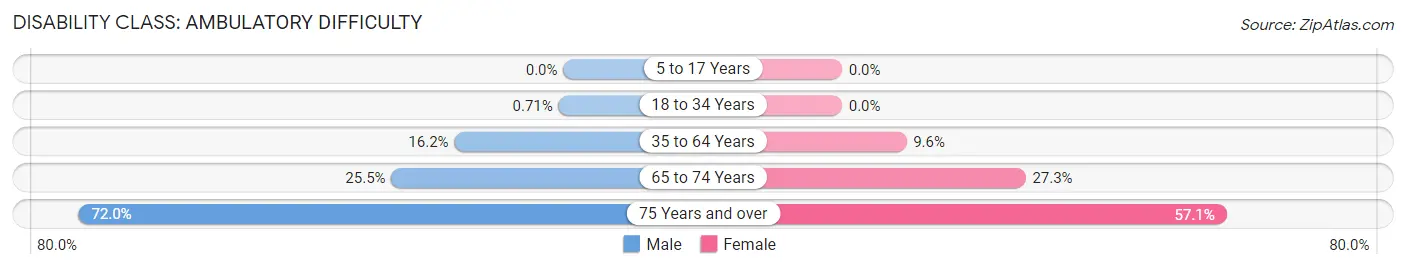
| Age Bracket | Male | Female |
| 5 to 17 Years | 0 (0.0%) | 0 (0.0%) |
| 18 to 34 Years | 1 (0.7%) | 0 (0.0%) |
| 35 to 64 Years | 33 (16.2%) | 18 (9.6%) |
| 65 to 74 Years | 12 (25.5%) | 15 (27.3%) |
| 75 Years and over | 36 (72.0%) | 28 (57.1%) |
Disability Class: Self-Care Difficulty
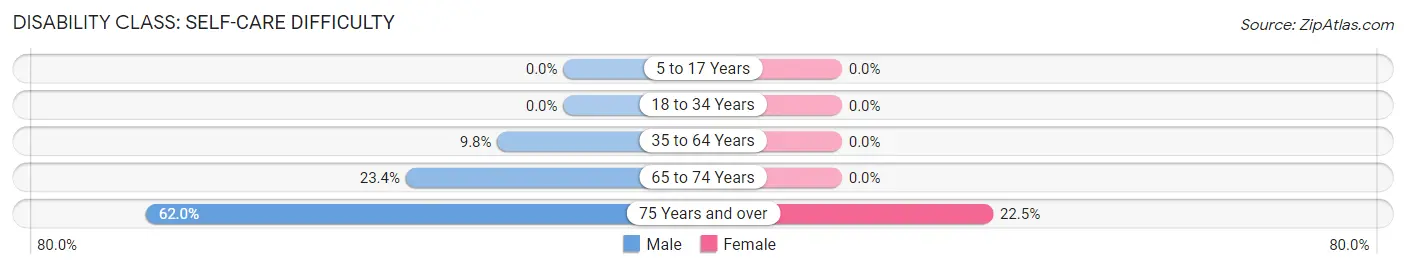
| Age Bracket | Male | Female |
| 5 to 17 Years | 0 (0.0%) | 0 (0.0%) |
| 18 to 34 Years | 0 (0.0%) | 0 (0.0%) |
| 35 to 64 Years | 20 (9.8%) | 0 (0.0%) |
| 65 to 74 Years | 11 (23.4%) | 0 (0.0%) |
| 75 Years and over | 31 (62.0%) | 11 (22.5%) |
Technology Access in Toa Baja
Computing Device Access in Toa Baja
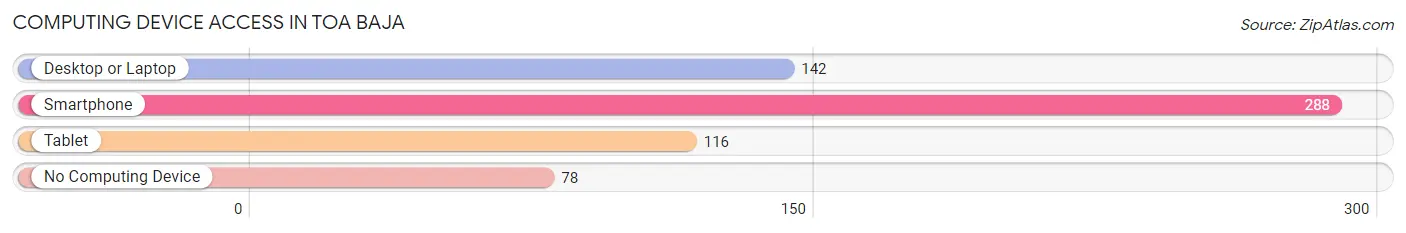
| Device Type | # Households | % Households |
| Desktop or Laptop | 142 | 35.9% |
| Smartphone | 288 | 72.9% |
| Tablet | 116 | 29.4% |
| No Computing Device | 78 | 19.8% |
| Total | 395 | 100.0% |
Internet Access in Toa Baja
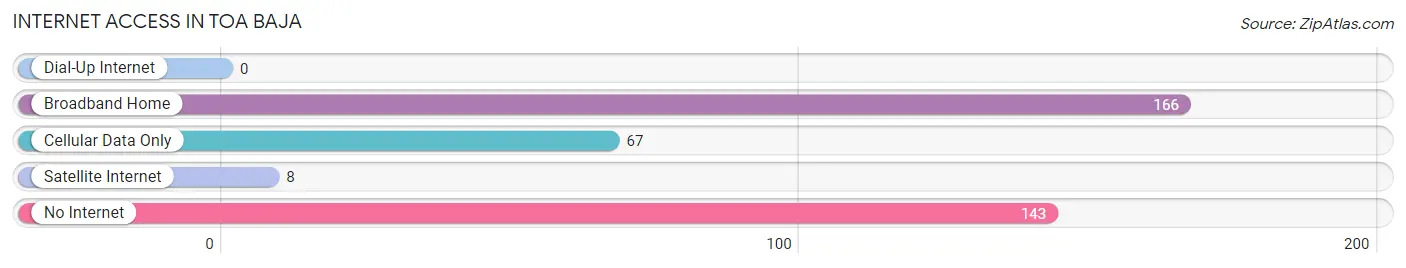
| Internet Type | # Households | % Households |
| Dial-Up Internet | 0 | 0.0% |
| Broadband Home | 166 | 42.0% |
| Cellular Data Only | 67 | 17.0% |
| Satellite Internet | 8 | 2.0% |
| No Internet | 143 | 36.2% |
| Total | 395 | 100.0% |
Toa Baja Summary
Toa Baja is a municipality located in the northern coast of Puerto Rico, in the northern karst zone of the island. It is part of the San Juan-Caguas-Guaynabo Metropolitan Statistical Area. As of the 2010 census, the municipality had a population of 79,961, making it the fourth most populous municipality in Puerto Rico.
History
The area of Toa Baja was originally inhabited by the Taíno Indians. The region was later colonized by the Spanish in the early 16th century. The name of the town is derived from the Taíno word for “low land”.
In 1776, Toa Baja was officially recognized as a municipality by the Spanish Crown. During the 19th century, the town experienced a period of economic growth and development, due to the sugar cane industry. In 1898, Toa Baja was annexed by the United States as part of the Treaty of Paris, which ended the Spanish-American War.
Geography
Toa Baja is located in the northern coast of Puerto Rico, in the northern karst zone of the island. It is bordered by the municipalities of Dorado to the north, Toa Alta to the south, Bayamón to the east, and Vega Baja to the west. The municipality covers an area of approximately 33.5 square miles (86.7 km2).
The terrain of Toa Baja is mostly flat, with some hills in the western part of the municipality. The highest point is Cerro La Torrecilla, which has an elevation of 1,065 feet (325 m). The municipality is drained by several rivers, including the Río La Plata, Río Culebrinas, and Río Grande de Manatí.
Economy
The economy of Toa Baja is largely based on manufacturing and services. The municipality is home to several industrial parks, including the Toa Baja Industrial Park, the Toa Baja Industrial Park II, and the Toa Baja Industrial Park III. These parks are home to a variety of industries, including pharmaceuticals, electronics, and food processing.
The municipality is also home to several shopping centers, including the Plaza del Sol, Plaza Toa Baja, and Plaza del Norte. In addition, Toa Baja is home to several tourist attractions, including the Toa Baja Zoo, the Toa Baja Aquarium, and the Toa Baja Botanical Garden.
Demographics
As of the 2010 census, the population of Toa Baja was 79,961, making it the fourth most populous municipality in Puerto Rico. The population is largely of mixed European and African descent. The median household income in Toa Baja was $20,845 in 2010, and the median age was 37.7 years.
The majority of the population (90.3%) speaks Spanish as their primary language, while 4.2% speak English. The majority of the population (90.3%) is Roman Catholic, while 4.2% are Protestant.
Conclusion
Toa Baja is a municipality located in the northern coast of Puerto Rico, in the northern karst zone of the island. It is part of the San Juan-Caguas-Guaynabo Metropolitan Statistical Area. As of the 2010 census, the municipality had a population of 79,961, making it the fourth most populous municipality in Puerto Rico. The economy of Toa Baja is largely based on manufacturing and services, and the population is largely of mixed European and African descent. The majority of the population speaks Spanish as their primary language, and the majority of the population is Roman Catholic.
Common Questions
What is Per Capita Income in Toa Baja?
Per Capita income in Toa Baja is $13,238.
What is the Median Family Income in Toa Baja?
Median Family Income in Toa Baja is $20,750.
What is the Median Household income in Toa Baja?
Median Household Income in Toa Baja is $21,652.
What is Income or Wage Gap in Toa Baja?
Income or Wage Gap in Toa Baja is 28.8%.
Women in Toa Baja earn 71.2 cents for every dollar earned by a man.
What is Inequality or Gini Index in Toa Baja?
Inequality or Gini Index in Toa Baja is 0.52.
What is the Total Population of Toa Baja?
Total Population of Toa Baja is 999.
What is the Total Male Population of Toa Baja?
Total Male Population of Toa Baja is 529.
What is the Total Female Population of Toa Baja?
Total Female Population of Toa Baja is 470.
What is the Ratio of Males per 100 Females in Toa Baja?
There are 112.55 Males per 100 Females in Toa Baja.
What is the Ratio of Females per 100 Males in Toa Baja?
There are 88.85 Females per 100 Males in Toa Baja.
What is the Median Population Age in Toa Baja?
Median Population Age in Toa Baja is 45.8 Years.
What is the Average Family Size in Toa Baja
Average Family Size in Toa Baja is 2.9 People.
What is the Average Household Size in Toa Baja
Average Household Size in Toa Baja is 2.4 People.
How Large is the Labor Force in Toa Baja?
There are 365 People in the Labor Forcein in Toa Baja.
What is the Percentage of People in the Labor Force in Toa Baja?
41.4% of People are in the Labor Force in Toa Baja.
What is the Unemployment Rate in Toa Baja?
Unemployment Rate in Toa Baja is 9.0%.