Sabana Seca, PR Map & Demographics
Sabana Seca Map
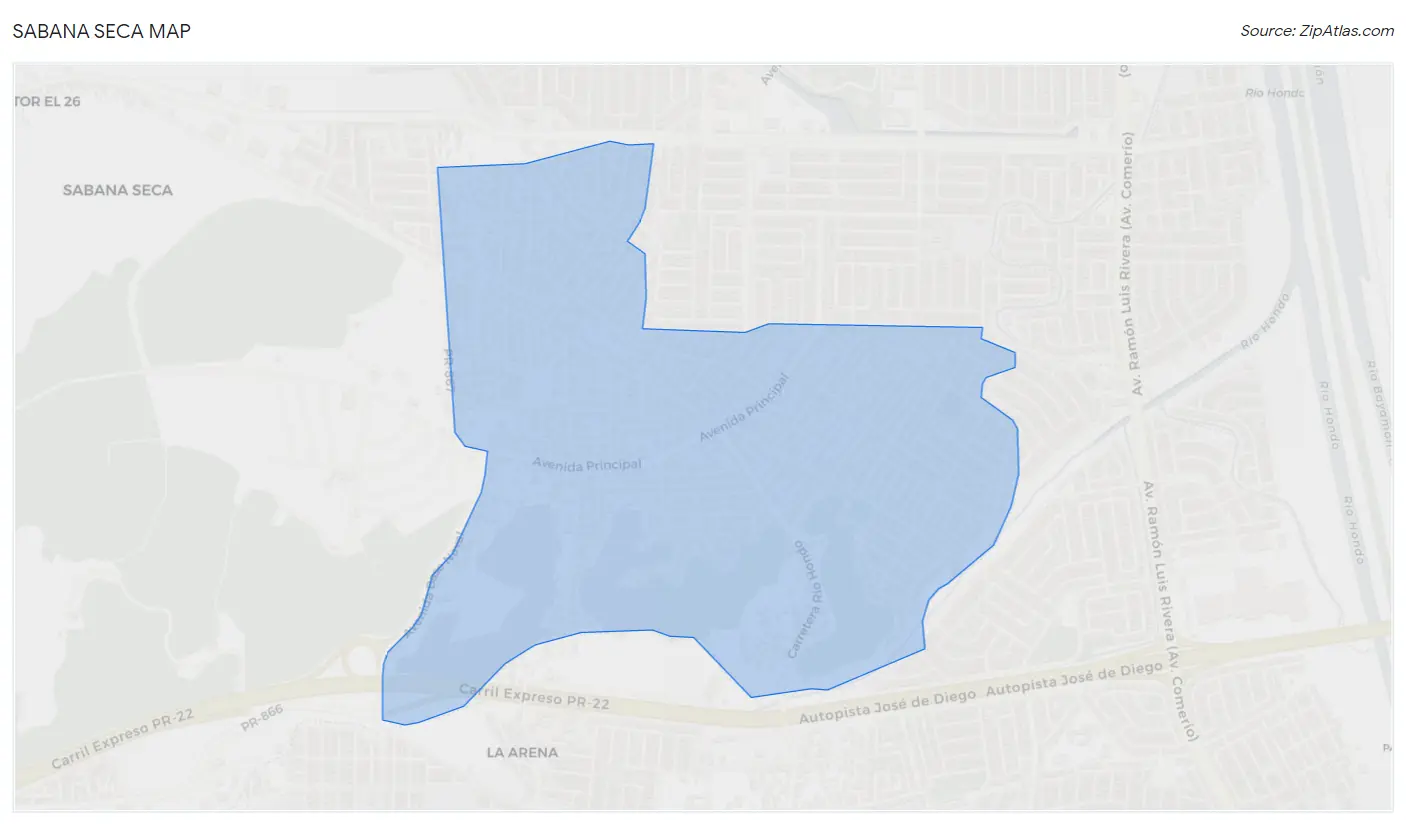
Sabana Seca Overview
$11,651
PER CAPITA INCOME
$24,759
AVG FAMILY INCOME
$21,178
AVG HOUSEHOLD INCOME
3.7%
WAGE / INCOME GAP [ % ]
96.3¢/ $1
WAGE / INCOME GAP [ $ ]
$11,628
FAMILY INCOME DEFICIT
0.43
INEQUALITY / GINI INDEX
7,769
TOTAL POPULATION
3,757
MALE POPULATION
4,012
FEMALE POPULATION
93.64
MALES / 100 FEMALES
106.79
FEMALES / 100 MALES
49.4
MEDIAN AGE
3.2
AVG FAMILY SIZE
2.6
AVG HOUSEHOLD SIZE
3,200
LABOR FORCE [ PEOPLE ]
46.7%
PERCENT IN LABOR FORCE
15.4%
UNEMPLOYMENT RATE
Sabana Seca Zip Codes
Income in Sabana Seca
Income Overview in Sabana Seca
Per Capita Income in Sabana Seca is $11,651, while median incomes of families and households are $24,759 and $21,178 respectively.
| Characteristic | Number | Measure |
| Per Capita Income | 7,769 | $11,651 |
| Median Family Income | 1,903 | $24,759 |
| Mean Family Income | 1,903 | $29,119 |
| Median Household Income | 2,956 | $21,178 |
| Mean Household Income | 2,956 | $25,800 |
| Income Deficit | 1,903 | $11,628 |
| Wage / Income Gap (%) | 7,769 | 3.66% |
| Wage / Income Gap ($) | 7,769 | 96.34¢ per $1 |
| Gini / Inequality Index | 7,769 | 0.43 |
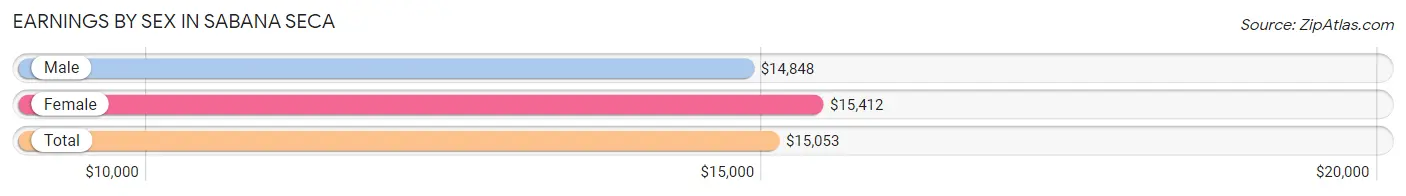
Earnings by Sex in Sabana Seca
Average Earnings in Sabana Seca are $15,053, $14,848 for men and $15,412 for women, a difference of 3.7%.
| Sex | Number | Average Earnings |
| Male | 1,665 (57.9%) | $14,848 |
| Female | 1,209 (42.1%) | $15,412 |
| Total | 2,874 (100.0%) | $15,053 |
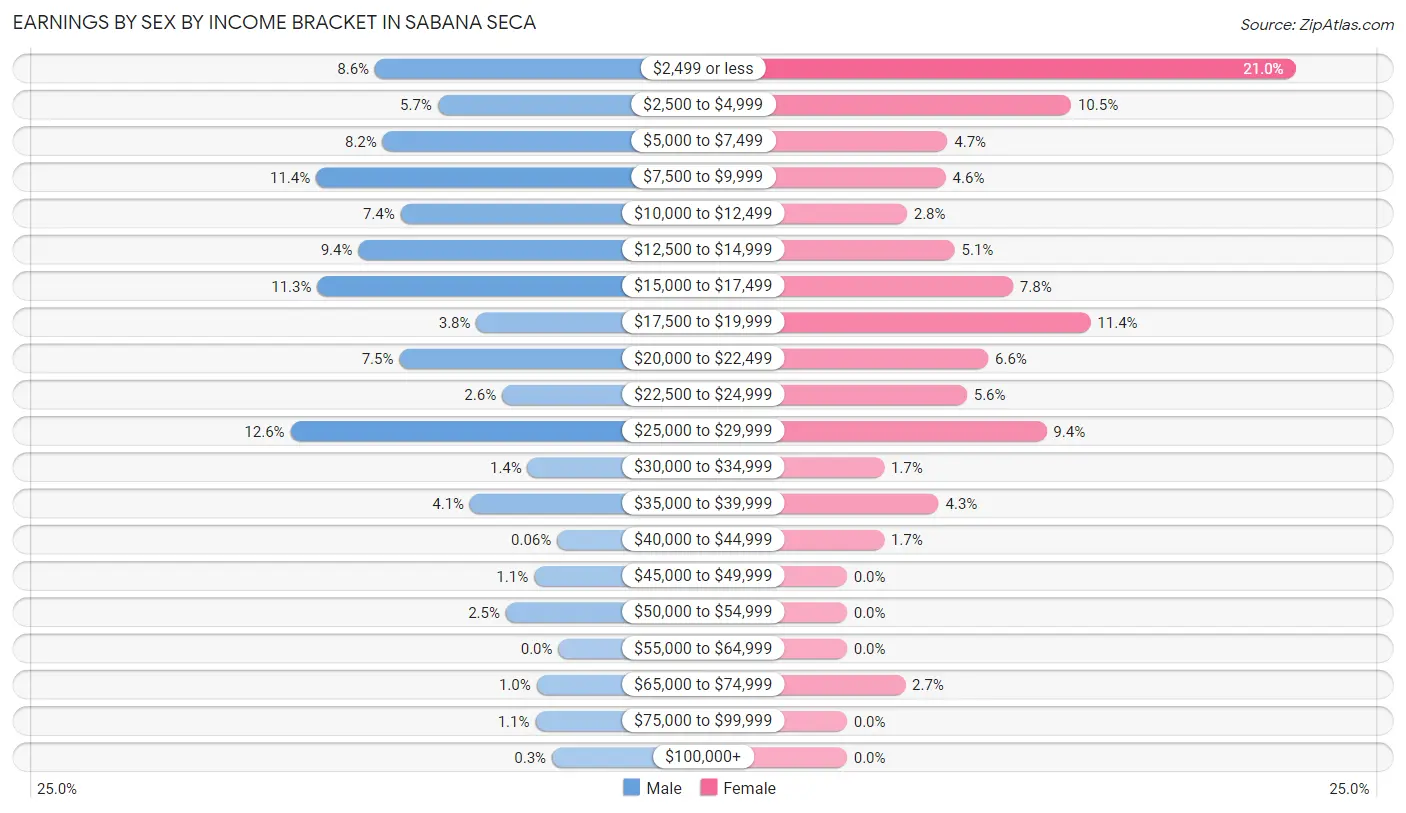
Earnings by Sex by Income Bracket in Sabana Seca
The most common earnings brackets in Sabana Seca are $25,000 to $29,999 for men (209 | 12.6%) and $2,499 or less for women (254 | 21.0%).
| Income | Male | Female |
| $2,499 or less | 143 (8.6%) | 254 (21.0%) |
| $2,500 to $4,999 | 94 (5.7%) | 127 (10.5%) |
| $5,000 to $7,499 | 137 (8.2%) | 57 (4.7%) |
| $7,500 to $9,999 | 189 (11.4%) | 56 (4.6%) |
| $10,000 to $12,499 | 123 (7.4%) | 34 (2.8%) |
| $12,500 to $14,999 | 156 (9.4%) | 61 (5.1%) |
| $15,000 to $17,499 | 188 (11.3%) | 94 (7.8%) |
| $17,500 to $19,999 | 64 (3.8%) | 138 (11.4%) |
| $20,000 to $22,499 | 124 (7.4%) | 80 (6.6%) |
| $22,500 to $24,999 | 44 (2.6%) | 68 (5.6%) |
| $25,000 to $29,999 | 209 (12.6%) | 113 (9.3%) |
| $30,000 to $34,999 | 24 (1.4%) | 21 (1.7%) |
| $35,000 to $39,999 | 69 (4.1%) | 52 (4.3%) |
| $40,000 to $44,999 | 1 (0.1%) | 21 (1.7%) |
| $45,000 to $49,999 | 19 (1.1%) | 0 (0.0%) |
| $50,000 to $54,999 | 41 (2.5%) | 0 (0.0%) |
| $55,000 to $64,999 | 0 (0.0%) | 0 (0.0%) |
| $65,000 to $74,999 | 17 (1.0%) | 33 (2.7%) |
| $75,000 to $99,999 | 18 (1.1%) | 0 (0.0%) |
| $100,000+ | 5 (0.3%) | 0 (0.0%) |
| Total | 1,665 (100.0%) | 1,209 (100.0%) |
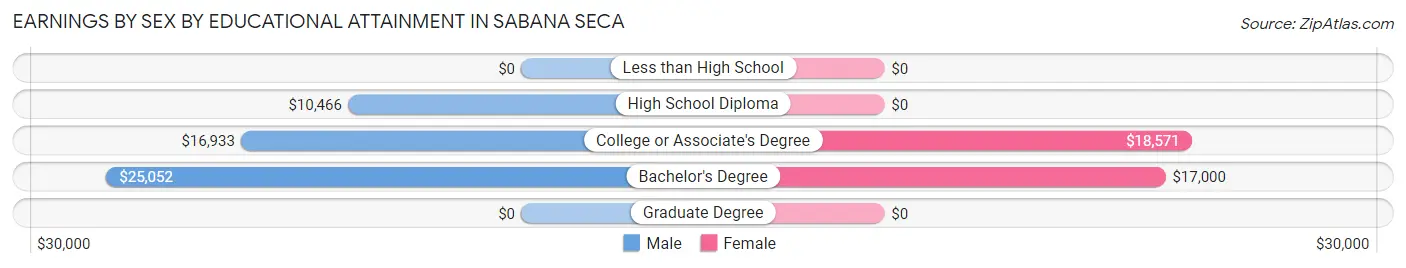
Earnings by Sex by Educational Attainment in Sabana Seca
Average earnings in Sabana Seca are $15,850 for men and $17,545 for women, a difference of 9.7%. Men with an educational attainment of bachelor's degree enjoy the highest average annual earnings of $25,052, while those with high school diploma education earn the least with $10,466. Women with an educational attainment of college or associate's degree earn the most with the average annual earnings of $18,571, while those with bachelor's degree education have the smallest earnings of $17,000.
| Educational Attainment | Male Income | Female Income |
| Less than High School | - | - |
| High School Diploma | $10,466 | $0 |
| College or Associate's Degree | $16,933 | $18,571 |
| Bachelor's Degree | $25,052 | $17,000 |
| Graduate Degree | - | - |
| Total | $15,850 | $17,545 |
Family Income in Sabana Seca
Family Income Brackets in Sabana Seca
According to the Sabana Seca family income data, there are 497 families falling into the $15,000 to $24,999 income range, which is the most common income bracket and makes up 26.1% of all families.
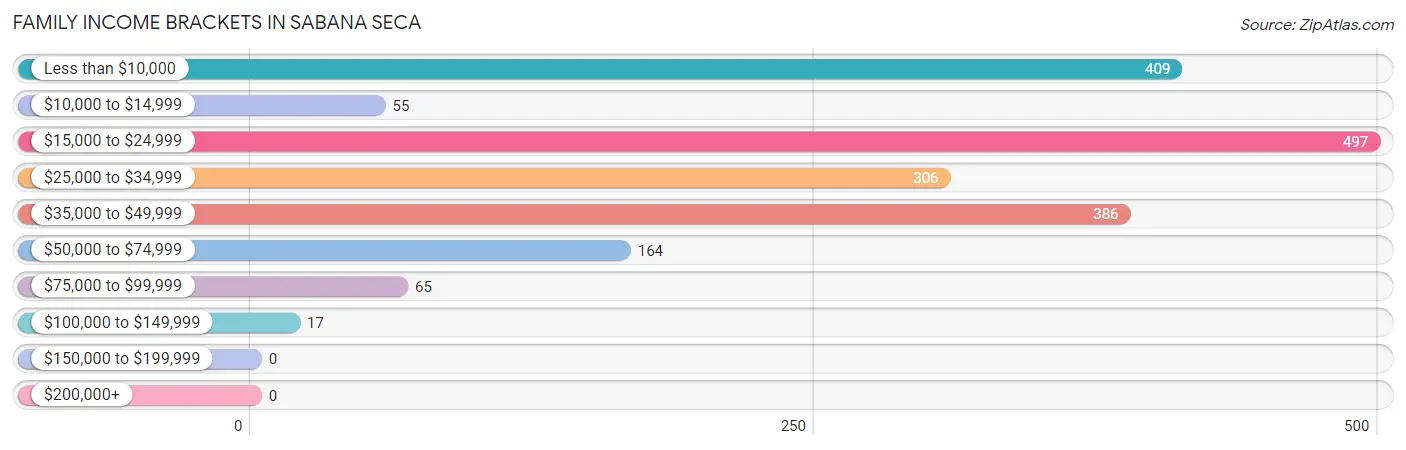
| Income Bracket | # Families | % Families |
| Less than $10,000 | 409 | 21.5% |
| $10,000 to $14,999 | 55 | 2.9% |
| $15,000 to $24,999 | 497 | 26.1% |
| $25,000 to $34,999 | 306 | 16.1% |
| $35,000 to $49,999 | 386 | 20.3% |
| $50,000 to $74,999 | 164 | 8.6% |
| $75,000 to $99,999 | 65 | 3.4% |
| $100,000 to $149,999 | 17 | 0.9% |
| $150,000 to $199,999 | 0 | 0.0% |
| $200,000+ | 0 | 0.0% |
Family Income by Famaliy Size in Sabana Seca
4-person families (246 | 12.9%) account for the highest median family income in Sabana Seca with $55,152 per family, while 4-person families (246 | 12.9%) have the highest median income of $13,788 per family member.
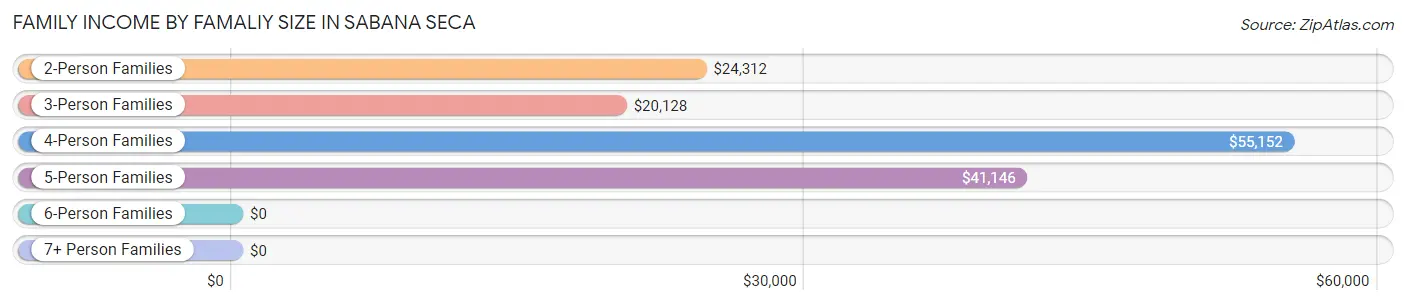
| Income Bracket | # Families | Median Income |
| 2-Person Families | 1,206 (63.4%) | $24,312 |
| 3-Person Families | 287 (15.1%) | $20,128 |
| 4-Person Families | 246 (12.9%) | $55,152 |
| 5-Person Families | 66 (3.5%) | $41,146 |
| 6-Person Families | 46 (2.4%) | $0 |
| 7+ Person Families | 52 (2.7%) | $0 |
| Total | 1,903 (100.0%) | $24,759 |
Family Income by Number of Earners in Sabana Seca
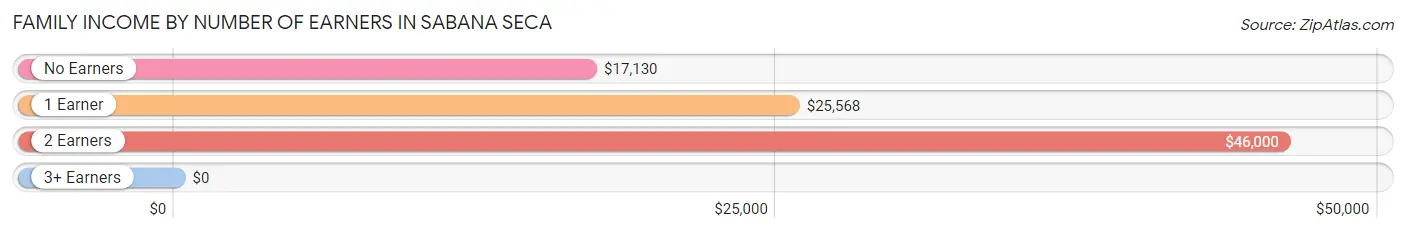
| Number of Earners | # Families | Median Income |
| No Earners | 787 (41.4%) | $17,130 |
| 1 Earner | 564 (29.6%) | $25,568 |
| 2 Earners | 452 (23.7%) | $46,000 |
| 3+ Earners | 100 (5.2%) | $0 |
| Total | 1,903 (100.0%) | $24,759 |
Household Income in Sabana Seca
Household Income Brackets in Sabana Seca
With 733 households falling in the category, the less than $10,000 income range is the most frequent in Sabana Seca, accounting for 24.8% of all households.
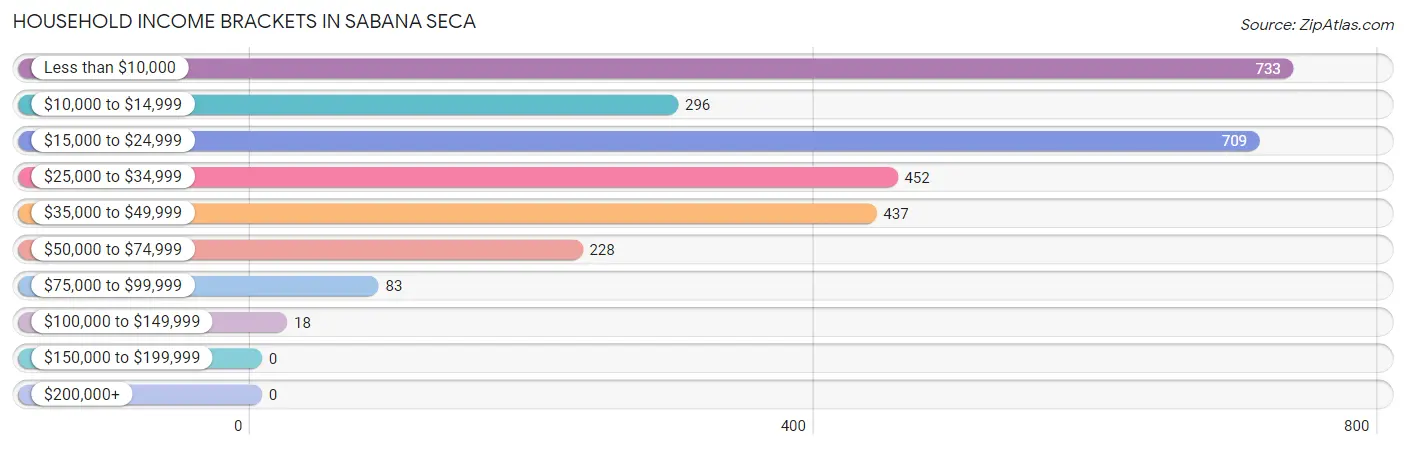
| Income Bracket | # Households | % Households |
| Less than $10,000 | 733 | 24.8% |
| $10,000 to $14,999 | 296 | 10.0% |
| $15,000 to $24,999 | 709 | 24.0% |
| $25,000 to $34,999 | 452 | 15.3% |
| $35,000 to $49,999 | 437 | 14.8% |
| $50,000 to $74,999 | 228 | 7.7% |
| $75,000 to $99,999 | 83 | 2.8% |
| $100,000 to $149,999 | 18 | 0.6% |
| $150,000 to $199,999 | 0 | 0.0% |
| $200,000+ | 0 | 0.0% |
Household Income by Householder Age in Sabana Seca
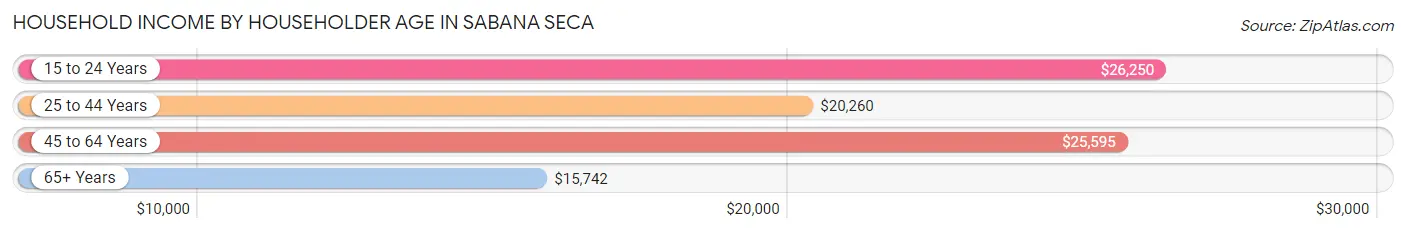
The median household income in Sabana Seca is $21,178, with the highest median household income of $26,250 found in the 15 to 24 years age bracket for the primary householder. A total of 42 households (1.4%) fall into this category. Meanwhile, the 65+ years age bracket for the primary householder has the lowest median household income of $15,742, with 1,274 households (43.1%) in this group.
| Income Bracket | # Households | Median Income |
| 15 to 24 Years | 42 (1.4%) | $26,250 |
| 25 to 44 Years | 430 (14.5%) | $20,260 |
| 45 to 64 Years | 1,210 (40.9%) | $25,595 |
| 65+ Years | 1,274 (43.1%) | $15,742 |
| Total | 2,956 (100.0%) | $21,178 |
Poverty in Sabana Seca
Income Below Poverty by Sex and Age in Sabana Seca
With 39.7% poverty level for males and 46.6% for females among the residents of Sabana Seca, 5 year old males and 16 and 17 year old females are the most vulnerable to poverty, with 24 males (100.0%) and 26 females (100.0%) in their respective age groups living below the poverty level.
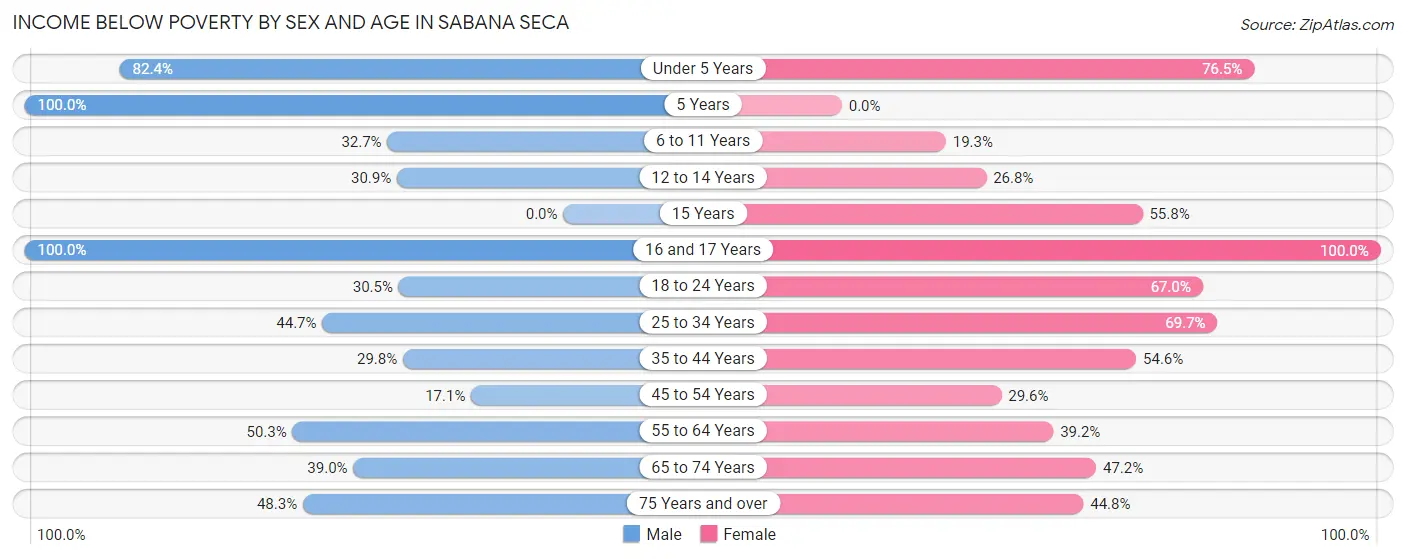
| Age Bracket | Male | Female |
| Under 5 Years | 84 (82.4%) | 62 (76.5%) |
| 5 Years | 24 (100.0%) | 0 (0.0%) |
| 6 to 11 Years | 80 (32.7%) | 22 (19.3%) |
| 12 to 14 Years | 46 (30.9%) | 26 (26.8%) |
| 15 Years | 0 (0.0%) | 48 (55.8%) |
| 16 and 17 Years | 76 (100.0%) | 26 (100.0%) |
| 18 to 24 Years | 124 (30.5%) | 280 (67.0%) |
| 25 to 34 Years | 229 (44.7%) | 221 (69.7%) |
| 35 to 44 Years | 100 (29.8%) | 183 (54.6%) |
| 45 to 54 Years | 85 (17.1%) | 193 (29.6%) |
| 55 to 64 Years | 279 (50.3%) | 279 (39.2%) |
| 65 to 74 Years | 205 (39.0%) | 244 (47.2%) |
| 75 Years and over | 159 (48.3%) | 282 (44.8%) |
| Total | 1,491 (39.7%) | 1,866 (46.6%) |
Income Above Poverty by Sex and Age in Sabana Seca
According to the poverty statistics in Sabana Seca, males aged 45 to 54 years and females aged 5 years are the age groups that are most secure financially, with 82.9% of males and 100.0% of females in these age groups living above the poverty line.
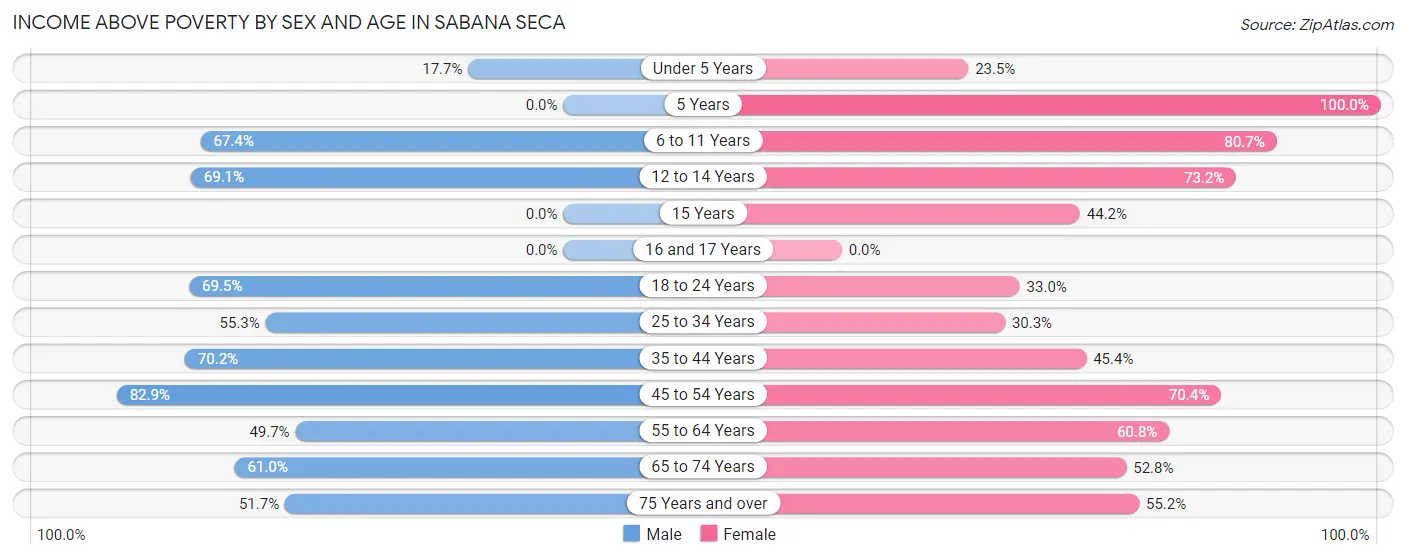
| Age Bracket | Male | Female |
| Under 5 Years | 18 (17.6%) | 19 (23.5%) |
| 5 Years | 0 (0.0%) | 19 (100.0%) |
| 6 to 11 Years | 165 (67.3%) | 92 (80.7%) |
| 12 to 14 Years | 103 (69.1%) | 71 (73.2%) |
| 15 Years | 0 (0.0%) | 38 (44.2%) |
| 16 and 17 Years | 0 (0.0%) | 0 (0.0%) |
| 18 to 24 Years | 282 (69.5%) | 138 (33.0%) |
| 25 to 34 Years | 283 (55.3%) | 96 (30.3%) |
| 35 to 44 Years | 236 (70.2%) | 152 (45.4%) |
| 45 to 54 Years | 412 (82.9%) | 459 (70.4%) |
| 55 to 64 Years | 276 (49.7%) | 432 (60.8%) |
| 65 to 74 Years | 321 (61.0%) | 273 (52.8%) |
| 75 Years and over | 170 (51.7%) | 347 (55.2%) |
| Total | 2,266 (60.3%) | 2,136 (53.4%) |
Income Below Poverty Among Married-Couple Families in Sabana Seca
The poverty statistics for married-couple families in Sabana Seca show that 30.6% or 265 of the total 866 families live below the poverty line. Families with no children have the highest poverty rate of 32.0%, comprising of 223 families. On the other hand, families with 3 or 4 children have the lowest poverty rate of 0.0%, which includes 0 families.
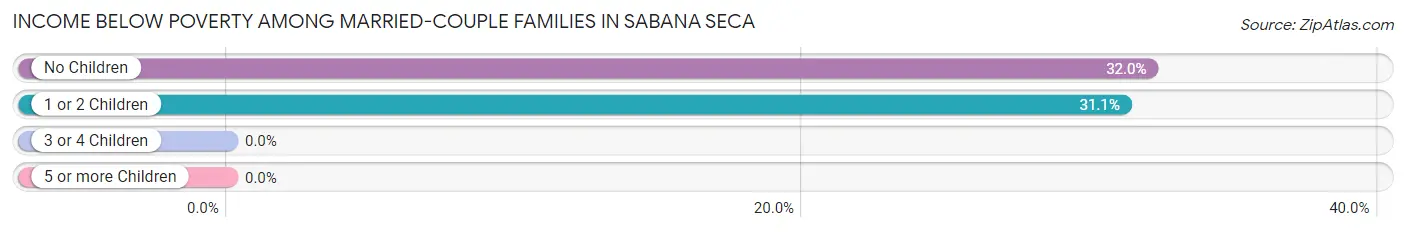
| Children | Above Poverty | Below Poverty |
| No Children | 473 (68.0%) | 223 (32.0%) |
| 1 or 2 Children | 93 (68.9%) | 42 (31.1%) |
| 3 or 4 Children | 14 (100.0%) | 0 (0.0%) |
| 5 or more Children | 21 (100.0%) | 0 (0.0%) |
| Total | 601 (69.4%) | 265 (30.6%) |
Income Below Poverty Among Single-Parent Households in Sabana Seca
According to the poverty data in Sabana Seca, 22.0% or 65 single-father households and 55.9% or 414 single-mother households are living below the poverty line. Among single-father households, those with 1 or 2 children have the highest poverty rate, with 18 households (62.1%) experiencing poverty. Likewise, among single-mother households, those with 3 or 4 children have the highest poverty rate, with 22 households (100.0%) falling below the poverty line.
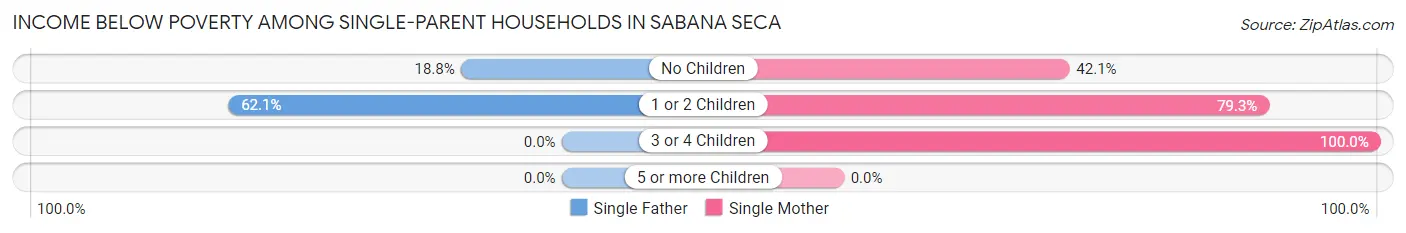
| Children | Single Father | Single Mother |
| No Children | 47 (18.8%) | 201 (42.0%) |
| 1 or 2 Children | 18 (62.1%) | 191 (79.2%) |
| 3 or 4 Children | 0 (0.0%) | 22 (100.0%) |
| 5 or more Children | 0 (0.0%) | 0 (0.0%) |
| Total | 65 (22.0%) | 414 (55.9%) |
Income Below Poverty Among Married-Couple vs Single-Parent Households in Sabana Seca
The poverty data for Sabana Seca shows that 265 of the married-couple family households (30.6%) and 479 of the single-parent households (46.2%) are living below the poverty level. Within the married-couple family households, those with no children have the highest poverty rate, with 223 households (32.0%) falling below the poverty line. Among the single-parent households, those with 1 or 2 children have the highest poverty rate, with 209 household (77.4%) living below poverty.
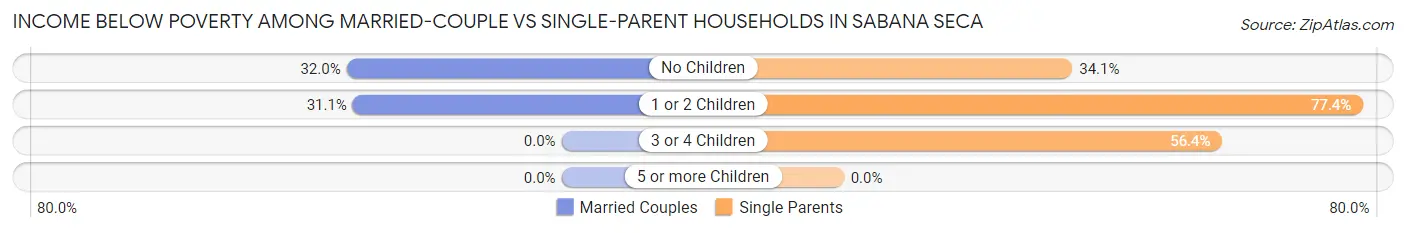
| Children | Married-Couple Families | Single-Parent Households |
| No Children | 223 (32.0%) | 248 (34.1%) |
| 1 or 2 Children | 42 (31.1%) | 209 (77.4%) |
| 3 or 4 Children | 0 (0.0%) | 22 (56.4%) |
| 5 or more Children | 0 (0.0%) | 0 (0.0%) |
| Total | 265 (30.6%) | 479 (46.2%) |
Race in Sabana Seca
The most populous races in Sabana Seca are Hispanic or Latino (7,768 | 100.0%), Some other Race (3,167 | 40.8%), and White / Caucasian (2,237 | 28.8%).
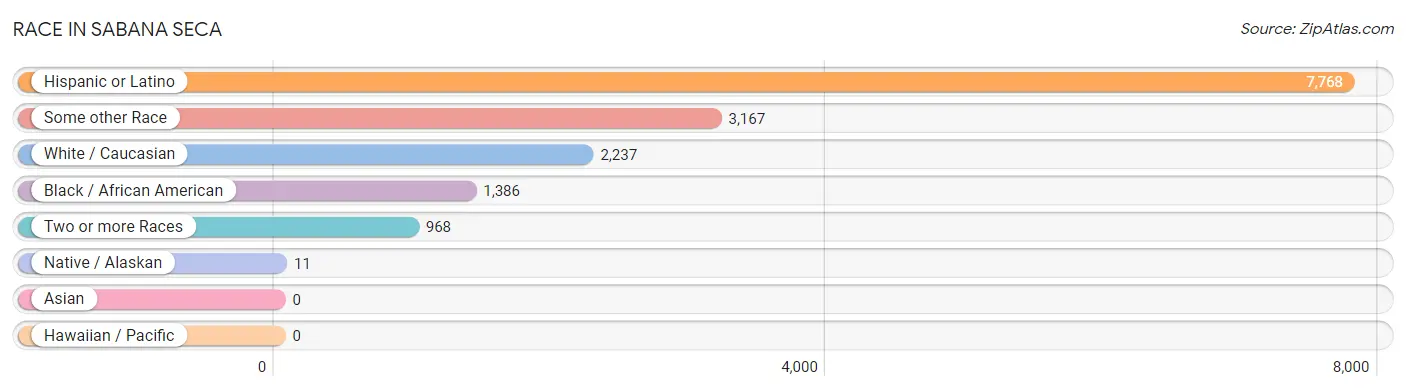
| Race | # Population | % Population |
| Asian | 0 | 0.0% |
| Black / African American | 1,386 | 17.8% |
| Hawaiian / Pacific | 0 | 0.0% |
| Hispanic or Latino | 7,768 | 100.0% |
| Native / Alaskan | 11 | 0.1% |
| White / Caucasian | 2,237 | 28.8% |
| Two or more Races | 968 | 12.5% |
| Some other Race | 3,167 | 40.8% |
| Total | 7,769 | 100.0% |
Ancestry in Sabana Seca
The most populous ancestries reported in Sabana Seca are Puerto Rican (7,490 | 96.4%), Dominican (229 | 2.9%), Iranian (39 | 0.5%), South American (24 | 0.3%), and Mexican (20 | 0.3%), together accounting for 100.4% of all Sabana Seca residents.
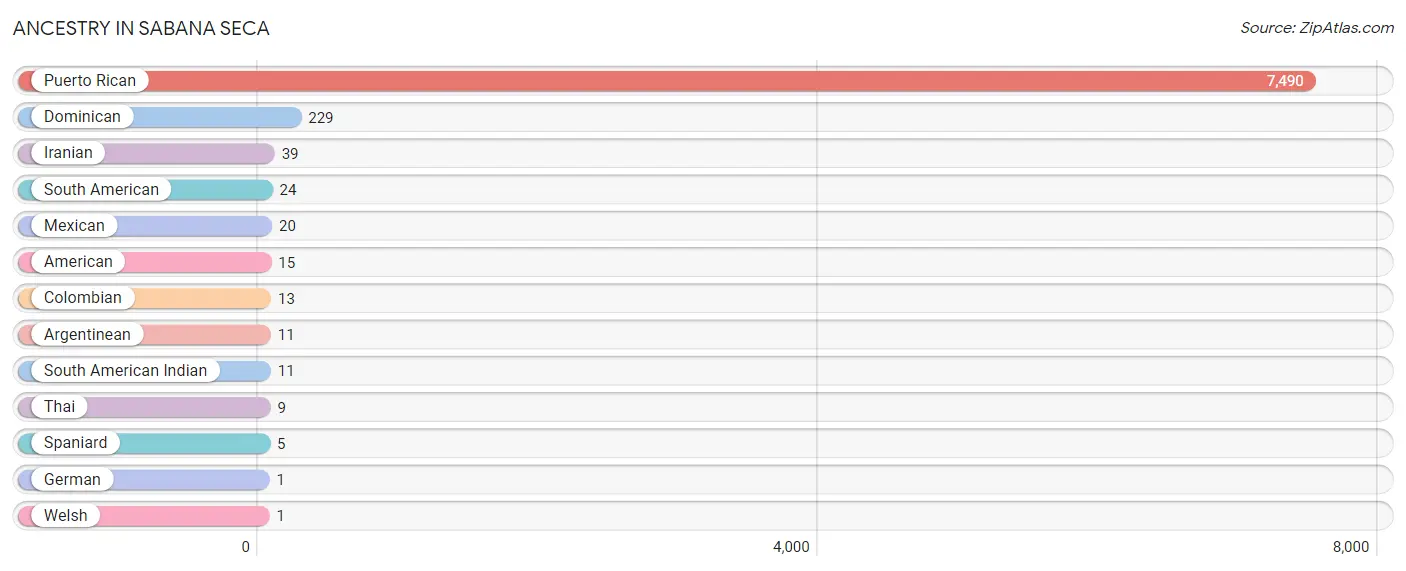
| Ancestry | # Population | % Population |
| American | 15 | 0.2% |
| Argentinean | 11 | 0.1% |
| Colombian | 13 | 0.2% |
| Dominican | 229 | 2.9% |
| German | 1 | 0.0% |
| Iranian | 39 | 0.5% |
| Mexican | 20 | 0.3% |
| Puerto Rican | 7,490 | 96.4% |
| South American | 24 | 0.3% |
| South American Indian | 11 | 0.1% |
| Spaniard | 5 | 0.1% |
| Thai | 9 | 0.1% |
| Welsh | 1 | 0.0% | View All 13 Rows |
Immigrants in Sabana Seca

| Immigration Origin | # Population | % Population | View All 0 Rows |
Sex and Age in Sabana Seca
Sex and Age in Sabana Seca
The most populous age groups in Sabana Seca are 20 to 24 Years (348 | 9.3%) for men and 60 to 64 Years (511 | 12.7%) for women.
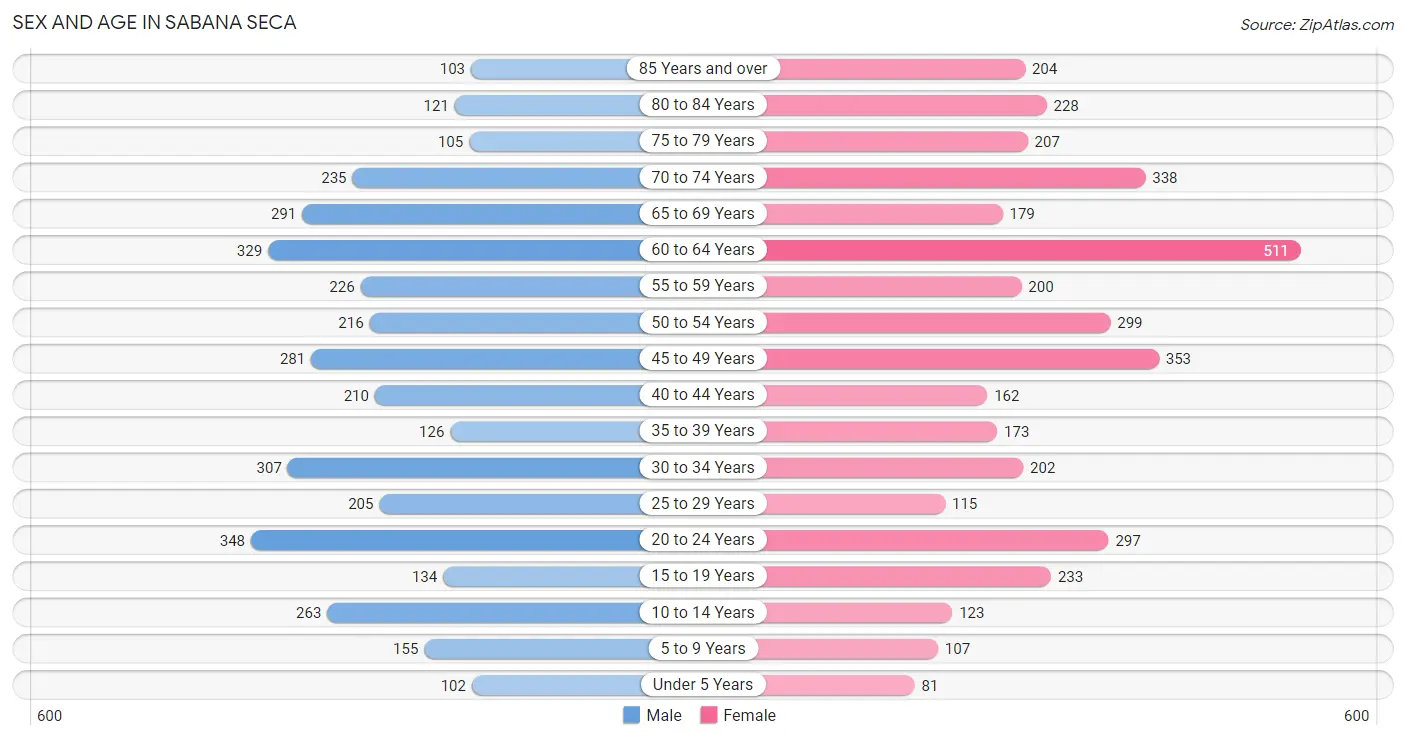
| Age Bracket | Male | Female |
| Under 5 Years | 102 (2.7%) | 81 (2.0%) |
| 5 to 9 Years | 155 (4.1%) | 107 (2.7%) |
| 10 to 14 Years | 263 (7.0%) | 123 (3.1%) |
| 15 to 19 Years | 134 (3.6%) | 233 (5.8%) |
| 20 to 24 Years | 348 (9.3%) | 297 (7.4%) |
| 25 to 29 Years | 205 (5.5%) | 115 (2.9%) |
| 30 to 34 Years | 307 (8.2%) | 202 (5.0%) |
| 35 to 39 Years | 126 (3.4%) | 173 (4.3%) |
| 40 to 44 Years | 210 (5.6%) | 162 (4.0%) |
| 45 to 49 Years | 281 (7.5%) | 353 (8.8%) |
| 50 to 54 Years | 216 (5.8%) | 299 (7.4%) |
| 55 to 59 Years | 226 (6.0%) | 200 (5.0%) |
| 60 to 64 Years | 329 (8.8%) | 511 (12.7%) |
| 65 to 69 Years | 291 (7.7%) | 179 (4.5%) |
| 70 to 74 Years | 235 (6.2%) | 338 (8.4%) |
| 75 to 79 Years | 105 (2.8%) | 207 (5.2%) |
| 80 to 84 Years | 121 (3.2%) | 228 (5.7%) |
| 85 Years and over | 103 (2.7%) | 204 (5.1%) |
| Total | 3,757 (100.0%) | 4,012 (100.0%) |
Families and Households in Sabana Seca
Median Family Size in Sabana Seca
The median family size in Sabana Seca is 3.21 persons per family, with married-couple families (866 | 45.5%) accounting for the largest median family size of 3.35 persons per family. On the other hand, single male/father families (296 | 15.5%) represent the smallest median family size with 2.66 persons per family.
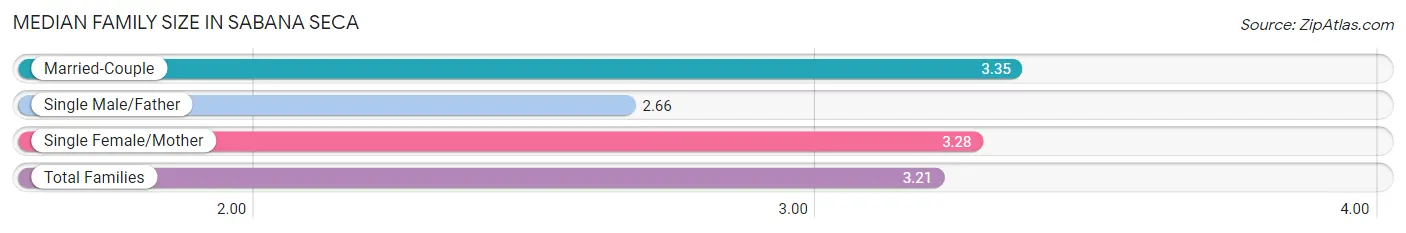
| Family Type | # Families | Family Size |
| Married-Couple | 866 (45.5%) | 3.35 |
| Single Male/Father | 296 (15.5%) | 2.66 |
| Single Female/Mother | 741 (38.9%) | 3.28 |
| Total Families | 1,903 (100.0%) | 3.21 |
Median Household Size in Sabana Seca
The median household size in Sabana Seca is 2.62 persons per household, with single female/mother households (741 | 25.1%) accounting for the largest median household size of 3.45 persons per household. non-family households (1,053 | 35.6%) represent the smallest median household size with 1.26 persons per household.
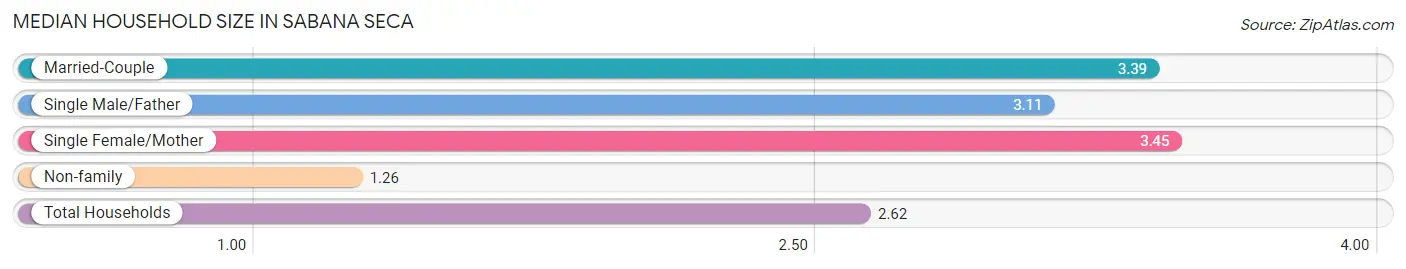
| Household Type | # Households | Household Size |
| Married-Couple | 866 (29.3%) | 3.39 |
| Single Male/Father | 296 (10.0%) | 3.11 |
| Single Female/Mother | 741 (25.1%) | 3.45 |
| Non-family | 1,053 (35.6%) | 1.26 |
| Total Households | 2,956 (100.0%) | 2.62 |
Household Size by Marriage Status in Sabana Seca
Out of a total of 2,956 households in Sabana Seca, 1,903 (64.4%) are family households, while 1,053 (35.6%) are nonfamily households. The most numerous type of family households are 2-person households, comprising 1,055, and the most common type of nonfamily households are 1-person households, comprising 836.
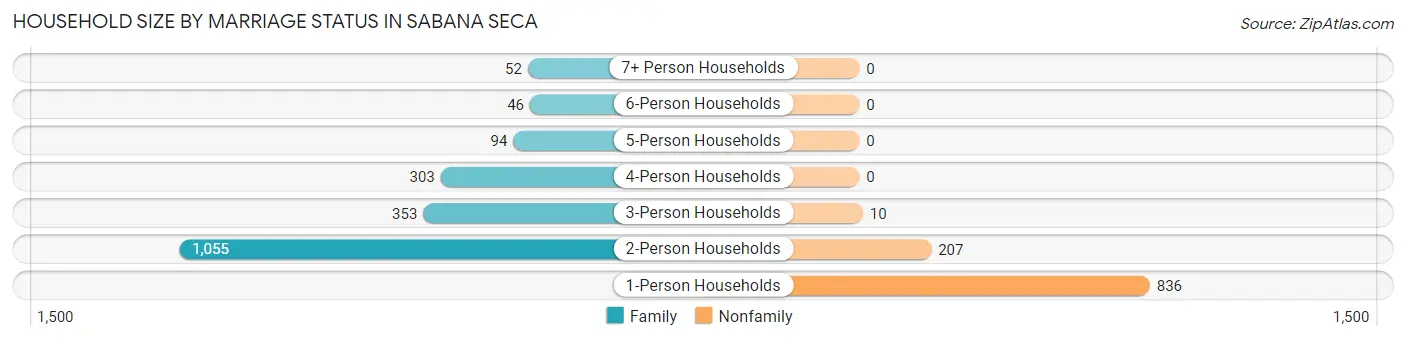
| Household Size | Family Households | Nonfamily Households |
| 1-Person Households | - | 836 (28.3%) |
| 2-Person Households | 1,055 (35.7%) | 207 (7.0%) |
| 3-Person Households | 353 (11.9%) | 10 (0.3%) |
| 4-Person Households | 303 (10.2%) | 0 (0.0%) |
| 5-Person Households | 94 (3.2%) | 0 (0.0%) |
| 6-Person Households | 46 (1.6%) | 0 (0.0%) |
| 7+ Person Households | 52 (1.8%) | 0 (0.0%) |
| Total | 1,903 (64.4%) | 1,053 (35.6%) |
Female Fertility in Sabana Seca
Fertility by Age in Sabana Seca
Average fertility rate in Sabana Seca is 37.0 births per 1,000 women. Women in the age bracket of 15 to 19 years have the highest fertility rate with 146.0 births per 1,000 women. Women in the age bracket of 15 to 19 years acount for 58.6% of all women with births.
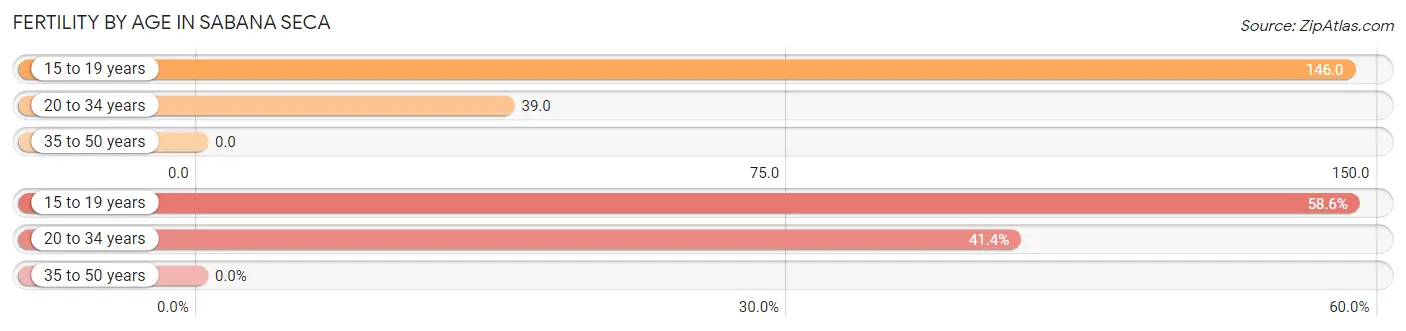
| Age Bracket | Women with Births | Births / 1,000 Women |
| 15 to 19 years | 34 (58.6%) | 146.0 |
| 20 to 34 years | 24 (41.4%) | 39.0 |
| 35 to 50 years | 0 (0.0%) | 0.0 |
| Total | 58 (100.0%) | 37.0 |
Fertility by Age by Marriage Status in Sabana Seca
17.2% of women with births (58) in Sabana Seca are married. The highest percentage of unmarried women with births falls into 15 to 19 years age bracket with 100.0% of them unmarried at the time of birth, while the lowest percentage of unmarried women with births belong to 20 to 34 years age bracket with 58.3% of them unmarried.
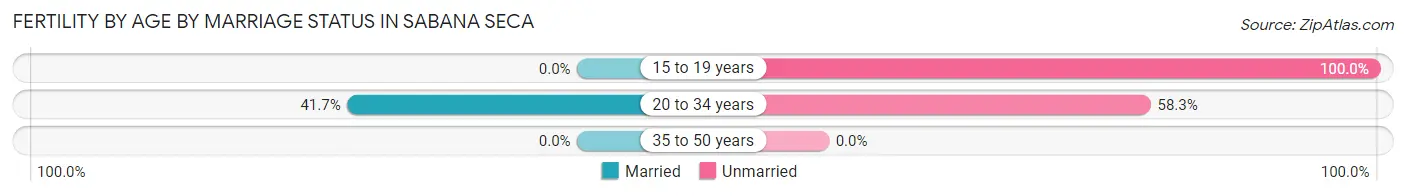
| Age Bracket | Married | Unmarried |
| 15 to 19 years | 0 (0.0%) | 34 (100.0%) |
| 20 to 34 years | 10 (41.7%) | 14 (58.3%) |
| 35 to 50 years | 0 (0.0%) | 0 (0.0%) |
| Total | 10 (17.2%) | 48 (82.8%) |
Fertility by Education in Sabana Seca
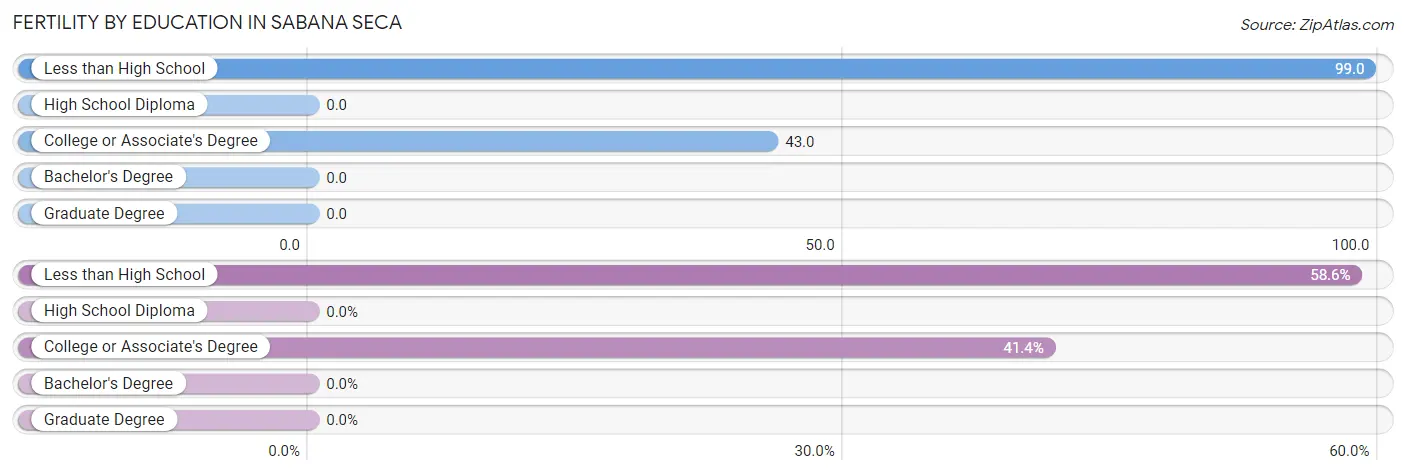
| Educational Attainment | Women with Births | Births / 1,000 Women |
| Less than High School | 34 (58.6%) | 99.0 |
| High School Diploma | 0 (0.0%) | 0.0 |
| College or Associate's Degree | 24 (41.4%) | 43.0 |
| Bachelor's Degree | 0 (0.0%) | 0.0 |
| Graduate Degree | 0 (0.0%) | 0.0 |
| Total | 58 (100.0%) | 37.0 |
Fertility by Education by Marriage Status in Sabana Seca
82.8% of women with births in Sabana Seca are unmarried. Women with the educational attainment of college or associate's degree are most likely to be married with 41.7% of them married at childbirth, while women with the educational attainment of less than high school are least likely to be married with 100.0% of them unmarried at childbirth.
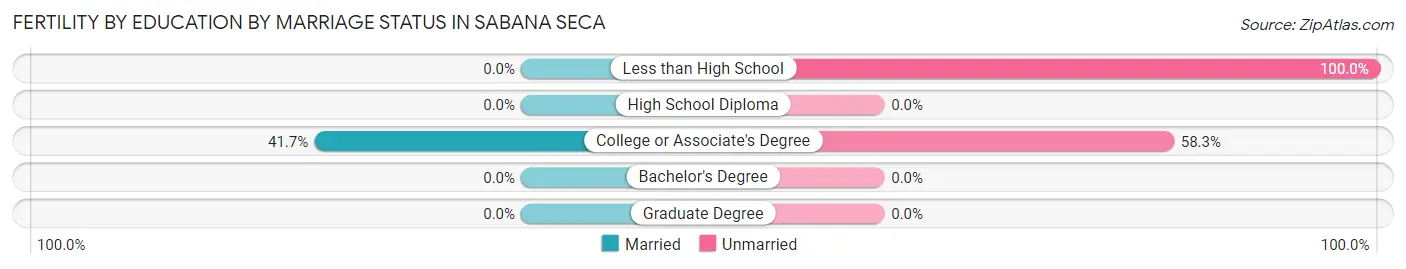
| Educational Attainment | Married | Unmarried |
| Less than High School | 0 (0.0%) | 34 (100.0%) |
| High School Diploma | 0 (0.0%) | 0 (0.0%) |
| College or Associate's Degree | 10 (41.7%) | 14 (58.3%) |
| Bachelor's Degree | 0 (0.0%) | 0 (0.0%) |
| Graduate Degree | 0 (0.0%) | 0 (0.0%) |
| Total | 10 (17.2%) | 48 (82.8%) |
Employment Characteristics in Sabana Seca
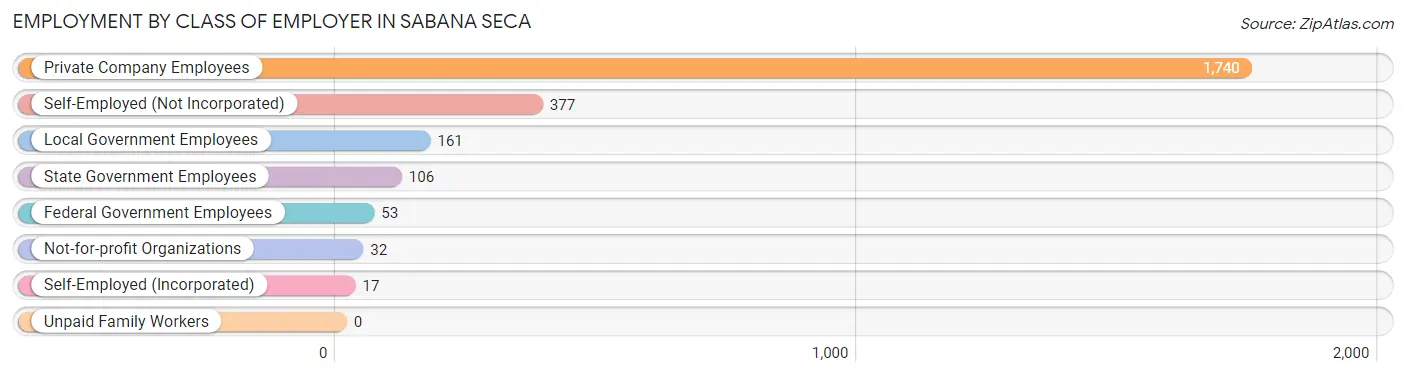
Employment by Class of Employer in Sabana Seca
Among the 2,486 employed individuals in Sabana Seca, private company employees (1,740 | 70.0%), self-employed (not incorporated) (377 | 15.2%), and local government employees (161 | 6.5%) make up the most common classes of employment.
| Employer Class | # Employees | % Employees |
| Private Company Employees | 1,740 | 70.0% |
| Self-Employed (Incorporated) | 17 | 0.7% |
| Self-Employed (Not Incorporated) | 377 | 15.2% |
| Not-for-profit Organizations | 32 | 1.3% |
| Local Government Employees | 161 | 6.5% |
| State Government Employees | 106 | 4.3% |
| Federal Government Employees | 53 | 2.1% |
| Unpaid Family Workers | 0 | 0.0% |
| Total | 2,486 | 100.0% |
Employment Status by Age in Sabana Seca
According to the labor force statistics for Sabana Seca, out of the total population over 16 years of age (6,852), 46.7% or 3,200 individuals are in the labor force, with 15.4% or 493 of them unemployed. The age group with the highest labor force participation rate is 20 to 24 years, with 84.3% or 544 individuals in the labor force. Within the labor force, the 16 to 19 years age range has the highest percentage of unemployed individuals, with 73.9% or 82 of them being unemployed.
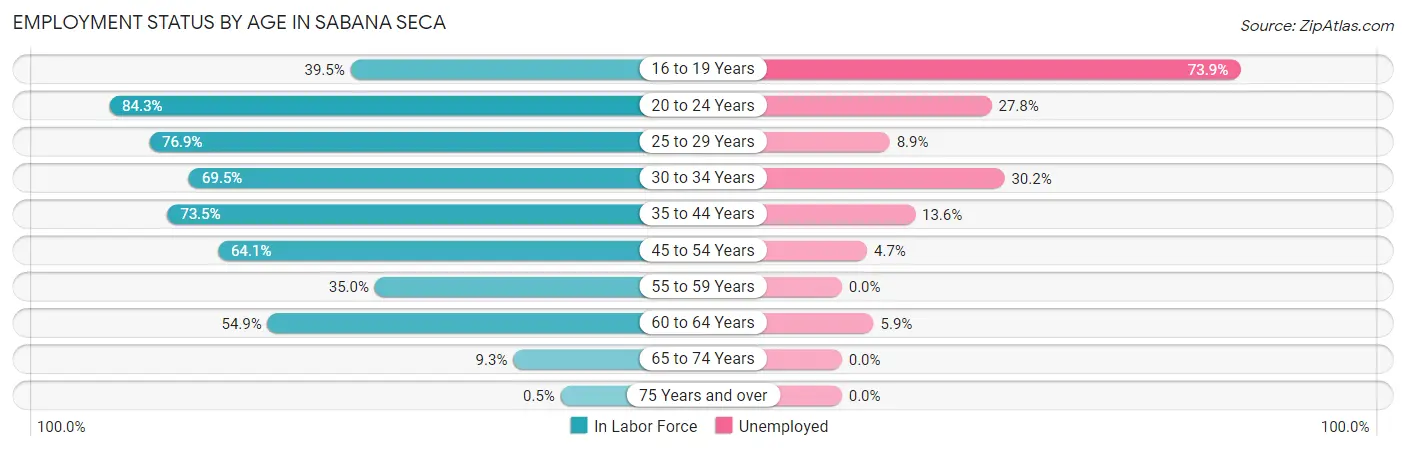
| Age Bracket | In Labor Force | Unemployed |
| 16 to 19 Years | 111 (39.5%) | 82 (73.9%) |
| 20 to 24 Years | 544 (84.3%) | 151 (27.8%) |
| 25 to 29 Years | 246 (76.9%) | 22 (8.9%) |
| 30 to 34 Years | 354 (69.5%) | 107 (30.2%) |
| 35 to 44 Years | 493 (73.5%) | 67 (13.6%) |
| 45 to 54 Years | 737 (64.1%) | 35 (4.7%) |
| 55 to 59 Years | 149 (35.0%) | 0 (0.0%) |
| 60 to 64 Years | 461 (54.9%) | 27 (5.9%) |
| 65 to 74 Years | 97 (9.3%) | 0 (0.0%) |
| 75 Years and over | 5 (0.5%) | 0 (0.0%) |
| Total | 3,200 (46.7%) | 493 (15.4%) |
Employment Status by Educational Attainment in Sabana Seca
According to labor force statistics for Sabana Seca, 62.3% of individuals (2,439) out of the total population between 25 and 64 years of age (3,915) are in the labor force, with 10.6% or 259 of them being unemployed. The group with the highest labor force participation rate are those with the educational attainment of bachelor's degree or higher, with 77.7% or 566 individuals in the labor force. Within the labor force, individuals with less than high school education have the highest percentage of unemployment, with 30.3% or 57 of them being unemployed.
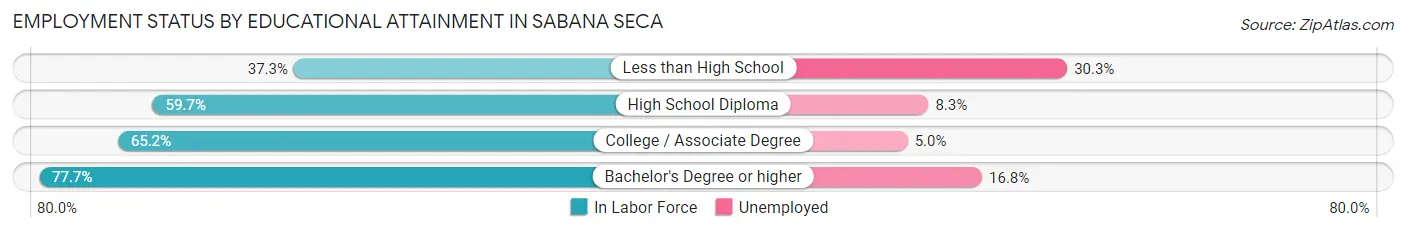
| Educational Attainment | In Labor Force | Unemployed |
| Less than High School | 188 (37.3%) | 153 (30.3%) |
| High School Diploma | 678 (59.7%) | 94 (8.3%) |
| College / Associate Degree | 1,009 (65.2%) | 77 (5.0%) |
| Bachelor's Degree or higher | 566 (77.7%) | 122 (16.8%) |
| Total | 2,439 (62.3%) | 415 (10.6%) |
Employment Occupations by Sex in Sabana Seca
Management, Business, Science and Arts Occupations
The most common Management, Business, Science and Arts occupations in Sabana Seca are Management (178 | 6.6%), Community & Social Service (93 | 3.4%), Business & Financial (62 | 2.3%), Education, Arts & Media (47 | 1.7%), and Education Instruction & Library (46 | 1.7%).
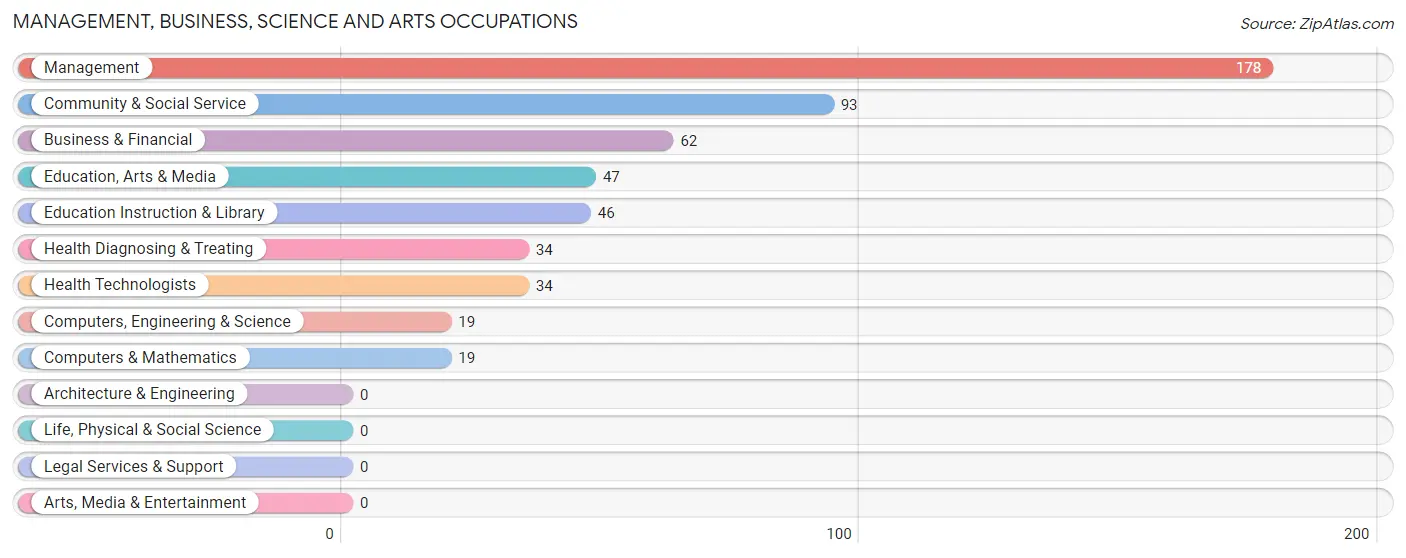
Management, Business, Science and Arts Occupations by Sex
Within the Management, Business, Science and Arts occupations in Sabana Seca, the most male-oriented occupations are Computers, Engineering & Science (100.0%), Computers & Mathematics (100.0%), and Management (94.4%), while the most female-oriented occupations are Health Diagnosing & Treating (100.0%), Health Technologists (100.0%), and Education Instruction & Library (73.9%).
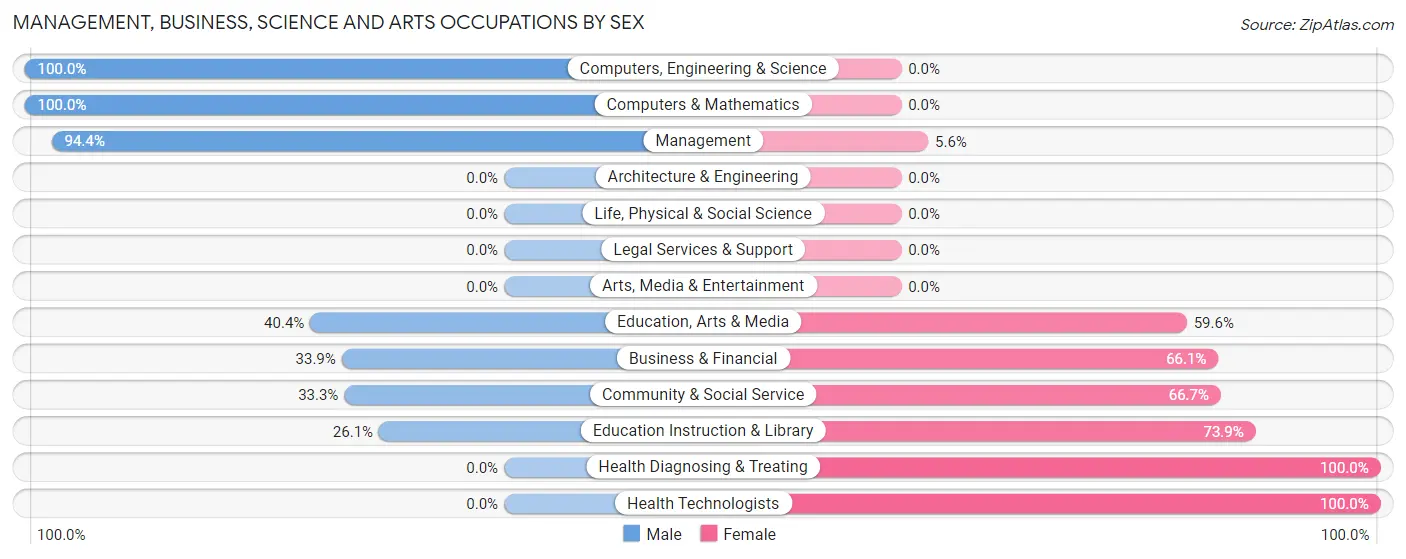
| Occupation | Male | Female |
| Management | 168 (94.4%) | 10 (5.6%) |
| Business & Financial | 21 (33.9%) | 41 (66.1%) |
| Computers, Engineering & Science | 19 (100.0%) | 0 (0.0%) |
| Computers & Mathematics | 19 (100.0%) | 0 (0.0%) |
| Architecture & Engineering | 0 (0.0%) | 0 (0.0%) |
| Life, Physical & Social Science | 0 (0.0%) | 0 (0.0%) |
| Community & Social Service | 31 (33.3%) | 62 (66.7%) |
| Education, Arts & Media | 19 (40.4%) | 28 (59.6%) |
| Legal Services & Support | 0 (0.0%) | 0 (0.0%) |
| Education Instruction & Library | 12 (26.1%) | 34 (73.9%) |
| Arts, Media & Entertainment | 0 (0.0%) | 0 (0.0%) |
| Health Diagnosing & Treating | 0 (0.0%) | 34 (100.0%) |
| Health Technologists | 0 (0.0%) | 34 (100.0%) |
| Total (Category) | 239 (61.9%) | 147 (38.1%) |
| Total (Overall) | 1,553 (57.4%) | 1,153 (42.6%) |
Services Occupations
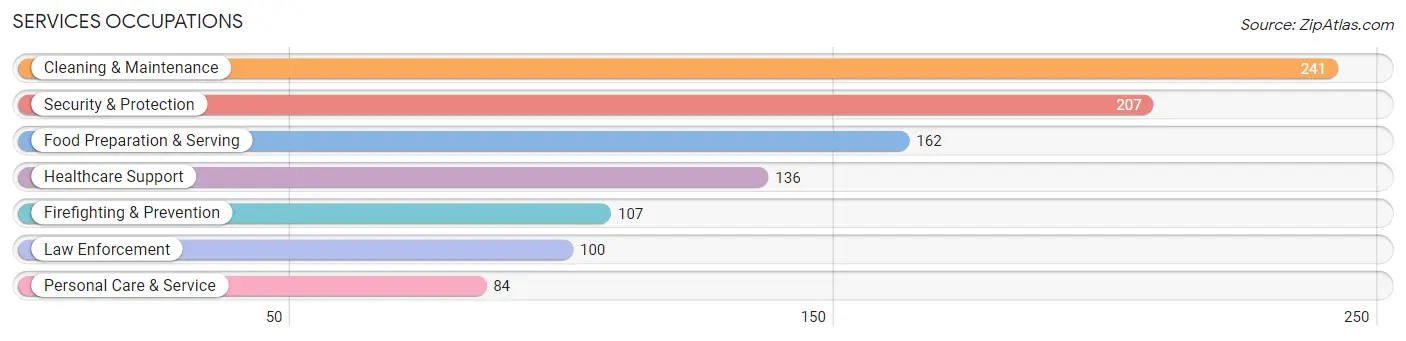
The most common Services occupations in Sabana Seca are Cleaning & Maintenance (241 | 8.9%), Security & Protection (207 | 7.6%), Food Preparation & Serving (162 | 6.0%), Healthcare Support (136 | 5.0%), and Firefighting & Prevention (107 | 4.0%).
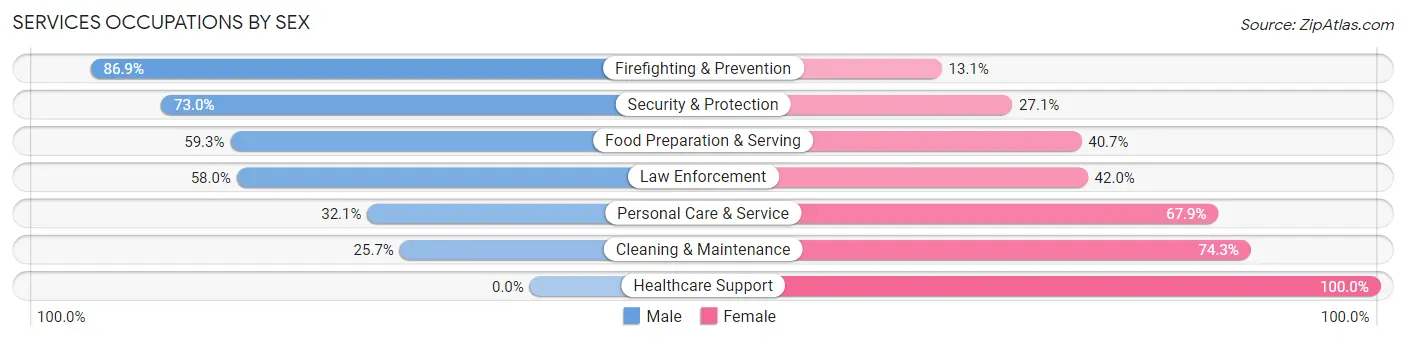
Services Occupations by Sex
Within the Services occupations in Sabana Seca, the most male-oriented occupations are Firefighting & Prevention (86.9%), Security & Protection (73.0%), and Food Preparation & Serving (59.3%), while the most female-oriented occupations are Healthcare Support (100.0%), Cleaning & Maintenance (74.3%), and Personal Care & Service (67.9%).
| Occupation | Male | Female |
| Healthcare Support | 0 (0.0%) | 136 (100.0%) |
| Security & Protection | 151 (73.0%) | 56 (27.1%) |
| Firefighting & Prevention | 93 (86.9%) | 14 (13.1%) |
| Law Enforcement | 58 (58.0%) | 42 (42.0%) |
| Food Preparation & Serving | 96 (59.3%) | 66 (40.7%) |
| Cleaning & Maintenance | 62 (25.7%) | 179 (74.3%) |
| Personal Care & Service | 27 (32.1%) | 57 (67.9%) |
| Total (Category) | 336 (40.5%) | 494 (59.5%) |
| Total (Overall) | 1,553 (57.4%) | 1,153 (42.6%) |
Sales and Office Occupations
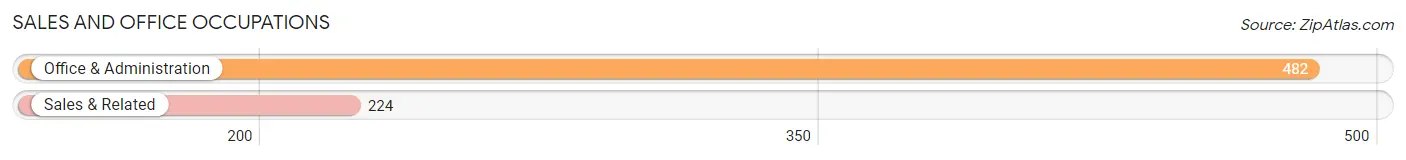
The most common Sales and Office occupations in Sabana Seca are Office & Administration (482 | 17.8%), and Sales & Related (224 | 8.3%).
Sales and Office Occupations by Sex
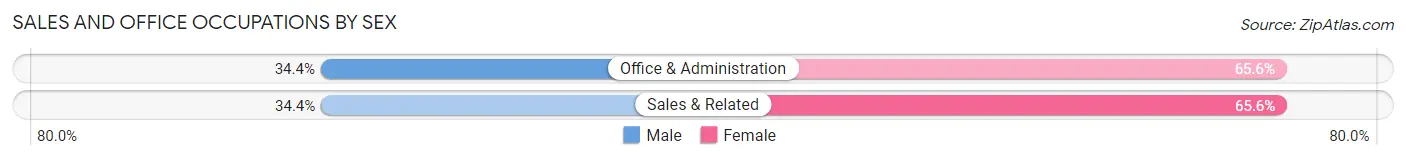
| Occupation | Male | Female |
| Sales & Related | 77 (34.4%) | 147 (65.6%) |
| Office & Administration | 166 (34.4%) | 316 (65.6%) |
| Total (Category) | 243 (34.4%) | 463 (65.6%) |
| Total (Overall) | 1,553 (57.4%) | 1,153 (42.6%) |
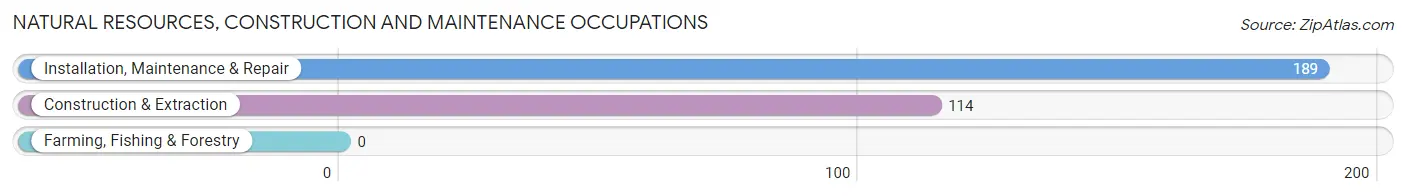
Natural Resources, Construction and Maintenance Occupations
The most common Natural Resources, Construction and Maintenance occupations in Sabana Seca are Installation, Maintenance & Repair (189 | 7.0%), and Construction & Extraction (114 | 4.2%).
Natural Resources, Construction and Maintenance Occupations by Sex
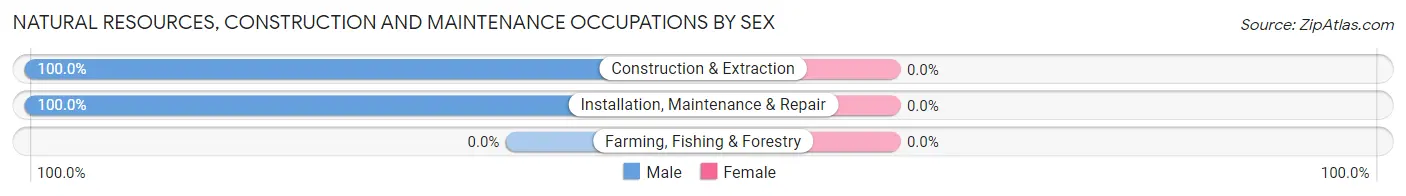
| Occupation | Male | Female |
| Farming, Fishing & Forestry | 0 (0.0%) | 0 (0.0%) |
| Construction & Extraction | 114 (100.0%) | 0 (0.0%) |
| Installation, Maintenance & Repair | 189 (100.0%) | 0 (0.0%) |
| Total (Category) | 303 (100.0%) | 0 (0.0%) |
| Total (Overall) | 1,553 (57.4%) | 1,153 (42.6%) |
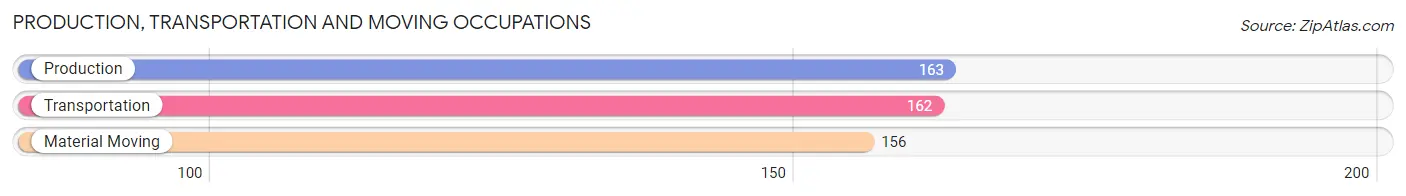
Production, Transportation and Moving Occupations
The most common Production, Transportation and Moving occupations in Sabana Seca are Production (163 | 6.0%), Transportation (162 | 6.0%), and Material Moving (156 | 5.8%).
Production, Transportation and Moving Occupations by Sex
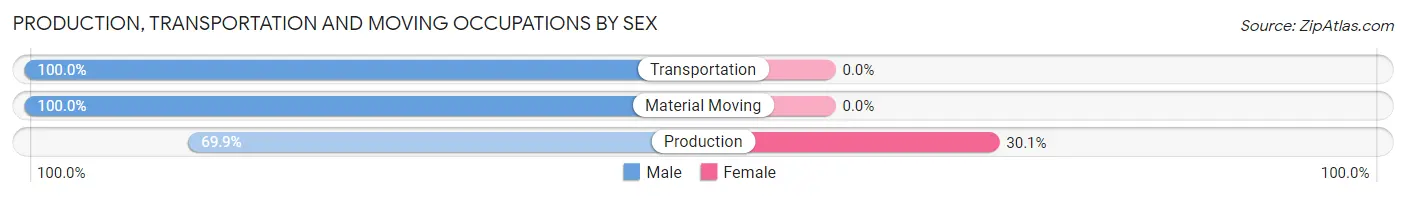
| Occupation | Male | Female |
| Production | 114 (69.9%) | 49 (30.1%) |
| Transportation | 162 (100.0%) | 0 (0.0%) |
| Material Moving | 156 (100.0%) | 0 (0.0%) |
| Total (Category) | 432 (89.8%) | 49 (10.2%) |
| Total (Overall) | 1,553 (57.4%) | 1,153 (42.6%) |
Employment Industries by Sex in Sabana Seca
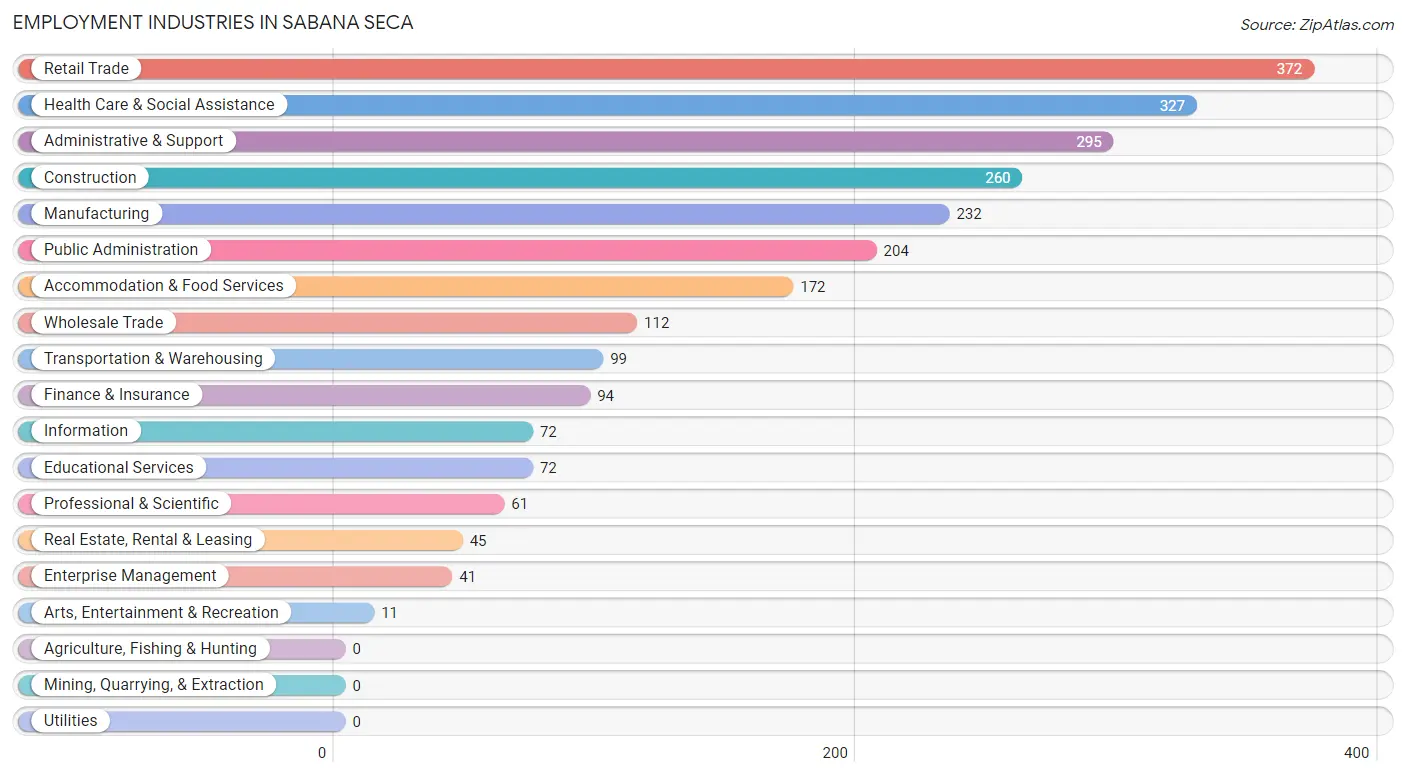
Employment Industries in Sabana Seca
The major employment industries in Sabana Seca include Retail Trade (372 | 13.8%), Health Care & Social Assistance (327 | 12.1%), Administrative & Support (295 | 10.9%), Construction (260 | 9.6%), and Manufacturing (232 | 8.6%).
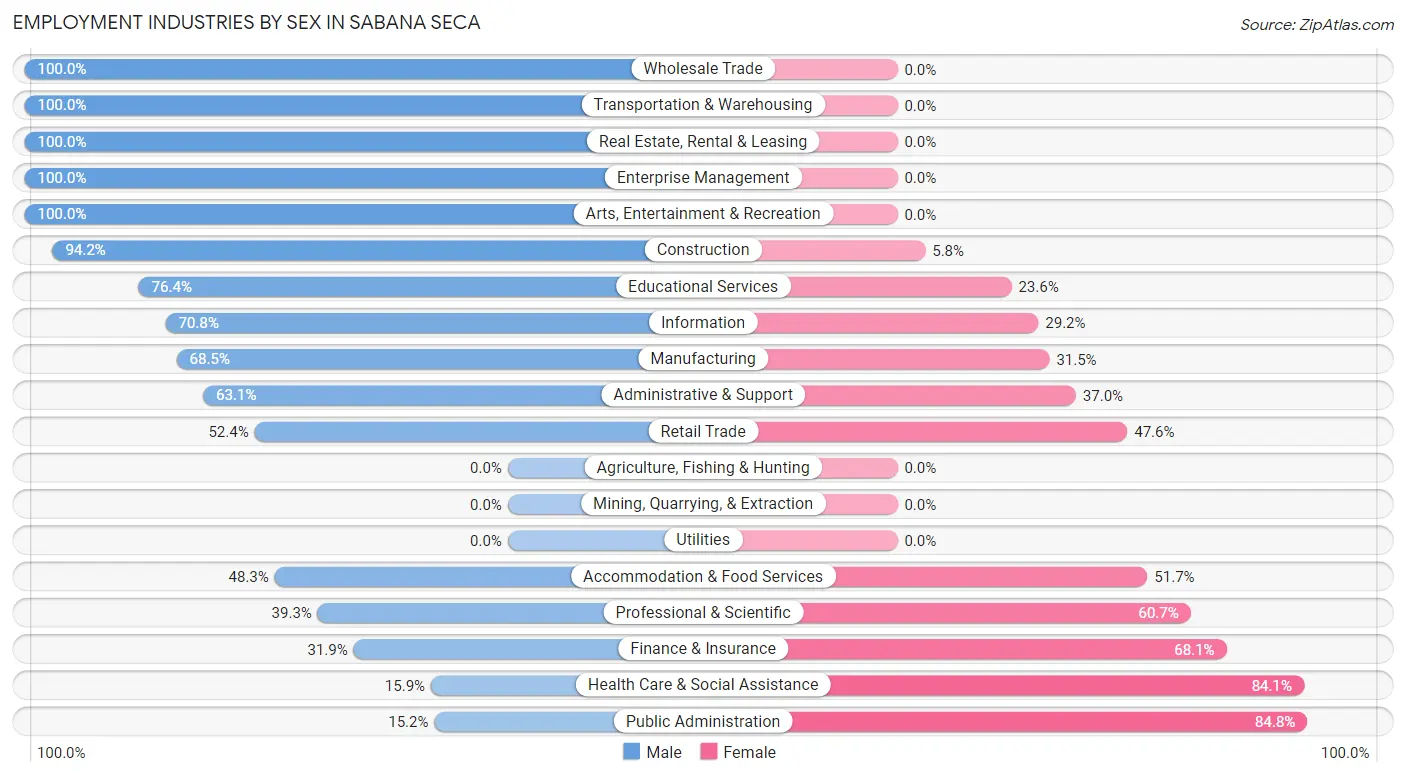
Employment Industries by Sex in Sabana Seca
The Sabana Seca industries that see more men than women are Wholesale Trade (100.0%), Transportation & Warehousing (100.0%), and Real Estate, Rental & Leasing (100.0%), whereas the industries that tend to have a higher number of women are Public Administration (84.8%), Health Care & Social Assistance (84.1%), and Finance & Insurance (68.1%).
| Industry | Male | Female |
| Agriculture, Fishing & Hunting | 0 (0.0%) | 0 (0.0%) |
| Mining, Quarrying, & Extraction | 0 (0.0%) | 0 (0.0%) |
| Construction | 245 (94.2%) | 15 (5.8%) |
| Manufacturing | 159 (68.5%) | 73 (31.5%) |
| Wholesale Trade | 112 (100.0%) | 0 (0.0%) |
| Retail Trade | 195 (52.4%) | 177 (47.6%) |
| Transportation & Warehousing | 99 (100.0%) | 0 (0.0%) |
| Utilities | 0 (0.0%) | 0 (0.0%) |
| Information | 51 (70.8%) | 21 (29.2%) |
| Finance & Insurance | 30 (31.9%) | 64 (68.1%) |
| Real Estate, Rental & Leasing | 45 (100.0%) | 0 (0.0%) |
| Professional & Scientific | 24 (39.3%) | 37 (60.7%) |
| Enterprise Management | 41 (100.0%) | 0 (0.0%) |
| Administrative & Support | 186 (63.0%) | 109 (36.9%) |
| Educational Services | 55 (76.4%) | 17 (23.6%) |
| Health Care & Social Assistance | 52 (15.9%) | 275 (84.1%) |
| Arts, Entertainment & Recreation | 11 (100.0%) | 0 (0.0%) |
| Accommodation & Food Services | 83 (48.3%) | 89 (51.7%) |
| Public Administration | 31 (15.2%) | 173 (84.8%) |
| Total | 1,553 (57.4%) | 1,153 (42.6%) |
Education in Sabana Seca
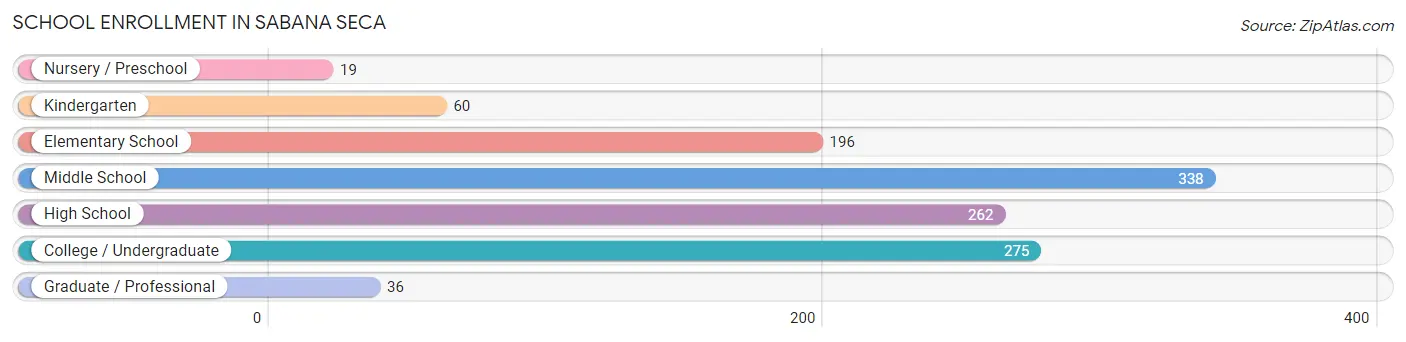
School Enrollment in Sabana Seca
The most common levels of schooling among the 1,186 students in Sabana Seca are middle school (338 | 28.5%), college / undergraduate (275 | 23.2%), and high school (262 | 22.1%).
| School Level | # Students | % Students |
| Nursery / Preschool | 19 | 1.6% |
| Kindergarten | 60 | 5.1% |
| Elementary School | 196 | 16.5% |
| Middle School | 338 | 28.5% |
| High School | 262 | 22.1% |
| College / Undergraduate | 275 | 23.2% |
| Graduate / Professional | 36 | 3.0% |
| Total | 1,186 | 100.0% |
School Enrollment by Age by Funding Source in Sabana Seca
Out of a total of 1,186 students who are enrolled in schools in Sabana Seca, 355 (29.9%) attend a private institution, while the remaining 831 (70.1%) are enrolled in public schools. The age group of 3 to 4 year olds has the highest likelihood of being enrolled in private schools, with 19 (100.0% in the age bracket) enrolled. Conversely, the age group of 10 to 14 year olds has the lowest likelihood of being enrolled in a private school, with 366 (94.8% in the age bracket) attending a public institution.
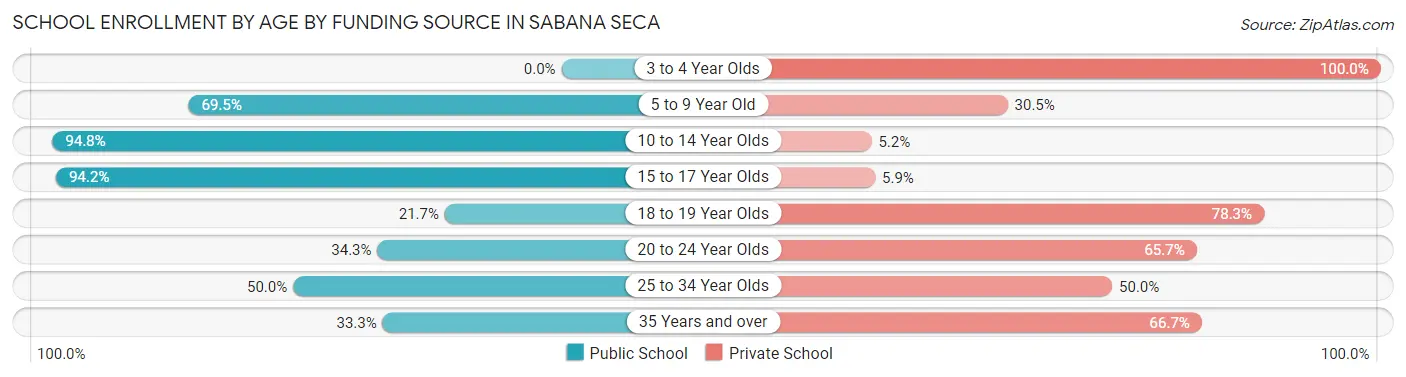
| Age Bracket | Public School | Private School |
| 3 to 4 Year Olds | 0 (0.0%) | 19 (100.0%) |
| 5 to 9 Year Old | 182 (69.5%) | 80 (30.5%) |
| 10 to 14 Year Olds | 366 (94.8%) | 20 (5.2%) |
| 15 to 17 Year Olds | 177 (94.2%) | 11 (5.9%) |
| 18 to 19 Year Olds | 20 (21.7%) | 72 (78.3%) |
| 20 to 24 Year Olds | 60 (34.3%) | 115 (65.7%) |
| 25 to 34 Year Olds | 14 (50.0%) | 14 (50.0%) |
| 35 Years and over | 12 (33.3%) | 24 (66.7%) |
| Total | 831 (70.1%) | 355 (29.9%) |
Educational Attainment by Field of Study in Sabana Seca
Business (425 | 44.5%), education (111 | 11.6%), science & technology (95 | 9.9%), computers & mathematics (88 | 9.2%), and engineering (69 | 7.2%) are the most common fields of study among 956 individuals in Sabana Seca who have obtained a bachelor's degree or higher.
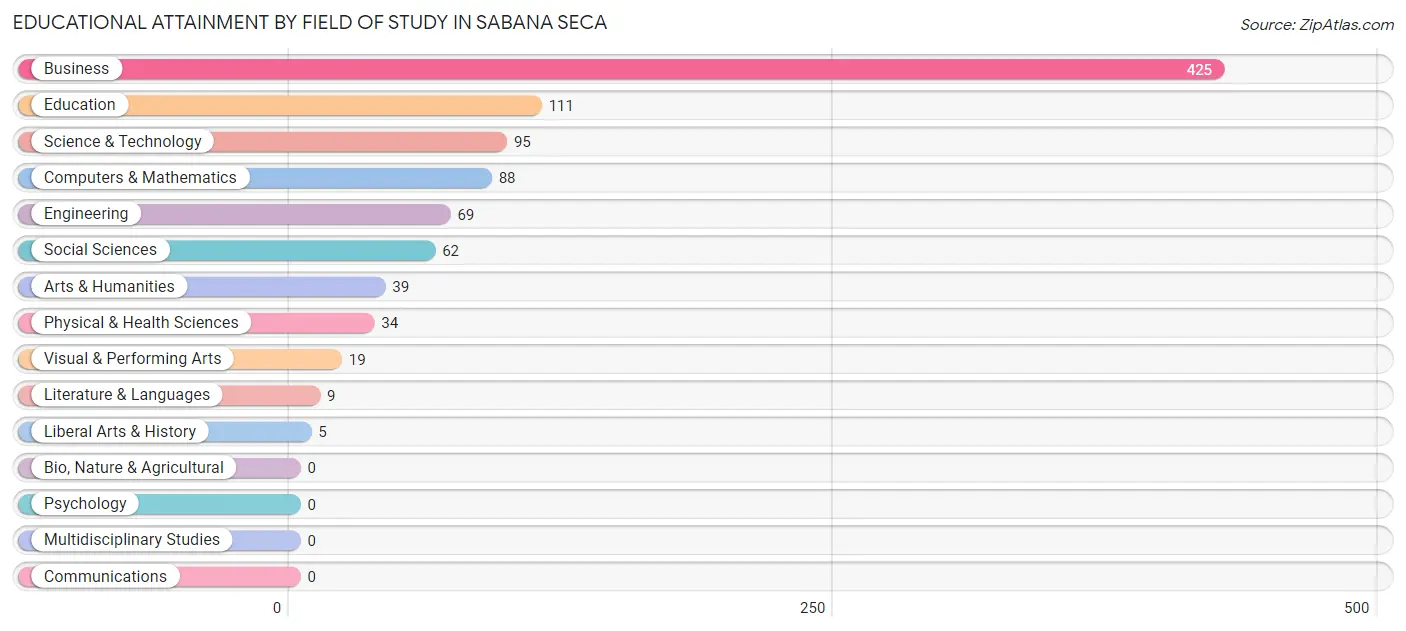
| Field of Study | # Graduates | % Graduates |
| Computers & Mathematics | 88 | 9.2% |
| Bio, Nature & Agricultural | 0 | 0.0% |
| Physical & Health Sciences | 34 | 3.6% |
| Psychology | 0 | 0.0% |
| Social Sciences | 62 | 6.5% |
| Engineering | 69 | 7.2% |
| Multidisciplinary Studies | 0 | 0.0% |
| Science & Technology | 95 | 9.9% |
| Business | 425 | 44.5% |
| Education | 111 | 11.6% |
| Literature & Languages | 9 | 0.9% |
| Liberal Arts & History | 5 | 0.5% |
| Visual & Performing Arts | 19 | 2.0% |
| Communications | 0 | 0.0% |
| Arts & Humanities | 39 | 4.1% |
| Total | 956 | 100.0% |
Transportation & Commute in Sabana Seca
Vehicle Availability by Sex in Sabana Seca
The most prevalent vehicle ownership categories in Sabana Seca are males with 2 vehicles (544, accounting for 37.3%) and females with 2 vehicles (339, making up 53.6%).
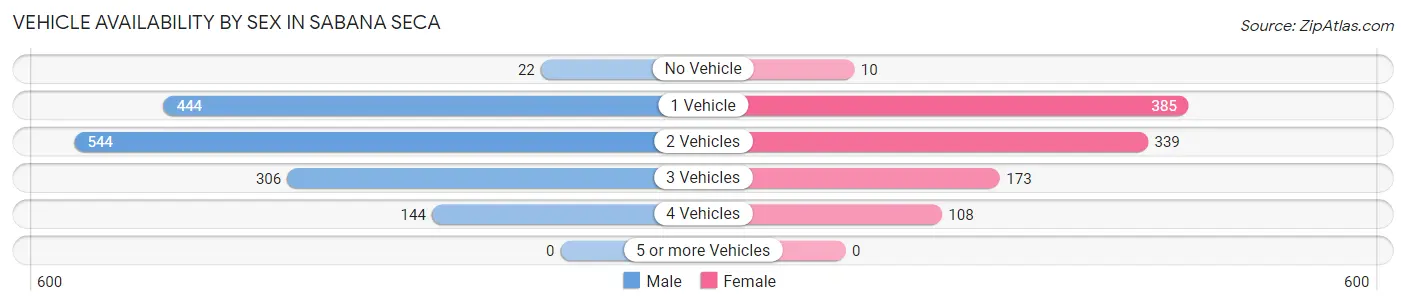
| Vehicles Available | Male | Female |
| No Vehicle | 22 (1.5%) | 10 (1.0%) |
| 1 Vehicle | 444 (30.4%) | 385 (37.9%) |
| 2 Vehicles | 544 (37.3%) | 339 (33.4%) |
| 3 Vehicles | 306 (21.0%) | 173 (17.0%) |
| 4 Vehicles | 144 (9.9%) | 108 (10.6%) |
| 5 or more Vehicles | 0 (0.0%) | 0 (0.0%) |
| Total | 1,460 (100.0%) | 1,015 (100.0%) |
Commute Time in Sabana Seca
The most frequently occuring commute durations in Sabana Seca are 30 to 34 minutes (501 commuters, 21.6%), 15 to 19 minutes (340 commuters, 14.7%), and 20 to 24 minutes (316 commuters, 13.6%).
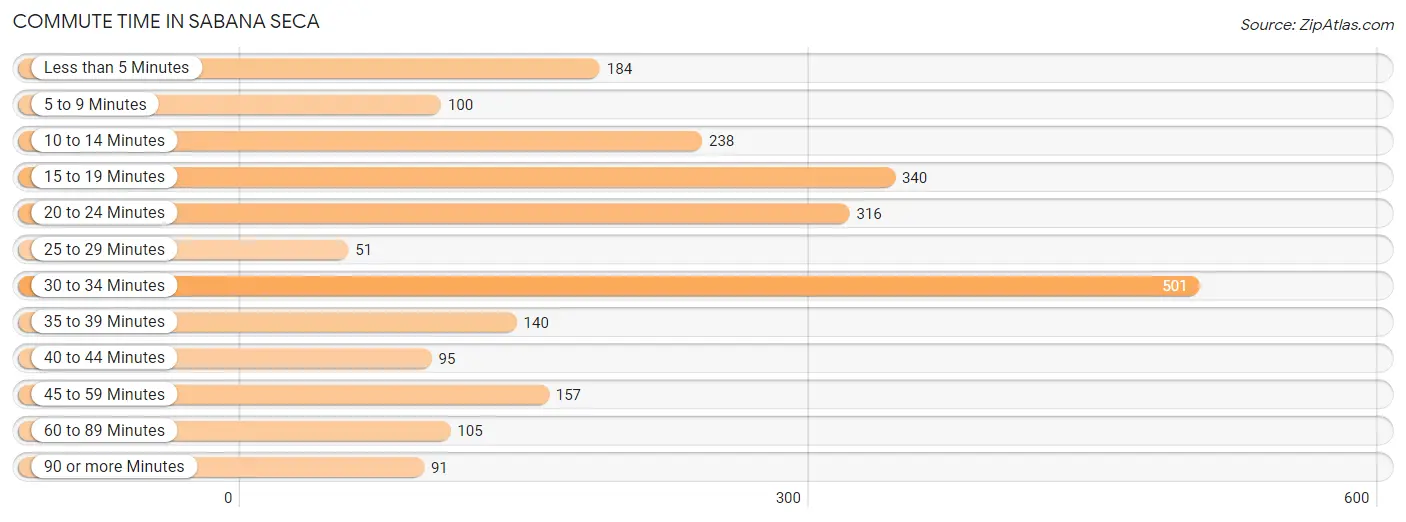
| Commute Time | # Commuters | % Commuters |
| Less than 5 Minutes | 184 | 7.9% |
| 5 to 9 Minutes | 100 | 4.3% |
| 10 to 14 Minutes | 238 | 10.3% |
| 15 to 19 Minutes | 340 | 14.7% |
| 20 to 24 Minutes | 316 | 13.6% |
| 25 to 29 Minutes | 51 | 2.2% |
| 30 to 34 Minutes | 501 | 21.6% |
| 35 to 39 Minutes | 140 | 6.0% |
| 40 to 44 Minutes | 95 | 4.1% |
| 45 to 59 Minutes | 157 | 6.8% |
| 60 to 89 Minutes | 105 | 4.5% |
| 90 or more Minutes | 91 | 3.9% |
Commute Time by Sex in Sabana Seca
The most common commute times in Sabana Seca are 30 to 34 minutes (260 commuters, 18.6%) for males and 30 to 34 minutes (241 commuters, 26.1%) for females.
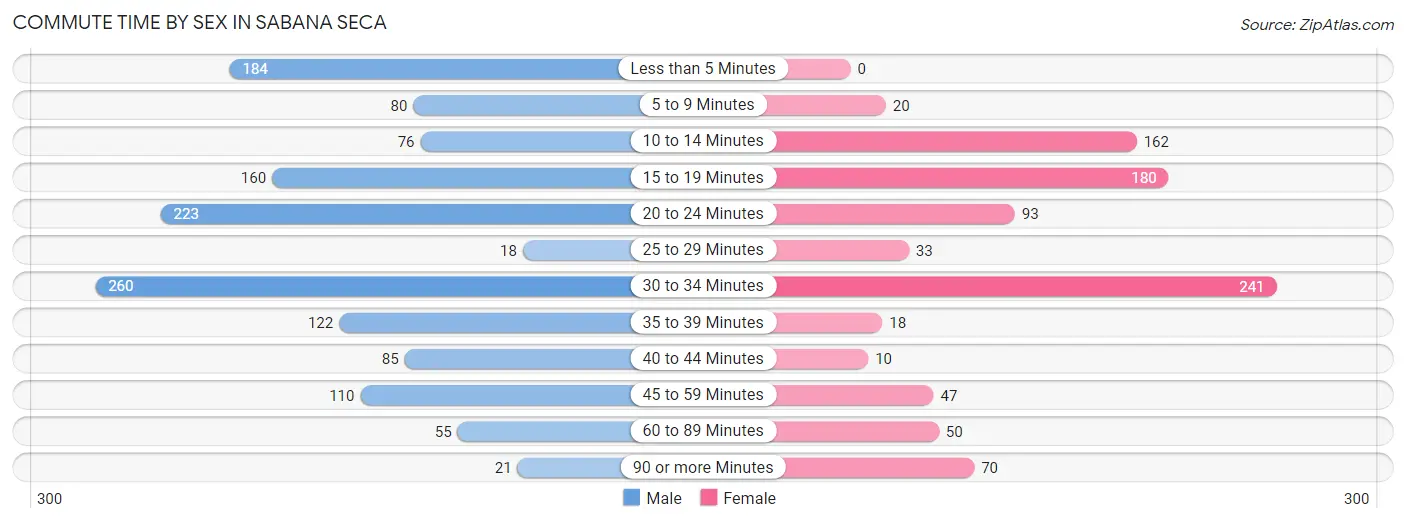
| Commute Time | Male | Female |
| Less than 5 Minutes | 184 (13.2%) | 0 (0.0%) |
| 5 to 9 Minutes | 80 (5.7%) | 20 (2.2%) |
| 10 to 14 Minutes | 76 (5.4%) | 162 (17.5%) |
| 15 to 19 Minutes | 160 (11.5%) | 180 (19.5%) |
| 20 to 24 Minutes | 223 (16.0%) | 93 (10.1%) |
| 25 to 29 Minutes | 18 (1.3%) | 33 (3.6%) |
| 30 to 34 Minutes | 260 (18.6%) | 241 (26.1%) |
| 35 to 39 Minutes | 122 (8.7%) | 18 (1.9%) |
| 40 to 44 Minutes | 85 (6.1%) | 10 (1.1%) |
| 45 to 59 Minutes | 110 (7.9%) | 47 (5.1%) |
| 60 to 89 Minutes | 55 (4.0%) | 50 (5.4%) |
| 90 or more Minutes | 21 (1.5%) | 70 (7.6%) |
Time of Departure to Work by Sex in Sabana Seca
The most frequent times of departure to work in Sabana Seca are 7:00 AM to 7:29 AM (224, 16.1%) for males and 6:00 AM to 6:29 AM (224, 24.2%) for females.
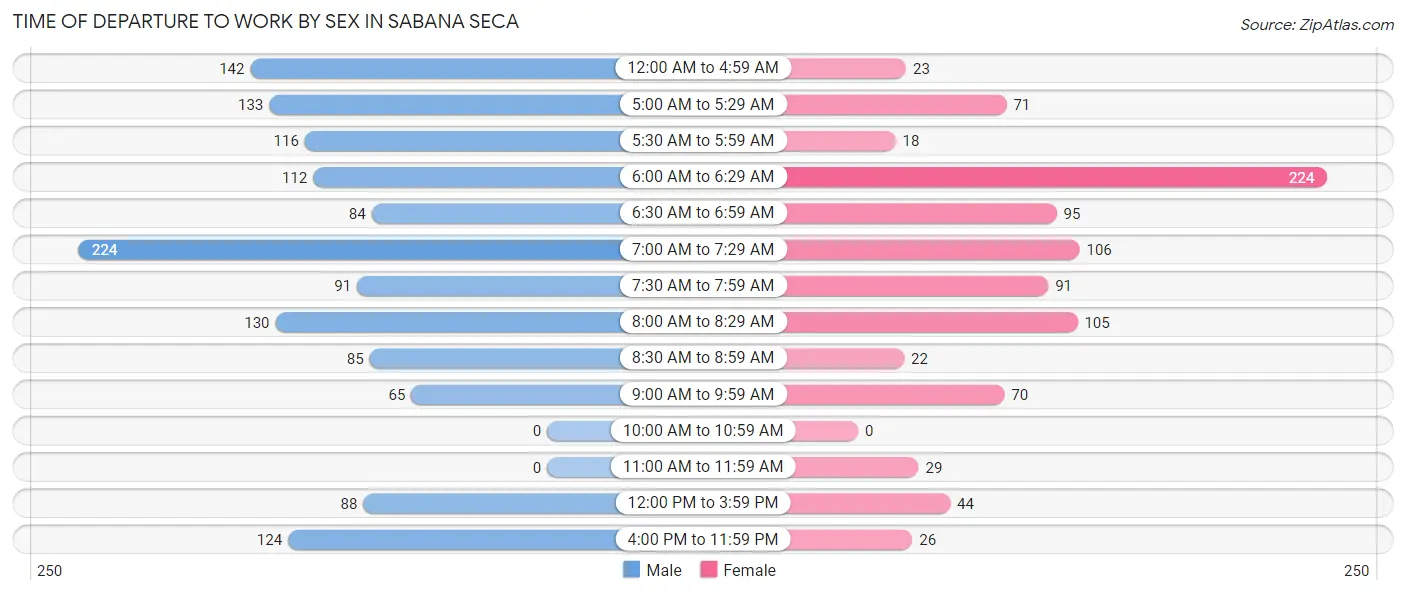
| Time of Departure | Male | Female |
| 12:00 AM to 4:59 AM | 142 (10.2%) | 23 (2.5%) |
| 5:00 AM to 5:29 AM | 133 (9.5%) | 71 (7.7%) |
| 5:30 AM to 5:59 AM | 116 (8.3%) | 18 (1.9%) |
| 6:00 AM to 6:29 AM | 112 (8.0%) | 224 (24.2%) |
| 6:30 AM to 6:59 AM | 84 (6.0%) | 95 (10.3%) |
| 7:00 AM to 7:29 AM | 224 (16.1%) | 106 (11.5%) |
| 7:30 AM to 7:59 AM | 91 (6.5%) | 91 (9.9%) |
| 8:00 AM to 8:29 AM | 130 (9.3%) | 105 (11.4%) |
| 8:30 AM to 8:59 AM | 85 (6.1%) | 22 (2.4%) |
| 9:00 AM to 9:59 AM | 65 (4.7%) | 70 (7.6%) |
| 10:00 AM to 10:59 AM | 0 (0.0%) | 0 (0.0%) |
| 11:00 AM to 11:59 AM | 0 (0.0%) | 29 (3.1%) |
| 12:00 PM to 3:59 PM | 88 (6.3%) | 44 (4.8%) |
| 4:00 PM to 11:59 PM | 124 (8.9%) | 26 (2.8%) |
| Total | 1,394 (100.0%) | 924 (100.0%) |
Housing Occupancy in Sabana Seca
Occupancy by Ownership in Sabana Seca
Of the total 2,956 dwellings in Sabana Seca, owner-occupied units account for 1,984 (67.1%), while renter-occupied units make up 972 (32.9%).
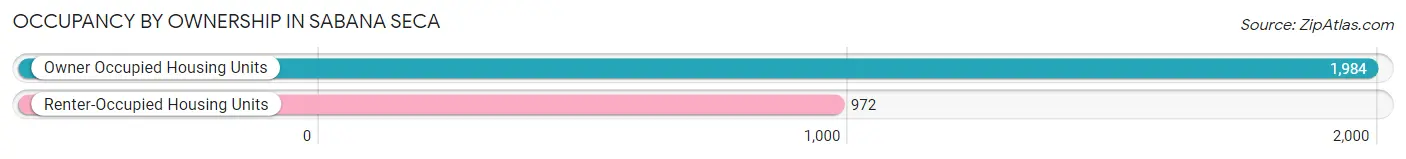
| Occupancy | # Housing Units | % Housing Units |
| Owner Occupied Housing Units | 1,984 | 67.1% |
| Renter-Occupied Housing Units | 972 | 32.9% |
| Total Occupied Housing Units | 2,956 | 100.0% |
Occupancy by Household Size in Sabana Seca
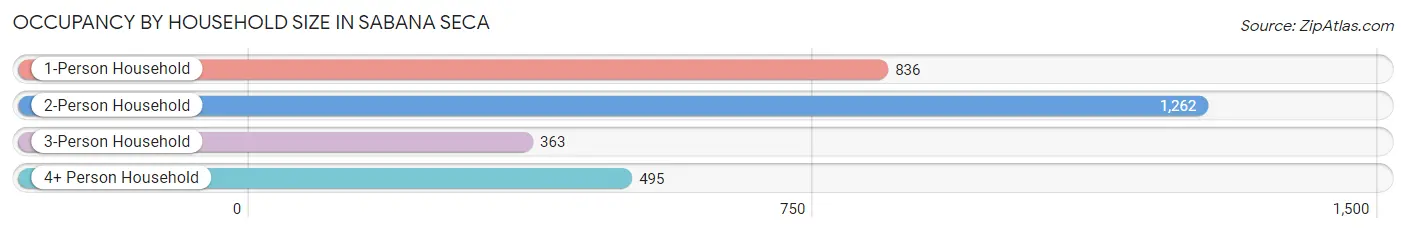
| Household Size | # Housing Units | % Housing Units |
| 1-Person Household | 836 | 28.3% |
| 2-Person Household | 1,262 | 42.7% |
| 3-Person Household | 363 | 12.3% |
| 4+ Person Household | 495 | 16.8% |
| Total Housing Units | 2,956 | 100.0% |
Occupancy by Ownership by Household Size in Sabana Seca
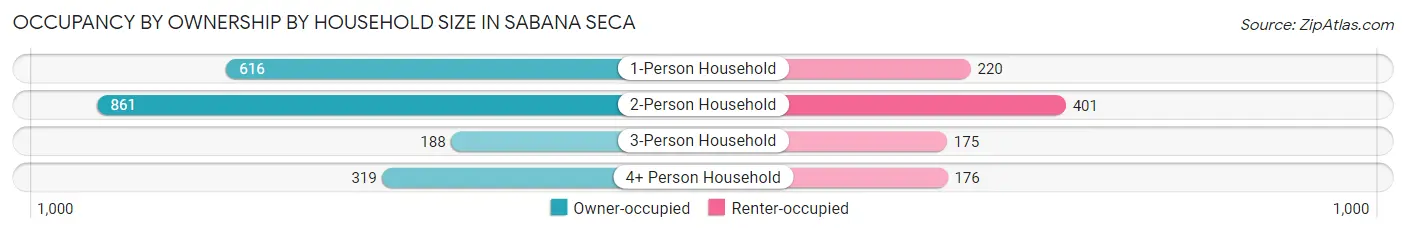
| Household Size | Owner-occupied | Renter-occupied |
| 1-Person Household | 616 (73.7%) | 220 (26.3%) |
| 2-Person Household | 861 (68.2%) | 401 (31.8%) |
| 3-Person Household | 188 (51.8%) | 175 (48.2%) |
| 4+ Person Household | 319 (64.4%) | 176 (35.6%) |
| Total Housing Units | 1,984 (67.1%) | 972 (32.9%) |
Occupancy by Educational Attainment in Sabana Seca
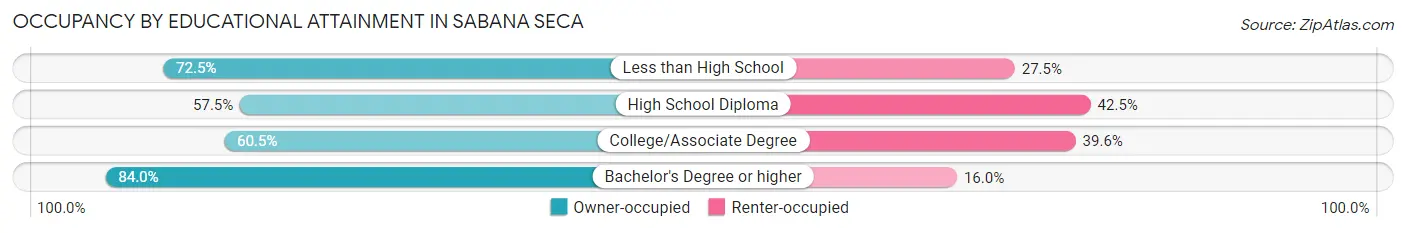
| Household Size | Owner-occupied | Renter-occupied |
| Less than High School | 681 (72.5%) | 258 (27.5%) |
| High School Diploma | 481 (57.5%) | 356 (42.5%) |
| College/Associate Degree | 434 (60.5%) | 284 (39.6%) |
| Bachelor's Degree or higher | 388 (84.0%) | 74 (16.0%) |
Occupancy by Age of Householder in Sabana Seca
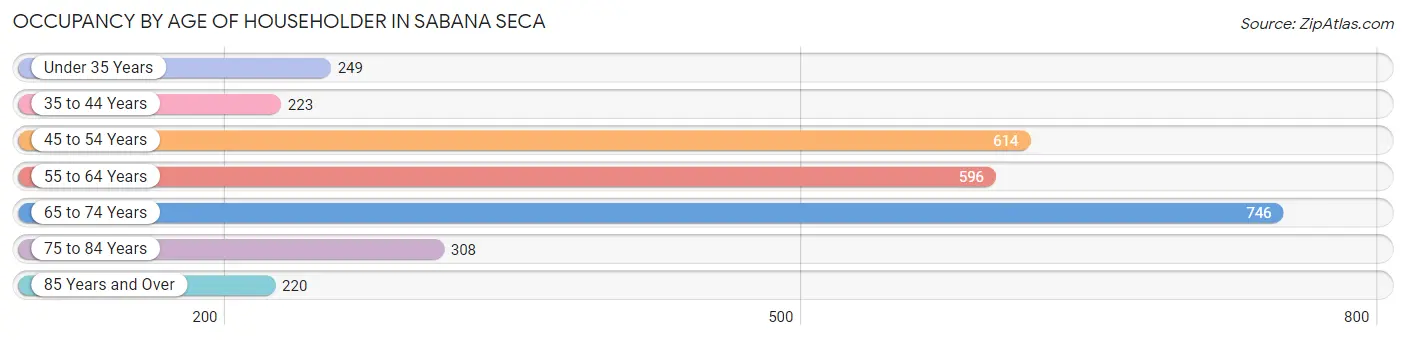
| Age Bracket | # Households | % Households |
| Under 35 Years | 249 | 8.4% |
| 35 to 44 Years | 223 | 7.5% |
| 45 to 54 Years | 614 | 20.8% |
| 55 to 64 Years | 596 | 20.2% |
| 65 to 74 Years | 746 | 25.2% |
| 75 to 84 Years | 308 | 10.4% |
| 85 Years and Over | 220 | 7.4% |
| Total | 2,956 | 100.0% |
Housing Finances in Sabana Seca
Median Income by Occupancy in Sabana Seca
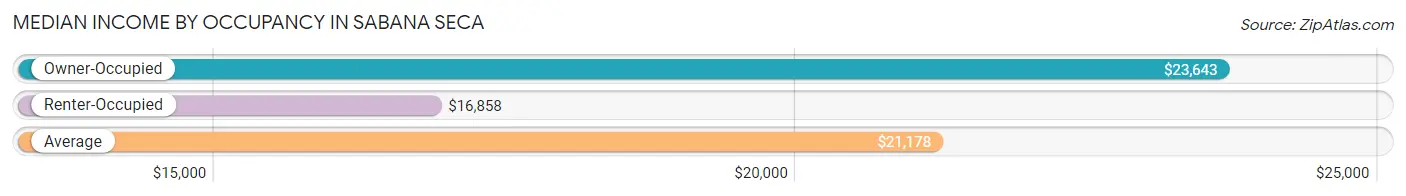
| Occupancy Type | # Households | Median Income |
| Owner-Occupied | 1,984 (67.1%) | $23,643 |
| Renter-Occupied | 972 (32.9%) | $16,858 |
| Average | 2,956 (100.0%) | $21,178 |
Occupancy by Householder Income Bracket in Sabana Seca
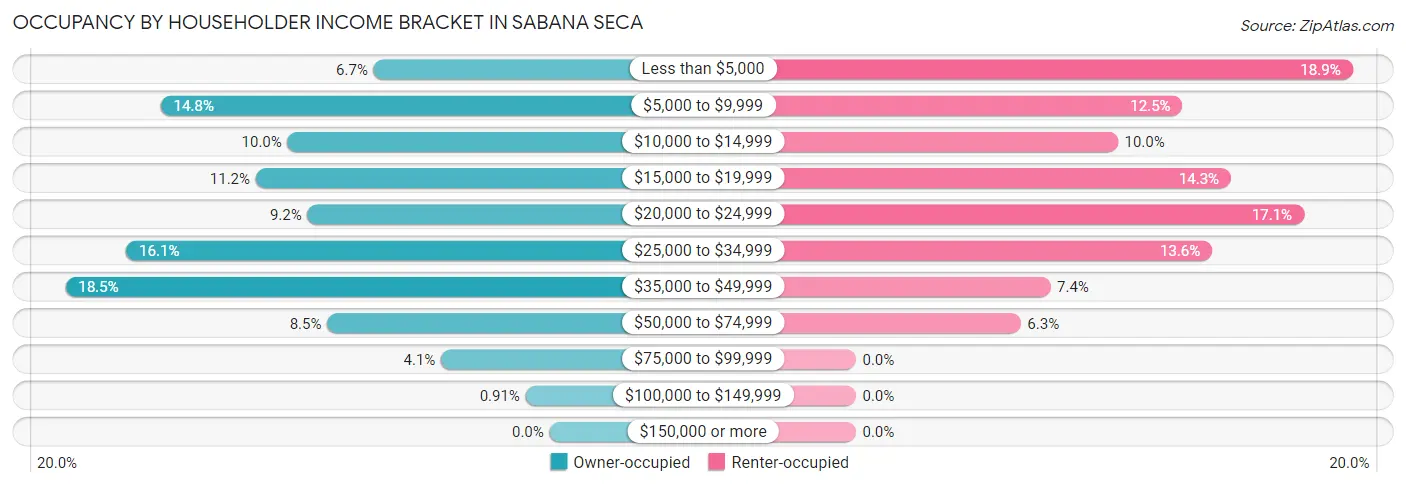
| Income Bracket | Owner-occupied | Renter-occupied |
| Less than $5,000 | 133 (6.7%) | 184 (18.9%) |
| $5,000 to $9,999 | 294 (14.8%) | 121 (12.4%) |
| $10,000 to $14,999 | 198 (10.0%) | 97 (10.0%) |
| $15,000 to $19,999 | 222 (11.2%) | 139 (14.3%) |
| $20,000 to $24,999 | 183 (9.2%) | 166 (17.1%) |
| $25,000 to $34,999 | 320 (16.1%) | 132 (13.6%) |
| $35,000 to $49,999 | 366 (18.4%) | 72 (7.4%) |
| $50,000 to $74,999 | 168 (8.5%) | 61 (6.3%) |
| $75,000 to $99,999 | 82 (4.1%) | 0 (0.0%) |
| $100,000 to $149,999 | 18 (0.9%) | 0 (0.0%) |
| $150,000 or more | 0 (0.0%) | 0 (0.0%) |
| Total | 1,984 (100.0%) | 972 (100.0%) |
Monthly Housing Cost Tiers in Sabana Seca
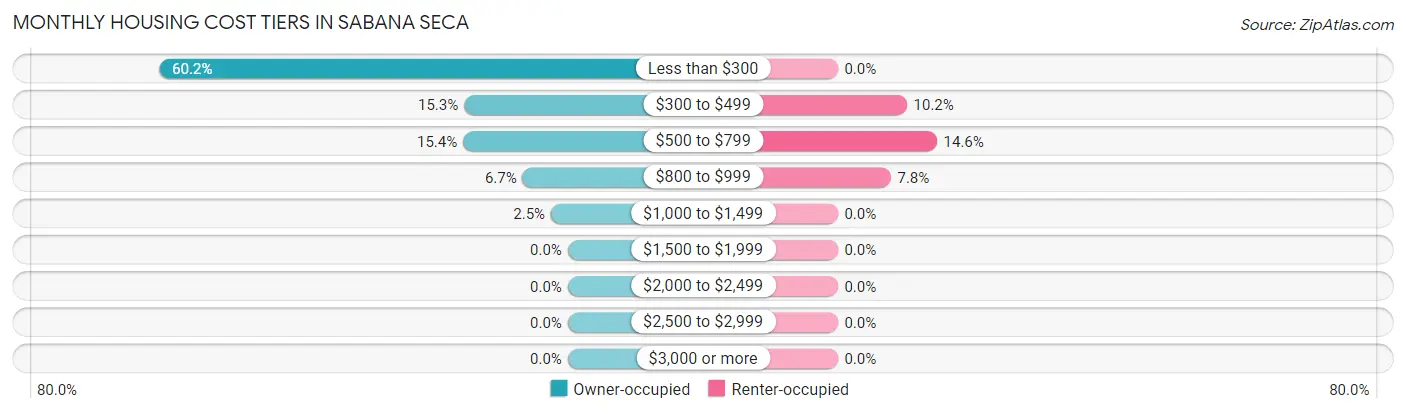
| Monthly Cost | Owner-occupied | Renter-occupied |
| Less than $300 | 1,194 (60.2%) | 0 (0.0%) |
| $300 to $499 | 303 (15.3%) | 99 (10.2%) |
| $500 to $799 | 306 (15.4%) | 142 (14.6%) |
| $800 to $999 | 132 (6.7%) | 76 (7.8%) |
| $1,000 to $1,499 | 49 (2.5%) | 0 (0.0%) |
| $1,500 to $1,999 | 0 (0.0%) | 0 (0.0%) |
| $2,000 to $2,499 | 0 (0.0%) | 0 (0.0%) |
| $2,500 to $2,999 | 0 (0.0%) | 0 (0.0%) |
| $3,000 or more | 0 (0.0%) | 0 (0.0%) |
| Total | 1,984 (100.0%) | 972 (100.0%) |
Physical Housing Characteristics in Sabana Seca
Housing Structures in Sabana Seca
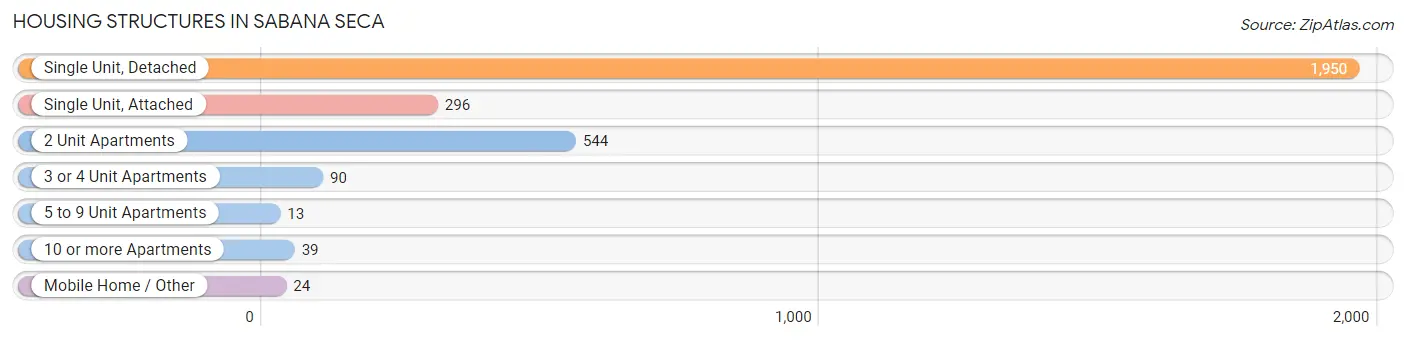
| Structure Type | # Housing Units | % Housing Units |
| Single Unit, Detached | 1,950 | 66.0% |
| Single Unit, Attached | 296 | 10.0% |
| 2 Unit Apartments | 544 | 18.4% |
| 3 or 4 Unit Apartments | 90 | 3.0% |
| 5 to 9 Unit Apartments | 13 | 0.4% |
| 10 or more Apartments | 39 | 1.3% |
| Mobile Home / Other | 24 | 0.8% |
| Total | 2,956 | 100.0% |
Housing Structures by Occupancy in Sabana Seca
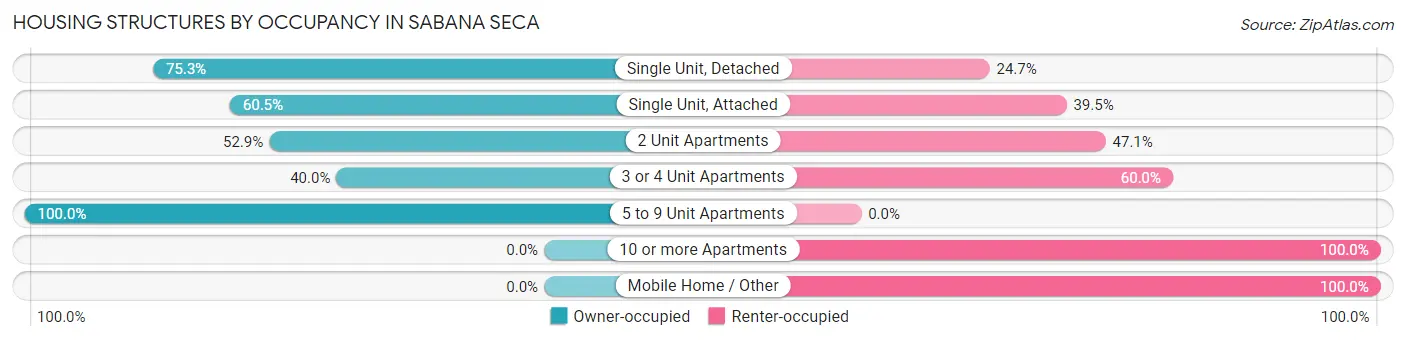
| Structure Type | Owner-occupied | Renter-occupied |
| Single Unit, Detached | 1,468 (75.3%) | 482 (24.7%) |
| Single Unit, Attached | 179 (60.5%) | 117 (39.5%) |
| 2 Unit Apartments | 288 (52.9%) | 256 (47.1%) |
| 3 or 4 Unit Apartments | 36 (40.0%) | 54 (60.0%) |
| 5 to 9 Unit Apartments | 13 (100.0%) | 0 (0.0%) |
| 10 or more Apartments | 0 (0.0%) | 39 (100.0%) |
| Mobile Home / Other | 0 (0.0%) | 24 (100.0%) |
| Total | 1,984 (67.1%) | 972 (32.9%) |
Housing Structures by Number of Rooms in Sabana Seca
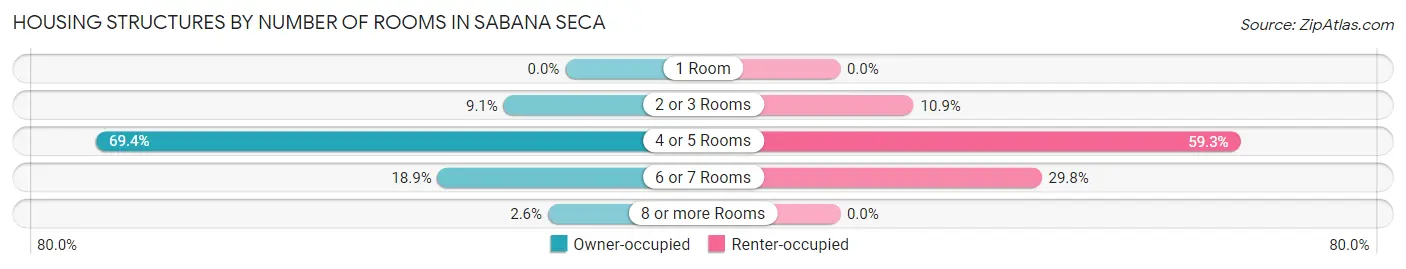
| Number of Rooms | Owner-occupied | Renter-occupied |
| 1 Room | 0 (0.0%) | 0 (0.0%) |
| 2 or 3 Rooms | 181 (9.1%) | 106 (10.9%) |
| 4 or 5 Rooms | 1,377 (69.4%) | 576 (59.3%) |
| 6 or 7 Rooms | 375 (18.9%) | 290 (29.8%) |
| 8 or more Rooms | 51 (2.6%) | 0 (0.0%) |
| Total | 1,984 (100.0%) | 972 (100.0%) |
Housing Structure by Heating Type in Sabana Seca
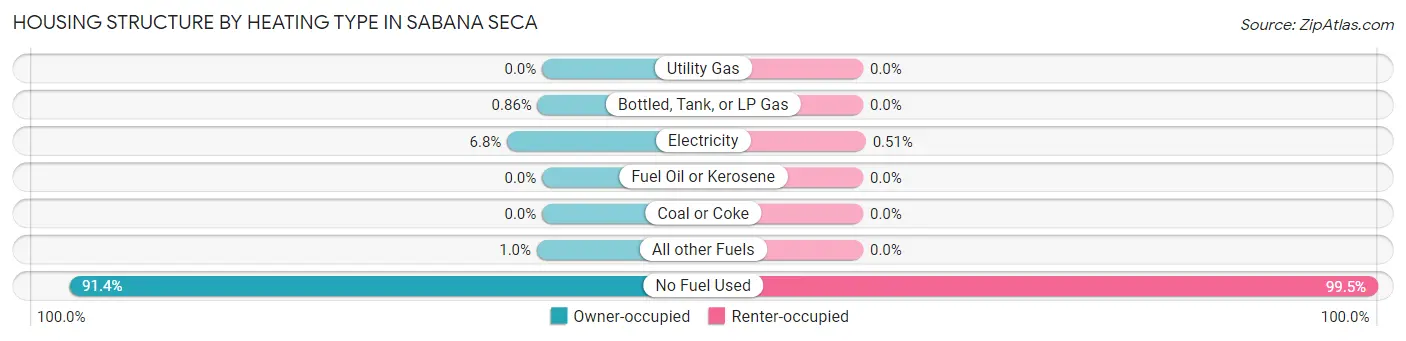
| Heating Type | Owner-occupied | Renter-occupied |
| Utility Gas | 0 (0.0%) | 0 (0.0%) |
| Bottled, Tank, or LP Gas | 17 (0.9%) | 0 (0.0%) |
| Electricity | 134 (6.8%) | 5 (0.5%) |
| Fuel Oil or Kerosene | 0 (0.0%) | 0 (0.0%) |
| Coal or Coke | 0 (0.0%) | 0 (0.0%) |
| All other Fuels | 20 (1.0%) | 0 (0.0%) |
| No Fuel Used | 1,813 (91.4%) | 967 (99.5%) |
| Total | 1,984 (100.0%) | 972 (100.0%) |
Household Vehicle Usage in Sabana Seca
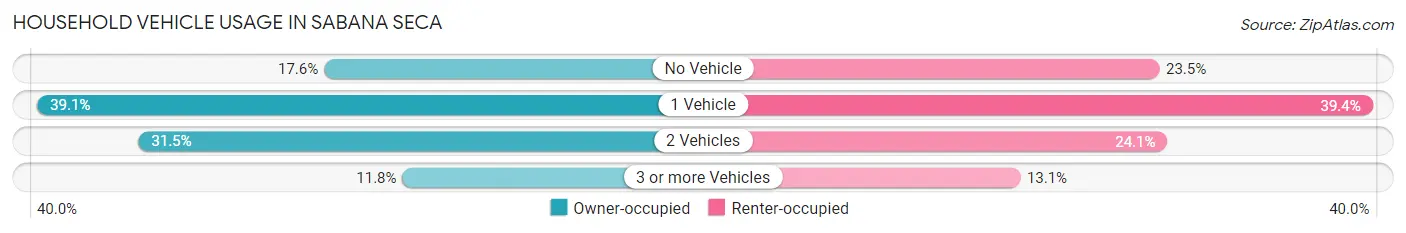
| Vehicles per Household | Owner-occupied | Renter-occupied |
| No Vehicle | 350 (17.6%) | 228 (23.5%) |
| 1 Vehicle | 775 (39.1%) | 383 (39.4%) |
| 2 Vehicles | 625 (31.5%) | 234 (24.1%) |
| 3 or more Vehicles | 234 (11.8%) | 127 (13.1%) |
| Total | 1,984 (100.0%) | 972 (100.0%) |
Real Estate & Mortgages in Sabana Seca
Real Estate and Mortgage Overview in Sabana Seca
| Characteristic | Without Mortgage | With Mortgage |
| Housing Units | 1,521 | 463 |
| Median Property Value | $99,900 | $122,600 |
| Median Household Income | $20,409 | $0 |
| Monthly Housing Costs | $185 | $0 |
| Real Estate Taxes | - | - |
Property Value by Mortgage Status in Sabana Seca
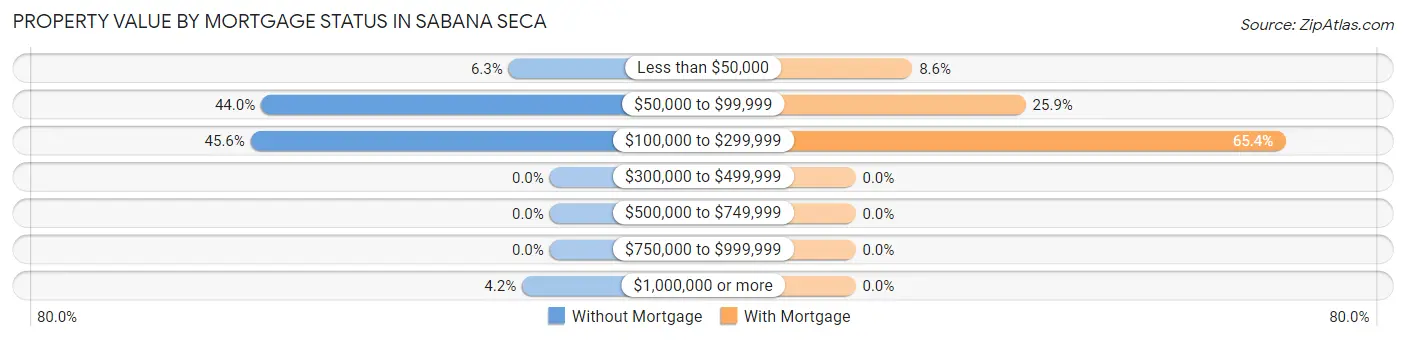
| Property Value | Without Mortgage | With Mortgage |
| Less than $50,000 | 95 (6.2%) | 40 (8.6%) |
| $50,000 to $99,999 | 669 (44.0%) | 120 (25.9%) |
| $100,000 to $299,999 | 693 (45.6%) | 303 (65.4%) |
| $300,000 to $499,999 | 0 (0.0%) | 0 (0.0%) |
| $500,000 to $749,999 | 0 (0.0%) | 0 (0.0%) |
| $750,000 to $999,999 | 0 (0.0%) | 0 (0.0%) |
| $1,000,000 or more | 64 (4.2%) | 0 (0.0%) |
| Total | 1,521 (100.0%) | 463 (100.0%) |
Household Income by Mortgage Status in Sabana Seca
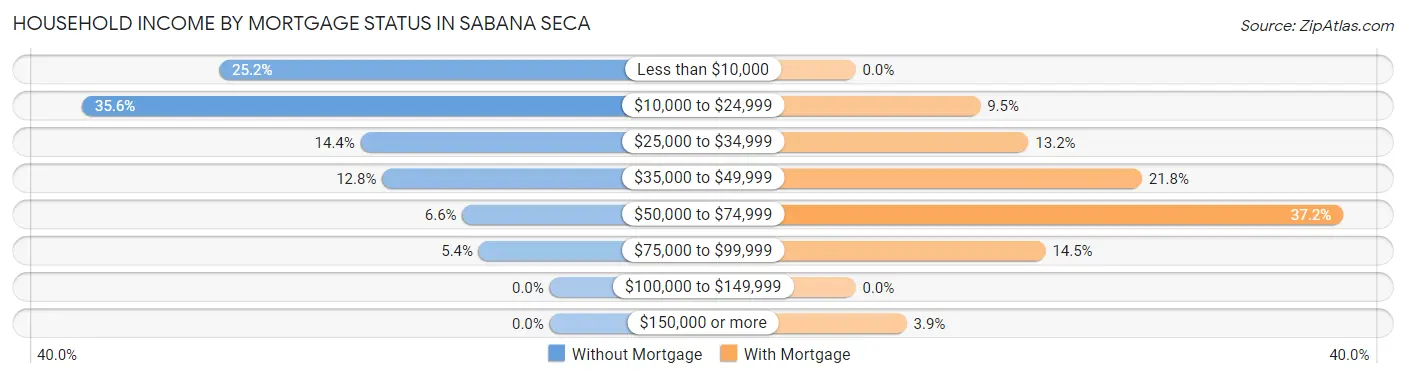
| Household Income | Without Mortgage | With Mortgage |
| Less than $10,000 | 383 (25.2%) | 0 (0.0%) |
| $10,000 to $24,999 | 542 (35.6%) | 44 (9.5%) |
| $25,000 to $34,999 | 219 (14.4%) | 61 (13.2%) |
| $35,000 to $49,999 | 194 (12.8%) | 101 (21.8%) |
| $50,000 to $74,999 | 101 (6.6%) | 172 (37.1%) |
| $75,000 to $99,999 | 82 (5.4%) | 67 (14.5%) |
| $100,000 to $149,999 | 0 (0.0%) | 0 (0.0%) |
| $150,000 or more | 0 (0.0%) | 18 (3.9%) |
| Total | 1,521 (100.0%) | 463 (100.0%) |
Property Value to Household Income Ratio in Sabana Seca

| Value-to-Income Ratio | Without Mortgage | With Mortgage |
| Less than 2.0x | 186 (12.2%) | 40,365 (8,718.1%) |
| 2.0x to 2.9x | 234 (15.4%) | 105 (22.7%) |
| 3.0x to 3.9x | 141 (9.3%) | 86 (18.6%) |
| 4.0x or more | 912 (60.0%) | 120 (25.9%) |
| Total | 1,521 (100.0%) | 463 (100.0%) |
Real Estate Taxes by Mortgage Status in Sabana Seca
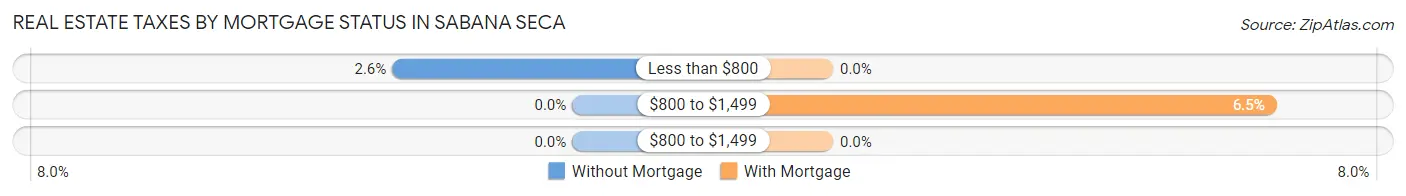
| Property Taxes | Without Mortgage | With Mortgage |
| Less than $800 | 40 (2.6%) | 0 (0.0%) |
| $800 to $1,499 | 0 (0.0%) | 30 (6.5%) |
| $800 to $1,499 | 0 (0.0%) | 0 (0.0%) |
| Total | 1,521 (100.0%) | 463 (100.0%) |
Health & Disability in Sabana Seca
Health Insurance Coverage by Age in Sabana Seca
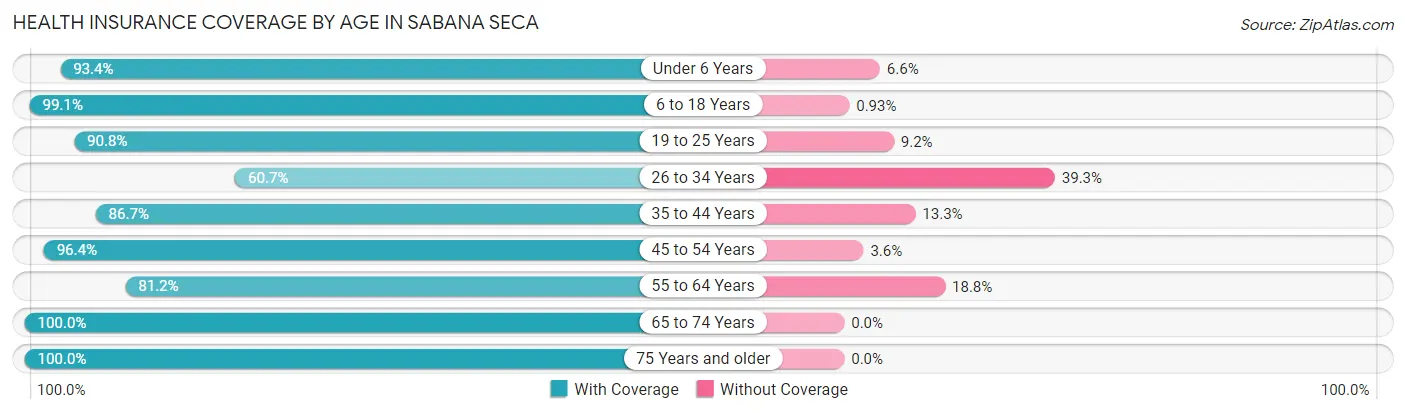
| Age Bracket | With Coverage | Without Coverage |
| Under 6 Years | 211 (93.4%) | 15 (6.6%) |
| 6 to 18 Years | 853 (99.1%) | 8 (0.9%) |
| 19 to 25 Years | 796 (90.8%) | 81 (9.2%) |
| 26 to 34 Years | 430 (60.7%) | 278 (39.3%) |
| 35 to 44 Years | 582 (86.7%) | 89 (13.3%) |
| 45 to 54 Years | 1,108 (96.4%) | 41 (3.6%) |
| 55 to 64 Years | 1,028 (81.2%) | 238 (18.8%) |
| 65 to 74 Years | 1,043 (100.0%) | 0 (0.0%) |
| 75 Years and older | 958 (100.0%) | 0 (0.0%) |
| Total | 7,009 (90.3%) | 750 (9.7%) |
Health Insurance Coverage by Citizenship Status in Sabana Seca
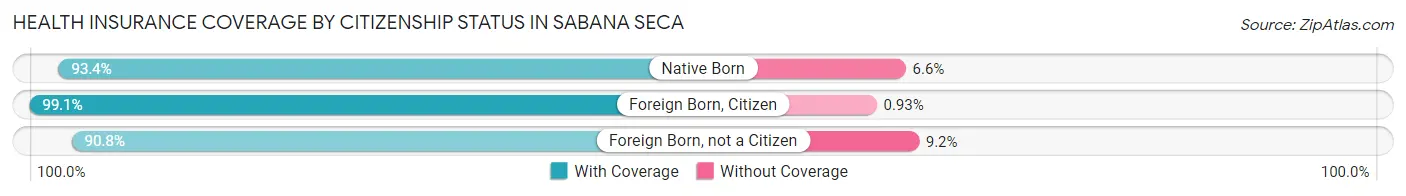
| Citizenship Status | With Coverage | Without Coverage |
| Native Born | 211 (93.4%) | 15 (6.6%) |
| Foreign Born, Citizen | 853 (99.1%) | 8 (0.9%) |
| Foreign Born, not a Citizen | 796 (90.8%) | 81 (9.2%) |
Health Insurance Coverage by Household Income in Sabana Seca
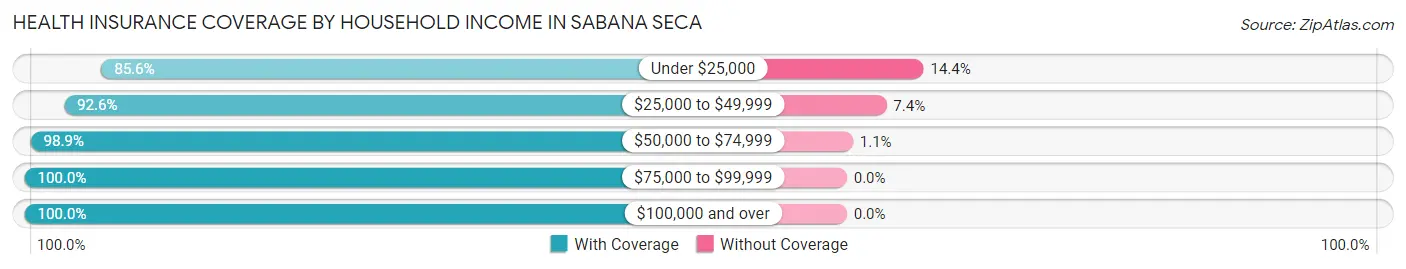
| Household Income | With Coverage | Without Coverage |
| Under $25,000 | 3,269 (85.6%) | 549 (14.4%) |
| $25,000 to $49,999 | 2,394 (92.6%) | 192 (7.4%) |
| $50,000 to $74,999 | 788 (98.9%) | 9 (1.1%) |
| $75,000 to $99,999 | 437 (100.0%) | 0 (0.0%) |
| $100,000 and over | 93 (100.0%) | 0 (0.0%) |
Public vs Private Health Insurance Coverage by Age in Sabana Seca
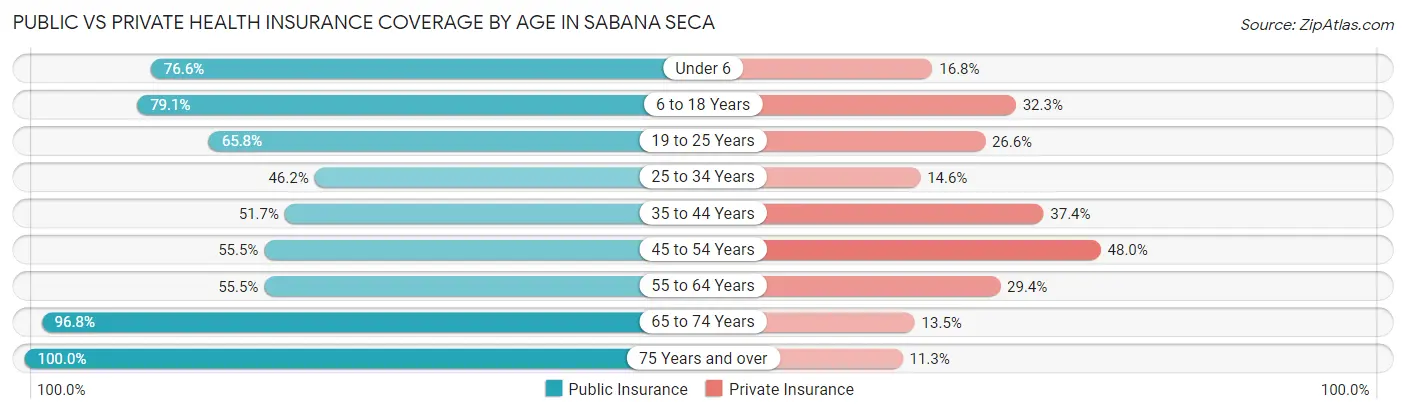
| Age Bracket | Public Insurance | Private Insurance |
| Under 6 | 173 (76.5%) | 38 (16.8%) |
| 6 to 18 Years | 681 (79.1%) | 278 (32.3%) |
| 19 to 25 Years | 577 (65.8%) | 233 (26.6%) |
| 25 to 34 Years | 327 (46.2%) | 103 (14.5%) |
| 35 to 44 Years | 347 (51.7%) | 251 (37.4%) |
| 45 to 54 Years | 638 (55.5%) | 552 (48.0%) |
| 55 to 64 Years | 703 (55.5%) | 372 (29.4%) |
| 65 to 74 Years | 1,010 (96.8%) | 141 (13.5%) |
| 75 Years and over | 958 (100.0%) | 108 (11.3%) |
| Total | 5,414 (69.8%) | 2,076 (26.8%) |
Disability Status by Sex by Age in Sabana Seca
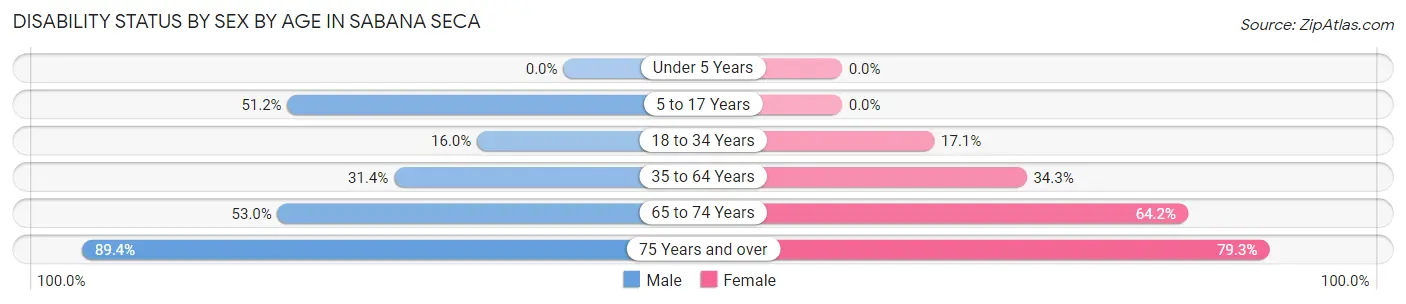
| Age Bracket | Male | Female |
| Under 5 Years | 0 (0.0%) | 0 (0.0%) |
| 5 to 17 Years | 253 (51.2%) | 0 (0.0%) |
| 18 to 34 Years | 147 (16.0%) | 126 (17.1%) |
| 35 to 64 Years | 436 (31.4%) | 582 (34.3%) |
| 65 to 74 Years | 279 (53.0%) | 332 (64.2%) |
| 75 Years and over | 294 (89.4%) | 499 (79.3%) |
Disability Class by Sex by Age in Sabana Seca
Disability Class: Hearing Difficulty
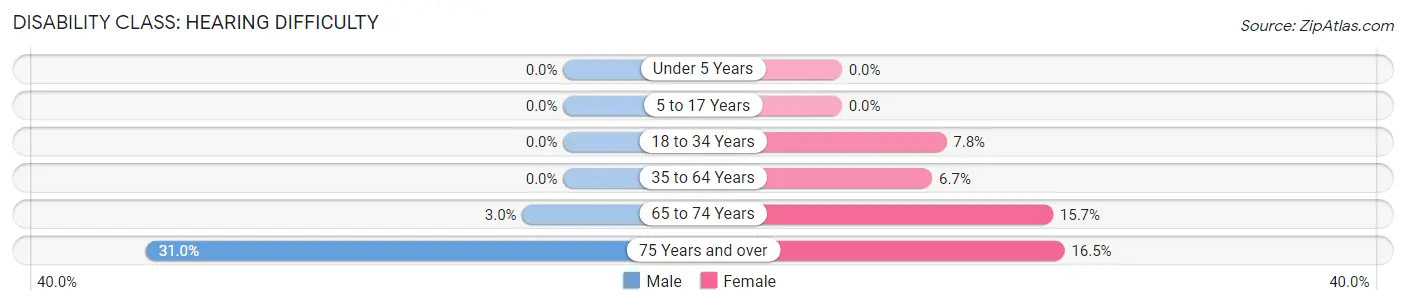
| Age Bracket | Male | Female |
| Under 5 Years | 0 (0.0%) | 0 (0.0%) |
| 5 to 17 Years | 0 (0.0%) | 0 (0.0%) |
| 18 to 34 Years | 0 (0.0%) | 57 (7.8%) |
| 35 to 64 Years | 0 (0.0%) | 114 (6.7%) |
| 65 to 74 Years | 16 (3.0%) | 81 (15.7%) |
| 75 Years and over | 102 (31.0%) | 104 (16.5%) |
Disability Class: Vision Difficulty
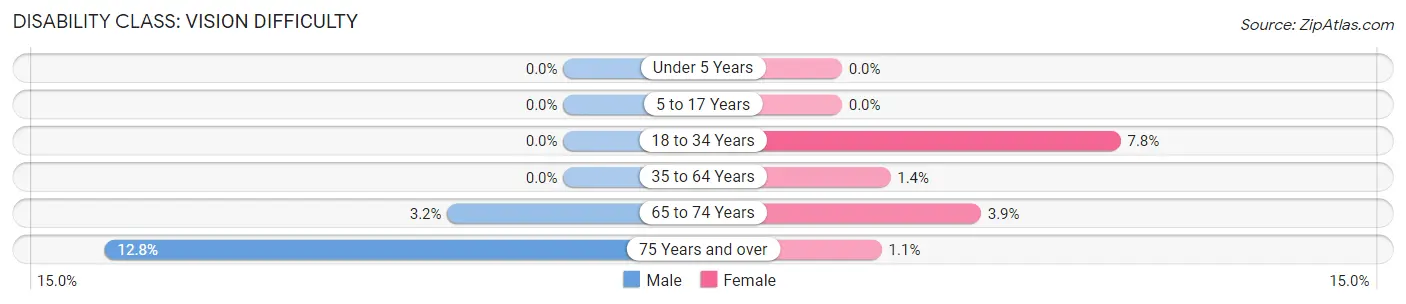
| Age Bracket | Male | Female |
| Under 5 Years | 0 (0.0%) | 0 (0.0%) |
| 5 to 17 Years | 0 (0.0%) | 0 (0.0%) |
| 18 to 34 Years | 0 (0.0%) | 57 (7.8%) |
| 35 to 64 Years | 0 (0.0%) | 23 (1.3%) |
| 65 to 74 Years | 17 (3.2%) | 20 (3.9%) |
| 75 Years and over | 42 (12.8%) | 7 (1.1%) |
Disability Class: Cognitive Difficulty
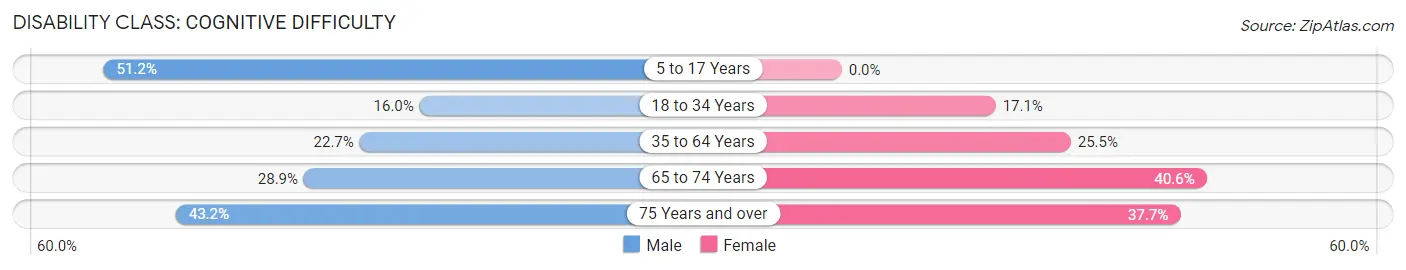
| Age Bracket | Male | Female |
| 5 to 17 Years | 253 (51.2%) | 0 (0.0%) |
| 18 to 34 Years | 147 (16.0%) | 126 (17.1%) |
| 35 to 64 Years | 315 (22.7%) | 433 (25.5%) |
| 65 to 74 Years | 152 (28.9%) | 210 (40.6%) |
| 75 Years and over | 142 (43.2%) | 237 (37.7%) |
Disability Class: Ambulatory Difficulty
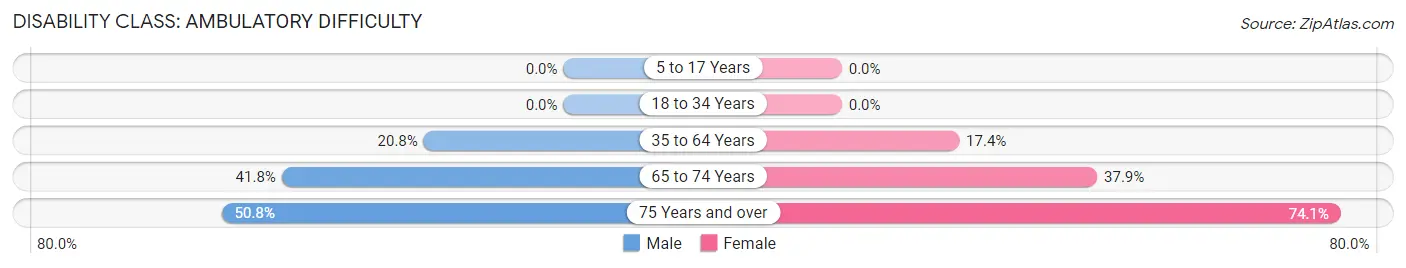
| Age Bracket | Male | Female |
| 5 to 17 Years | 0 (0.0%) | 0 (0.0%) |
| 18 to 34 Years | 0 (0.0%) | 0 (0.0%) |
| 35 to 64 Years | 288 (20.7%) | 296 (17.4%) |
| 65 to 74 Years | 220 (41.8%) | 196 (37.9%) |
| 75 Years and over | 167 (50.8%) | 466 (74.1%) |
Disability Class: Self-Care Difficulty
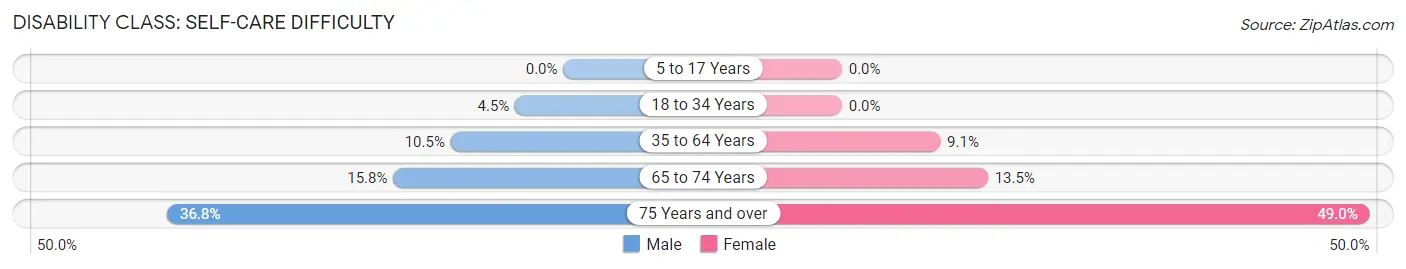
| Age Bracket | Male | Female |
| 5 to 17 Years | 0 (0.0%) | 0 (0.0%) |
| 18 to 34 Years | 41 (4.5%) | 0 (0.0%) |
| 35 to 64 Years | 145 (10.4%) | 155 (9.1%) |
| 65 to 74 Years | 83 (15.8%) | 70 (13.5%) |
| 75 Years and over | 121 (36.8%) | 308 (49.0%) |
Technology Access in Sabana Seca
Computing Device Access in Sabana Seca
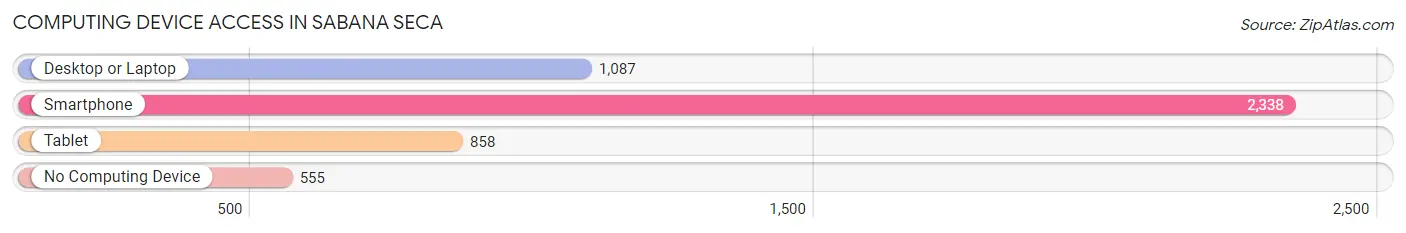
| Device Type | # Households | % Households |
| Desktop or Laptop | 1,087 | 36.8% |
| Smartphone | 2,338 | 79.1% |
| Tablet | 858 | 29.0% |
| No Computing Device | 555 | 18.8% |
| Total | 2,956 | 100.0% |
Internet Access in Sabana Seca
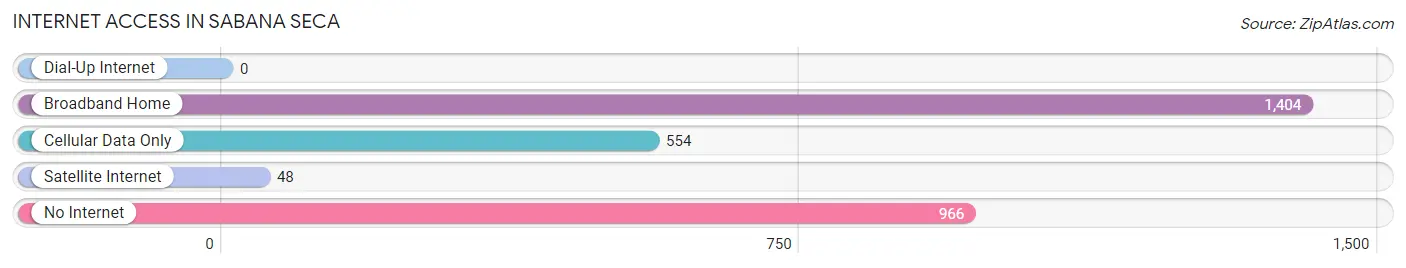
| Internet Type | # Households | % Households |
| Dial-Up Internet | 0 | 0.0% |
| Broadband Home | 1,404 | 47.5% |
| Cellular Data Only | 554 | 18.7% |
| Satellite Internet | 48 | 1.6% |
| No Internet | 966 | 32.7% |
| Total | 2,956 | 100.0% |
Sabana Seca Summary
Sabana Seca is a small town located in the municipality of Toa Baja, Puerto Rico. It is located in the northern part of the island, about 15 miles west of San Juan. The town has a population of approximately 8,000 people and is known for its agricultural production.
History
The history of Sabana Seca dates back to the 16th century when it was first settled by the Taino Indians. The Taino Indians were the first inhabitants of Puerto Rico and were known for their agricultural production. The town was originally called “Sabana de los Indios”, which translates to “Plains of the Indians”.
In the late 19th century, the town was renamed “Sabana Seca”, which translates to “Dry Plains”. This was due to the fact that the area was prone to drought and the soil was not suitable for farming.
In the early 20th century, the town began to grow and develop. The population increased and the economy began to diversify. The town became known for its agricultural production, particularly sugar cane and tobacco.
Geography
Sabana Seca is located in the northern part of Puerto Rico, about 15 miles west of San Juan. The town is situated in a valley surrounded by mountains. The climate is tropical and the average temperature is around 80 degrees Fahrenheit.
The town is divided into two sections, the urban area and the rural area. The urban area is located in the center of the town and is home to most of the population. The rural area is located on the outskirts of the town and is home to the agricultural production.
Economy
The economy of Sabana Seca is mainly based on agriculture. The town is known for its production of sugar cane, tobacco, and other crops. The town also has a few small businesses, such as restaurants, stores, and other services.
The town is also home to a few manufacturing companies, such as a pharmaceutical company and a plastics factory. These companies provide employment to many of the town’s residents.
Demographics
As of the 2010 census, the population of Sabana Seca was 8,000. The majority of the population is of Hispanic descent. The town also has a small population of African Americans and other ethnicities.
The town has a high rate of poverty, with over 40% of the population living below the poverty line. The median household income is around $15,000 per year.
Conclusion
Sabana Seca is a small town located in the municipality of Toa Baja, Puerto Rico. The town has a population of approximately 8,000 people and is known for its agricultural production. The economy of the town is mainly based on agriculture and manufacturing. The town also has a high rate of poverty, with over 40% of the population living below the poverty line.
Common Questions
What is Per Capita Income in Sabana Seca?
Per Capita income in Sabana Seca is $11,651.
What is the Median Family Income in Sabana Seca?
Median Family Income in Sabana Seca is $24,759.
What is the Median Household income in Sabana Seca?
Median Household Income in Sabana Seca is $21,178.
What is Income or Wage Gap in Sabana Seca?
Income or Wage Gap in Sabana Seca is 3.7%.
Women in Sabana Seca earn 96.3 cents for every dollar earned by a man.
What is Family Income Deficit in Sabana Seca?
Family Income Deficit in Sabana Seca is $11,628.
Families that are below poverty line in Sabana Seca earn $11,628 less on average than the poverty threshold level.
What is Inequality or Gini Index in Sabana Seca?
Inequality or Gini Index in Sabana Seca is 0.43.
What is the Total Population of Sabana Seca?
Total Population of Sabana Seca is 7,769.
What is the Total Male Population of Sabana Seca?
Total Male Population of Sabana Seca is 3,757.
What is the Total Female Population of Sabana Seca?
Total Female Population of Sabana Seca is 4,012.
What is the Ratio of Males per 100 Females in Sabana Seca?
There are 93.64 Males per 100 Females in Sabana Seca.
What is the Ratio of Females per 100 Males in Sabana Seca?
There are 106.79 Females per 100 Males in Sabana Seca.
What is the Median Population Age in Sabana Seca?
Median Population Age in Sabana Seca is 49.4 Years.
What is the Average Family Size in Sabana Seca
Average Family Size in Sabana Seca is 3.2 People.
What is the Average Household Size in Sabana Seca
Average Household Size in Sabana Seca is 2.6 People.
How Large is the Labor Force in Sabana Seca?
There are 3,200 People in the Labor Forcein in Sabana Seca.
What is the Percentage of People in the Labor Force in Sabana Seca?
46.7% of People are in the Labor Force in Sabana Seca.
What is the Unemployment Rate in Sabana Seca?
Unemployment Rate in Sabana Seca is 15.4%.