Humacao, PR Map & Demographics
Humacao Map
Humacao Overview
$15,264
PER CAPITA INCOME
$29,911
AVG FAMILY INCOME
$21,318
AVG HOUSEHOLD INCOME
4.2%
WAGE / INCOME GAP [ % ]
95.8¢/ $1
WAGE / INCOME GAP [ $ ]
$10,460
FAMILY INCOME DEFICIT
0.53
INEQUALITY / GINI INDEX
16,762
TOTAL POPULATION
7,836
MALE POPULATION
8,926
FEMALE POPULATION
87.79
MALES / 100 FEMALES
113.91
FEMALES / 100 MALES
48.3
MEDIAN AGE
3.5
AVG FAMILY SIZE
2.6
AVG HOUSEHOLD SIZE
5,053
LABOR FORCE [ PEOPLE ]
35.3%
PERCENT IN LABOR FORCE
10.8%
UNEMPLOYMENT RATE
Humacao Zip Codes
Humacao Area Codes
Income in Humacao
Income Overview in Humacao
Per Capita Income in Humacao is $15,264, while median incomes of families and households are $29,911 and $21,318 respectively.
| Characteristic | Number | Measure |
| Per Capita Income | 16,762 | $15,264 |
| Median Family Income | 3,805 | $29,911 |
| Mean Family Income | 3,805 | $42,888 |
| Median Household Income | 6,512 | $21,318 |
| Mean Household Income | 6,512 | $33,626 |
| Income Deficit | 3,805 | $10,460 |
| Wage / Income Gap (%) | 16,762 | 4.24% |
| Wage / Income Gap ($) | 16,762 | 95.76¢ per $1 |
| Gini / Inequality Index | 16,762 | 0.53 |
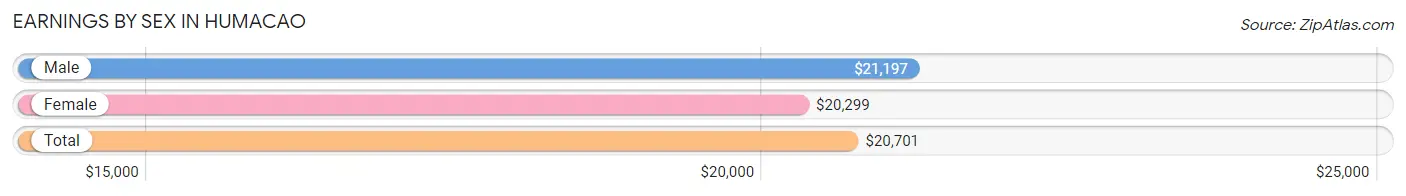
Earnings by Sex in Humacao
Average Earnings in Humacao are $20,701, $21,197 for men and $20,299 for women, a difference of 4.2%.
| Sex | Number | Average Earnings |
| Male | 2,785 (54.3%) | $21,197 |
| Female | 2,339 (45.7%) | $20,299 |
| Total | 5,124 (100.0%) | $20,701 |
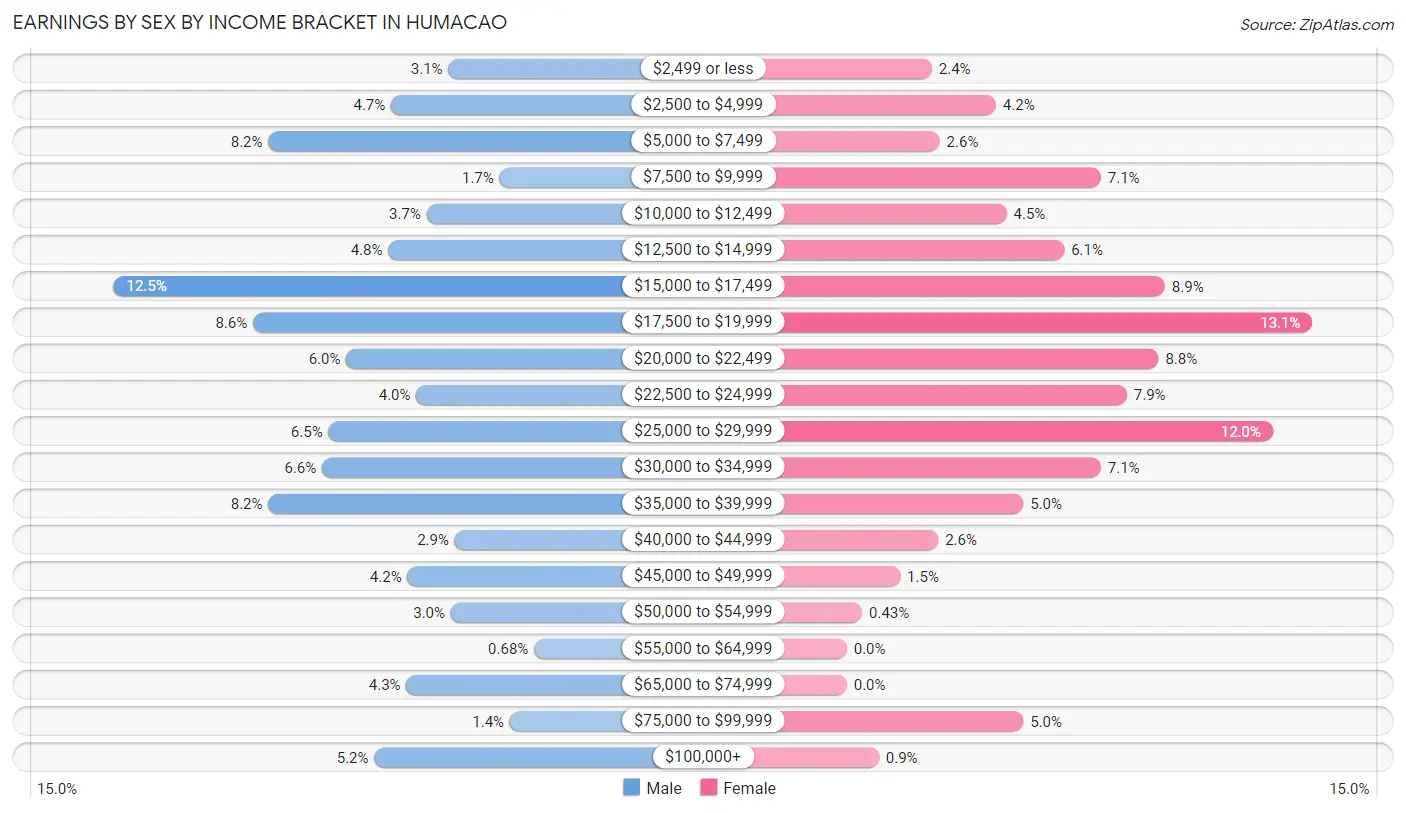
Earnings by Sex by Income Bracket in Humacao
The most common earnings brackets in Humacao are $15,000 to $17,499 for men (348 | 12.5%) and $17,500 to $19,999 for women (306 | 13.1%).
| Income | Male | Female |
| $2,499 or less | 86 (3.1%) | 56 (2.4%) |
| $2,500 to $4,999 | 131 (4.7%) | 98 (4.2%) |
| $5,000 to $7,499 | 227 (8.2%) | 61 (2.6%) |
| $7,500 to $9,999 | 46 (1.7%) | 167 (7.1%) |
| $10,000 to $12,499 | 103 (3.7%) | 105 (4.5%) |
| $12,500 to $14,999 | 133 (4.8%) | 143 (6.1%) |
| $15,000 to $17,499 | 348 (12.5%) | 209 (8.9%) |
| $17,500 to $19,999 | 239 (8.6%) | 306 (13.1%) |
| $20,000 to $22,499 | 166 (6.0%) | 205 (8.8%) |
| $22,500 to $24,999 | 111 (4.0%) | 184 (7.9%) |
| $25,000 to $29,999 | 180 (6.5%) | 280 (12.0%) |
| $30,000 to $34,999 | 185 (6.6%) | 167 (7.1%) |
| $35,000 to $39,999 | 227 (8.2%) | 116 (5.0%) |
| $40,000 to $44,999 | 81 (2.9%) | 60 (2.6%) |
| $45,000 to $49,999 | 118 (4.2%) | 35 (1.5%) |
| $50,000 to $54,999 | 84 (3.0%) | 10 (0.4%) |
| $55,000 to $64,999 | 19 (0.7%) | 0 (0.0%) |
| $65,000 to $74,999 | 119 (4.3%) | 0 (0.0%) |
| $75,000 to $99,999 | 38 (1.4%) | 116 (5.0%) |
| $100,000+ | 144 (5.2%) | 21 (0.9%) |
| Total | 2,785 (100.0%) | 2,339 (100.0%) |
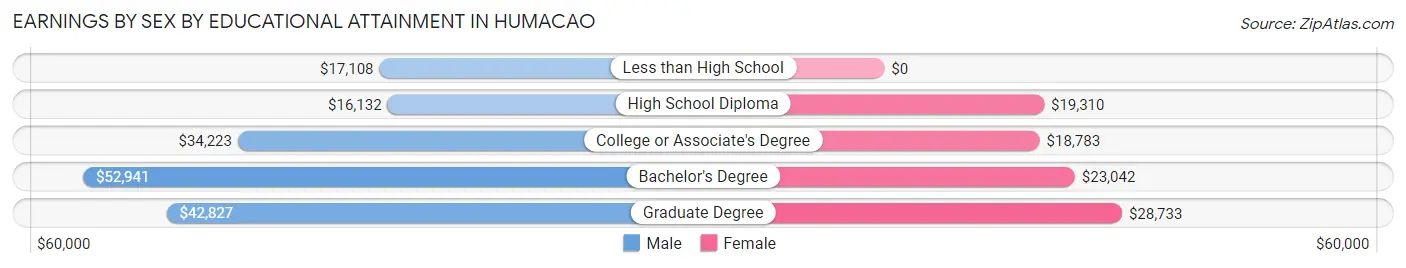
Earnings by Sex by Educational Attainment in Humacao
Average earnings in Humacao are $21,867 for men and $21,524 for women, a difference of 1.6%. Men with an educational attainment of bachelor's degree enjoy the highest average annual earnings of $52,941, while those with high school diploma education earn the least with $16,132. Women with an educational attainment of graduate degree earn the most with the average annual earnings of $28,733, while those with college or associate's degree education have the smallest earnings of $18,783.
| Educational Attainment | Male Income | Female Income |
| Less than High School | $17,108 | $0 |
| High School Diploma | $16,132 | $19,310 |
| College or Associate's Degree | $34,223 | $18,783 |
| Bachelor's Degree | $52,941 | $23,042 |
| Graduate Degree | $42,827 | $28,733 |
| Total | $21,867 | $21,524 |
Family Income in Humacao
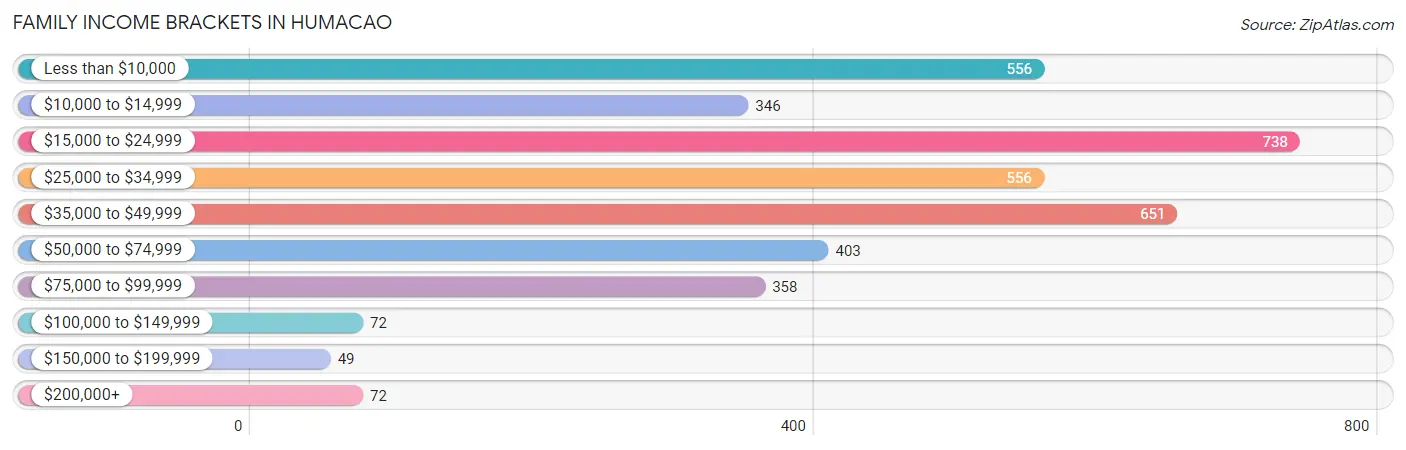
Family Income Brackets in Humacao
According to the Humacao family income data, there are 738 families falling into the $15,000 to $24,999 income range, which is the most common income bracket and makes up 19.4% of all families. Conversely, the $150,000 to $199,999 income bracket is the least frequent group with only 49 families (1.3%) belonging to this category.
| Income Bracket | # Families | % Families |
| Less than $10,000 | 556 | 14.6% |
| $10,000 to $14,999 | 346 | 9.1% |
| $15,000 to $24,999 | 738 | 19.4% |
| $25,000 to $34,999 | 556 | 14.6% |
| $35,000 to $49,999 | 651 | 17.1% |
| $50,000 to $74,999 | 403 | 10.6% |
| $75,000 to $99,999 | 358 | 9.4% |
| $100,000 to $149,999 | 72 | 1.9% |
| $150,000 to $199,999 | 49 | 1.3% |
| $200,000+ | 72 | 1.9% |
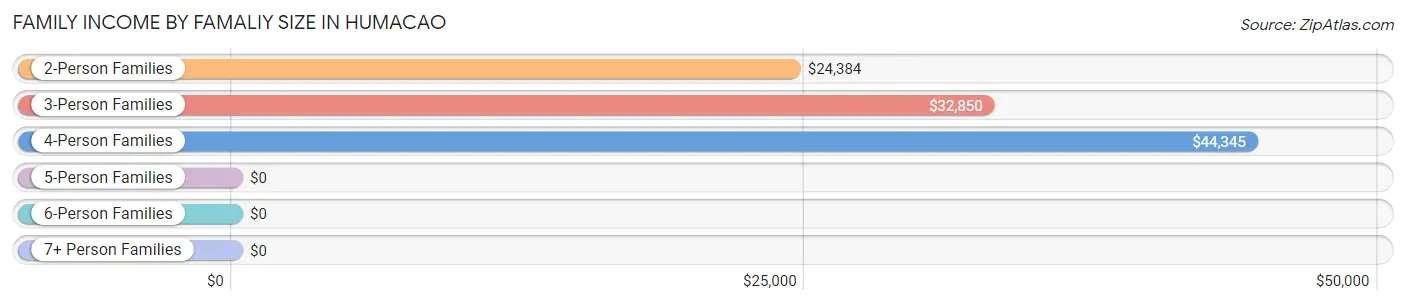
Family Income by Famaliy Size in Humacao
4-person families (651 | 17.1%) account for the highest median family income in Humacao with $44,345 per family, while 2-person families (2,042 | 53.7%) have the highest median income of $12,192 per family member.
| Income Bracket | # Families | Median Income |
| 2-Person Families | 2,042 (53.7%) | $24,384 |
| 3-Person Families | 905 (23.8%) | $32,850 |
| 4-Person Families | 651 (17.1%) | $44,345 |
| 5-Person Families | 147 (3.9%) | $0 |
| 6-Person Families | 15 (0.4%) | $0 |
| 7+ Person Families | 45 (1.2%) | $0 |
| Total | 3,805 (100.0%) | $29,911 |
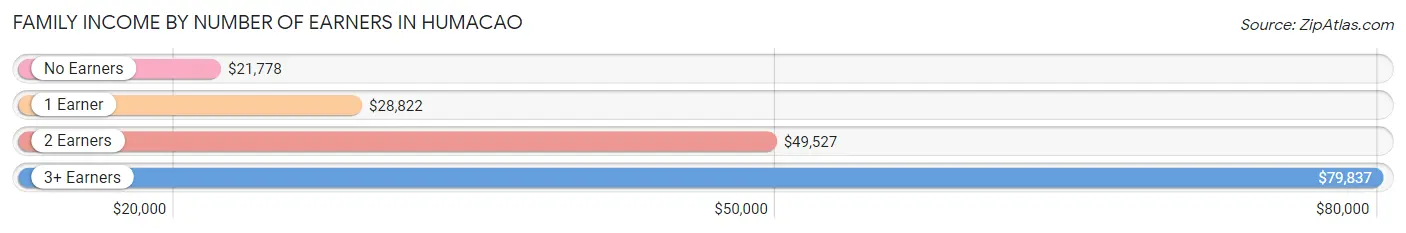
Family Income by Number of Earners in Humacao
The median family income in Humacao is $29,911, with families comprising 3+ earners (223) having the highest median family income of $79,837, while families with no earners (1,642) have the lowest median family income of $21,778, accounting for 5.9% and 43.1% of families, respectively.
| Number of Earners | # Families | Median Income |
| No Earners | 1,642 (43.1%) | $21,778 |
| 1 Earner | 1,320 (34.7%) | $28,822 |
| 2 Earners | 620 (16.3%) | $49,527 |
| 3+ Earners | 223 (5.9%) | $79,837 |
| Total | 3,805 (100.0%) | $29,911 |
Household Income in Humacao
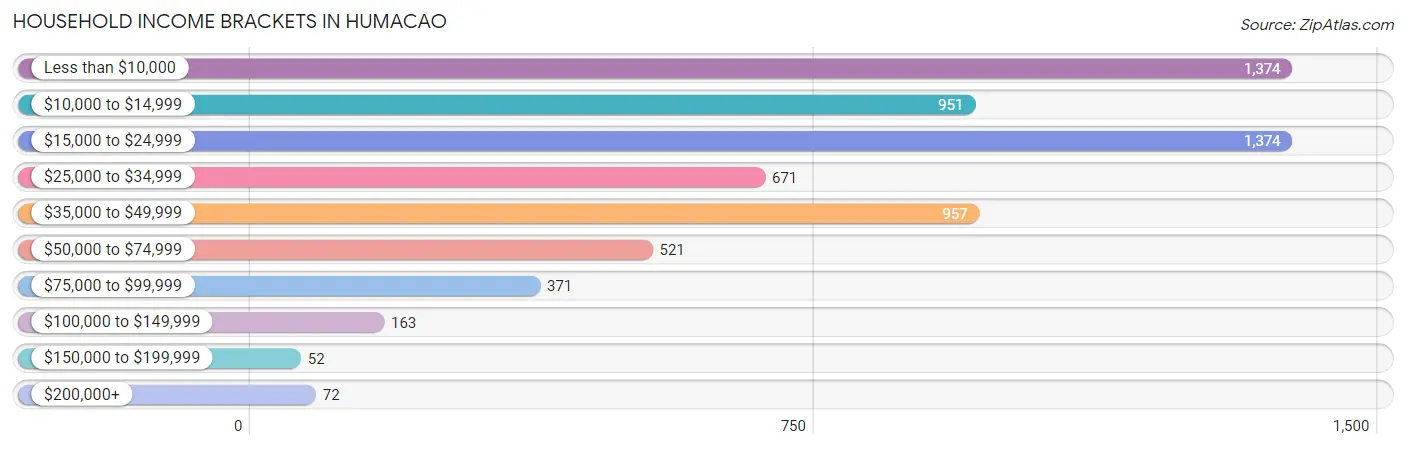
Household Income Brackets in Humacao
With 1,374 households falling in the category, the less than $10,000 income range is the most frequent in Humacao, accounting for 21.1% of all households. In contrast, only 52 households (0.8%) fall into the $150,000 to $199,999 income bracket, making it the least populous group.
| Income Bracket | # Households | % Households |
| Less than $10,000 | 1,374 | 21.1% |
| $10,000 to $14,999 | 951 | 14.6% |
| $15,000 to $24,999 | 1,374 | 21.1% |
| $25,000 to $34,999 | 671 | 10.3% |
| $35,000 to $49,999 | 957 | 14.7% |
| $50,000 to $74,999 | 521 | 8.0% |
| $75,000 to $99,999 | 371 | 5.7% |
| $100,000 to $149,999 | 163 | 2.5% |
| $150,000 to $199,999 | 52 | 0.8% |
| $200,000+ | 72 | 1.1% |
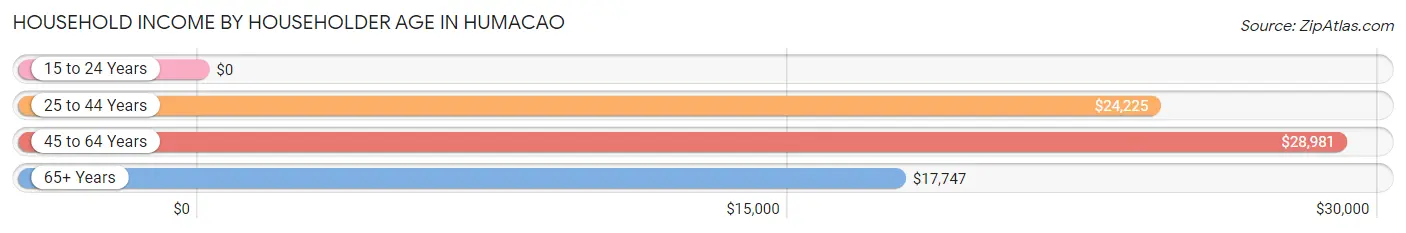
Household Income by Householder Age in Humacao
The median household income in Humacao is $21,318, with the highest median household income of $28,981 found in the 45 to 64 years age bracket for the primary householder. A total of 1,935 households (29.7%) fall into this category. Meanwhile, the 15 to 24 years age bracket for the primary householder has the lowest median household income of $0, with 116 households (1.8%) in this group.
| Income Bracket | # Households | Median Income |
| 15 to 24 Years | 116 (1.8%) | $0 |
| 25 to 44 Years | 1,383 (21.2%) | $24,225 |
| 45 to 64 Years | 1,935 (29.7%) | $28,981 |
| 65+ Years | 3,078 (47.3%) | $17,747 |
| Total | 6,512 (100.0%) | $21,318 |
Poverty in Humacao
Income Below Poverty by Sex and Age in Humacao
With 35.9% poverty level for males and 40.0% for females among the residents of Humacao, 12 to 14 year old males and under 5 year old females are the most vulnerable to poverty, with 209 males (65.7%) and 188 females (100.0%) in their respective age groups living below the poverty level.
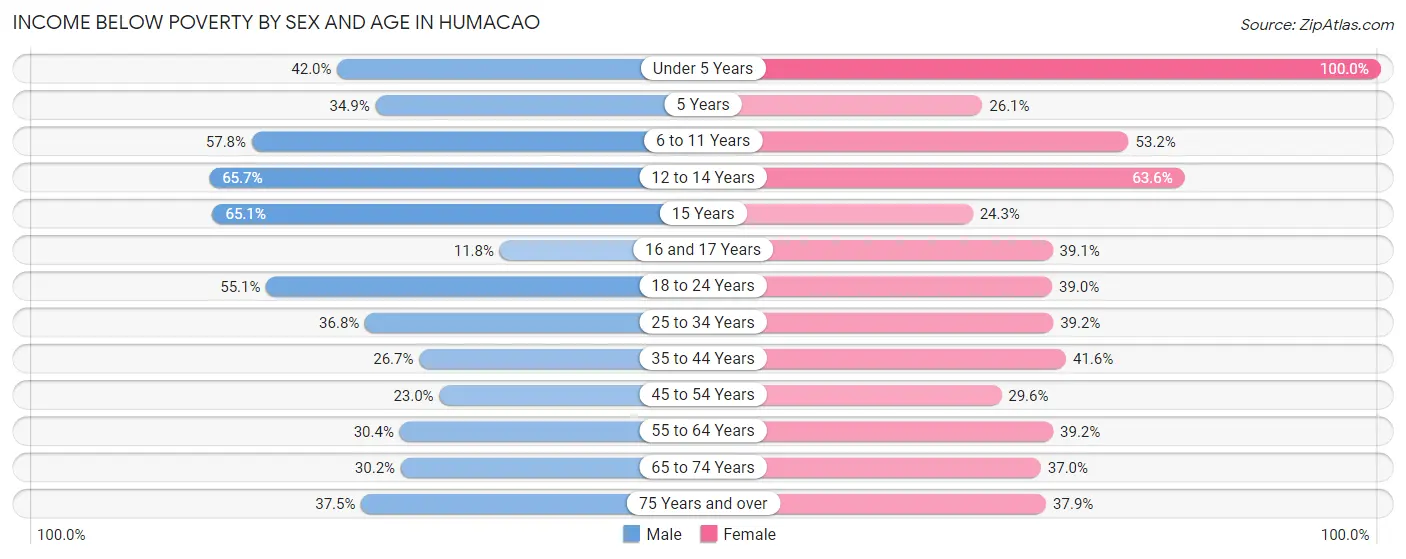
| Age Bracket | Male | Female |
| Under 5 Years | 112 (41.9%) | 188 (100.0%) |
| 5 Years | 38 (34.9%) | 36 (26.1%) |
| 6 to 11 Years | 281 (57.8%) | 238 (53.2%) |
| 12 to 14 Years | 209 (65.7%) | 152 (63.6%) |
| 15 Years | 97 (65.1%) | 26 (24.3%) |
| 16 and 17 Years | 25 (11.8%) | 72 (39.1%) |
| 18 to 24 Years | 306 (55.1%) | 247 (39.0%) |
| 25 to 34 Years | 273 (36.8%) | 390 (39.2%) |
| 35 to 44 Years | 280 (26.7%) | 390 (41.6%) |
| 45 to 54 Years | 241 (23.0%) | 313 (29.6%) |
| 55 to 64 Years | 270 (30.4%) | 451 (39.2%) |
| 65 to 74 Years | 290 (30.1%) | 558 (36.9%) |
| 75 Years and over | 377 (37.5%) | 501 (37.9%) |
| Total | 2,799 (35.9%) | 3,562 (40.0%) |
Income Above Poverty by Sex and Age in Humacao
According to the poverty statistics in Humacao, males aged 16 and 17 years and females aged 15 years are the age groups that are most secure financially, with 88.2% of males and 75.7% of females in these age groups living above the poverty line.
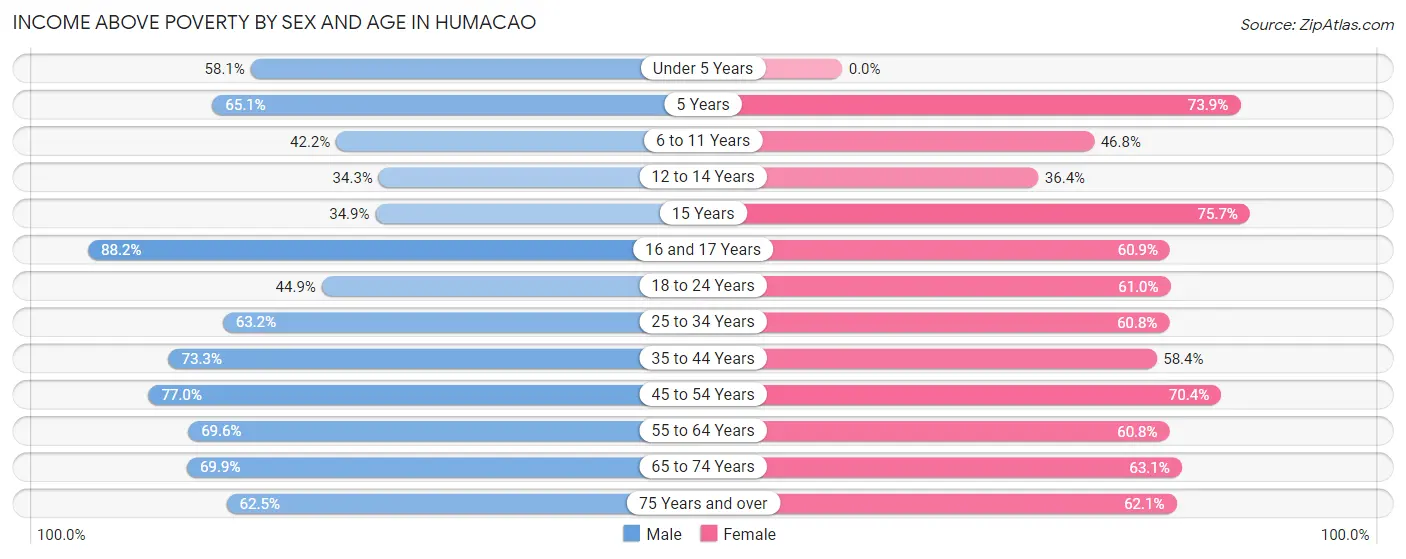
| Age Bracket | Male | Female |
| Under 5 Years | 155 (58.1%) | 0 (0.0%) |
| 5 Years | 71 (65.1%) | 102 (73.9%) |
| 6 to 11 Years | 205 (42.2%) | 209 (46.8%) |
| 12 to 14 Years | 109 (34.3%) | 87 (36.4%) |
| 15 Years | 52 (34.9%) | 81 (75.7%) |
| 16 and 17 Years | 187 (88.2%) | 112 (60.9%) |
| 18 to 24 Years | 249 (44.9%) | 386 (61.0%) |
| 25 to 34 Years | 469 (63.2%) | 604 (60.8%) |
| 35 to 44 Years | 767 (73.3%) | 547 (58.4%) |
| 45 to 54 Years | 807 (77.0%) | 744 (70.4%) |
| 55 to 64 Years | 619 (69.6%) | 699 (60.8%) |
| 65 to 74 Years | 672 (69.9%) | 952 (63.0%) |
| 75 Years and over | 628 (62.5%) | 820 (62.1%) |
| Total | 4,990 (64.1%) | 5,343 (60.0%) |
Income Below Poverty Among Married-Couple Families in Humacao
The poverty statistics for married-couple families in Humacao show that 19.2% or 416 of the total 2,168 families live below the poverty line. Families with 3 or 4 children have the highest poverty rate of 100.0%, comprising of 30 families. On the other hand, families with 1 or 2 children have the lowest poverty rate of 15.4%, which includes 73 families.
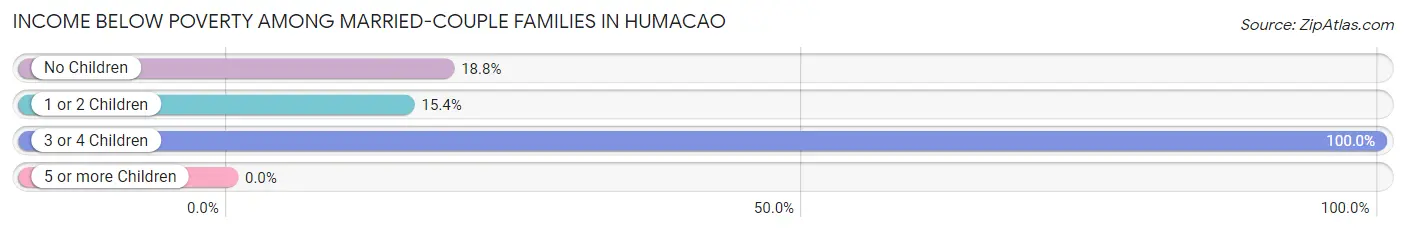
| Children | Above Poverty | Below Poverty |
| No Children | 1,350 (81.2%) | 313 (18.8%) |
| 1 or 2 Children | 402 (84.6%) | 73 (15.4%) |
| 3 or 4 Children | 0 (0.0%) | 30 (100.0%) |
| 5 or more Children | 0 (0.0%) | 0 (0.0%) |
| Total | 1,752 (80.8%) | 416 (19.2%) |
Income Below Poverty Among Single-Parent Households in Humacao
According to the poverty data in Humacao, 39.6% or 99 single-father households and 60.1% or 833 single-mother households are living below the poverty line. Among single-father households, those with no children have the highest poverty rate, with 69 households (45.7%) experiencing poverty. Likewise, among single-mother households, those with 3 or 4 children have the highest poverty rate, with 74 households (100.0%) falling below the poverty line.
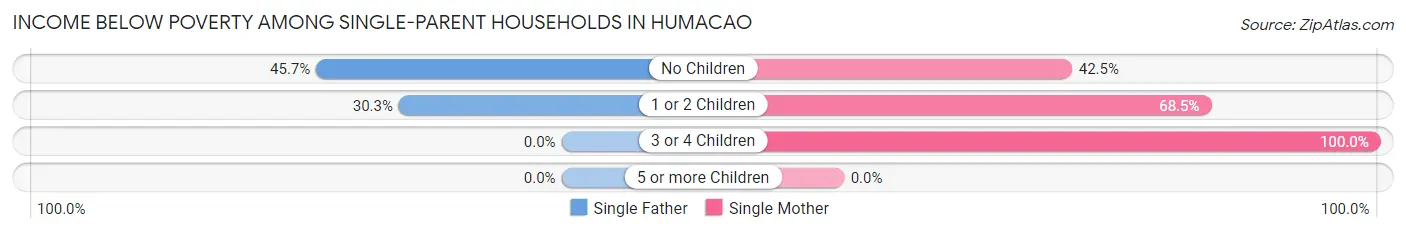
| Children | Single Father | Single Mother |
| No Children | 69 (45.7%) | 229 (42.5%) |
| 1 or 2 Children | 30 (30.3%) | 530 (68.5%) |
| 3 or 4 Children | 0 (0.0%) | 74 (100.0%) |
| 5 or more Children | 0 (0.0%) | 0 (0.0%) |
| Total | 99 (39.6%) | 833 (60.1%) |
Income Below Poverty Among Married-Couple vs Single-Parent Households in Humacao
The poverty data for Humacao shows that 416 of the married-couple family households (19.2%) and 932 of the single-parent households (56.9%) are living below the poverty level. Within the married-couple family households, those with 3 or 4 children have the highest poverty rate, with 30 households (100.0%) falling below the poverty line. Among the single-parent households, those with 3 or 4 children have the highest poverty rate, with 74 household (100.0%) living below poverty.
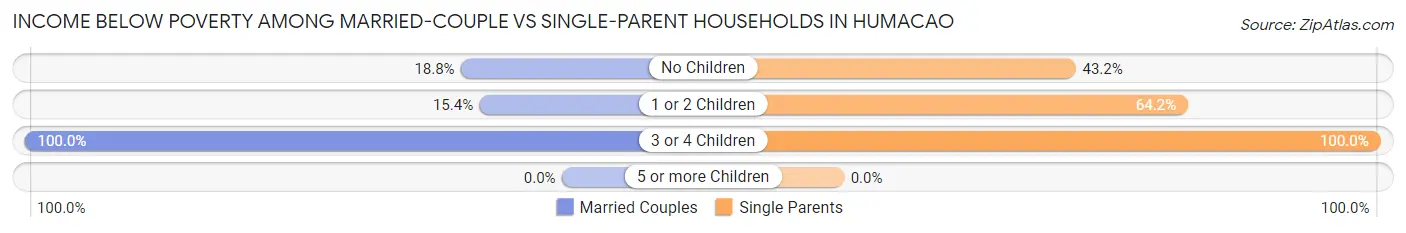
| Children | Married-Couple Families | Single-Parent Households |
| No Children | 313 (18.8%) | 298 (43.2%) |
| 1 or 2 Children | 73 (15.4%) | 560 (64.1%) |
| 3 or 4 Children | 30 (100.0%) | 74 (100.0%) |
| 5 or more Children | 0 (0.0%) | 0 (0.0%) |
| Total | 416 (19.2%) | 932 (56.9%) |
Race in Humacao
The most populous races in Humacao are Hispanic or Latino (16,632 | 99.2%), Some other Race (9,193 | 54.8%), and White / Caucasian (4,555 | 27.2%).
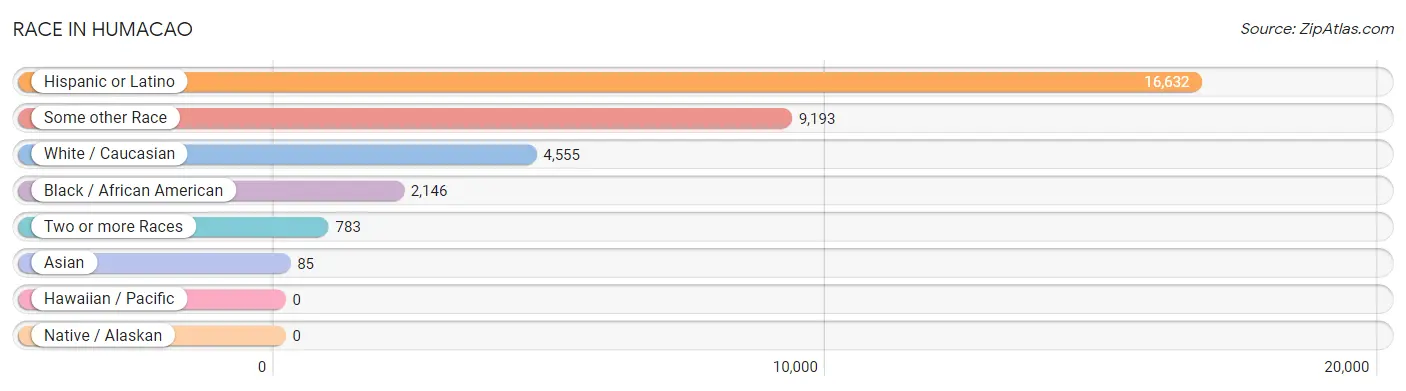
| Race | # Population | % Population |
| Asian | 85 | 0.5% |
| Black / African American | 2,146 | 12.8% |
| Hawaiian / Pacific | 0 | 0.0% |
| Hispanic or Latino | 16,632 | 99.2% |
| Native / Alaskan | 0 | 0.0% |
| White / Caucasian | 4,555 | 27.2% |
| Two or more Races | 783 | 4.7% |
| Some other Race | 9,193 | 54.8% |
| Total | 16,762 | 100.0% |
Ancestry in Humacao
The most populous ancestries reported in Humacao are Puerto Rican (16,004 | 95.5%), Dominican (236 | 1.4%), Mexican (197 | 1.2%), South American (119 | 0.7%), and American (99 | 0.6%), together accounting for 99.4% of all Humacao residents.
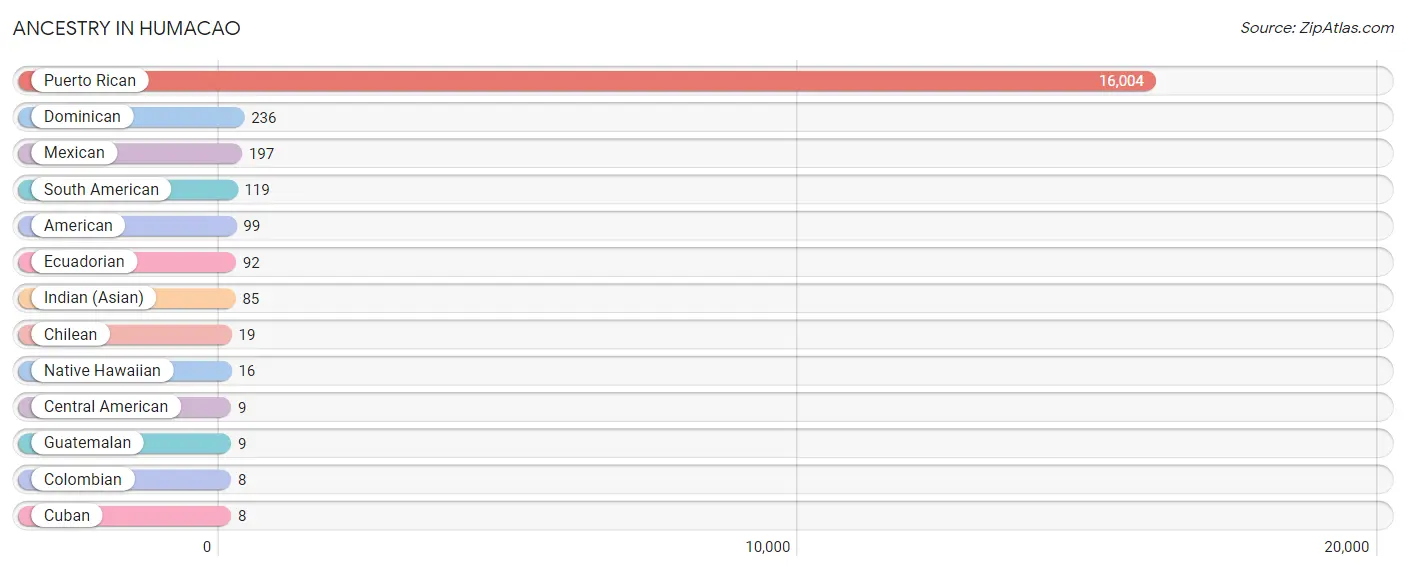
| Ancestry | # Population | % Population |
| American | 99 | 0.6% |
| Central American | 9 | 0.1% |
| Chilean | 19 | 0.1% |
| Colombian | 8 | 0.1% |
| Cuban | 8 | 0.1% |
| Dominican | 236 | 1.4% |
| Ecuadorian | 92 | 0.5% |
| Guatemalan | 9 | 0.1% |
| Indian (Asian) | 85 | 0.5% |
| Mexican | 197 | 1.2% |
| Native Hawaiian | 16 | 0.1% |
| Puerto Rican | 16,004 | 95.5% |
| South American | 119 | 0.7% | View All 13 Rows |
Immigrants in Humacao

| Immigration Origin | # Population | % Population | View All 0 Rows |
Sex and Age in Humacao
Sex and Age in Humacao
The most populous age groups in Humacao are 75 to 79 Years (670 | 8.6%) for men and 65 to 69 Years (761 | 8.5%) for women.
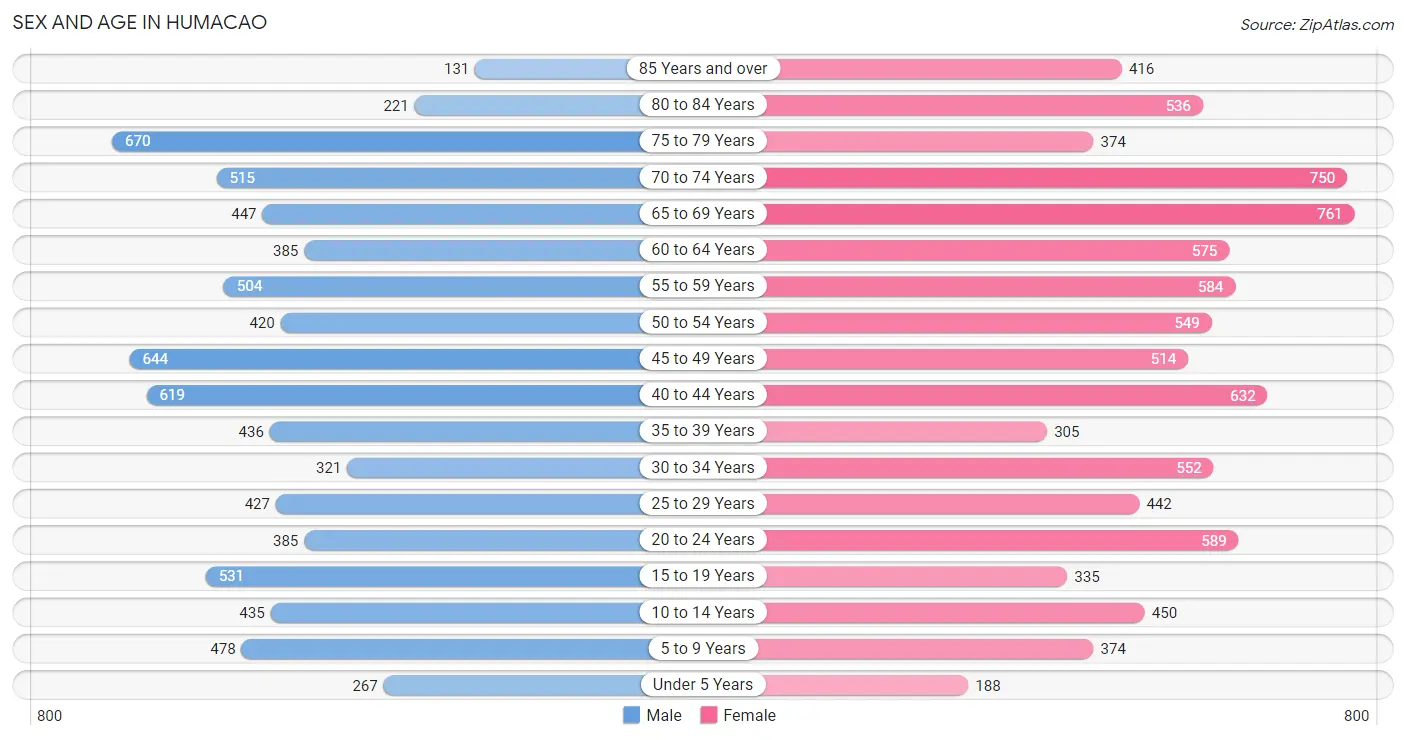
| Age Bracket | Male | Female |
| Under 5 Years | 267 (3.4%) | 188 (2.1%) |
| 5 to 9 Years | 478 (6.1%) | 374 (4.2%) |
| 10 to 14 Years | 435 (5.6%) | 450 (5.0%) |
| 15 to 19 Years | 531 (6.8%) | 335 (3.7%) |
| 20 to 24 Years | 385 (4.9%) | 589 (6.6%) |
| 25 to 29 Years | 427 (5.4%) | 442 (5.0%) |
| 30 to 34 Years | 321 (4.1%) | 552 (6.2%) |
| 35 to 39 Years | 436 (5.6%) | 305 (3.4%) |
| 40 to 44 Years | 619 (7.9%) | 632 (7.1%) |
| 45 to 49 Years | 644 (8.2%) | 514 (5.8%) |
| 50 to 54 Years | 420 (5.4%) | 549 (6.1%) |
| 55 to 59 Years | 504 (6.4%) | 584 (6.5%) |
| 60 to 64 Years | 385 (4.9%) | 575 (6.4%) |
| 65 to 69 Years | 447 (5.7%) | 761 (8.5%) |
| 70 to 74 Years | 515 (6.6%) | 750 (8.4%) |
| 75 to 79 Years | 670 (8.6%) | 374 (4.2%) |
| 80 to 84 Years | 221 (2.8%) | 536 (6.0%) |
| 85 Years and over | 131 (1.7%) | 416 (4.7%) |
| Total | 7,836 (100.0%) | 8,926 (100.0%) |
Families and Households in Humacao
Median Family Size in Humacao
The median family size in Humacao is 3.48 persons per family, with single male/father families (250 | 6.6%) accounting for the largest median family size of 4.15 persons per family. On the other hand, single female/mother families (1,387 | 36.4%) represent the smallest median family size with 3.33 persons per family.
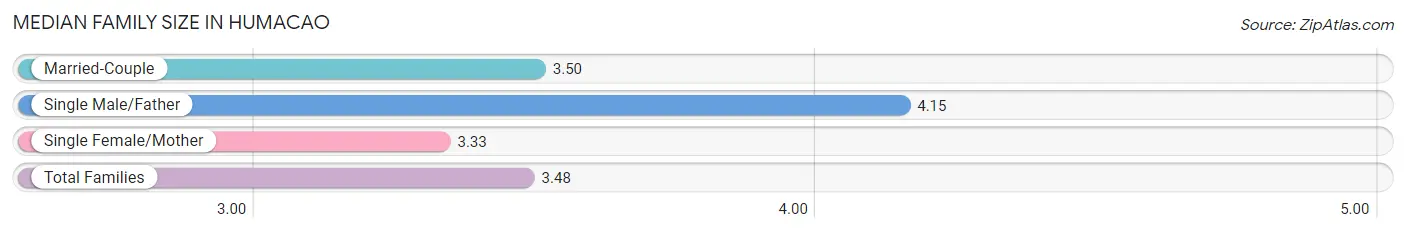
| Family Type | # Families | Family Size |
| Married-Couple | 2,168 (57.0%) | 3.50 |
| Single Male/Father | 250 (6.6%) | 4.15 |
| Single Female/Mother | 1,387 (36.4%) | 3.33 |
| Total Families | 3,805 (100.0%) | 3.48 |
Median Household Size in Humacao
The median household size in Humacao is 2.56 persons per household, with single male/father households (250 | 3.8%) accounting for the largest median household size of 4.31 persons per household. non-family households (2,707 | 41.6%) represent the smallest median household size with 1.09 persons per household.
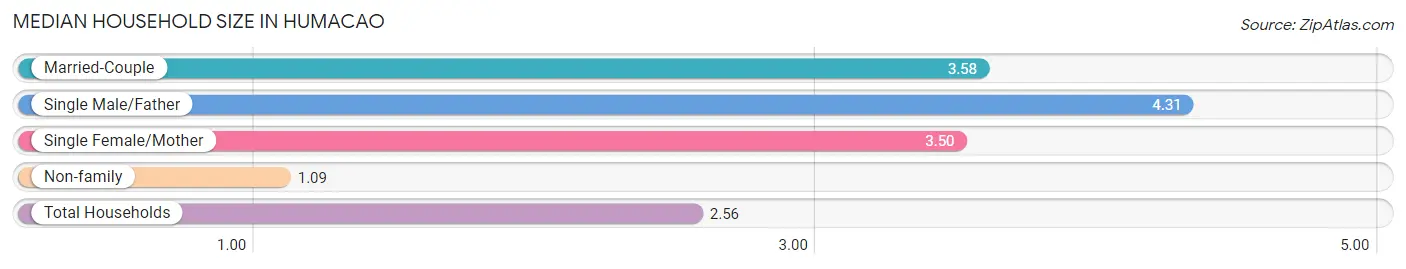
| Household Type | # Households | Household Size |
| Married-Couple | 2,168 (33.3%) | 3.58 |
| Single Male/Father | 250 (3.8%) | 4.31 |
| Single Female/Mother | 1,387 (21.3%) | 3.50 |
| Non-family | 2,707 (41.6%) | 1.09 |
| Total Households | 6,512 (100.0%) | 2.56 |
Household Size by Marriage Status in Humacao
Out of a total of 6,512 households in Humacao, 3,805 (58.4%) are family households, while 2,707 (41.6%) are nonfamily households. The most numerous type of family households are 2-person households, comprising 1,951, and the most common type of nonfamily households are 1-person households, comprising 2,498.
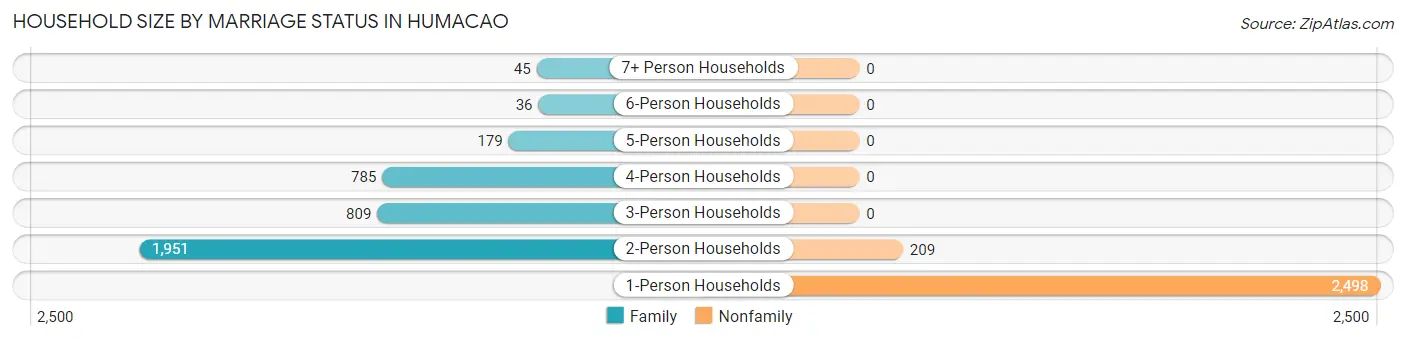
| Household Size | Family Households | Nonfamily Households |
| 1-Person Households | - | 2,498 (38.4%) |
| 2-Person Households | 1,951 (30.0%) | 209 (3.2%) |
| 3-Person Households | 809 (12.4%) | 0 (0.0%) |
| 4-Person Households | 785 (12.0%) | 0 (0.0%) |
| 5-Person Households | 179 (2.8%) | 0 (0.0%) |
| 6-Person Households | 36 (0.5%) | 0 (0.0%) |
| 7+ Person Households | 45 (0.7%) | 0 (0.0%) |
| Total | 3,805 (58.4%) | 2,707 (41.6%) |
Female Fertility in Humacao
Fertility by Age in Humacao
Average fertility rate in Humacao is 32.0 births per 1,000 women. Women in the age bracket of 20 to 34 years have the highest fertility rate with 45.0 births per 1,000 women. Women in the age bracket of 20 to 34 years acount for 64.3% of all women with births.
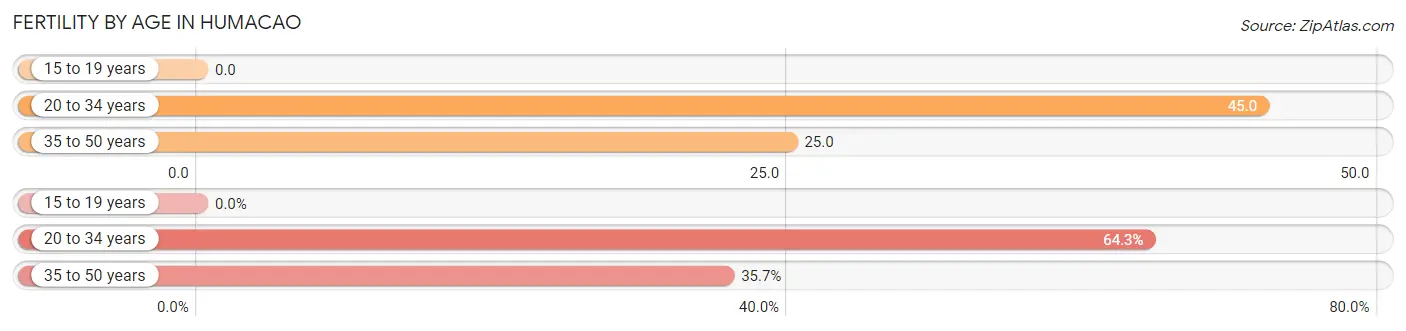
| Age Bracket | Women with Births | Births / 1,000 Women |
| 15 to 19 years | 0 (0.0%) | 0.0 |
| 20 to 34 years | 72 (64.3%) | 45.0 |
| 35 to 50 years | 40 (35.7%) | 25.0 |
| Total | 112 (100.0%) | 32.0 |
Fertility by Age by Marriage Status in Humacao
66.1% of women with births (112) in Humacao are married. The highest percentage of unmarried women with births falls into 20 to 34 years age bracket with 52.8% of them unmarried at the time of birth, while the lowest percentage of unmarried women with births belong to 35 to 50 years age bracket with 0.0% of them unmarried.
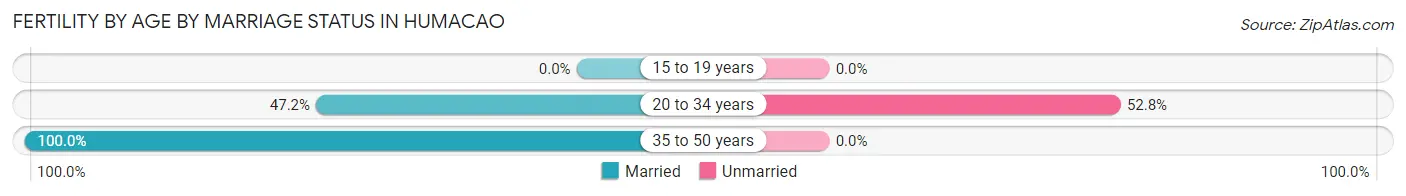
| Age Bracket | Married | Unmarried |
| 15 to 19 years | 0 (0.0%) | 0 (0.0%) |
| 20 to 34 years | 34 (47.2%) | 38 (52.8%) |
| 35 to 50 years | 40 (100.0%) | 0 (0.0%) |
| Total | 74 (66.1%) | 38 (33.9%) |
Fertility by Education in Humacao
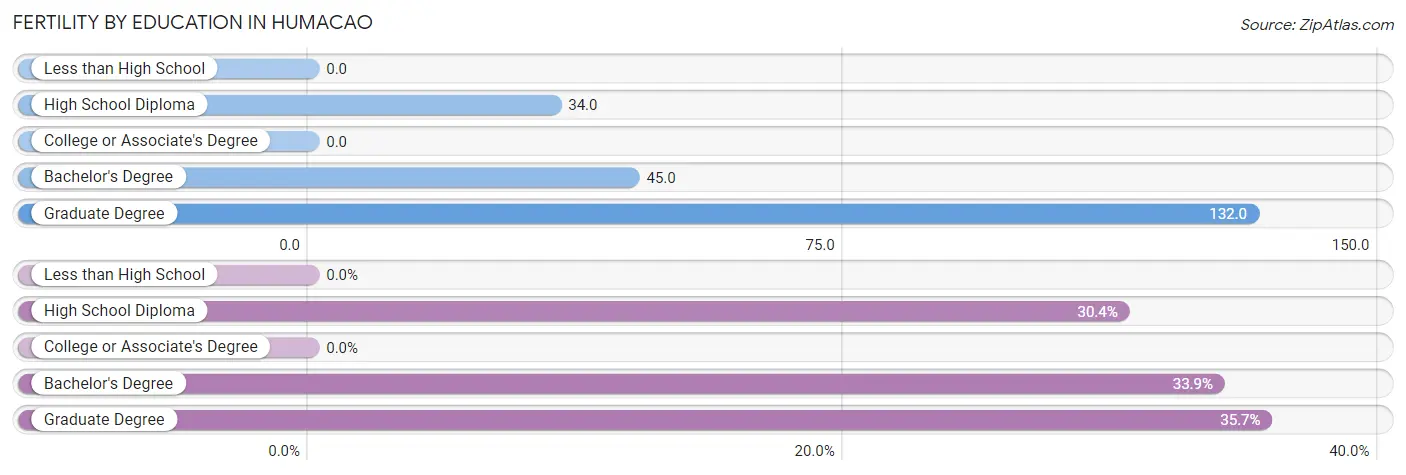
| Educational Attainment | Women with Births | Births / 1,000 Women |
| Less than High School | 0 (0.0%) | 0.0 |
| High School Diploma | 34 (30.4%) | 34.0 |
| College or Associate's Degree | 0 (0.0%) | 0.0 |
| Bachelor's Degree | 38 (33.9%) | 45.0 |
| Graduate Degree | 40 (35.7%) | 132.0 |
| Total | 112 (100.0%) | 32.0 |
Fertility by Education by Marriage Status in Humacao
33.9% of women with births in Humacao are unmarried. Women with the educational attainment of high school diploma are most likely to be married with 100.0% of them married at childbirth, while women with the educational attainment of bachelor's degree are least likely to be married with 100.0% of them unmarried at childbirth.
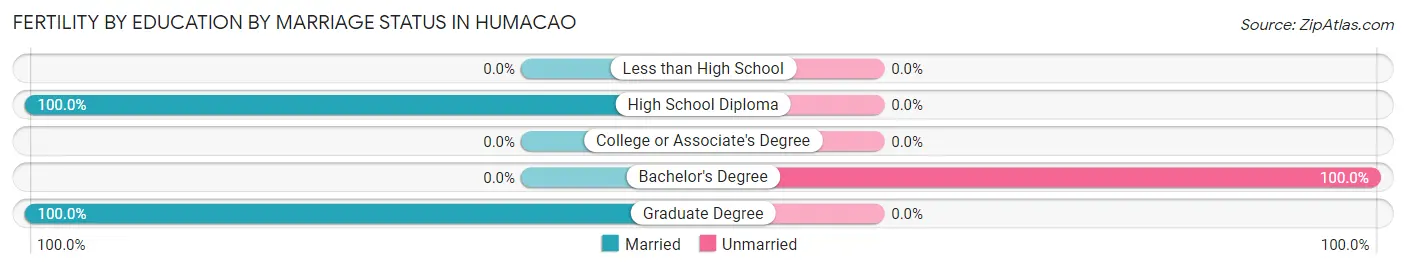
| Educational Attainment | Married | Unmarried |
| Less than High School | 0 (0.0%) | 0 (0.0%) |
| High School Diploma | 34 (100.0%) | 0 (0.0%) |
| College or Associate's Degree | 0 (0.0%) | 0 (0.0%) |
| Bachelor's Degree | 0 (0.0%) | 38 (100.0%) |
| Graduate Degree | 40 (100.0%) | 0 (0.0%) |
| Total | 74 (66.1%) | 38 (33.9%) |
Employment Characteristics in Humacao
Employment by Class of Employer in Humacao
Among the 4,453 employed individuals in Humacao, private company employees (2,441 | 54.8%), state government employees (737 | 16.6%), and local government employees (387 | 8.7%) make up the most common classes of employment.
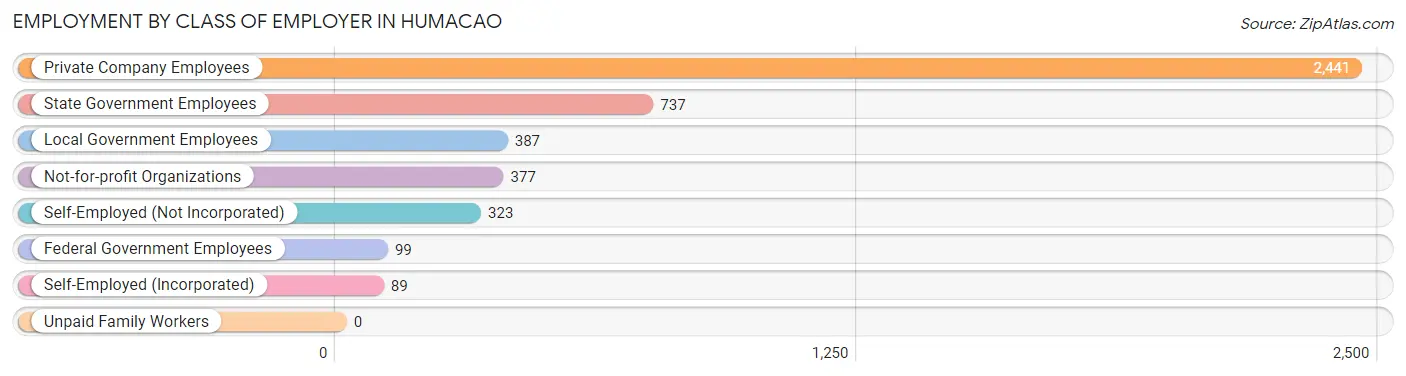
| Employer Class | # Employees | % Employees |
| Private Company Employees | 2,441 | 54.8% |
| Self-Employed (Incorporated) | 89 | 2.0% |
| Self-Employed (Not Incorporated) | 323 | 7.2% |
| Not-for-profit Organizations | 377 | 8.5% |
| Local Government Employees | 387 | 8.7% |
| State Government Employees | 737 | 16.6% |
| Federal Government Employees | 99 | 2.2% |
| Unpaid Family Workers | 0 | 0.0% |
| Total | 4,453 | 100.0% |
Employment Status by Age in Humacao
According to the labor force statistics for Humacao, out of the total population over 16 years of age (14,314), 35.3% or 5,053 individuals are in the labor force, with 10.8% or 546 of them unemployed. The age group with the highest labor force participation rate is 35 to 44 years, with 70.6% or 1,406 individuals in the labor force. Within the labor force, the 20 to 24 years age range has the highest percentage of unemployed individuals, with 23.4% or 98 of them being unemployed.
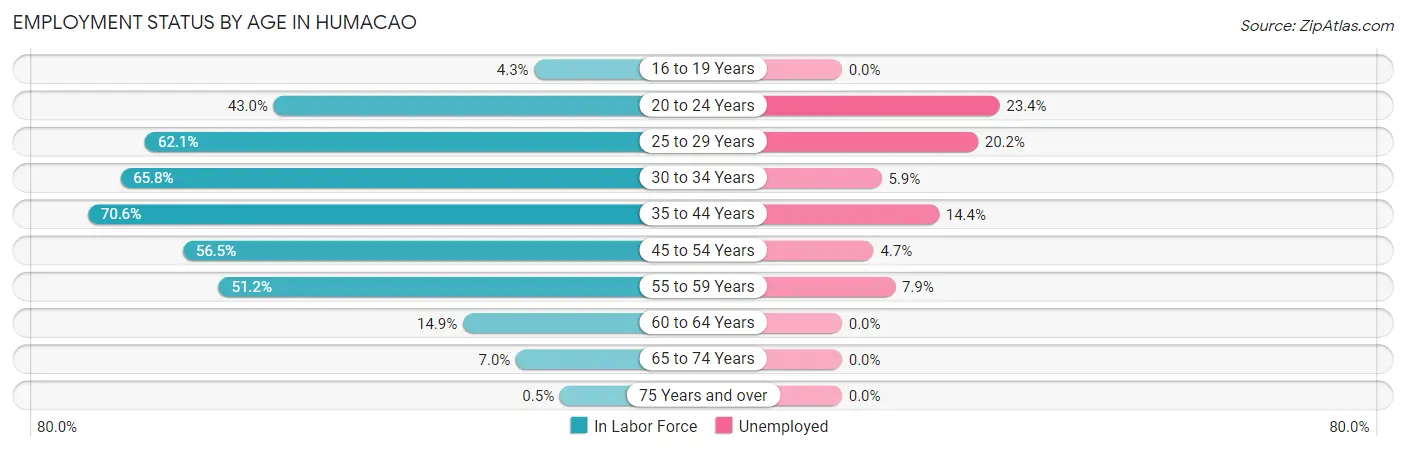
| Age Bracket | In Labor Force | Unemployed |
| 16 to 19 Years | 26 (4.3%) | 0 (0.0%) |
| 20 to 24 Years | 419 (43.0%) | 98 (23.4%) |
| 25 to 29 Years | 540 (62.1%) | 109 (20.2%) |
| 30 to 34 Years | 574 (65.8%) | 34 (5.9%) |
| 35 to 44 Years | 1,406 (70.6%) | 202 (14.4%) |
| 45 to 54 Years | 1,202 (56.5%) | 56 (4.7%) |
| 55 to 59 Years | 557 (51.2%) | 44 (7.9%) |
| 60 to 64 Years | 143 (14.9%) | 0 (0.0%) |
| 65 to 74 Years | 173 (7.0%) | 0 (0.0%) |
| 75 Years and over | 12 (0.5%) | 0 (0.0%) |
| Total | 5,053 (35.3%) | 546 (10.8%) |
Employment Status by Educational Attainment in Humacao
According to labor force statistics for Humacao, 55.9% of individuals (4,421) out of the total population between 25 and 64 years of age (7,909) are in the labor force, with 10.1% or 447 of them being unemployed. The group with the highest labor force participation rate are those with the educational attainment of bachelor's degree or higher, with 73.5% or 1,711 individuals in the labor force. Within the labor force, individuals with high school diploma education have the highest percentage of unemployment, with 18.7% or 280 of them being unemployed.
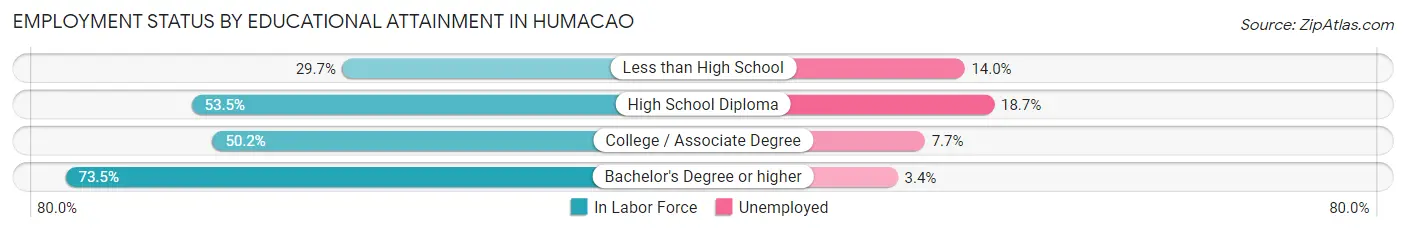
| Educational Attainment | In Labor Force | Unemployed |
| Less than High School | 265 (29.7%) | 125 (14.0%) |
| High School Diploma | 1,495 (53.5%) | 523 (18.7%) |
| College / Associate Degree | 951 (50.2%) | 146 (7.7%) |
| Bachelor's Degree or higher | 1,711 (73.5%) | 79 (3.4%) |
| Total | 4,421 (55.9%) | 799 (10.1%) |
Employment Occupations by Sex in Humacao
Management, Business, Science and Arts Occupations
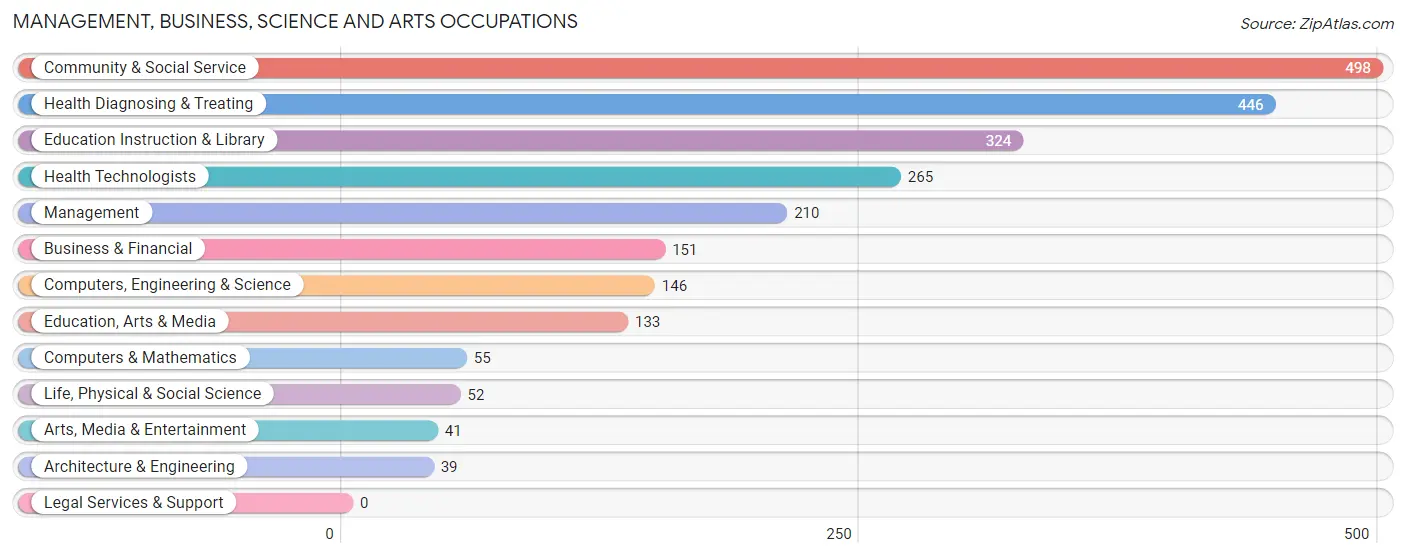
The most common Management, Business, Science and Arts occupations in Humacao are Community & Social Service (498 | 11.1%), Health Diagnosing & Treating (446 | 9.9%), Education Instruction & Library (324 | 7.2%), Health Technologists (265 | 5.9%), and Management (210 | 4.7%).
Management, Business, Science and Arts Occupations by Sex
Within the Management, Business, Science and Arts occupations in Humacao, the most male-oriented occupations are Architecture & Engineering (100.0%), Computers & Mathematics (60.0%), and Computers, Engineering & Science (49.3%), while the most female-oriented occupations are Life, Physical & Social Science (100.0%), Education Instruction & Library (81.2%), and Community & Social Service (72.3%).
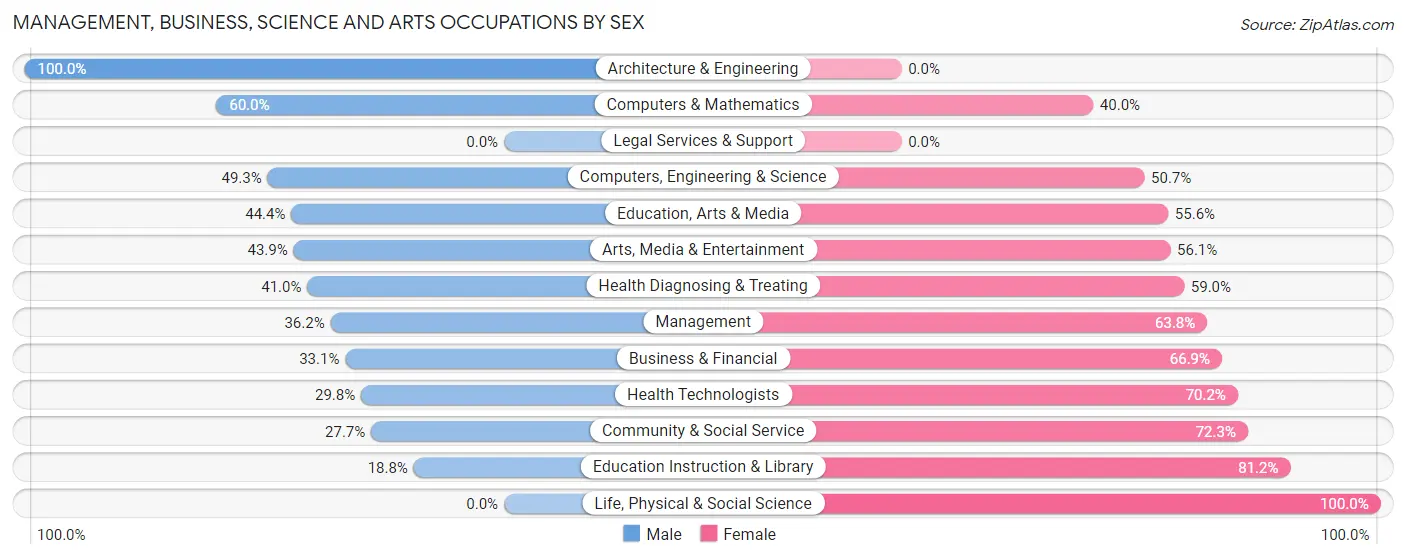
| Occupation | Male | Female |
| Management | 76 (36.2%) | 134 (63.8%) |
| Business & Financial | 50 (33.1%) | 101 (66.9%) |
| Computers, Engineering & Science | 72 (49.3%) | 74 (50.7%) |
| Computers & Mathematics | 33 (60.0%) | 22 (40.0%) |
| Architecture & Engineering | 39 (100.0%) | 0 (0.0%) |
| Life, Physical & Social Science | 0 (0.0%) | 52 (100.0%) |
| Community & Social Service | 138 (27.7%) | 360 (72.3%) |
| Education, Arts & Media | 59 (44.4%) | 74 (55.6%) |
| Legal Services & Support | 0 (0.0%) | 0 (0.0%) |
| Education Instruction & Library | 61 (18.8%) | 263 (81.2%) |
| Arts, Media & Entertainment | 18 (43.9%) | 23 (56.1%) |
| Health Diagnosing & Treating | 183 (41.0%) | 263 (59.0%) |
| Health Technologists | 79 (29.8%) | 186 (70.2%) |
| Total (Category) | 519 (35.8%) | 932 (64.2%) |
| Total (Overall) | 2,372 (52.6%) | 2,136 (47.4%) |
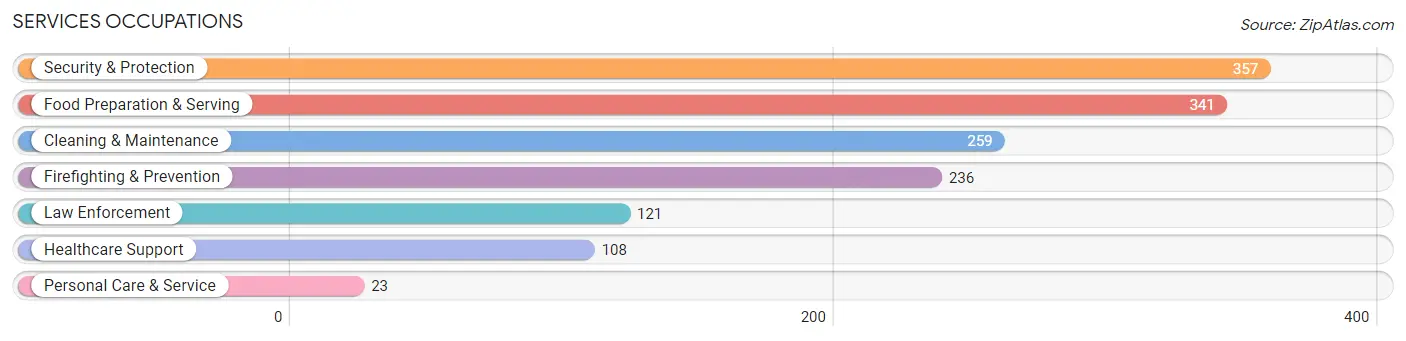
Services Occupations
The most common Services occupations in Humacao are Security & Protection (357 | 7.9%), Food Preparation & Serving (341 | 7.6%), Cleaning & Maintenance (259 | 5.8%), Firefighting & Prevention (236 | 5.2%), and Law Enforcement (121 | 2.7%).
Services Occupations by Sex
Within the Services occupations in Humacao, the most male-oriented occupations are Security & Protection (100.0%), Firefighting & Prevention (100.0%), and Law Enforcement (100.0%), while the most female-oriented occupations are Personal Care & Service (100.0%), Food Preparation & Serving (68.0%), and Healthcare Support (61.1%).
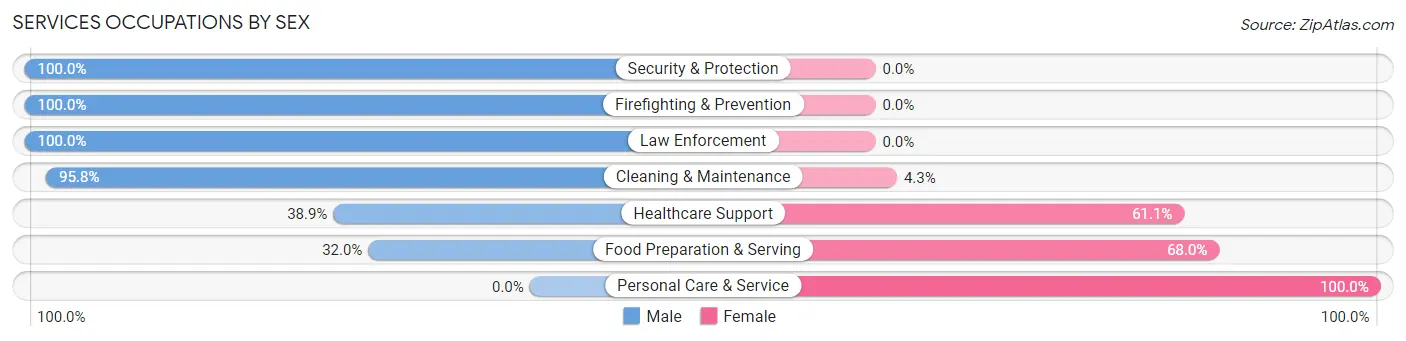
| Occupation | Male | Female |
| Healthcare Support | 42 (38.9%) | 66 (61.1%) |
| Security & Protection | 357 (100.0%) | 0 (0.0%) |
| Firefighting & Prevention | 236 (100.0%) | 0 (0.0%) |
| Law Enforcement | 121 (100.0%) | 0 (0.0%) |
| Food Preparation & Serving | 109 (32.0%) | 232 (68.0%) |
| Cleaning & Maintenance | 248 (95.8%) | 11 (4.3%) |
| Personal Care & Service | 0 (0.0%) | 23 (100.0%) |
| Total (Category) | 756 (69.5%) | 332 (30.5%) |
| Total (Overall) | 2,372 (52.6%) | 2,136 (47.4%) |
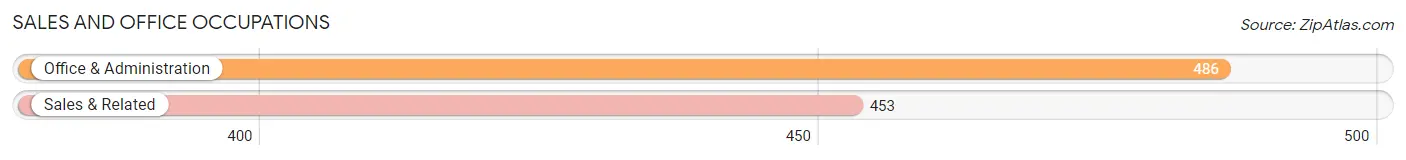
Sales and Office Occupations
The most common Sales and Office occupations in Humacao are Office & Administration (486 | 10.8%), and Sales & Related (453 | 10.1%).
Sales and Office Occupations by Sex
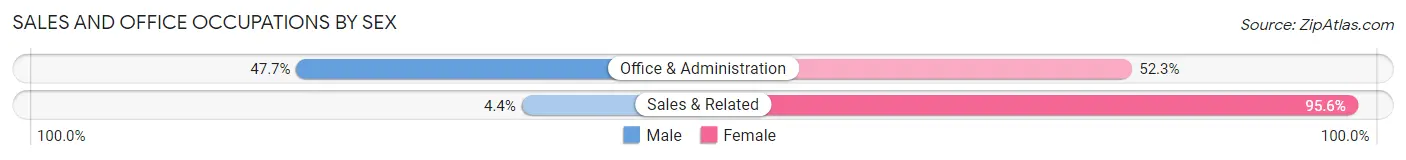
| Occupation | Male | Female |
| Sales & Related | 20 (4.4%) | 433 (95.6%) |
| Office & Administration | 232 (47.7%) | 254 (52.3%) |
| Total (Category) | 252 (26.8%) | 687 (73.2%) |
| Total (Overall) | 2,372 (52.6%) | 2,136 (47.4%) |
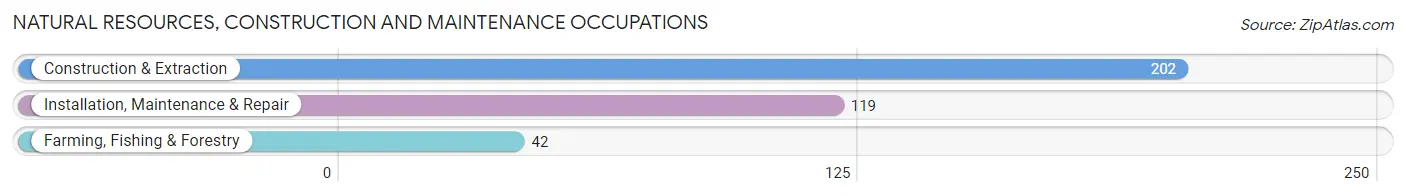
Natural Resources, Construction and Maintenance Occupations
The most common Natural Resources, Construction and Maintenance occupations in Humacao are Construction & Extraction (202 | 4.5%), Installation, Maintenance & Repair (119 | 2.6%), and Farming, Fishing & Forestry (42 | 0.9%).
Natural Resources, Construction and Maintenance Occupations by Sex
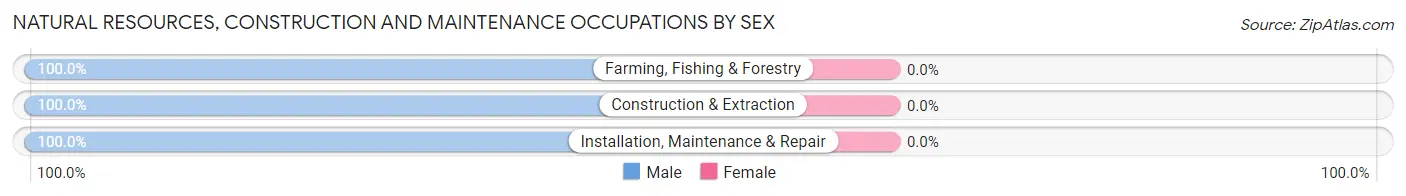
| Occupation | Male | Female |
| Farming, Fishing & Forestry | 42 (100.0%) | 0 (0.0%) |
| Construction & Extraction | 202 (100.0%) | 0 (0.0%) |
| Installation, Maintenance & Repair | 119 (100.0%) | 0 (0.0%) |
| Total (Category) | 363 (100.0%) | 0 (0.0%) |
| Total (Overall) | 2,372 (52.6%) | 2,136 (47.4%) |
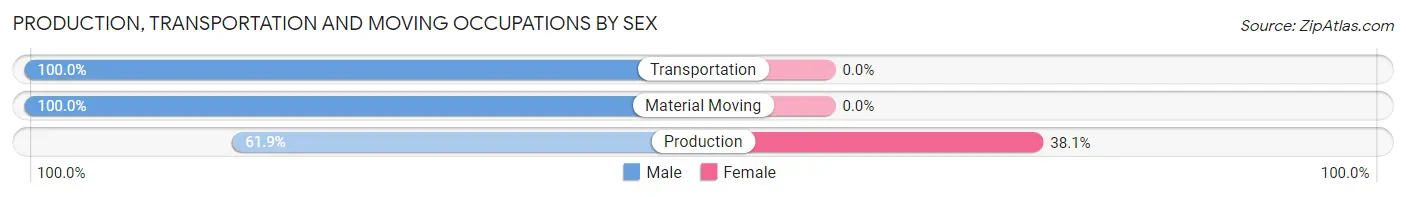
Production, Transportation and Moving Occupations
The most common Production, Transportation and Moving occupations in Humacao are Production (485 | 10.8%), Transportation (142 | 3.2%), and Material Moving (40 | 0.9%).
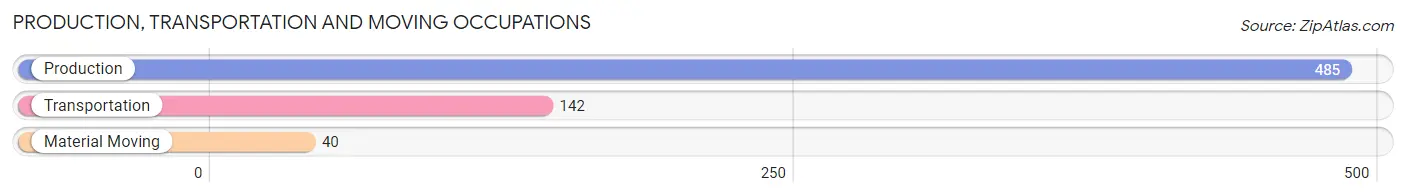
Production, Transportation and Moving Occupations by Sex
| Occupation | Male | Female |
| Production | 300 (61.9%) | 185 (38.1%) |
| Transportation | 142 (100.0%) | 0 (0.0%) |
| Material Moving | 40 (100.0%) | 0 (0.0%) |
| Total (Category) | 482 (72.3%) | 185 (27.7%) |
| Total (Overall) | 2,372 (52.6%) | 2,136 (47.4%) |
Employment Industries by Sex in Humacao
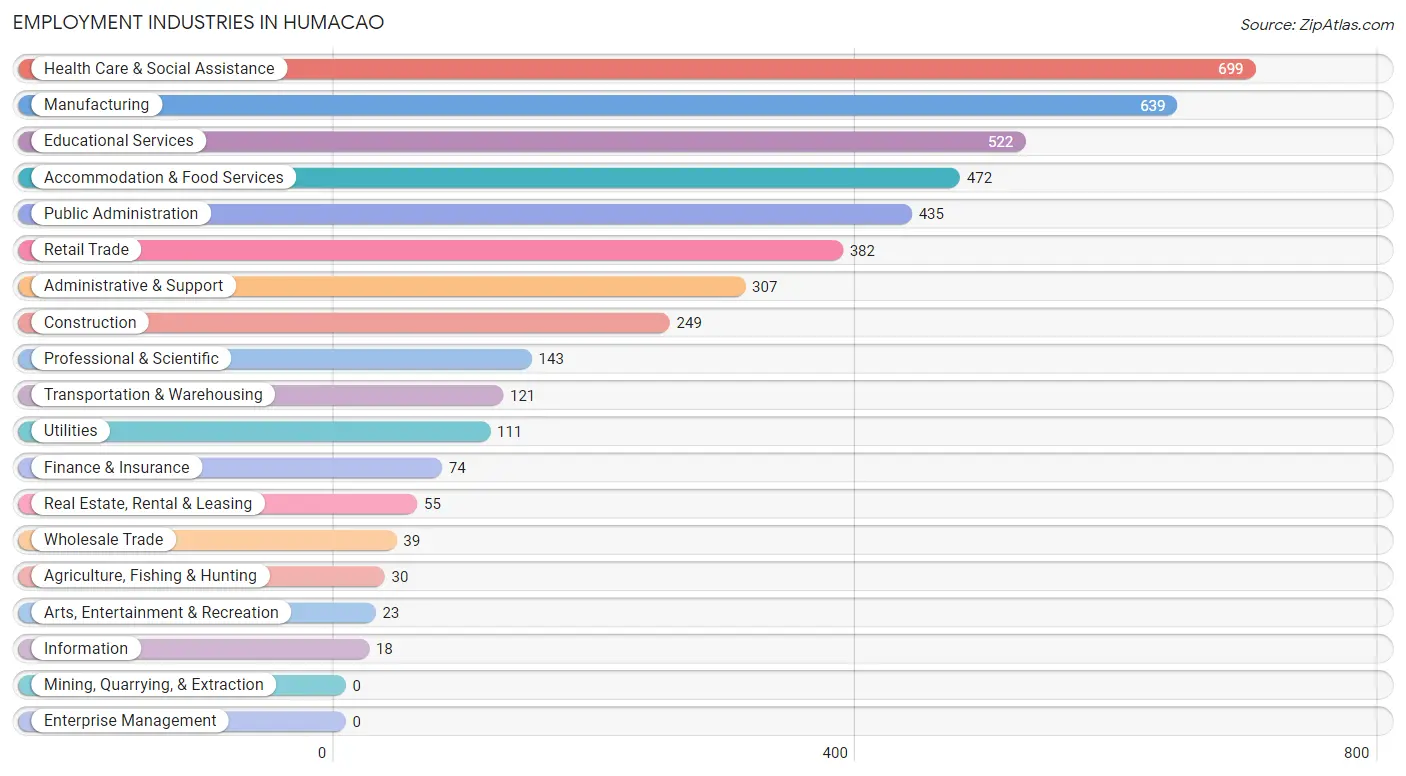
Employment Industries in Humacao
The major employment industries in Humacao include Health Care & Social Assistance (699 | 15.5%), Manufacturing (639 | 14.2%), Educational Services (522 | 11.6%), Accommodation & Food Services (472 | 10.5%), and Public Administration (435 | 9.7%).
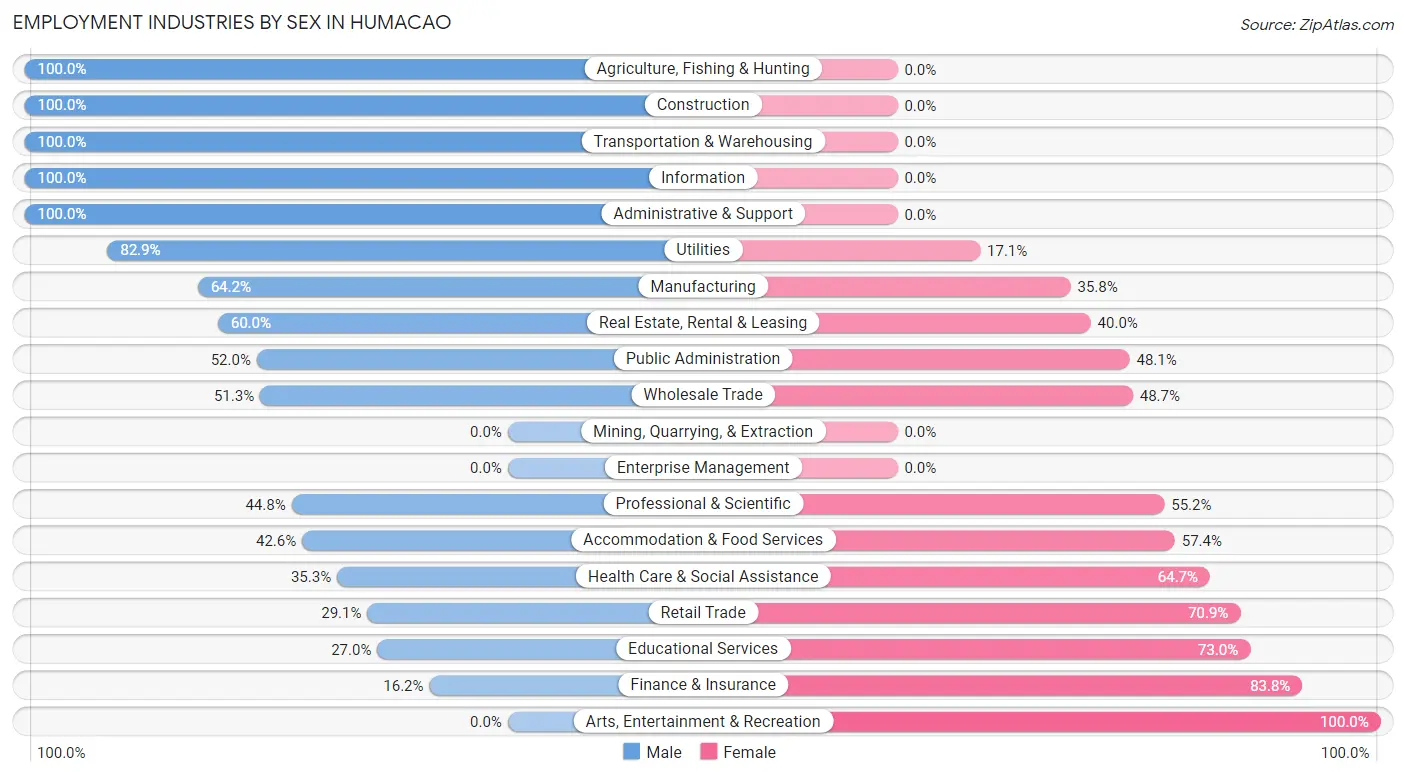
Employment Industries by Sex in Humacao
The Humacao industries that see more men than women are Agriculture, Fishing & Hunting (100.0%), Construction (100.0%), and Transportation & Warehousing (100.0%), whereas the industries that tend to have a higher number of women are Arts, Entertainment & Recreation (100.0%), Finance & Insurance (83.8%), and Educational Services (73.0%).
| Industry | Male | Female |
| Agriculture, Fishing & Hunting | 30 (100.0%) | 0 (0.0%) |
| Mining, Quarrying, & Extraction | 0 (0.0%) | 0 (0.0%) |
| Construction | 249 (100.0%) | 0 (0.0%) |
| Manufacturing | 410 (64.2%) | 229 (35.8%) |
| Wholesale Trade | 20 (51.3%) | 19 (48.7%) |
| Retail Trade | 111 (29.1%) | 271 (70.9%) |
| Transportation & Warehousing | 121 (100.0%) | 0 (0.0%) |
| Utilities | 92 (82.9%) | 19 (17.1%) |
| Information | 18 (100.0%) | 0 (0.0%) |
| Finance & Insurance | 12 (16.2%) | 62 (83.8%) |
| Real Estate, Rental & Leasing | 33 (60.0%) | 22 (40.0%) |
| Professional & Scientific | 64 (44.8%) | 79 (55.2%) |
| Enterprise Management | 0 (0.0%) | 0 (0.0%) |
| Administrative & Support | 307 (100.0%) | 0 (0.0%) |
| Educational Services | 141 (27.0%) | 381 (73.0%) |
| Health Care & Social Assistance | 247 (35.3%) | 452 (64.7%) |
| Arts, Entertainment & Recreation | 0 (0.0%) | 23 (100.0%) |
| Accommodation & Food Services | 201 (42.6%) | 271 (57.4%) |
| Public Administration | 226 (51.9%) | 209 (48.0%) |
| Total | 2,372 (52.6%) | 2,136 (47.4%) |
Education in Humacao
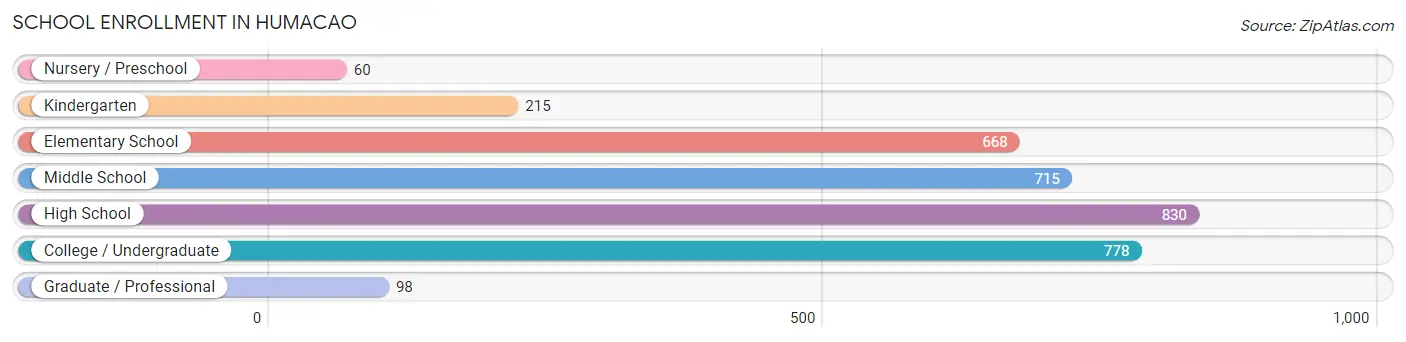
School Enrollment in Humacao
The most common levels of schooling among the 3,364 students in Humacao are high school (830 | 24.7%), college / undergraduate (778 | 23.1%), and middle school (715 | 21.2%).
| School Level | # Students | % Students |
| Nursery / Preschool | 60 | 1.8% |
| Kindergarten | 215 | 6.4% |
| Elementary School | 668 | 19.9% |
| Middle School | 715 | 21.2% |
| High School | 830 | 24.7% |
| College / Undergraduate | 778 | 23.1% |
| Graduate / Professional | 98 | 2.9% |
| Total | 3,364 | 100.0% |
School Enrollment by Age by Funding Source in Humacao
Out of a total of 3,364 students who are enrolled in schools in Humacao, 1,120 (33.3%) attend a private institution, while the remaining 2,244 (66.7%) are enrolled in public schools. The age group of 25 to 34 year olds has the highest likelihood of being enrolled in private schools, with 109 (64.5% in the age bracket) enrolled. Conversely, the age group of 3 to 4 year olds has the lowest likelihood of being enrolled in a private school, with 85 (100.0% in the age bracket) attending a public institution.
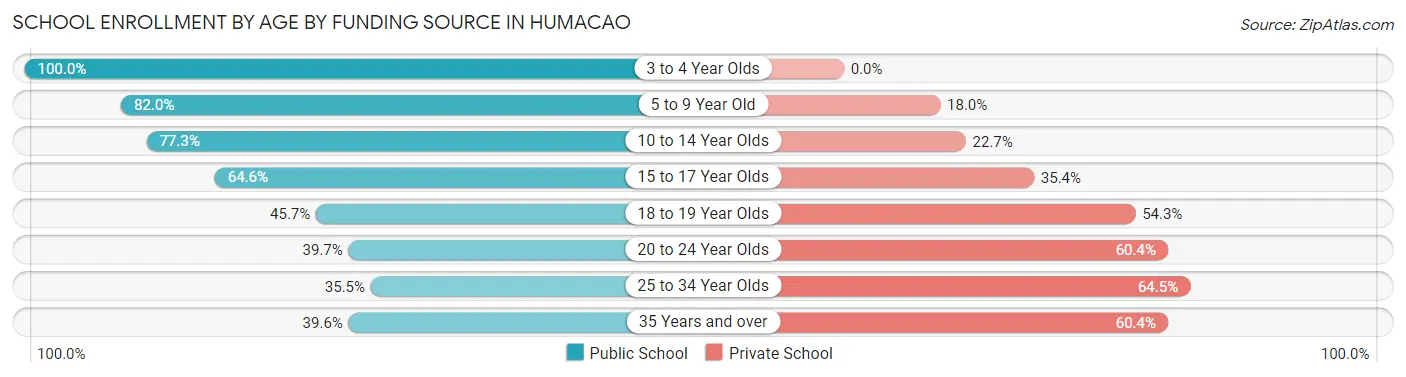
| Age Bracket | Public School | Private School |
| 3 to 4 Year Olds | 85 (100.0%) | 0 (0.0%) |
| 5 to 9 Year Old | 699 (82.0%) | 153 (18.0%) |
| 10 to 14 Year Olds | 684 (77.3%) | 201 (22.7%) |
| 15 to 17 Year Olds | 421 (64.6%) | 231 (35.4%) |
| 18 to 19 Year Olds | 69 (45.7%) | 82 (54.3%) |
| 20 to 24 Year Olds | 182 (39.7%) | 277 (60.4%) |
| 25 to 34 Year Olds | 60 (35.5%) | 109 (64.5%) |
| 35 Years and over | 44 (39.6%) | 67 (60.4%) |
| Total | 2,244 (66.7%) | 1,120 (33.3%) |
Educational Attainment by Field of Study in Humacao
Business (784 | 24.4%), education (594 | 18.5%), science & technology (464 | 14.4%), arts & humanities (421 | 13.1%), and social sciences (202 | 6.3%) are the most common fields of study among 3,213 individuals in Humacao who have obtained a bachelor's degree or higher.
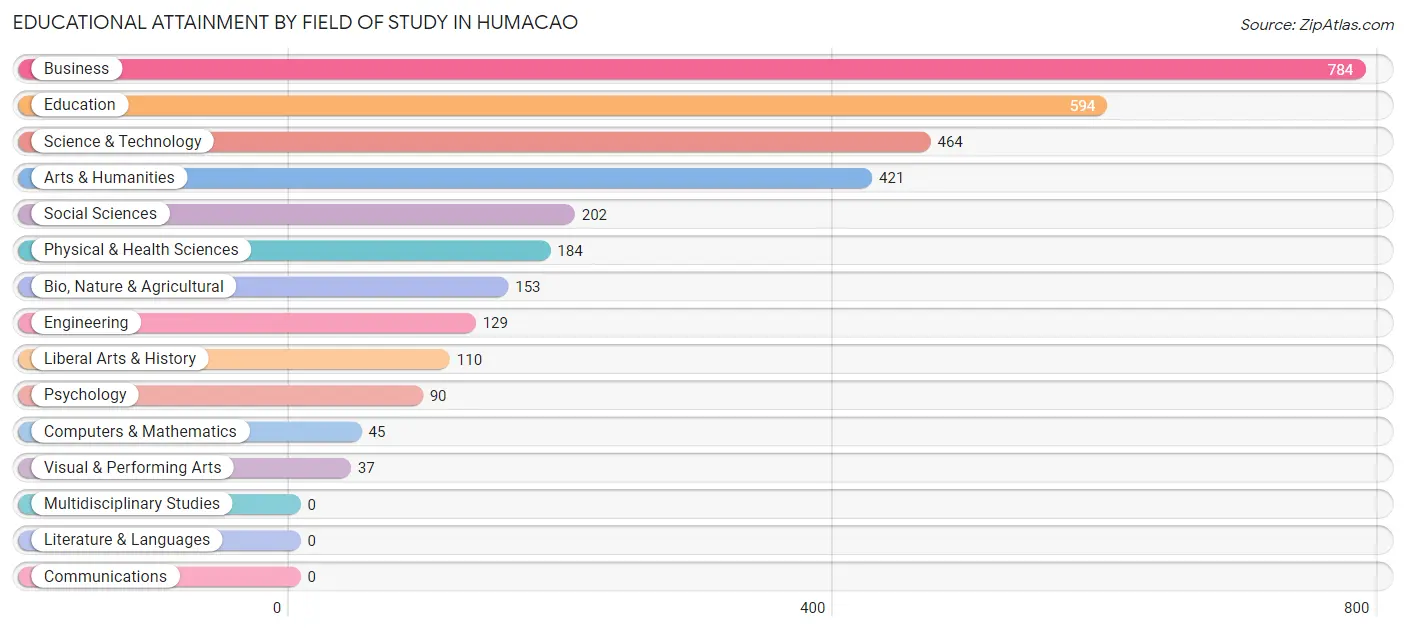
| Field of Study | # Graduates | % Graduates |
| Computers & Mathematics | 45 | 1.4% |
| Bio, Nature & Agricultural | 153 | 4.8% |
| Physical & Health Sciences | 184 | 5.7% |
| Psychology | 90 | 2.8% |
| Social Sciences | 202 | 6.3% |
| Engineering | 129 | 4.0% |
| Multidisciplinary Studies | 0 | 0.0% |
| Science & Technology | 464 | 14.4% |
| Business | 784 | 24.4% |
| Education | 594 | 18.5% |
| Literature & Languages | 0 | 0.0% |
| Liberal Arts & History | 110 | 3.4% |
| Visual & Performing Arts | 37 | 1.1% |
| Communications | 0 | 0.0% |
| Arts & Humanities | 421 | 13.1% |
| Total | 3,213 | 100.0% |
Transportation & Commute in Humacao
Vehicle Availability by Sex in Humacao
The most prevalent vehicle ownership categories in Humacao are males with 2 vehicles (1,143, accounting for 48.2%) and females with 2 vehicles (776, making up 55.0%).
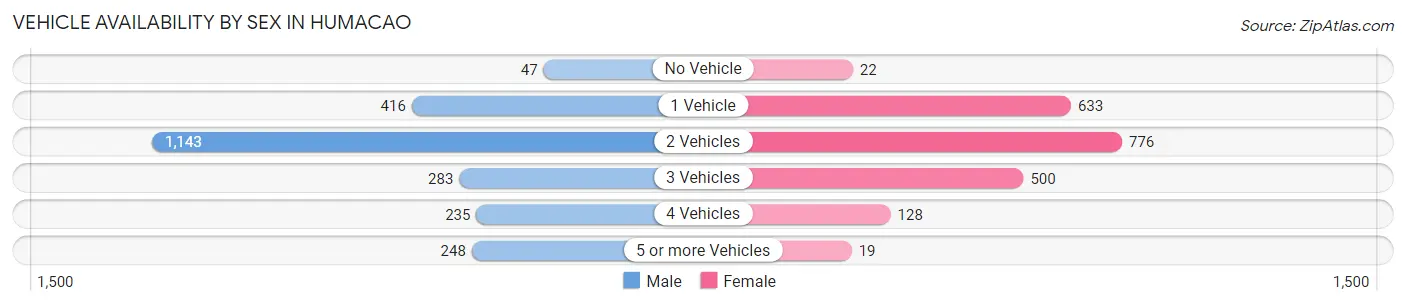
| Vehicles Available | Male | Female |
| No Vehicle | 47 (2.0%) | 22 (1.1%) |
| 1 Vehicle | 416 (17.5%) | 633 (30.5%) |
| 2 Vehicles | 1,143 (48.2%) | 776 (37.3%) |
| 3 Vehicles | 283 (11.9%) | 500 (24.1%) |
| 4 Vehicles | 235 (9.9%) | 128 (6.2%) |
| 5 or more Vehicles | 248 (10.5%) | 19 (0.9%) |
| Total | 2,372 (100.0%) | 2,078 (100.0%) |
Commute Time in Humacao
The most frequently occuring commute durations in Humacao are 20 to 24 minutes (967 commuters, 22.1%), 15 to 19 minutes (867 commuters, 19.8%), and 10 to 14 minutes (802 commuters, 18.3%).
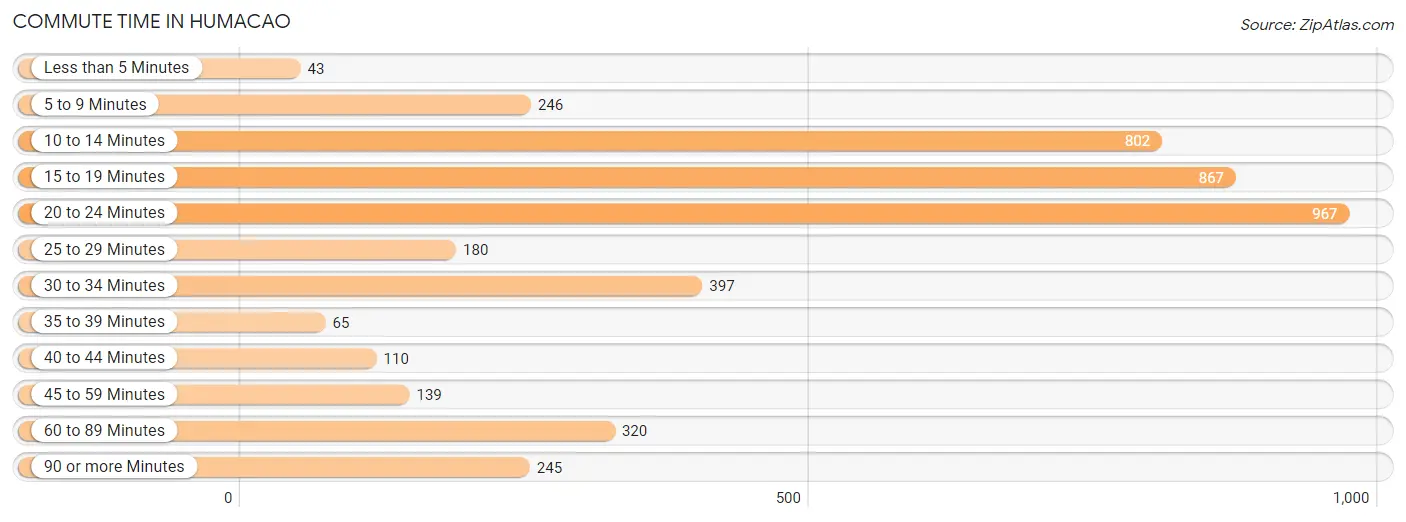
| Commute Time | # Commuters | % Commuters |
| Less than 5 Minutes | 43 | 1.0% |
| 5 to 9 Minutes | 246 | 5.6% |
| 10 to 14 Minutes | 802 | 18.3% |
| 15 to 19 Minutes | 867 | 19.8% |
| 20 to 24 Minutes | 967 | 22.1% |
| 25 to 29 Minutes | 180 | 4.1% |
| 30 to 34 Minutes | 397 | 9.1% |
| 35 to 39 Minutes | 65 | 1.5% |
| 40 to 44 Minutes | 110 | 2.5% |
| 45 to 59 Minutes | 139 | 3.2% |
| 60 to 89 Minutes | 320 | 7.3% |
| 90 or more Minutes | 245 | 5.6% |
Commute Time by Sex in Humacao
The most common commute times in Humacao are 20 to 24 minutes (568 commuters, 24.4%) for males and 15 to 19 minutes (494 commuters, 24.0%) for females.
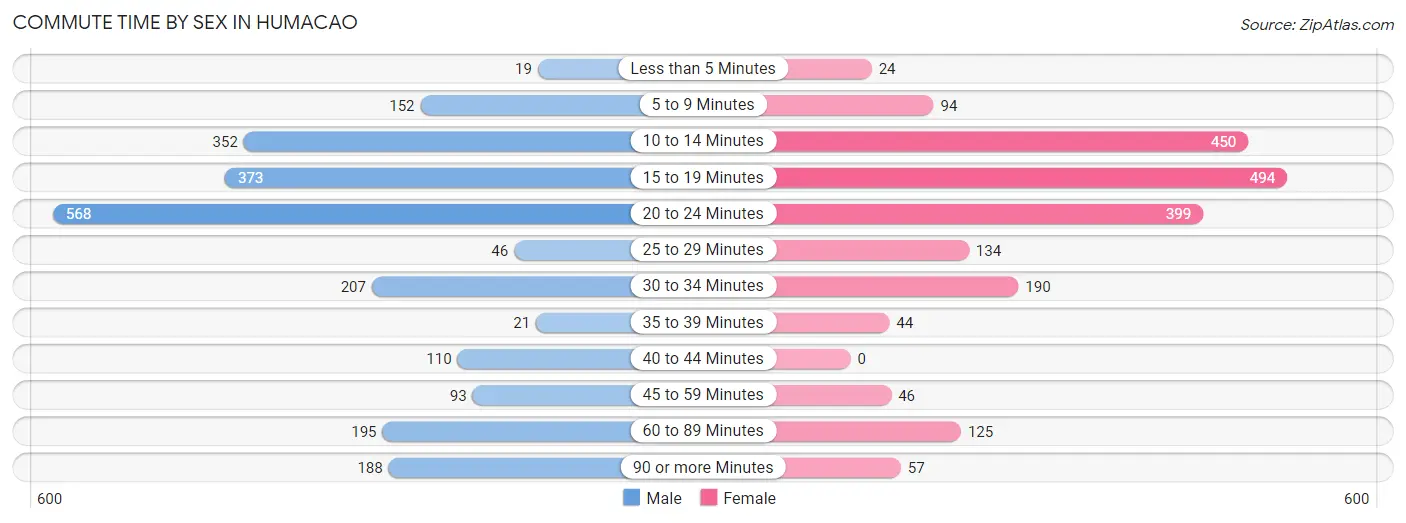
| Commute Time | Male | Female |
| Less than 5 Minutes | 19 (0.8%) | 24 (1.2%) |
| 5 to 9 Minutes | 152 (6.5%) | 94 (4.6%) |
| 10 to 14 Minutes | 352 (15.1%) | 450 (21.9%) |
| 15 to 19 Minutes | 373 (16.1%) | 494 (24.0%) |
| 20 to 24 Minutes | 568 (24.4%) | 399 (19.4%) |
| 25 to 29 Minutes | 46 (2.0%) | 134 (6.5%) |
| 30 to 34 Minutes | 207 (8.9%) | 190 (9.2%) |
| 35 to 39 Minutes | 21 (0.9%) | 44 (2.1%) |
| 40 to 44 Minutes | 110 (4.7%) | 0 (0.0%) |
| 45 to 59 Minutes | 93 (4.0%) | 46 (2.2%) |
| 60 to 89 Minutes | 195 (8.4%) | 125 (6.1%) |
| 90 or more Minutes | 188 (8.1%) | 57 (2.8%) |
Time of Departure to Work by Sex in Humacao
The most frequent times of departure to work in Humacao are 12:00 PM to 3:59 PM (330, 14.2%) for males and 7:00 AM to 7:29 AM (325, 15.8%) for females.
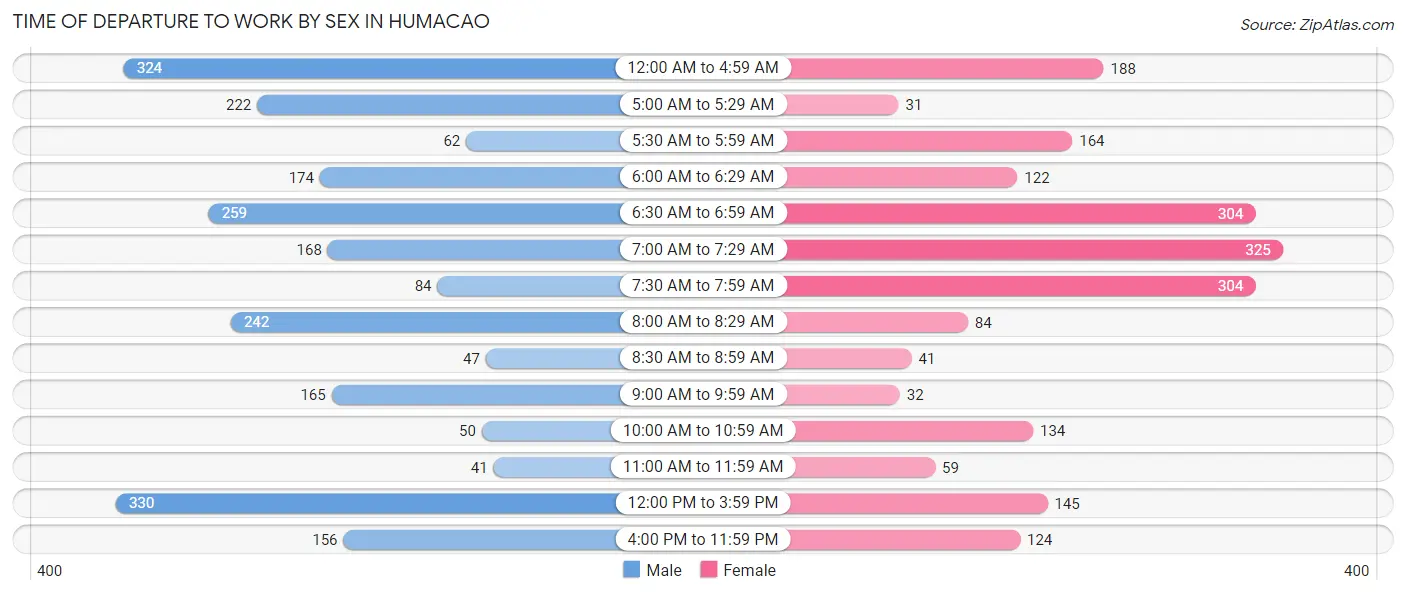
| Time of Departure | Male | Female |
| 12:00 AM to 4:59 AM | 324 (13.9%) | 188 (9.1%) |
| 5:00 AM to 5:29 AM | 222 (9.6%) | 31 (1.5%) |
| 5:30 AM to 5:59 AM | 62 (2.7%) | 164 (8.0%) |
| 6:00 AM to 6:29 AM | 174 (7.5%) | 122 (5.9%) |
| 6:30 AM to 6:59 AM | 259 (11.1%) | 304 (14.8%) |
| 7:00 AM to 7:29 AM | 168 (7.2%) | 325 (15.8%) |
| 7:30 AM to 7:59 AM | 84 (3.6%) | 304 (14.8%) |
| 8:00 AM to 8:29 AM | 242 (10.4%) | 84 (4.1%) |
| 8:30 AM to 8:59 AM | 47 (2.0%) | 41 (2.0%) |
| 9:00 AM to 9:59 AM | 165 (7.1%) | 32 (1.6%) |
| 10:00 AM to 10:59 AM | 50 (2.1%) | 134 (6.5%) |
| 11:00 AM to 11:59 AM | 41 (1.8%) | 59 (2.9%) |
| 12:00 PM to 3:59 PM | 330 (14.2%) | 145 (7.0%) |
| 4:00 PM to 11:59 PM | 156 (6.7%) | 124 (6.0%) |
| Total | 2,324 (100.0%) | 2,057 (100.0%) |
Housing Occupancy in Humacao
Occupancy by Ownership in Humacao
Of the total 6,512 dwellings in Humacao, owner-occupied units account for 4,308 (66.1%), while renter-occupied units make up 2,204 (33.9%).
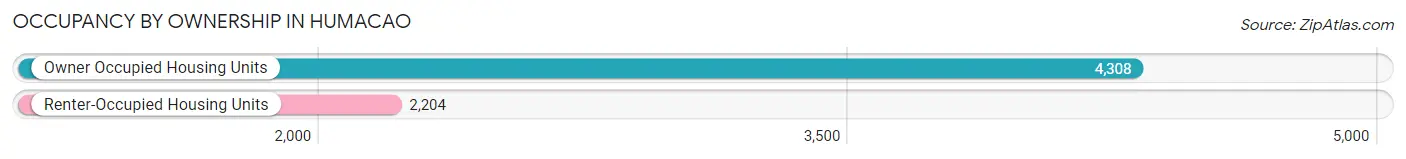
| Occupancy | # Housing Units | % Housing Units |
| Owner Occupied Housing Units | 4,308 | 66.1% |
| Renter-Occupied Housing Units | 2,204 | 33.9% |
| Total Occupied Housing Units | 6,512 | 100.0% |
Occupancy by Household Size in Humacao
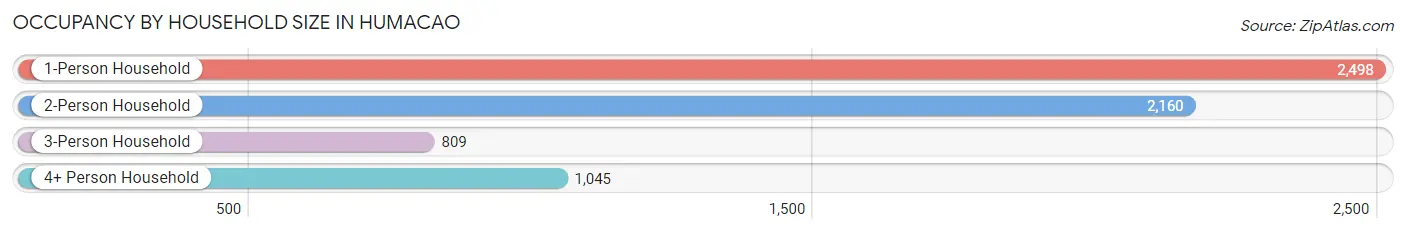
| Household Size | # Housing Units | % Housing Units |
| 1-Person Household | 2,498 | 38.4% |
| 2-Person Household | 2,160 | 33.2% |
| 3-Person Household | 809 | 12.4% |
| 4+ Person Household | 1,045 | 16.1% |
| Total Housing Units | 6,512 | 100.0% |
Occupancy by Ownership by Household Size in Humacao
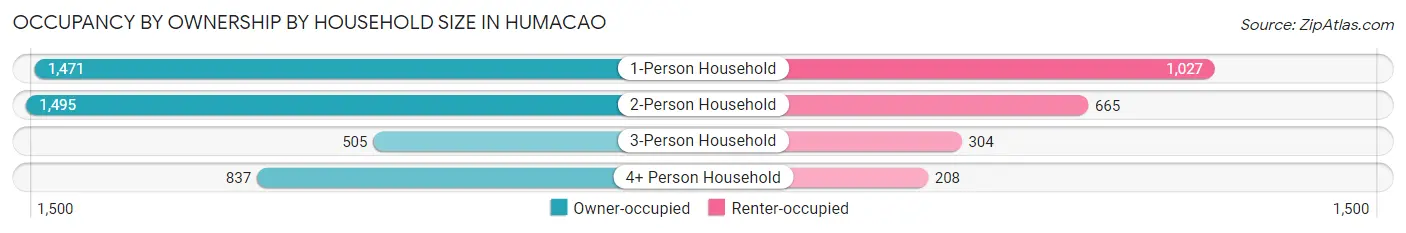
| Household Size | Owner-occupied | Renter-occupied |
| 1-Person Household | 1,471 (58.9%) | 1,027 (41.1%) |
| 2-Person Household | 1,495 (69.2%) | 665 (30.8%) |
| 3-Person Household | 505 (62.4%) | 304 (37.6%) |
| 4+ Person Household | 837 (80.1%) | 208 (19.9%) |
| Total Housing Units | 4,308 (66.1%) | 2,204 (33.9%) |
Occupancy by Educational Attainment in Humacao
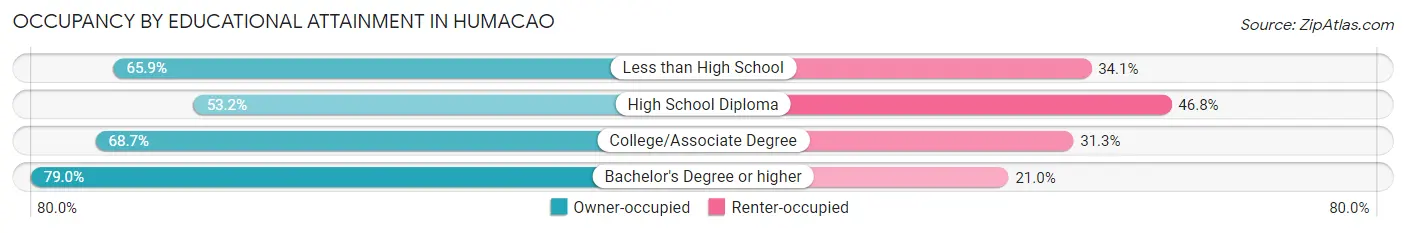
| Household Size | Owner-occupied | Renter-occupied |
| Less than High School | 871 (65.9%) | 451 (34.1%) |
| High School Diploma | 1,099 (53.2%) | 968 (46.8%) |
| College/Associate Degree | 866 (68.7%) | 394 (31.3%) |
| Bachelor's Degree or higher | 1,472 (79.0%) | 391 (21.0%) |
Occupancy by Age of Householder in Humacao
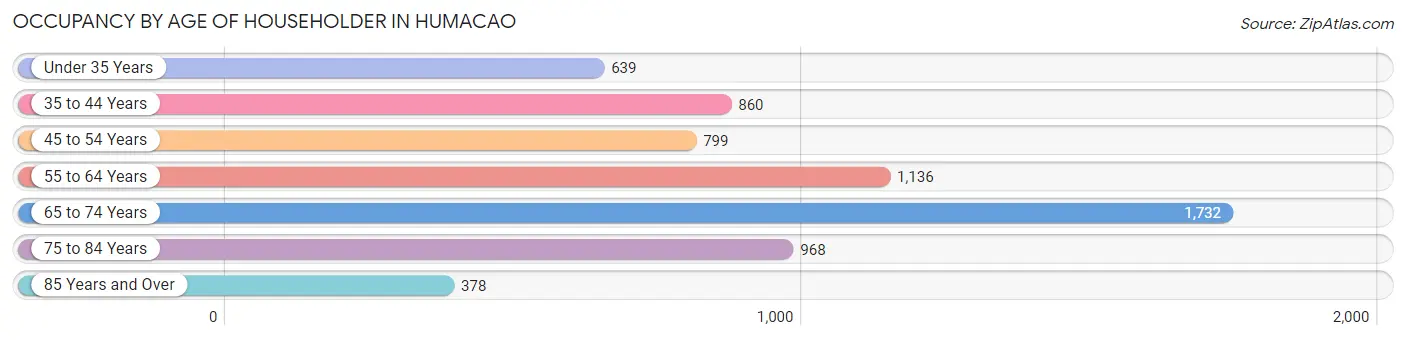
| Age Bracket | # Households | % Households |
| Under 35 Years | 639 | 9.8% |
| 35 to 44 Years | 860 | 13.2% |
| 45 to 54 Years | 799 | 12.3% |
| 55 to 64 Years | 1,136 | 17.4% |
| 65 to 74 Years | 1,732 | 26.6% |
| 75 to 84 Years | 968 | 14.9% |
| 85 Years and Over | 378 | 5.8% |
| Total | 6,512 | 100.0% |
Housing Finances in Humacao
Median Income by Occupancy in Humacao
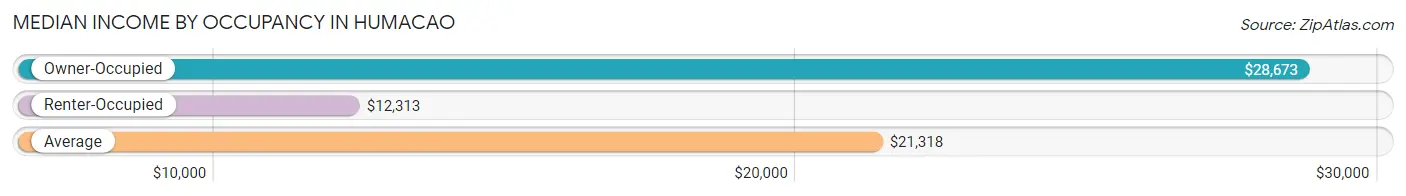
| Occupancy Type | # Households | Median Income |
| Owner-Occupied | 4,308 (66.1%) | $28,673 |
| Renter-Occupied | 2,204 (33.9%) | $12,313 |
| Average | 6,512 (100.0%) | $21,318 |
Occupancy by Householder Income Bracket in Humacao
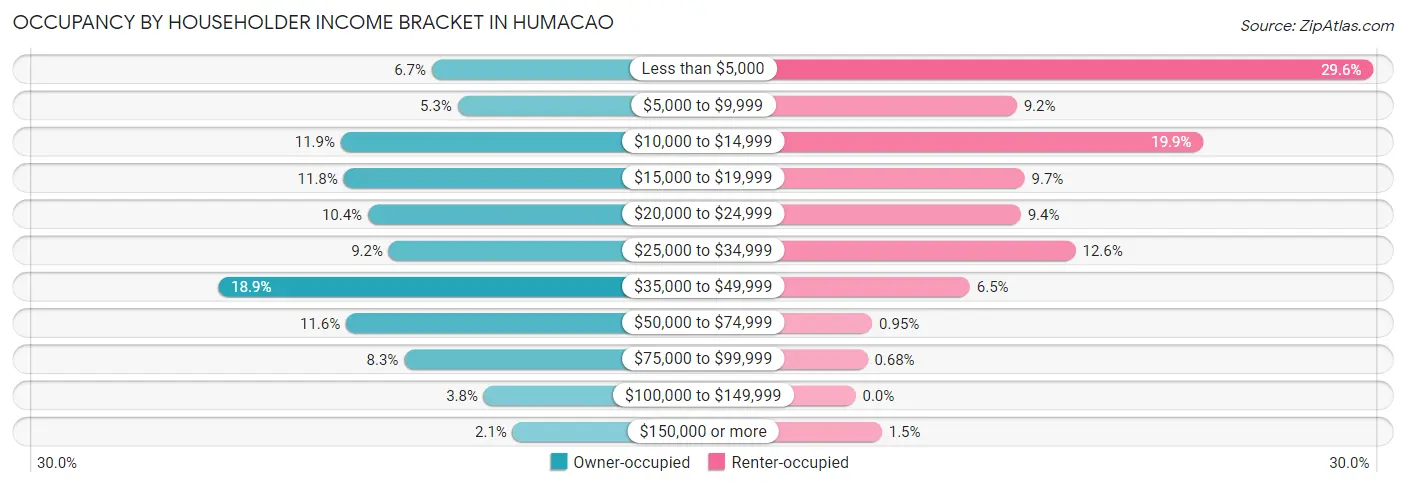
| Income Bracket | Owner-occupied | Renter-occupied |
| Less than $5,000 | 290 (6.7%) | 652 (29.6%) |
| $5,000 to $9,999 | 226 (5.2%) | 203 (9.2%) |
| $10,000 to $14,999 | 514 (11.9%) | 438 (19.9%) |
| $15,000 to $19,999 | 507 (11.8%) | 213 (9.7%) |
| $20,000 to $24,999 | 447 (10.4%) | 208 (9.4%) |
| $25,000 to $34,999 | 396 (9.2%) | 277 (12.6%) |
| $35,000 to $49,999 | 816 (18.9%) | 144 (6.5%) |
| $50,000 to $74,999 | 501 (11.6%) | 21 (0.9%) |
| $75,000 to $99,999 | 358 (8.3%) | 15 (0.7%) |
| $100,000 to $149,999 | 162 (3.8%) | 0 (0.0%) |
| $150,000 or more | 91 (2.1%) | 33 (1.5%) |
| Total | 4,308 (100.0%) | 2,204 (100.0%) |
Monthly Housing Cost Tiers in Humacao
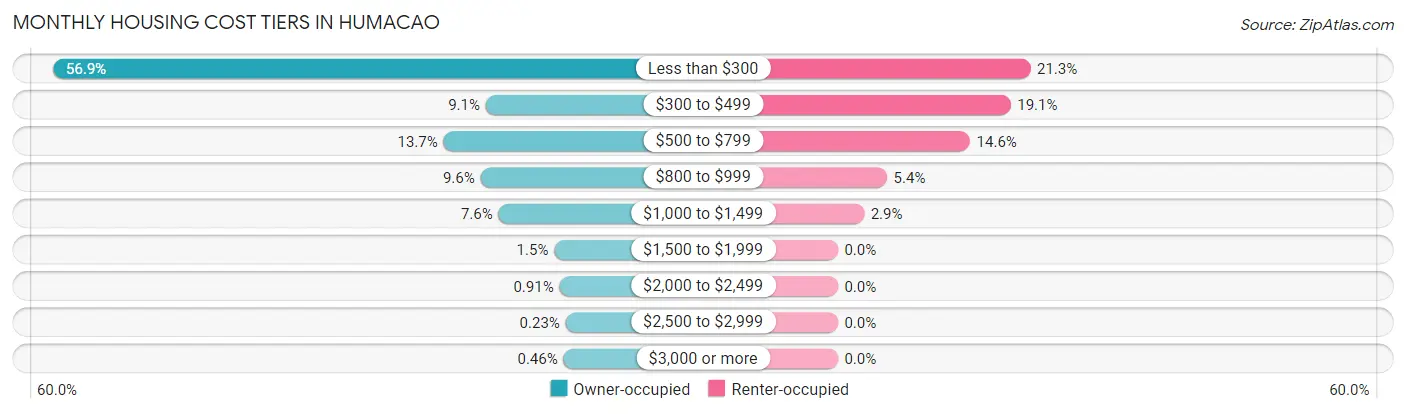
| Monthly Cost | Owner-occupied | Renter-occupied |
| Less than $300 | 2,450 (56.9%) | 469 (21.3%) |
| $300 to $499 | 390 (9.0%) | 421 (19.1%) |
| $500 to $799 | 591 (13.7%) | 322 (14.6%) |
| $800 to $999 | 415 (9.6%) | 120 (5.4%) |
| $1,000 to $1,499 | 329 (7.6%) | 64 (2.9%) |
| $1,500 to $1,999 | 64 (1.5%) | 0 (0.0%) |
| $2,000 to $2,499 | 39 (0.9%) | 0 (0.0%) |
| $2,500 to $2,999 | 10 (0.2%) | 0 (0.0%) |
| $3,000 or more | 20 (0.5%) | 0 (0.0%) |
| Total | 4,308 (100.0%) | 2,204 (100.0%) |
Physical Housing Characteristics in Humacao
Housing Structures in Humacao
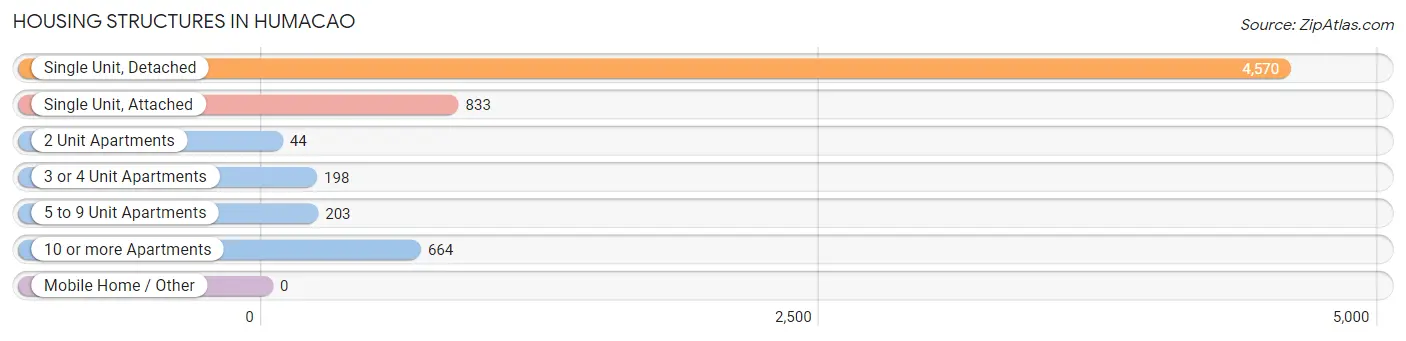
| Structure Type | # Housing Units | % Housing Units |
| Single Unit, Detached | 4,570 | 70.2% |
| Single Unit, Attached | 833 | 12.8% |
| 2 Unit Apartments | 44 | 0.7% |
| 3 or 4 Unit Apartments | 198 | 3.0% |
| 5 to 9 Unit Apartments | 203 | 3.1% |
| 10 or more Apartments | 664 | 10.2% |
| Mobile Home / Other | 0 | 0.0% |
| Total | 6,512 | 100.0% |
Housing Structures by Occupancy in Humacao
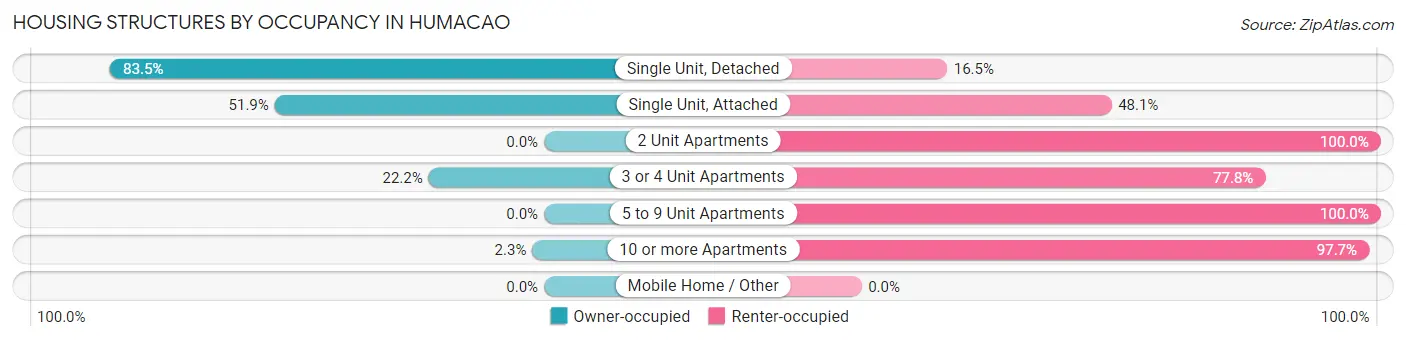
| Structure Type | Owner-occupied | Renter-occupied |
| Single Unit, Detached | 3,817 (83.5%) | 753 (16.5%) |
| Single Unit, Attached | 432 (51.9%) | 401 (48.1%) |
| 2 Unit Apartments | 0 (0.0%) | 44 (100.0%) |
| 3 or 4 Unit Apartments | 44 (22.2%) | 154 (77.8%) |
| 5 to 9 Unit Apartments | 0 (0.0%) | 203 (100.0%) |
| 10 or more Apartments | 15 (2.3%) | 649 (97.7%) |
| Mobile Home / Other | 0 (0.0%) | 0 (0.0%) |
| Total | 4,308 (66.1%) | 2,204 (33.9%) |
Housing Structures by Number of Rooms in Humacao
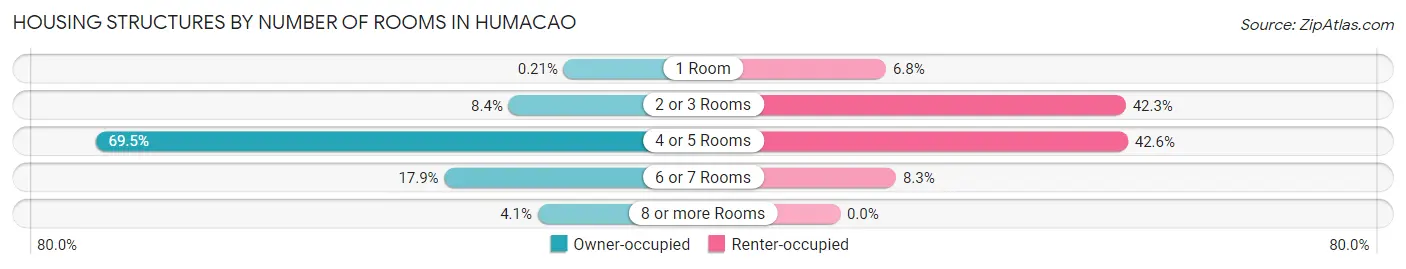
| Number of Rooms | Owner-occupied | Renter-occupied |
| 1 Room | 9 (0.2%) | 150 (6.8%) |
| 2 or 3 Rooms | 360 (8.4%) | 932 (42.3%) |
| 4 or 5 Rooms | 2,994 (69.5%) | 939 (42.6%) |
| 6 or 7 Rooms | 770 (17.9%) | 183 (8.3%) |
| 8 or more Rooms | 175 (4.1%) | 0 (0.0%) |
| Total | 4,308 (100.0%) | 2,204 (100.0%) |
Housing Structure by Heating Type in Humacao
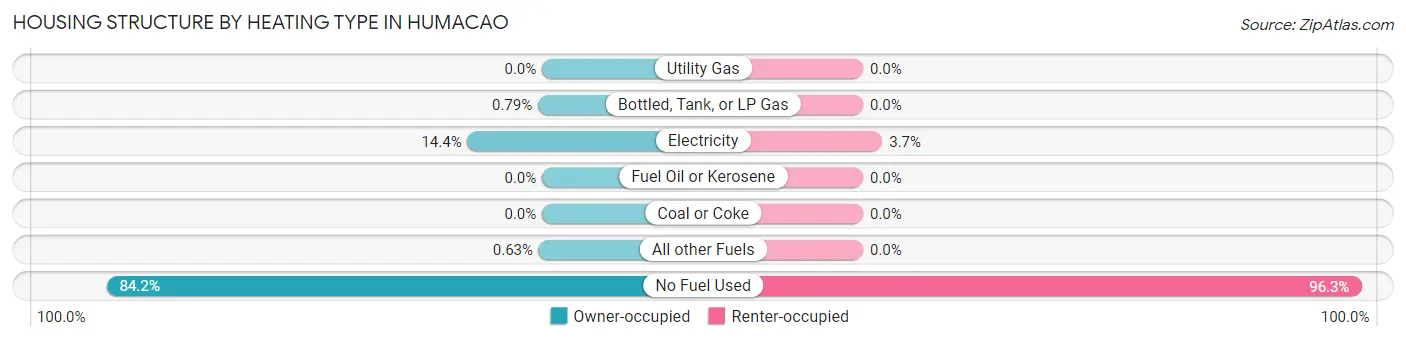
| Heating Type | Owner-occupied | Renter-occupied |
| Utility Gas | 0 (0.0%) | 0 (0.0%) |
| Bottled, Tank, or LP Gas | 34 (0.8%) | 0 (0.0%) |
| Electricity | 621 (14.4%) | 82 (3.7%) |
| Fuel Oil or Kerosene | 0 (0.0%) | 0 (0.0%) |
| Coal or Coke | 0 (0.0%) | 0 (0.0%) |
| All other Fuels | 27 (0.6%) | 0 (0.0%) |
| No Fuel Used | 3,626 (84.2%) | 2,122 (96.3%) |
| Total | 4,308 (100.0%) | 2,204 (100.0%) |
Household Vehicle Usage in Humacao
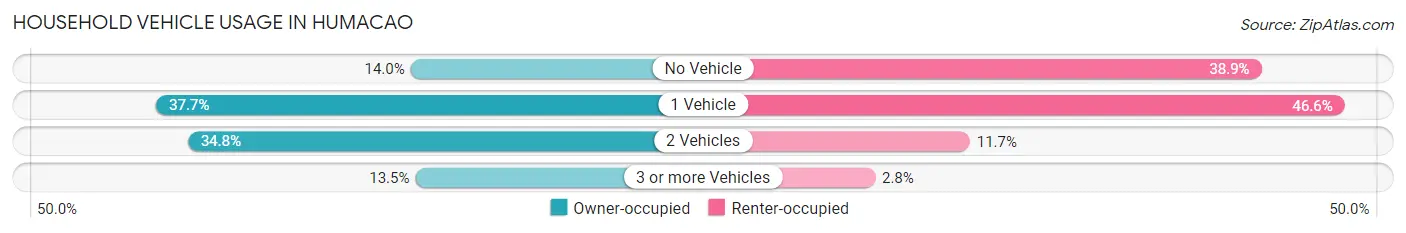
| Vehicles per Household | Owner-occupied | Renter-occupied |
| No Vehicle | 602 (14.0%) | 857 (38.9%) |
| 1 Vehicle | 1,625 (37.7%) | 1,028 (46.6%) |
| 2 Vehicles | 1,498 (34.8%) | 257 (11.7%) |
| 3 or more Vehicles | 583 (13.5%) | 62 (2.8%) |
| Total | 4,308 (100.0%) | 2,204 (100.0%) |
Real Estate & Mortgages in Humacao
Real Estate and Mortgage Overview in Humacao
| Characteristic | Without Mortgage | With Mortgage |
| Housing Units | 2,696 | 1,612 |
| Median Property Value | $111,900 | $115,900 |
| Median Household Income | $20,355 | $54 |
| Monthly Housing Costs | $172 | $20 |
| Real Estate Taxes | $622 | $1,364 |
Property Value by Mortgage Status in Humacao
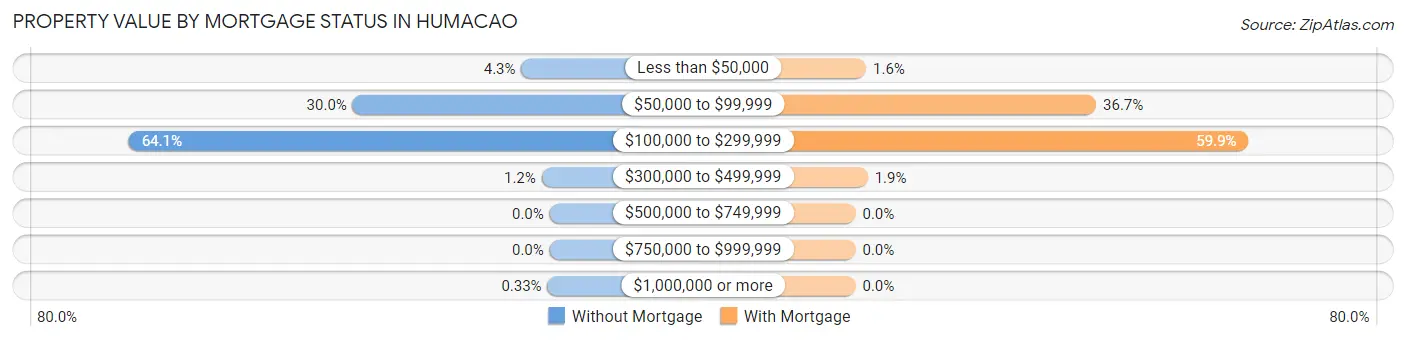
| Property Value | Without Mortgage | With Mortgage |
| Less than $50,000 | 116 (4.3%) | 26 (1.6%) |
| $50,000 to $99,999 | 809 (30.0%) | 591 (36.7%) |
| $100,000 to $299,999 | 1,729 (64.1%) | 965 (59.9%) |
| $300,000 to $499,999 | 33 (1.2%) | 30 (1.9%) |
| $500,000 to $749,999 | 0 (0.0%) | 0 (0.0%) |
| $750,000 to $999,999 | 0 (0.0%) | 0 (0.0%) |
| $1,000,000 or more | 9 (0.3%) | 0 (0.0%) |
| Total | 2,696 (100.0%) | 1,612 (100.0%) |
Household Income by Mortgage Status in Humacao
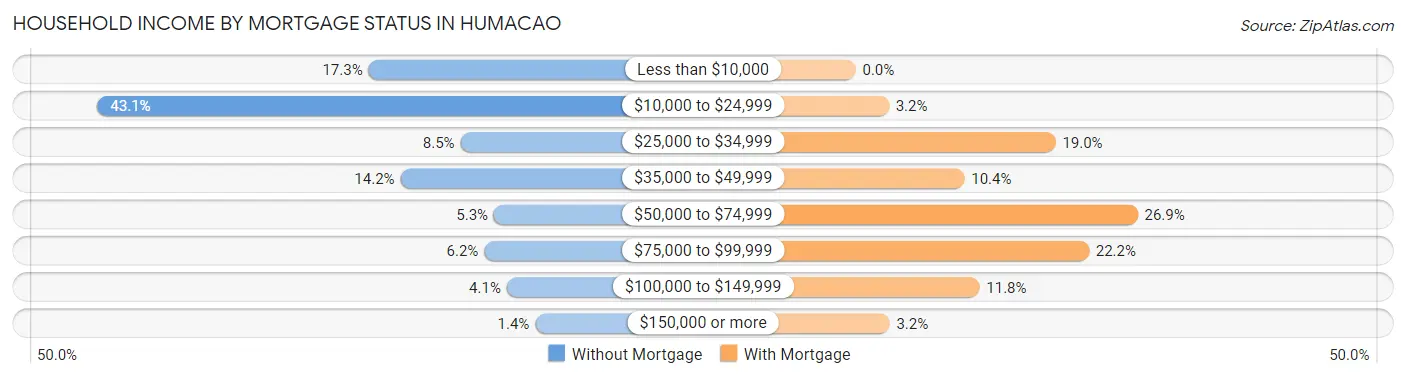
| Household Income | Without Mortgage | With Mortgage |
| Less than $10,000 | 465 (17.2%) | 0 (0.0%) |
| $10,000 to $24,999 | 1,161 (43.1%) | 51 (3.2%) |
| $25,000 to $34,999 | 229 (8.5%) | 307 (19.0%) |
| $35,000 to $49,999 | 383 (14.2%) | 167 (10.4%) |
| $50,000 to $74,999 | 143 (5.3%) | 433 (26.9%) |
| $75,000 to $99,999 | 168 (6.2%) | 358 (22.2%) |
| $100,000 to $149,999 | 110 (4.1%) | 190 (11.8%) |
| $150,000 or more | 37 (1.4%) | 52 (3.2%) |
| Total | 2,696 (100.0%) | 1,612 (100.0%) |
Property Value to Household Income Ratio in Humacao
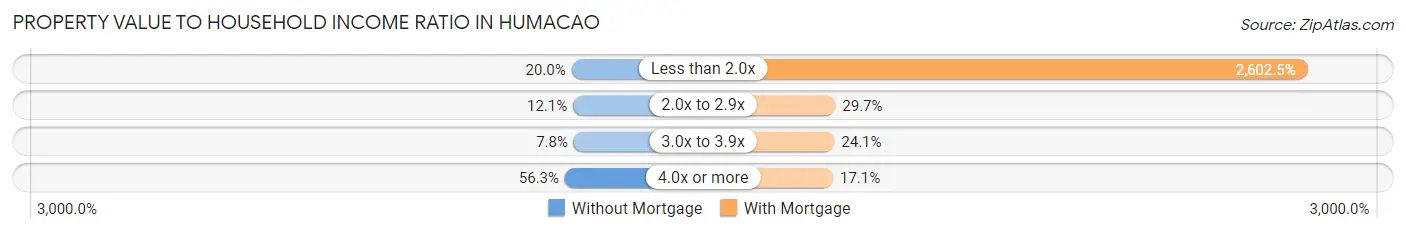
| Value-to-Income Ratio | Without Mortgage | With Mortgage |
| Less than 2.0x | 539 (20.0%) | 41,953 (2,602.5%) |
| 2.0x to 2.9x | 327 (12.1%) | 479 (29.7%) |
| 3.0x to 3.9x | 210 (7.8%) | 388 (24.1%) |
| 4.0x or more | 1,518 (56.3%) | 275 (17.1%) |
| Total | 2,696 (100.0%) | 1,612 (100.0%) |
Real Estate Taxes by Mortgage Status in Humacao
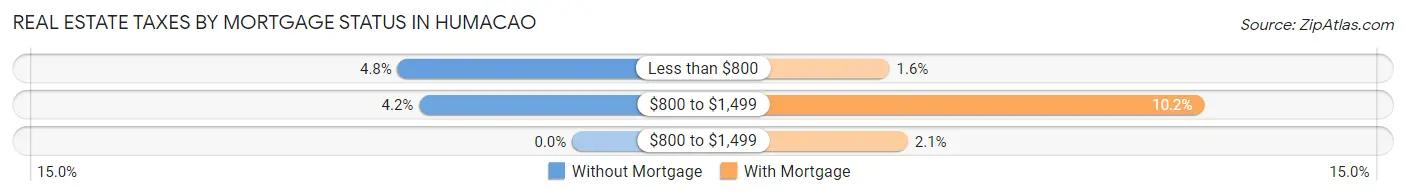
| Property Taxes | Without Mortgage | With Mortgage |
| Less than $800 | 129 (4.8%) | 25 (1.5%) |
| $800 to $1,499 | 113 (4.2%) | 164 (10.2%) |
| $800 to $1,499 | 0 (0.0%) | 33 (2.1%) |
| Total | 2,696 (100.0%) | 1,612 (100.0%) |
Health & Disability in Humacao
Health Insurance Coverage by Age in Humacao
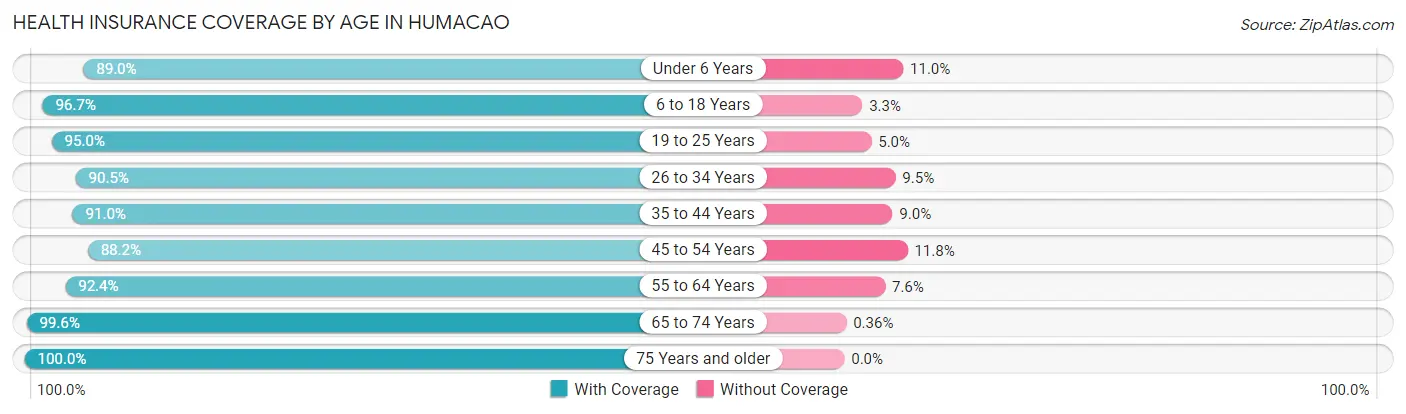
| Age Bracket | With Coverage | Without Coverage |
| Under 6 Years | 625 (89.0%) | 77 (11.0%) |
| 6 to 18 Years | 2,169 (96.7%) | 75 (3.3%) |
| 19 to 25 Years | 1,265 (95.0%) | 67 (5.0%) |
| 26 to 34 Years | 1,348 (90.5%) | 142 (9.5%) |
| 35 to 44 Years | 1,806 (91.0%) | 178 (9.0%) |
| 45 to 54 Years | 1,857 (88.2%) | 248 (11.8%) |
| 55 to 64 Years | 1,884 (92.4%) | 155 (7.6%) |
| 65 to 74 Years | 2,463 (99.6%) | 9 (0.4%) |
| 75 Years and older | 2,326 (100.0%) | 0 (0.0%) |
| Total | 15,743 (94.3%) | 951 (5.7%) |
Health Insurance Coverage by Citizenship Status in Humacao
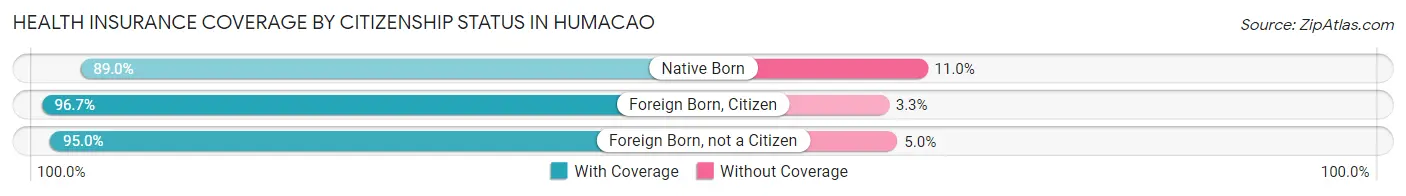
| Citizenship Status | With Coverage | Without Coverage |
| Native Born | 625 (89.0%) | 77 (11.0%) |
| Foreign Born, Citizen | 2,169 (96.7%) | 75 (3.3%) |
| Foreign Born, not a Citizen | 1,265 (95.0%) | 67 (5.0%) |
Health Insurance Coverage by Household Income in Humacao
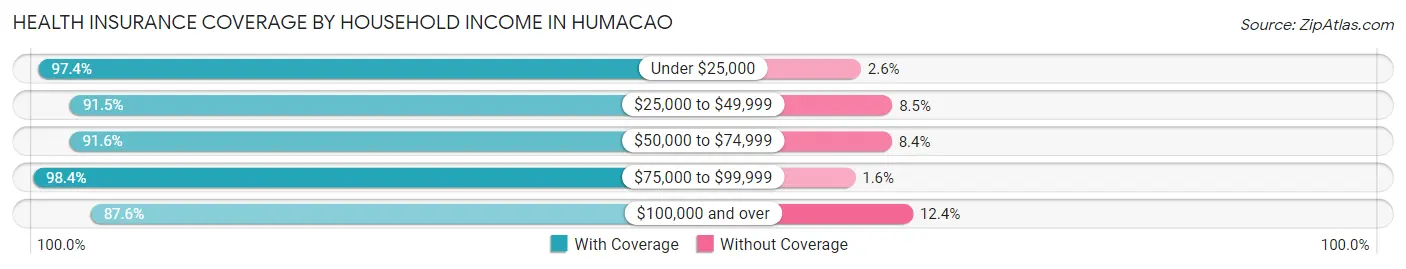
| Household Income | With Coverage | Without Coverage |
| Under $25,000 | 6,817 (97.4%) | 184 (2.6%) |
| $25,000 to $49,999 | 4,033 (91.5%) | 375 (8.5%) |
| $50,000 to $74,999 | 1,732 (91.6%) | 159 (8.4%) |
| $75,000 to $99,999 | 1,674 (98.4%) | 27 (1.6%) |
| $100,000 and over | 1,441 (87.6%) | 204 (12.4%) |
Public vs Private Health Insurance Coverage by Age in Humacao
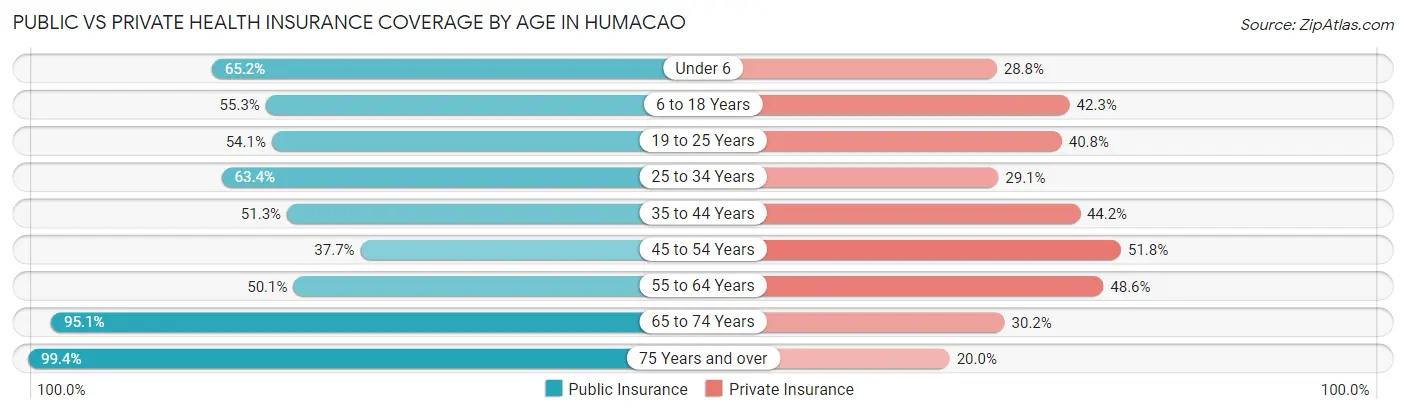
| Age Bracket | Public Insurance | Private Insurance |
| Under 6 | 458 (65.2%) | 202 (28.8%) |
| 6 to 18 Years | 1,240 (55.3%) | 949 (42.3%) |
| 19 to 25 Years | 721 (54.1%) | 544 (40.8%) |
| 25 to 34 Years | 945 (63.4%) | 433 (29.1%) |
| 35 to 44 Years | 1,018 (51.3%) | 877 (44.2%) |
| 45 to 54 Years | 793 (37.7%) | 1,091 (51.8%) |
| 55 to 64 Years | 1,022 (50.1%) | 990 (48.5%) |
| 65 to 74 Years | 2,350 (95.1%) | 747 (30.2%) |
| 75 Years and over | 2,311 (99.4%) | 466 (20.0%) |
| Total | 10,858 (65.0%) | 6,299 (37.7%) |
Disability Status by Sex by Age in Humacao
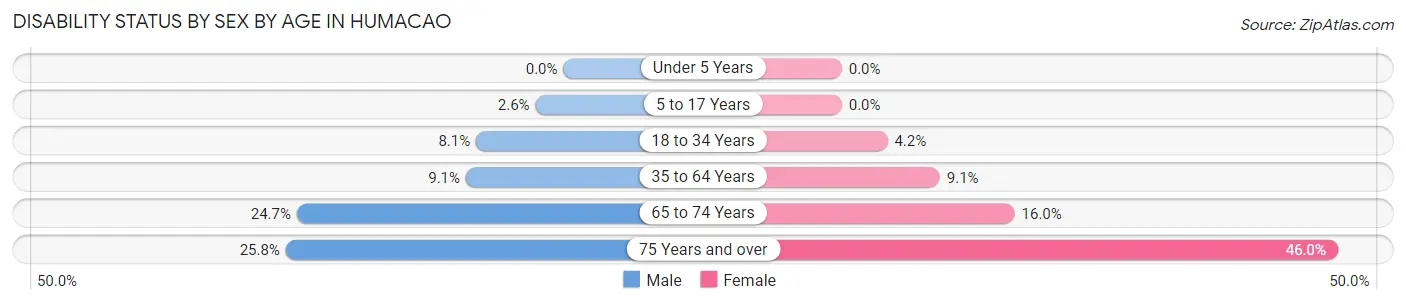
| Age Bracket | Male | Female |
| Under 5 Years | 0 (0.0%) | 0 (0.0%) |
| 5 to 17 Years | 33 (2.6%) | 0 (0.0%) |
| 18 to 34 Years | 105 (8.1%) | 69 (4.2%) |
| 35 to 64 Years | 270 (9.0%) | 286 (9.1%) |
| 65 to 74 Years | 238 (24.7%) | 242 (16.0%) |
| 75 Years and over | 259 (25.8%) | 608 (46.0%) |
Disability Class by Sex by Age in Humacao
Disability Class: Hearing Difficulty
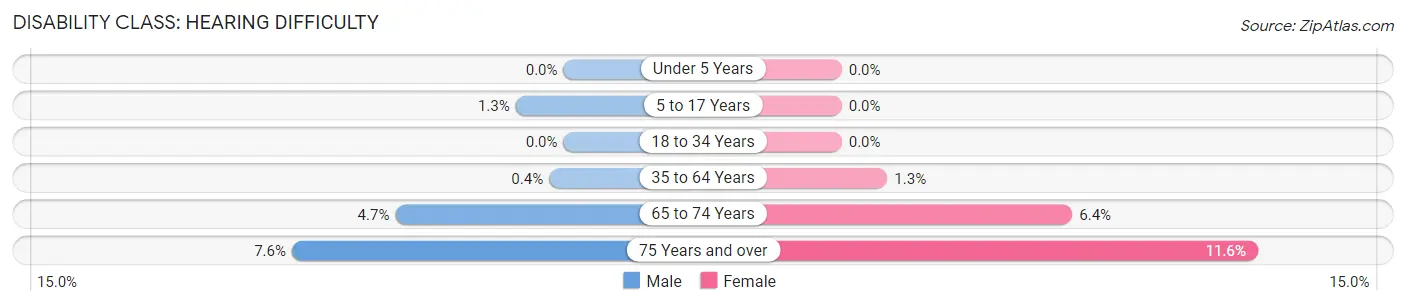
| Age Bracket | Male | Female |
| Under 5 Years | 0 (0.0%) | 0 (0.0%) |
| 5 to 17 Years | 17 (1.3%) | 0 (0.0%) |
| 18 to 34 Years | 0 (0.0%) | 0 (0.0%) |
| 35 to 64 Years | 12 (0.4%) | 40 (1.3%) |
| 65 to 74 Years | 45 (4.7%) | 97 (6.4%) |
| 75 Years and over | 76 (7.6%) | 153 (11.6%) |
Disability Class: Vision Difficulty
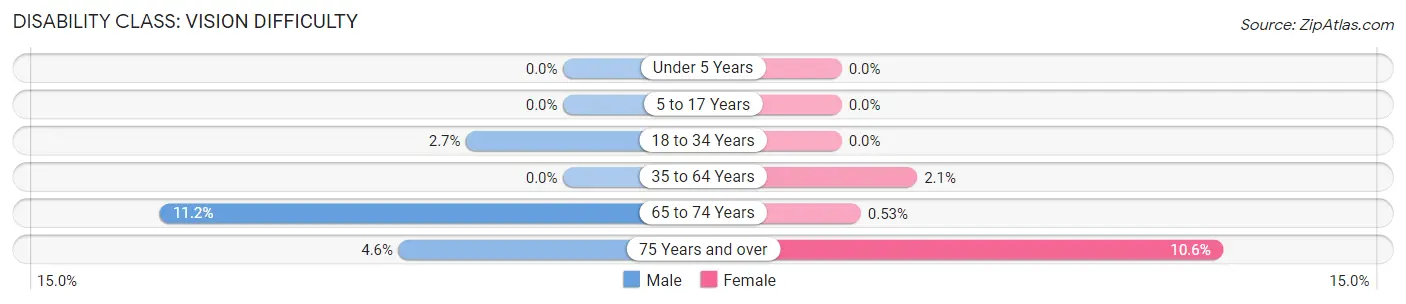
| Age Bracket | Male | Female |
| Under 5 Years | 0 (0.0%) | 0 (0.0%) |
| 5 to 17 Years | 0 (0.0%) | 0 (0.0%) |
| 18 to 34 Years | 35 (2.7%) | 0 (0.0%) |
| 35 to 64 Years | 0 (0.0%) | 66 (2.1%) |
| 65 to 74 Years | 108 (11.2%) | 8 (0.5%) |
| 75 Years and over | 46 (4.6%) | 140 (10.6%) |
Disability Class: Cognitive Difficulty
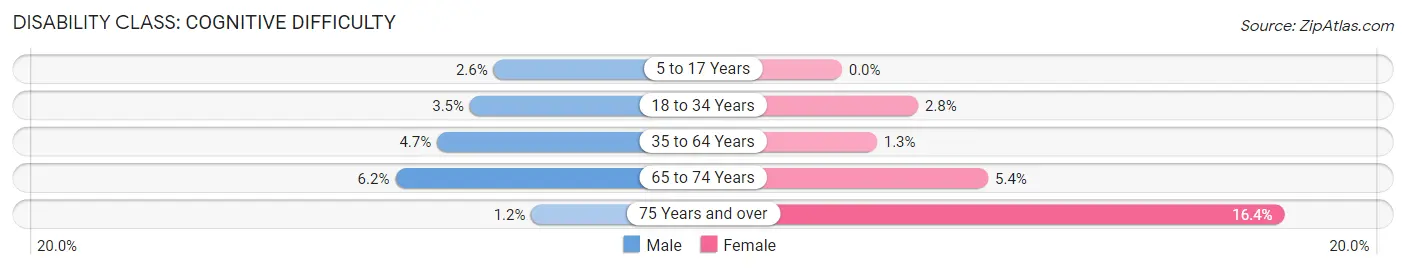
| Age Bracket | Male | Female |
| 5 to 17 Years | 33 (2.6%) | 0 (0.0%) |
| 18 to 34 Years | 45 (3.5%) | 46 (2.8%) |
| 35 to 64 Years | 140 (4.7%) | 41 (1.3%) |
| 65 to 74 Years | 60 (6.2%) | 82 (5.4%) |
| 75 Years and over | 12 (1.2%) | 217 (16.4%) |
Disability Class: Ambulatory Difficulty
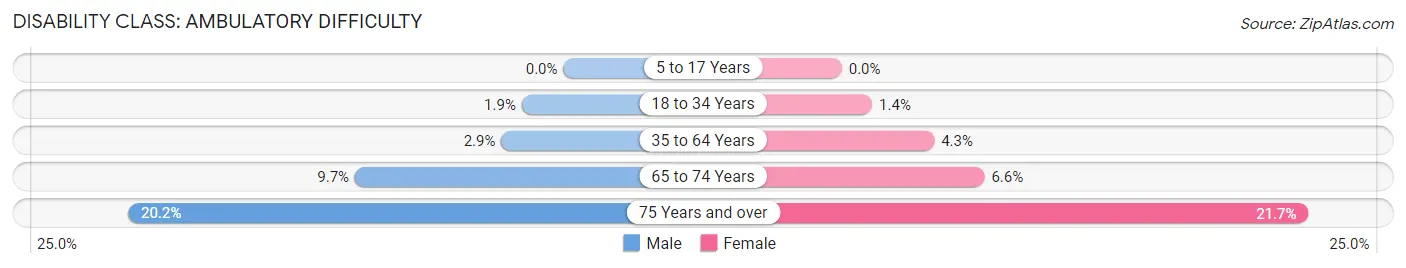
| Age Bracket | Male | Female |
| 5 to 17 Years | 0 (0.0%) | 0 (0.0%) |
| 18 to 34 Years | 25 (1.9%) | 23 (1.4%) |
| 35 to 64 Years | 86 (2.9%) | 135 (4.3%) |
| 65 to 74 Years | 93 (9.7%) | 100 (6.6%) |
| 75 Years and over | 203 (20.2%) | 286 (21.6%) |
Disability Class: Self-Care Difficulty
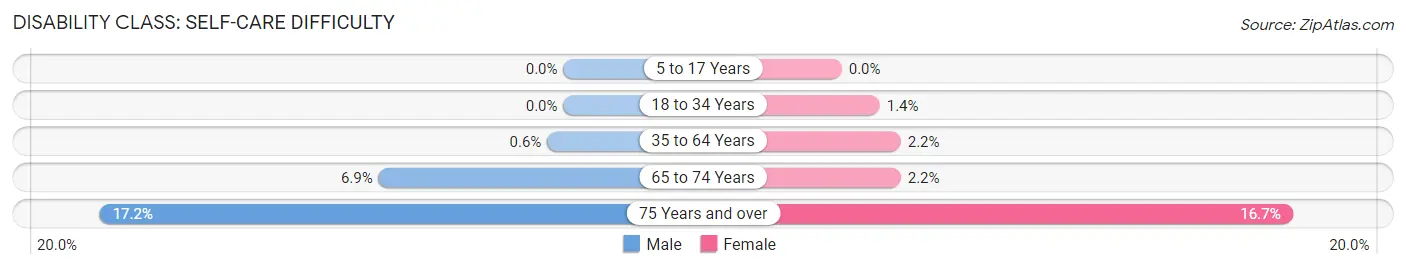
| Age Bracket | Male | Female |
| 5 to 17 Years | 0 (0.0%) | 0 (0.0%) |
| 18 to 34 Years | 0 (0.0%) | 23 (1.4%) |
| 35 to 64 Years | 18 (0.6%) | 69 (2.2%) |
| 65 to 74 Years | 66 (6.9%) | 33 (2.2%) |
| 75 Years and over | 173 (17.2%) | 221 (16.7%) |
Technology Access in Humacao
Computing Device Access in Humacao
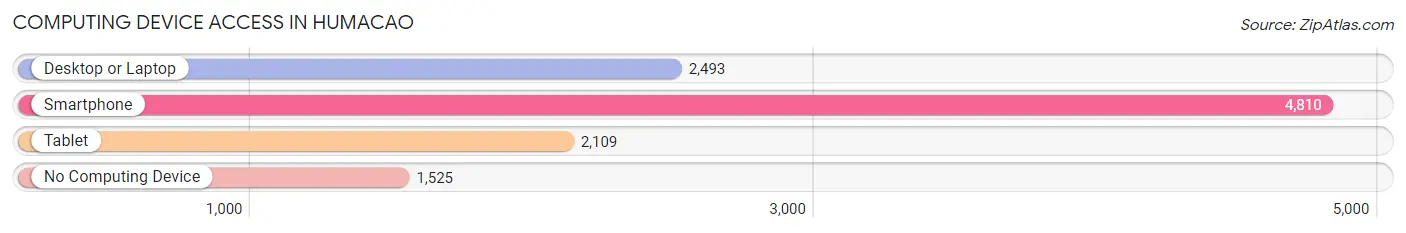
| Device Type | # Households | % Households |
| Desktop or Laptop | 2,493 | 38.3% |
| Smartphone | 4,810 | 73.9% |
| Tablet | 2,109 | 32.4% |
| No Computing Device | 1,525 | 23.4% |
| Total | 6,512 | 100.0% |
Internet Access in Humacao
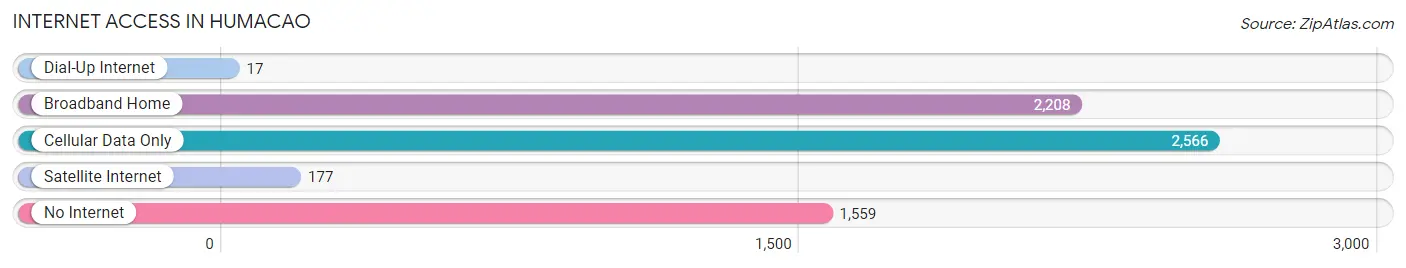
| Internet Type | # Households | % Households |
| Dial-Up Internet | 17 | 0.3% |
| Broadband Home | 2,208 | 33.9% |
| Cellular Data Only | 2,566 | 39.4% |
| Satellite Internet | 177 | 2.7% |
| No Internet | 1,559 | 23.9% |
| Total | 6,512 | 100.0% |
Humacao Summary
Humacao is a municipality located in the eastern part of Puerto Rico, in the region known as the Eastern Coastal Plain. It is bordered by the municipalities of Yabucoa to the east, Las Piedras to the west, and Naguabo to the south. The municipality is located on the coast of the Atlantic Ocean, and is home to a population of approximately 77,000 people.
History
Humacao was founded in 1793 by Don Juan de Aponte, a Spanish military officer. The name of the municipality is derived from the Taíno word “Humacao”, which means “place of rest”. The area was originally inhabited by the Taíno people, who were the indigenous people of the Caribbean.
In the 19th century, the area was used for sugar cane production, and the economy of the region was largely based on the sugar industry. In the early 20th century, the economy shifted to the production of tobacco and other agricultural products.
In the 1950s, the economy of Humacao began to diversify, and the municipality became a major industrial center. The municipality is home to several large industrial parks, including the Humacao Industrial Park, which is the largest industrial park in Puerto Rico.
Geography
Humacao is located in the eastern part of Puerto Rico, in the region known as the Eastern Coastal Plain. The municipality is bordered by the municipalities of Yabucoa to the east, Las Piedras to the west, and Naguabo to the south. The municipality is located on the coast of the Atlantic Ocean, and is home to a population of approximately 77,000 people.
The municipality is divided into two regions: the northern region, which is mostly rural, and the southern region, which is more urbanized. The northern region is home to the Humacao Nature Reserve, a protected area of tropical rainforest. The southern region is home to the Humacao Industrial Park, which is the largest industrial park in Puerto Rico.
Economy
The economy of Humacao is largely based on the industrial sector, which is centered around the Humacao Industrial Park. The industrial park is home to several large companies, including pharmaceutical companies, electronics companies, and food processing companies. The industrial park also houses several government agencies, including the Puerto Rico Industrial Development Company.
The municipality is also home to several agricultural businesses, including sugar cane production, tobacco production, and other agricultural products. Tourism is also an important part of the economy, with several resorts and hotels located in the municipality.
Demographics
As of the 2010 census, the population of Humacao was 77,063. The population is largely of Puerto Rican descent, with a small percentage of people of other ethnic backgrounds. The majority of the population is Roman Catholic, with a small percentage of people belonging to other religious denominations.
The median household income in Humacao is $20,845, which is lower than the median household income in Puerto Rico as a whole. The unemployment rate in the municipality is 11.2%, which is higher than the national average. The poverty rate in Humacao is 28.3%, which is higher than the national average.
Common Questions
What is Per Capita Income in Humacao?
Per Capita income in Humacao is $15,264.
What is the Median Family Income in Humacao?
Median Family Income in Humacao is $29,911.
What is the Median Household income in Humacao?
Median Household Income in Humacao is $21,318.
What is Income or Wage Gap in Humacao?
Income or Wage Gap in Humacao is 4.2%.
Women in Humacao earn 95.8 cents for every dollar earned by a man.
What is Family Income Deficit in Humacao?
Family Income Deficit in Humacao is $10,460.
Families that are below poverty line in Humacao earn $10,460 less on average than the poverty threshold level.
What is Inequality or Gini Index in Humacao?
Inequality or Gini Index in Humacao is 0.53.
What is the Total Population of Humacao?
Total Population of Humacao is 16,762.
What is the Total Male Population of Humacao?
Total Male Population of Humacao is 7,836.
What is the Total Female Population of Humacao?
Total Female Population of Humacao is 8,926.
What is the Ratio of Males per 100 Females in Humacao?
There are 87.79 Males per 100 Females in Humacao.
What is the Ratio of Females per 100 Males in Humacao?
There are 113.91 Females per 100 Males in Humacao.
What is the Median Population Age in Humacao?
Median Population Age in Humacao is 48.3 Years.
What is the Average Family Size in Humacao
Average Family Size in Humacao is 3.5 People.
What is the Average Household Size in Humacao
Average Household Size in Humacao is 2.6 People.
How Large is the Labor Force in Humacao?
There are 5,053 People in the Labor Forcein in Humacao.
What is the Percentage of People in the Labor Force in Humacao?
35.3% of People are in the Labor Force in Humacao.
What is the Unemployment Rate in Humacao?
Unemployment Rate in Humacao is 10.8%.