Coamo, PR Map & Demographics
Coamo Map
Coamo Overview
$11,581
PER CAPITA INCOME
$21,007
AVG FAMILY INCOME
$15,128
AVG HOUSEHOLD INCOME
16.4%
WAGE / INCOME GAP [ % ]
83.6¢/ $1
WAGE / INCOME GAP [ $ ]
$12,444
FAMILY INCOME DEFICIT
0.56
INEQUALITY / GINI INDEX
9,806
TOTAL POPULATION
4,953
MALE POPULATION
4,853
FEMALE POPULATION
102.06
MALES / 100 FEMALES
97.98
FEMALES / 100 MALES
48.5
MEDIAN AGE
3.2
AVG FAMILY SIZE
2.4
AVG HOUSEHOLD SIZE
3,156
LABOR FORCE [ PEOPLE ]
37.5%
PERCENT IN LABOR FORCE
7.2%
UNEMPLOYMENT RATE
Coamo Zip Codes
Coamo Area Codes
Income in Coamo
Income Overview in Coamo
Per Capita Income in Coamo is $11,581, while median incomes of families and households are $21,007 and $15,128 respectively.
| Characteristic | Number | Measure |
| Per Capita Income | 9,806 | $11,581 |
| Median Family Income | 2,329 | $21,007 |
| Mean Family Income | 2,329 | $31,223 |
| Median Household Income | 4,011 | $15,128 |
| Mean Household Income | 4,011 | $25,007 |
| Income Deficit | 2,329 | $12,444 |
| Wage / Income Gap (%) | 9,806 | 16.37% |
| Wage / Income Gap ($) | 9,806 | 83.63¢ per $1 |
| Gini / Inequality Index | 9,806 | 0.56 |
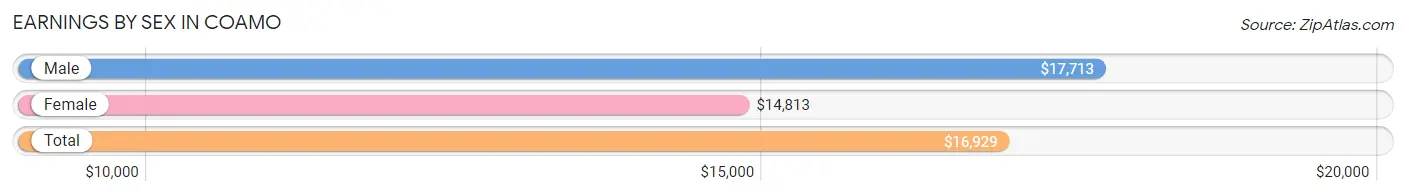
Earnings by Sex in Coamo
Average Earnings in Coamo are $16,929, $17,713 for men and $14,813 for women, a difference of 16.4%.
| Sex | Number | Average Earnings |
| Male | 1,710 (54.1%) | $17,713 |
| Female | 1,453 (45.9%) | $14,813 |
| Total | 3,163 (100.0%) | $16,929 |
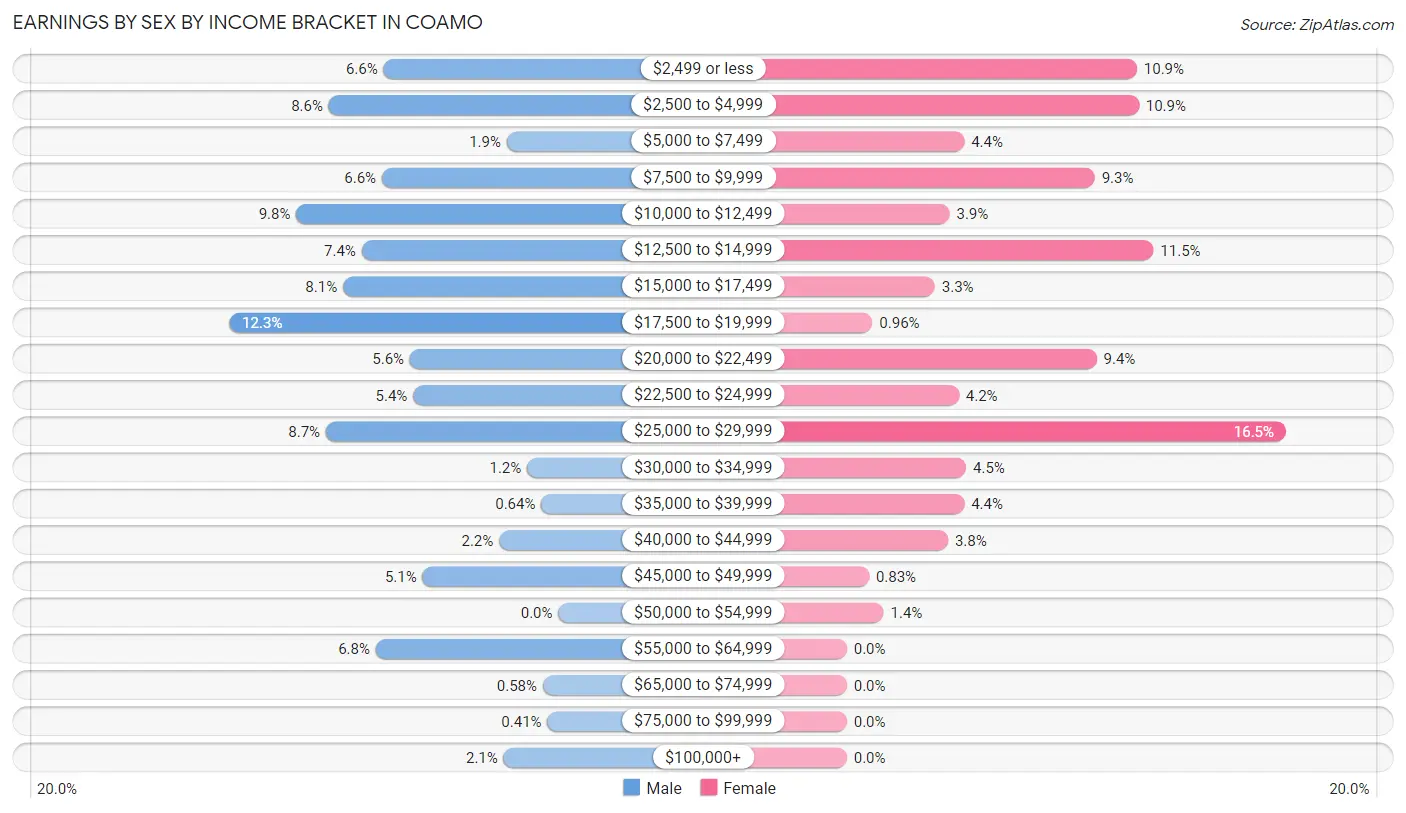
Earnings by Sex by Income Bracket in Coamo
The most common earnings brackets in Coamo are $17,500 to $19,999 for men (211 | 12.3%) and $25,000 to $29,999 for women (239 | 16.5%).
| Income | Male | Female |
| $2,499 or less | 112 (6.6%) | 158 (10.9%) |
| $2,500 to $4,999 | 147 (8.6%) | 159 (10.9%) |
| $5,000 to $7,499 | 33 (1.9%) | 64 (4.4%) |
| $7,500 to $9,999 | 113 (6.6%) | 135 (9.3%) |
| $10,000 to $12,499 | 168 (9.8%) | 56 (3.8%) |
| $12,500 to $14,999 | 126 (7.4%) | 167 (11.5%) |
| $15,000 to $17,499 | 138 (8.1%) | 48 (3.3%) |
| $17,500 to $19,999 | 211 (12.3%) | 14 (1.0%) |
| $20,000 to $22,499 | 95 (5.6%) | 136 (9.4%) |
| $22,500 to $24,999 | 93 (5.4%) | 61 (4.2%) |
| $25,000 to $29,999 | 149 (8.7%) | 239 (16.5%) |
| $30,000 to $34,999 | 20 (1.2%) | 65 (4.5%) |
| $35,000 to $39,999 | 11 (0.6%) | 64 (4.4%) |
| $40,000 to $44,999 | 38 (2.2%) | 55 (3.8%) |
| $45,000 to $49,999 | 87 (5.1%) | 12 (0.8%) |
| $50,000 to $54,999 | 0 (0.0%) | 20 (1.4%) |
| $55,000 to $64,999 | 117 (6.8%) | 0 (0.0%) |
| $65,000 to $74,999 | 10 (0.6%) | 0 (0.0%) |
| $75,000 to $99,999 | 7 (0.4%) | 0 (0.0%) |
| $100,000+ | 35 (2.1%) | 0 (0.0%) |
| Total | 1,710 (100.0%) | 1,453 (100.0%) |
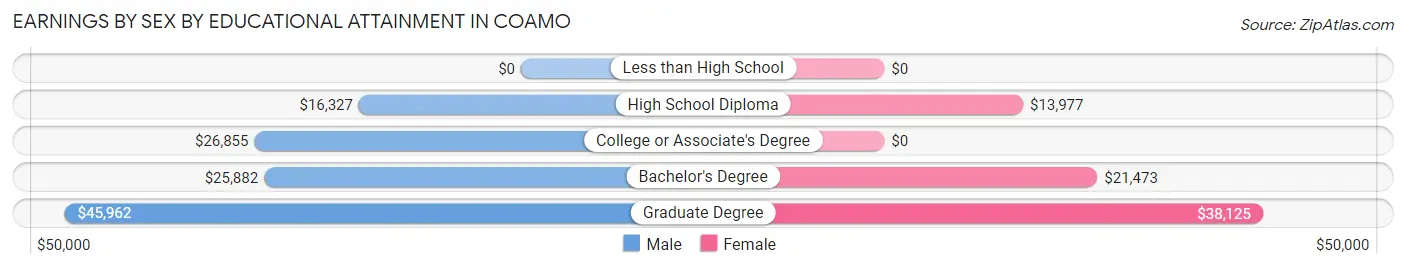
Earnings by Sex by Educational Attainment in Coamo
Average earnings in Coamo are $18,663 for men and $18,750 for women, a difference of 0.5%. Men with an educational attainment of graduate degree enjoy the highest average annual earnings of $45,962, while those with high school diploma education earn the least with $16,327. Women with an educational attainment of graduate degree earn the most with the average annual earnings of $38,125, while those with high school diploma education have the smallest earnings of $13,977.
| Educational Attainment | Male Income | Female Income |
| Less than High School | - | - |
| High School Diploma | $16,327 | $13,977 |
| College or Associate's Degree | $26,855 | $0 |
| Bachelor's Degree | $25,882 | $21,473 |
| Graduate Degree | $45,962 | $38,125 |
| Total | $18,663 | $18,750 |
Family Income in Coamo
Family Income Brackets in Coamo
According to the Coamo family income data, there are 627 families falling into the less than $10,000 income range, which is the most common income bracket and makes up 26.9% of all families.
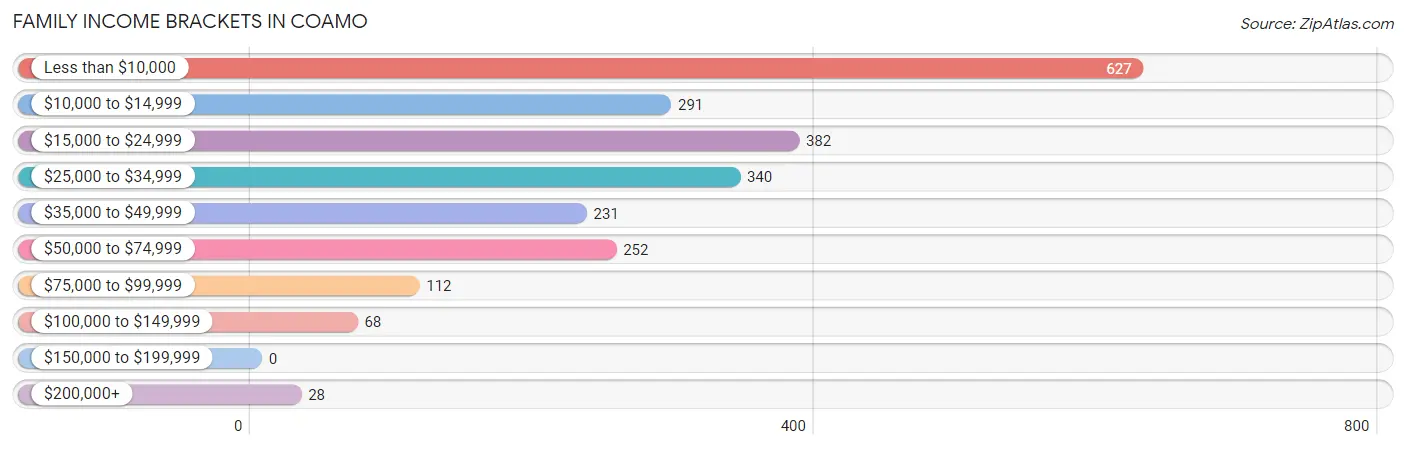
| Income Bracket | # Families | % Families |
| Less than $10,000 | 627 | 26.9% |
| $10,000 to $14,999 | 291 | 12.5% |
| $15,000 to $24,999 | 382 | 16.4% |
| $25,000 to $34,999 | 340 | 14.6% |
| $35,000 to $49,999 | 231 | 9.9% |
| $50,000 to $74,999 | 252 | 10.8% |
| $75,000 to $99,999 | 112 | 4.8% |
| $100,000 to $149,999 | 68 | 2.9% |
| $150,000 to $199,999 | 0 | 0.0% |
| $200,000+ | 28 | 1.2% |
Family Income by Famaliy Size in Coamo
3-person families (627 | 26.9%) account for the highest median family income in Coamo with $21,938 per family, while 2-person families (1,279 | 54.9%) have the highest median income of $10,208 per family member.
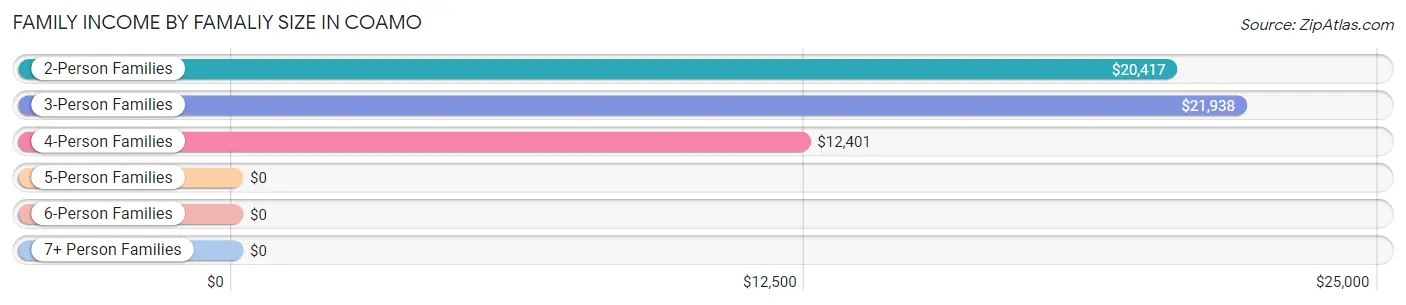
| Income Bracket | # Families | Median Income |
| 2-Person Families | 1,279 (54.9%) | $20,417 |
| 3-Person Families | 627 (26.9%) | $21,938 |
| 4-Person Families | 323 (13.9%) | $12,401 |
| 5-Person Families | 83 (3.6%) | $0 |
| 6-Person Families | 17 (0.7%) | $0 |
| 7+ Person Families | 0 (0.0%) | $0 |
| Total | 2,329 (100.0%) | $21,007 |
Family Income by Number of Earners in Coamo
The median family income in Coamo is $21,007, with families comprising 3+ earners (192) having the highest median family income of $71,214, while families with no earners (1,096) have the lowest median family income of $13,618, accounting for 8.2% and 47.1% of families, respectively.
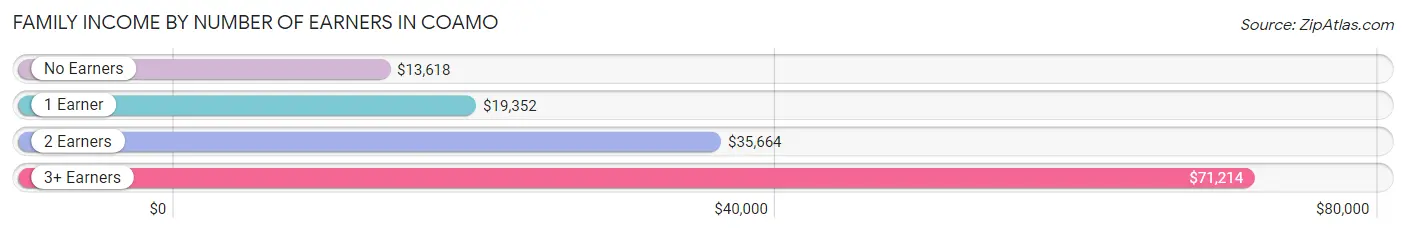
| Number of Earners | # Families | Median Income |
| No Earners | 1,096 (47.1%) | $13,618 |
| 1 Earner | 710 (30.5%) | $19,352 |
| 2 Earners | 331 (14.2%) | $35,664 |
| 3+ Earners | 192 (8.2%) | $71,214 |
| Total | 2,329 (100.0%) | $21,007 |
Household Income in Coamo
Household Income Brackets in Coamo
With 1,344 households falling in the category, the less than $10,000 income range is the most frequent in Coamo, accounting for 33.5% of all households.
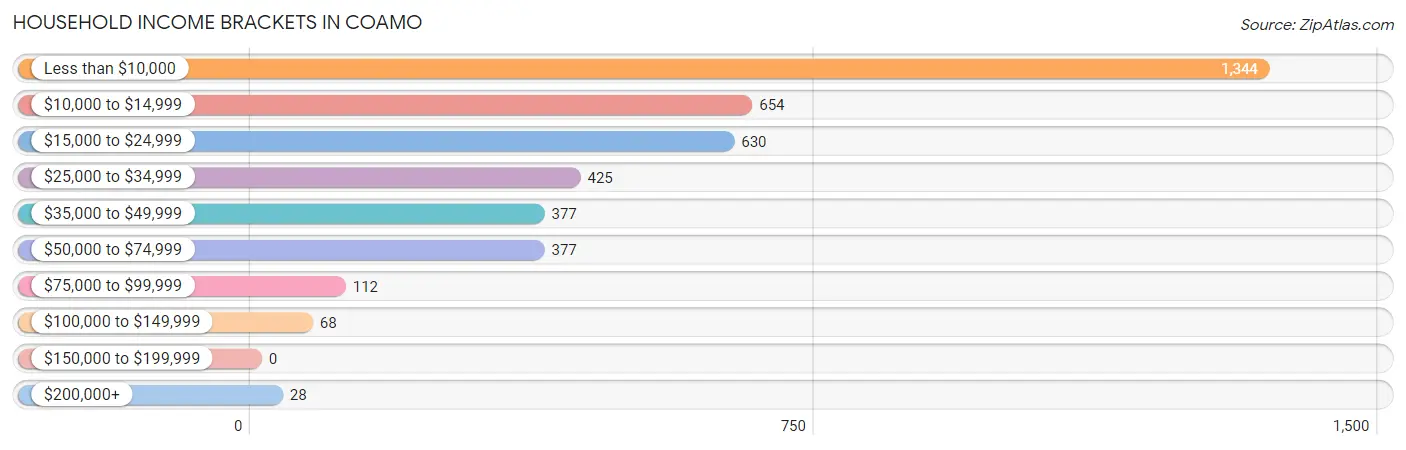
| Income Bracket | # Households | % Households |
| Less than $10,000 | 1,344 | 33.5% |
| $10,000 to $14,999 | 654 | 16.3% |
| $15,000 to $24,999 | 630 | 15.7% |
| $25,000 to $34,999 | 425 | 10.6% |
| $35,000 to $49,999 | 377 | 9.4% |
| $50,000 to $74,999 | 377 | 9.4% |
| $75,000 to $99,999 | 112 | 2.8% |
| $100,000 to $149,999 | 68 | 1.7% |
| $150,000 to $199,999 | 0 | 0.0% |
| $200,000+ | 28 | 0.7% |
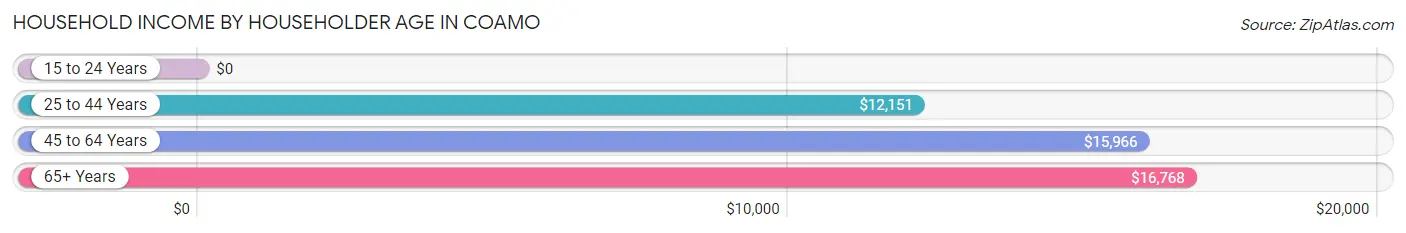
Household Income by Householder Age in Coamo
The median household income in Coamo is $15,128, with the highest median household income of $16,768 found in the 65+ years age bracket for the primary householder. A total of 1,311 households (32.7%) fall into this category. Meanwhile, the 15 to 24 years age bracket for the primary householder has the lowest median household income of $0, with 76 households (1.9%) in this group.
| Income Bracket | # Households | Median Income |
| 15 to 24 Years | 76 (1.9%) | $0 |
| 25 to 44 Years | 696 (17.3%) | $12,151 |
| 45 to 64 Years | 1,928 (48.1%) | $15,966 |
| 65+ Years | 1,311 (32.7%) | $16,768 |
| Total | 4,011 (100.0%) | $15,128 |
Poverty in Coamo
Income Below Poverty by Sex and Age in Coamo
With 54.9% poverty level for males and 59.9% for females among the residents of Coamo, 5 year old males and 5 year old females are the most vulnerable to poverty, with 10 males (100.0%) and 20 females (100.0%) in their respective age groups living below the poverty level.
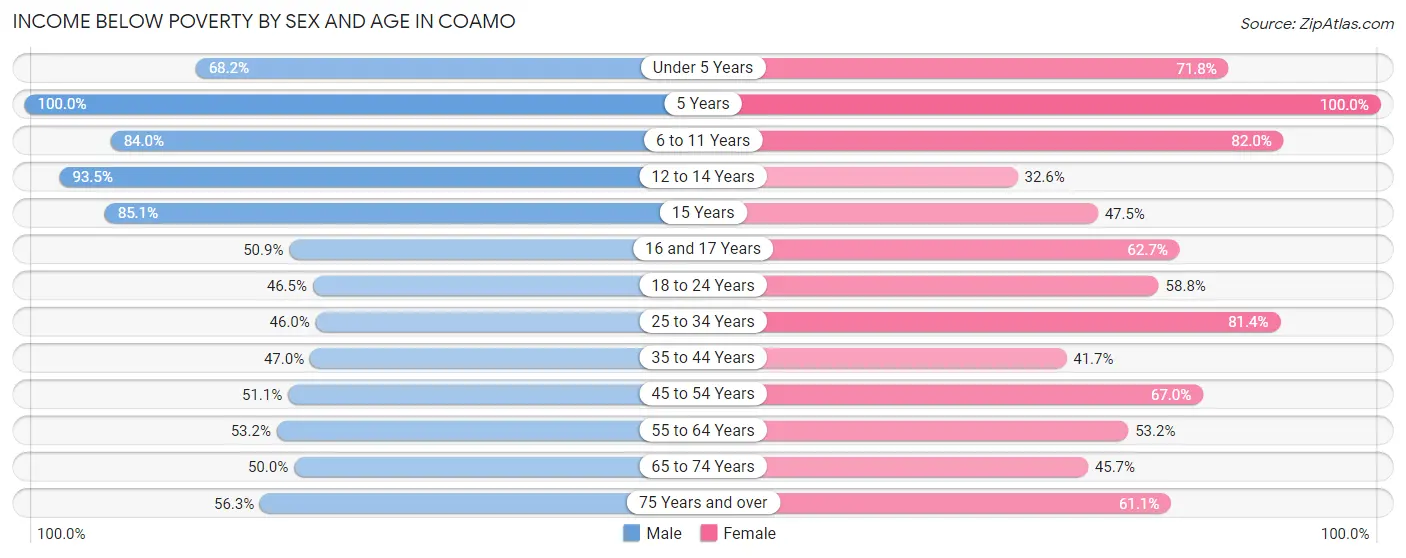
| Age Bracket | Male | Female |
| Under 5 Years | 189 (68.2%) | 117 (71.8%) |
| 5 Years | 10 (100.0%) | 20 (100.0%) |
| 6 to 11 Years | 289 (84.0%) | 196 (82.0%) |
| 12 to 14 Years | 101 (93.5%) | 46 (32.6%) |
| 15 Years | 40 (85.1%) | 19 (47.5%) |
| 16 and 17 Years | 29 (50.9%) | 37 (62.7%) |
| 18 to 24 Years | 220 (46.5%) | 207 (58.8%) |
| 25 to 34 Years | 200 (46.0%) | 463 (81.4%) |
| 35 to 44 Years | 230 (47.0%) | 210 (41.7%) |
| 45 to 54 Years | 512 (51.1%) | 596 (67.0%) |
| 55 to 64 Years | 349 (53.2%) | 444 (53.2%) |
| 65 to 74 Years | 333 (50.0%) | 248 (45.7%) |
| 75 Years and over | 219 (56.3%) | 305 (61.1%) |
| Total | 2,721 (54.9%) | 2,908 (59.9%) |
Income Above Poverty by Sex and Age in Coamo
According to the poverty statistics in Coamo, males aged 25 to 34 years and females aged 12 to 14 years are the age groups that are most secure financially, with 54.0% of males and 67.4% of females in these age groups living above the poverty line.
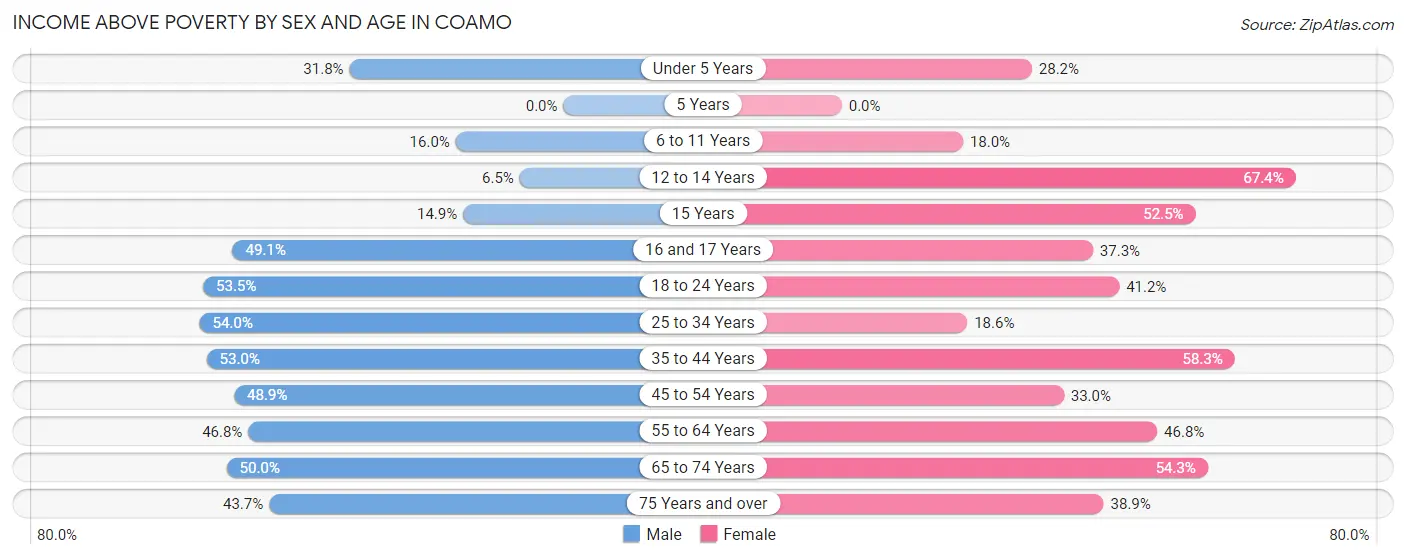
| Age Bracket | Male | Female |
| Under 5 Years | 88 (31.8%) | 46 (28.2%) |
| 5 Years | 0 (0.0%) | 0 (0.0%) |
| 6 to 11 Years | 55 (16.0%) | 43 (18.0%) |
| 12 to 14 Years | 7 (6.5%) | 95 (67.4%) |
| 15 Years | 7 (14.9%) | 21 (52.5%) |
| 16 and 17 Years | 28 (49.1%) | 22 (37.3%) |
| 18 to 24 Years | 253 (53.5%) | 145 (41.2%) |
| 25 to 34 Years | 235 (54.0%) | 106 (18.6%) |
| 35 to 44 Years | 259 (53.0%) | 294 (58.3%) |
| 45 to 54 Years | 490 (48.9%) | 293 (33.0%) |
| 55 to 64 Years | 307 (46.8%) | 391 (46.8%) |
| 65 to 74 Years | 333 (50.0%) | 295 (54.3%) |
| 75 Years and over | 170 (43.7%) | 194 (38.9%) |
| Total | 2,232 (45.1%) | 1,945 (40.1%) |
Income Below Poverty Among Married-Couple Families in Coamo
The poverty statistics for married-couple families in Coamo show that 36.8% or 446 of the total 1,212 families live below the poverty line. Families with 1 or 2 children have the highest poverty rate of 51.7%, comprising of 137 families. On the other hand, families with no children have the lowest poverty rate of 32.5%, which includes 299 families.
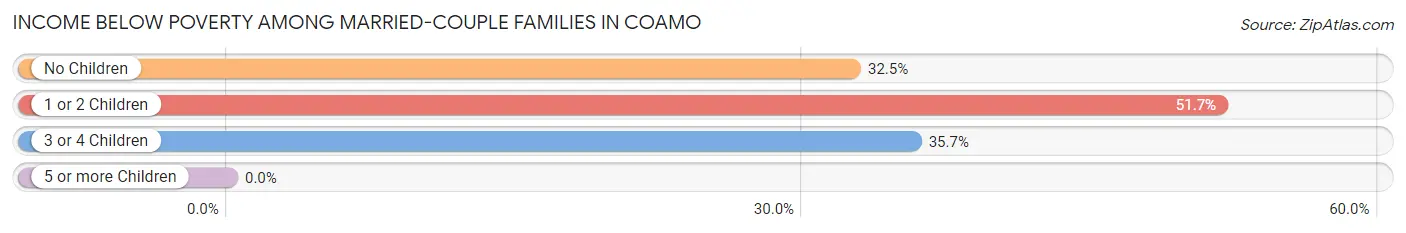
| Children | Above Poverty | Below Poverty |
| No Children | 620 (67.5%) | 299 (32.5%) |
| 1 or 2 Children | 128 (48.3%) | 137 (51.7%) |
| 3 or 4 Children | 18 (64.3%) | 10 (35.7%) |
| 5 or more Children | 0 (0.0%) | 0 (0.0%) |
| Total | 766 (63.2%) | 446 (36.8%) |
Income Below Poverty Among Single-Parent Households in Coamo
According to the poverty data in Coamo, 77.4% or 336 single-father households and 60.3% or 412 single-mother households are living below the poverty line. Among single-father households, those with 3 or 4 children have the highest poverty rate, with 11 households (100.0%) experiencing poverty. Likewise, among single-mother households, those with 3 or 4 children have the highest poverty rate, with 30 households (100.0%) falling below the poverty line.
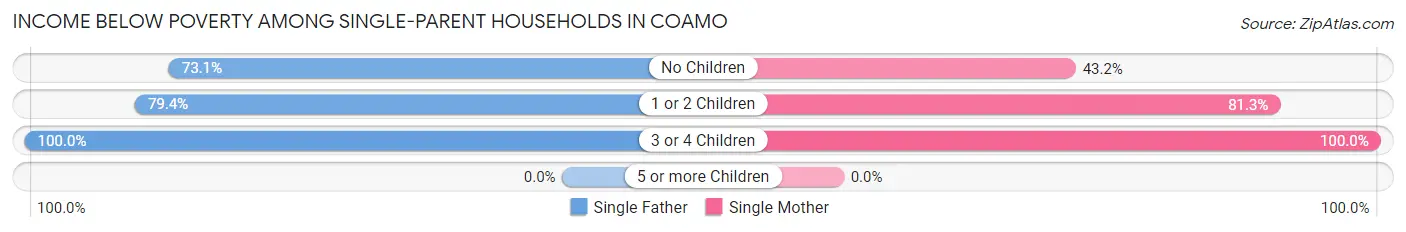
| Children | Single Father | Single Mother |
| No Children | 128 (73.1%) | 169 (43.2%) |
| 1 or 2 Children | 197 (79.4%) | 213 (81.3%) |
| 3 or 4 Children | 11 (100.0%) | 30 (100.0%) |
| 5 or more Children | 0 (0.0%) | 0 (0.0%) |
| Total | 336 (77.4%) | 412 (60.3%) |
Income Below Poverty Among Married-Couple vs Single-Parent Households in Coamo
The poverty data for Coamo shows that 446 of the married-couple family households (36.8%) and 748 of the single-parent households (67.0%) are living below the poverty level. Within the married-couple family households, those with 1 or 2 children have the highest poverty rate, with 137 households (51.7%) falling below the poverty line. Among the single-parent households, those with 3 or 4 children have the highest poverty rate, with 41 household (100.0%) living below poverty.
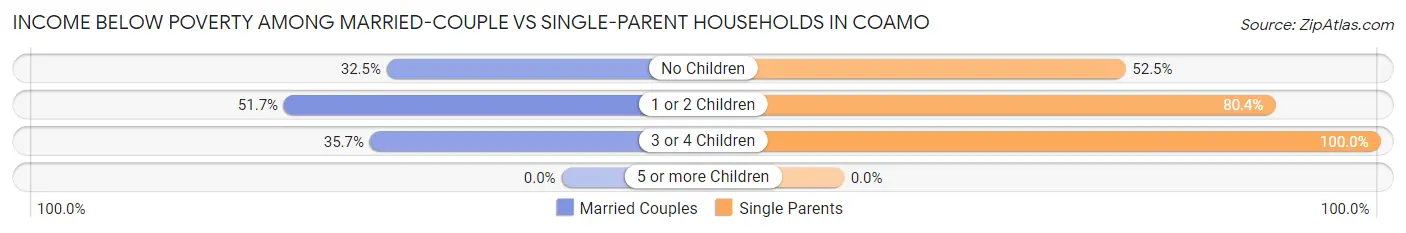
| Children | Married-Couple Families | Single-Parent Households |
| No Children | 299 (32.5%) | 297 (52.5%) |
| 1 or 2 Children | 137 (51.7%) | 410 (80.4%) |
| 3 or 4 Children | 10 (35.7%) | 41 (100.0%) |
| 5 or more Children | 0 (0.0%) | 0 (0.0%) |
| Total | 446 (36.8%) | 748 (67.0%) |
Race in Coamo
The most populous races in Coamo are Hispanic or Latino (9,762 | 99.6%), Two or more Races (4,736 | 48.3%), and White / Caucasian (3,537 | 36.1%).
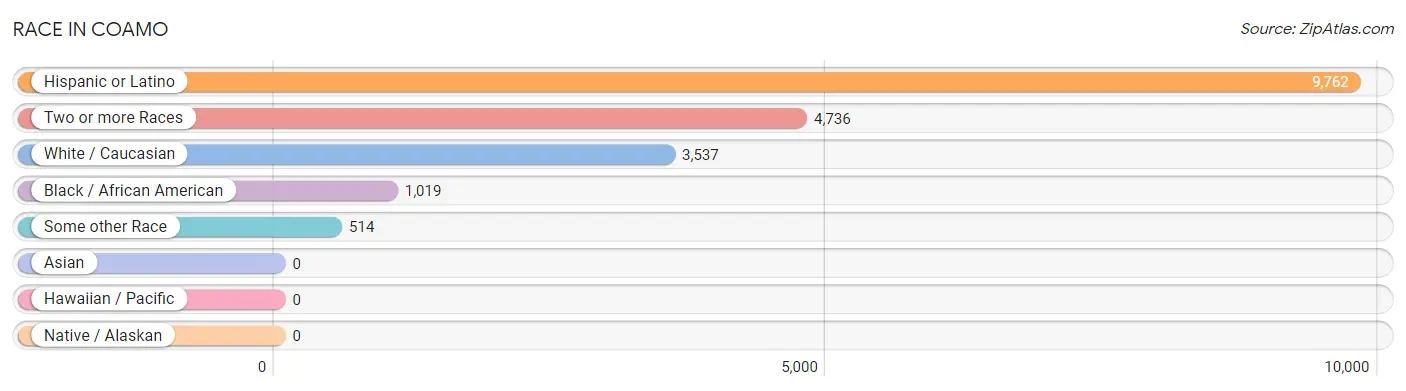
| Race | # Population | % Population |
| Asian | 0 | 0.0% |
| Black / African American | 1,019 | 10.4% |
| Hawaiian / Pacific | 0 | 0.0% |
| Hispanic or Latino | 9,762 | 99.6% |
| Native / Alaskan | 0 | 0.0% |
| White / Caucasian | 3,537 | 36.1% |
| Two or more Races | 4,736 | 48.3% |
| Some other Race | 514 | 5.2% |
| Total | 9,806 | 100.0% |
Ancestry in Coamo
The most populous ancestries reported in Coamo are Puerto Rican (9,719 | 99.1%), American (38 | 0.4%), Cuban (27 | 0.3%), Central American Indian (24 | 0.2%), and African (19 | 0.2%), together accounting for 100.2% of all Coamo residents.
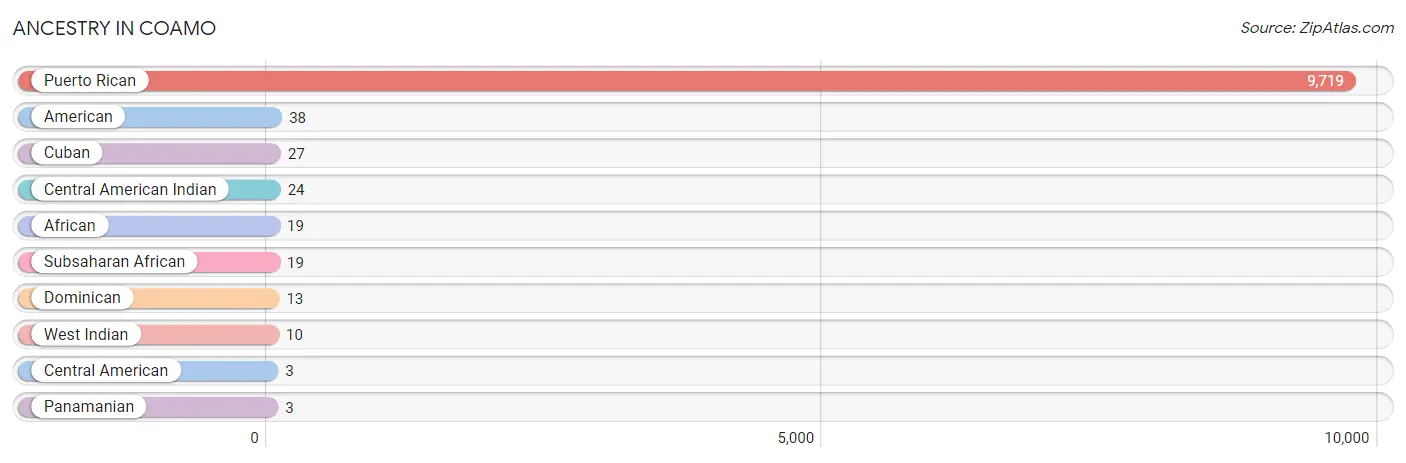
| Ancestry | # Population | % Population |
| African | 19 | 0.2% |
| American | 38 | 0.4% |
| Central American | 3 | 0.0% |
| Central American Indian | 24 | 0.2% |
| Cuban | 27 | 0.3% |
| Dominican | 13 | 0.1% |
| Panamanian | 3 | 0.0% |
| Puerto Rican | 9,719 | 99.1% |
| Subsaharan African | 19 | 0.2% |
| West Indian | 10 | 0.1% | View All 10 Rows |
Immigrants in Coamo

| Immigration Origin | # Population | % Population | View All 0 Rows |
Sex and Age in Coamo
Sex and Age in Coamo
The most populous age groups in Coamo are 50 to 54 Years (621 | 12.5%) for men and 50 to 54 Years (511 | 10.5%) for women.
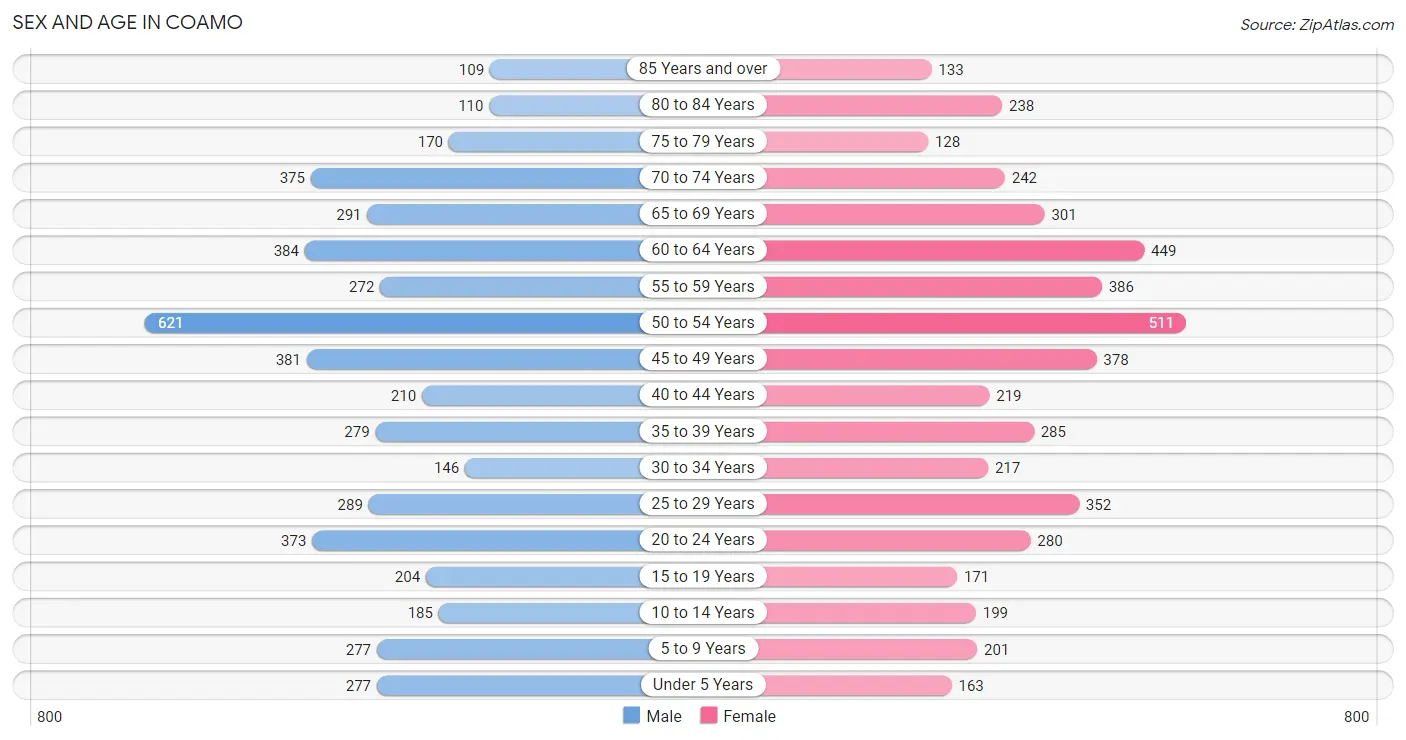
| Age Bracket | Male | Female |
| Under 5 Years | 277 (5.6%) | 163 (3.4%) |
| 5 to 9 Years | 277 (5.6%) | 201 (4.1%) |
| 10 to 14 Years | 185 (3.7%) | 199 (4.1%) |
| 15 to 19 Years | 204 (4.1%) | 171 (3.5%) |
| 20 to 24 Years | 373 (7.5%) | 280 (5.8%) |
| 25 to 29 Years | 289 (5.8%) | 352 (7.2%) |
| 30 to 34 Years | 146 (2.9%) | 217 (4.5%) |
| 35 to 39 Years | 279 (5.6%) | 285 (5.9%) |
| 40 to 44 Years | 210 (4.2%) | 219 (4.5%) |
| 45 to 49 Years | 381 (7.7%) | 378 (7.8%) |
| 50 to 54 Years | 621 (12.5%) | 511 (10.5%) |
| 55 to 59 Years | 272 (5.5%) | 386 (8.0%) |
| 60 to 64 Years | 384 (7.7%) | 449 (9.2%) |
| 65 to 69 Years | 291 (5.9%) | 301 (6.2%) |
| 70 to 74 Years | 375 (7.6%) | 242 (5.0%) |
| 75 to 79 Years | 170 (3.4%) | 128 (2.6%) |
| 80 to 84 Years | 110 (2.2%) | 238 (4.9%) |
| 85 Years and over | 109 (2.2%) | 133 (2.7%) |
| Total | 4,953 (100.0%) | 4,853 (100.0%) |
Families and Households in Coamo
Median Family Size in Coamo
The median family size in Coamo is 3.18 persons per family, with single female/mother families (683 | 29.3%) accounting for the largest median family size of 3.49 persons per family. On the other hand, single male/father families (434 | 18.6%) represent the smallest median family size with 2.98 persons per family.
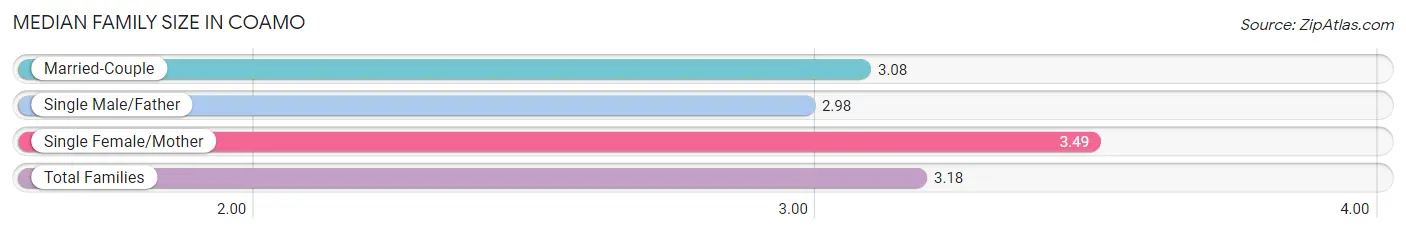
| Family Type | # Families | Family Size |
| Married-Couple | 1,212 (52.0%) | 3.08 |
| Single Male/Father | 434 (18.6%) | 2.98 |
| Single Female/Mother | 683 (29.3%) | 3.49 |
| Total Families | 2,329 (100.0%) | 3.18 |
Median Household Size in Coamo
The median household size in Coamo is 2.43 persons per household, with single female/mother households (683 | 17.0%) accounting for the largest median household size of 3.77 persons per household. non-family households (1,682 | 41.9%) represent the smallest median household size with 1.12 persons per household.
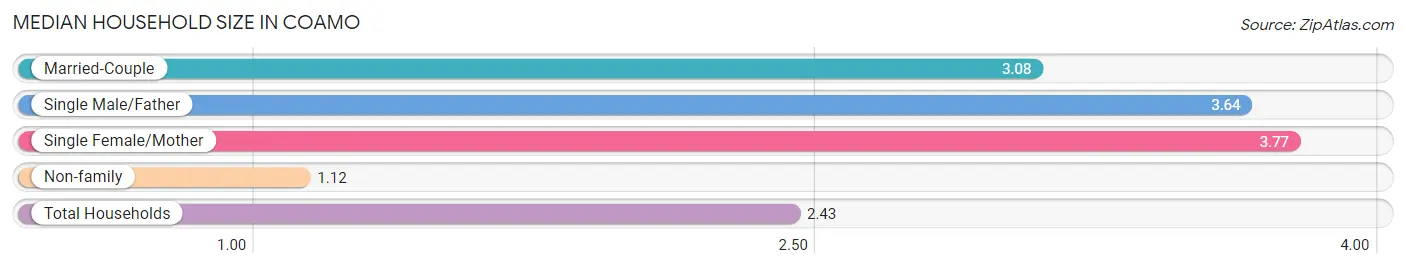
| Household Type | # Households | Household Size |
| Married-Couple | 1,212 (30.2%) | 3.08 |
| Single Male/Father | 434 (10.8%) | 3.64 |
| Single Female/Mother | 683 (17.0%) | 3.77 |
| Non-family | 1,682 (41.9%) | 1.12 |
| Total Households | 4,011 (100.0%) | 2.43 |
Household Size by Marriage Status in Coamo
Out of a total of 4,011 households in Coamo, 2,329 (58.1%) are family households, while 1,682 (41.9%) are nonfamily households. The most numerous type of family households are 2-person households, comprising 1,099, and the most common type of nonfamily households are 1-person households, comprising 1,515.
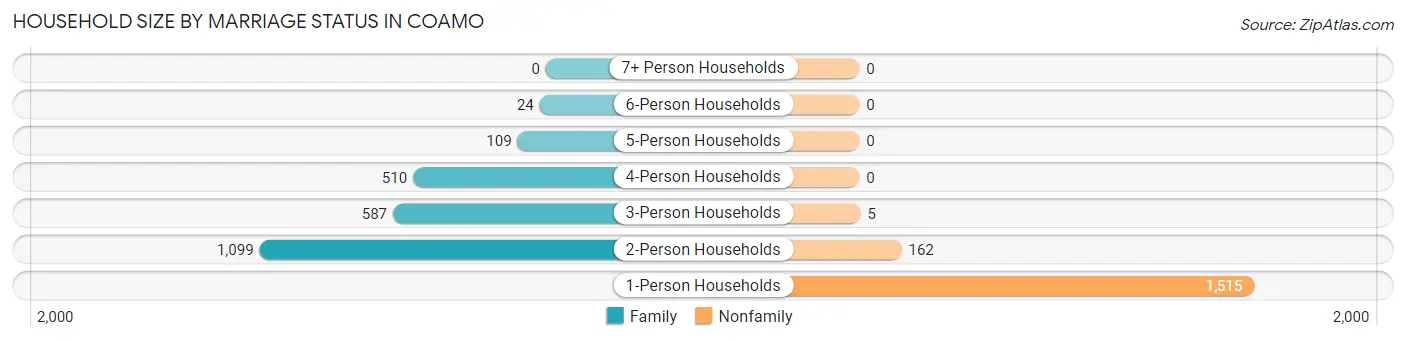
| Household Size | Family Households | Nonfamily Households |
| 1-Person Households | - | 1,515 (37.8%) |
| 2-Person Households | 1,099 (27.4%) | 162 (4.0%) |
| 3-Person Households | 587 (14.6%) | 5 (0.1%) |
| 4-Person Households | 510 (12.7%) | 0 (0.0%) |
| 5-Person Households | 109 (2.7%) | 0 (0.0%) |
| 6-Person Households | 24 (0.6%) | 0 (0.0%) |
| 7+ Person Households | 0 (0.0%) | 0 (0.0%) |
| Total | 2,329 (58.1%) | 1,682 (41.9%) |
Female Fertility in Coamo
Fertility by Age in Coamo
Average fertility rate in Coamo is 16.0 births per 1,000 women. Women in the age bracket of 15 to 19 years have the highest fertility rate with 29.0 births per 1,000 women. Women in the age bracket of 20 to 34 years acount for 83.3% of all women with births.
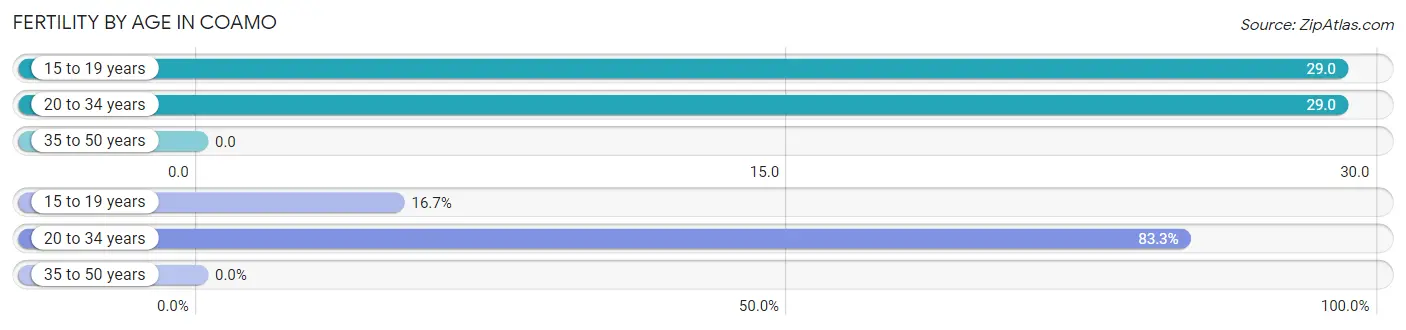
| Age Bracket | Women with Births | Births / 1,000 Women |
| 15 to 19 years | 5 (16.7%) | 29.0 |
| 20 to 34 years | 25 (83.3%) | 29.0 |
| 35 to 50 years | 0 (0.0%) | 0.0 |
| Total | 30 (100.0%) | 16.0 |
Fertility by Age by Marriage Status in Coamo
33.3% of women with births (30) in Coamo are married. The highest percentage of unmarried women with births falls into 15 to 19 years age bracket with 100.0% of them unmarried at the time of birth, while the lowest percentage of unmarried women with births belong to 20 to 34 years age bracket with 60.0% of them unmarried.
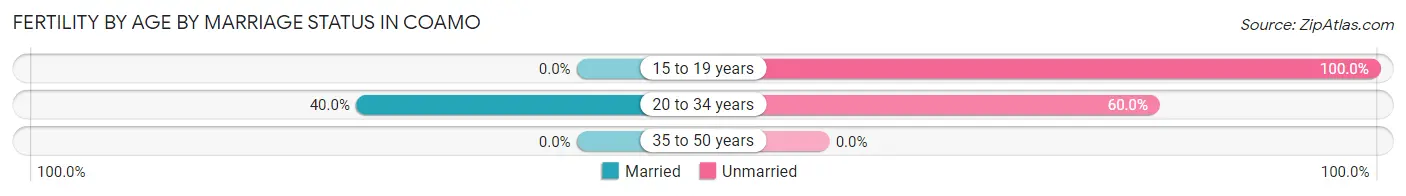
| Age Bracket | Married | Unmarried |
| 15 to 19 years | 0 (0.0%) | 5 (100.0%) |
| 20 to 34 years | 10 (40.0%) | 15 (60.0%) |
| 35 to 50 years | 0 (0.0%) | 0 (0.0%) |
| Total | 10 (33.3%) | 20 (66.7%) |
Fertility by Education in Coamo
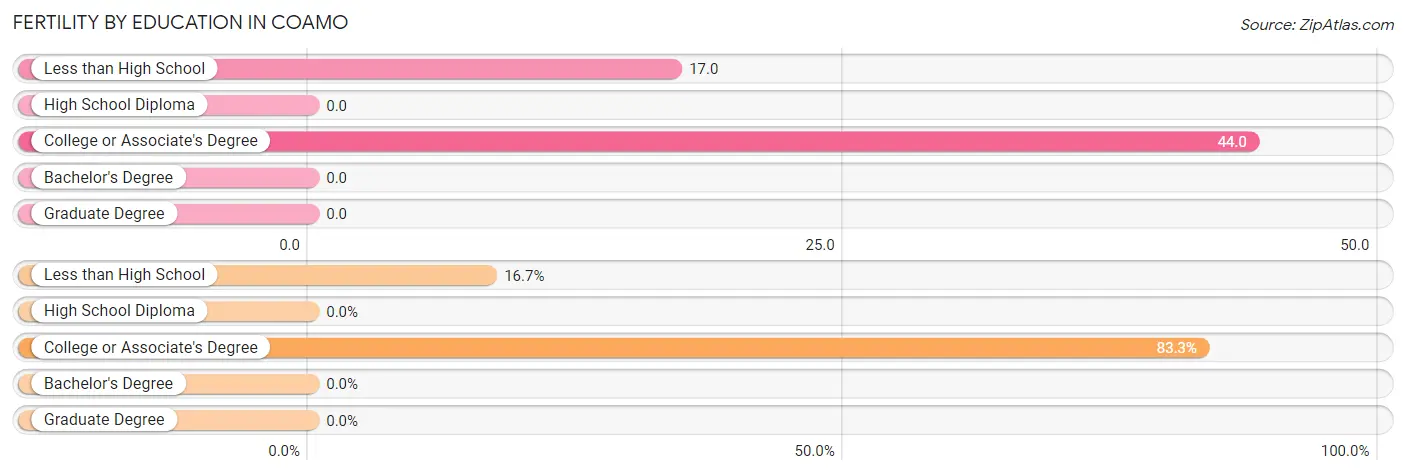
| Educational Attainment | Women with Births | Births / 1,000 Women |
| Less than High School | 5 (16.7%) | 17.0 |
| High School Diploma | 0 (0.0%) | 0.0 |
| College or Associate's Degree | 25 (83.3%) | 44.0 |
| Bachelor's Degree | 0 (0.0%) | 0.0 |
| Graduate Degree | 0 (0.0%) | 0.0 |
| Total | 30 (100.0%) | 16.0 |
Fertility by Education by Marriage Status in Coamo
66.7% of women with births in Coamo are unmarried. Women with the educational attainment of college or associate's degree are most likely to be married with 40.0% of them married at childbirth, while women with the educational attainment of less than high school are least likely to be married with 100.0% of them unmarried at childbirth.
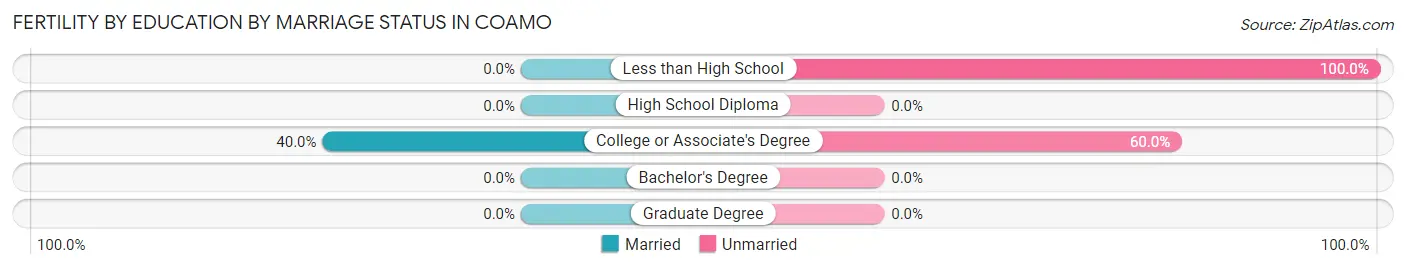
| Educational Attainment | Married | Unmarried |
| Less than High School | 0 (0.0%) | 5 (100.0%) |
| High School Diploma | 0 (0.0%) | 0 (0.0%) |
| College or Associate's Degree | 10 (40.0%) | 15 (60.0%) |
| Bachelor's Degree | 0 (0.0%) | 0 (0.0%) |
| Graduate Degree | 0 (0.0%) | 0 (0.0%) |
| Total | 10 (33.3%) | 20 (66.7%) |
Employment Characteristics in Coamo
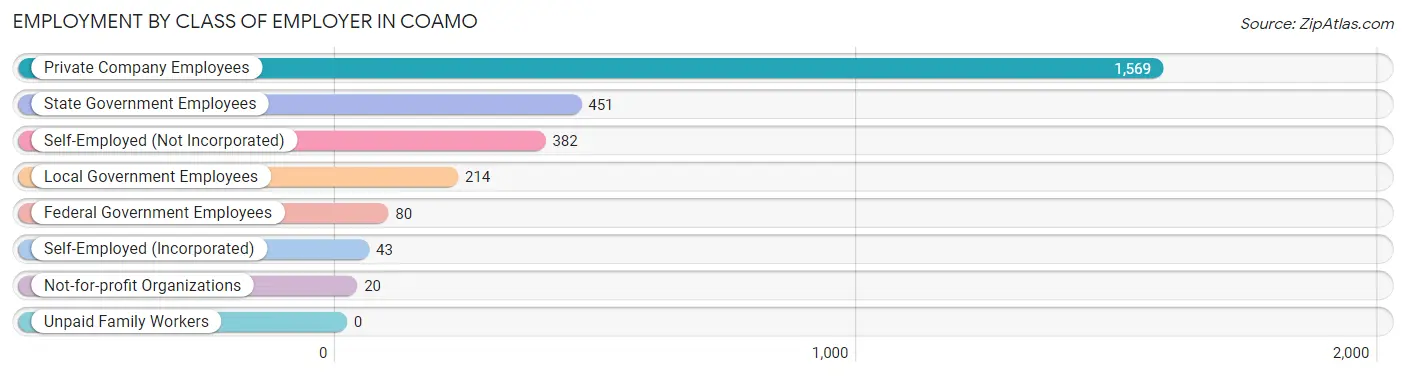
Employment by Class of Employer in Coamo
Among the 2,759 employed individuals in Coamo, private company employees (1,569 | 56.9%), state government employees (451 | 16.4%), and self-employed (not incorporated) (382 | 13.9%) make up the most common classes of employment.
| Employer Class | # Employees | % Employees |
| Private Company Employees | 1,569 | 56.9% |
| Self-Employed (Incorporated) | 43 | 1.6% |
| Self-Employed (Not Incorporated) | 382 | 13.9% |
| Not-for-profit Organizations | 20 | 0.7% |
| Local Government Employees | 214 | 7.8% |
| State Government Employees | 451 | 16.4% |
| Federal Government Employees | 80 | 2.9% |
| Unpaid Family Workers | 0 | 0.0% |
| Total | 2,759 | 100.0% |
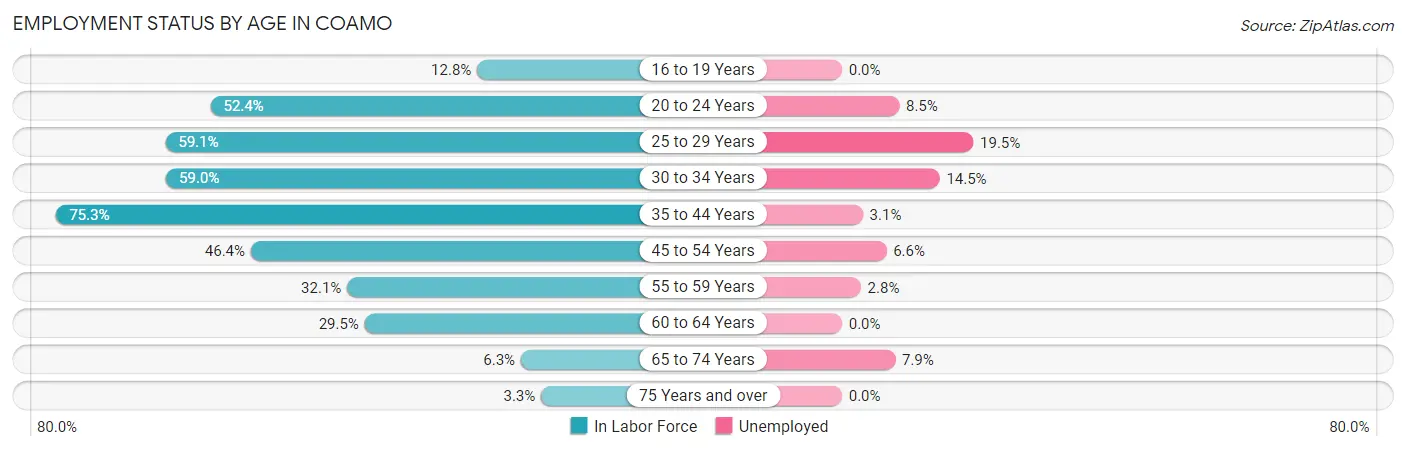
Employment Status by Age in Coamo
According to the labor force statistics for Coamo, out of the total population over 16 years of age (8,417), 37.5% or 3,156 individuals are in the labor force, with 7.2% or 227 of them unemployed. The age group with the highest labor force participation rate is 35 to 44 years, with 75.3% or 748 individuals in the labor force. Within the labor force, the 25 to 29 years age range has the highest percentage of unemployed individuals, with 19.5% or 74 of them being unemployed.
| Age Bracket | In Labor Force | Unemployed |
| 16 to 19 Years | 37 (12.8%) | 0 (0.0%) |
| 20 to 24 Years | 342 (52.4%) | 29 (8.5%) |
| 25 to 29 Years | 379 (59.1%) | 74 (19.5%) |
| 30 to 34 Years | 214 (59.0%) | 31 (14.5%) |
| 35 to 44 Years | 748 (75.3%) | 23 (3.1%) |
| 45 to 54 Years | 877 (46.4%) | 58 (6.6%) |
| 55 to 59 Years | 211 (32.1%) | 6 (2.8%) |
| 60 to 64 Years | 246 (29.5%) | 0 (0.0%) |
| 65 to 74 Years | 76 (6.3%) | 6 (7.9%) |
| 75 Years and over | 29 (3.3%) | 0 (0.0%) |
| Total | 3,156 (37.5%) | 227 (7.2%) |
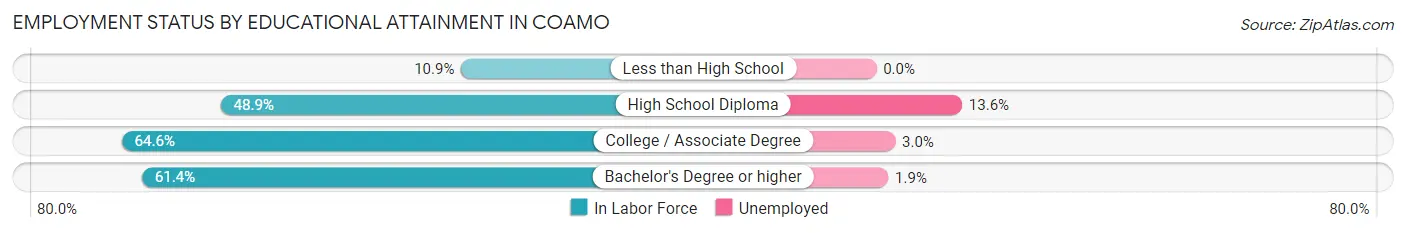
Employment Status by Educational Attainment in Coamo
According to labor force statistics for Coamo, 49.7% of individuals (2,673) out of the total population between 25 and 64 years of age (5,379) are in the labor force, with 7.2% or 192 of them being unemployed. The group with the highest labor force participation rate are those with the educational attainment of college / associate degree, with 64.6% or 711 individuals in the labor force. Within the labor force, individuals with high school diploma education have the highest percentage of unemployment, with 13.6% or 157 of them being unemployed.
| Educational Attainment | In Labor Force | Unemployed |
| Less than High School | 79 (10.9%) | 0 (0.0%) |
| High School Diploma | 1,151 (48.9%) | 320 (13.6%) |
| College / Associate Degree | 711 (64.6%) | 33 (3.0%) |
| Bachelor's Degree or higher | 735 (61.4%) | 23 (1.9%) |
| Total | 2,673 (49.7%) | 387 (7.2%) |
Employment Occupations by Sex in Coamo
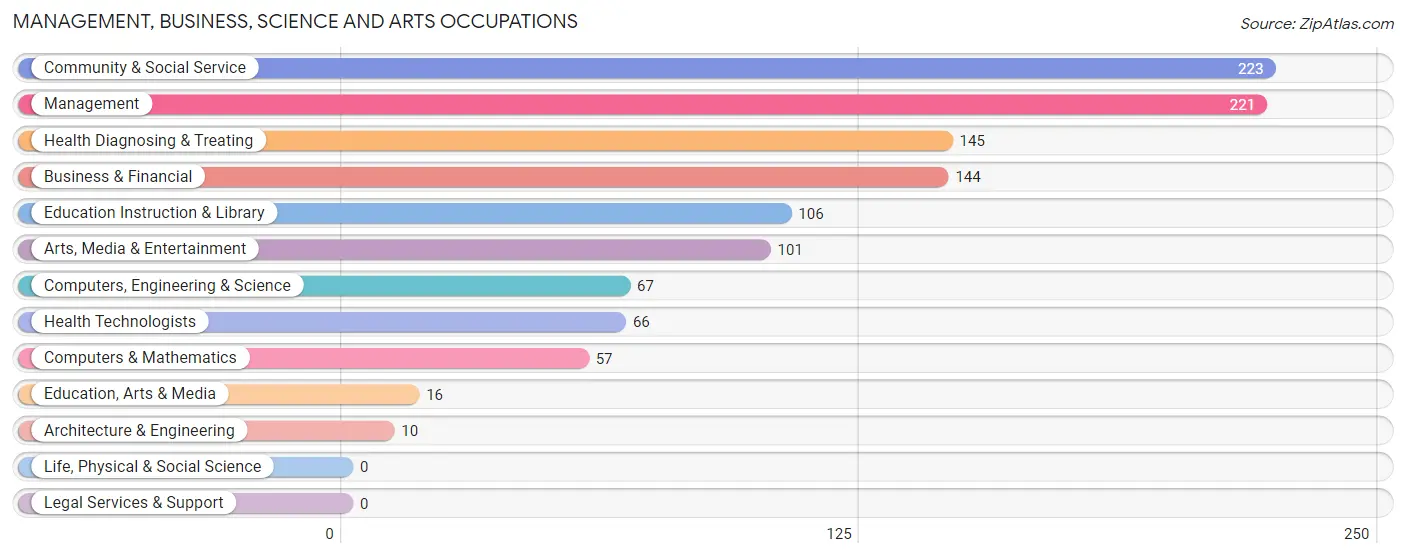
Management, Business, Science and Arts Occupations
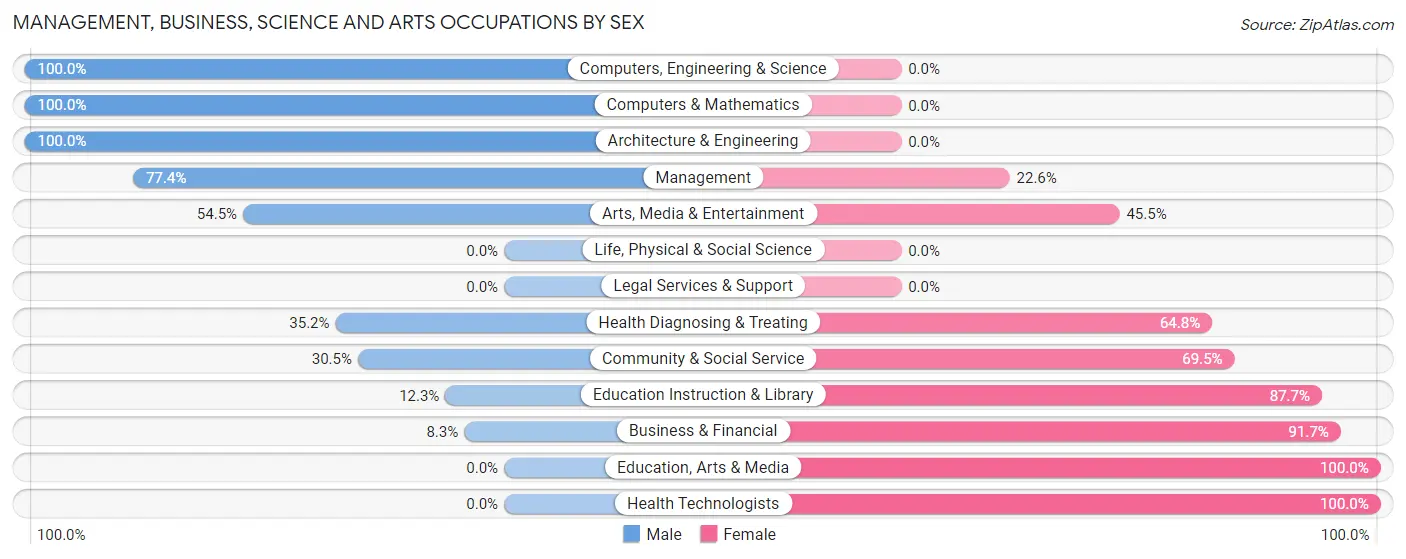
The most common Management, Business, Science and Arts occupations in Coamo are Community & Social Service (223 | 7.6%), Management (221 | 7.5%), Health Diagnosing & Treating (145 | 5.0%), Business & Financial (144 | 4.9%), and Education Instruction & Library (106 | 3.6%).
Management, Business, Science and Arts Occupations by Sex
Within the Management, Business, Science and Arts occupations in Coamo, the most male-oriented occupations are Computers, Engineering & Science (100.0%), Computers & Mathematics (100.0%), and Architecture & Engineering (100.0%), while the most female-oriented occupations are Education, Arts & Media (100.0%), Health Technologists (100.0%), and Business & Financial (91.7%).
| Occupation | Male | Female |
| Management | 171 (77.4%) | 50 (22.6%) |
| Business & Financial | 12 (8.3%) | 132 (91.7%) |
| Computers, Engineering & Science | 67 (100.0%) | 0 (0.0%) |
| Computers & Mathematics | 57 (100.0%) | 0 (0.0%) |
| Architecture & Engineering | 10 (100.0%) | 0 (0.0%) |
| Life, Physical & Social Science | 0 (0.0%) | 0 (0.0%) |
| Community & Social Service | 68 (30.5%) | 155 (69.5%) |
| Education, Arts & Media | 0 (0.0%) | 16 (100.0%) |
| Legal Services & Support | 0 (0.0%) | 0 (0.0%) |
| Education Instruction & Library | 13 (12.3%) | 93 (87.7%) |
| Arts, Media & Entertainment | 55 (54.5%) | 46 (45.5%) |
| Health Diagnosing & Treating | 51 (35.2%) | 94 (64.8%) |
| Health Technologists | 0 (0.0%) | 66 (100.0%) |
| Total (Category) | 369 (46.1%) | 431 (53.9%) |
| Total (Overall) | 1,579 (54.0%) | 1,347 (46.0%) |
Services Occupations
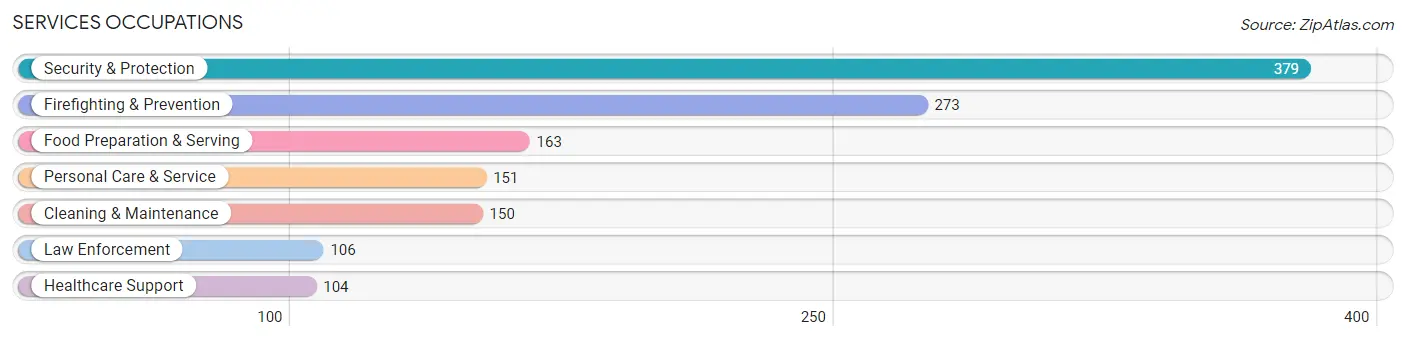
The most common Services occupations in Coamo are Security & Protection (379 | 13.0%), Firefighting & Prevention (273 | 9.3%), Food Preparation & Serving (163 | 5.6%), Personal Care & Service (151 | 5.2%), and Cleaning & Maintenance (150 | 5.1%).
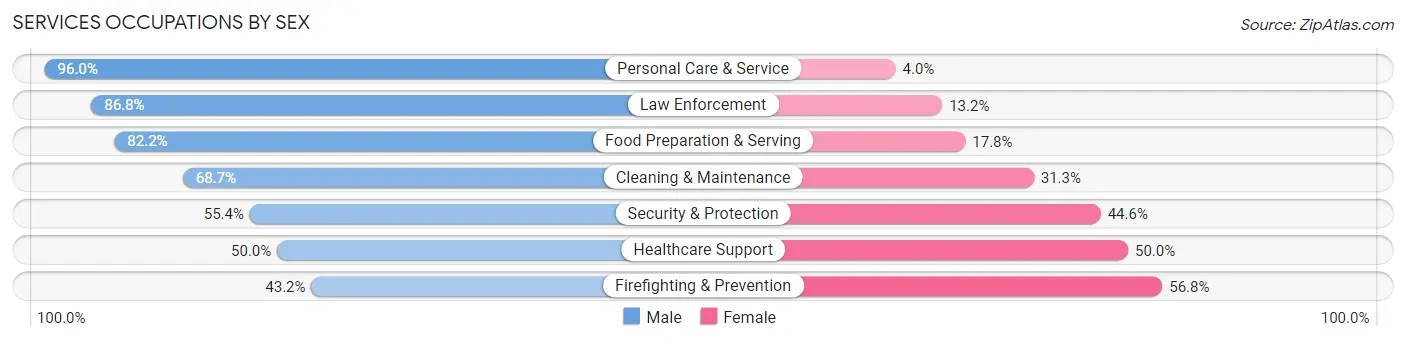
Services Occupations by Sex
Within the Services occupations in Coamo, the most male-oriented occupations are Personal Care & Service (96.0%), Law Enforcement (86.8%), and Food Preparation & Serving (82.2%), while the most female-oriented occupations are Firefighting & Prevention (56.8%), Healthcare Support (50.0%), and Security & Protection (44.6%).
| Occupation | Male | Female |
| Healthcare Support | 52 (50.0%) | 52 (50.0%) |
| Security & Protection | 210 (55.4%) | 169 (44.6%) |
| Firefighting & Prevention | 118 (43.2%) | 155 (56.8%) |
| Law Enforcement | 92 (86.8%) | 14 (13.2%) |
| Food Preparation & Serving | 134 (82.2%) | 29 (17.8%) |
| Cleaning & Maintenance | 103 (68.7%) | 47 (31.3%) |
| Personal Care & Service | 145 (96.0%) | 6 (4.0%) |
| Total (Category) | 644 (68.0%) | 303 (32.0%) |
| Total (Overall) | 1,579 (54.0%) | 1,347 (46.0%) |
Sales and Office Occupations
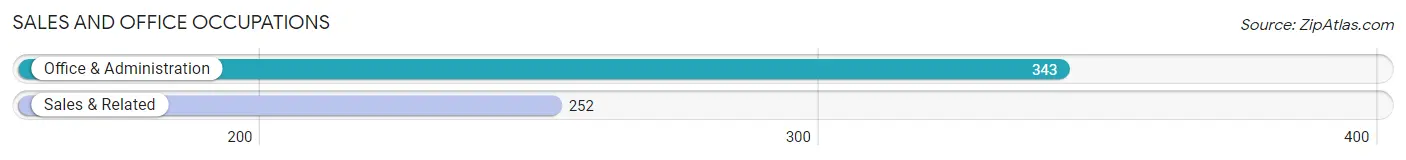
The most common Sales and Office occupations in Coamo are Office & Administration (343 | 11.7%), and Sales & Related (252 | 8.6%).
Sales and Office Occupations by Sex
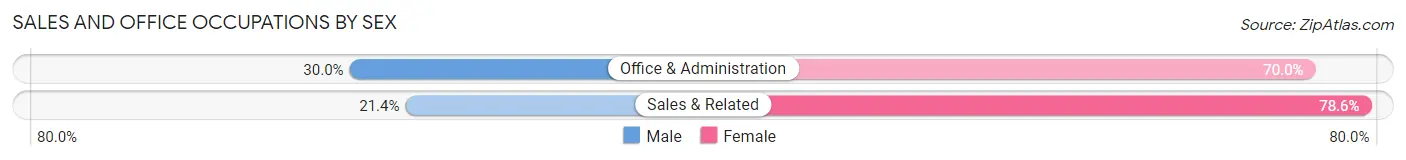
| Occupation | Male | Female |
| Sales & Related | 54 (21.4%) | 198 (78.6%) |
| Office & Administration | 103 (30.0%) | 240 (70.0%) |
| Total (Category) | 157 (26.4%) | 438 (73.6%) |
| Total (Overall) | 1,579 (54.0%) | 1,347 (46.0%) |
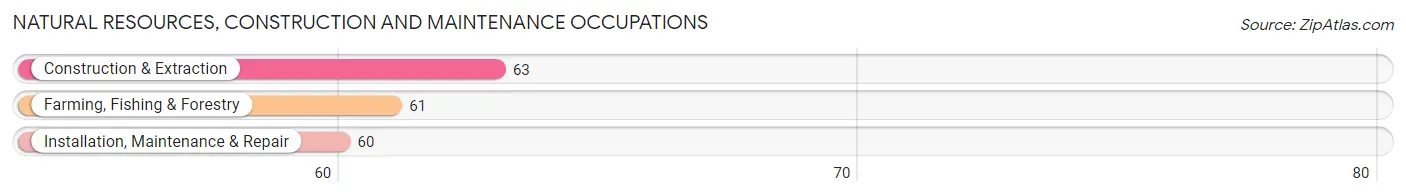
Natural Resources, Construction and Maintenance Occupations
The most common Natural Resources, Construction and Maintenance occupations in Coamo are Construction & Extraction (63 | 2.1%), Farming, Fishing & Forestry (61 | 2.1%), and Installation, Maintenance & Repair (60 | 2.1%).
Natural Resources, Construction and Maintenance Occupations by Sex
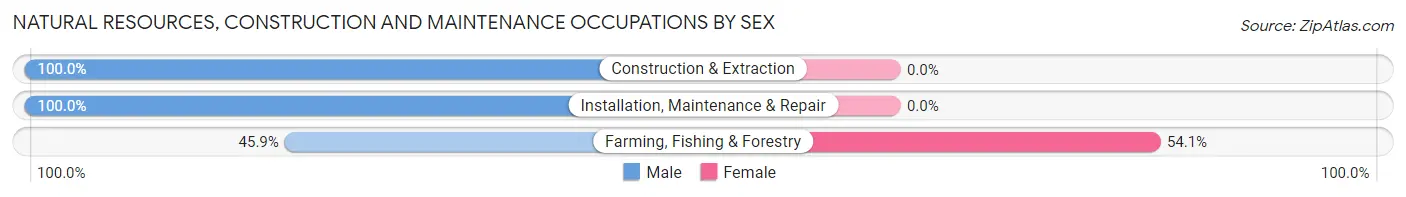
| Occupation | Male | Female |
| Farming, Fishing & Forestry | 28 (45.9%) | 33 (54.1%) |
| Construction & Extraction | 63 (100.0%) | 0 (0.0%) |
| Installation, Maintenance & Repair | 60 (100.0%) | 0 (0.0%) |
| Total (Category) | 151 (82.1%) | 33 (17.9%) |
| Total (Overall) | 1,579 (54.0%) | 1,347 (46.0%) |
Production, Transportation and Moving Occupations
The most common Production, Transportation and Moving occupations in Coamo are Production (296 | 10.1%), Material Moving (63 | 2.1%), and Transportation (41 | 1.4%).
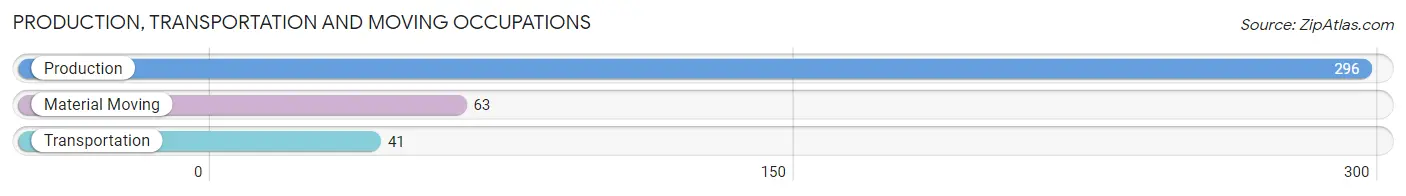
Production, Transportation and Moving Occupations by Sex
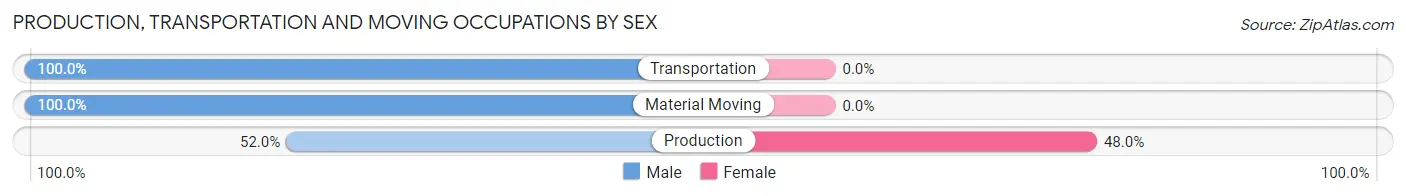
| Occupation | Male | Female |
| Production | 154 (52.0%) | 142 (48.0%) |
| Transportation | 41 (100.0%) | 0 (0.0%) |
| Material Moving | 63 (100.0%) | 0 (0.0%) |
| Total (Category) | 258 (64.5%) | 142 (35.5%) |
| Total (Overall) | 1,579 (54.0%) | 1,347 (46.0%) |
Employment Industries by Sex in Coamo
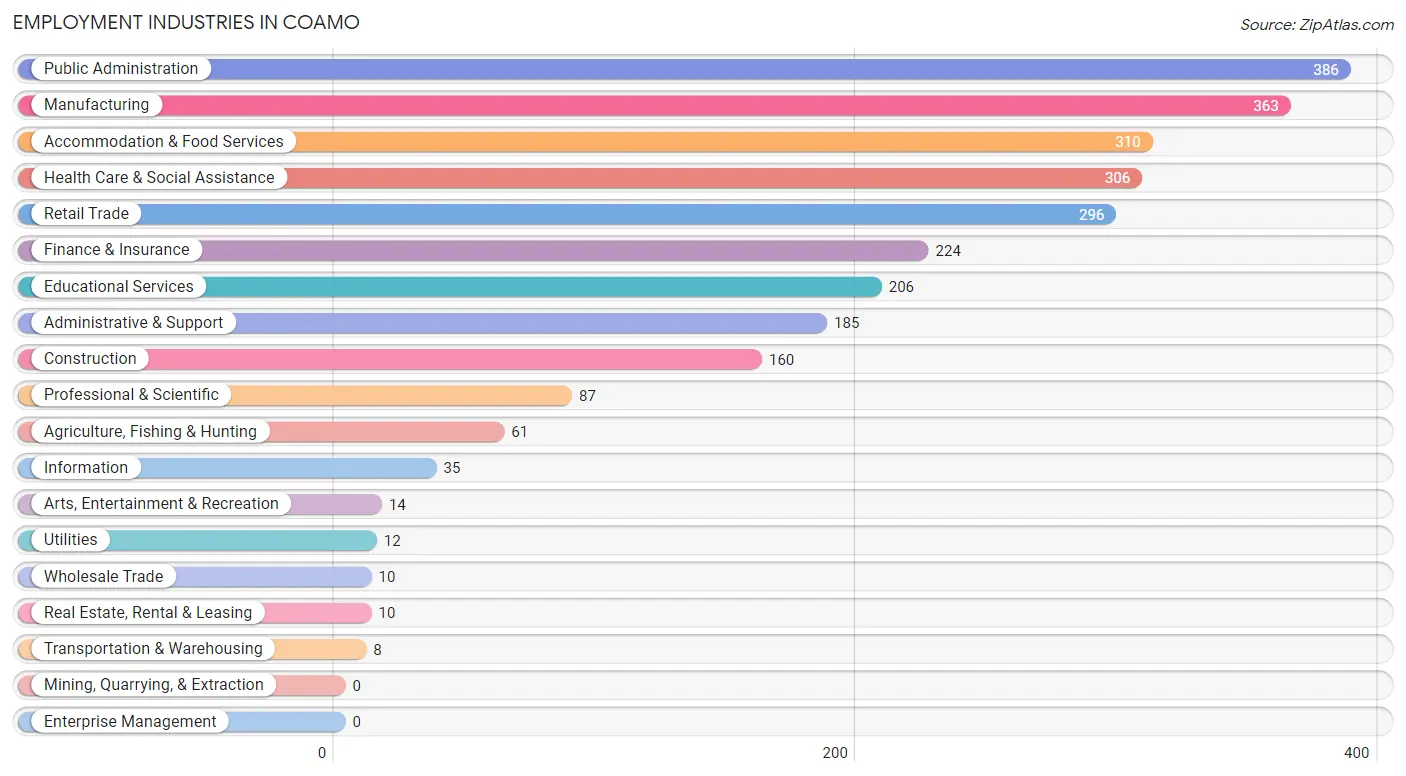
Employment Industries in Coamo
The major employment industries in Coamo include Public Administration (386 | 13.2%), Manufacturing (363 | 12.4%), Accommodation & Food Services (310 | 10.6%), Health Care & Social Assistance (306 | 10.5%), and Retail Trade (296 | 10.1%).
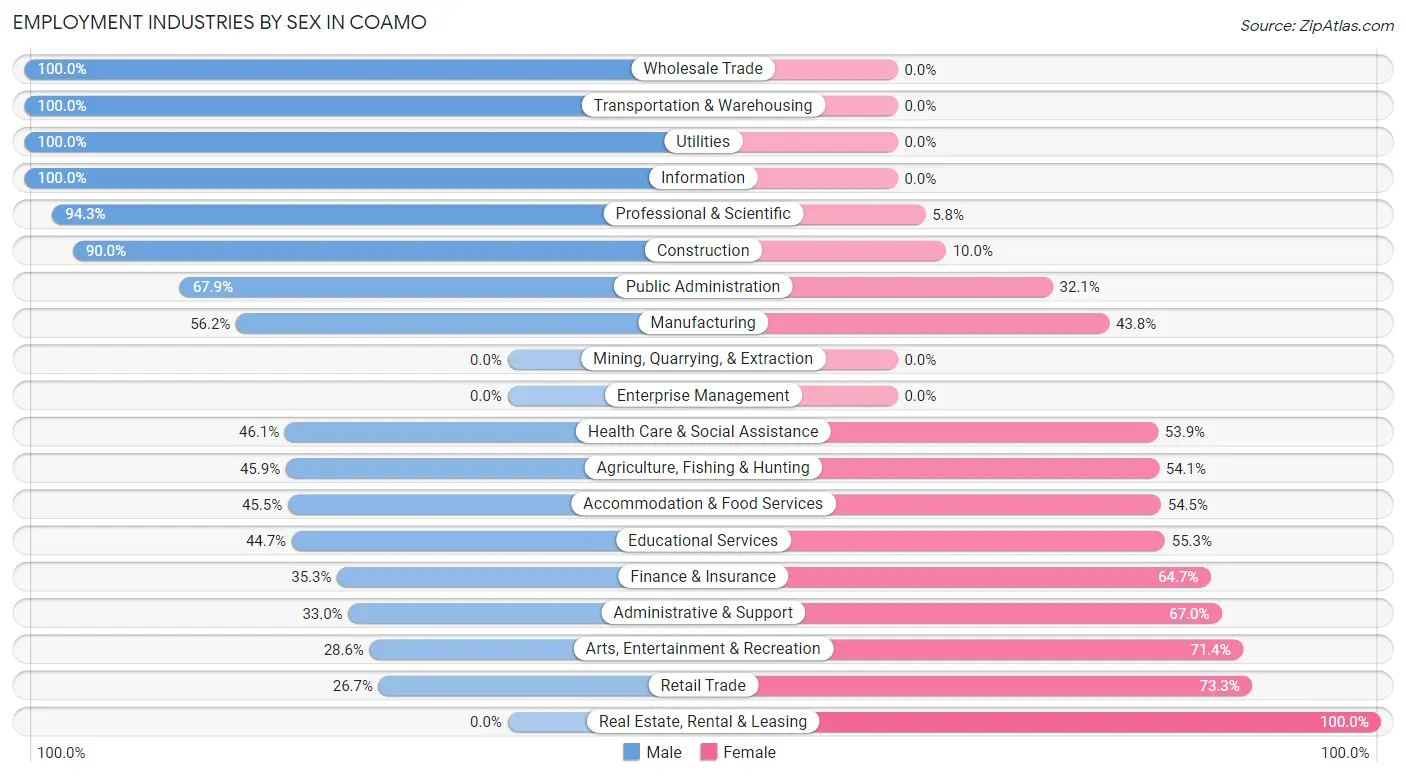
Employment Industries by Sex in Coamo
The Coamo industries that see more men than women are Wholesale Trade (100.0%), Transportation & Warehousing (100.0%), and Utilities (100.0%), whereas the industries that tend to have a higher number of women are Real Estate, Rental & Leasing (100.0%), Retail Trade (73.3%), and Arts, Entertainment & Recreation (71.4%).
| Industry | Male | Female |
| Agriculture, Fishing & Hunting | 28 (45.9%) | 33 (54.1%) |
| Mining, Quarrying, & Extraction | 0 (0.0%) | 0 (0.0%) |
| Construction | 144 (90.0%) | 16 (10.0%) |
| Manufacturing | 204 (56.2%) | 159 (43.8%) |
| Wholesale Trade | 10 (100.0%) | 0 (0.0%) |
| Retail Trade | 79 (26.7%) | 217 (73.3%) |
| Transportation & Warehousing | 8 (100.0%) | 0 (0.0%) |
| Utilities | 12 (100.0%) | 0 (0.0%) |
| Information | 35 (100.0%) | 0 (0.0%) |
| Finance & Insurance | 79 (35.3%) | 145 (64.7%) |
| Real Estate, Rental & Leasing | 0 (0.0%) | 10 (100.0%) |
| Professional & Scientific | 82 (94.3%) | 5 (5.8%) |
| Enterprise Management | 0 (0.0%) | 0 (0.0%) |
| Administrative & Support | 61 (33.0%) | 124 (67.0%) |
| Educational Services | 92 (44.7%) | 114 (55.3%) |
| Health Care & Social Assistance | 141 (46.1%) | 165 (53.9%) |
| Arts, Entertainment & Recreation | 4 (28.6%) | 10 (71.4%) |
| Accommodation & Food Services | 141 (45.5%) | 169 (54.5%) |
| Public Administration | 262 (67.9%) | 124 (32.1%) |
| Total | 1,579 (54.0%) | 1,347 (46.0%) |
Education in Coamo
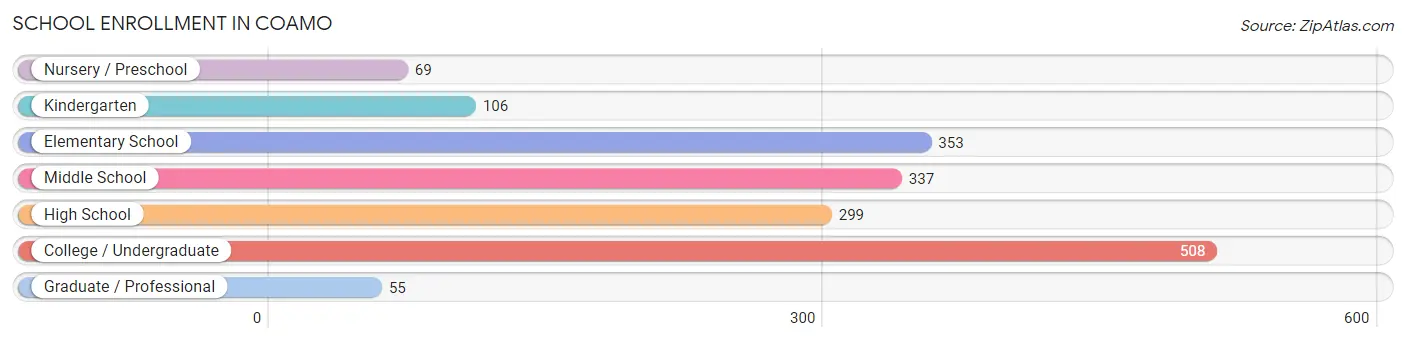
School Enrollment in Coamo
The most common levels of schooling among the 1,727 students in Coamo are college / undergraduate (508 | 29.4%), elementary school (353 | 20.4%), and middle school (337 | 19.5%).
| School Level | # Students | % Students |
| Nursery / Preschool | 69 | 4.0% |
| Kindergarten | 106 | 6.1% |
| Elementary School | 353 | 20.4% |
| Middle School | 337 | 19.5% |
| High School | 299 | 17.3% |
| College / Undergraduate | 508 | 29.4% |
| Graduate / Professional | 55 | 3.2% |
| Total | 1,727 | 100.0% |
School Enrollment by Age by Funding Source in Coamo
Out of a total of 1,727 students who are enrolled in schools in Coamo, 572 (33.1%) attend a private institution, while the remaining 1,155 (66.9%) are enrolled in public schools. The age group of 18 to 19 year olds has the highest likelihood of being enrolled in private schools, with 118 (92.9% in the age bracket) enrolled. Conversely, the age group of 10 to 14 year olds has the lowest likelihood of being enrolled in a private school, with 373 (98.7% in the age bracket) attending a public institution.
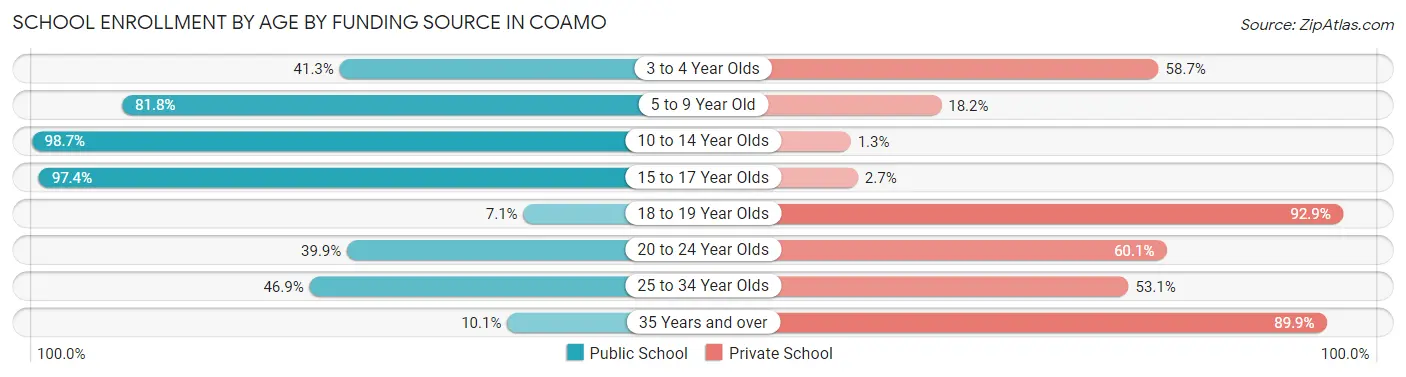
| Age Bracket | Public School | Private School |
| 3 to 4 Year Olds | 31 (41.3%) | 44 (58.7%) |
| 5 to 9 Year Old | 387 (81.8%) | 86 (18.2%) |
| 10 to 14 Year Olds | 373 (98.7%) | 5 (1.3%) |
| 15 to 17 Year Olds | 184 (97.4%) | 5 (2.6%) |
| 18 to 19 Year Olds | 9 (7.1%) | 118 (92.9%) |
| 20 to 24 Year Olds | 115 (39.9%) | 173 (60.1%) |
| 25 to 34 Year Olds | 46 (46.9%) | 52 (53.1%) |
| 35 Years and over | 10 (10.1%) | 89 (89.9%) |
| Total | 1,155 (66.9%) | 572 (33.1%) |
Educational Attainment by Field of Study in Coamo
Education (402 | 26.2%), business (369 | 24.1%), science & technology (188 | 12.3%), arts & humanities (129 | 8.4%), and physical & health sciences (126 | 8.2%) are the most common fields of study among 1,533 individuals in Coamo who have obtained a bachelor's degree or higher.
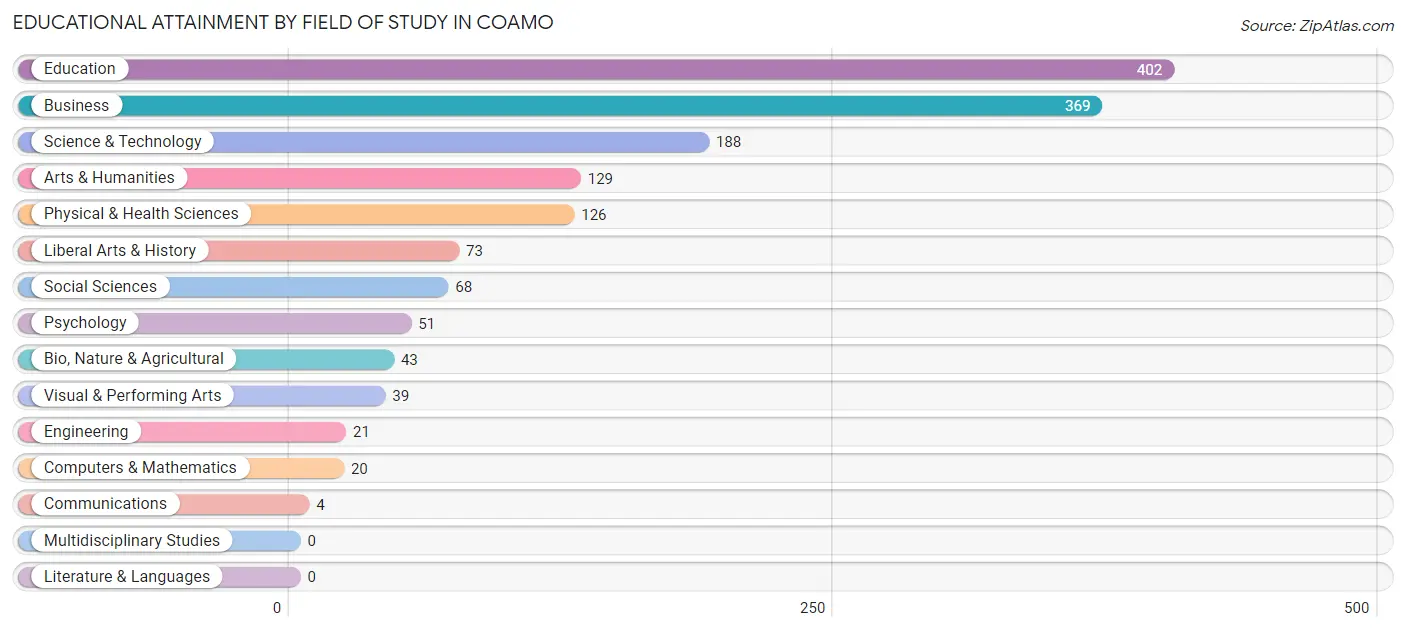
| Field of Study | # Graduates | % Graduates |
| Computers & Mathematics | 20 | 1.3% |
| Bio, Nature & Agricultural | 43 | 2.8% |
| Physical & Health Sciences | 126 | 8.2% |
| Psychology | 51 | 3.3% |
| Social Sciences | 68 | 4.4% |
| Engineering | 21 | 1.4% |
| Multidisciplinary Studies | 0 | 0.0% |
| Science & Technology | 188 | 12.3% |
| Business | 369 | 24.1% |
| Education | 402 | 26.2% |
| Literature & Languages | 0 | 0.0% |
| Liberal Arts & History | 73 | 4.8% |
| Visual & Performing Arts | 39 | 2.5% |
| Communications | 4 | 0.3% |
| Arts & Humanities | 129 | 8.4% |
| Total | 1,533 | 100.0% |
Transportation & Commute in Coamo
Vehicle Availability by Sex in Coamo
The most prevalent vehicle ownership categories in Coamo are males with 2 vehicles (648, accounting for 43.7%) and females with 2 vehicles (268, making up 50.7%).
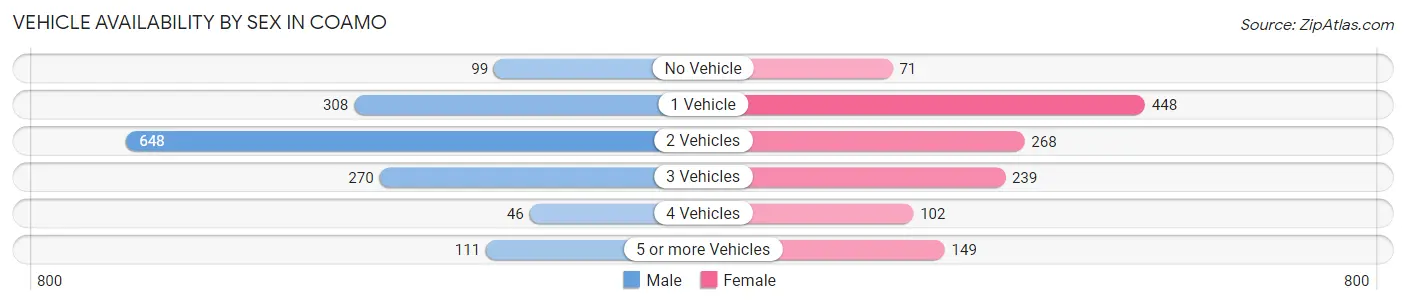
| Vehicles Available | Male | Female |
| No Vehicle | 99 (6.7%) | 71 (5.6%) |
| 1 Vehicle | 308 (20.8%) | 448 (35.1%) |
| 2 Vehicles | 648 (43.7%) | 268 (21.0%) |
| 3 Vehicles | 270 (18.2%) | 239 (18.7%) |
| 4 Vehicles | 46 (3.1%) | 102 (8.0%) |
| 5 or more Vehicles | 111 (7.5%) | 149 (11.7%) |
| Total | 1,482 (100.0%) | 1,277 (100.0%) |
Commute Time in Coamo
The most frequently occuring commute durations in Coamo are 5 to 9 minutes (603 commuters, 23.3%), 10 to 14 minutes (440 commuters, 17.0%), and 15 to 19 minutes (393 commuters, 15.2%).
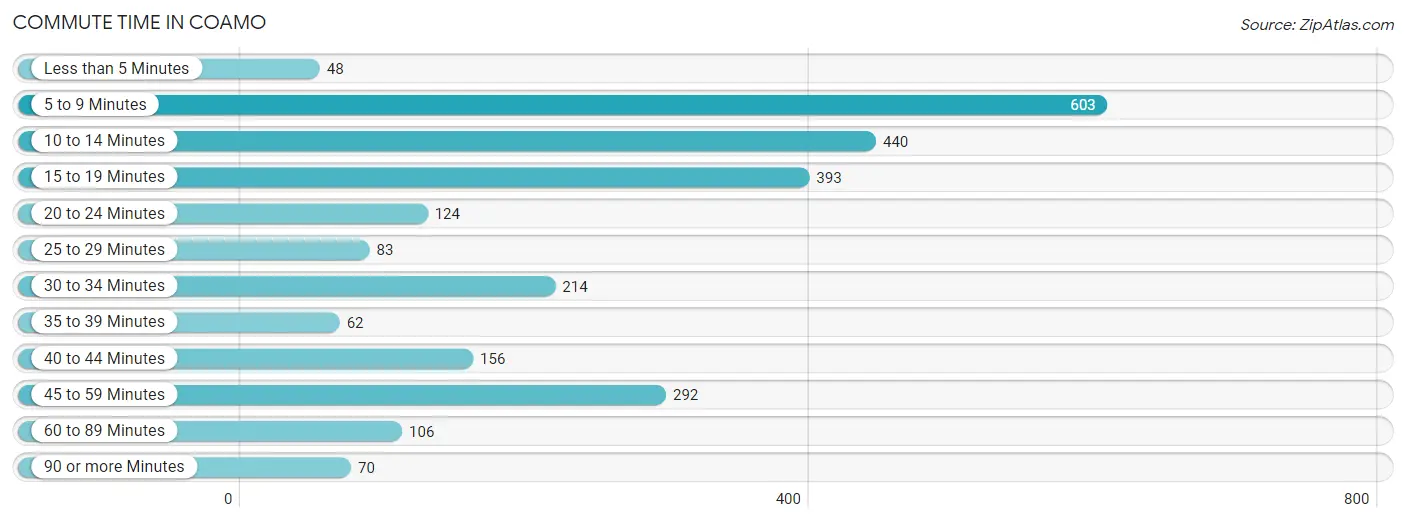
| Commute Time | # Commuters | % Commuters |
| Less than 5 Minutes | 48 | 1.8% |
| 5 to 9 Minutes | 603 | 23.3% |
| 10 to 14 Minutes | 440 | 17.0% |
| 15 to 19 Minutes | 393 | 15.2% |
| 20 to 24 Minutes | 124 | 4.8% |
| 25 to 29 Minutes | 83 | 3.2% |
| 30 to 34 Minutes | 214 | 8.3% |
| 35 to 39 Minutes | 62 | 2.4% |
| 40 to 44 Minutes | 156 | 6.0% |
| 45 to 59 Minutes | 292 | 11.3% |
| 60 to 89 Minutes | 106 | 4.1% |
| 90 or more Minutes | 70 | 2.7% |
Commute Time by Sex in Coamo
The most common commute times in Coamo are 5 to 9 minutes (283 commuters, 19.6%) for males and 5 to 9 minutes (320 commuters, 27.9%) for females.
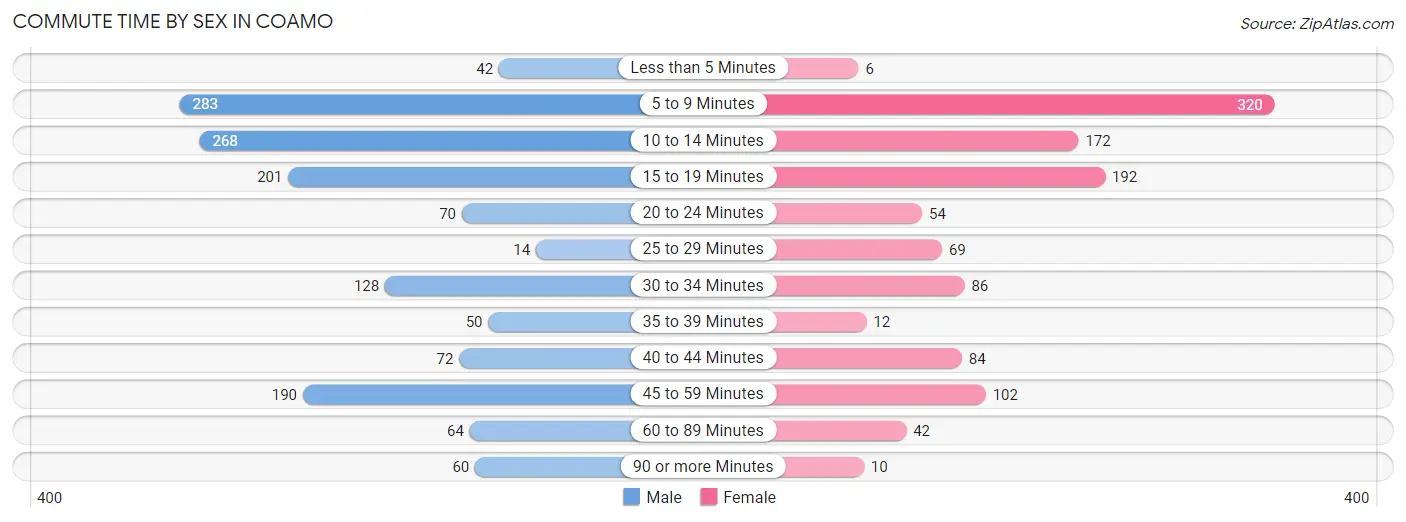
| Commute Time | Male | Female |
| Less than 5 Minutes | 42 (2.9%) | 6 (0.5%) |
| 5 to 9 Minutes | 283 (19.6%) | 320 (27.9%) |
| 10 to 14 Minutes | 268 (18.6%) | 172 (15.0%) |
| 15 to 19 Minutes | 201 (13.9%) | 192 (16.7%) |
| 20 to 24 Minutes | 70 (4.9%) | 54 (4.7%) |
| 25 to 29 Minutes | 14 (1.0%) | 69 (6.0%) |
| 30 to 34 Minutes | 128 (8.9%) | 86 (7.5%) |
| 35 to 39 Minutes | 50 (3.5%) | 12 (1.0%) |
| 40 to 44 Minutes | 72 (5.0%) | 84 (7.3%) |
| 45 to 59 Minutes | 190 (13.2%) | 102 (8.9%) |
| 60 to 89 Minutes | 64 (4.4%) | 42 (3.7%) |
| 90 or more Minutes | 60 (4.2%) | 10 (0.9%) |
Time of Departure to Work by Sex in Coamo
The most frequent times of departure to work in Coamo are 5:30 AM to 5:59 AM (275, 19.1%) for males and 8:00 AM to 8:29 AM (299, 26.0%) for females.
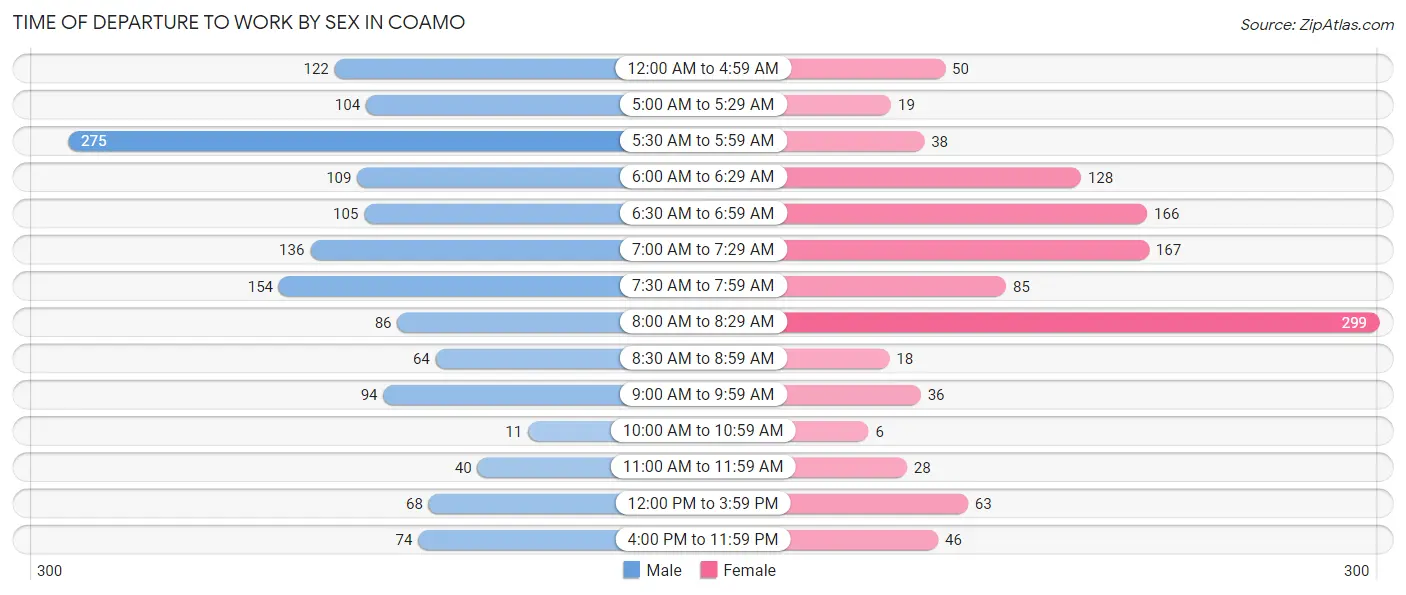
| Time of Departure | Male | Female |
| 12:00 AM to 4:59 AM | 122 (8.5%) | 50 (4.3%) |
| 5:00 AM to 5:29 AM | 104 (7.2%) | 19 (1.7%) |
| 5:30 AM to 5:59 AM | 275 (19.1%) | 38 (3.3%) |
| 6:00 AM to 6:29 AM | 109 (7.6%) | 128 (11.1%) |
| 6:30 AM to 6:59 AM | 105 (7.3%) | 166 (14.4%) |
| 7:00 AM to 7:29 AM | 136 (9.4%) | 167 (14.5%) |
| 7:30 AM to 7:59 AM | 154 (10.7%) | 85 (7.4%) |
| 8:00 AM to 8:29 AM | 86 (6.0%) | 299 (26.0%) |
| 8:30 AM to 8:59 AM | 64 (4.4%) | 18 (1.6%) |
| 9:00 AM to 9:59 AM | 94 (6.5%) | 36 (3.1%) |
| 10:00 AM to 10:59 AM | 11 (0.8%) | 6 (0.5%) |
| 11:00 AM to 11:59 AM | 40 (2.8%) | 28 (2.4%) |
| 12:00 PM to 3:59 PM | 68 (4.7%) | 63 (5.5%) |
| 4:00 PM to 11:59 PM | 74 (5.1%) | 46 (4.0%) |
| Total | 1,442 (100.0%) | 1,149 (100.0%) |
Housing Occupancy in Coamo
Occupancy by Ownership in Coamo
Of the total 4,011 dwellings in Coamo, owner-occupied units account for 2,540 (63.3%), while renter-occupied units make up 1,471 (36.7%).
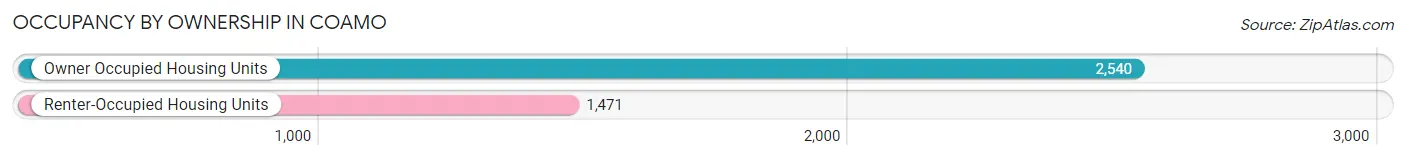
| Occupancy | # Housing Units | % Housing Units |
| Owner Occupied Housing Units | 2,540 | 63.3% |
| Renter-Occupied Housing Units | 1,471 | 36.7% |
| Total Occupied Housing Units | 4,011 | 100.0% |
Occupancy by Household Size in Coamo
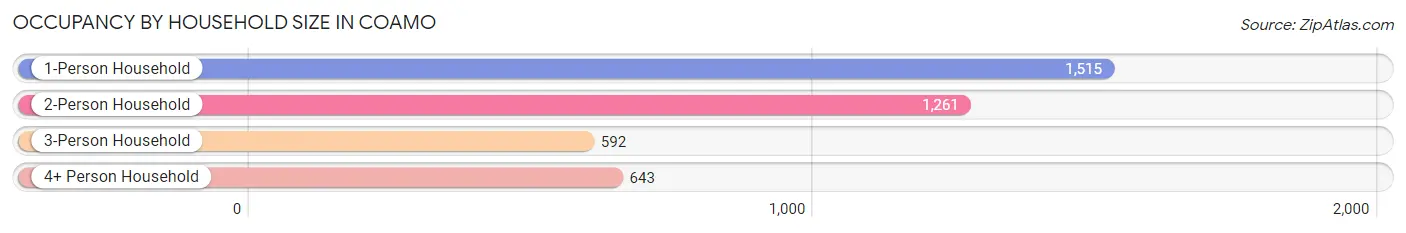
| Household Size | # Housing Units | % Housing Units |
| 1-Person Household | 1,515 | 37.8% |
| 2-Person Household | 1,261 | 31.4% |
| 3-Person Household | 592 | 14.8% |
| 4+ Person Household | 643 | 16.0% |
| Total Housing Units | 4,011 | 100.0% |
Occupancy by Ownership by Household Size in Coamo

| Household Size | Owner-occupied | Renter-occupied |
| 1-Person Household | 869 (57.4%) | 646 (42.6%) |
| 2-Person Household | 865 (68.6%) | 396 (31.4%) |
| 3-Person Household | 448 (75.7%) | 144 (24.3%) |
| 4+ Person Household | 358 (55.7%) | 285 (44.3%) |
| Total Housing Units | 2,540 (63.3%) | 1,471 (36.7%) |
Occupancy by Educational Attainment in Coamo
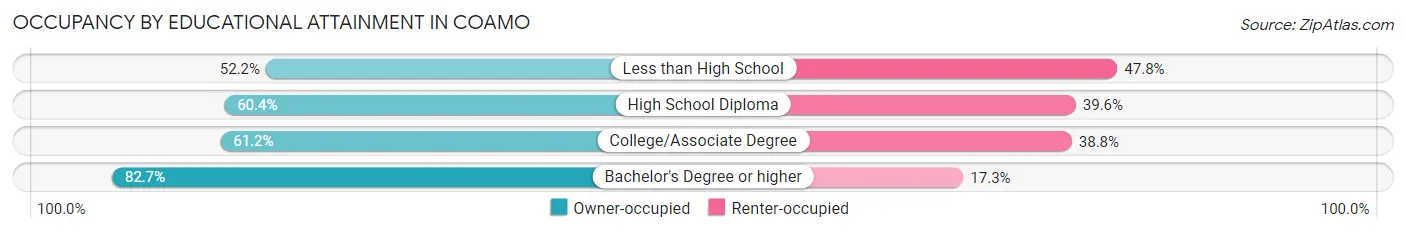
| Household Size | Owner-occupied | Renter-occupied |
| Less than High School | 336 (52.2%) | 308 (47.8%) |
| High School Diploma | 1,204 (60.4%) | 789 (39.6%) |
| College/Associate Degree | 388 (61.2%) | 246 (38.8%) |
| Bachelor's Degree or higher | 612 (82.7%) | 128 (17.3%) |
Occupancy by Age of Householder in Coamo
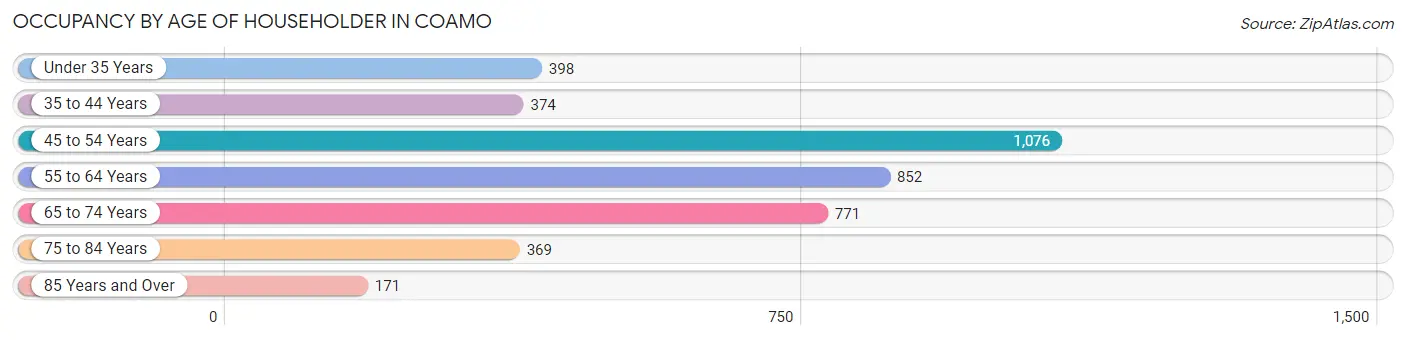
| Age Bracket | # Households | % Households |
| Under 35 Years | 398 | 9.9% |
| 35 to 44 Years | 374 | 9.3% |
| 45 to 54 Years | 1,076 | 26.8% |
| 55 to 64 Years | 852 | 21.2% |
| 65 to 74 Years | 771 | 19.2% |
| 75 to 84 Years | 369 | 9.2% |
| 85 Years and Over | 171 | 4.3% |
| Total | 4,011 | 100.0% |
Housing Finances in Coamo
Median Income by Occupancy in Coamo
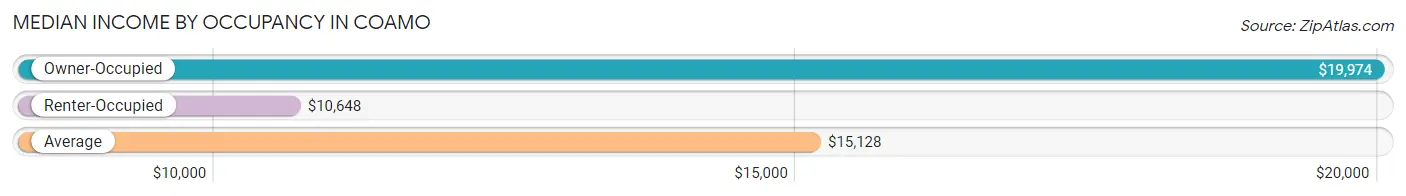
| Occupancy Type | # Households | Median Income |
| Owner-Occupied | 2,540 (63.3%) | $19,974 |
| Renter-Occupied | 1,471 (36.7%) | $10,648 |
| Average | 4,011 (100.0%) | $15,128 |
Occupancy by Householder Income Bracket in Coamo
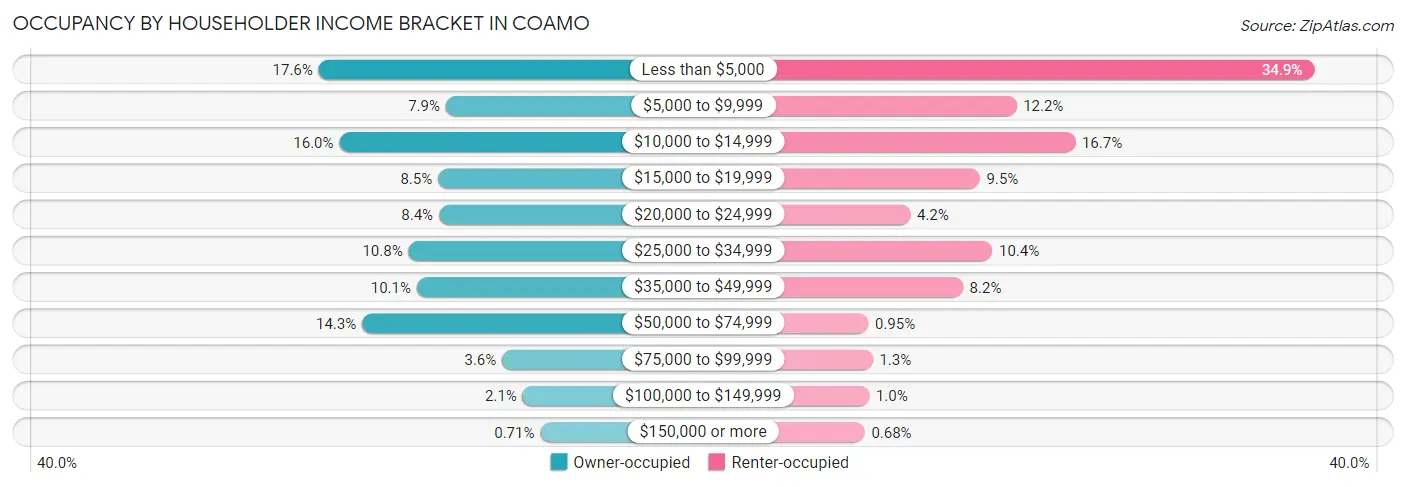
| Income Bracket | Owner-occupied | Renter-occupied |
| Less than $5,000 | 447 (17.6%) | 514 (34.9%) |
| $5,000 to $9,999 | 201 (7.9%) | 180 (12.2%) |
| $10,000 to $14,999 | 407 (16.0%) | 246 (16.7%) |
| $15,000 to $19,999 | 216 (8.5%) | 139 (9.5%) |
| $20,000 to $24,999 | 214 (8.4%) | 61 (4.2%) |
| $25,000 to $34,999 | 273 (10.7%) | 153 (10.4%) |
| $35,000 to $49,999 | 257 (10.1%) | 120 (8.2%) |
| $50,000 to $74,999 | 363 (14.3%) | 14 (0.9%) |
| $75,000 to $99,999 | 92 (3.6%) | 19 (1.3%) |
| $100,000 to $149,999 | 52 (2.1%) | 15 (1.0%) |
| $150,000 or more | 18 (0.7%) | 10 (0.7%) |
| Total | 2,540 (100.0%) | 1,471 (100.0%) |
Monthly Housing Cost Tiers in Coamo
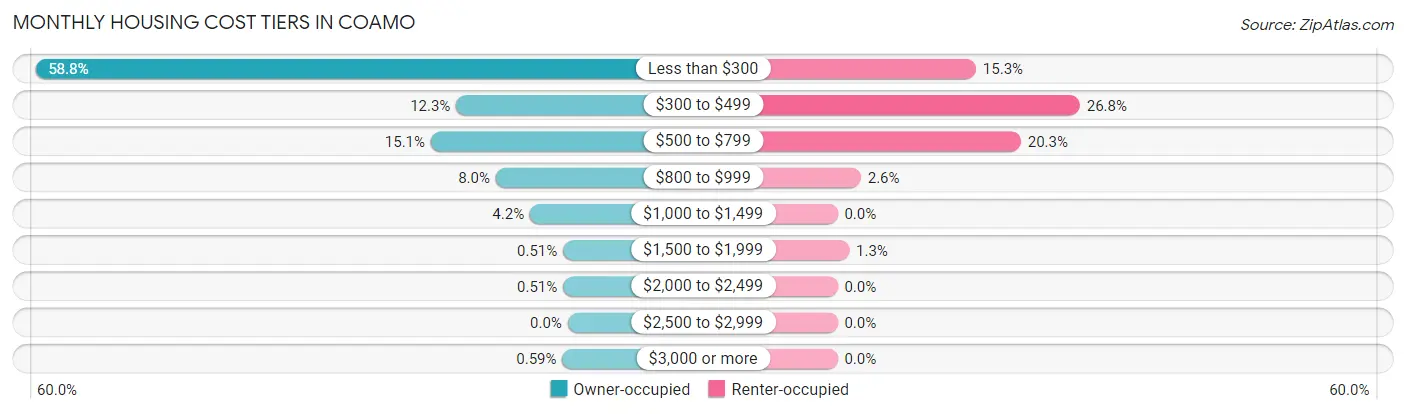
| Monthly Cost | Owner-occupied | Renter-occupied |
| Less than $300 | 1,494 (58.8%) | 225 (15.3%) |
| $300 to $499 | 313 (12.3%) | 394 (26.8%) |
| $500 to $799 | 384 (15.1%) | 298 (20.3%) |
| $800 to $999 | 202 (8.0%) | 38 (2.6%) |
| $1,000 to $1,499 | 106 (4.2%) | 0 (0.0%) |
| $1,500 to $1,999 | 13 (0.5%) | 19 (1.3%) |
| $2,000 to $2,499 | 13 (0.5%) | 0 (0.0%) |
| $2,500 to $2,999 | 0 (0.0%) | 0 (0.0%) |
| $3,000 or more | 15 (0.6%) | 0 (0.0%) |
| Total | 2,540 (100.0%) | 1,471 (100.0%) |
Physical Housing Characteristics in Coamo
Housing Structures in Coamo
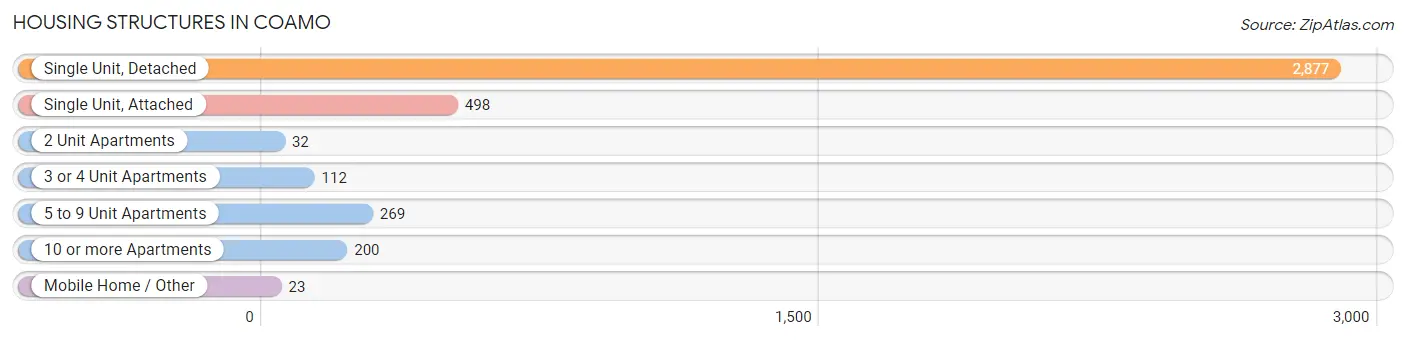
| Structure Type | # Housing Units | % Housing Units |
| Single Unit, Detached | 2,877 | 71.7% |
| Single Unit, Attached | 498 | 12.4% |
| 2 Unit Apartments | 32 | 0.8% |
| 3 or 4 Unit Apartments | 112 | 2.8% |
| 5 to 9 Unit Apartments | 269 | 6.7% |
| 10 or more Apartments | 200 | 5.0% |
| Mobile Home / Other | 23 | 0.6% |
| Total | 4,011 | 100.0% |
Housing Structures by Occupancy in Coamo
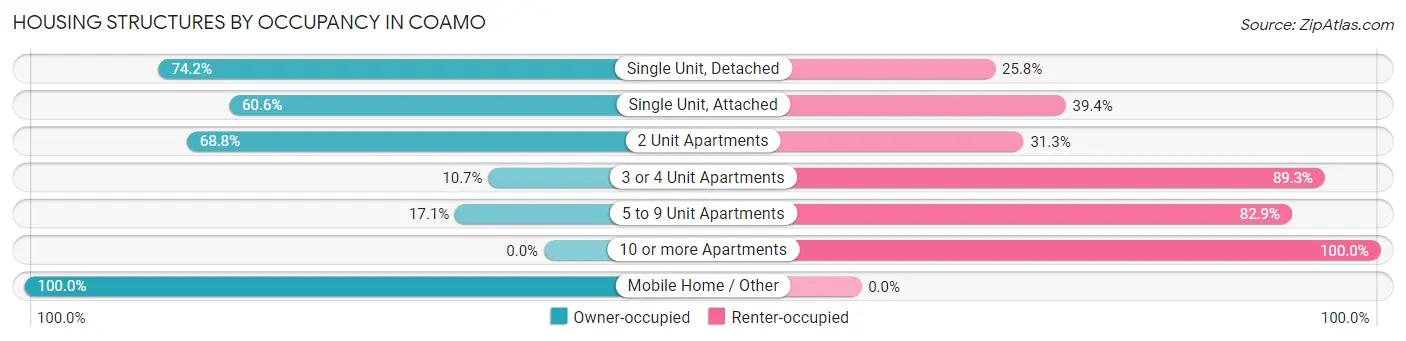
| Structure Type | Owner-occupied | Renter-occupied |
| Single Unit, Detached | 2,135 (74.2%) | 742 (25.8%) |
| Single Unit, Attached | 302 (60.6%) | 196 (39.4%) |
| 2 Unit Apartments | 22 (68.8%) | 10 (31.2%) |
| 3 or 4 Unit Apartments | 12 (10.7%) | 100 (89.3%) |
| 5 to 9 Unit Apartments | 46 (17.1%) | 223 (82.9%) |
| 10 or more Apartments | 0 (0.0%) | 200 (100.0%) |
| Mobile Home / Other | 23 (100.0%) | 0 (0.0%) |
| Total | 2,540 (63.3%) | 1,471 (36.7%) |
Housing Structures by Number of Rooms in Coamo
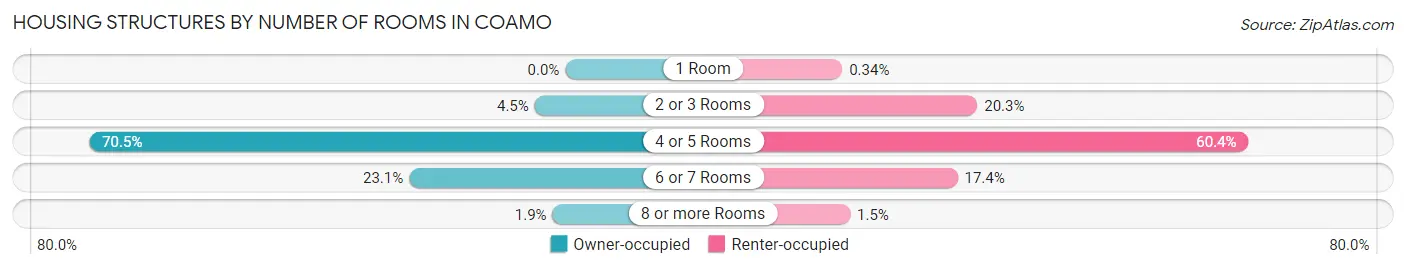
| Number of Rooms | Owner-occupied | Renter-occupied |
| 1 Room | 0 (0.0%) | 5 (0.3%) |
| 2 or 3 Rooms | 115 (4.5%) | 299 (20.3%) |
| 4 or 5 Rooms | 1,790 (70.5%) | 889 (60.4%) |
| 6 or 7 Rooms | 587 (23.1%) | 256 (17.4%) |
| 8 or more Rooms | 48 (1.9%) | 22 (1.5%) |
| Total | 2,540 (100.0%) | 1,471 (100.0%) |
Housing Structure by Heating Type in Coamo
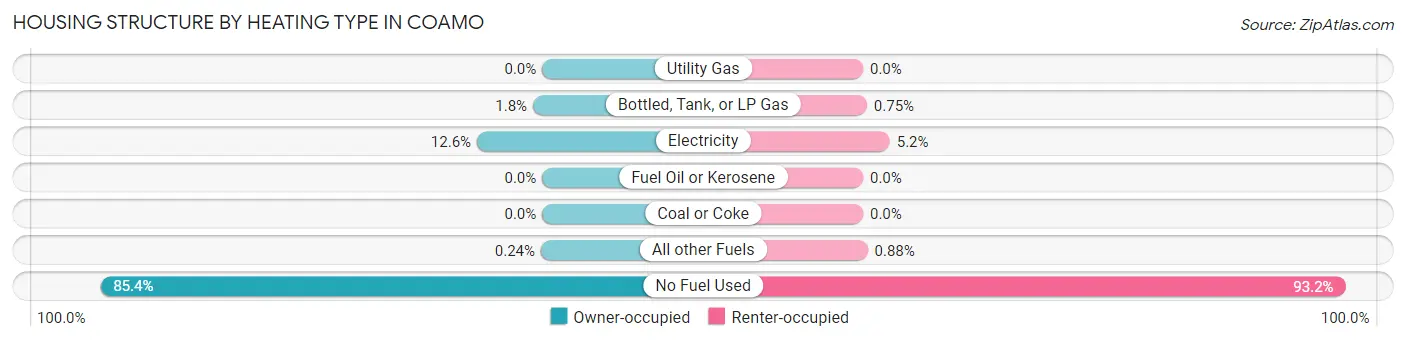
| Heating Type | Owner-occupied | Renter-occupied |
| Utility Gas | 0 (0.0%) | 0 (0.0%) |
| Bottled, Tank, or LP Gas | 45 (1.8%) | 11 (0.7%) |
| Electricity | 320 (12.6%) | 76 (5.2%) |
| Fuel Oil or Kerosene | 0 (0.0%) | 0 (0.0%) |
| Coal or Coke | 0 (0.0%) | 0 (0.0%) |
| All other Fuels | 6 (0.2%) | 13 (0.9%) |
| No Fuel Used | 2,169 (85.4%) | 1,371 (93.2%) |
| Total | 2,540 (100.0%) | 1,471 (100.0%) |
Household Vehicle Usage in Coamo
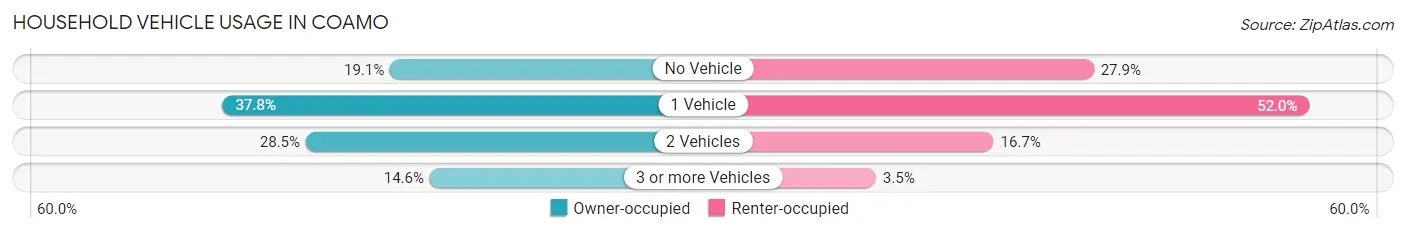
| Vehicles per Household | Owner-occupied | Renter-occupied |
| No Vehicle | 484 (19.1%) | 410 (27.9%) |
| 1 Vehicle | 961 (37.8%) | 765 (52.0%) |
| 2 Vehicles | 724 (28.5%) | 245 (16.7%) |
| 3 or more Vehicles | 371 (14.6%) | 51 (3.5%) |
| Total | 2,540 (100.0%) | 1,471 (100.0%) |
Real Estate & Mortgages in Coamo
Real Estate and Mortgage Overview in Coamo
| Characteristic | Without Mortgage | With Mortgage |
| Housing Units | 1,659 | 881 |
| Median Property Value | $83,200 | $99,600 |
| Median Household Income | $14,282 | $0 |
| Monthly Housing Costs | $156 | $0 |
| Real Estate Taxes | $656 | $851 |
Property Value by Mortgage Status in Coamo
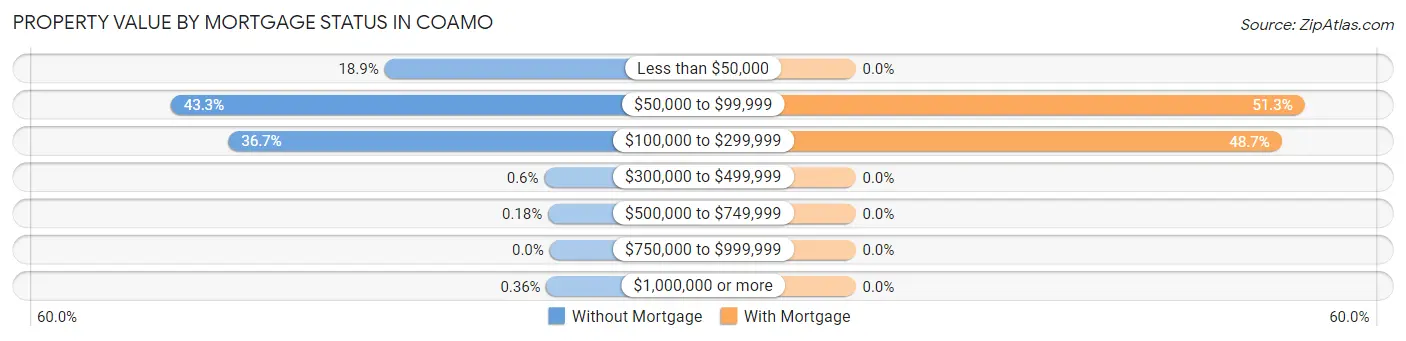
| Property Value | Without Mortgage | With Mortgage |
| Less than $50,000 | 313 (18.9%) | 0 (0.0%) |
| $50,000 to $99,999 | 718 (43.3%) | 452 (51.3%) |
| $100,000 to $299,999 | 609 (36.7%) | 429 (48.7%) |
| $300,000 to $499,999 | 10 (0.6%) | 0 (0.0%) |
| $500,000 to $749,999 | 3 (0.2%) | 0 (0.0%) |
| $750,000 to $999,999 | 0 (0.0%) | 0 (0.0%) |
| $1,000,000 or more | 6 (0.4%) | 0 (0.0%) |
| Total | 1,659 (100.0%) | 881 (100.0%) |
Household Income by Mortgage Status in Coamo
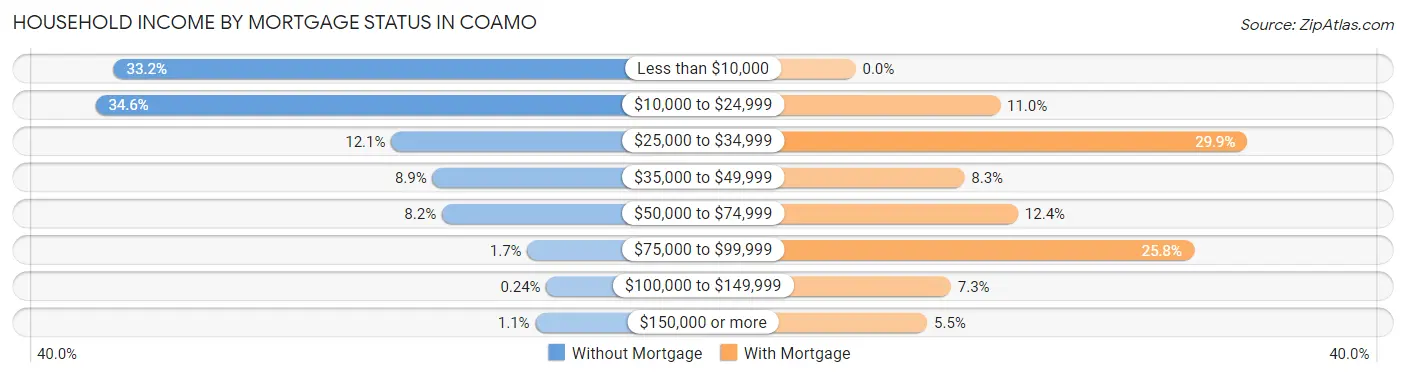
| Household Income | Without Mortgage | With Mortgage |
| Less than $10,000 | 551 (33.2%) | 0 (0.0%) |
| $10,000 to $24,999 | 574 (34.6%) | 97 (11.0%) |
| $25,000 to $34,999 | 200 (12.1%) | 263 (29.8%) |
| $35,000 to $49,999 | 148 (8.9%) | 73 (8.3%) |
| $50,000 to $74,999 | 136 (8.2%) | 109 (12.4%) |
| $75,000 to $99,999 | 28 (1.7%) | 227 (25.8%) |
| $100,000 to $149,999 | 4 (0.2%) | 64 (7.3%) |
| $150,000 or more | 18 (1.1%) | 48 (5.4%) |
| Total | 1,659 (100.0%) | 881 (100.0%) |
Property Value to Household Income Ratio in Coamo
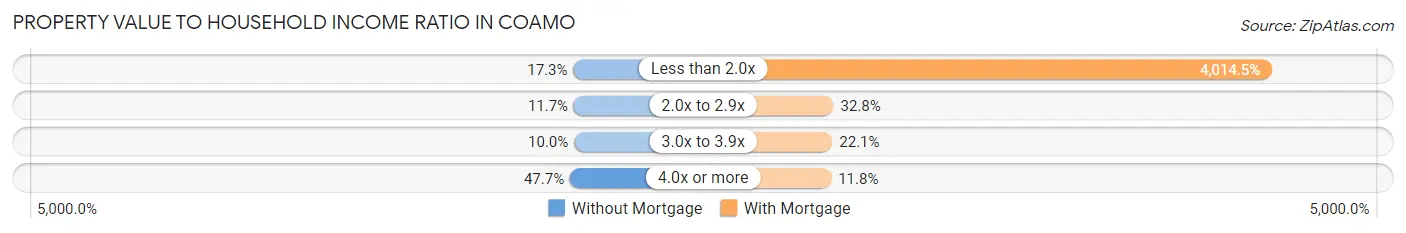
| Value-to-Income Ratio | Without Mortgage | With Mortgage |
| Less than 2.0x | 287 (17.3%) | 35,368 (4,014.5%) |
| 2.0x to 2.9x | 194 (11.7%) | 289 (32.8%) |
| 3.0x to 3.9x | 165 (10.0%) | 195 (22.1%) |
| 4.0x or more | 791 (47.7%) | 104 (11.8%) |
| Total | 1,659 (100.0%) | 881 (100.0%) |
Real Estate Taxes by Mortgage Status in Coamo
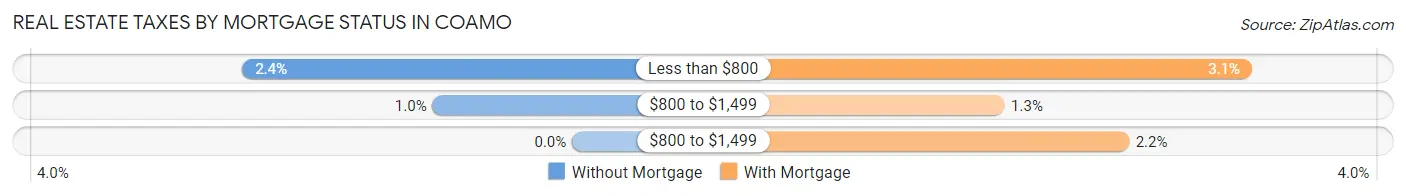
| Property Taxes | Without Mortgage | With Mortgage |
| Less than $800 | 40 (2.4%) | 27 (3.1%) |
| $800 to $1,499 | 17 (1.0%) | 11 (1.3%) |
| $800 to $1,499 | 0 (0.0%) | 19 (2.2%) |
| Total | 1,659 (100.0%) | 881 (100.0%) |
Health & Disability in Coamo
Health Insurance Coverage by Age in Coamo
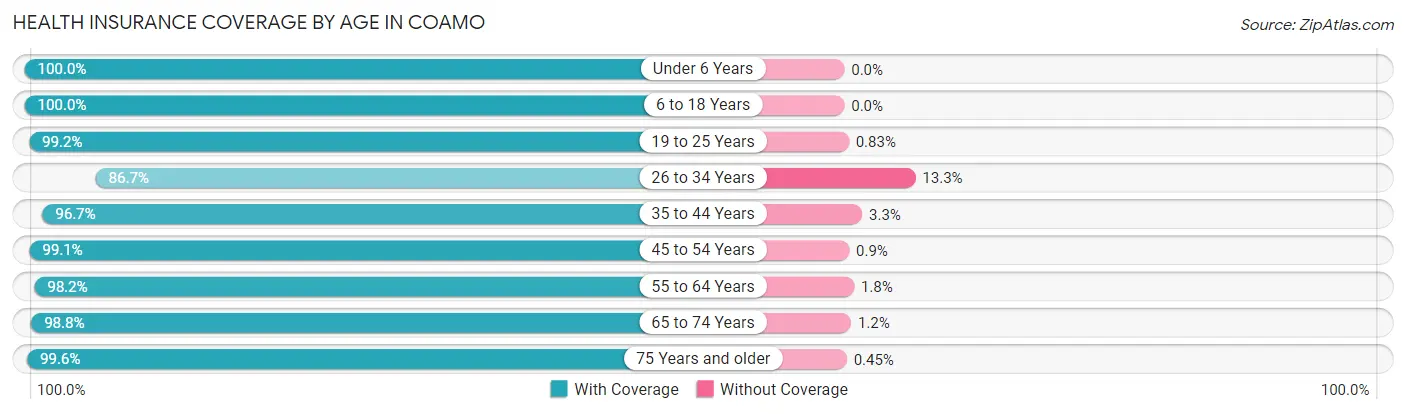
| Age Bracket | With Coverage | Without Coverage |
| Under 6 Years | 470 (100.0%) | 0 (0.0%) |
| 6 to 18 Years | 1,124 (100.0%) | 0 (0.0%) |
| 19 to 25 Years | 836 (99.2%) | 7 (0.8%) |
| 26 to 34 Years | 772 (86.7%) | 118 (13.3%) |
| 35 to 44 Years | 960 (96.7%) | 33 (3.3%) |
| 45 to 54 Years | 1,874 (99.1%) | 17 (0.9%) |
| 55 to 64 Years | 1,464 (98.2%) | 27 (1.8%) |
| 65 to 74 Years | 1,194 (98.8%) | 15 (1.2%) |
| 75 Years and older | 884 (99.6%) | 4 (0.4%) |
| Total | 9,578 (97.7%) | 221 (2.3%) |
Health Insurance Coverage by Citizenship Status in Coamo
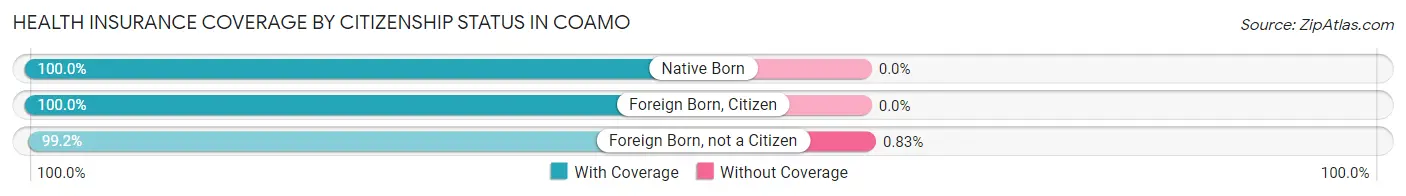
| Citizenship Status | With Coverage | Without Coverage |
| Native Born | 470 (100.0%) | 0 (0.0%) |
| Foreign Born, Citizen | 1,124 (100.0%) | 0 (0.0%) |
| Foreign Born, not a Citizen | 836 (99.2%) | 7 (0.8%) |
Health Insurance Coverage by Household Income in Coamo
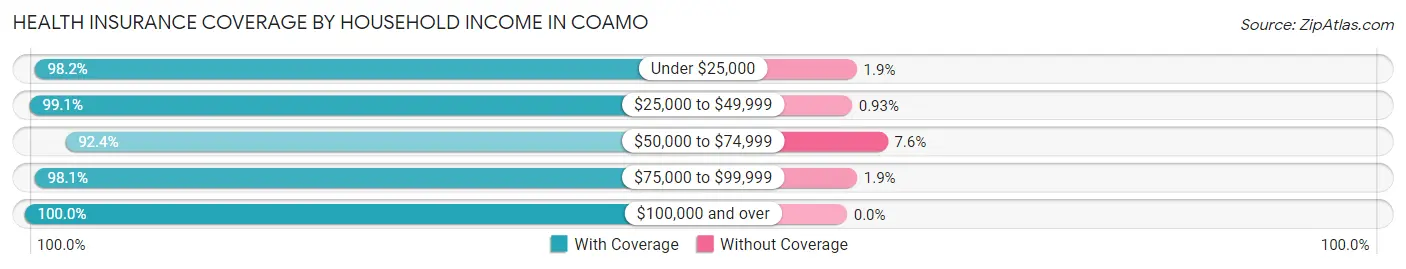
| Household Income | With Coverage | Without Coverage |
| Under $25,000 | 5,472 (98.2%) | 103 (1.8%) |
| $25,000 to $49,999 | 2,233 (99.1%) | 21 (0.9%) |
| $50,000 to $74,999 | 1,043 (92.4%) | 86 (7.6%) |
| $75,000 to $99,999 | 470 (98.1%) | 9 (1.9%) |
| $100,000 and over | 314 (100.0%) | 0 (0.0%) |
Public vs Private Health Insurance Coverage by Age in Coamo
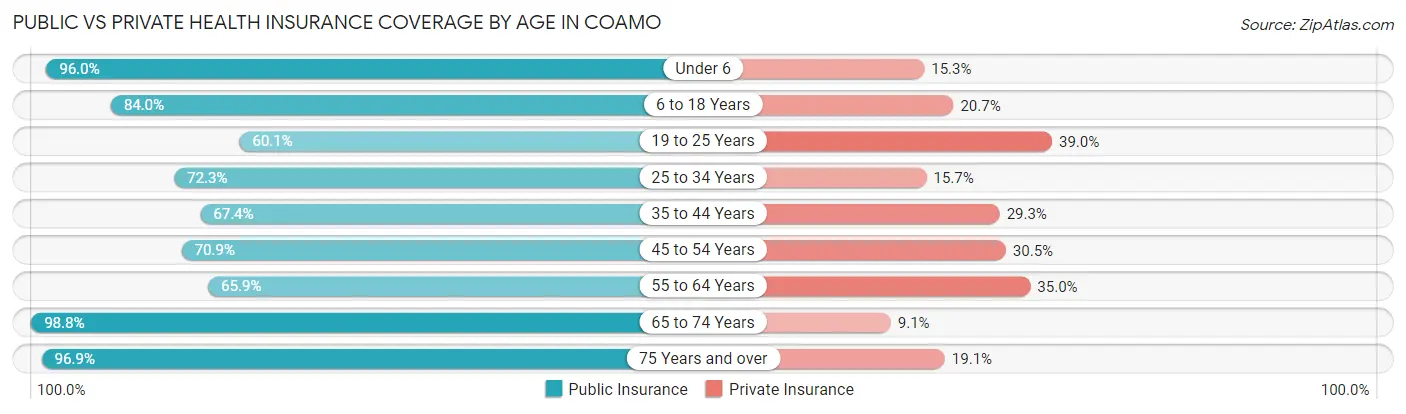
| Age Bracket | Public Insurance | Private Insurance |
| Under 6 | 451 (96.0%) | 72 (15.3%) |
| 6 to 18 Years | 944 (84.0%) | 233 (20.7%) |
| 19 to 25 Years | 507 (60.1%) | 329 (39.0%) |
| 25 to 34 Years | 643 (72.3%) | 140 (15.7%) |
| 35 to 44 Years | 669 (67.4%) | 291 (29.3%) |
| 45 to 54 Years | 1,340 (70.9%) | 576 (30.5%) |
| 55 to 64 Years | 983 (65.9%) | 522 (35.0%) |
| 65 to 74 Years | 1,194 (98.8%) | 110 (9.1%) |
| 75 Years and over | 860 (96.9%) | 170 (19.1%) |
| Total | 7,591 (77.5%) | 2,443 (24.9%) |
Disability Status by Sex by Age in Coamo
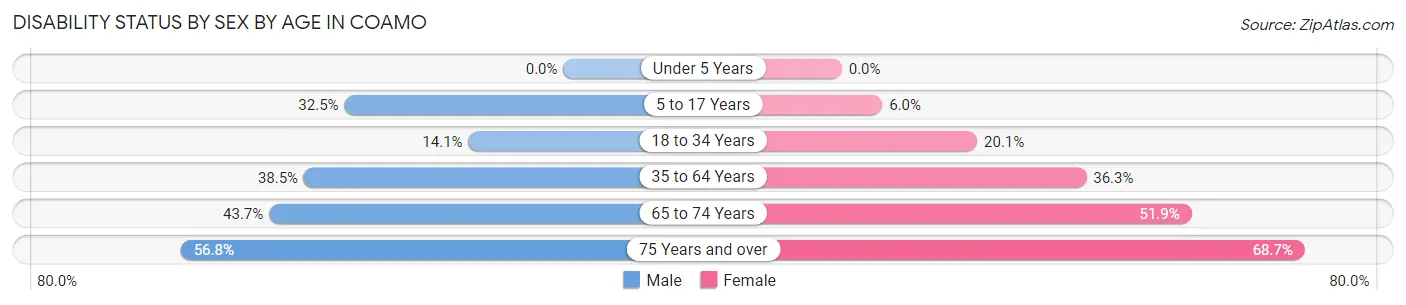
| Age Bracket | Male | Female |
| Under 5 Years | 0 (0.0%) | 0 (0.0%) |
| 5 to 17 Years | 184 (32.5%) | 30 (6.0%) |
| 18 to 34 Years | 127 (14.1%) | 185 (20.1%) |
| 35 to 64 Years | 827 (38.5%) | 809 (36.3%) |
| 65 to 74 Years | 291 (43.7%) | 282 (51.9%) |
| 75 Years and over | 221 (56.8%) | 343 (68.7%) |
Disability Class by Sex by Age in Coamo
Disability Class: Hearing Difficulty
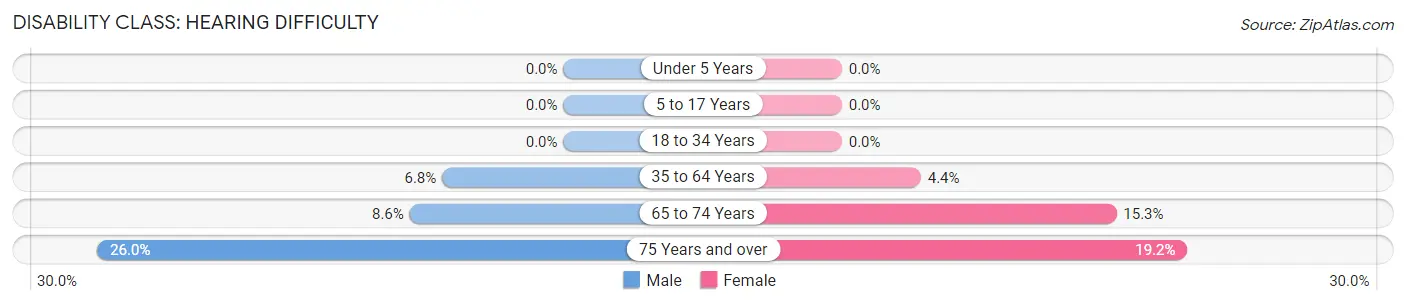
| Age Bracket | Male | Female |
| Under 5 Years | 0 (0.0%) | 0 (0.0%) |
| 5 to 17 Years | 0 (0.0%) | 0 (0.0%) |
| 18 to 34 Years | 0 (0.0%) | 0 (0.0%) |
| 35 to 64 Years | 145 (6.8%) | 98 (4.4%) |
| 65 to 74 Years | 57 (8.6%) | 83 (15.3%) |
| 75 Years and over | 101 (26.0%) | 96 (19.2%) |
Disability Class: Vision Difficulty
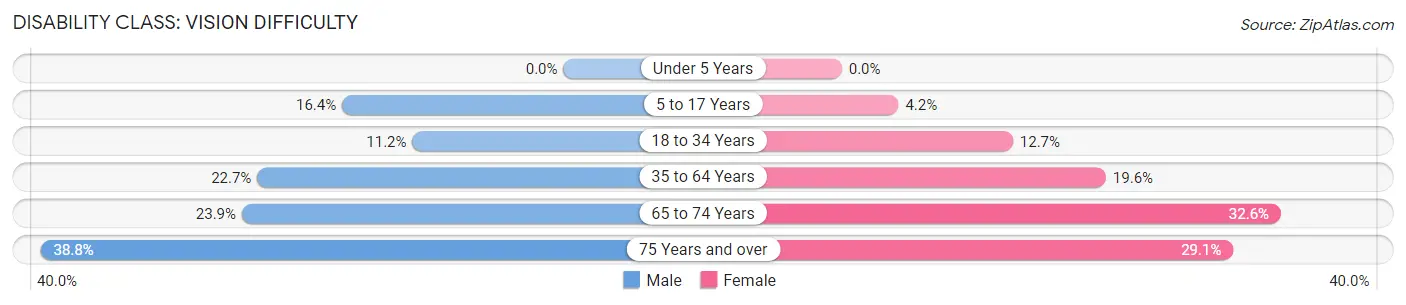
| Age Bracket | Male | Female |
| Under 5 Years | 0 (0.0%) | 0 (0.0%) |
| 5 to 17 Years | 93 (16.4%) | 21 (4.2%) |
| 18 to 34 Years | 101 (11.2%) | 117 (12.7%) |
| 35 to 64 Years | 488 (22.7%) | 437 (19.6%) |
| 65 to 74 Years | 159 (23.9%) | 177 (32.6%) |
| 75 Years and over | 151 (38.8%) | 145 (29.1%) |
Disability Class: Cognitive Difficulty
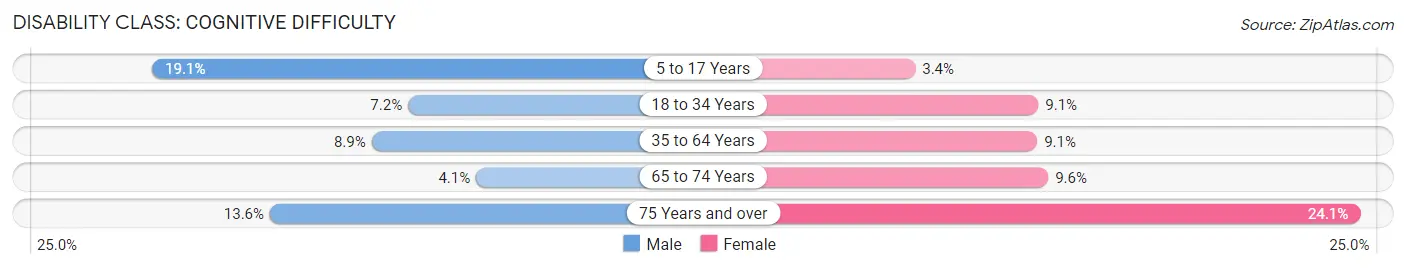
| Age Bracket | Male | Female |
| 5 to 17 Years | 108 (19.1%) | 17 (3.4%) |
| 18 to 34 Years | 65 (7.2%) | 84 (9.1%) |
| 35 to 64 Years | 191 (8.9%) | 202 (9.1%) |
| 65 to 74 Years | 27 (4.1%) | 52 (9.6%) |
| 75 Years and over | 53 (13.6%) | 120 (24.0%) |
Disability Class: Ambulatory Difficulty
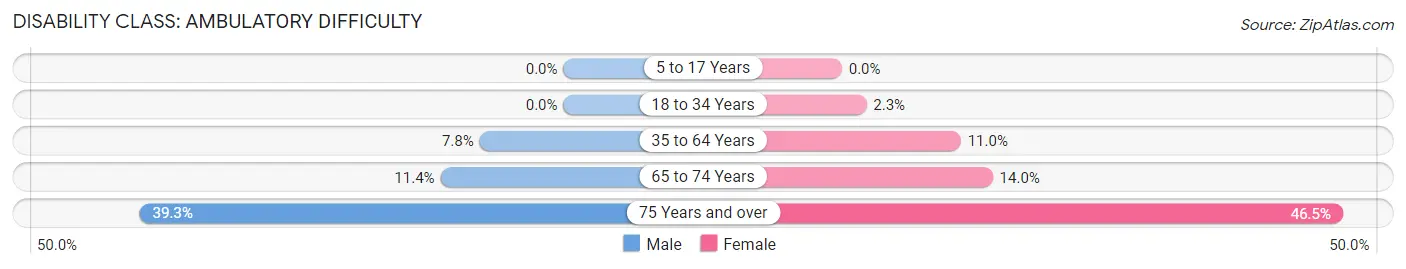
| Age Bracket | Male | Female |
| 5 to 17 Years | 0 (0.0%) | 0 (0.0%) |
| 18 to 34 Years | 0 (0.0%) | 21 (2.3%) |
| 35 to 64 Years | 167 (7.8%) | 246 (11.0%) |
| 65 to 74 Years | 76 (11.4%) | 76 (14.0%) |
| 75 Years and over | 153 (39.3%) | 232 (46.5%) |
Disability Class: Self-Care Difficulty
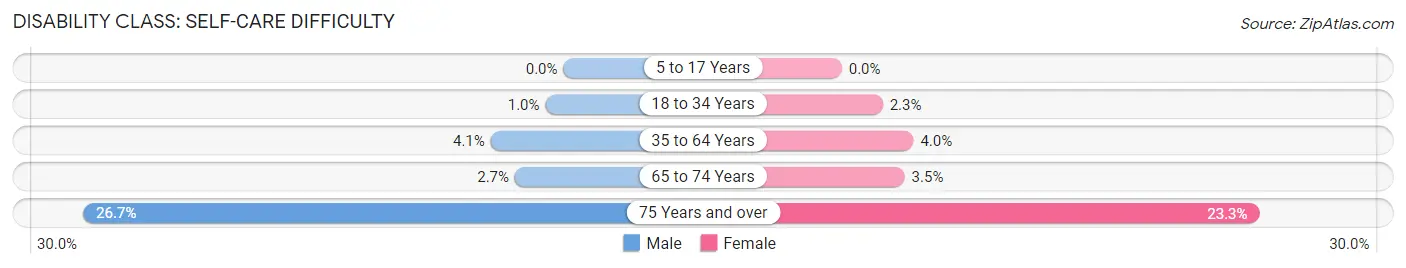
| Age Bracket | Male | Female |
| 5 to 17 Years | 0 (0.0%) | 0 (0.0%) |
| 18 to 34 Years | 9 (1.0%) | 21 (2.3%) |
| 35 to 64 Years | 87 (4.1%) | 89 (4.0%) |
| 65 to 74 Years | 18 (2.7%) | 19 (3.5%) |
| 75 Years and over | 104 (26.7%) | 116 (23.3%) |
Technology Access in Coamo
Computing Device Access in Coamo
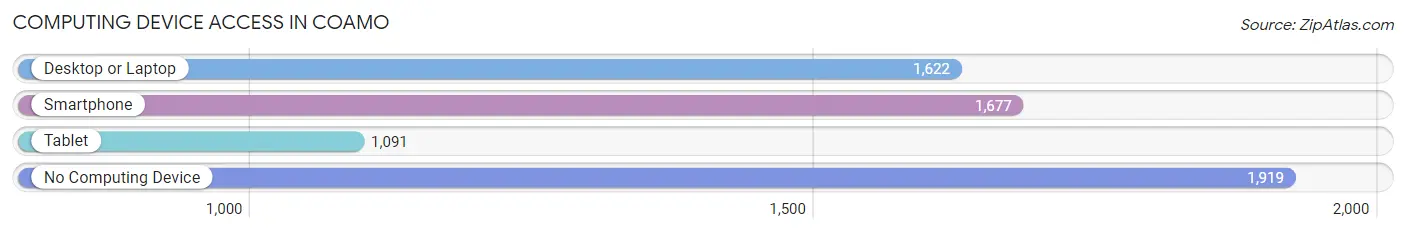
| Device Type | # Households | % Households |
| Desktop or Laptop | 1,622 | 40.4% |
| Smartphone | 1,677 | 41.8% |
| Tablet | 1,091 | 27.2% |
| No Computing Device | 1,919 | 47.8% |
| Total | 4,011 | 100.0% |
Internet Access in Coamo
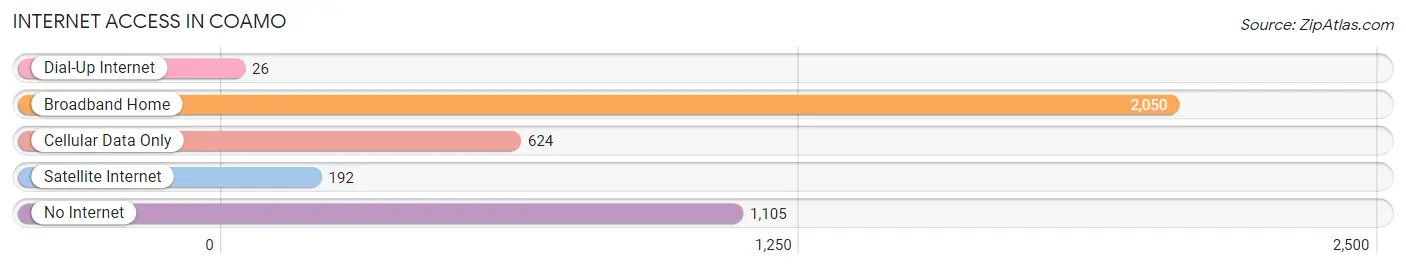
| Internet Type | # Households | % Households |
| Dial-Up Internet | 26 | 0.6% |
| Broadband Home | 2,050 | 51.1% |
| Cellular Data Only | 624 | 15.6% |
| Satellite Internet | 192 | 4.8% |
| No Internet | 1,105 | 27.6% |
| Total | 4,011 | 100.0% |
Coamo Summary
Coamo is a municipality located in the south-central region of Puerto Rico. It is part of the Ponce Metropolitan Statistical Area. The town is known for its hot springs, which have been used for therapeutic purposes since the 16th century.
Geography
Coamo is located in the southern coastal plain region of Puerto Rico, about 20 miles south of the capital city of San Juan. The municipality is bordered by the municipalities of Santa Isabel to the north, Juana Diaz to the east, and Orocovis to the west. The municipality covers an area of approximately 75 square miles and is located at an elevation of approximately 500 feet above sea level.
The terrain of Coamo is mostly flat, with some rolling hills in the northern part of the municipality. The climate is tropical, with temperatures ranging from the mid-70s to the mid-80s Fahrenheit. The average annual precipitation is approximately 50 inches.
Economy
The economy of Coamo is largely based on agriculture and tourism. The municipality is home to several large farms, which produce a variety of crops, including sugar cane, coffee, and tobacco. The town is also home to several small-scale manufacturing operations, which produce a variety of products, including furniture, clothing, and electronics.
Tourism is an important part of the local economy, with visitors coming to the area to enjoy the hot springs, as well as the nearby beaches and other attractions. The municipality is home to several hotels and resorts, as well as a variety of restaurants and bars.
Demographics
As of the 2010 census, Coamo had a population of approximately 33,000 people. The population is largely of Puerto Rican descent, with a small percentage of African and European ancestry. The median household income is approximately $20,000, and the unemployment rate is approximately 10%.
The majority of the population is Roman Catholic, with a small percentage of other religious affiliations. Spanish is the primary language spoken in Coamo, although English is also spoken by a small percentage of the population.
Conclusion
Coamo is a municipality located in the south-central region of Puerto Rico. It is known for its hot springs, which have been used for therapeutic purposes since the 16th century. The economy of Coamo is largely based on agriculture and tourism, and the population is largely of Puerto Rican descent. The town is home to several large farms, as well as a variety of small-scale manufacturing operations and hotels and resorts. Spanish is the primary language spoken in Coamo, although English is also spoken by a small percentage of the population.
Common Questions
What is Per Capita Income in Coamo?
Per Capita income in Coamo is $11,581.
What is the Median Family Income in Coamo?
Median Family Income in Coamo is $21,007.
What is the Median Household income in Coamo?
Median Household Income in Coamo is $15,128.
What is Income or Wage Gap in Coamo?
Income or Wage Gap in Coamo is 16.4%.
Women in Coamo earn 83.6 cents for every dollar earned by a man.
What is Family Income Deficit in Coamo?
Family Income Deficit in Coamo is $12,444.
Families that are below poverty line in Coamo earn $12,444 less on average than the poverty threshold level.
What is Inequality or Gini Index in Coamo?
Inequality or Gini Index in Coamo is 0.56.
What is the Total Population of Coamo?
Total Population of Coamo is 9,806.
What is the Total Male Population of Coamo?
Total Male Population of Coamo is 4,953.
What is the Total Female Population of Coamo?
Total Female Population of Coamo is 4,853.
What is the Ratio of Males per 100 Females in Coamo?
There are 102.06 Males per 100 Females in Coamo.
What is the Ratio of Females per 100 Males in Coamo?
There are 97.98 Females per 100 Males in Coamo.
What is the Median Population Age in Coamo?
Median Population Age in Coamo is 48.5 Years.
What is the Average Family Size in Coamo
Average Family Size in Coamo is 3.2 People.
What is the Average Household Size in Coamo
Average Household Size in Coamo is 2.4 People.
How Large is the Labor Force in Coamo?
There are 3,156 People in the Labor Forcein in Coamo.
What is the Percentage of People in the Labor Force in Coamo?
37.5% of People are in the Labor Force in Coamo.
What is the Unemployment Rate in Coamo?
Unemployment Rate in Coamo is 7.2%.