Caguas, PR Map & Demographics
Caguas Map
Caguas Overview
$15,916
PER CAPITA INCOME
$31,427
AVG FAMILY INCOME
$25,934
AVG HOUSEHOLD INCOME
6.5%
WAGE / INCOME GAP [ % ]
93.5¢/ $1
WAGE / INCOME GAP [ $ ]
$11,236
FAMILY INCOME DEFICIT
0.49
INEQUALITY / GINI INDEX
73,713
TOTAL POPULATION
33,129
MALE POPULATION
40,584
FEMALE POPULATION
81.63
MALES / 100 FEMALES
122.50
FEMALES / 100 MALES
43.5
MEDIAN AGE
3.1
AVG FAMILY SIZE
2.4
AVG HOUSEHOLD SIZE
30,716
LABOR FORCE [ PEOPLE ]
48.6%
PERCENT IN LABOR FORCE
11.7%
UNEMPLOYMENT RATE
Income in Caguas
Income Overview in Caguas
Per Capita Income in Caguas is $15,916, while median incomes of families and households are $31,427 and $25,934 respectively.
| Characteristic | Number | Measure |
| Per Capita Income | 73,713 | $15,916 |
| Median Family Income | 18,258 | $31,427 |
| Mean Family Income | 18,258 | $41,337 |
| Median Household Income | 30,374 | $25,934 |
| Mean Household Income | 30,374 | $36,229 |
| Income Deficit | 18,258 | $11,236 |
| Wage / Income Gap (%) | 73,713 | 6.48% |
| Wage / Income Gap ($) | 73,713 | 93.52¢ per $1 |
| Gini / Inequality Index | 73,713 | 0.49 |
Earnings by Sex in Caguas
Average Earnings in Caguas are $19,298, $19,884 for men and $18,595 for women, a difference of 6.5%.
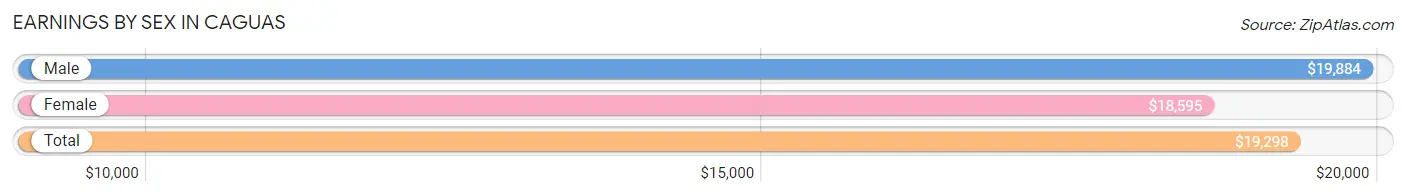
| Sex | Number | Average Earnings |
| Male | 14,897 (49.9%) | $19,884 |
| Female | 14,975 (50.1%) | $18,595 |
| Total | 29,872 (100.0%) | $19,298 |
Earnings by Sex by Income Bracket in Caguas
The most common earnings brackets in Caguas are $15,000 to $17,499 for men (1,336 | 9.0%) and $25,000 to $29,999 for women (1,190 | 8.0%).
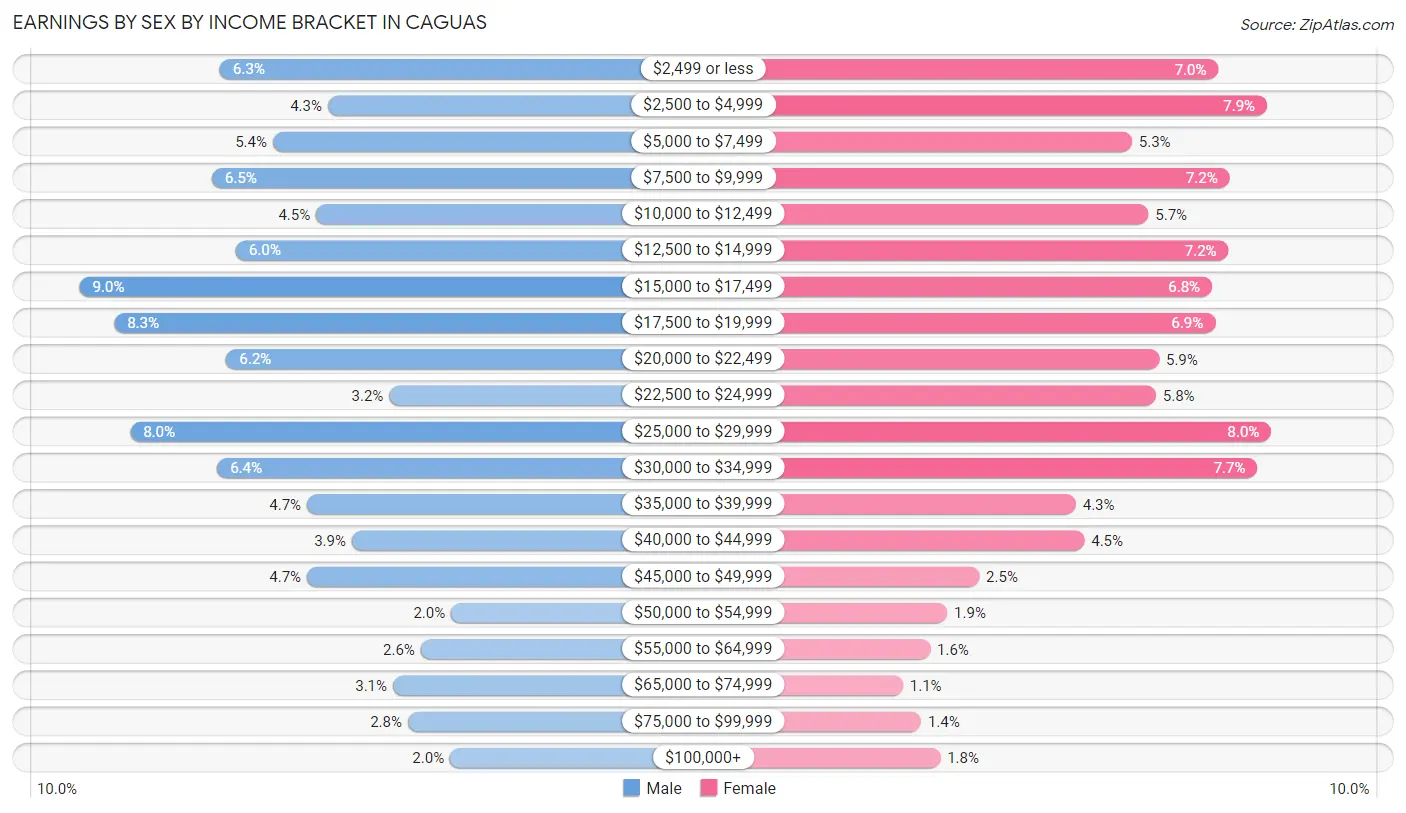
| Income | Male | Female |
| $2,499 or less | 945 (6.3%) | 1,043 (7.0%) |
| $2,500 to $4,999 | 644 (4.3%) | 1,178 (7.9%) |
| $5,000 to $7,499 | 797 (5.3%) | 800 (5.3%) |
| $7,500 to $9,999 | 967 (6.5%) | 1,073 (7.2%) |
| $10,000 to $12,499 | 677 (4.5%) | 846 (5.7%) |
| $12,500 to $14,999 | 900 (6.0%) | 1,070 (7.1%) |
| $15,000 to $17,499 | 1,336 (9.0%) | 1,025 (6.8%) |
| $17,500 to $19,999 | 1,240 (8.3%) | 1,033 (6.9%) |
| $20,000 to $22,499 | 927 (6.2%) | 876 (5.9%) |
| $22,500 to $24,999 | 472 (3.2%) | 867 (5.8%) |
| $25,000 to $29,999 | 1,194 (8.0%) | 1,190 (8.0%) |
| $30,000 to $34,999 | 952 (6.4%) | 1,152 (7.7%) |
| $35,000 to $39,999 | 701 (4.7%) | 642 (4.3%) |
| $40,000 to $44,999 | 577 (3.9%) | 666 (4.4%) |
| $45,000 to $49,999 | 701 (4.7%) | 372 (2.5%) |
| $50,000 to $54,999 | 299 (2.0%) | 282 (1.9%) |
| $55,000 to $64,999 | 384 (2.6%) | 233 (1.6%) |
| $65,000 to $74,999 | 462 (3.1%) | 157 (1.1%) |
| $75,000 to $99,999 | 420 (2.8%) | 208 (1.4%) |
| $100,000+ | 302 (2.0%) | 262 (1.8%) |
| Total | 14,897 (100.0%) | 14,975 (100.0%) |
Earnings by Sex by Educational Attainment in Caguas
Average earnings in Caguas are $21,725 for men and $20,644 for women, a difference of 5.0%. Men with an educational attainment of graduate degree enjoy the highest average annual earnings of $44,313, while those with high school diploma education earn the least with $17,211. Women with an educational attainment of graduate degree earn the most with the average annual earnings of $30,477, while those with high school diploma education have the smallest earnings of $14,307.
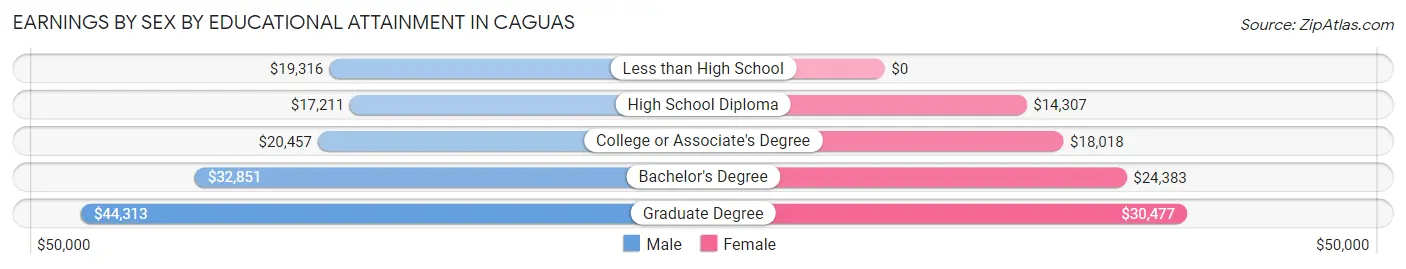
| Educational Attainment | Male Income | Female Income |
| Less than High School | $19,316 | $0 |
| High School Diploma | $17,211 | $14,307 |
| College or Associate's Degree | $20,457 | $18,018 |
| Bachelor's Degree | $32,851 | $24,383 |
| Graduate Degree | $44,313 | $30,477 |
| Total | $21,725 | $20,644 |
Family Income in Caguas
Family Income Brackets in Caguas
According to the Caguas family income data, there are 3,305 families falling into the less than $10,000 income range, which is the most common income bracket and makes up 18.1% of all families. Conversely, the $150,000 to $199,999 income bracket is the least frequent group with only 146 families (0.8%) belonging to this category.
| Income Bracket | # Families | % Families |
| Less than $10,000 | 3,305 | 18.1% |
| $10,000 to $14,999 | 1,442 | 7.9% |
| $15,000 to $24,999 | 2,830 | 15.5% |
| $25,000 to $34,999 | 2,538 | 13.9% |
| $35,000 to $49,999 | 2,720 | 14.9% |
| $50,000 to $74,999 | 2,885 | 15.8% |
| $75,000 to $99,999 | 1,296 | 7.1% |
| $100,000 to $149,999 | 876 | 4.8% |
| $150,000 to $199,999 | 146 | 0.8% |
| $200,000+ | 219 | 1.2% |
Family Income by Famaliy Size in Caguas
4-person families (2,609 | 14.3%) account for the highest median family income in Caguas with $42,541 per family, while 2-person families (9,247 | 50.6%) have the highest median income of $13,756 per family member.
| Income Bracket | # Families | Median Income |
| 2-Person Families | 9,247 (50.6%) | $27,513 |
| 3-Person Families | 5,523 (30.2%) | $33,312 |
| 4-Person Families | 2,609 (14.3%) | $42,541 |
| 5-Person Families | 702 (3.8%) | $37,200 |
| 6-Person Families | 112 (0.6%) | $0 |
| 7+ Person Families | 65 (0.4%) | $0 |
| Total | 18,258 (100.0%) | $31,427 |
Family Income by Number of Earners in Caguas
The median family income in Caguas is $31,427, with families comprising 3+ earners (1,056) having the highest median family income of $74,545, while families with no earners (5,813) have the lowest median family income of $20,035, accounting for 5.8% and 31.8% of families, respectively.
| Number of Earners | # Families | Median Income |
| No Earners | 5,813 (31.8%) | $20,035 |
| 1 Earner | 7,075 (38.8%) | $24,995 |
| 2 Earners | 4,314 (23.6%) | $53,941 |
| 3+ Earners | 1,056 (5.8%) | $74,545 |
| Total | 18,258 (100.0%) | $31,427 |
Household Income in Caguas
Household Income Brackets in Caguas
With 6,166 households falling in the category, the less than $10,000 income range is the most frequent in Caguas, accounting for 20.3% of all households. In contrast, only 243 households (0.8%) fall into the $150,000 to $199,999 income bracket, making it the least populous group.
| Income Bracket | # Households | % Households |
| Less than $10,000 | 6,166 | 20.3% |
| $10,000 to $14,999 | 3,615 | 11.9% |
| $15,000 to $24,999 | 5,072 | 16.7% |
| $25,000 to $34,999 | 4,313 | 14.2% |
| $35,000 to $49,999 | 3,949 | 13.0% |
| $50,000 to $74,999 | 4,070 | 13.4% |
| $75,000 to $99,999 | 1,671 | 5.5% |
| $100,000 to $149,999 | 1,033 | 3.4% |
| $150,000 to $199,999 | 243 | 0.8% |
| $200,000+ | 243 | 0.8% |
Household Income by Householder Age in Caguas
The median household income in Caguas is $25,934, with the highest median household income of $32,715 found in the 45 to 64 years age bracket for the primary householder. A total of 10,484 households (34.5%) fall into this category. Meanwhile, the 15 to 24 years age bracket for the primary householder has the lowest median household income of $15,102, with 564 households (1.9%) in this group.
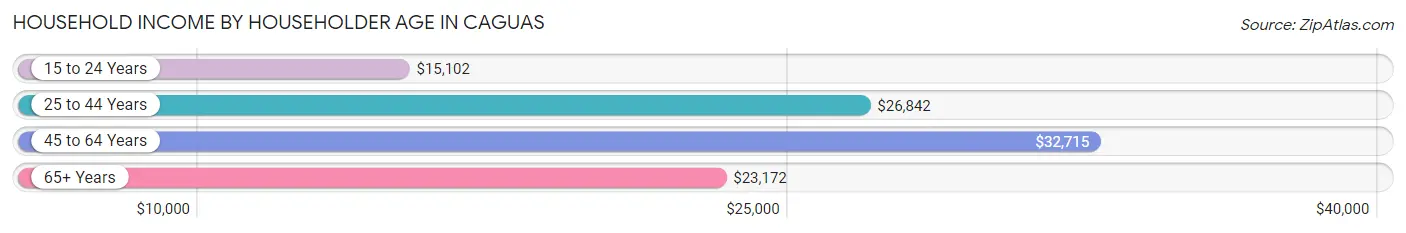
| Income Bracket | # Households | Median Income |
| 15 to 24 Years | 564 (1.9%) | $15,102 |
| 25 to 44 Years | 7,636 (25.1%) | $26,842 |
| 45 to 64 Years | 10,484 (34.5%) | $32,715 |
| 65+ Years | 11,690 (38.5%) | $23,172 |
| Total | 30,374 (100.0%) | $25,934 |
Poverty in Caguas
Income Below Poverty by Sex and Age in Caguas
With 37.7% poverty level for males and 42.5% for females among the residents of Caguas, 5 year old males and 6 to 11 year old females are the most vulnerable to poverty, with 322 males (73.0%) and 1,346 females (65.3%) in their respective age groups living below the poverty level.
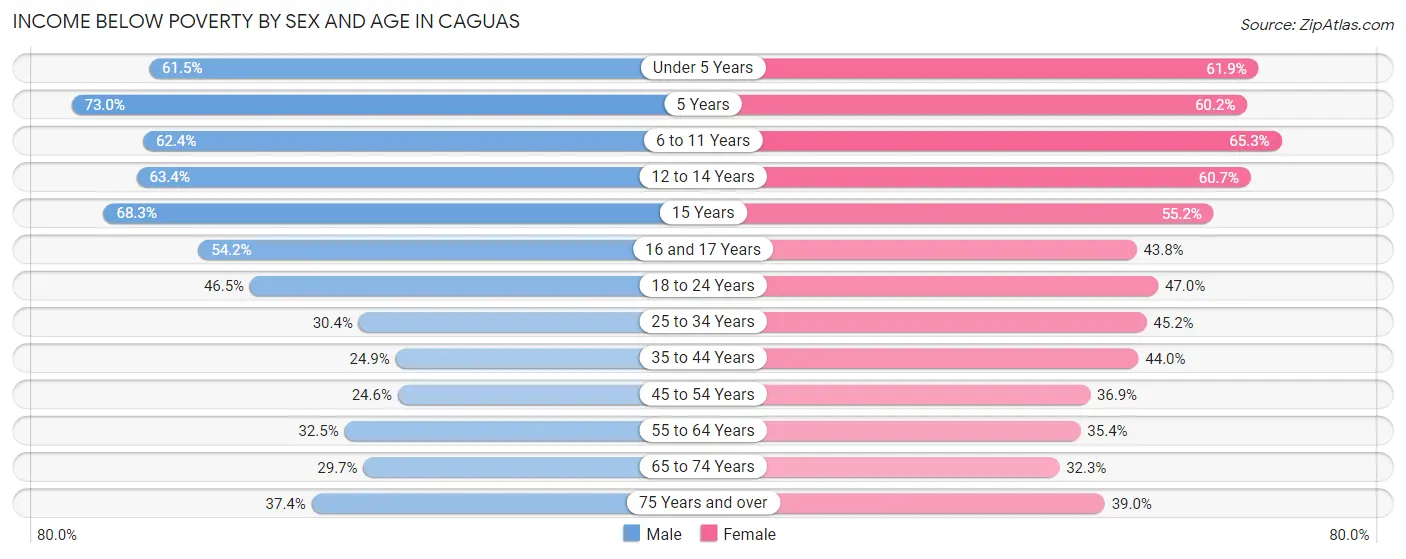
| Age Bracket | Male | Female |
| Under 5 Years | 772 (61.5%) | 677 (61.9%) |
| 5 Years | 322 (73.0%) | 183 (60.2%) |
| 6 to 11 Years | 1,388 (62.4%) | 1,346 (65.3%) |
| 12 to 14 Years | 824 (63.4%) | 552 (60.7%) |
| 15 Years | 213 (68.3%) | 254 (55.2%) |
| 16 and 17 Years | 471 (54.2%) | 322 (43.8%) |
| 18 to 24 Years | 1,649 (46.5%) | 1,635 (47.0%) |
| 25 to 34 Years | 1,422 (30.4%) | 2,471 (45.2%) |
| 35 to 44 Years | 1,024 (24.9%) | 2,080 (44.0%) |
| 45 to 54 Years | 1,089 (24.6%) | 1,847 (36.8%) |
| 55 to 64 Years | 1,216 (32.5%) | 1,780 (35.4%) |
| 65 to 74 Years | 912 (29.7%) | 1,640 (32.3%) |
| 75 Years and over | 1,142 (37.4%) | 2,295 (39.0%) |
| Total | 12,444 (37.7%) | 17,082 (42.5%) |
Income Above Poverty by Sex and Age in Caguas
According to the poverty statistics in Caguas, males aged 45 to 54 years and females aged 65 to 74 years are the age groups that are most secure financially, with 75.4% of males and 67.7% of females in these age groups living above the poverty line.
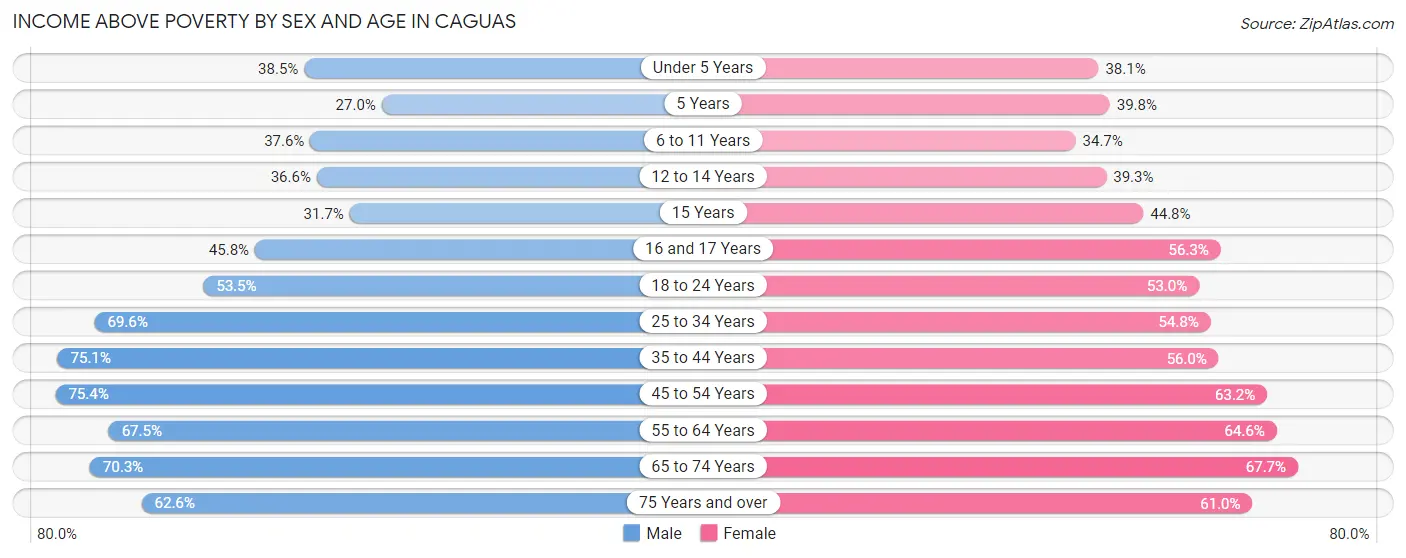
| Age Bracket | Male | Female |
| Under 5 Years | 483 (38.5%) | 417 (38.1%) |
| 5 Years | 119 (27.0%) | 121 (39.8%) |
| 6 to 11 Years | 836 (37.6%) | 716 (34.7%) |
| 12 to 14 Years | 476 (36.6%) | 357 (39.3%) |
| 15 Years | 99 (31.7%) | 206 (44.8%) |
| 16 and 17 Years | 398 (45.8%) | 414 (56.2%) |
| 18 to 24 Years | 1,894 (53.5%) | 1,847 (53.0%) |
| 25 to 34 Years | 3,259 (69.6%) | 2,992 (54.8%) |
| 35 to 44 Years | 3,086 (75.1%) | 2,643 (56.0%) |
| 45 to 54 Years | 3,340 (75.4%) | 3,165 (63.1%) |
| 55 to 64 Years | 2,526 (67.5%) | 3,244 (64.6%) |
| 65 to 74 Years | 2,159 (70.3%) | 3,441 (67.7%) |
| 75 Years and over | 1,913 (62.6%) | 3,584 (61.0%) |
| Total | 20,588 (62.3%) | 23,147 (57.5%) |
Income Below Poverty Among Married-Couple Families in Caguas
The poverty statistics for married-couple families in Caguas show that 22.7% or 1,970 of the total 8,677 families live below the poverty line. Families with 3 or 4 children have the highest poverty rate of 47.8%, comprising of 133 families. On the other hand, families with no children have the lowest poverty rate of 21.2%, which includes 1,387 families.
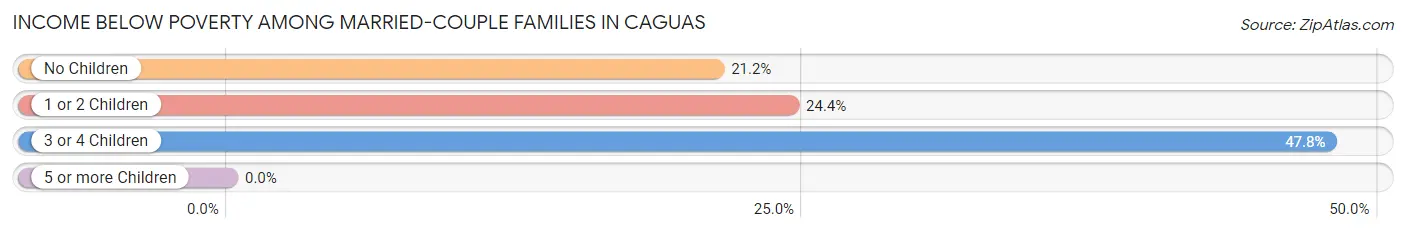
| Children | Above Poverty | Below Poverty |
| No Children | 5,169 (78.8%) | 1,387 (21.2%) |
| 1 or 2 Children | 1,393 (75.6%) | 450 (24.4%) |
| 3 or 4 Children | 145 (52.2%) | 133 (47.8%) |
| 5 or more Children | 0 (0.0%) | 0 (0.0%) |
| Total | 6,707 (77.3%) | 1,970 (22.7%) |
Income Below Poverty Among Single-Parent Households in Caguas
According to the poverty data in Caguas, 40.6% or 757 single-father households and 53.2% or 4,102 single-mother households are living below the poverty line. Among single-father households, those with 3 or 4 children have the highest poverty rate, with 67 households (91.8%) experiencing poverty. Likewise, among single-mother households, those with 3 or 4 children have the highest poverty rate, with 343 households (85.8%) falling below the poverty line.
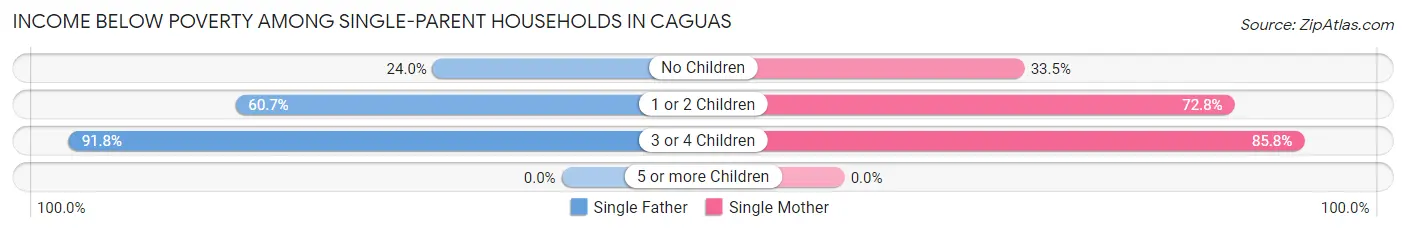
| Children | Single Father | Single Mother |
| No Children | 260 (24.0%) | 1,338 (33.5%) |
| 1 or 2 Children | 430 (60.7%) | 2,421 (72.8%) |
| 3 or 4 Children | 67 (91.8%) | 343 (85.8%) |
| 5 or more Children | 0 (0.0%) | 0 (0.0%) |
| Total | 757 (40.6%) | 4,102 (53.2%) |
Income Below Poverty Among Married-Couple vs Single-Parent Households in Caguas
The poverty data for Caguas shows that 1,970 of the married-couple family households (22.7%) and 4,859 of the single-parent households (50.7%) are living below the poverty level. Within the married-couple family households, those with 3 or 4 children have the highest poverty rate, with 133 households (47.8%) falling below the poverty line. Among the single-parent households, those with 3 or 4 children have the highest poverty rate, with 410 household (86.7%) living below poverty.
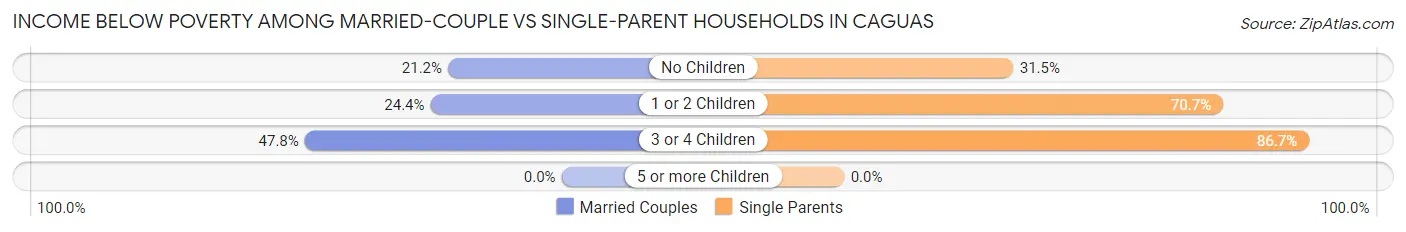
| Children | Married-Couple Families | Single-Parent Households |
| No Children | 1,387 (21.2%) | 1,598 (31.5%) |
| 1 or 2 Children | 450 (24.4%) | 2,851 (70.7%) |
| 3 or 4 Children | 133 (47.8%) | 410 (86.7%) |
| 5 or more Children | 0 (0.0%) | 0 (0.0%) |
| Total | 1,970 (22.7%) | 4,859 (50.7%) |
Race in Caguas
The most populous races in Caguas are Hispanic or Latino (72,206 | 98.0%), White / Caucasian (40,112 | 54.4%), and Some other Race (15,102 | 20.5%).
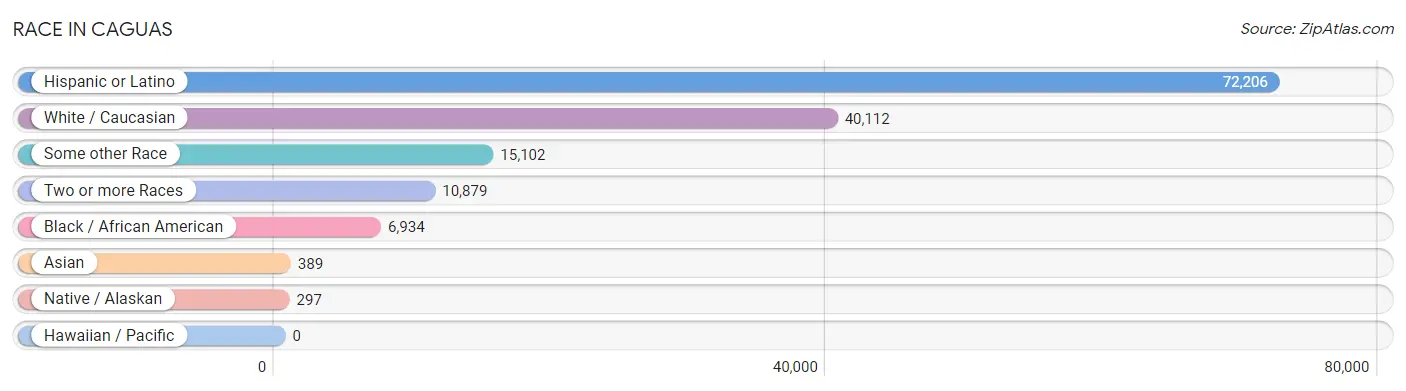
| Race | # Population | % Population |
| Asian | 389 | 0.5% |
| Black / African American | 6,934 | 9.4% |
| Hawaiian / Pacific | 0 | 0.0% |
| Hispanic or Latino | 72,206 | 98.0% |
| Native / Alaskan | 297 | 0.4% |
| White / Caucasian | 40,112 | 54.4% |
| Two or more Races | 10,879 | 14.8% |
| Some other Race | 15,102 | 20.5% |
| Total | 73,713 | 100.0% |
Ancestry in Caguas
The most populous ancestries reported in Caguas are Puerto Rican (69,933 | 94.9%), American (2,328 | 3.2%), Dominican (957 | 1.3%), Thai (492 | 0.7%), and Central American Indian (491 | 0.7%), together accounting for 100.7% of all Caguas residents.
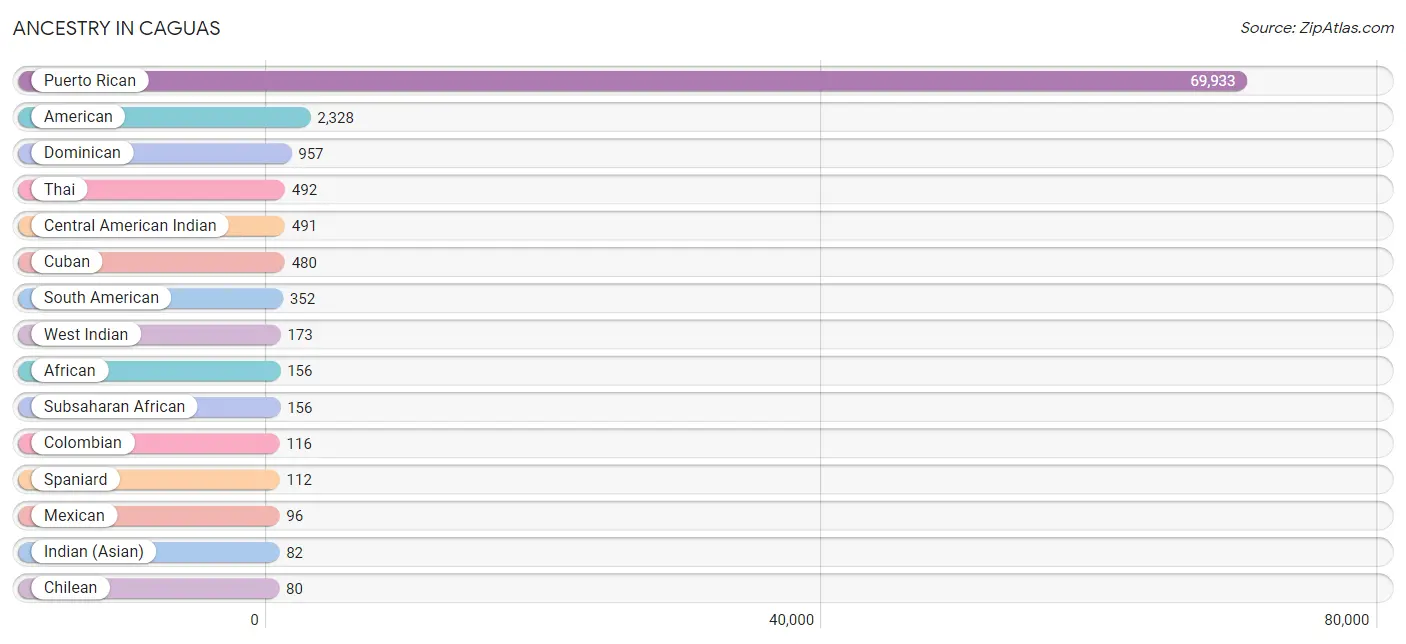
| Ancestry | # Population | % Population |
| African | 156 | 0.2% |
| American | 2,328 | 3.2% |
| Argentinean | 26 | 0.0% |
| British West Indian | 18 | 0.0% |
| Canadian | 9 | 0.0% |
| Central American | 34 | 0.1% |
| Central American Indian | 491 | 0.7% |
| Cherokee | 12 | 0.0% |
| Chilean | 80 | 0.1% |
| Colombian | 116 | 0.2% |
| Cuban | 480 | 0.6% |
| Dominican | 957 | 1.3% |
| Ecuadorian | 17 | 0.0% |
| English | 18 | 0.0% |
| Fijian | 10 | 0.0% |
| French | 14 | 0.0% |
| French Canadian | 14 | 0.0% |
| German | 31 | 0.0% |
| Guatemalan | 6 | 0.0% |
| Indian (Asian) | 82 | 0.1% |
| Irish | 10 | 0.0% |
| Italian | 39 | 0.1% |
| Laotian | 37 | 0.1% |
| Mexican | 96 | 0.1% |
| Panamanian | 27 | 0.0% |
| Peruvian | 42 | 0.1% |
| Portuguese | 19 | 0.0% |
| Puerto Rican | 69,933 | 94.9% |
| Salvadoran | 1 | 0.0% |
| South American | 352 | 0.5% |
| Spaniard | 112 | 0.2% |
| Subsaharan African | 156 | 0.2% |
| Thai | 492 | 0.7% |
| Ukrainian | 17 | 0.0% |
| Venezuelan | 71 | 0.1% |
| West Indian | 173 | 0.2% | View All 36 Rows |
Immigrants in Caguas

| Immigration Origin | # Population | % Population | View All 0 Rows |
Sex and Age in Caguas
Sex and Age in Caguas
The most populous age groups in Caguas are 20 to 24 Years (2,665 | 8.0%) for men and 25 to 29 Years (2,744 | 6.8%) for women.
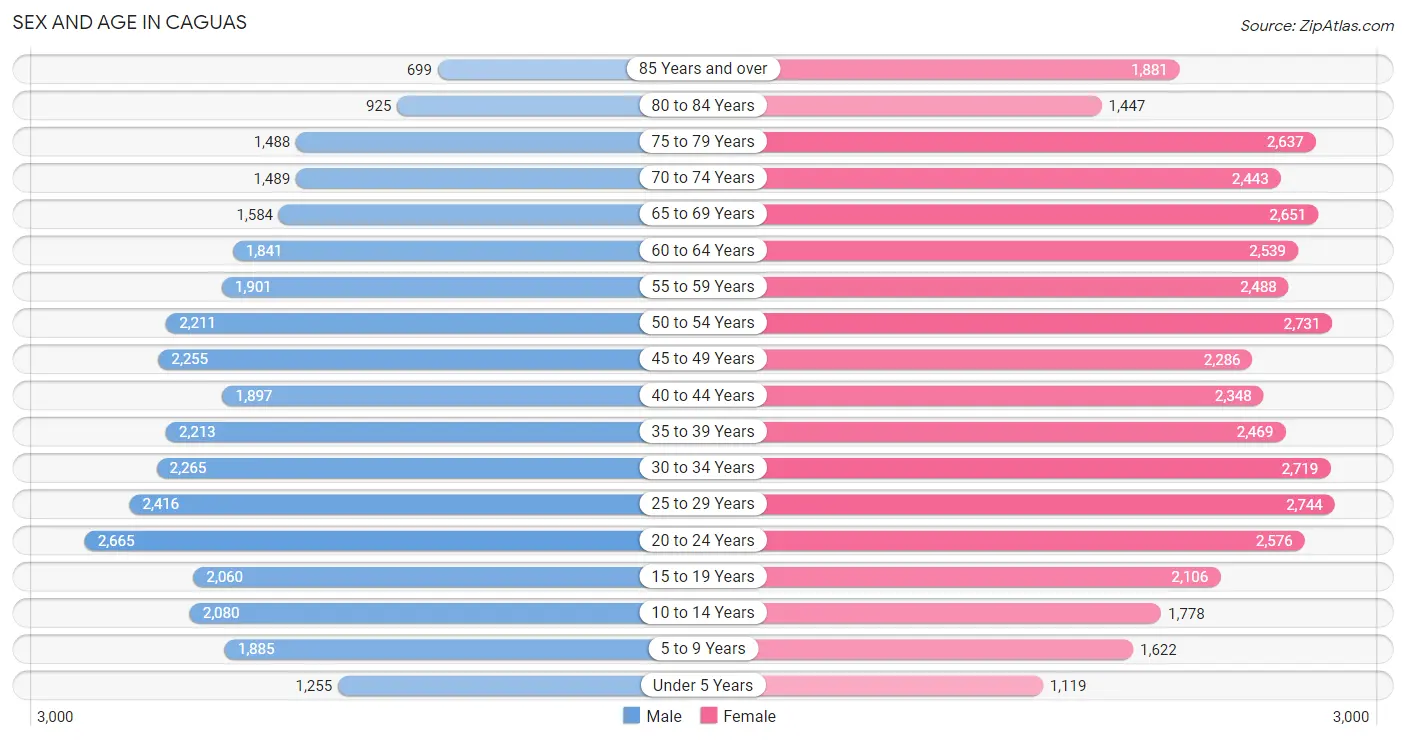
| Age Bracket | Male | Female |
| Under 5 Years | 1,255 (3.8%) | 1,119 (2.8%) |
| 5 to 9 Years | 1,885 (5.7%) | 1,622 (4.0%) |
| 10 to 14 Years | 2,080 (6.3%) | 1,778 (4.4%) |
| 15 to 19 Years | 2,060 (6.2%) | 2,106 (5.2%) |
| 20 to 24 Years | 2,665 (8.0%) | 2,576 (6.4%) |
| 25 to 29 Years | 2,416 (7.3%) | 2,744 (6.8%) |
| 30 to 34 Years | 2,265 (6.8%) | 2,719 (6.7%) |
| 35 to 39 Years | 2,213 (6.7%) | 2,469 (6.1%) |
| 40 to 44 Years | 1,897 (5.7%) | 2,348 (5.8%) |
| 45 to 49 Years | 2,255 (6.8%) | 2,286 (5.6%) |
| 50 to 54 Years | 2,211 (6.7%) | 2,731 (6.7%) |
| 55 to 59 Years | 1,901 (5.7%) | 2,488 (6.1%) |
| 60 to 64 Years | 1,841 (5.6%) | 2,539 (6.3%) |
| 65 to 69 Years | 1,584 (4.8%) | 2,651 (6.5%) |
| 70 to 74 Years | 1,489 (4.5%) | 2,443 (6.0%) |
| 75 to 79 Years | 1,488 (4.5%) | 2,637 (6.5%) |
| 80 to 84 Years | 925 (2.8%) | 1,447 (3.6%) |
| 85 Years and over | 699 (2.1%) | 1,881 (4.6%) |
| Total | 33,129 (100.0%) | 40,584 (100.0%) |
Families and Households in Caguas
Median Family Size in Caguas
The median family size in Caguas is 3.11 persons per family, with married-couple families (8,677 | 47.5%) accounting for the largest median family size of 3.14 persons per family. On the other hand, single male/father families (1,865 | 10.2%) represent the smallest median family size with 2.96 persons per family.
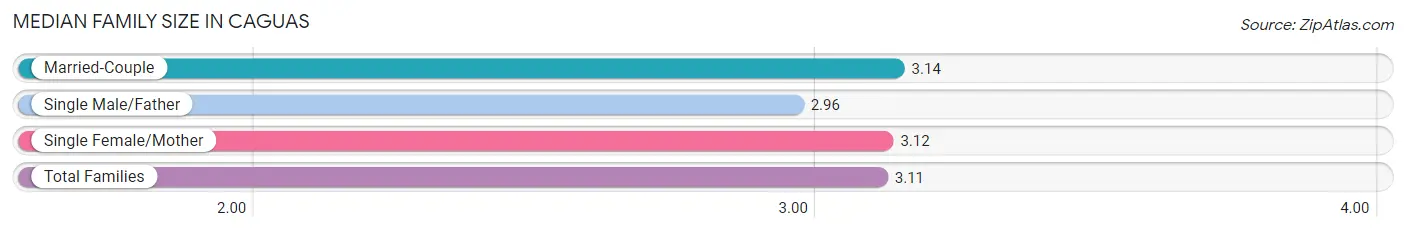
| Family Type | # Families | Family Size |
| Married-Couple | 8,677 (47.5%) | 3.14 |
| Single Male/Father | 1,865 (10.2%) | 2.96 |
| Single Female/Mother | 7,716 (42.3%) | 3.12 |
| Total Families | 18,258 (100.0%) | 3.11 |
Median Household Size in Caguas
The median household size in Caguas is 2.41 persons per household, with single male/father households (1,865 | 6.1%) accounting for the largest median household size of 3.35 persons per household. non-family households (12,116 | 39.9%) represent the smallest median household size with 1.20 persons per household.
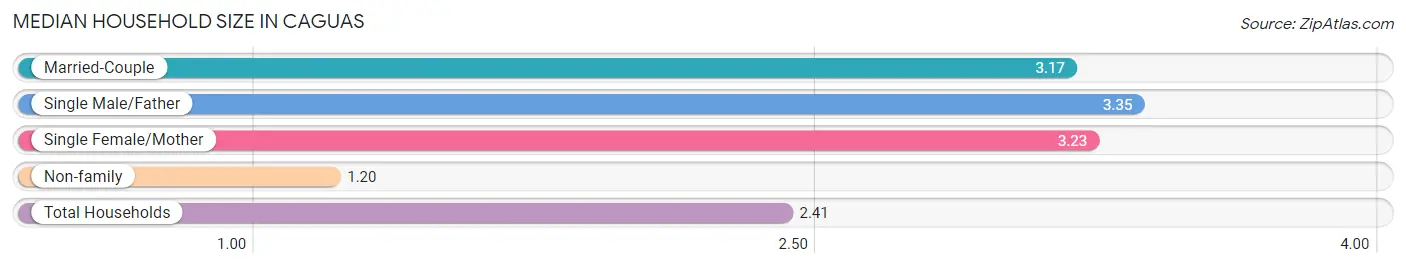
| Household Type | # Households | Household Size |
| Married-Couple | 8,677 (28.6%) | 3.17 |
| Single Male/Father | 1,865 (6.1%) | 3.35 |
| Single Female/Mother | 7,716 (25.4%) | 3.23 |
| Non-family | 12,116 (39.9%) | 1.20 |
| Total Households | 30,374 (100.0%) | 2.41 |
Household Size by Marriage Status in Caguas
Out of a total of 30,374 households in Caguas, 18,258 (60.1%) are family households, while 12,116 (39.9%) are nonfamily households. The most numerous type of family households are 2-person households, comprising 8,308, and the most common type of nonfamily households are 1-person households, comprising 10,180.
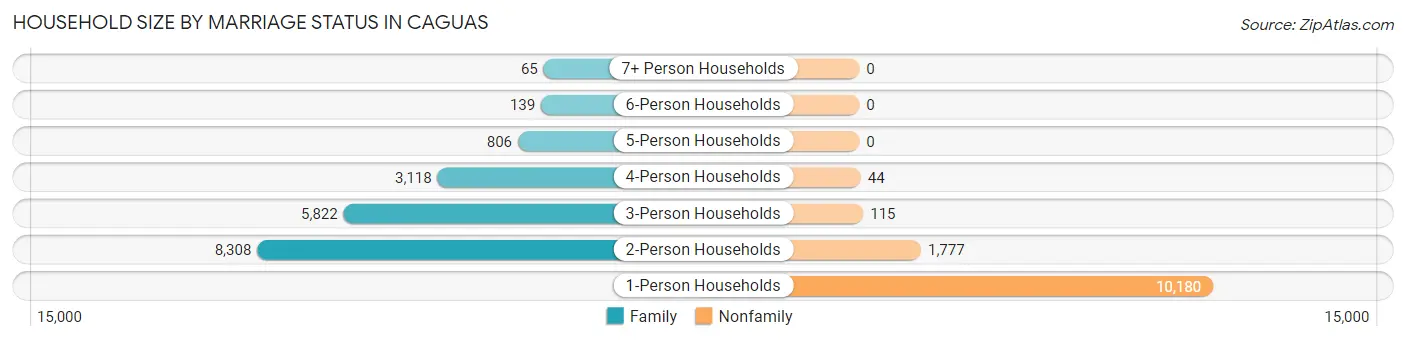
| Household Size | Family Households | Nonfamily Households |
| 1-Person Households | - | 10,180 (33.5%) |
| 2-Person Households | 8,308 (27.4%) | 1,777 (5.9%) |
| 3-Person Households | 5,822 (19.2%) | 115 (0.4%) |
| 4-Person Households | 3,118 (10.3%) | 44 (0.1%) |
| 5-Person Households | 806 (2.6%) | 0 (0.0%) |
| 6-Person Households | 139 (0.5%) | 0 (0.0%) |
| 7+ Person Households | 65 (0.2%) | 0 (0.0%) |
| Total | 18,258 (60.1%) | 12,116 (39.9%) |
Female Fertility in Caguas
Fertility by Age in Caguas
Average fertility rate in Caguas is 17.0 births per 1,000 women. Women in the age bracket of 20 to 34 years have the highest fertility rate with 30.0 births per 1,000 women. Women in the age bracket of 20 to 34 years acount for 82.5% of all women with births.
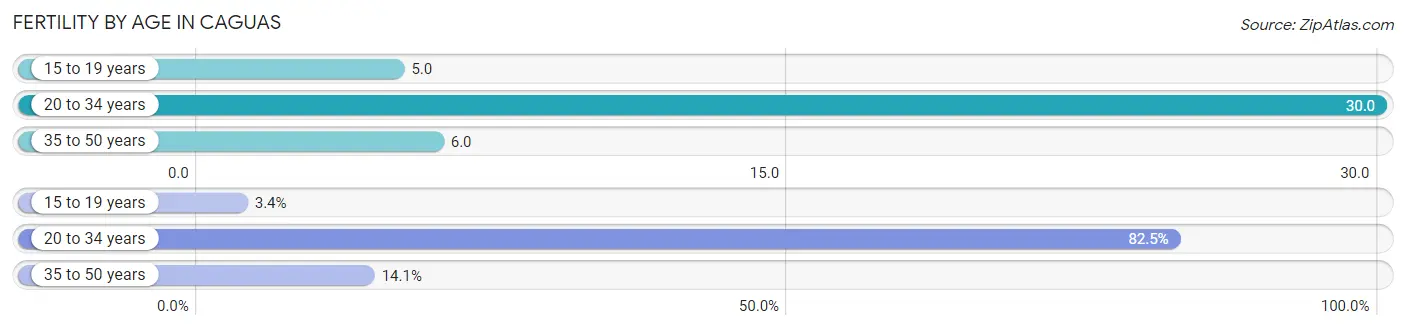
| Age Bracket | Women with Births | Births / 1,000 Women |
| 15 to 19 years | 10 (3.4%) | 5.0 |
| 20 to 34 years | 245 (82.5%) | 30.0 |
| 35 to 50 years | 42 (14.1%) | 6.0 |
| Total | 297 (100.0%) | 17.0 |
Fertility by Age by Marriage Status in Caguas
46.5% of women with births (297) in Caguas are married. The highest percentage of unmarried women with births falls into 15 to 19 years age bracket with 100.0% of them unmarried at the time of birth, while the lowest percentage of unmarried women with births belong to 20 to 34 years age bracket with 43.7% of them unmarried.
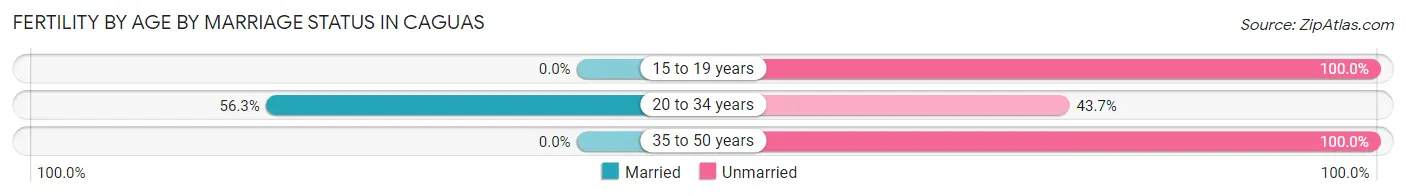
| Age Bracket | Married | Unmarried |
| 15 to 19 years | 0 (0.0%) | 10 (100.0%) |
| 20 to 34 years | 138 (56.3%) | 107 (43.7%) |
| 35 to 50 years | 0 (0.0%) | 42 (100.0%) |
| Total | 138 (46.5%) | 159 (53.5%) |
Fertility by Education in Caguas
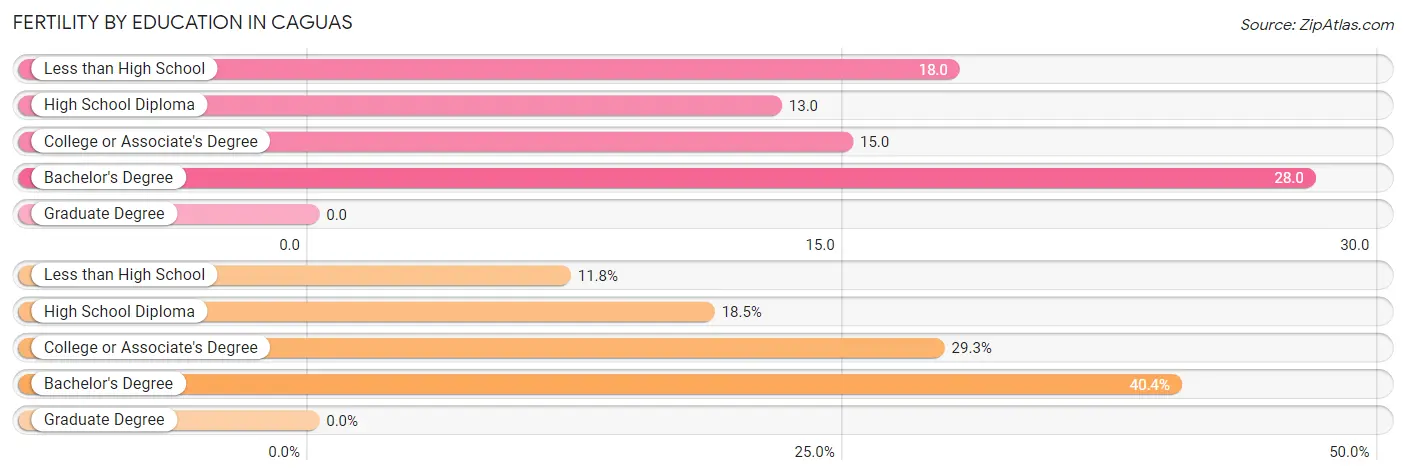
| Educational Attainment | Women with Births | Births / 1,000 Women |
| Less than High School | 35 (11.8%) | 18.0 |
| High School Diploma | 55 (18.5%) | 13.0 |
| College or Associate's Degree | 87 (29.3%) | 15.0 |
| Bachelor's Degree | 120 (40.4%) | 28.0 |
| Graduate Degree | 0 (0.0%) | 0.0 |
| Total | 297 (100.0%) | 17.0 |
Fertility by Education by Marriage Status in Caguas
53.5% of women with births in Caguas are unmarried. Women with the educational attainment of bachelor's degree are most likely to be married with 68.3% of them married at childbirth, while women with the educational attainment of less than high school are least likely to be married with 100.0% of them unmarried at childbirth.
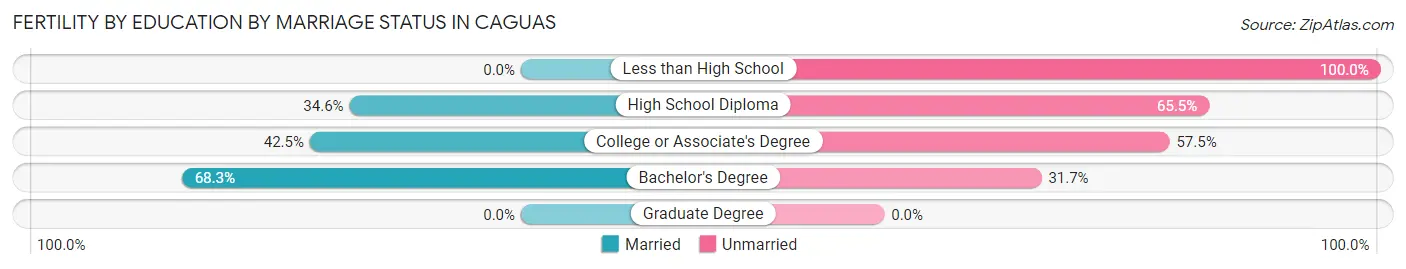
| Educational Attainment | Married | Unmarried |
| Less than High School | 0 (0.0%) | 35 (100.0%) |
| High School Diploma | 19 (34.5%) | 36 (65.4%) |
| College or Associate's Degree | 37 (42.5%) | 50 (57.5%) |
| Bachelor's Degree | 82 (68.3%) | 38 (31.7%) |
| Graduate Degree | 0 (0.0%) | 0 (0.0%) |
| Total | 138 (46.5%) | 159 (53.5%) |
Employment Characteristics in Caguas
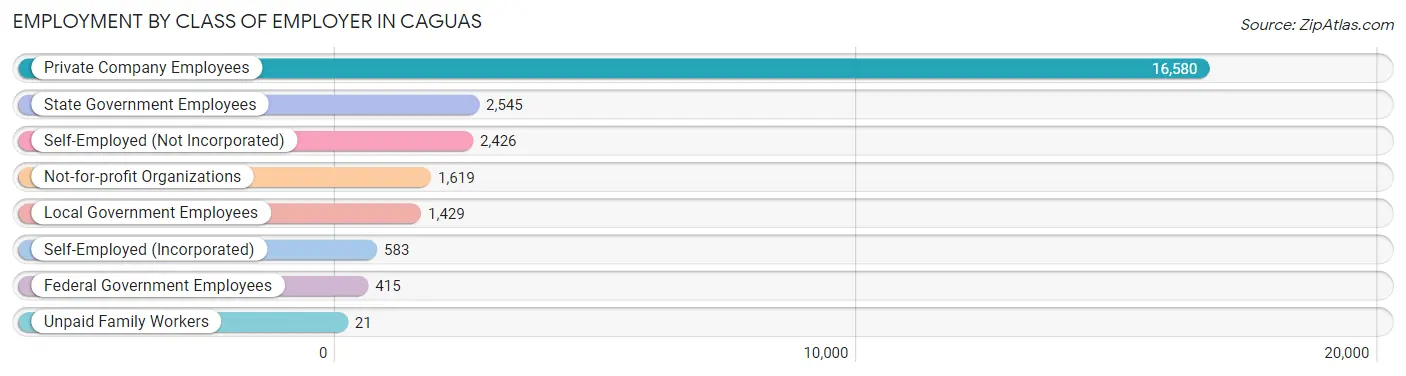
Employment by Class of Employer in Caguas
Among the 25,618 employed individuals in Caguas, private company employees (16,580 | 64.7%), state government employees (2,545 | 9.9%), and self-employed (not incorporated) (2,426 | 9.5%) make up the most common classes of employment.
| Employer Class | # Employees | % Employees |
| Private Company Employees | 16,580 | 64.7% |
| Self-Employed (Incorporated) | 583 | 2.3% |
| Self-Employed (Not Incorporated) | 2,426 | 9.5% |
| Not-for-profit Organizations | 1,619 | 6.3% |
| Local Government Employees | 1,429 | 5.6% |
| State Government Employees | 2,545 | 9.9% |
| Federal Government Employees | 415 | 1.6% |
| Unpaid Family Workers | 21 | 0.1% |
| Total | 25,618 | 100.0% |
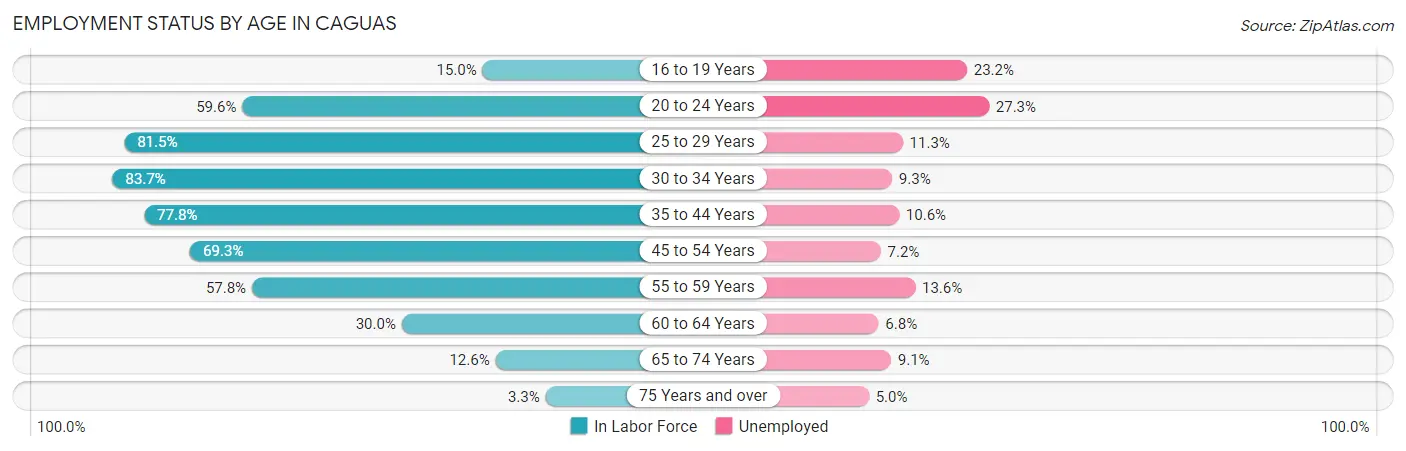
Employment Status by Age in Caguas
According to the labor force statistics for Caguas, out of the total population over 16 years of age (63,202), 48.6% or 30,716 individuals are in the labor force, with 11.7% or 3,594 of them unemployed. The age group with the highest labor force participation rate is 30 to 34 years, with 83.7% or 4,172 individuals in the labor force. Within the labor force, the 20 to 24 years age range has the highest percentage of unemployed individuals, with 27.3% or 853 of them being unemployed.
| Age Bracket | In Labor Force | Unemployed |
| 16 to 19 Years | 509 (15.0%) | 118 (23.2%) |
| 20 to 24 Years | 3,124 (59.6%) | 853 (27.3%) |
| 25 to 29 Years | 4,205 (81.5%) | 475 (11.3%) |
| 30 to 34 Years | 4,172 (83.7%) | 388 (9.3%) |
| 35 to 44 Years | 6,945 (77.8%) | 736 (10.6%) |
| 45 to 54 Years | 6,572 (69.3%) | 473 (7.2%) |
| 55 to 59 Years | 2,537 (57.8%) | 345 (13.6%) |
| 60 to 64 Years | 1,314 (30.0%) | 89 (6.8%) |
| 65 to 74 Years | 1,029 (12.6%) | 94 (9.1%) |
| 75 Years and over | 300 (3.3%) | 15 (5.0%) |
| Total | 30,716 (48.6%) | 3,594 (11.7%) |
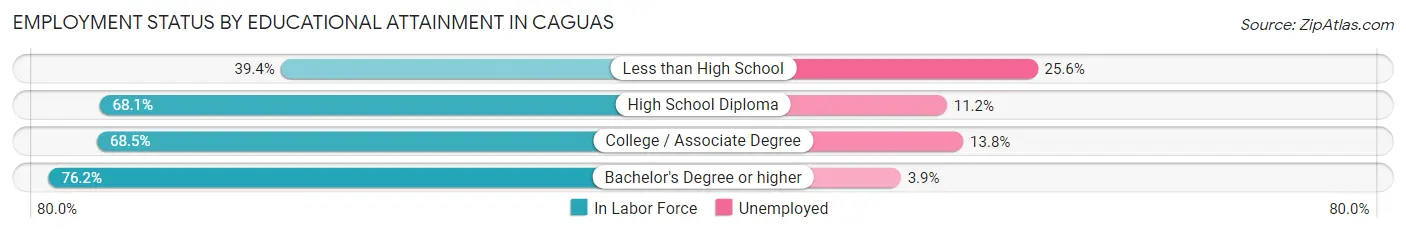
Employment Status by Educational Attainment in Caguas
According to labor force statistics for Caguas, 69.0% of individuals (25,753) out of the total population between 25 and 64 years of age (37,323) are in the labor force, with 9.7% or 2,498 of them being unemployed. The group with the highest labor force participation rate are those with the educational attainment of bachelor's degree or higher, with 76.2% or 10,136 individuals in the labor force. Within the labor force, individuals with less than high school education have the highest percentage of unemployment, with 25.6% or 280 of them being unemployed.
| Educational Attainment | In Labor Force | Unemployed |
| Less than High School | 1,093 (39.4%) | 710 (25.6%) |
| High School Diploma | 6,800 (68.1%) | 1,118 (11.2%) |
| College / Associate Degree | 7,714 (68.5%) | 1,554 (13.8%) |
| Bachelor's Degree or higher | 10,136 (76.2%) | 519 (3.9%) |
| Total | 25,753 (69.0%) | 3,620 (9.7%) |
Employment Occupations by Sex in Caguas
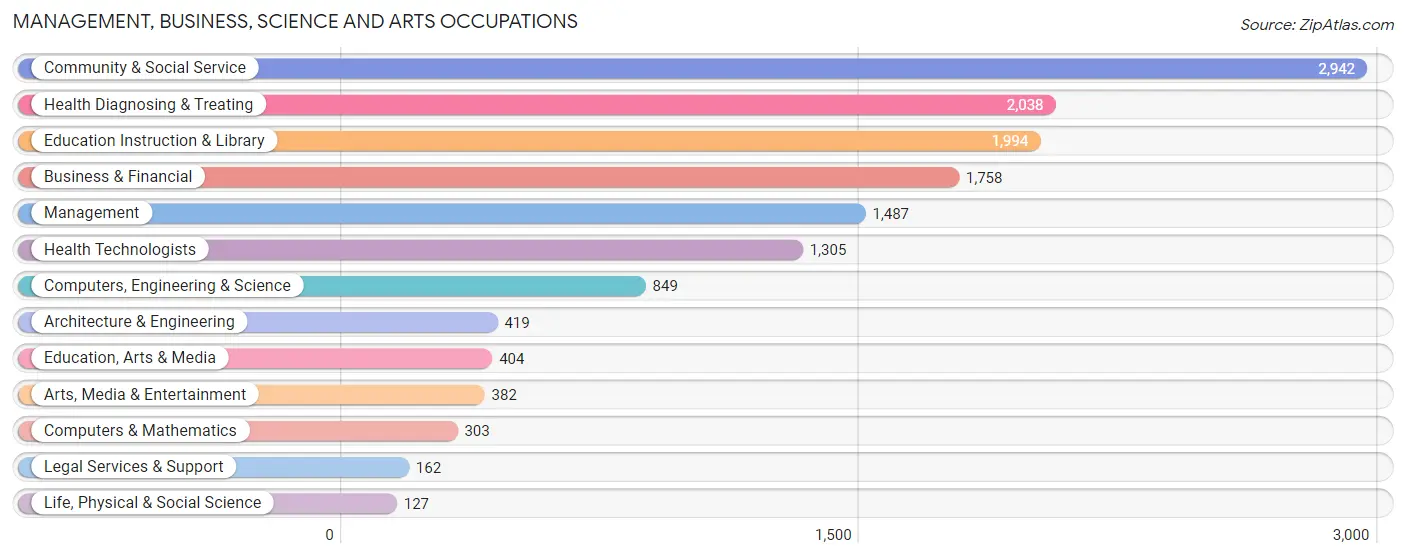
Management, Business, Science and Arts Occupations
The most common Management, Business, Science and Arts occupations in Caguas are Community & Social Service (2,942 | 10.9%), Health Diagnosing & Treating (2,038 | 7.5%), Education Instruction & Library (1,994 | 7.4%), Business & Financial (1,758 | 6.5%), and Management (1,487 | 5.5%).
Management, Business, Science and Arts Occupations by Sex
Within the Management, Business, Science and Arts occupations in Caguas, the most male-oriented occupations are Arts, Media & Entertainment (91.1%), Architecture & Engineering (77.8%), and Computers & Mathematics (73.9%), while the most female-oriented occupations are Education Instruction & Library (85.9%), Education, Arts & Media (82.7%), and Community & Social Service (73.6%).
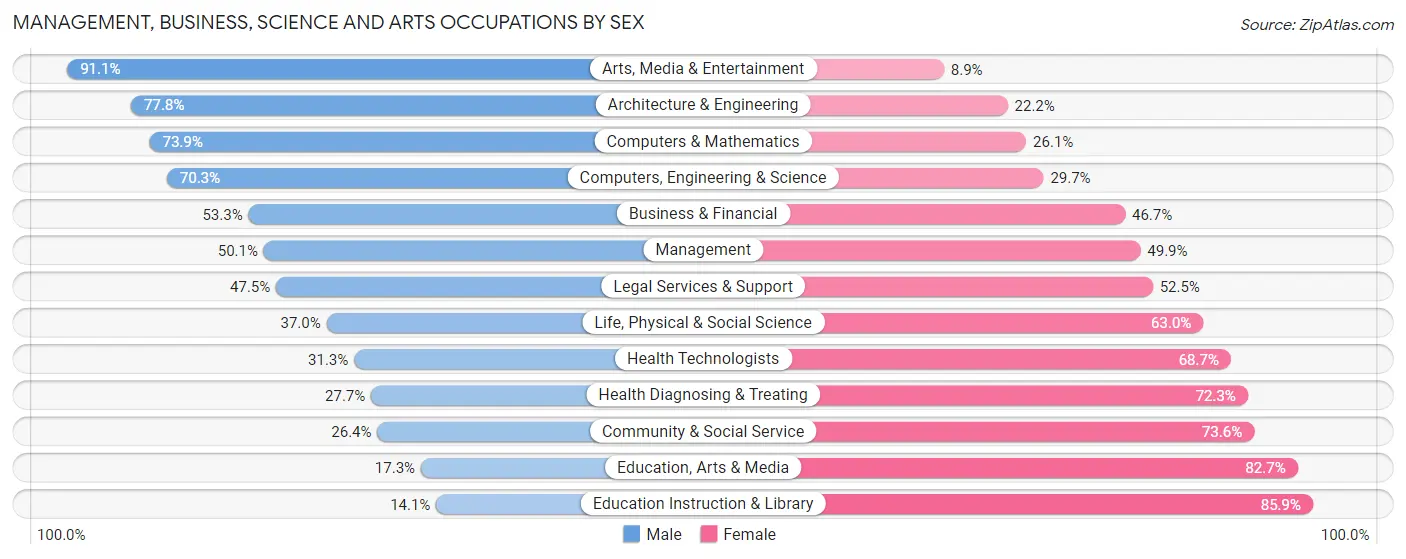
| Occupation | Male | Female |
| Management | 745 (50.1%) | 742 (49.9%) |
| Business & Financial | 937 (53.3%) | 821 (46.7%) |
| Computers, Engineering & Science | 597 (70.3%) | 252 (29.7%) |
| Computers & Mathematics | 224 (73.9%) | 79 (26.1%) |
| Architecture & Engineering | 326 (77.8%) | 93 (22.2%) |
| Life, Physical & Social Science | 47 (37.0%) | 80 (63.0%) |
| Community & Social Service | 777 (26.4%) | 2,165 (73.6%) |
| Education, Arts & Media | 70 (17.3%) | 334 (82.7%) |
| Legal Services & Support | 77 (47.5%) | 85 (52.5%) |
| Education Instruction & Library | 282 (14.1%) | 1,712 (85.9%) |
| Arts, Media & Entertainment | 348 (91.1%) | 34 (8.9%) |
| Health Diagnosing & Treating | 565 (27.7%) | 1,473 (72.3%) |
| Health Technologists | 408 (31.3%) | 897 (68.7%) |
| Total (Category) | 3,621 (39.9%) | 5,453 (60.1%) |
| Total (Overall) | 13,482 (49.8%) | 13,589 (50.2%) |
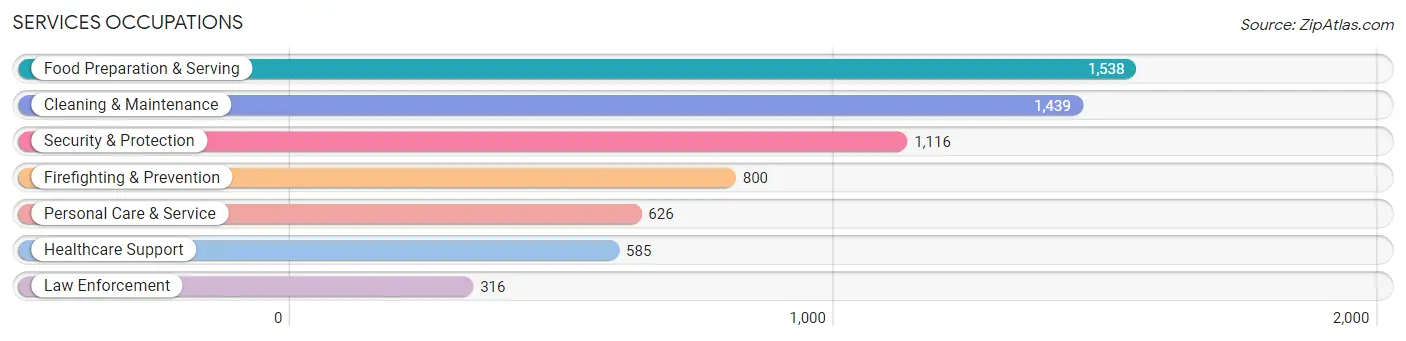
Services Occupations
The most common Services occupations in Caguas are Food Preparation & Serving (1,538 | 5.7%), Cleaning & Maintenance (1,439 | 5.3%), Security & Protection (1,116 | 4.1%), Firefighting & Prevention (800 | 3.0%), and Personal Care & Service (626 | 2.3%).
Services Occupations by Sex
Within the Services occupations in Caguas, the most male-oriented occupations are Firefighting & Prevention (79.4%), Security & Protection (74.4%), and Cleaning & Maintenance (67.1%), while the most female-oriented occupations are Healthcare Support (80.3%), Personal Care & Service (49.2%), and Food Preparation & Serving (43.1%).
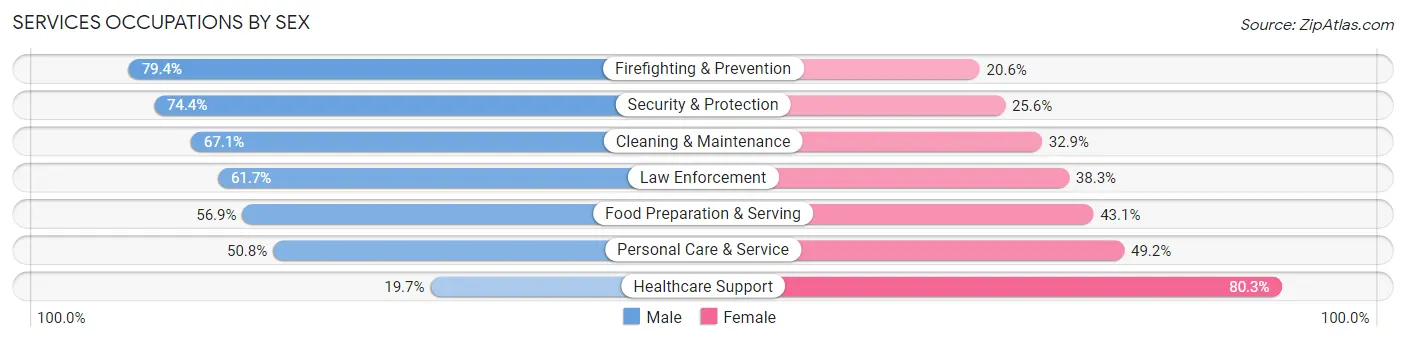
| Occupation | Male | Female |
| Healthcare Support | 115 (19.7%) | 470 (80.3%) |
| Security & Protection | 830 (74.4%) | 286 (25.6%) |
| Firefighting & Prevention | 635 (79.4%) | 165 (20.6%) |
| Law Enforcement | 195 (61.7%) | 121 (38.3%) |
| Food Preparation & Serving | 875 (56.9%) | 663 (43.1%) |
| Cleaning & Maintenance | 965 (67.1%) | 474 (32.9%) |
| Personal Care & Service | 318 (50.8%) | 308 (49.2%) |
| Total (Category) | 3,103 (58.5%) | 2,201 (41.5%) |
| Total (Overall) | 13,482 (49.8%) | 13,589 (50.2%) |
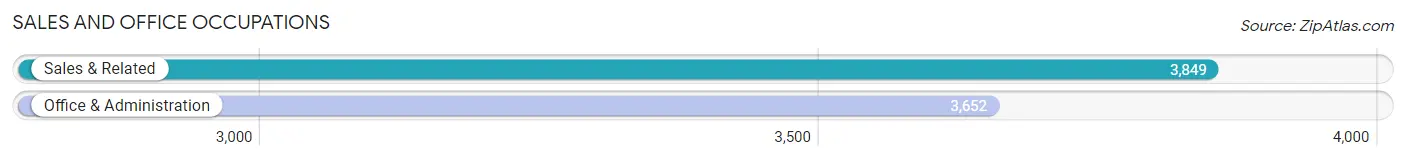
Sales and Office Occupations
The most common Sales and Office occupations in Caguas are Sales & Related (3,849 | 14.2%), and Office & Administration (3,652 | 13.5%).
Sales and Office Occupations by Sex
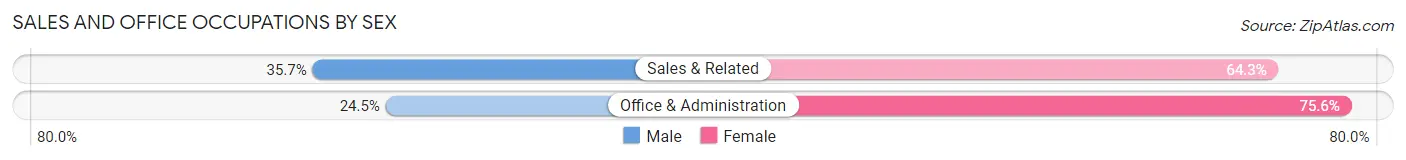
| Occupation | Male | Female |
| Sales & Related | 1,374 (35.7%) | 2,475 (64.3%) |
| Office & Administration | 893 (24.4%) | 2,759 (75.5%) |
| Total (Category) | 2,267 (30.2%) | 5,234 (69.8%) |
| Total (Overall) | 13,482 (49.8%) | 13,589 (50.2%) |
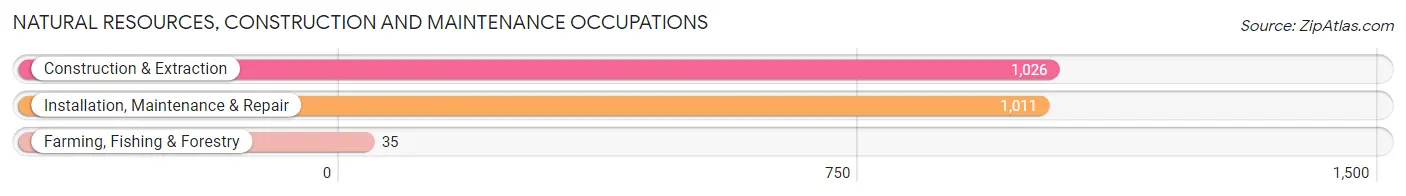
Natural Resources, Construction and Maintenance Occupations
The most common Natural Resources, Construction and Maintenance occupations in Caguas are Construction & Extraction (1,026 | 3.8%), Installation, Maintenance & Repair (1,011 | 3.7%), and Farming, Fishing & Forestry (35 | 0.1%).
Natural Resources, Construction and Maintenance Occupations by Sex
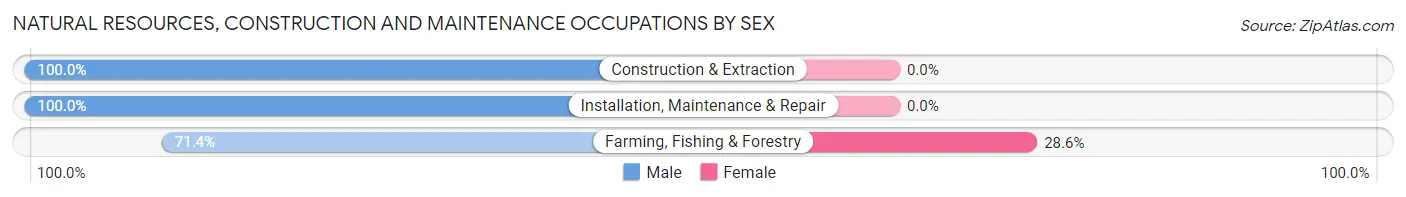
| Occupation | Male | Female |
| Farming, Fishing & Forestry | 25 (71.4%) | 10 (28.6%) |
| Construction & Extraction | 1,026 (100.0%) | 0 (0.0%) |
| Installation, Maintenance & Repair | 1,011 (100.0%) | 0 (0.0%) |
| Total (Category) | 2,062 (99.5%) | 10 (0.5%) |
| Total (Overall) | 13,482 (49.8%) | 13,589 (50.2%) |
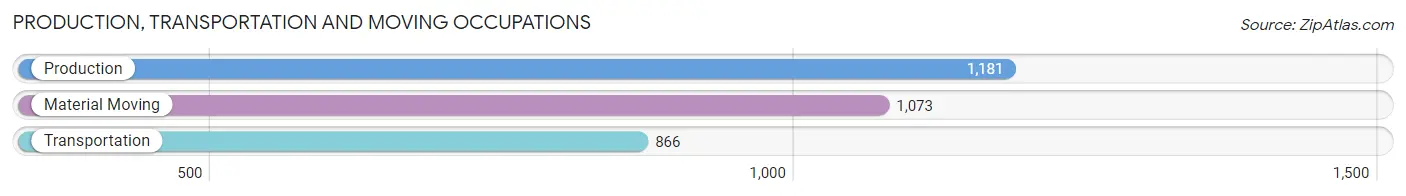
Production, Transportation and Moving Occupations
The most common Production, Transportation and Moving occupations in Caguas are Production (1,181 | 4.4%), Material Moving (1,073 | 4.0%), and Transportation (866 | 3.2%).
Production, Transportation and Moving Occupations by Sex
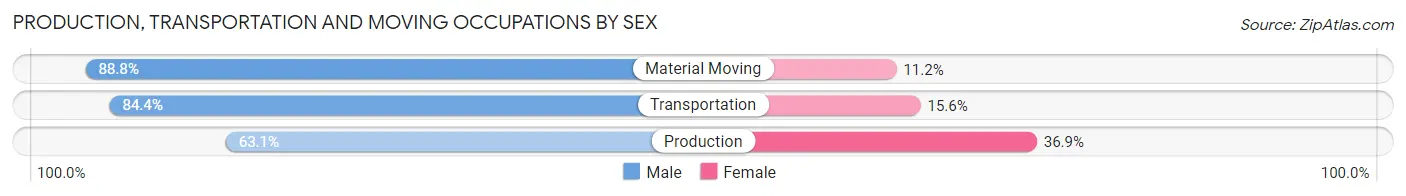
| Occupation | Male | Female |
| Production | 745 (63.1%) | 436 (36.9%) |
| Transportation | 731 (84.4%) | 135 (15.6%) |
| Material Moving | 953 (88.8%) | 120 (11.2%) |
| Total (Category) | 2,429 (77.8%) | 691 (22.2%) |
| Total (Overall) | 13,482 (49.8%) | 13,589 (50.2%) |
Employment Industries by Sex in Caguas
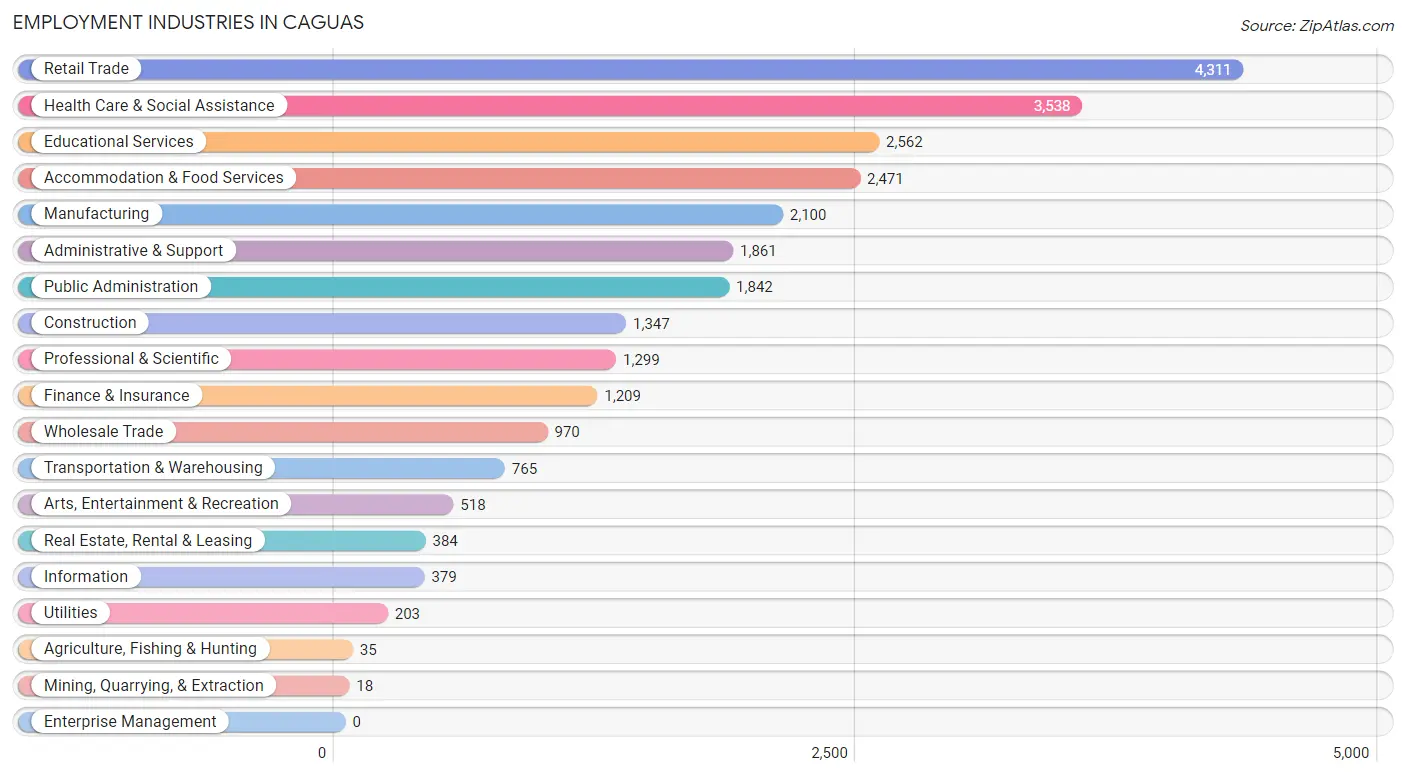
Employment Industries in Caguas
The major employment industries in Caguas include Retail Trade (4,311 | 15.9%), Health Care & Social Assistance (3,538 | 13.1%), Educational Services (2,562 | 9.5%), Accommodation & Food Services (2,471 | 9.1%), and Manufacturing (2,100 | 7.8%).
Employment Industries by Sex in Caguas
The Caguas industries that see more men than women are Construction (92.9%), Utilities (92.6%), and Arts, Entertainment & Recreation (81.7%), whereas the industries that tend to have a higher number of women are Mining, Quarrying, & Extraction (100.0%), Educational Services (79.5%), and Health Care & Social Assistance (73.8%).
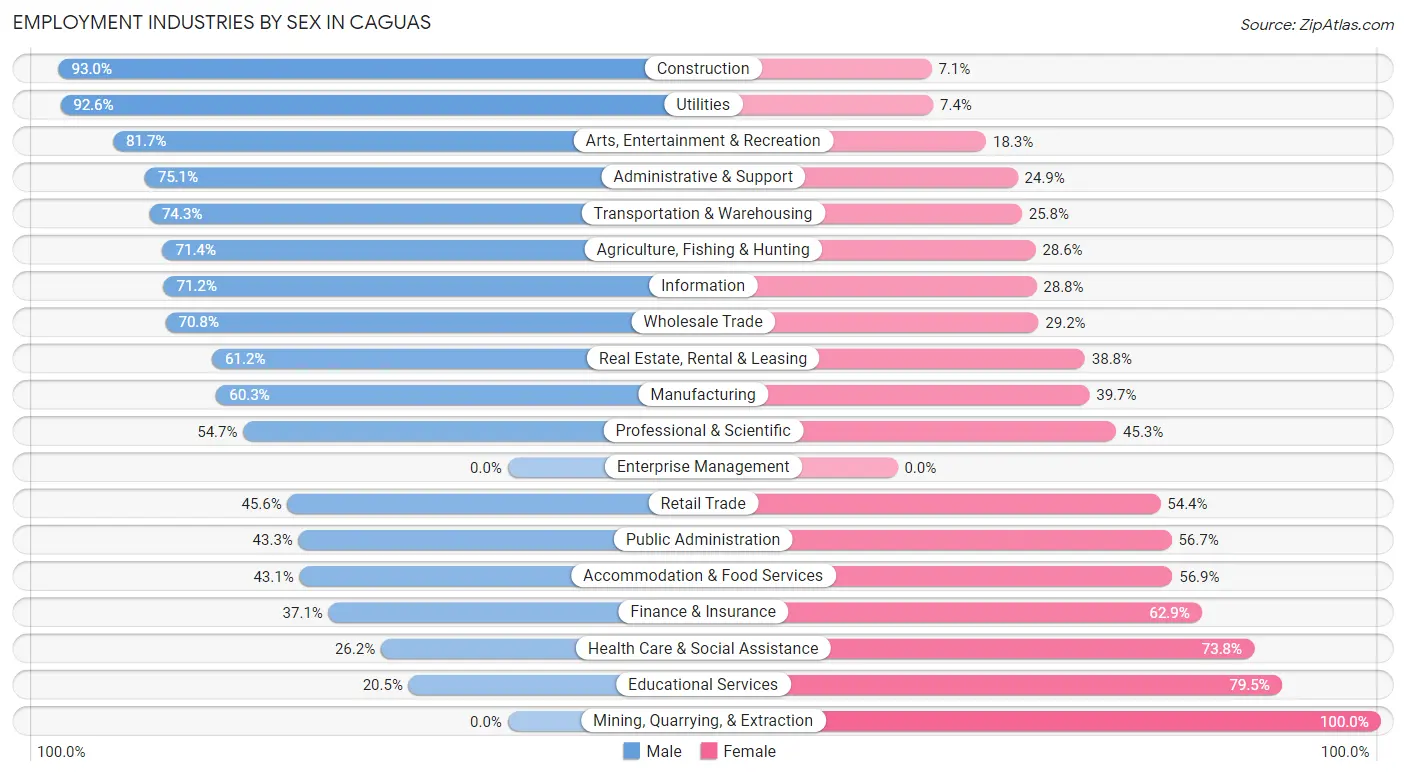
| Industry | Male | Female |
| Agriculture, Fishing & Hunting | 25 (71.4%) | 10 (28.6%) |
| Mining, Quarrying, & Extraction | 0 (0.0%) | 18 (100.0%) |
| Construction | 1,252 (92.9%) | 95 (7.0%) |
| Manufacturing | 1,266 (60.3%) | 834 (39.7%) |
| Wholesale Trade | 687 (70.8%) | 283 (29.2%) |
| Retail Trade | 1,965 (45.6%) | 2,346 (54.4%) |
| Transportation & Warehousing | 568 (74.3%) | 197 (25.8%) |
| Utilities | 188 (92.6%) | 15 (7.4%) |
| Information | 270 (71.2%) | 109 (28.8%) |
| Finance & Insurance | 448 (37.1%) | 761 (62.9%) |
| Real Estate, Rental & Leasing | 235 (61.2%) | 149 (38.8%) |
| Professional & Scientific | 711 (54.7%) | 588 (45.3%) |
| Enterprise Management | 0 (0.0%) | 0 (0.0%) |
| Administrative & Support | 1,398 (75.1%) | 463 (24.9%) |
| Educational Services | 525 (20.5%) | 2,037 (79.5%) |
| Health Care & Social Assistance | 928 (26.2%) | 2,610 (73.8%) |
| Arts, Entertainment & Recreation | 423 (81.7%) | 95 (18.3%) |
| Accommodation & Food Services | 1,065 (43.1%) | 1,406 (56.9%) |
| Public Administration | 797 (43.3%) | 1,045 (56.7%) |
| Total | 13,482 (49.8%) | 13,589 (50.2%) |
Education in Caguas
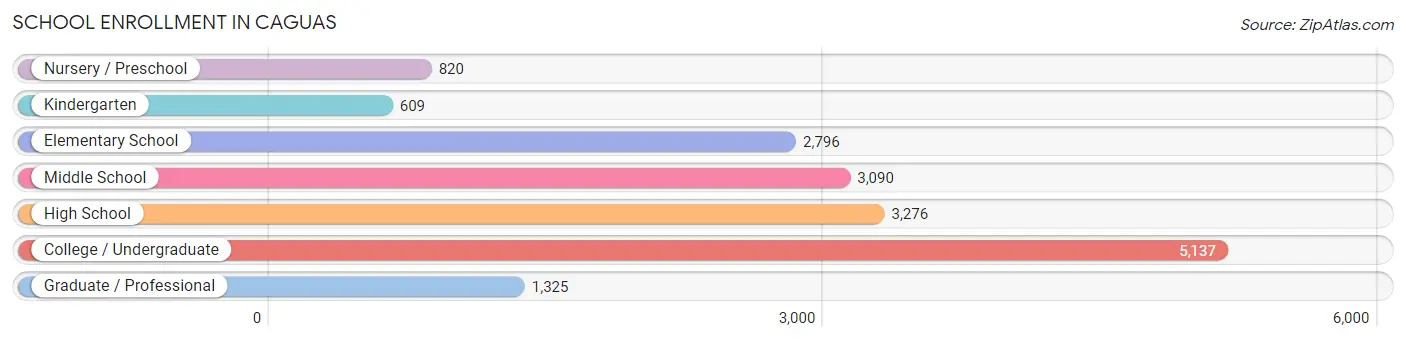
School Enrollment in Caguas
The most common levels of schooling among the 17,053 students in Caguas are college / undergraduate (5,137 | 30.1%), high school (3,276 | 19.2%), and middle school (3,090 | 18.1%).
| School Level | # Students | % Students |
| Nursery / Preschool | 820 | 4.8% |
| Kindergarten | 609 | 3.6% |
| Elementary School | 2,796 | 16.4% |
| Middle School | 3,090 | 18.1% |
| High School | 3,276 | 19.2% |
| College / Undergraduate | 5,137 | 30.1% |
| Graduate / Professional | 1,325 | 7.8% |
| Total | 17,053 | 100.0% |
School Enrollment by Age by Funding Source in Caguas
Out of a total of 17,053 students who are enrolled in schools in Caguas, 7,486 (43.9%) attend a private institution, while the remaining 9,567 (56.1%) are enrolled in public schools. The age group of 25 to 34 year olds has the highest likelihood of being enrolled in private schools, with 1,435 (82.8% in the age bracket) enrolled. Conversely, the age group of 10 to 14 year olds has the lowest likelihood of being enrolled in a private school, with 2,790 (74.5% in the age bracket) attending a public institution.
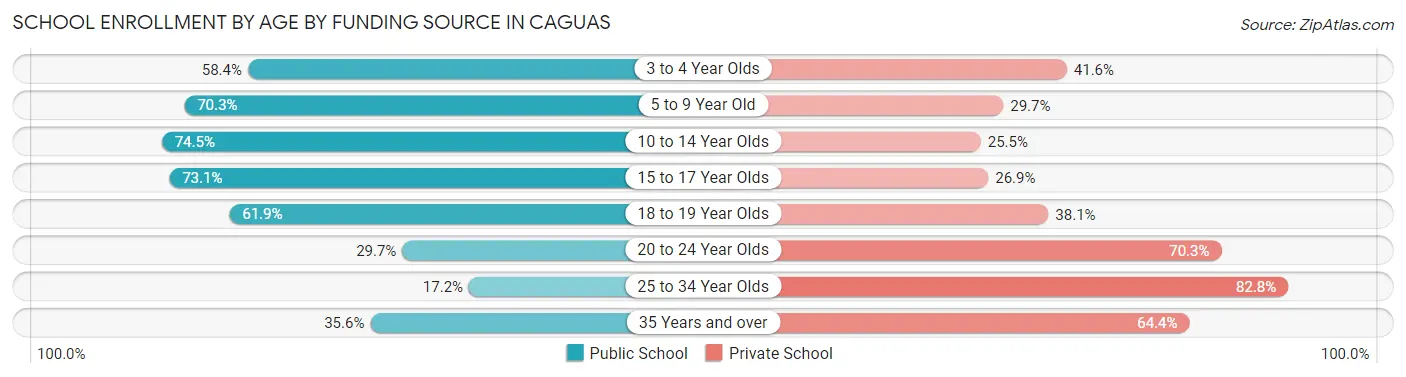
| Age Bracket | Public School | Private School |
| 3 to 4 Year Olds | 388 (58.4%) | 276 (41.6%) |
| 5 to 9 Year Old | 2,290 (70.3%) | 969 (29.7%) |
| 10 to 14 Year Olds | 2,790 (74.5%) | 957 (25.5%) |
| 15 to 17 Year Olds | 1,717 (73.1%) | 633 (26.9%) |
| 18 to 19 Year Olds | 865 (61.9%) | 533 (38.1%) |
| 20 to 24 Year Olds | 825 (29.7%) | 1,956 (70.3%) |
| 25 to 34 Year Olds | 299 (17.2%) | 1,435 (82.8%) |
| 35 Years and over | 399 (35.6%) | 721 (64.4%) |
| Total | 9,567 (56.1%) | 7,486 (43.9%) |
Educational Attainment by Field of Study in Caguas
Business (5,022 | 27.7%), education (3,079 | 17.0%), science & technology (2,206 | 12.2%), social sciences (1,331 | 7.3%), and physical & health sciences (1,114 | 6.1%) are the most common fields of study among 18,137 individuals in Caguas who have obtained a bachelor's degree or higher.
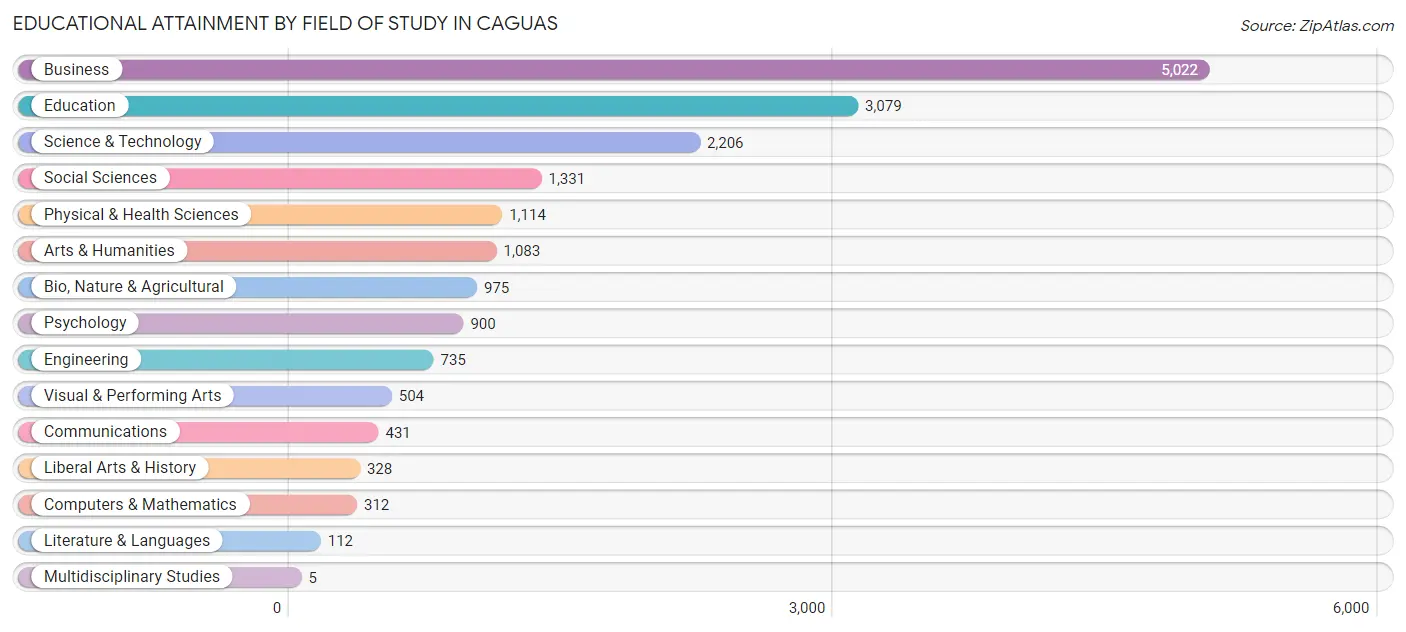
| Field of Study | # Graduates | % Graduates |
| Computers & Mathematics | 312 | 1.7% |
| Bio, Nature & Agricultural | 975 | 5.4% |
| Physical & Health Sciences | 1,114 | 6.1% |
| Psychology | 900 | 5.0% |
| Social Sciences | 1,331 | 7.3% |
| Engineering | 735 | 4.1% |
| Multidisciplinary Studies | 5 | 0.0% |
| Science & Technology | 2,206 | 12.2% |
| Business | 5,022 | 27.7% |
| Education | 3,079 | 17.0% |
| Literature & Languages | 112 | 0.6% |
| Liberal Arts & History | 328 | 1.8% |
| Visual & Performing Arts | 504 | 2.8% |
| Communications | 431 | 2.4% |
| Arts & Humanities | 1,083 | 6.0% |
| Total | 18,137 | 100.0% |
Transportation & Commute in Caguas
Vehicle Availability by Sex in Caguas
The most prevalent vehicle ownership categories in Caguas are males with 2 vehicles (5,455, accounting for 42.0%) and females with 2 vehicles (5,233, making up 43.3%).
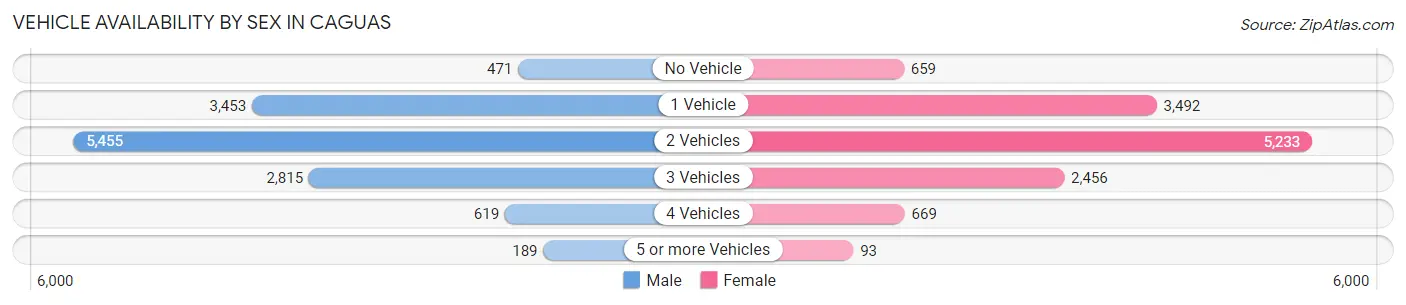
| Vehicles Available | Male | Female |
| No Vehicle | 471 (3.6%) | 659 (5.2%) |
| 1 Vehicle | 3,453 (26.6%) | 3,492 (27.7%) |
| 2 Vehicles | 5,455 (42.0%) | 5,233 (41.5%) |
| 3 Vehicles | 2,815 (21.6%) | 2,456 (19.5%) |
| 4 Vehicles | 619 (4.8%) | 669 (5.3%) |
| 5 or more Vehicles | 189 (1.5%) | 93 (0.7%) |
| Total | 13,002 (100.0%) | 12,602 (100.0%) |
Commute Time in Caguas
The most frequently occuring commute durations in Caguas are 15 to 19 minutes (4,273 commuters, 17.4%), 30 to 34 minutes (3,503 commuters, 14.3%), and 10 to 14 minutes (3,313 commuters, 13.5%).
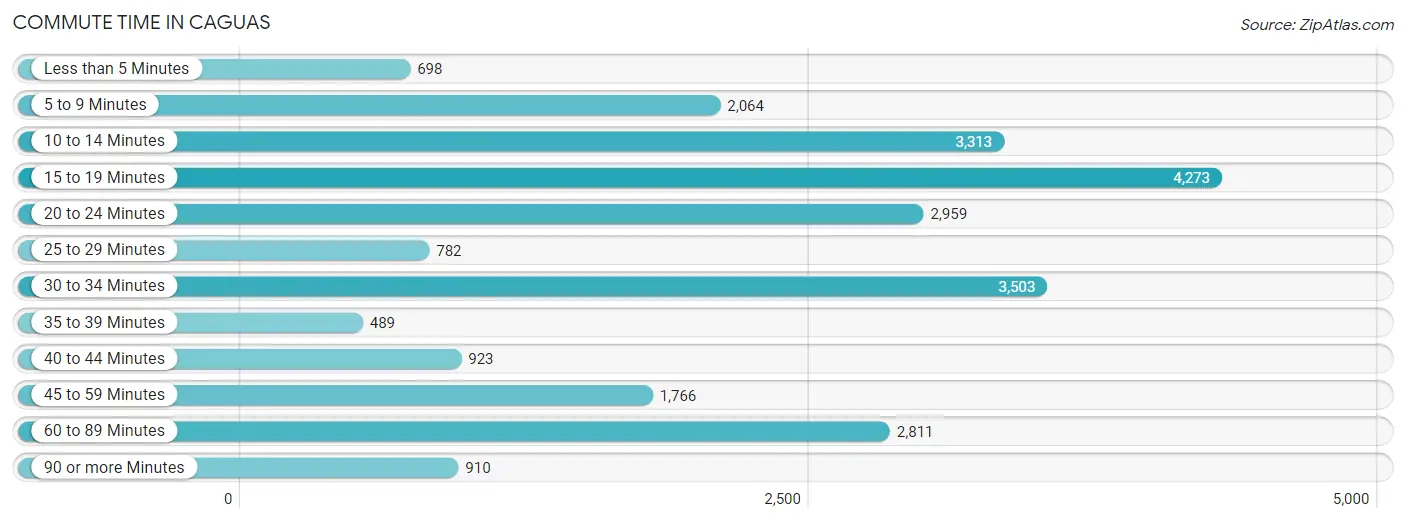
| Commute Time | # Commuters | % Commuters |
| Less than 5 Minutes | 698 | 2.9% |
| 5 to 9 Minutes | 2,064 | 8.4% |
| 10 to 14 Minutes | 3,313 | 13.5% |
| 15 to 19 Minutes | 4,273 | 17.4% |
| 20 to 24 Minutes | 2,959 | 12.1% |
| 25 to 29 Minutes | 782 | 3.2% |
| 30 to 34 Minutes | 3,503 | 14.3% |
| 35 to 39 Minutes | 489 | 2.0% |
| 40 to 44 Minutes | 923 | 3.8% |
| 45 to 59 Minutes | 1,766 | 7.2% |
| 60 to 89 Minutes | 2,811 | 11.5% |
| 90 or more Minutes | 910 | 3.7% |
Commute Time by Sex in Caguas
The most common commute times in Caguas are 30 to 34 minutes (2,101 commuters, 17.0%) for males and 15 to 19 minutes (2,394 commuters, 19.7%) for females.
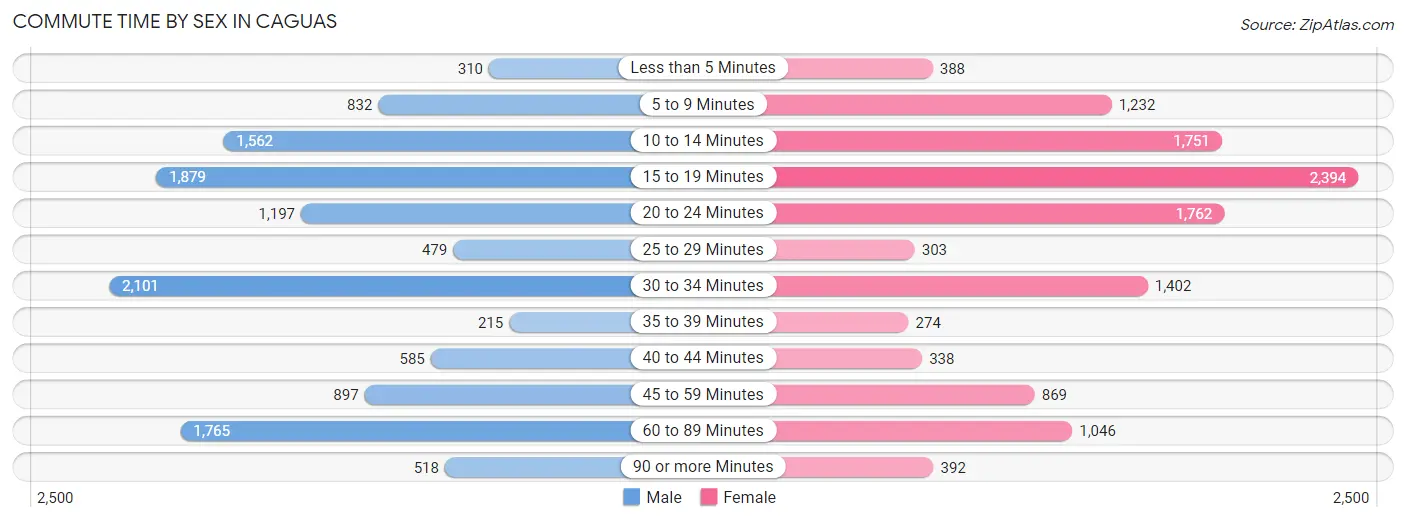
| Commute Time | Male | Female |
| Less than 5 Minutes | 310 (2.5%) | 388 (3.2%) |
| 5 to 9 Minutes | 832 (6.7%) | 1,232 (10.1%) |
| 10 to 14 Minutes | 1,562 (12.7%) | 1,751 (14.4%) |
| 15 to 19 Minutes | 1,879 (15.2%) | 2,394 (19.7%) |
| 20 to 24 Minutes | 1,197 (9.7%) | 1,762 (14.5%) |
| 25 to 29 Minutes | 479 (3.9%) | 303 (2.5%) |
| 30 to 34 Minutes | 2,101 (17.0%) | 1,402 (11.5%) |
| 35 to 39 Minutes | 215 (1.7%) | 274 (2.2%) |
| 40 to 44 Minutes | 585 (4.7%) | 338 (2.8%) |
| 45 to 59 Minutes | 897 (7.3%) | 869 (7.1%) |
| 60 to 89 Minutes | 1,765 (14.3%) | 1,046 (8.6%) |
| 90 or more Minutes | 518 (4.2%) | 392 (3.2%) |
Time of Departure to Work by Sex in Caguas
The most frequent times of departure to work in Caguas are 7:00 AM to 7:29 AM (2,153, 17.4%) for males and 7:00 AM to 7:29 AM (2,075, 17.1%) for females.
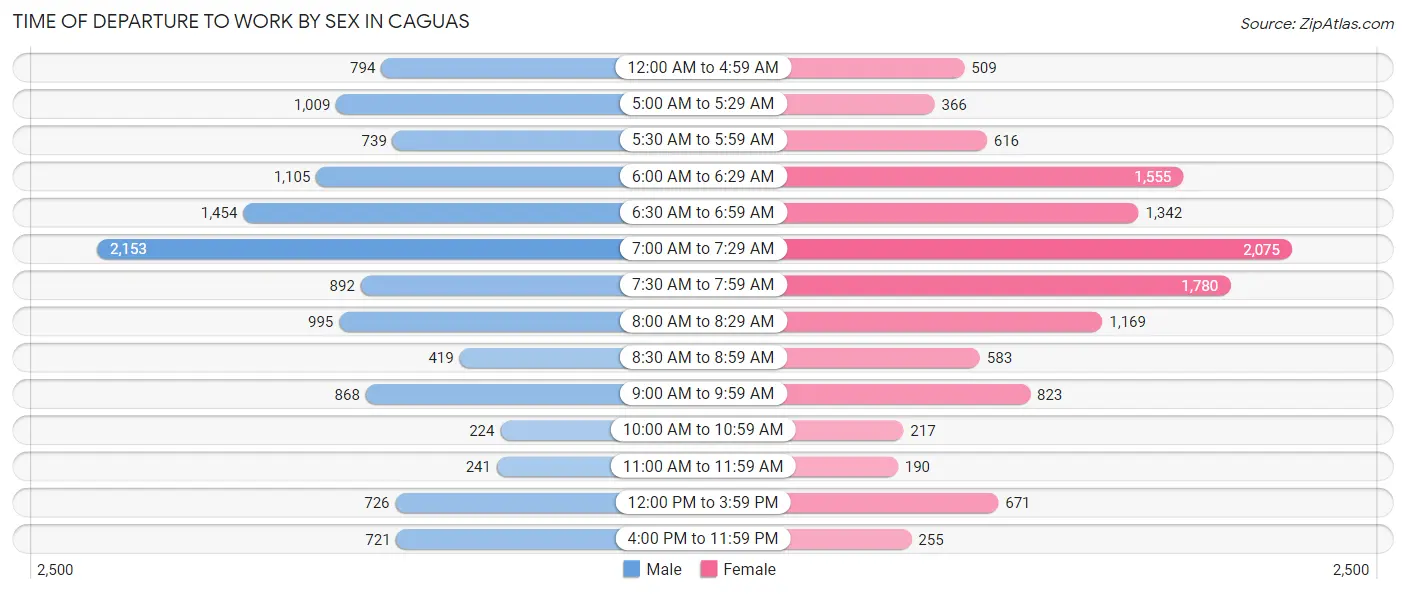
| Time of Departure | Male | Female |
| 12:00 AM to 4:59 AM | 794 (6.4%) | 509 (4.2%) |
| 5:00 AM to 5:29 AM | 1,009 (8.2%) | 366 (3.0%) |
| 5:30 AM to 5:59 AM | 739 (6.0%) | 616 (5.1%) |
| 6:00 AM to 6:29 AM | 1,105 (8.9%) | 1,555 (12.8%) |
| 6:30 AM to 6:59 AM | 1,454 (11.8%) | 1,342 (11.0%) |
| 7:00 AM to 7:29 AM | 2,153 (17.4%) | 2,075 (17.1%) |
| 7:30 AM to 7:59 AM | 892 (7.2%) | 1,780 (14.6%) |
| 8:00 AM to 8:29 AM | 995 (8.1%) | 1,169 (9.6%) |
| 8:30 AM to 8:59 AM | 419 (3.4%) | 583 (4.8%) |
| 9:00 AM to 9:59 AM | 868 (7.0%) | 823 (6.8%) |
| 10:00 AM to 10:59 AM | 224 (1.8%) | 217 (1.8%) |
| 11:00 AM to 11:59 AM | 241 (1.9%) | 190 (1.6%) |
| 12:00 PM to 3:59 PM | 726 (5.9%) | 671 (5.5%) |
| 4:00 PM to 11:59 PM | 721 (5.8%) | 255 (2.1%) |
| Total | 12,340 (100.0%) | 12,151 (100.0%) |
Housing Occupancy in Caguas
Occupancy by Ownership in Caguas
Of the total 30,374 dwellings in Caguas, owner-occupied units account for 18,551 (61.1%), while renter-occupied units make up 11,823 (38.9%).
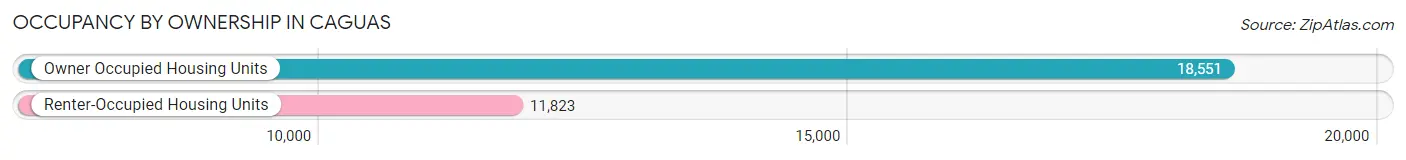
| Occupancy | # Housing Units | % Housing Units |
| Owner Occupied Housing Units | 18,551 | 61.1% |
| Renter-Occupied Housing Units | 11,823 | 38.9% |
| Total Occupied Housing Units | 30,374 | 100.0% |
Occupancy by Household Size in Caguas
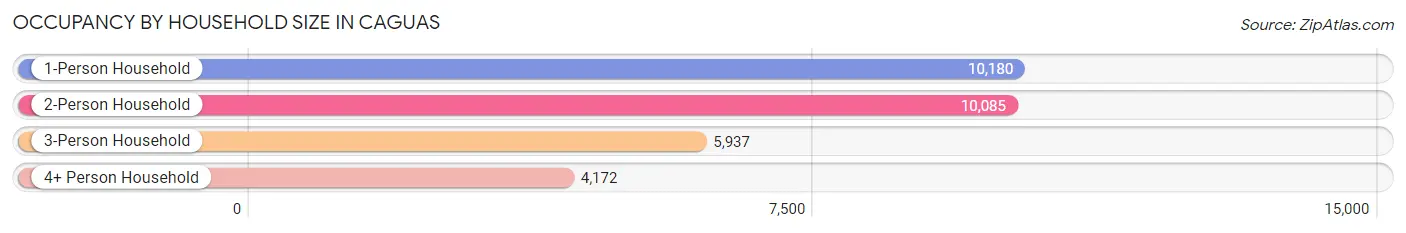
| Household Size | # Housing Units | % Housing Units |
| 1-Person Household | 10,180 | 33.5% |
| 2-Person Household | 10,085 | 33.2% |
| 3-Person Household | 5,937 | 19.6% |
| 4+ Person Household | 4,172 | 13.7% |
| Total Housing Units | 30,374 | 100.0% |
Occupancy by Ownership by Household Size in Caguas
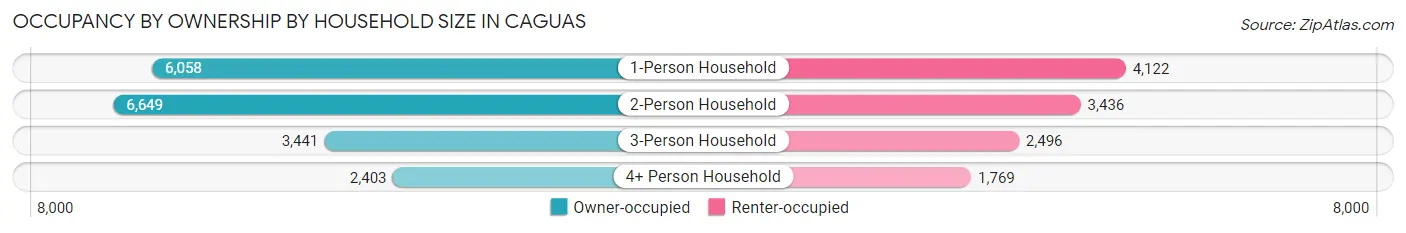
| Household Size | Owner-occupied | Renter-occupied |
| 1-Person Household | 6,058 (59.5%) | 4,122 (40.5%) |
| 2-Person Household | 6,649 (65.9%) | 3,436 (34.1%) |
| 3-Person Household | 3,441 (58.0%) | 2,496 (42.0%) |
| 4+ Person Household | 2,403 (57.6%) | 1,769 (42.4%) |
| Total Housing Units | 18,551 (61.1%) | 11,823 (38.9%) |
Occupancy by Educational Attainment in Caguas
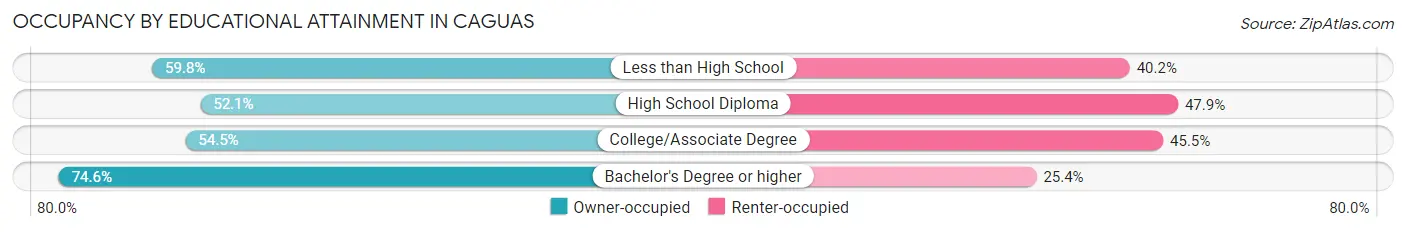
| Household Size | Owner-occupied | Renter-occupied |
| Less than High School | 2,470 (59.8%) | 1,662 (40.2%) |
| High School Diploma | 4,450 (52.1%) | 4,086 (47.9%) |
| College/Associate Degree | 4,271 (54.5%) | 3,567 (45.5%) |
| Bachelor's Degree or higher | 7,360 (74.6%) | 2,508 (25.4%) |
Occupancy by Age of Householder in Caguas
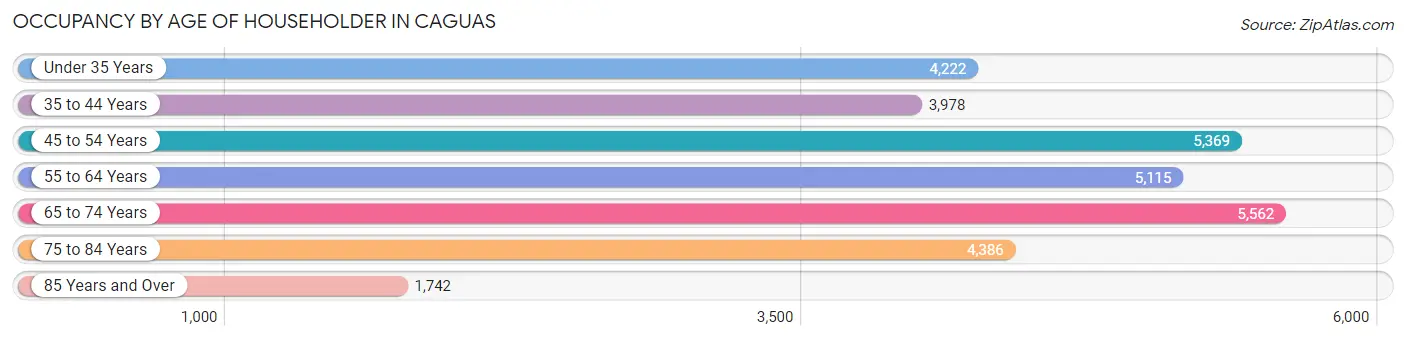
| Age Bracket | # Households | % Households |
| Under 35 Years | 4,222 | 13.9% |
| 35 to 44 Years | 3,978 | 13.1% |
| 45 to 54 Years | 5,369 | 17.7% |
| 55 to 64 Years | 5,115 | 16.8% |
| 65 to 74 Years | 5,562 | 18.3% |
| 75 to 84 Years | 4,386 | 14.4% |
| 85 Years and Over | 1,742 | 5.7% |
| Total | 30,374 | 100.0% |
Housing Finances in Caguas
Median Income by Occupancy in Caguas
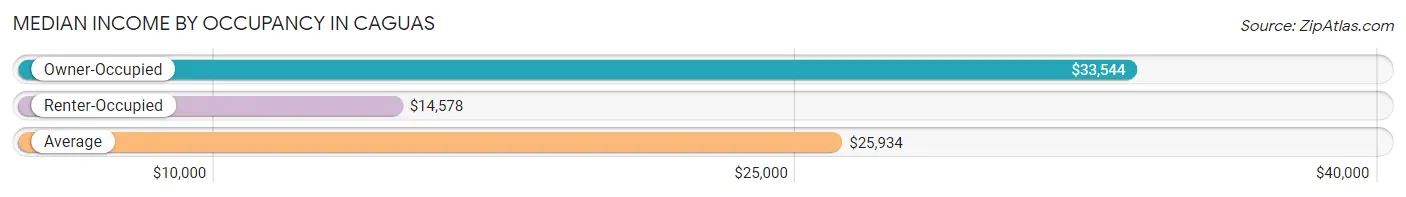
| Occupancy Type | # Households | Median Income |
| Owner-Occupied | 18,551 (61.1%) | $33,544 |
| Renter-Occupied | 11,823 (38.9%) | $14,578 |
| Average | 30,374 (100.0%) | $25,934 |
Occupancy by Householder Income Bracket in Caguas
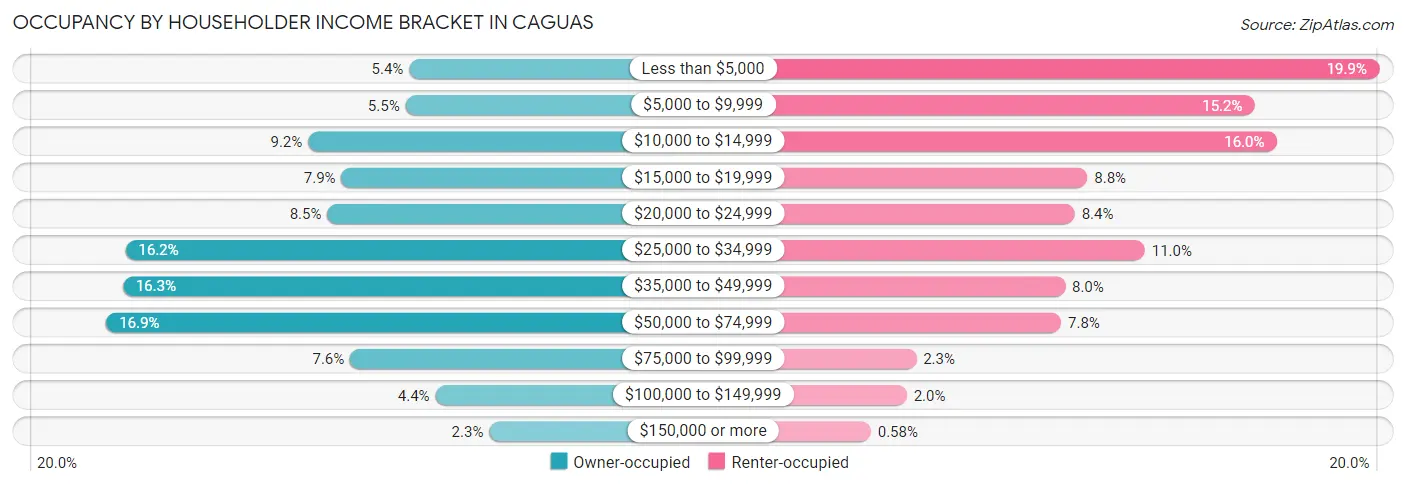
| Income Bracket | Owner-occupied | Renter-occupied |
| Less than $5,000 | 992 (5.3%) | 2,356 (19.9%) |
| $5,000 to $9,999 | 1,018 (5.5%) | 1,796 (15.2%) |
| $10,000 to $14,999 | 1,706 (9.2%) | 1,895 (16.0%) |
| $15,000 to $19,999 | 1,472 (7.9%) | 1,044 (8.8%) |
| $20,000 to $24,999 | 1,572 (8.5%) | 987 (8.4%) |
| $25,000 to $34,999 | 2,997 (16.2%) | 1,303 (11.0%) |
| $35,000 to $49,999 | 3,017 (16.3%) | 944 (8.0%) |
| $50,000 to $74,999 | 3,133 (16.9%) | 926 (7.8%) |
| $75,000 to $99,999 | 1,410 (7.6%) | 273 (2.3%) |
| $100,000 to $149,999 | 807 (4.3%) | 230 (1.9%) |
| $150,000 or more | 427 (2.3%) | 69 (0.6%) |
| Total | 18,551 (100.0%) | 11,823 (100.0%) |
Monthly Housing Cost Tiers in Caguas
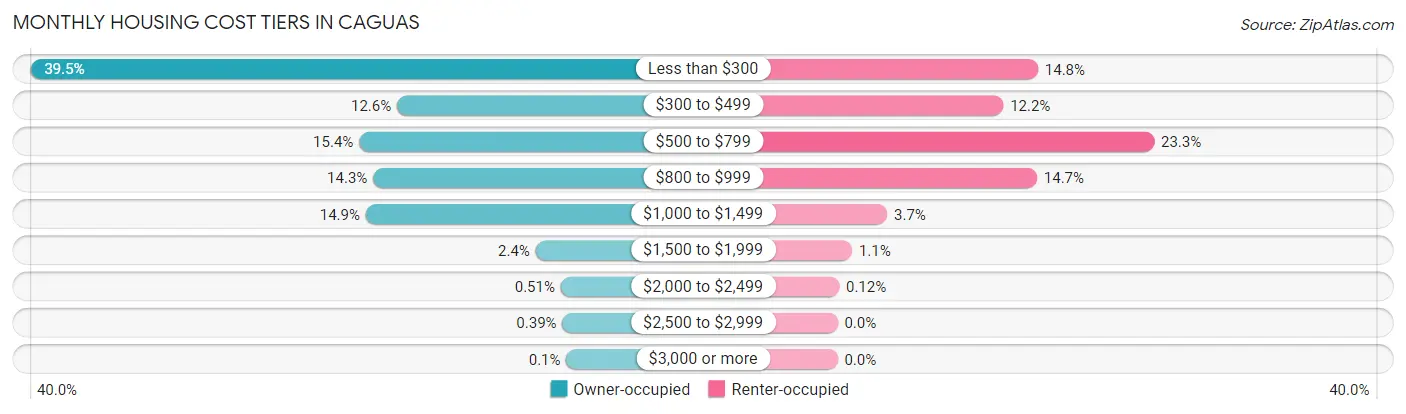
| Monthly Cost | Owner-occupied | Renter-occupied |
| Less than $300 | 7,330 (39.5%) | 1,745 (14.8%) |
| $300 to $499 | 2,331 (12.6%) | 1,443 (12.2%) |
| $500 to $799 | 2,849 (15.4%) | 2,757 (23.3%) |
| $800 to $999 | 2,659 (14.3%) | 1,737 (14.7%) |
| $1,000 to $1,499 | 2,759 (14.9%) | 433 (3.7%) |
| $1,500 to $1,999 | 437 (2.4%) | 126 (1.1%) |
| $2,000 to $2,499 | 95 (0.5%) | 14 (0.1%) |
| $2,500 to $2,999 | 72 (0.4%) | 0 (0.0%) |
| $3,000 or more | 19 (0.1%) | 0 (0.0%) |
| Total | 18,551 (100.0%) | 11,823 (100.0%) |
Physical Housing Characteristics in Caguas
Housing Structures in Caguas
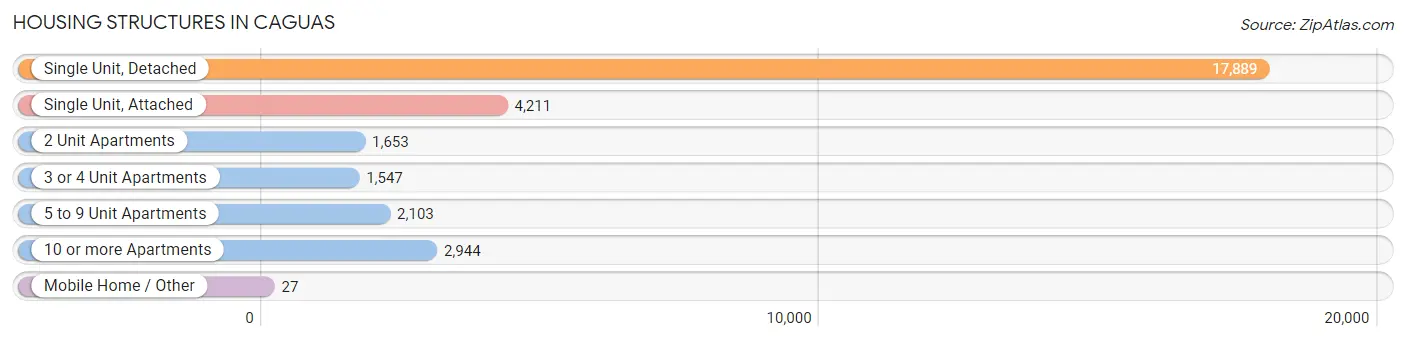
| Structure Type | # Housing Units | % Housing Units |
| Single Unit, Detached | 17,889 | 58.9% |
| Single Unit, Attached | 4,211 | 13.9% |
| 2 Unit Apartments | 1,653 | 5.4% |
| 3 or 4 Unit Apartments | 1,547 | 5.1% |
| 5 to 9 Unit Apartments | 2,103 | 6.9% |
| 10 or more Apartments | 2,944 | 9.7% |
| Mobile Home / Other | 27 | 0.1% |
| Total | 30,374 | 100.0% |
Housing Structures by Occupancy in Caguas
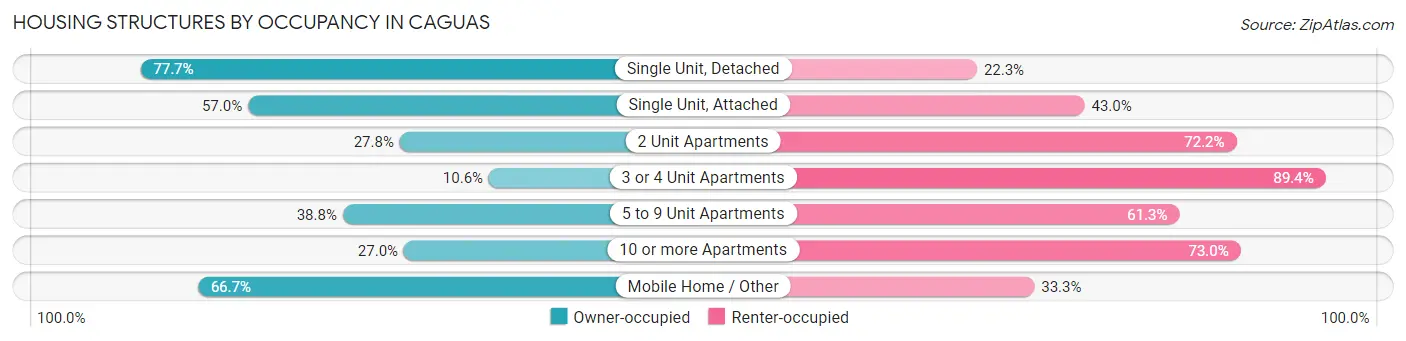
| Structure Type | Owner-occupied | Renter-occupied |
| Single Unit, Detached | 13,901 (77.7%) | 3,988 (22.3%) |
| Single Unit, Attached | 2,400 (57.0%) | 1,811 (43.0%) |
| 2 Unit Apartments | 459 (27.8%) | 1,194 (72.2%) |
| 3 or 4 Unit Apartments | 164 (10.6%) | 1,383 (89.4%) |
| 5 to 9 Unit Apartments | 815 (38.8%) | 1,288 (61.3%) |
| 10 or more Apartments | 794 (27.0%) | 2,150 (73.0%) |
| Mobile Home / Other | 18 (66.7%) | 9 (33.3%) |
| Total | 18,551 (61.1%) | 11,823 (38.9%) |
Housing Structures by Number of Rooms in Caguas
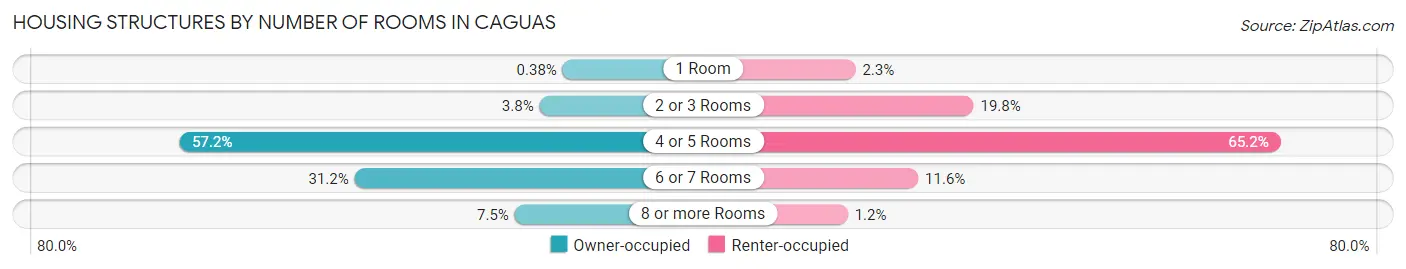
| Number of Rooms | Owner-occupied | Renter-occupied |
| 1 Room | 71 (0.4%) | 272 (2.3%) |
| 2 or 3 Rooms | 706 (3.8%) | 2,337 (19.8%) |
| 4 or 5 Rooms | 10,602 (57.2%) | 7,709 (65.2%) |
| 6 or 7 Rooms | 5,785 (31.2%) | 1,369 (11.6%) |
| 8 or more Rooms | 1,387 (7.5%) | 136 (1.1%) |
| Total | 18,551 (100.0%) | 11,823 (100.0%) |
Housing Structure by Heating Type in Caguas
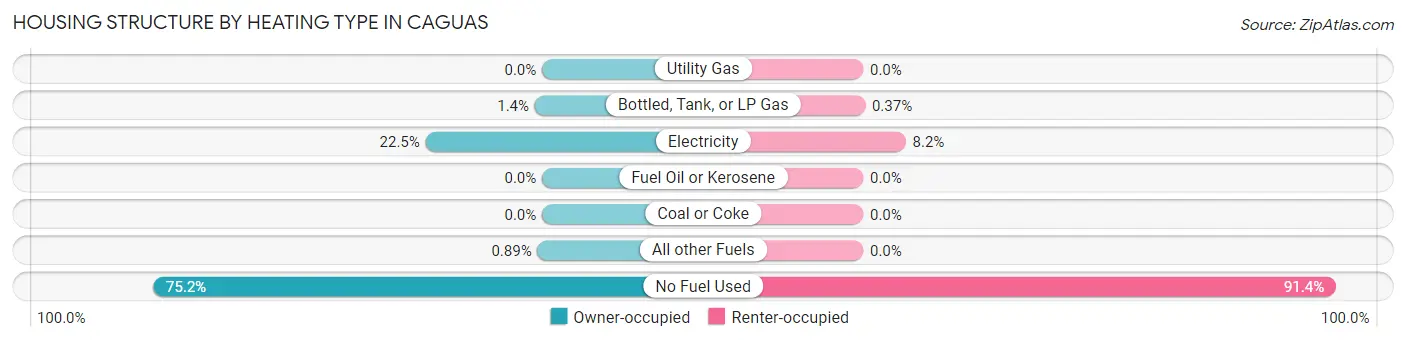
| Heating Type | Owner-occupied | Renter-occupied |
| Utility Gas | 0 (0.0%) | 0 (0.0%) |
| Bottled, Tank, or LP Gas | 259 (1.4%) | 44 (0.4%) |
| Electricity | 4,176 (22.5%) | 973 (8.2%) |
| Fuel Oil or Kerosene | 0 (0.0%) | 0 (0.0%) |
| Coal or Coke | 0 (0.0%) | 0 (0.0%) |
| All other Fuels | 165 (0.9%) | 0 (0.0%) |
| No Fuel Used | 13,951 (75.2%) | 10,806 (91.4%) |
| Total | 18,551 (100.0%) | 11,823 (100.0%) |
Household Vehicle Usage in Caguas
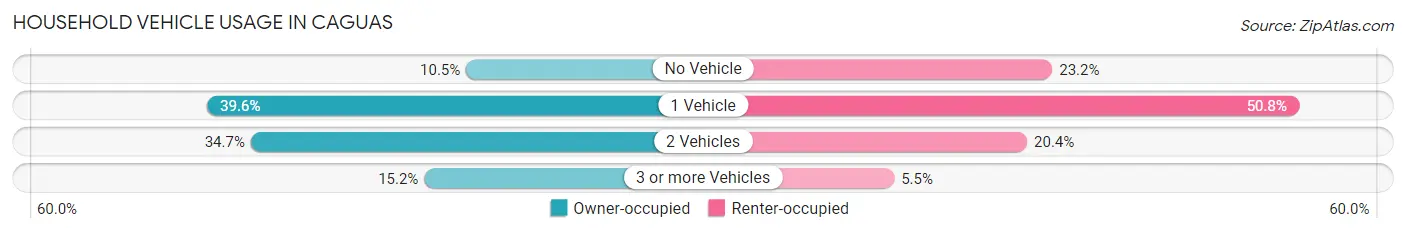
| Vehicles per Household | Owner-occupied | Renter-occupied |
| No Vehicle | 1,955 (10.5%) | 2,747 (23.2%) |
| 1 Vehicle | 7,337 (39.6%) | 6,010 (50.8%) |
| 2 Vehicles | 6,432 (34.7%) | 2,413 (20.4%) |
| 3 or more Vehicles | 2,827 (15.2%) | 653 (5.5%) |
| Total | 18,551 (100.0%) | 11,823 (100.0%) |
Real Estate & Mortgages in Caguas
Real Estate and Mortgage Overview in Caguas
| Characteristic | Without Mortgage | With Mortgage |
| Housing Units | 9,724 | 8,827 |
| Median Property Value | $124,700 | $132,400 |
| Median Household Income | $28,343 | $222 |
| Monthly Housing Costs | $184 | $9 |
| Real Estate Taxes | $664 | $7,819 |
Property Value by Mortgage Status in Caguas
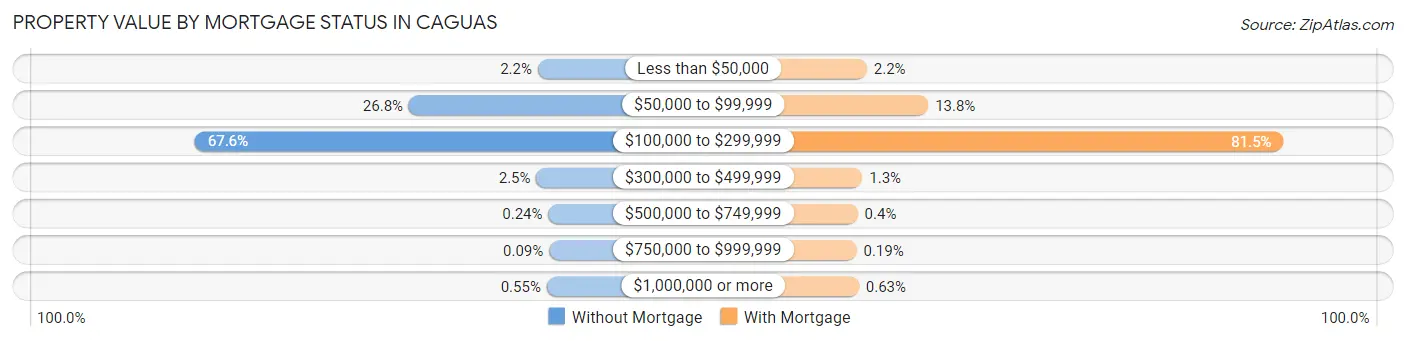
| Property Value | Without Mortgage | With Mortgage |
| Less than $50,000 | 218 (2.2%) | 190 (2.1%) |
| $50,000 to $99,999 | 2,606 (26.8%) | 1,222 (13.8%) |
| $100,000 to $299,999 | 6,570 (67.6%) | 7,193 (81.5%) |
| $300,000 to $499,999 | 245 (2.5%) | 114 (1.3%) |
| $500,000 to $749,999 | 23 (0.2%) | 35 (0.4%) |
| $750,000 to $999,999 | 9 (0.1%) | 17 (0.2%) |
| $1,000,000 or more | 53 (0.5%) | 56 (0.6%) |
| Total | 9,724 (100.0%) | 8,827 (100.0%) |
Household Income by Mortgage Status in Caguas
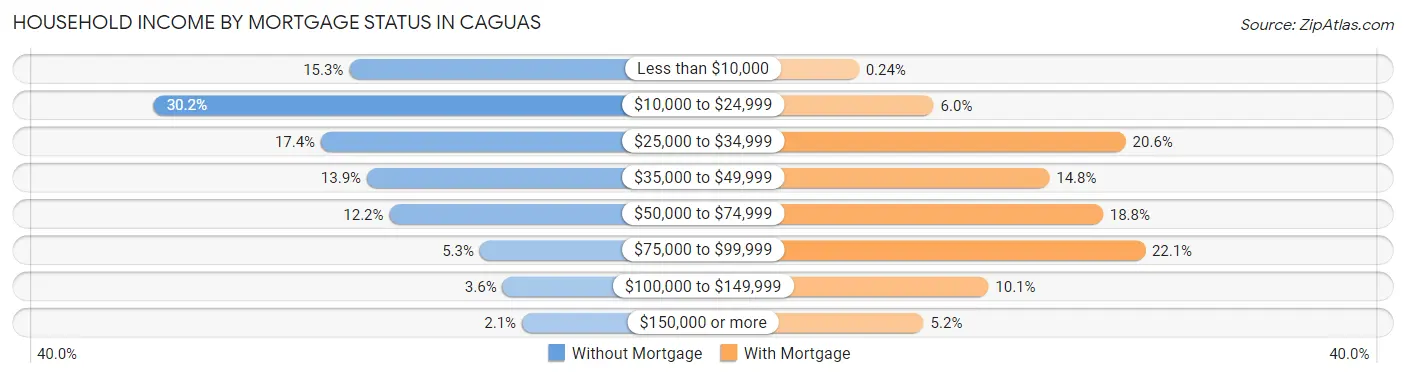
| Household Income | Without Mortgage | With Mortgage |
| Less than $10,000 | 1,485 (15.3%) | 21 (0.2%) |
| $10,000 to $24,999 | 2,933 (30.2%) | 525 (5.9%) |
| $25,000 to $34,999 | 1,694 (17.4%) | 1,817 (20.6%) |
| $35,000 to $49,999 | 1,354 (13.9%) | 1,303 (14.8%) |
| $50,000 to $74,999 | 1,187 (12.2%) | 1,663 (18.8%) |
| $75,000 to $99,999 | 517 (5.3%) | 1,946 (22.1%) |
| $100,000 to $149,999 | 349 (3.6%) | 893 (10.1%) |
| $150,000 or more | 205 (2.1%) | 458 (5.2%) |
| Total | 9,724 (100.0%) | 8,827 (100.0%) |
Property Value to Household Income Ratio in Caguas
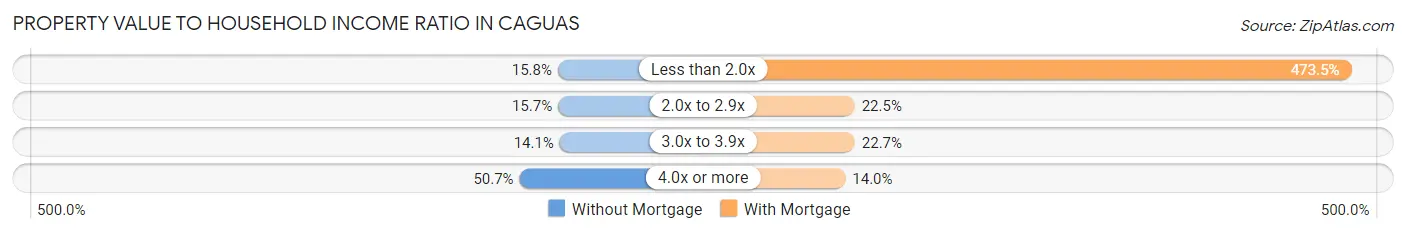
| Value-to-Income Ratio | Without Mortgage | With Mortgage |
| Less than 2.0x | 1,535 (15.8%) | 41,795 (473.5%) |
| 2.0x to 2.9x | 1,523 (15.7%) | 1,988 (22.5%) |
| 3.0x to 3.9x | 1,370 (14.1%) | 1,999 (22.7%) |
| 4.0x or more | 4,926 (50.7%) | 1,236 (14.0%) |
| Total | 9,724 (100.0%) | 8,827 (100.0%) |
Real Estate Taxes by Mortgage Status in Caguas
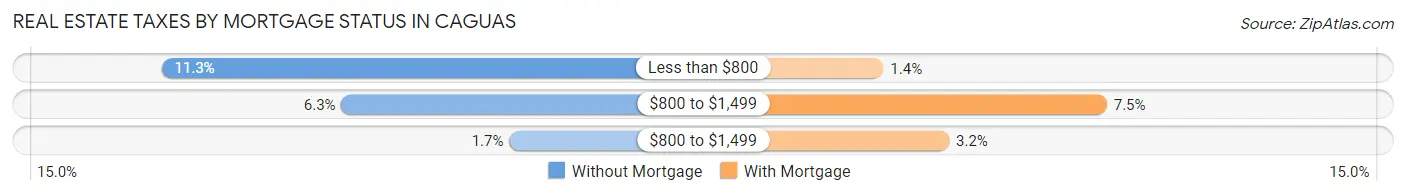
| Property Taxes | Without Mortgage | With Mortgage |
| Less than $800 | 1,094 (11.3%) | 122 (1.4%) |
| $800 to $1,499 | 615 (6.3%) | 662 (7.5%) |
| $800 to $1,499 | 167 (1.7%) | 281 (3.2%) |
| Total | 9,724 (100.0%) | 8,827 (100.0%) |
Health & Disability in Caguas
Health Insurance Coverage by Age in Caguas
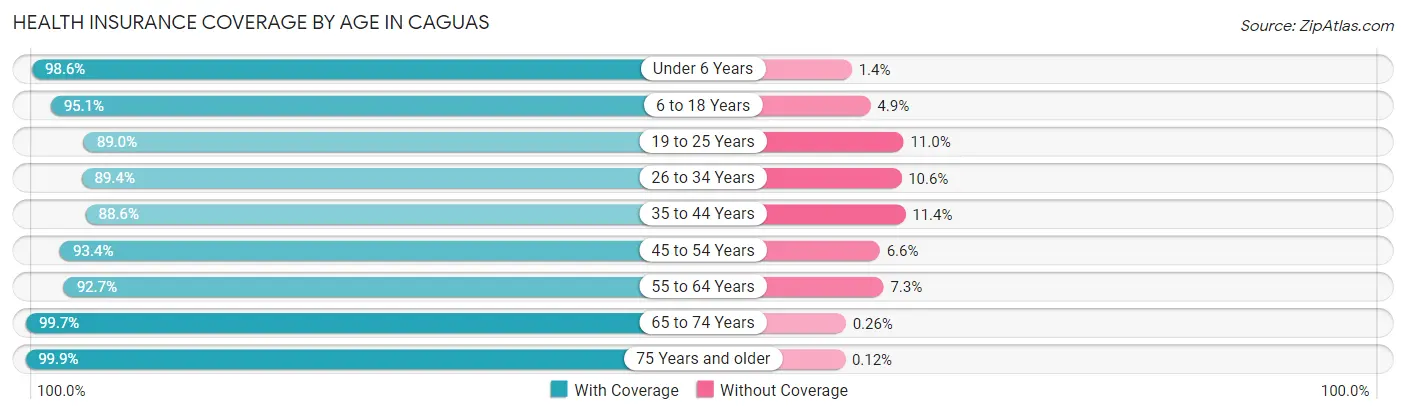
| Age Bracket | With Coverage | Without Coverage |
| Under 6 Years | 3,076 (98.6%) | 43 (1.4%) |
| 6 to 18 Years | 9,523 (95.1%) | 487 (4.9%) |
| 19 to 25 Years | 6,421 (89.0%) | 797 (11.0%) |
| 26 to 34 Years | 7,935 (89.4%) | 942 (10.6%) |
| 35 to 44 Years | 7,828 (88.6%) | 1,005 (11.4%) |
| 45 to 54 Years | 8,817 (93.4%) | 624 (6.6%) |
| 55 to 64 Years | 8,126 (92.7%) | 640 (7.3%) |
| 65 to 74 Years | 8,131 (99.7%) | 21 (0.3%) |
| 75 Years and older | 8,923 (99.9%) | 11 (0.1%) |
| Total | 68,780 (93.8%) | 4,570 (6.2%) |
Health Insurance Coverage by Citizenship Status in Caguas
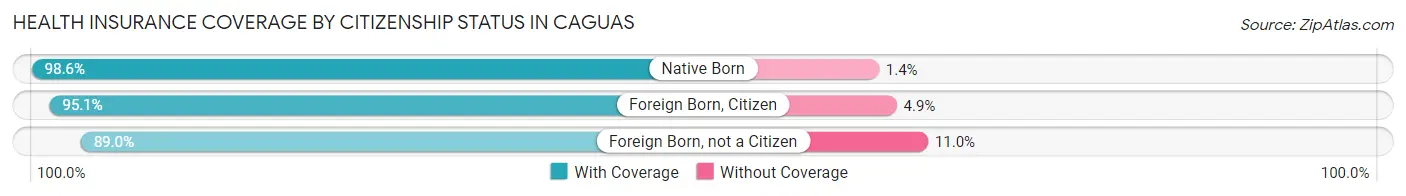
| Citizenship Status | With Coverage | Without Coverage |
| Native Born | 3,076 (98.6%) | 43 (1.4%) |
| Foreign Born, Citizen | 9,523 (95.1%) | 487 (4.9%) |
| Foreign Born, not a Citizen | 6,421 (89.0%) | 797 (11.0%) |
Health Insurance Coverage by Household Income in Caguas
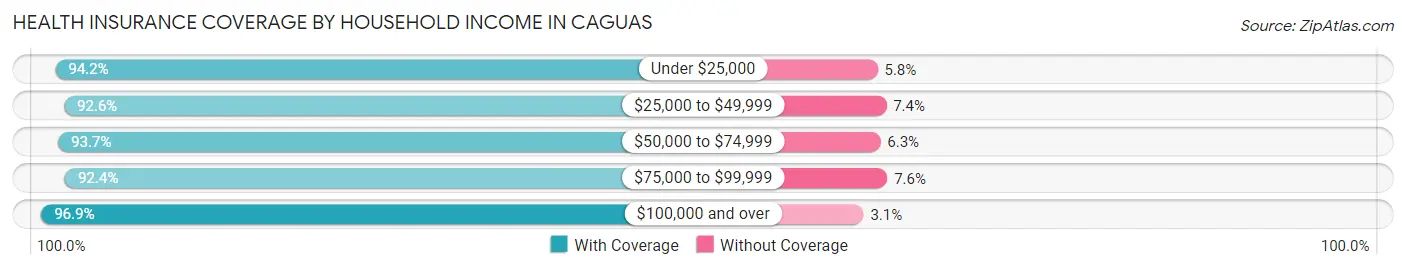
| Household Income | With Coverage | Without Coverage |
| Under $25,000 | 28,358 (94.2%) | 1,734 (5.8%) |
| $25,000 to $49,999 | 19,194 (92.6%) | 1,529 (7.4%) |
| $50,000 to $74,999 | 10,949 (93.7%) | 735 (6.3%) |
| $75,000 to $99,999 | 5,019 (92.4%) | 411 (7.6%) |
| $100,000 and over | 4,993 (96.9%) | 161 (3.1%) |
Public vs Private Health Insurance Coverage by Age in Caguas
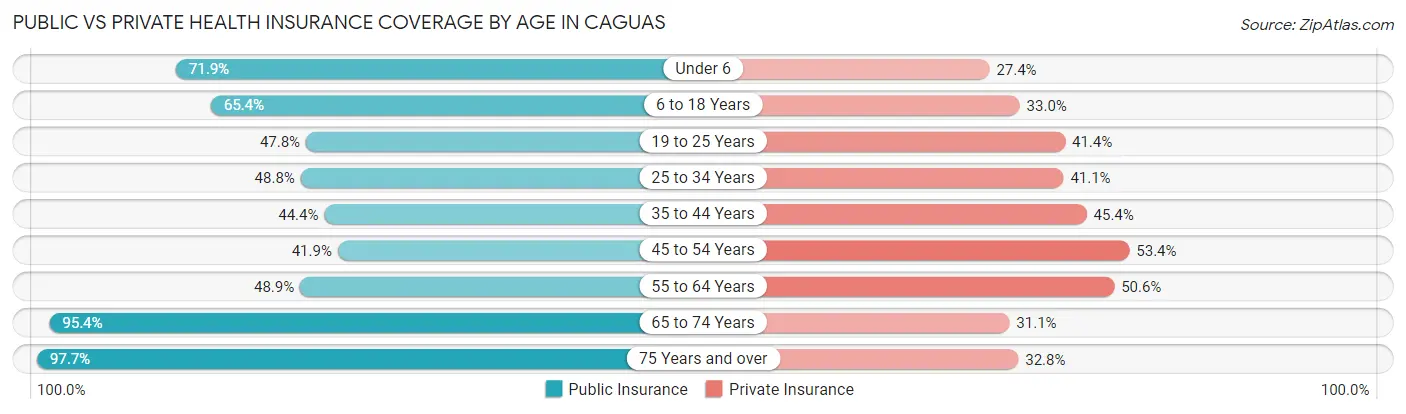
| Age Bracket | Public Insurance | Private Insurance |
| Under 6 | 2,243 (71.9%) | 855 (27.4%) |
| 6 to 18 Years | 6,550 (65.4%) | 3,304 (33.0%) |
| 19 to 25 Years | 3,449 (47.8%) | 2,991 (41.4%) |
| 25 to 34 Years | 4,328 (48.8%) | 3,652 (41.1%) |
| 35 to 44 Years | 3,919 (44.4%) | 4,014 (45.4%) |
| 45 to 54 Years | 3,954 (41.9%) | 5,040 (53.4%) |
| 55 to 64 Years | 4,284 (48.9%) | 4,432 (50.6%) |
| 65 to 74 Years | 7,777 (95.4%) | 2,536 (31.1%) |
| 75 Years and over | 8,729 (97.7%) | 2,927 (32.8%) |
| Total | 45,233 (61.7%) | 29,751 (40.6%) |
Disability Status by Sex by Age in Caguas
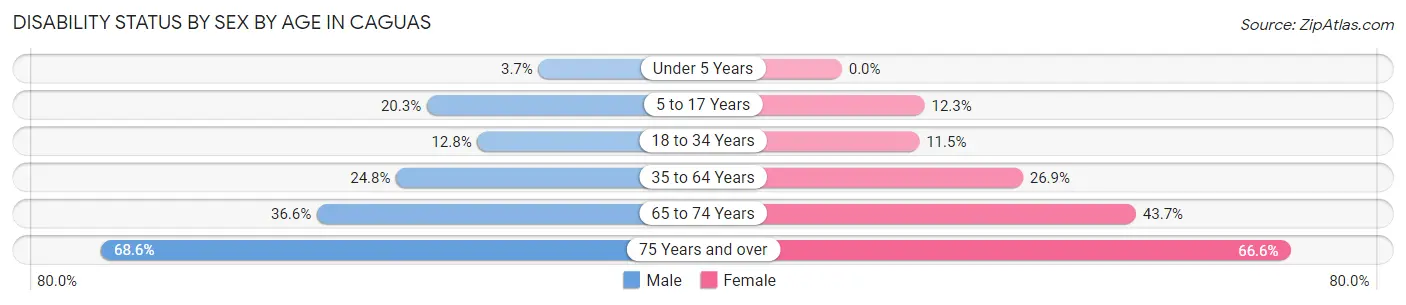
| Age Bracket | Male | Female |
| Under 5 Years | 46 (3.7%) | 0 (0.0%) |
| 5 to 17 Years | 1,042 (20.3%) | 565 (12.3%) |
| 18 to 34 Years | 1,040 (12.8%) | 1,029 (11.5%) |
| 35 to 64 Years | 3,046 (24.8%) | 3,967 (26.9%) |
| 65 to 74 Years | 1,123 (36.6%) | 2,219 (43.7%) |
| 75 Years and over | 2,097 (68.6%) | 3,915 (66.6%) |
Disability Class by Sex by Age in Caguas
Disability Class: Hearing Difficulty
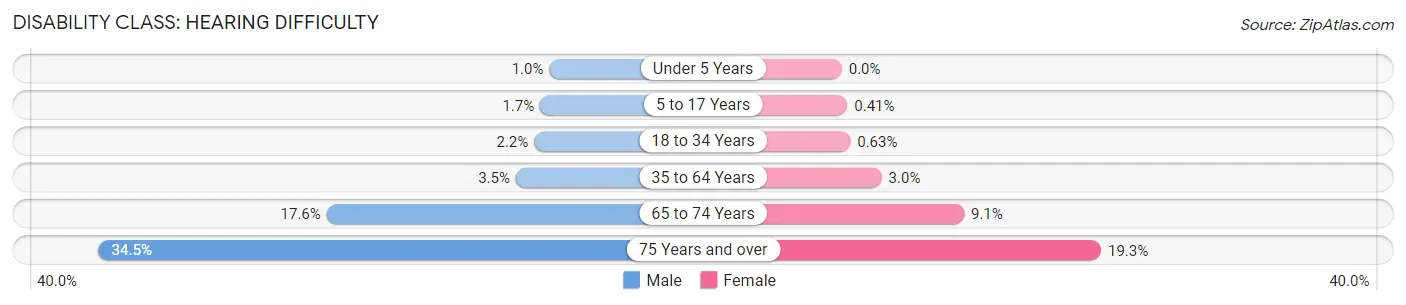
| Age Bracket | Male | Female |
| Under 5 Years | 13 (1.0%) | 0 (0.0%) |
| 5 to 17 Years | 89 (1.7%) | 19 (0.4%) |
| 18 to 34 Years | 177 (2.2%) | 56 (0.6%) |
| 35 to 64 Years | 434 (3.5%) | 437 (3.0%) |
| 65 to 74 Years | 540 (17.6%) | 461 (9.1%) |
| 75 Years and over | 1,054 (34.5%) | 1,132 (19.3%) |
Disability Class: Vision Difficulty
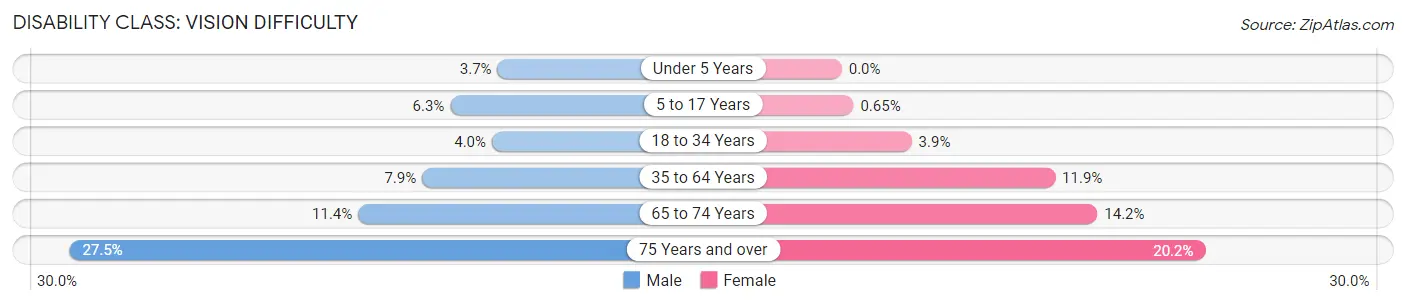
| Age Bracket | Male | Female |
| Under 5 Years | 46 (3.7%) | 0 (0.0%) |
| 5 to 17 Years | 324 (6.3%) | 30 (0.6%) |
| 18 to 34 Years | 325 (4.0%) | 348 (3.9%) |
| 35 to 64 Years | 966 (7.9%) | 1,753 (11.9%) |
| 65 to 74 Years | 351 (11.4%) | 723 (14.2%) |
| 75 Years and over | 840 (27.5%) | 1,190 (20.2%) |
Disability Class: Cognitive Difficulty
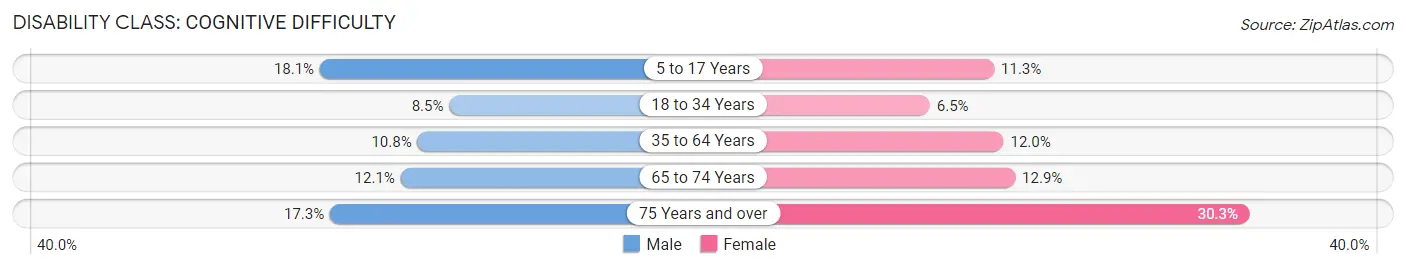
| Age Bracket | Male | Female |
| 5 to 17 Years | 930 (18.1%) | 520 (11.3%) |
| 18 to 34 Years | 691 (8.5%) | 585 (6.5%) |
| 35 to 64 Years | 1,330 (10.8%) | 1,772 (12.0%) |
| 65 to 74 Years | 371 (12.1%) | 654 (12.9%) |
| 75 Years and over | 529 (17.3%) | 1,781 (30.3%) |
Disability Class: Ambulatory Difficulty
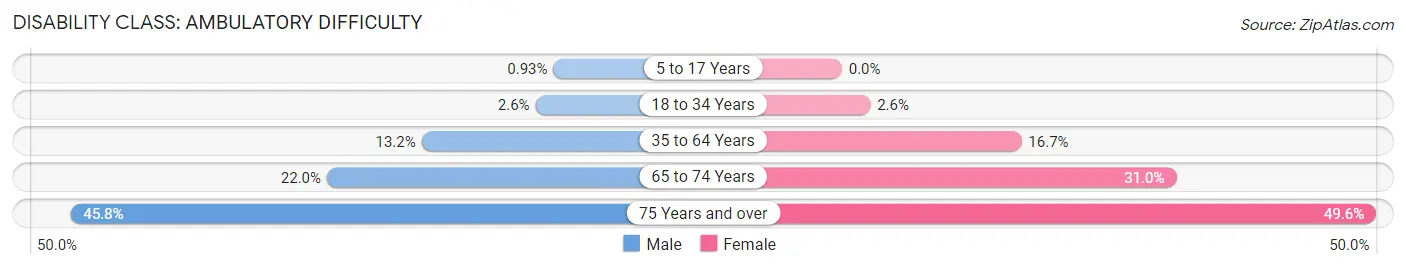
| Age Bracket | Male | Female |
| 5 to 17 Years | 48 (0.9%) | 0 (0.0%) |
| 18 to 34 Years | 211 (2.6%) | 236 (2.6%) |
| 35 to 64 Years | 1,616 (13.2%) | 2,461 (16.7%) |
| 65 to 74 Years | 674 (22.0%) | 1,577 (31.0%) |
| 75 Years and over | 1,398 (45.8%) | 2,915 (49.6%) |
Disability Class: Self-Care Difficulty
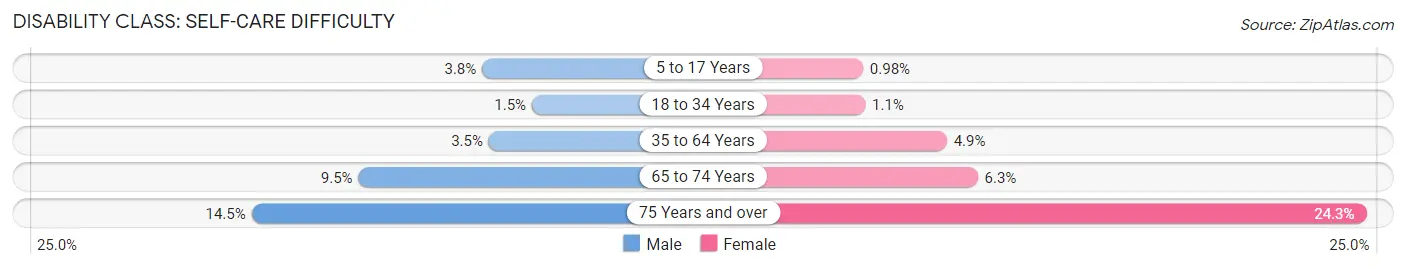
| Age Bracket | Male | Female |
| 5 to 17 Years | 194 (3.8%) | 45 (1.0%) |
| 18 to 34 Years | 119 (1.5%) | 97 (1.1%) |
| 35 to 64 Years | 425 (3.5%) | 719 (4.9%) |
| 65 to 74 Years | 292 (9.5%) | 320 (6.3%) |
| 75 Years and over | 442 (14.5%) | 1,431 (24.3%) |
Technology Access in Caguas
Computing Device Access in Caguas
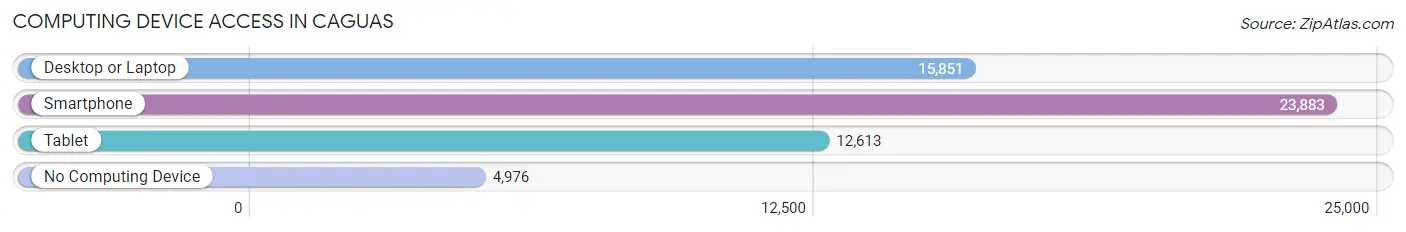
| Device Type | # Households | % Households |
| Desktop or Laptop | 15,851 | 52.2% |
| Smartphone | 23,883 | 78.6% |
| Tablet | 12,613 | 41.5% |
| No Computing Device | 4,976 | 16.4% |
| Total | 30,374 | 100.0% |
Internet Access in Caguas
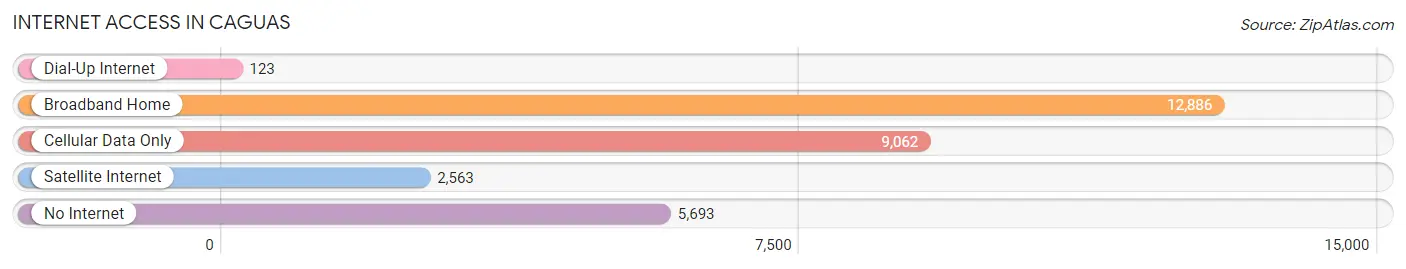
| Internet Type | # Households | % Households |
| Dial-Up Internet | 123 | 0.4% |
| Broadband Home | 12,886 | 42.4% |
| Cellular Data Only | 9,062 | 29.8% |
| Satellite Internet | 2,563 | 8.4% |
| No Internet | 5,693 | 18.7% |
| Total | 30,374 | 100.0% |
Caguas Summary
Caguas is a city located in the central mountain range of Puerto Rico, in the northeast of the island. It is the second largest city in Puerto Rico, with a population of approximately 140,000 people. It is located in the Caguas Valley, which is surrounded by the Cordillera Central mountain range. The city is known for its rich history, culture, and economy.
History
Caguas was founded in 1775 by Don Tomás de Abadía, a Spanish military officer. The city was named after the Caguax Indians, who were the original inhabitants of the area. The city was originally a small agricultural village, but it quickly grew in size and importance. In 1809, Caguas was declared a city by the Spanish government.
During the 19th century, Caguas was an important center of commerce and industry. It was home to several factories, including a sugar mill, a tobacco factory, and a textile mill. The city was also an important center of education, with several schools and universities.
In 1898, Caguas was occupied by the United States during the Spanish-American War. After the war, the city experienced a period of economic growth and development. In the early 20th century, Caguas was an important center of the Puerto Rican independence movement.
Geography
Caguas is located in the Caguas Valley, which is surrounded by the Cordillera Central mountain range. The city is located at an elevation of 1,000 feet (305 meters) above sea level. The climate in Caguas is tropical, with temperatures ranging from 70 to 90 degrees Fahrenheit (21 to 32 degrees Celsius).
The city is divided into several neighborhoods, including El Centro, El Carmen, El Cidral, El Coto, El Cumbre, El Pueblo, El Valle, and El Vigía. The city is also home to several parks, including Parque de los Niños, Parque de los Veteranos, and Parque de la Libertad.
Economy
Caguas is an important center of commerce and industry in Puerto Rico. The city is home to several factories, including a sugar mill, a tobacco factory, and a textile mill. The city is also home to several banks, insurance companies, and other financial institutions.
The city is also home to several shopping centers, including Plaza del Sol, Plaza Caguas, and Plaza Las Américas. The city is also home to several universities, including the University of Puerto Rico at Caguas, the Interamerican University of Puerto Rico, and the University of Turabo.
Demographics
As of the 2010 census, Caguas had a population of 140,000 people. The city is predominantly Hispanic, with a large population of Puerto Ricans. The city is also home to a large population of African-Americans, as well as a small population of other ethnic groups.
The median household income in Caguas is $20,000, and the median age is 33 years. The city has a high rate of poverty, with approximately 40% of the population living below the poverty line. The city also has a high rate of unemployment, with approximately 15% of the population unemployed.
Common Questions
What is Per Capita Income in Caguas?
Per Capita income in Caguas is $15,916.
What is the Median Family Income in Caguas?
Median Family Income in Caguas is $31,427.
What is the Median Household income in Caguas?
Median Household Income in Caguas is $25,934.
What is Income or Wage Gap in Caguas?
Income or Wage Gap in Caguas is 6.5%.
Women in Caguas earn 93.5 cents for every dollar earned by a man.
What is Family Income Deficit in Caguas?
Family Income Deficit in Caguas is $11,236.
Families that are below poverty line in Caguas earn $11,236 less on average than the poverty threshold level.
What is Inequality or Gini Index in Caguas?
Inequality or Gini Index in Caguas is 0.49.
What is the Total Population of Caguas?
Total Population of Caguas is 73,713.
What is the Total Male Population of Caguas?
Total Male Population of Caguas is 33,129.
What is the Total Female Population of Caguas?
Total Female Population of Caguas is 40,584.
What is the Ratio of Males per 100 Females in Caguas?
There are 81.63 Males per 100 Females in Caguas.
What is the Ratio of Females per 100 Males in Caguas?
There are 122.50 Females per 100 Males in Caguas.
What is the Median Population Age in Caguas?
Median Population Age in Caguas is 43.5 Years.
What is the Average Family Size in Caguas
Average Family Size in Caguas is 3.1 People.
What is the Average Household Size in Caguas
Average Household Size in Caguas is 2.4 People.
How Large is the Labor Force in Caguas?
There are 30,716 People in the Labor Forcein in Caguas.
What is the Percentage of People in the Labor Force in Caguas?
48.6% of People are in the Labor Force in Caguas.
What is the Unemployment Rate in Caguas?
Unemployment Rate in Caguas is 11.7%.