Punta Santiago, PR Map & Demographics
Punta Santiago Map
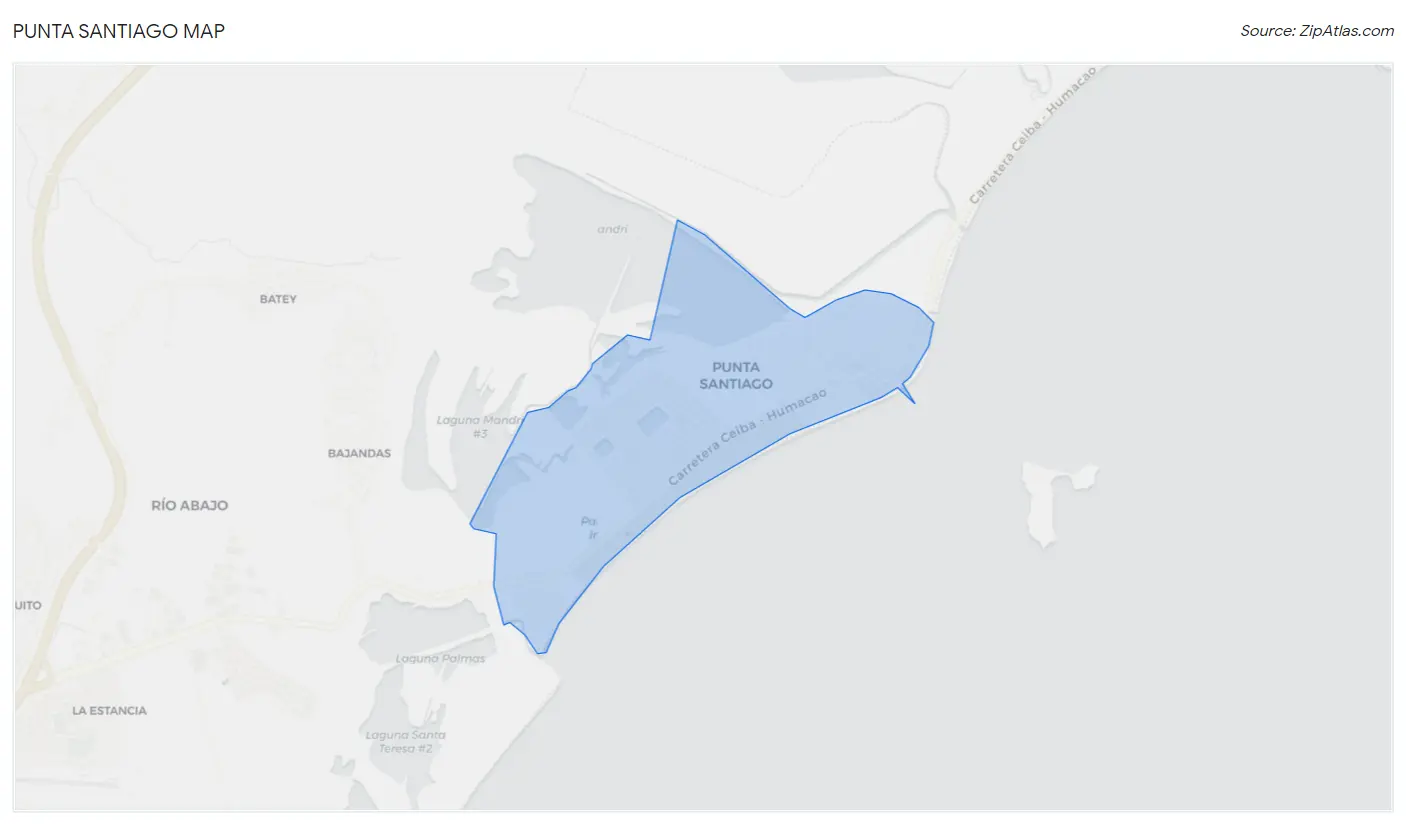
Punta Santiago Overview
$13,362
PER CAPITA INCOME
$28,810
AVG FAMILY INCOME
$23,821
AVG HOUSEHOLD INCOME
15.5%
WAGE / INCOME GAP [ % ]
84.5¢/ $1
WAGE / INCOME GAP [ $ ]
0.39
INEQUALITY / GINI INDEX
3,627
TOTAL POPULATION
1,615
MALE POPULATION
2,012
FEMALE POPULATION
80.27
MALES / 100 FEMALES
124.58
FEMALES / 100 MALES
47.1
MEDIAN AGE
3.2
AVG FAMILY SIZE
2.7
AVG HOUSEHOLD SIZE
1,227
LABOR FORCE [ PEOPLE ]
39.8%
PERCENT IN LABOR FORCE
10.4%
UNEMPLOYMENT RATE
Punta Santiago Zip Codes
Income in Punta Santiago
Income Overview in Punta Santiago
Per Capita Income in Punta Santiago is $13,362, while median incomes of families and households are $28,810 and $23,821 respectively.
| Characteristic | Number | Measure |
| Per Capita Income | 3,627 | $13,362 |
| Median Family Income | 930 | $28,810 |
| Mean Family Income | 930 | $33,440 |
| Median Household Income | 1,338 | $23,821 |
| Mean Household Income | 1,338 | $30,941 |
| Income Deficit | 930 | $0 |
| Wage / Income Gap (%) | 3,627 | 15.53% |
| Wage / Income Gap ($) | 3,627 | 84.47¢ per $1 |
| Gini / Inequality Index | 3,627 | 0.39 |
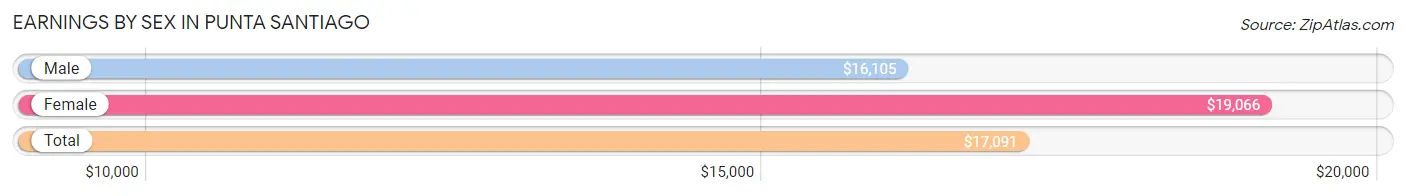
Earnings by Sex in Punta Santiago
Average Earnings in Punta Santiago are $17,091, $16,105 for men and $19,066 for women, a difference of 15.5%.
| Sex | Number | Average Earnings |
| Male | 704 (57.7%) | $16,105 |
| Female | 517 (42.3%) | $19,066 |
| Total | 1,221 (100.0%) | $17,091 |
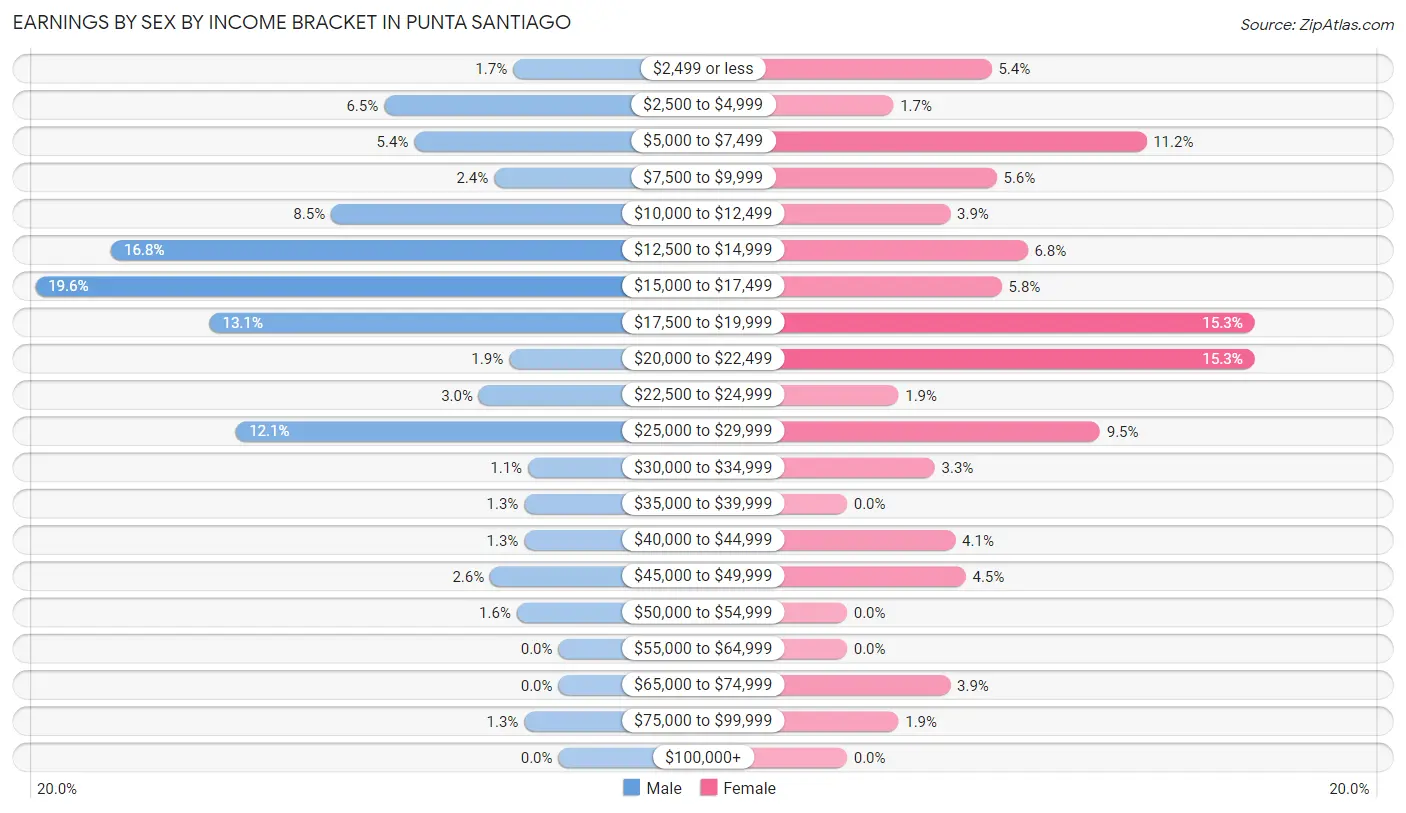
Earnings by Sex by Income Bracket in Punta Santiago
The most common earnings brackets in Punta Santiago are $15,000 to $17,499 for men (138 | 19.6%) and $17,500 to $19,999 for women (79 | 15.3%).
| Income | Male | Female |
| $2,499 or less | 12 (1.7%) | 28 (5.4%) |
| $2,500 to $4,999 | 46 (6.5%) | 9 (1.7%) |
| $5,000 to $7,499 | 38 (5.4%) | 58 (11.2%) |
| $7,500 to $9,999 | 17 (2.4%) | 29 (5.6%) |
| $10,000 to $12,499 | 60 (8.5%) | 20 (3.9%) |
| $12,500 to $14,999 | 118 (16.8%) | 35 (6.8%) |
| $15,000 to $17,499 | 138 (19.6%) | 30 (5.8%) |
| $17,500 to $19,999 | 92 (13.1%) | 79 (15.3%) |
| $20,000 to $22,499 | 13 (1.8%) | 79 (15.3%) |
| $22,500 to $24,999 | 21 (3.0%) | 10 (1.9%) |
| $25,000 to $29,999 | 85 (12.1%) | 49 (9.5%) |
| $30,000 to $34,999 | 8 (1.1%) | 17 (3.3%) |
| $35,000 to $39,999 | 9 (1.3%) | 0 (0.0%) |
| $40,000 to $44,999 | 9 (1.3%) | 21 (4.1%) |
| $45,000 to $49,999 | 18 (2.6%) | 23 (4.4%) |
| $50,000 to $54,999 | 11 (1.6%) | 0 (0.0%) |
| $55,000 to $64,999 | 0 (0.0%) | 0 (0.0%) |
| $65,000 to $74,999 | 0 (0.0%) | 20 (3.9%) |
| $75,000 to $99,999 | 9 (1.3%) | 10 (1.9%) |
| $100,000+ | 0 (0.0%) | 0 (0.0%) |
| Total | 704 (100.0%) | 517 (100.0%) |
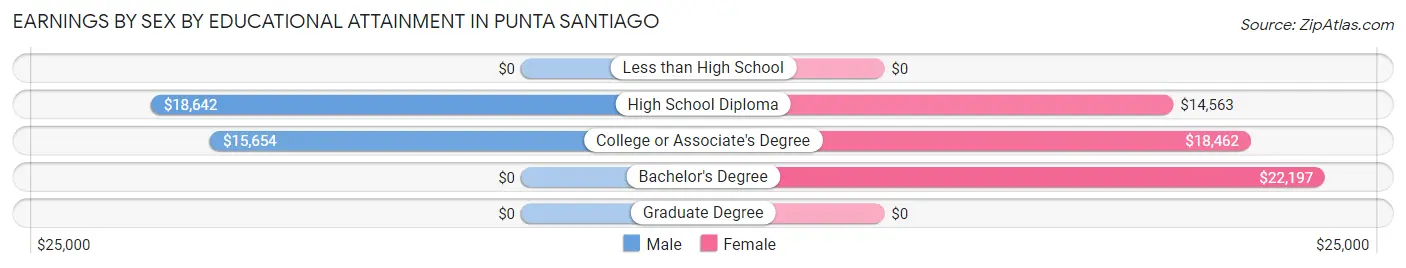
Earnings by Sex by Educational Attainment in Punta Santiago
Average earnings in Punta Santiago are $16,268 for men and $19,351 for women, a difference of 15.9%. Men with an educational attainment of high school diploma enjoy the highest average annual earnings of $18,642, while those with college or associate's degree education earn the least with $15,654. Women with an educational attainment of bachelor's degree earn the most with the average annual earnings of $22,197, while those with high school diploma education have the smallest earnings of $14,563.
| Educational Attainment | Male Income | Female Income |
| Less than High School | - | - |
| High School Diploma | $18,642 | $14,563 |
| College or Associate's Degree | $15,654 | $18,462 |
| Bachelor's Degree | - | - |
| Graduate Degree | - | - |
| Total | $16,268 | $19,351 |
Family Income in Punta Santiago
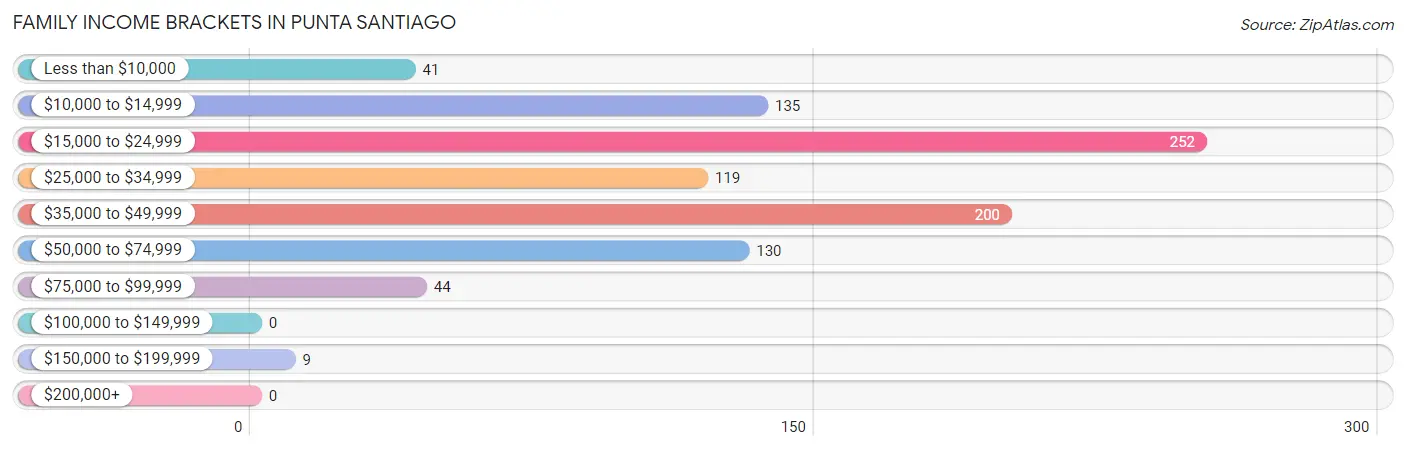
Family Income Brackets in Punta Santiago
According to the Punta Santiago family income data, there are 252 families falling into the $15,000 to $24,999 income range, which is the most common income bracket and makes up 27.1% of all families.
| Income Bracket | # Families | % Families |
| Less than $10,000 | 41 | 4.4% |
| $10,000 to $14,999 | 135 | 14.5% |
| $15,000 to $24,999 | 252 | 27.1% |
| $25,000 to $34,999 | 119 | 12.8% |
| $35,000 to $49,999 | 200 | 21.5% |
| $50,000 to $74,999 | 130 | 14.0% |
| $75,000 to $99,999 | 44 | 4.7% |
| $100,000 to $149,999 | 0 | 0.0% |
| $150,000 to $199,999 | 9 | 1.0% |
| $200,000+ | 0 | 0.0% |
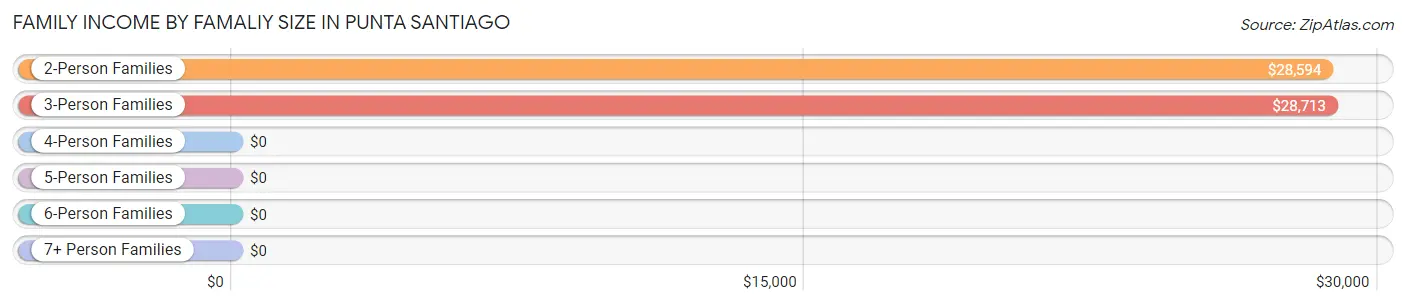
Family Income by Famaliy Size in Punta Santiago
3-person families (209 | 22.5%) account for the highest median family income in Punta Santiago with $28,713 per family, while 2-person families (605 | 65.0%) have the highest median income of $14,297 per family member.
| Income Bracket | # Families | Median Income |
| 2-Person Families | 605 (65.0%) | $28,594 |
| 3-Person Families | 209 (22.5%) | $28,713 |
| 4-Person Families | 50 (5.4%) | $0 |
| 5-Person Families | 30 (3.2%) | $0 |
| 6-Person Families | 15 (1.6%) | $0 |
| 7+ Person Families | 21 (2.3%) | $0 |
| Total | 930 (100.0%) | $28,810 |
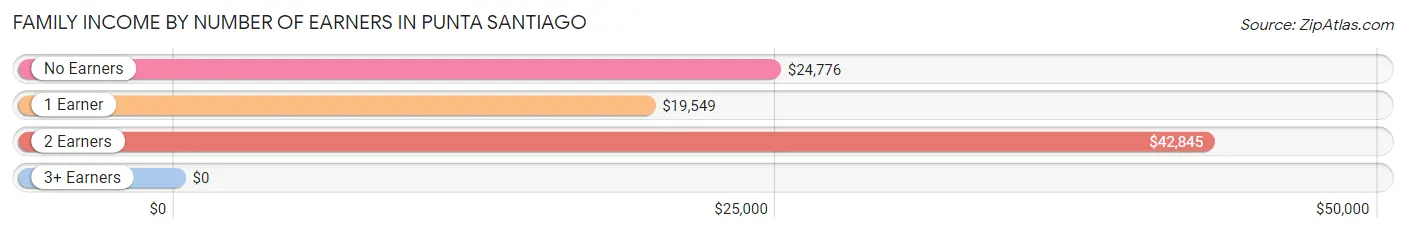
Family Income by Number of Earners in Punta Santiago
| Number of Earners | # Families | Median Income |
| No Earners | 403 (43.3%) | $24,776 |
| 1 Earner | 266 (28.6%) | $19,549 |
| 2 Earners | 238 (25.6%) | $42,845 |
| 3+ Earners | 23 (2.5%) | $0 |
| Total | 930 (100.0%) | $28,810 |
Household Income in Punta Santiago
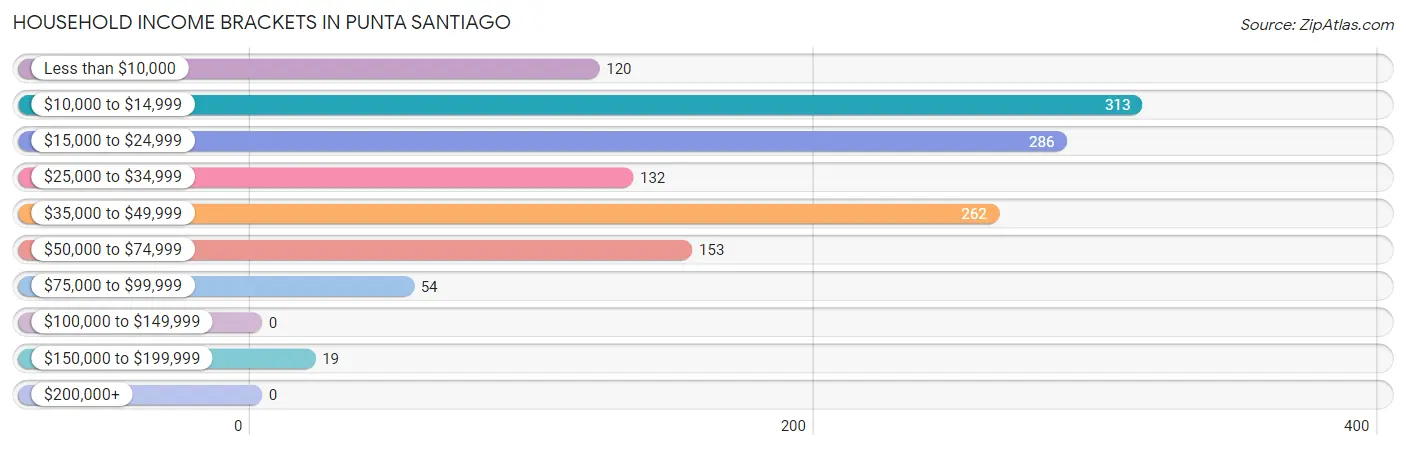
Household Income Brackets in Punta Santiago
With 313 households falling in the category, the $10,000 to $14,999 income range is the most frequent in Punta Santiago, accounting for 23.4% of all households.
| Income Bracket | # Households | % Households |
| Less than $10,000 | 120 | 9.0% |
| $10,000 to $14,999 | 313 | 23.4% |
| $15,000 to $24,999 | 286 | 21.4% |
| $25,000 to $34,999 | 132 | 9.9% |
| $35,000 to $49,999 | 262 | 19.6% |
| $50,000 to $74,999 | 153 | 11.4% |
| $75,000 to $99,999 | 54 | 4.0% |
| $100,000 to $149,999 | 0 | 0.0% |
| $150,000 to $199,999 | 19 | 1.4% |
| $200,000+ | 0 | 0.0% |
Household Income by Householder Age in Punta Santiago
The median household income in Punta Santiago is $23,821, with the highest median household income of $25,417 found in the 45 to 64 years age bracket for the primary householder. A total of 619 households (46.3%) fall into this category. Meanwhile, the 15 to 24 years age bracket for the primary householder has the lowest median household income of $0, with 10 households (0.7%) in this group.
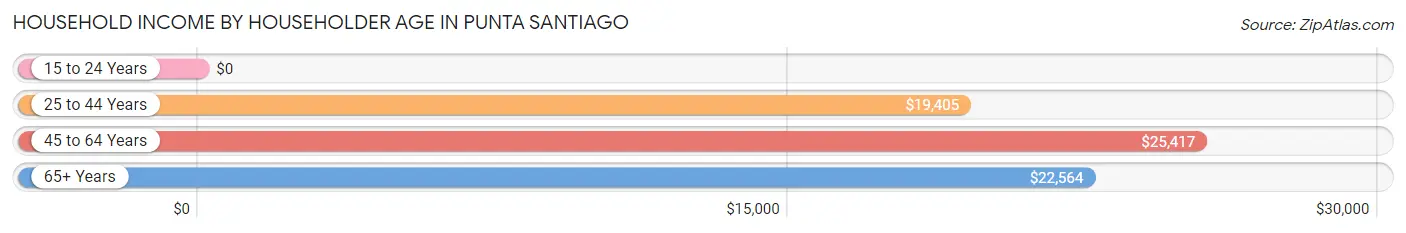
| Income Bracket | # Households | Median Income |
| 15 to 24 Years | 10 (0.7%) | $0 |
| 25 to 44 Years | 229 (17.1%) | $19,405 |
| 45 to 64 Years | 619 (46.3%) | $25,417 |
| 65+ Years | 480 (35.9%) | $22,564 |
| Total | 1,338 (100.0%) | $23,821 |
Poverty in Punta Santiago
Income Below Poverty by Sex and Age in Punta Santiago
With 47.8% poverty level for males and 51.6% for females among the residents of Punta Santiago, under 5 year old males and under 5 year old females are the most vulnerable to poverty, with 96 males (100.0%) and 162 females (91.5%) in their respective age groups living below the poverty level.
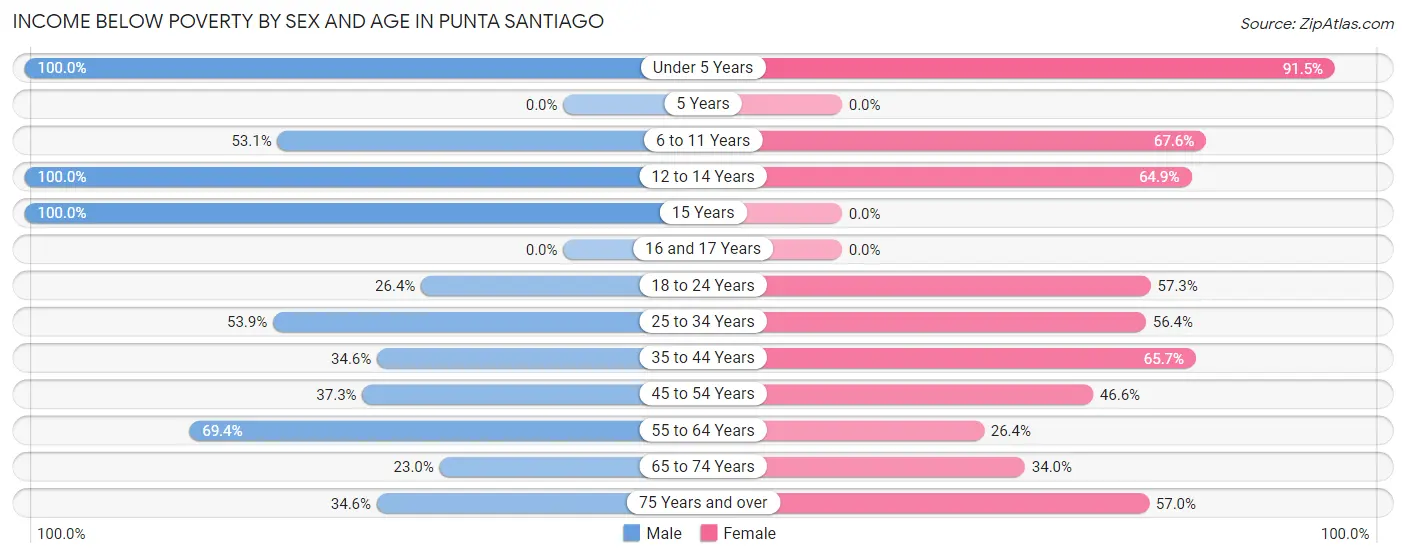
| Age Bracket | Male | Female |
| Under 5 Years | 96 (100.0%) | 162 (91.5%) |
| 5 Years | 0 (0.0%) | 0 (0.0%) |
| 6 to 11 Years | 26 (53.1%) | 48 (67.6%) |
| 12 to 14 Years | 42 (100.0%) | 48 (64.9%) |
| 15 Years | 36 (100.0%) | 0 (0.0%) |
| 16 and 17 Years | 0 (0.0%) | 0 (0.0%) |
| 18 to 24 Years | 57 (26.4%) | 47 (57.3%) |
| 25 to 34 Years | 139 (53.9%) | 136 (56.4%) |
| 35 to 44 Years | 65 (34.6%) | 138 (65.7%) |
| 45 to 54 Years | 91 (37.3%) | 103 (46.6%) |
| 55 to 64 Years | 134 (69.4%) | 93 (26.4%) |
| 65 to 74 Years | 34 (23.0%) | 87 (34.0%) |
| 75 Years and over | 45 (34.6%) | 175 (57.0%) |
| Total | 765 (47.8%) | 1,037 (51.6%) |
Income Above Poverty by Sex and Age in Punta Santiago
According to the poverty statistics in Punta Santiago, males aged 65 to 74 years and females aged 16 and 17 years are the age groups that are most secure financially, with 77.0% of males and 100.0% of females in these age groups living above the poverty line.
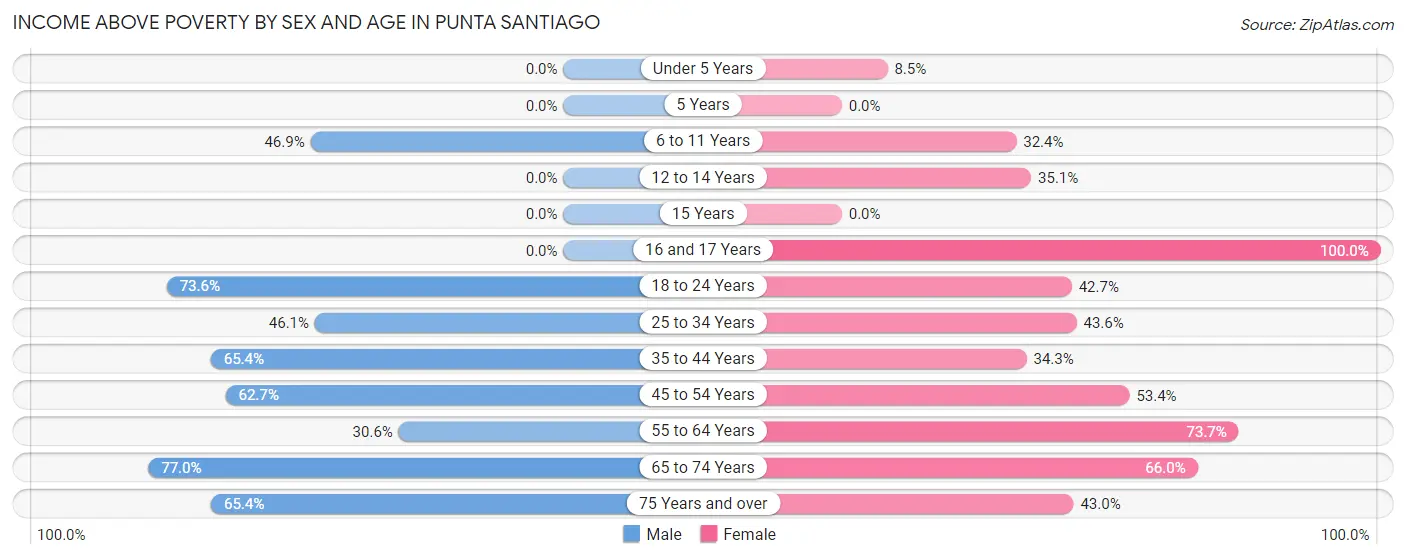
| Age Bracket | Male | Female |
| Under 5 Years | 0 (0.0%) | 15 (8.5%) |
| 5 Years | 0 (0.0%) | 0 (0.0%) |
| 6 to 11 Years | 23 (46.9%) | 23 (32.4%) |
| 12 to 14 Years | 0 (0.0%) | 26 (35.1%) |
| 15 Years | 0 (0.0%) | 0 (0.0%) |
| 16 and 17 Years | 0 (0.0%) | 17 (100.0%) |
| 18 to 24 Years | 159 (73.6%) | 35 (42.7%) |
| 25 to 34 Years | 119 (46.1%) | 105 (43.6%) |
| 35 to 44 Years | 123 (65.4%) | 72 (34.3%) |
| 45 to 54 Years | 153 (62.7%) | 118 (53.4%) |
| 55 to 64 Years | 59 (30.6%) | 260 (73.7%) |
| 65 to 74 Years | 114 (77.0%) | 169 (66.0%) |
| 75 Years and over | 85 (65.4%) | 132 (43.0%) |
| Total | 835 (52.2%) | 972 (48.4%) |
Income Below Poverty Among Married-Couple Families in Punta Santiago
The poverty statistics for married-couple families in Punta Santiago show that 35.4% or 197 of the total 556 families live below the poverty line. Families with 3 or 4 children have the highest poverty rate of 100.0%, comprising of 20 families. On the other hand, families with no children have the lowest poverty rate of 30.0%, which includes 137 families.
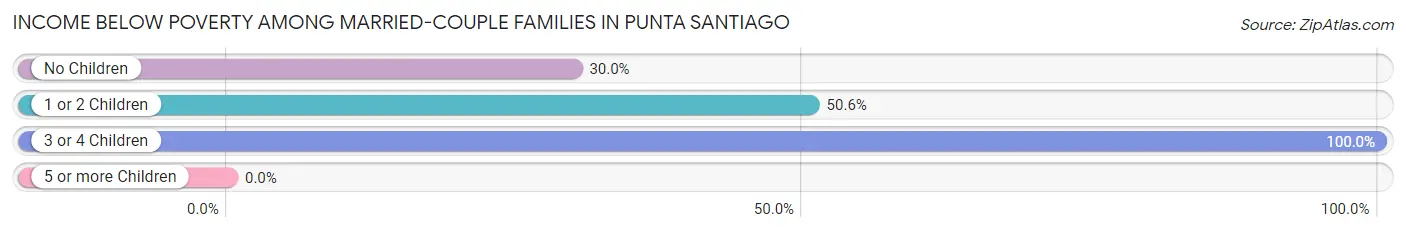
| Children | Above Poverty | Below Poverty |
| No Children | 320 (70.0%) | 137 (30.0%) |
| 1 or 2 Children | 39 (49.4%) | 40 (50.6%) |
| 3 or 4 Children | 0 (0.0%) | 20 (100.0%) |
| 5 or more Children | 0 (0.0%) | 0 (0.0%) |
| Total | 359 (64.6%) | 197 (35.4%) |
Income Below Poverty Among Single-Parent Households in Punta Santiago
According to the poverty data in Punta Santiago, 70.7% or 29 single-father households and 48.0% or 160 single-mother households are living below the poverty line. Among single-father households, those with no children have the highest poverty rate, with 12 households (100.0%) experiencing poverty. Likewise, among single-mother households, those with 5 or more children have the highest poverty rate, with 21 households (100.0%) falling below the poverty line.
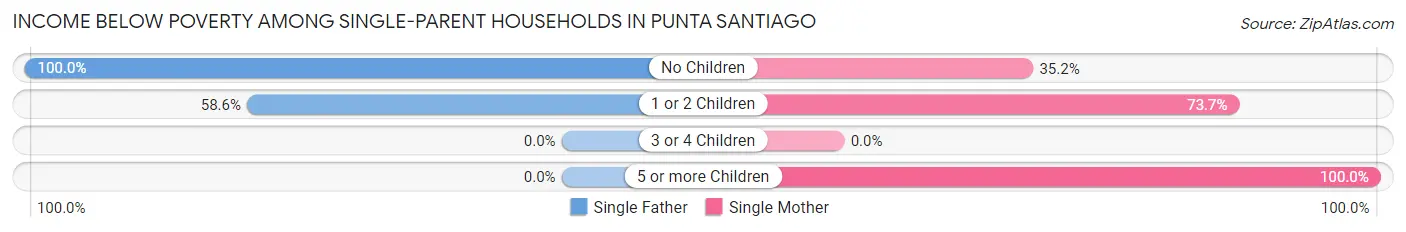
| Children | Single Father | Single Mother |
| No Children | 12 (100.0%) | 83 (35.2%) |
| 1 or 2 Children | 17 (58.6%) | 56 (73.7%) |
| 3 or 4 Children | 0 (0.0%) | 0 (0.0%) |
| 5 or more Children | 0 (0.0%) | 21 (100.0%) |
| Total | 29 (70.7%) | 160 (48.0%) |
Income Below Poverty Among Married-Couple vs Single-Parent Households in Punta Santiago
The poverty data for Punta Santiago shows that 197 of the married-couple family households (35.4%) and 189 of the single-parent households (50.5%) are living below the poverty level. Within the married-couple family households, those with 3 or 4 children have the highest poverty rate, with 20 households (100.0%) falling below the poverty line. Among the single-parent households, those with 5 or more children have the highest poverty rate, with 21 household (100.0%) living below poverty.
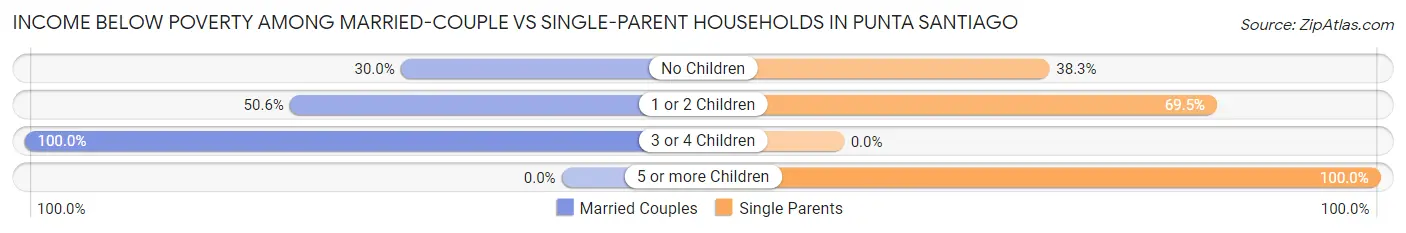
| Children | Married-Couple Families | Single-Parent Households |
| No Children | 137 (30.0%) | 95 (38.3%) |
| 1 or 2 Children | 40 (50.6%) | 73 (69.5%) |
| 3 or 4 Children | 20 (100.0%) | 0 (0.0%) |
| 5 or more Children | 0 (0.0%) | 21 (100.0%) |
| Total | 197 (35.4%) | 189 (50.5%) |
Race in Punta Santiago
The most populous races in Punta Santiago are Hispanic or Latino (3,609 | 99.5%), Some other Race (2,401 | 66.2%), and White / Caucasian (662 | 18.2%).
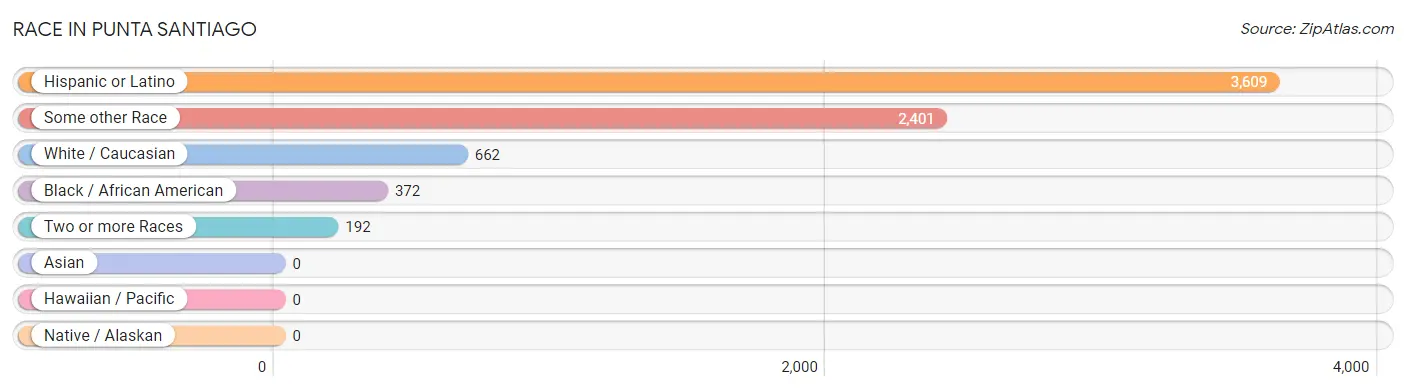
| Race | # Population | % Population |
| Asian | 0 | 0.0% |
| Black / African American | 372 | 10.3% |
| Hawaiian / Pacific | 0 | 0.0% |
| Hispanic or Latino | 3,609 | 99.5% |
| Native / Alaskan | 0 | 0.0% |
| White / Caucasian | 662 | 18.2% |
| Two or more Races | 192 | 5.3% |
| Some other Race | 2,401 | 66.2% |
| Total | 3,627 | 100.0% |
Ancestry in Punta Santiago
The most populous ancestries reported in Punta Santiago are Puerto Rican (3,557 | 98.1%), American (120 | 3.3%), Spaniard (12 | 0.3%), African (9 | 0.3%), and Dominican (9 | 0.3%), together accounting for 102.2% of all Punta Santiago residents.
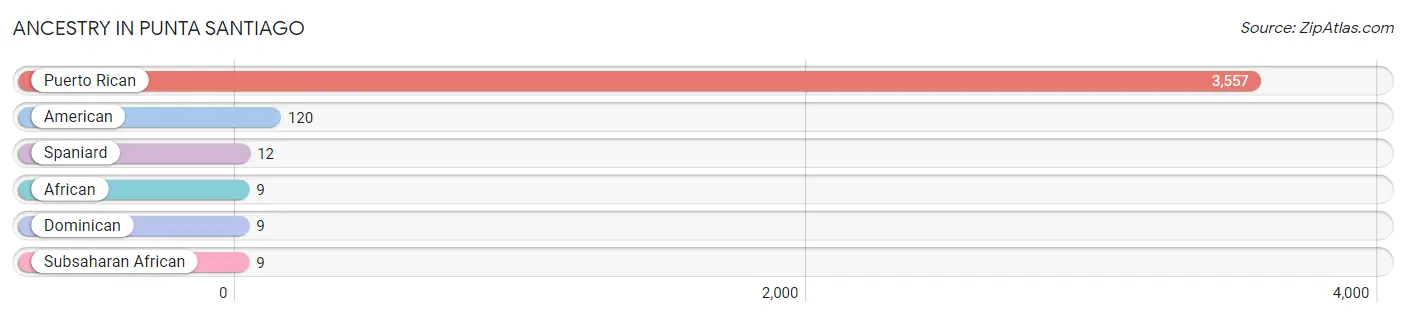
| Ancestry | # Population | % Population |
| African | 9 | 0.3% |
| American | 120 | 3.3% |
| Dominican | 9 | 0.3% |
| Puerto Rican | 3,557 | 98.1% |
| Spaniard | 12 | 0.3% |
| Subsaharan African | 9 | 0.3% | View All 6 Rows |
Immigrants in Punta Santiago

| Immigration Origin | # Population | % Population | View All 0 Rows |
Sex and Age in Punta Santiago
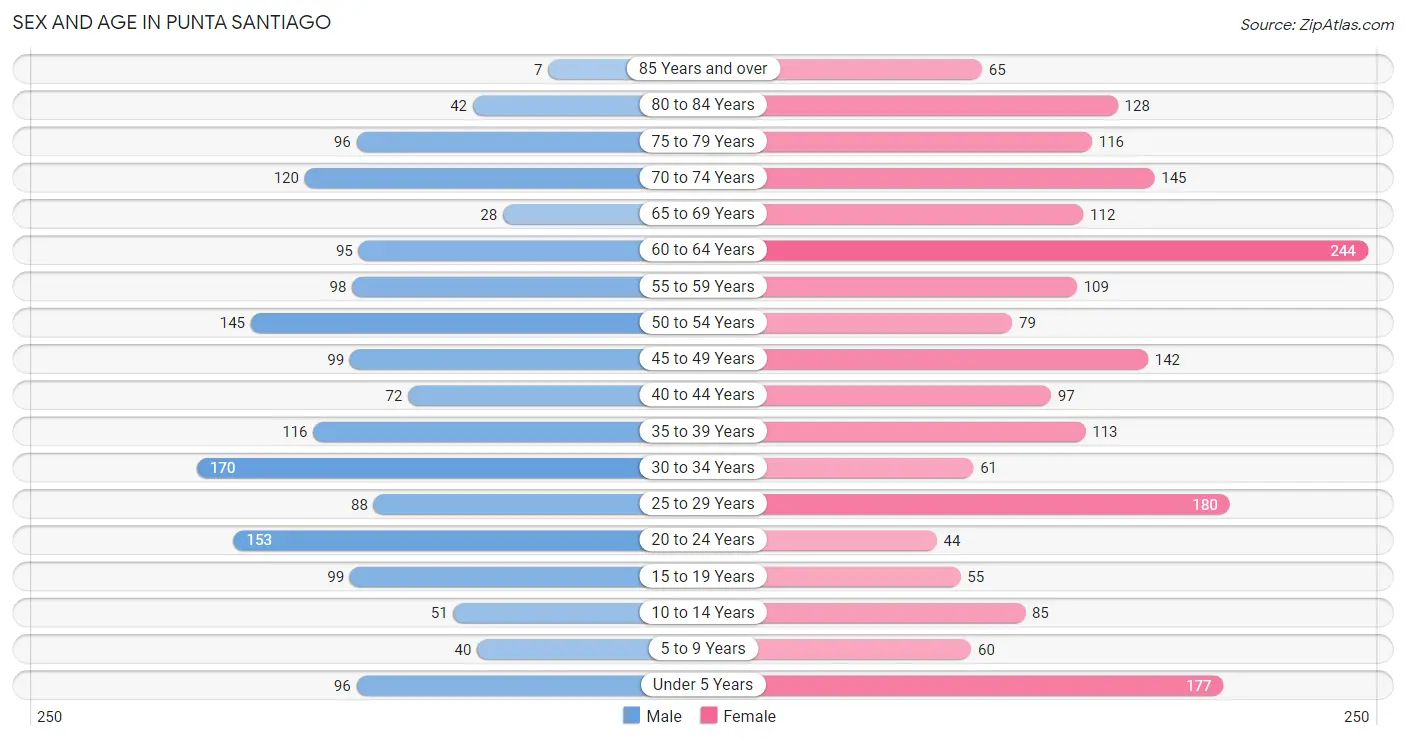
Sex and Age in Punta Santiago
The most populous age groups in Punta Santiago are 30 to 34 Years (170 | 10.5%) for men and 60 to 64 Years (244 | 12.1%) for women.
| Age Bracket | Male | Female |
| Under 5 Years | 96 (5.9%) | 177 (8.8%) |
| 5 to 9 Years | 40 (2.5%) | 60 (3.0%) |
| 10 to 14 Years | 51 (3.2%) | 85 (4.2%) |
| 15 to 19 Years | 99 (6.1%) | 55 (2.7%) |
| 20 to 24 Years | 153 (9.5%) | 44 (2.2%) |
| 25 to 29 Years | 88 (5.4%) | 180 (8.9%) |
| 30 to 34 Years | 170 (10.5%) | 61 (3.0%) |
| 35 to 39 Years | 116 (7.2%) | 113 (5.6%) |
| 40 to 44 Years | 72 (4.5%) | 97 (4.8%) |
| 45 to 49 Years | 99 (6.1%) | 142 (7.1%) |
| 50 to 54 Years | 145 (9.0%) | 79 (3.9%) |
| 55 to 59 Years | 98 (6.1%) | 109 (5.4%) |
| 60 to 64 Years | 95 (5.9%) | 244 (12.1%) |
| 65 to 69 Years | 28 (1.7%) | 112 (5.6%) |
| 70 to 74 Years | 120 (7.4%) | 145 (7.2%) |
| 75 to 79 Years | 96 (5.9%) | 116 (5.8%) |
| 80 to 84 Years | 42 (2.6%) | 128 (6.4%) |
| 85 Years and over | 7 (0.4%) | 65 (3.2%) |
| Total | 1,615 (100.0%) | 2,012 (100.0%) |
Families and Households in Punta Santiago
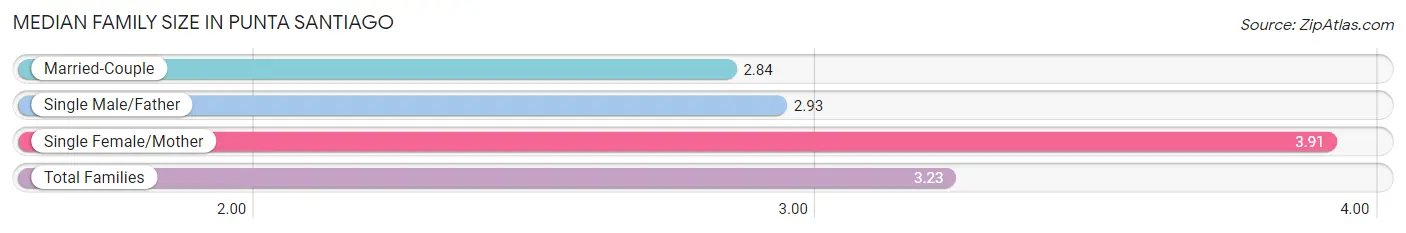
Median Family Size in Punta Santiago
The median family size in Punta Santiago is 3.23 persons per family, with single female/mother families (333 | 35.8%) accounting for the largest median family size of 3.91 persons per family. On the other hand, married-couple families (556 | 59.8%) represent the smallest median family size with 2.84 persons per family.
| Family Type | # Families | Family Size |
| Married-Couple | 556 (59.8%) | 2.84 |
| Single Male/Father | 41 (4.4%) | 2.93 |
| Single Female/Mother | 333 (35.8%) | 3.91 |
| Total Families | 930 (100.0%) | 3.23 |
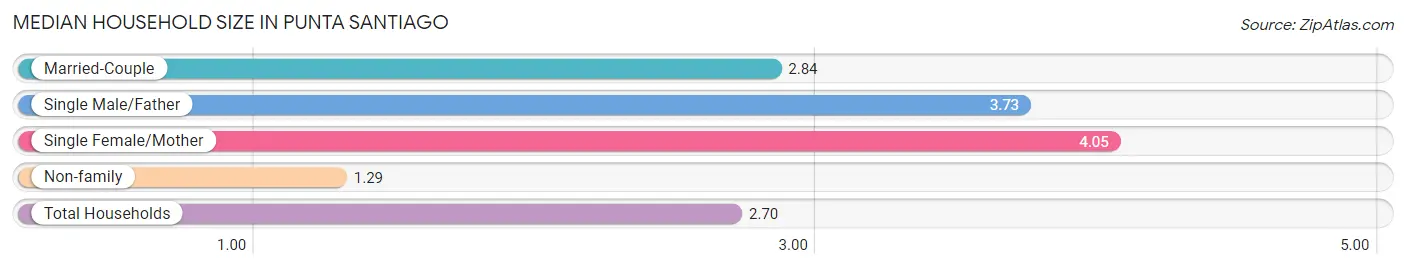
Median Household Size in Punta Santiago
The median household size in Punta Santiago is 2.70 persons per household, with single female/mother households (333 | 24.9%) accounting for the largest median household size of 4.05 persons per household. non-family households (408 | 30.5%) represent the smallest median household size with 1.29 persons per household.
| Household Type | # Households | Household Size |
| Married-Couple | 556 (41.5%) | 2.84 |
| Single Male/Father | 41 (3.1%) | 3.73 |
| Single Female/Mother | 333 (24.9%) | 4.05 |
| Non-family | 408 (30.5%) | 1.29 |
| Total Households | 1,338 (100.0%) | 2.70 |
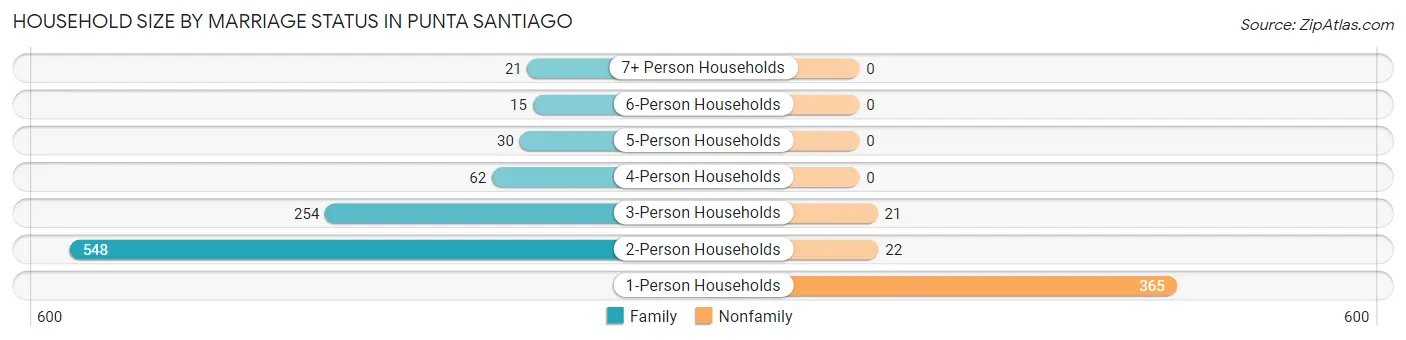
Household Size by Marriage Status in Punta Santiago
Out of a total of 1,338 households in Punta Santiago, 930 (69.5%) are family households, while 408 (30.5%) are nonfamily households. The most numerous type of family households are 2-person households, comprising 548, and the most common type of nonfamily households are 1-person households, comprising 365.
| Household Size | Family Households | Nonfamily Households |
| 1-Person Households | - | 365 (27.3%) |
| 2-Person Households | 548 (41.0%) | 22 (1.6%) |
| 3-Person Households | 254 (19.0%) | 21 (1.6%) |
| 4-Person Households | 62 (4.6%) | 0 (0.0%) |
| 5-Person Households | 30 (2.2%) | 0 (0.0%) |
| 6-Person Households | 15 (1.1%) | 0 (0.0%) |
| 7+ Person Households | 21 (1.6%) | 0 (0.0%) |
| Total | 930 (69.5%) | 408 (30.5%) |
Female Fertility in Punta Santiago
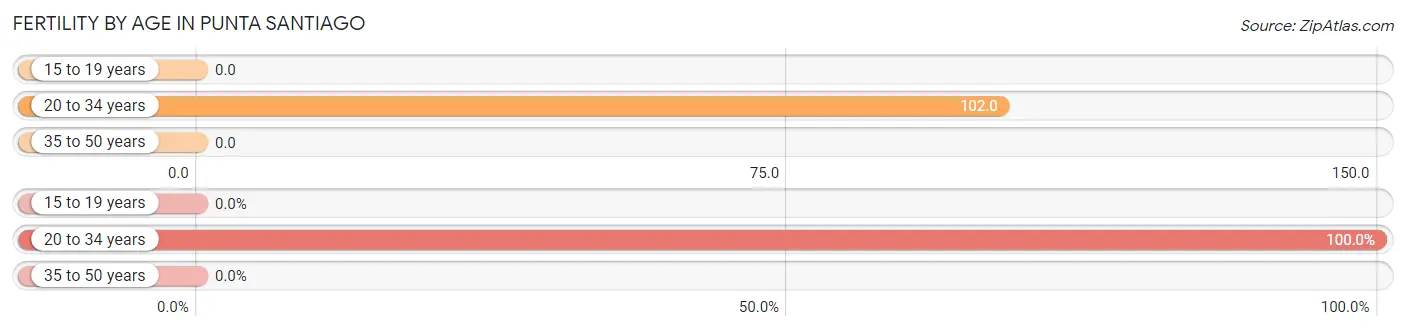
Fertility by Age in Punta Santiago
Average fertility rate in Punta Santiago is 42.0 births per 1,000 women. Women in the age bracket of 20 to 34 years have the highest fertility rate with 102.0 births per 1,000 women. Women in the age bracket of 20 to 34 years acount for 100.0% of all women with births.
| Age Bracket | Women with Births | Births / 1,000 Women |
| 15 to 19 years | 0 (0.0%) | 0.0 |
| 20 to 34 years | 29 (100.0%) | 102.0 |
| 35 to 50 years | 0 (0.0%) | 0.0 |
| Total | 29 (100.0%) | 42.0 |
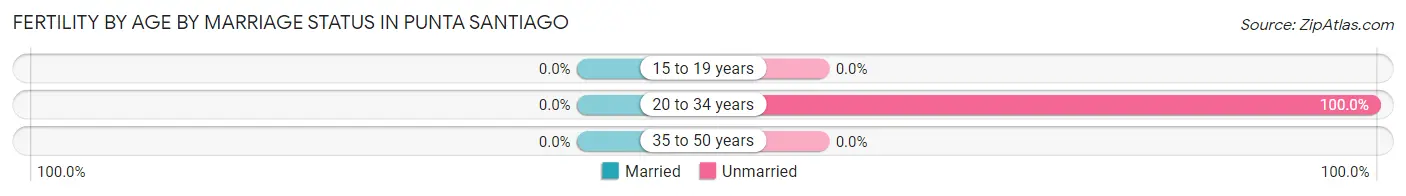
Fertility by Age by Marriage Status in Punta Santiago
| Age Bracket | Married | Unmarried |
| 15 to 19 years | 0 (0.0%) | 0 (0.0%) |
| 20 to 34 years | 0 (0.0%) | 29 (100.0%) |
| 35 to 50 years | 0 (0.0%) | 0 (0.0%) |
| Total | 0 (0.0%) | 29 (100.0%) |
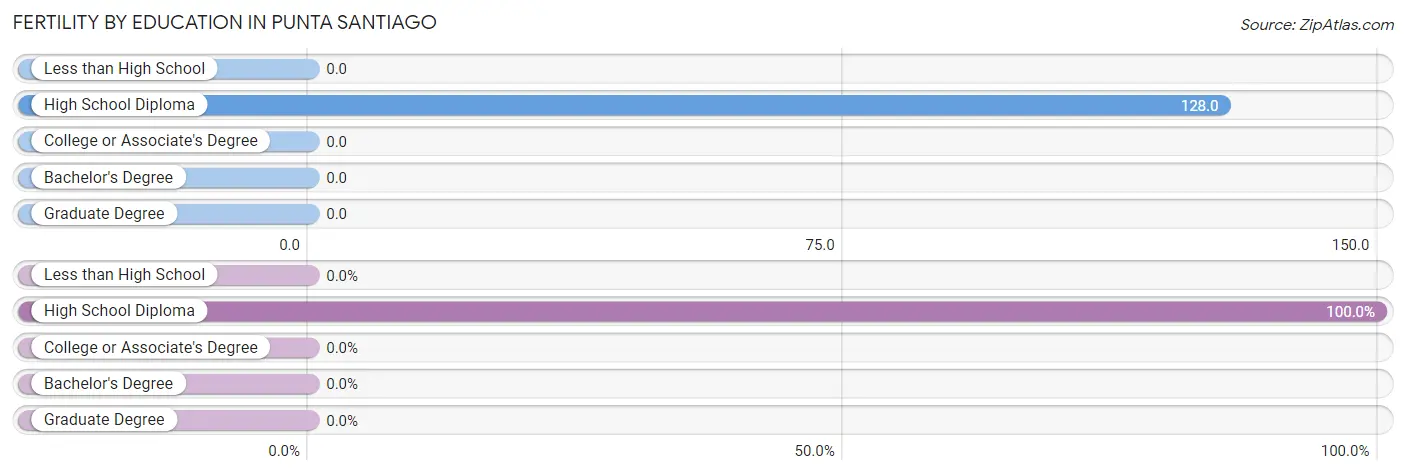
Fertility by Education in Punta Santiago
| Educational Attainment | Women with Births | Births / 1,000 Women |
| Less than High School | 0 (0.0%) | 0.0 |
| High School Diploma | 29 (100.0%) | 128.0 |
| College or Associate's Degree | 0 (0.0%) | 0.0 |
| Bachelor's Degree | 0 (0.0%) | 0.0 |
| Graduate Degree | 0 (0.0%) | 0.0 |
| Total | 29 (100.0%) | 42.0 |
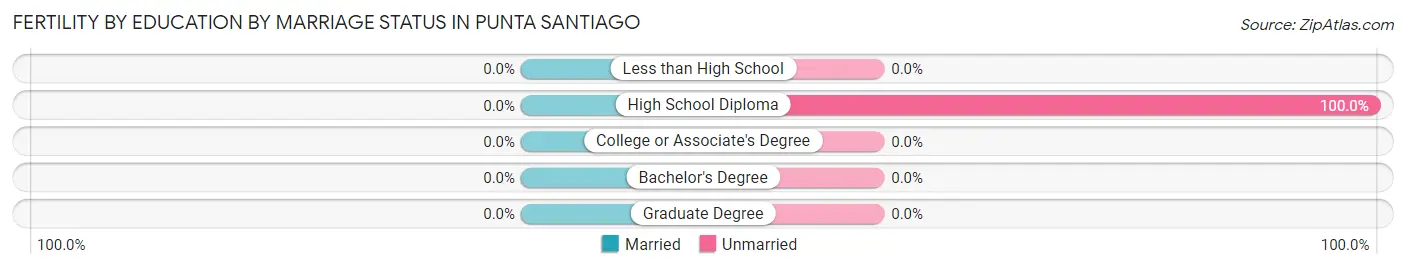
Fertility by Education by Marriage Status in Punta Santiago
| Educational Attainment | Married | Unmarried |
| Less than High School | 0 (0.0%) | 0 (0.0%) |
| High School Diploma | 0 (0.0%) | 29 (100.0%) |
| College or Associate's Degree | 0 (0.0%) | 0 (0.0%) |
| Bachelor's Degree | 0 (0.0%) | 0 (0.0%) |
| Graduate Degree | 0 (0.0%) | 0 (0.0%) |
| Total | 0 (0.0%) | 29 (100.0%) |
Employment Characteristics in Punta Santiago
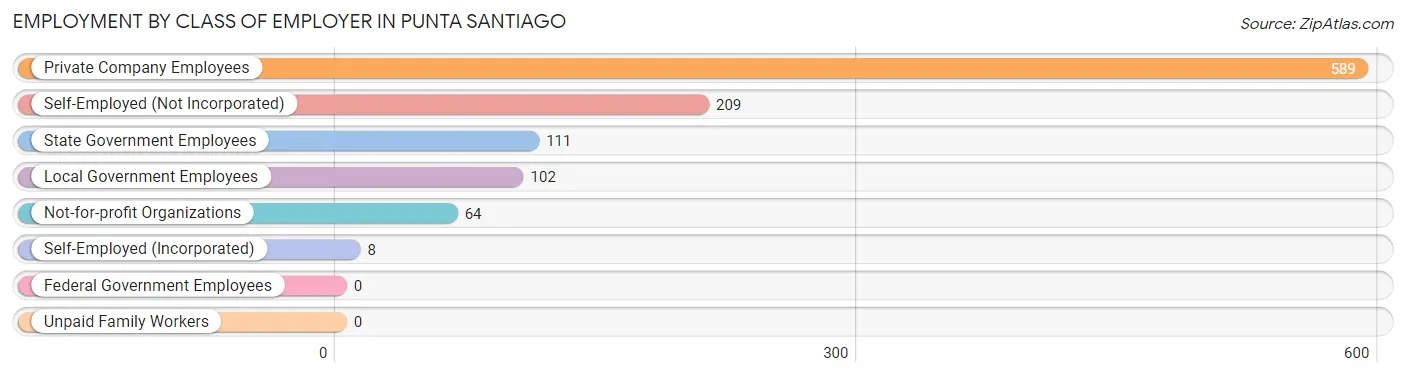
Employment by Class of Employer in Punta Santiago
Among the 1,083 employed individuals in Punta Santiago, private company employees (589 | 54.4%), self-employed (not incorporated) (209 | 19.3%), and state government employees (111 | 10.2%) make up the most common classes of employment.
| Employer Class | # Employees | % Employees |
| Private Company Employees | 589 | 54.4% |
| Self-Employed (Incorporated) | 8 | 0.7% |
| Self-Employed (Not Incorporated) | 209 | 19.3% |
| Not-for-profit Organizations | 64 | 5.9% |
| Local Government Employees | 102 | 9.4% |
| State Government Employees | 111 | 10.2% |
| Federal Government Employees | 0 | 0.0% |
| Unpaid Family Workers | 0 | 0.0% |
| Total | 1,083 | 100.0% |
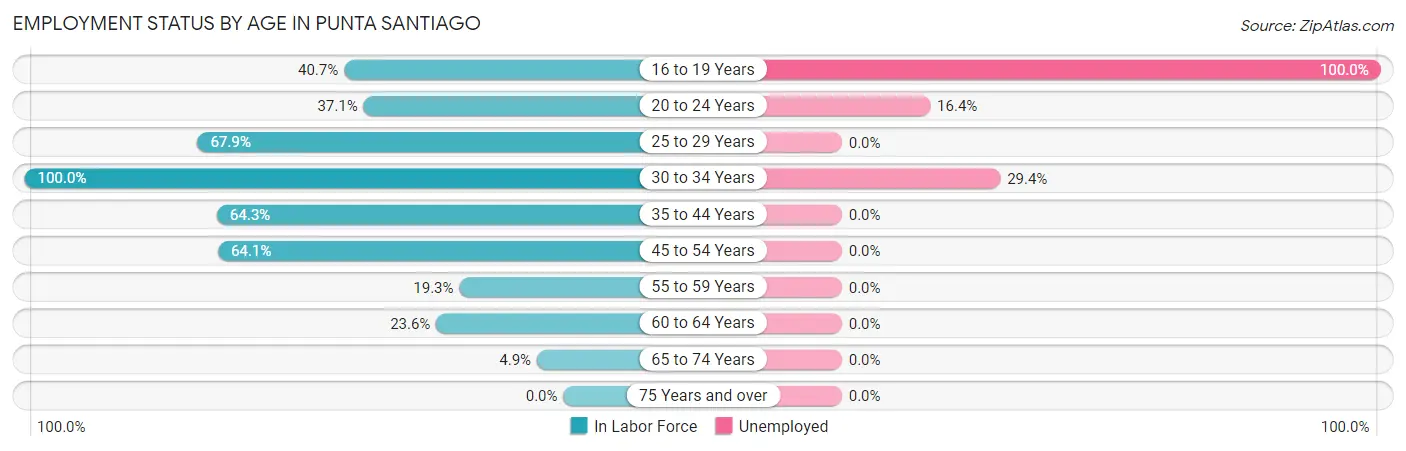
Employment Status by Age in Punta Santiago
According to the labor force statistics for Punta Santiago, out of the total population over 16 years of age (3,082), 39.8% or 1,227 individuals are in the labor force, with 10.4% or 128 of them unemployed. The age group with the highest labor force participation rate is 30 to 34 years, with 100.0% or 231 individuals in the labor force. Within the labor force, the 16 to 19 years age range has the highest percentage of unemployed individuals, with 100.0% or 48 of them being unemployed.
| Age Bracket | In Labor Force | Unemployed |
| 16 to 19 Years | 48 (40.7%) | 48 (100.0%) |
| 20 to 24 Years | 73 (37.1%) | 12 (16.4%) |
| 25 to 29 Years | 182 (67.9%) | 0 (0.0%) |
| 30 to 34 Years | 231 (100.0%) | 68 (29.4%) |
| 35 to 44 Years | 256 (64.3%) | 0 (0.0%) |
| 45 to 54 Years | 298 (64.1%) | 0 (0.0%) |
| 55 to 59 Years | 40 (19.3%) | 0 (0.0%) |
| 60 to 64 Years | 80 (23.6%) | 0 (0.0%) |
| 65 to 74 Years | 20 (4.9%) | 0 (0.0%) |
| 75 Years and over | 0 (0.0%) | 0 (0.0%) |
| Total | 1,227 (39.8%) | 128 (10.4%) |
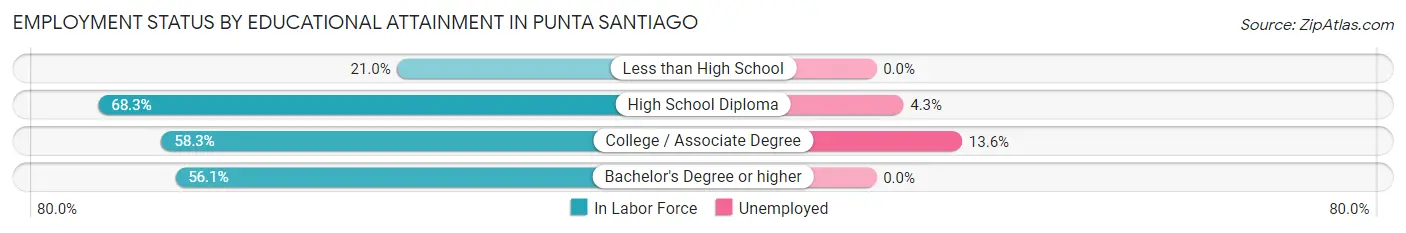
Employment Status by Educational Attainment in Punta Santiago
According to labor force statistics for Punta Santiago, 57.0% of individuals (1,088) out of the total population between 25 and 64 years of age (1,908) are in the labor force, with 6.3% or 69 of them being unemployed. The group with the highest labor force participation rate are those with the educational attainment of high school diploma, with 68.3% or 461 individuals in the labor force. Within the labor force, individuals with college / associate degree education have the highest percentage of unemployment, with 13.6% or 48 of them being unemployed.
| Educational Attainment | In Labor Force | Unemployed |
| Less than High School | 47 (21.0%) | 0 (0.0%) |
| High School Diploma | 461 (68.3%) | 29 (4.3%) |
| College / Associate Degree | 353 (58.3%) | 82 (13.6%) |
| Bachelor's Degree or higher | 226 (56.1%) | 0 (0.0%) |
| Total | 1,088 (57.0%) | 120 (6.3%) |
Employment Occupations by Sex in Punta Santiago
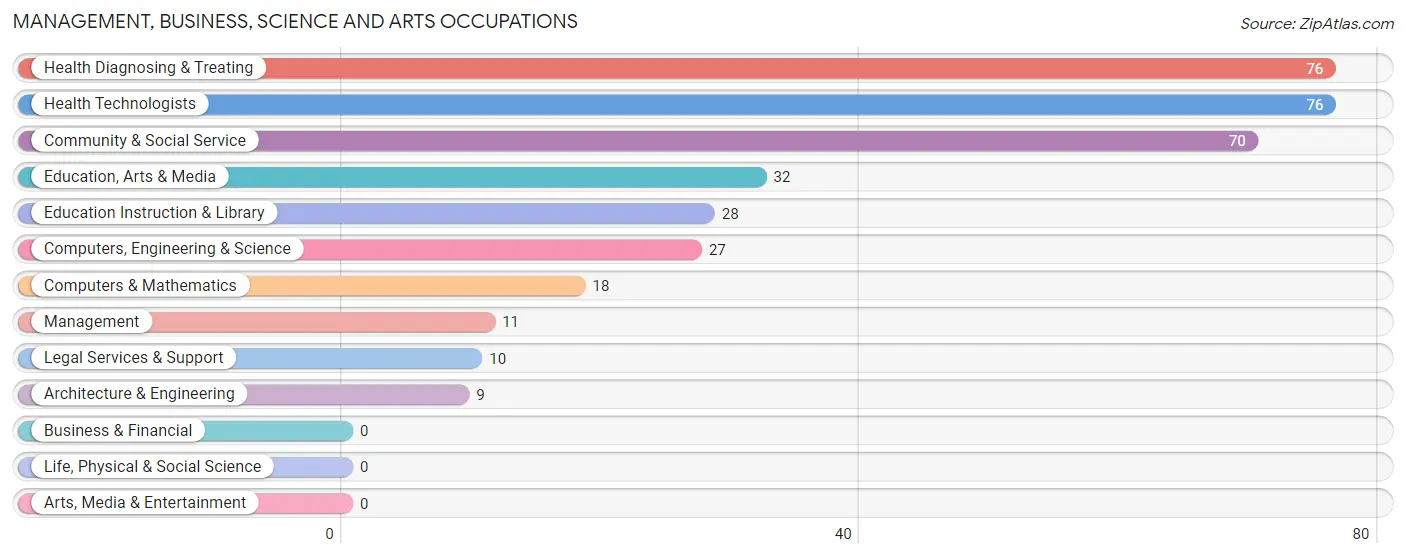
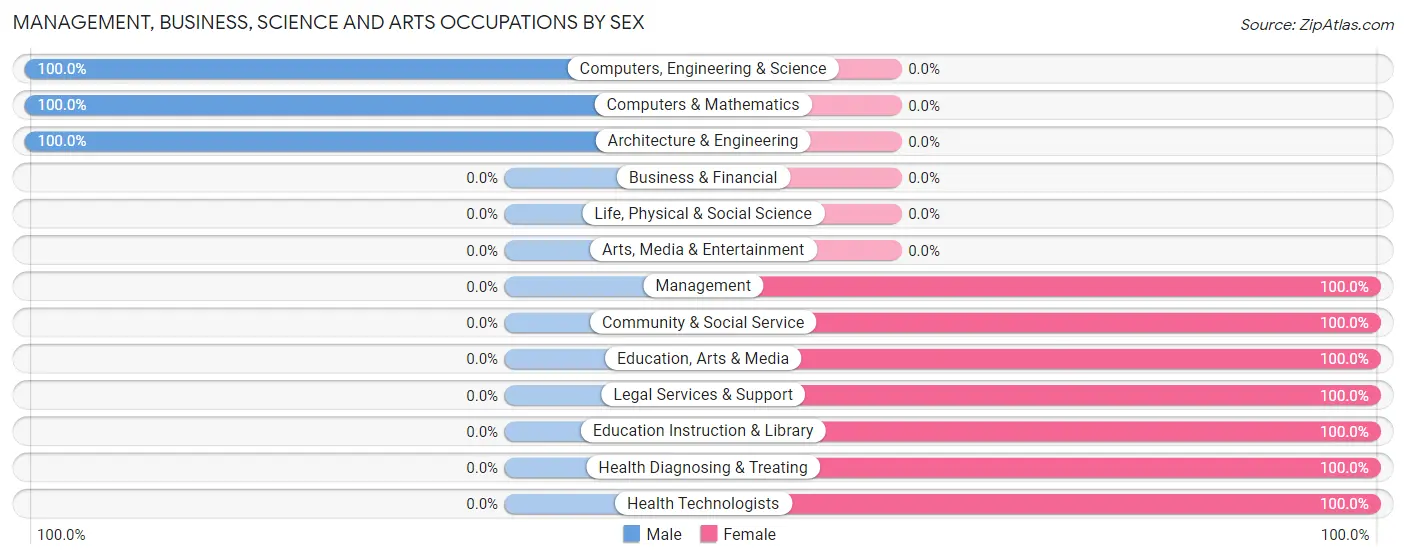
Management, Business, Science and Arts Occupations
The most common Management, Business, Science and Arts occupations in Punta Santiago are Health Diagnosing & Treating (76 | 6.9%), Health Technologists (76 | 6.9%), Community & Social Service (70 | 6.4%), Education, Arts & Media (32 | 2.9%), and Education Instruction & Library (28 | 2.5%).
Management, Business, Science and Arts Occupations by Sex
Within the Management, Business, Science and Arts occupations in Punta Santiago, the most male-oriented occupations are Computers, Engineering & Science (100.0%), Computers & Mathematics (100.0%), and Architecture & Engineering (100.0%), while the most female-oriented occupations are Management (100.0%), Community & Social Service (100.0%), and Education, Arts & Media (100.0%).
| Occupation | Male | Female |
| Management | 0 (0.0%) | 11 (100.0%) |
| Business & Financial | 0 (0.0%) | 0 (0.0%) |
| Computers, Engineering & Science | 27 (100.0%) | 0 (0.0%) |
| Computers & Mathematics | 18 (100.0%) | 0 (0.0%) |
| Architecture & Engineering | 9 (100.0%) | 0 (0.0%) |
| Life, Physical & Social Science | 0 (0.0%) | 0 (0.0%) |
| Community & Social Service | 0 (0.0%) | 70 (100.0%) |
| Education, Arts & Media | 0 (0.0%) | 32 (100.0%) |
| Legal Services & Support | 0 (0.0%) | 10 (100.0%) |
| Education Instruction & Library | 0 (0.0%) | 28 (100.0%) |
| Arts, Media & Entertainment | 0 (0.0%) | 0 (0.0%) |
| Health Diagnosing & Treating | 0 (0.0%) | 76 (100.0%) |
| Health Technologists | 0 (0.0%) | 76 (100.0%) |
| Total (Category) | 27 (14.7%) | 157 (85.3%) |
| Total (Overall) | 620 (56.4%) | 480 (43.6%) |
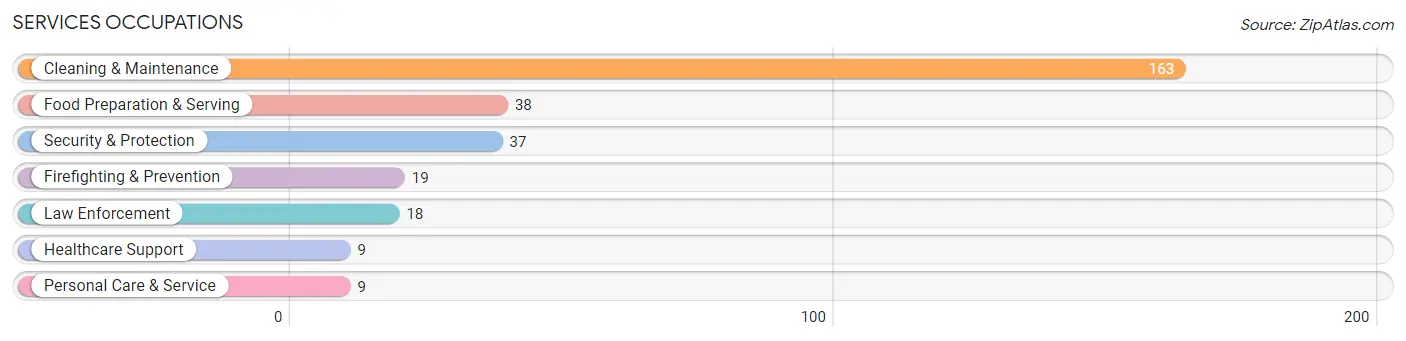
Services Occupations
The most common Services occupations in Punta Santiago are Cleaning & Maintenance (163 | 14.8%), Food Preparation & Serving (38 | 3.5%), Security & Protection (37 | 3.4%), Firefighting & Prevention (19 | 1.7%), and Law Enforcement (18 | 1.6%).
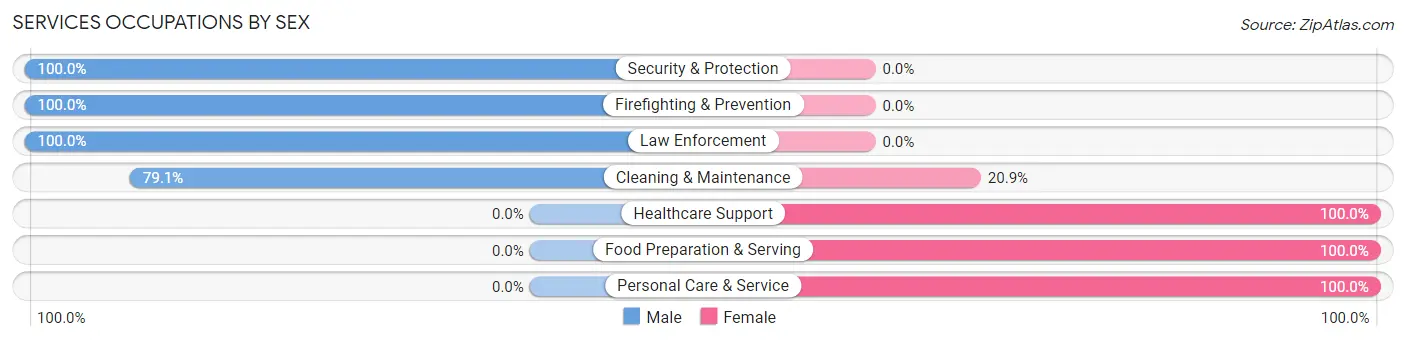
Services Occupations by Sex
Within the Services occupations in Punta Santiago, the most male-oriented occupations are Security & Protection (100.0%), Firefighting & Prevention (100.0%), and Law Enforcement (100.0%), while the most female-oriented occupations are Healthcare Support (100.0%), Food Preparation & Serving (100.0%), and Personal Care & Service (100.0%).
| Occupation | Male | Female |
| Healthcare Support | 0 (0.0%) | 9 (100.0%) |
| Security & Protection | 37 (100.0%) | 0 (0.0%) |
| Firefighting & Prevention | 19 (100.0%) | 0 (0.0%) |
| Law Enforcement | 18 (100.0%) | 0 (0.0%) |
| Food Preparation & Serving | 0 (0.0%) | 38 (100.0%) |
| Cleaning & Maintenance | 129 (79.1%) | 34 (20.9%) |
| Personal Care & Service | 0 (0.0%) | 9 (100.0%) |
| Total (Category) | 166 (64.8%) | 90 (35.2%) |
| Total (Overall) | 620 (56.4%) | 480 (43.6%) |
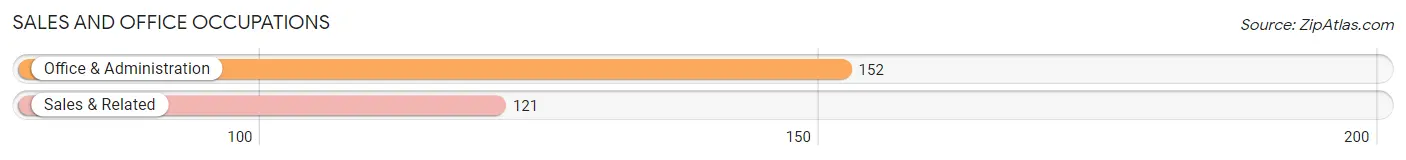
Sales and Office Occupations
The most common Sales and Office occupations in Punta Santiago are Office & Administration (152 | 13.8%), and Sales & Related (121 | 11.0%).
Sales and Office Occupations by Sex

| Occupation | Male | Female |
| Sales & Related | 48 (39.7%) | 73 (60.3%) |
| Office & Administration | 79 (52.0%) | 73 (48.0%) |
| Total (Category) | 127 (46.5%) | 146 (53.5%) |
| Total (Overall) | 620 (56.4%) | 480 (43.6%) |
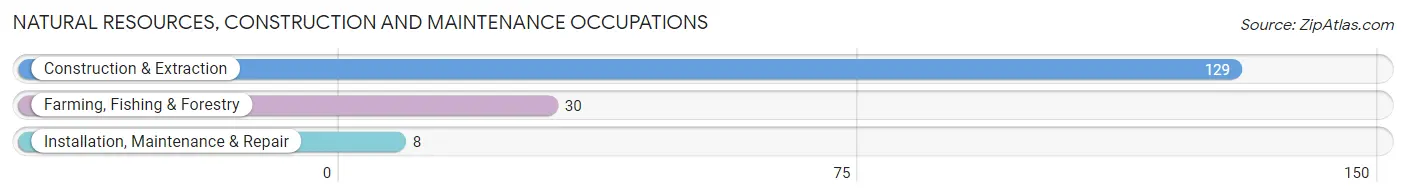
Natural Resources, Construction and Maintenance Occupations
The most common Natural Resources, Construction and Maintenance occupations in Punta Santiago are Construction & Extraction (129 | 11.7%), Farming, Fishing & Forestry (30 | 2.7%), and Installation, Maintenance & Repair (8 | 0.7%).
Natural Resources, Construction and Maintenance Occupations by Sex
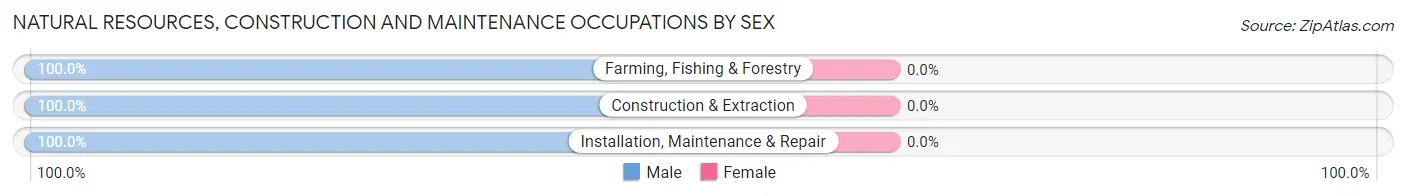
| Occupation | Male | Female |
| Farming, Fishing & Forestry | 30 (100.0%) | 0 (0.0%) |
| Construction & Extraction | 129 (100.0%) | 0 (0.0%) |
| Installation, Maintenance & Repair | 8 (100.0%) | 0 (0.0%) |
| Total (Category) | 167 (100.0%) | 0 (0.0%) |
| Total (Overall) | 620 (56.4%) | 480 (43.6%) |
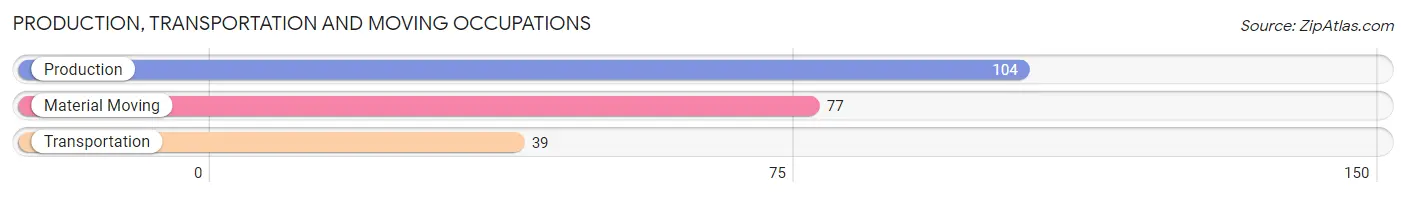
Production, Transportation and Moving Occupations
The most common Production, Transportation and Moving occupations in Punta Santiago are Production (104 | 9.5%), Material Moving (77 | 7.0%), and Transportation (39 | 3.5%).
Production, Transportation and Moving Occupations by Sex
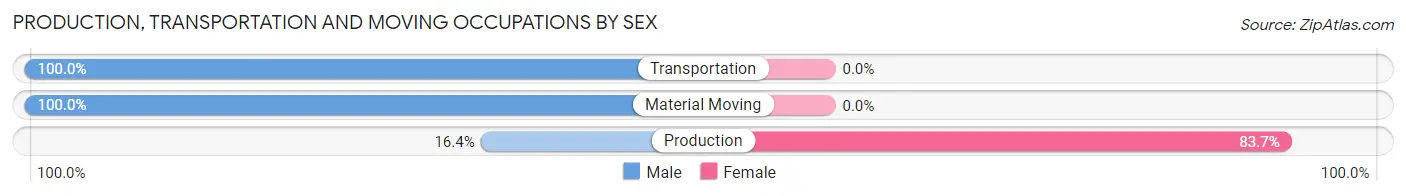
| Occupation | Male | Female |
| Production | 17 (16.4%) | 87 (83.7%) |
| Transportation | 39 (100.0%) | 0 (0.0%) |
| Material Moving | 77 (100.0%) | 0 (0.0%) |
| Total (Category) | 133 (60.5%) | 87 (39.6%) |
| Total (Overall) | 620 (56.4%) | 480 (43.6%) |
Employment Industries by Sex in Punta Santiago
Employment Industries in Punta Santiago
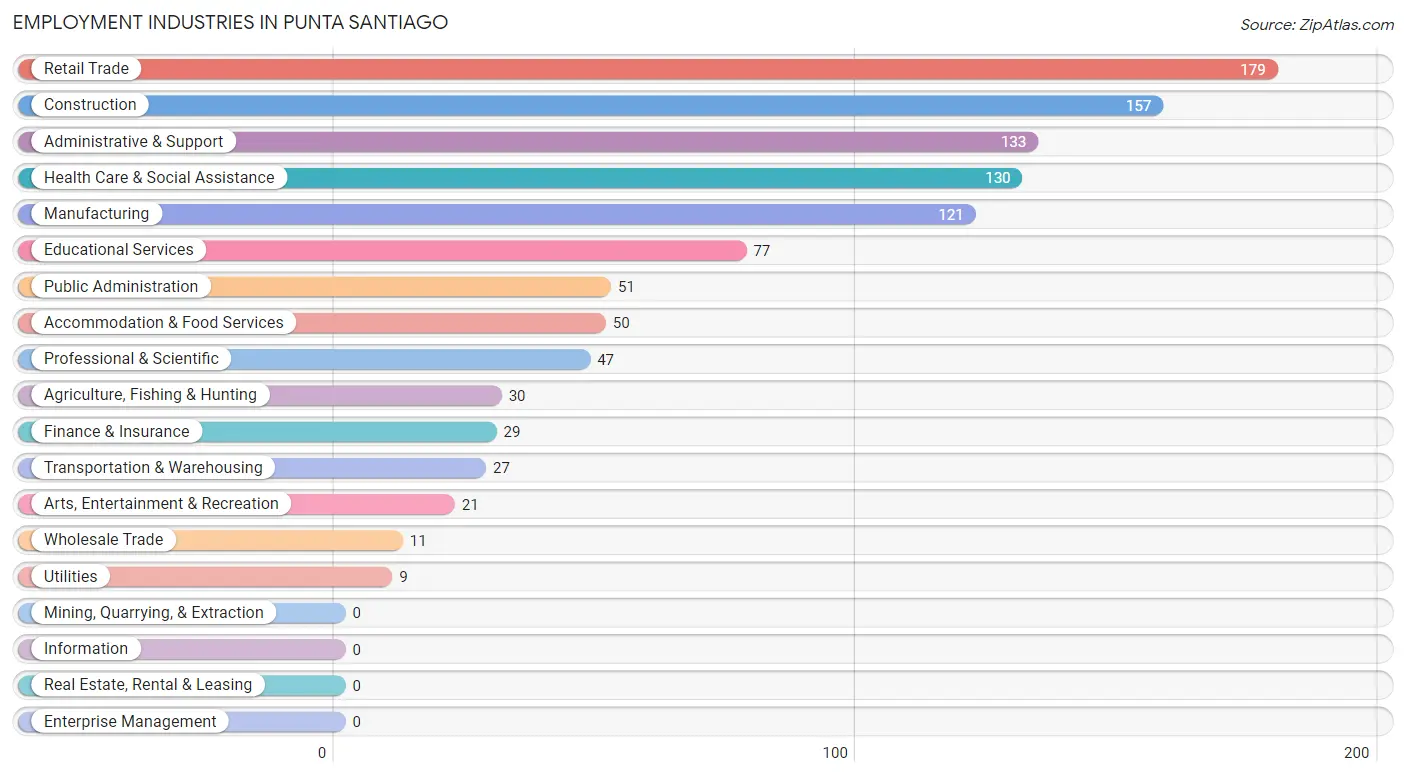
The major employment industries in Punta Santiago include Retail Trade (179 | 16.3%), Construction (157 | 14.3%), Administrative & Support (133 | 12.1%), Health Care & Social Assistance (130 | 11.8%), and Manufacturing (121 | 11.0%).
Employment Industries by Sex in Punta Santiago
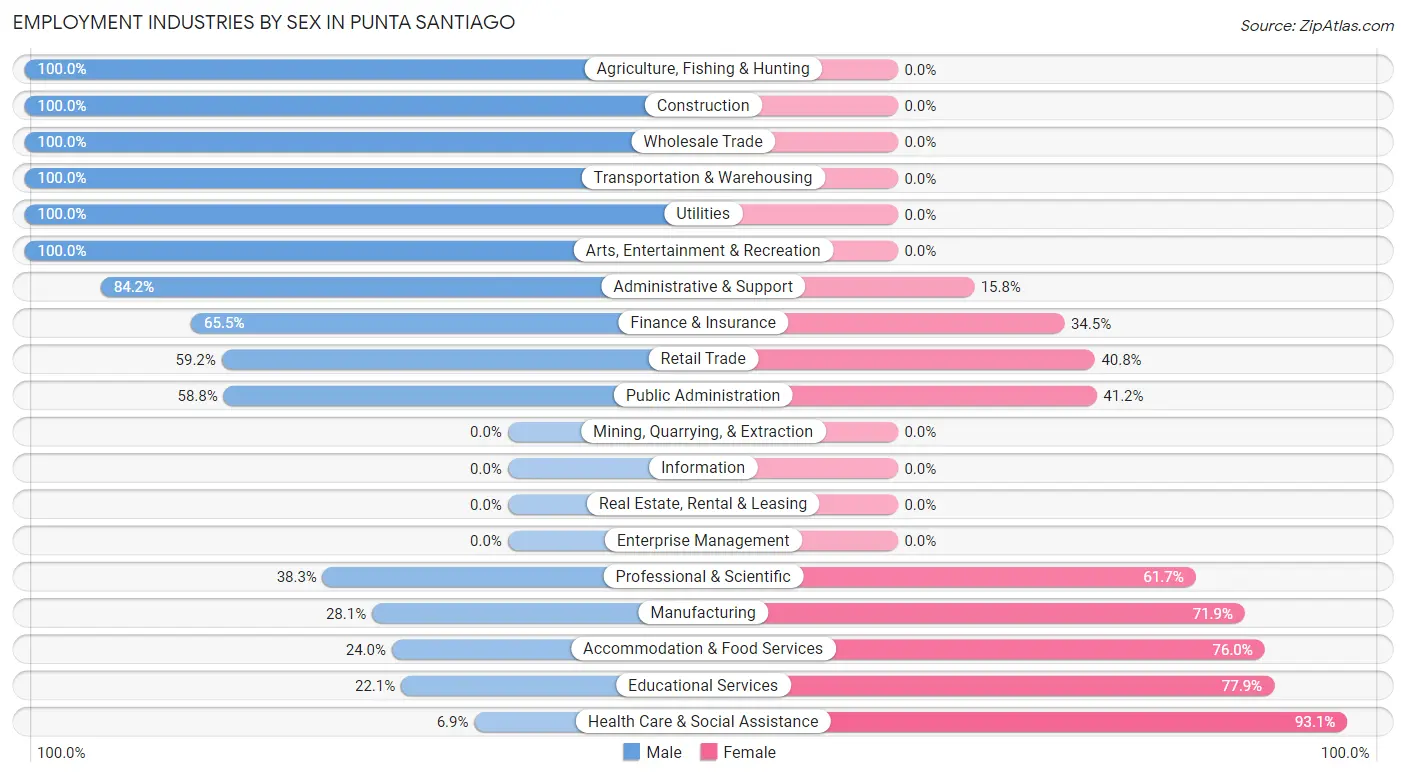
The Punta Santiago industries that see more men than women are Agriculture, Fishing & Hunting (100.0%), Construction (100.0%), and Wholesale Trade (100.0%), whereas the industries that tend to have a higher number of women are Health Care & Social Assistance (93.1%), Educational Services (77.9%), and Accommodation & Food Services (76.0%).
| Industry | Male | Female |
| Agriculture, Fishing & Hunting | 30 (100.0%) | 0 (0.0%) |
| Mining, Quarrying, & Extraction | 0 (0.0%) | 0 (0.0%) |
| Construction | 157 (100.0%) | 0 (0.0%) |
| Manufacturing | 34 (28.1%) | 87 (71.9%) |
| Wholesale Trade | 11 (100.0%) | 0 (0.0%) |
| Retail Trade | 106 (59.2%) | 73 (40.8%) |
| Transportation & Warehousing | 27 (100.0%) | 0 (0.0%) |
| Utilities | 9 (100.0%) | 0 (0.0%) |
| Information | 0 (0.0%) | 0 (0.0%) |
| Finance & Insurance | 19 (65.5%) | 10 (34.5%) |
| Real Estate, Rental & Leasing | 0 (0.0%) | 0 (0.0%) |
| Professional & Scientific | 18 (38.3%) | 29 (61.7%) |
| Enterprise Management | 0 (0.0%) | 0 (0.0%) |
| Administrative & Support | 112 (84.2%) | 21 (15.8%) |
| Educational Services | 17 (22.1%) | 60 (77.9%) |
| Health Care & Social Assistance | 9 (6.9%) | 121 (93.1%) |
| Arts, Entertainment & Recreation | 21 (100.0%) | 0 (0.0%) |
| Accommodation & Food Services | 12 (24.0%) | 38 (76.0%) |
| Public Administration | 30 (58.8%) | 21 (41.2%) |
| Total | 620 (56.4%) | 480 (43.6%) |
Education in Punta Santiago
School Enrollment in Punta Santiago
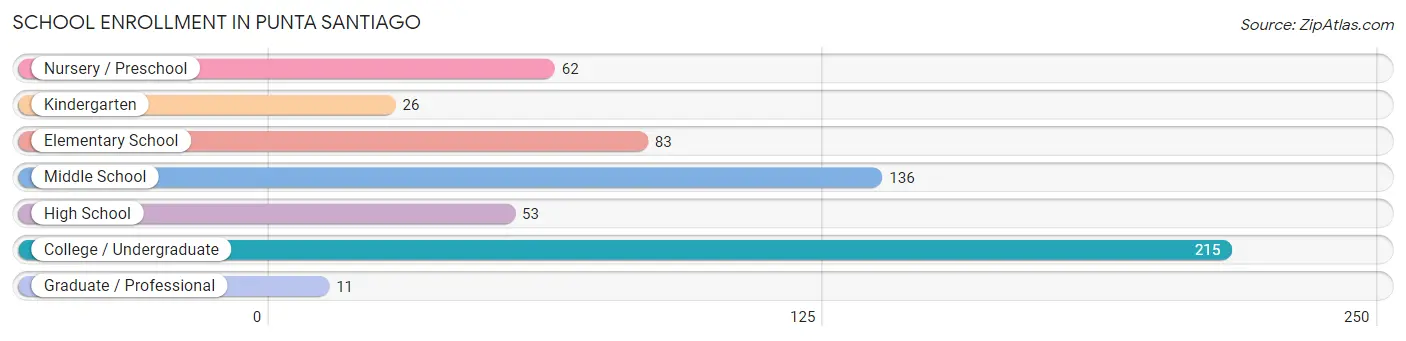
The most common levels of schooling among the 586 students in Punta Santiago are college / undergraduate (215 | 36.7%), middle school (136 | 23.2%), and elementary school (83 | 14.2%).
| School Level | # Students | % Students |
| Nursery / Preschool | 62 | 10.6% |
| Kindergarten | 26 | 4.4% |
| Elementary School | 83 | 14.2% |
| Middle School | 136 | 23.2% |
| High School | 53 | 9.0% |
| College / Undergraduate | 215 | 36.7% |
| Graduate / Professional | 11 | 1.9% |
| Total | 586 | 100.0% |
School Enrollment by Age by Funding Source in Punta Santiago
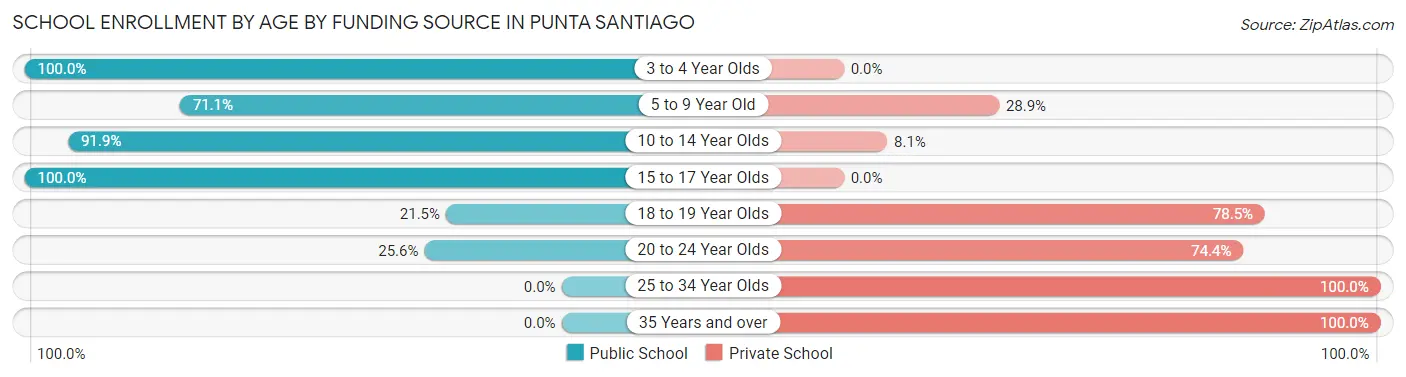
Out of a total of 586 students who are enrolled in schools in Punta Santiago, 224 (38.2%) attend a private institution, while the remaining 362 (61.8%) are enrolled in public schools. The age group of 25 to 34 year olds has the highest likelihood of being enrolled in private schools, with 48 (100.0% in the age bracket) enrolled. Conversely, the age group of 3 to 4 year olds has the lowest likelihood of being enrolled in a private school, with 88 (100.0% in the age bracket) attending a public institution.
| Age Bracket | Public School | Private School |
| 3 to 4 Year Olds | 88 (100.0%) | 0 (0.0%) |
| 5 to 9 Year Old | 59 (71.1%) | 24 (28.9%) |
| 10 to 14 Year Olds | 125 (91.9%) | 11 (8.1%) |
| 15 to 17 Year Olds | 53 (100.0%) | 0 (0.0%) |
| 18 to 19 Year Olds | 14 (21.5%) | 51 (78.5%) |
| 20 to 24 Year Olds | 23 (25.6%) | 67 (74.4%) |
| 25 to 34 Year Olds | 0 (0.0%) | 48 (100.0%) |
| 35 Years and over | 0 (0.0%) | 23 (100.0%) |
| Total | 362 (61.8%) | 224 (38.2%) |
Educational Attainment by Field of Study in Punta Santiago
Education (132 | 24.9%), science & technology (124 | 23.4%), business (116 | 21.9%), physical & health sciences (56 | 10.6%), and bio, nature & agricultural (44 | 8.3%) are the most common fields of study among 530 individuals in Punta Santiago who have obtained a bachelor's degree or higher.
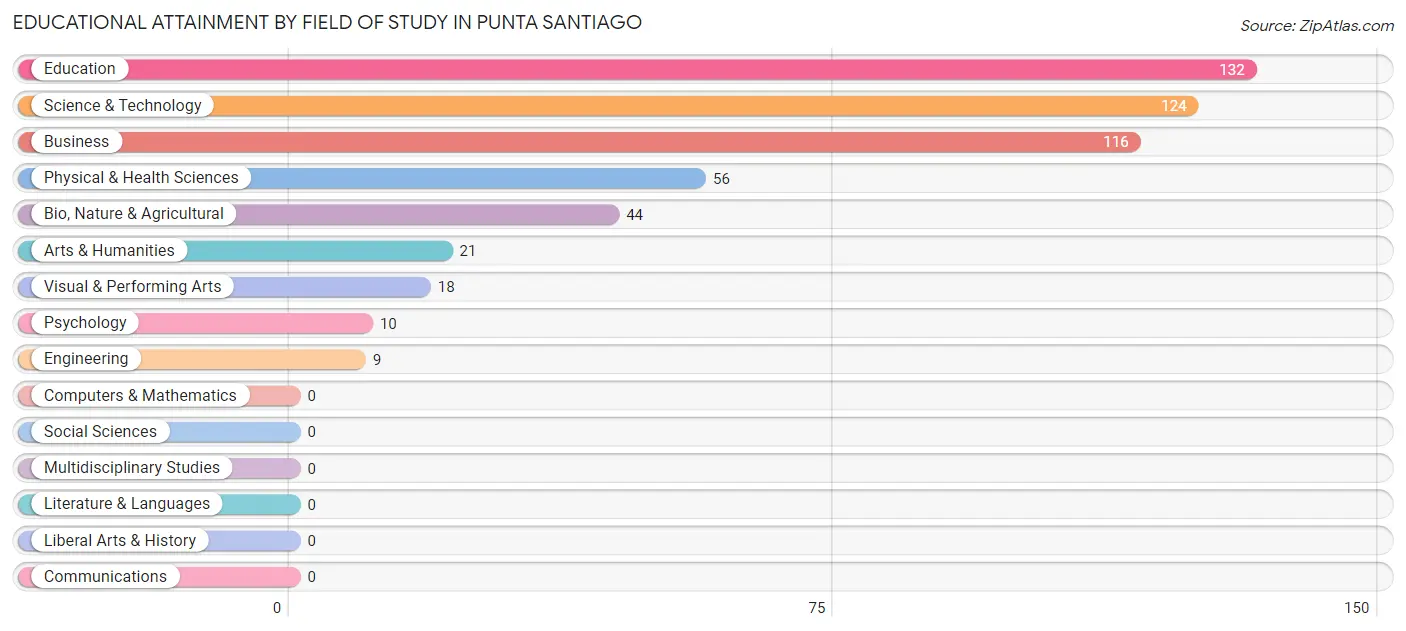
| Field of Study | # Graduates | % Graduates |
| Computers & Mathematics | 0 | 0.0% |
| Bio, Nature & Agricultural | 44 | 8.3% |
| Physical & Health Sciences | 56 | 10.6% |
| Psychology | 10 | 1.9% |
| Social Sciences | 0 | 0.0% |
| Engineering | 9 | 1.7% |
| Multidisciplinary Studies | 0 | 0.0% |
| Science & Technology | 124 | 23.4% |
| Business | 116 | 21.9% |
| Education | 132 | 24.9% |
| Literature & Languages | 0 | 0.0% |
| Liberal Arts & History | 0 | 0.0% |
| Visual & Performing Arts | 18 | 3.4% |
| Communications | 0 | 0.0% |
| Arts & Humanities | 21 | 4.0% |
| Total | 530 | 100.0% |
Transportation & Commute in Punta Santiago
Vehicle Availability by Sex in Punta Santiago
The most prevalent vehicle ownership categories in Punta Santiago are males with 1 vehicle (240, accounting for 39.2%) and females with 1 vehicle (156, making up 51.0%).
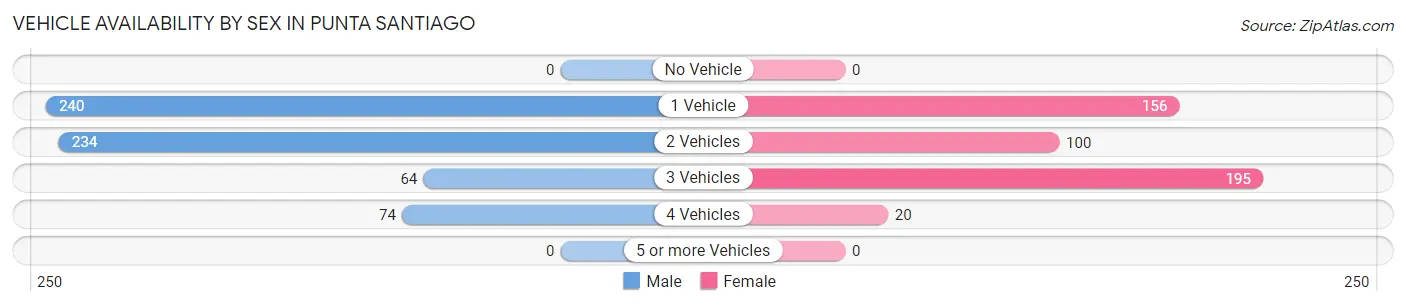
| Vehicles Available | Male | Female |
| No Vehicle | 0 (0.0%) | 0 (0.0%) |
| 1 Vehicle | 240 (39.2%) | 156 (33.1%) |
| 2 Vehicles | 234 (38.2%) | 100 (21.2%) |
| 3 Vehicles | 64 (10.5%) | 195 (41.4%) |
| 4 Vehicles | 74 (12.1%) | 20 (4.3%) |
| 5 or more Vehicles | 0 (0.0%) | 0 (0.0%) |
| Total | 612 (100.0%) | 471 (100.0%) |
Commute Time in Punta Santiago
The most frequently occuring commute durations in Punta Santiago are 20 to 24 minutes (275 commuters, 26.1%), 10 to 14 minutes (177 commuters, 16.8%), and 15 to 19 minutes (161 commuters, 15.3%).
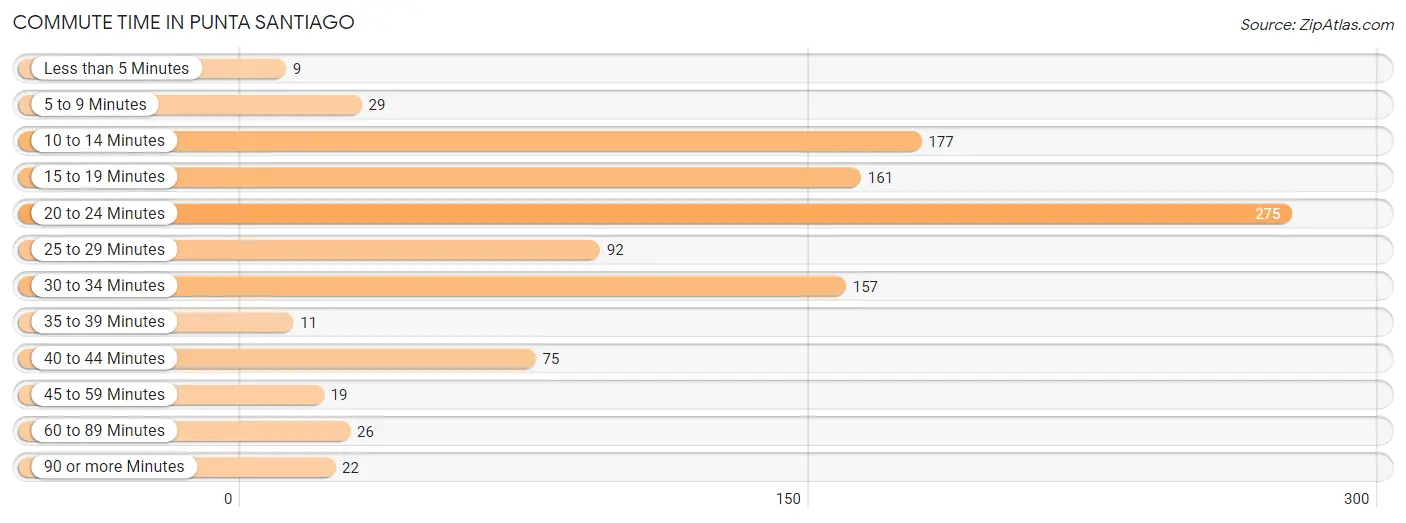
| Commute Time | # Commuters | % Commuters |
| Less than 5 Minutes | 9 | 0.9% |
| 5 to 9 Minutes | 29 | 2.8% |
| 10 to 14 Minutes | 177 | 16.8% |
| 15 to 19 Minutes | 161 | 15.3% |
| 20 to 24 Minutes | 275 | 26.1% |
| 25 to 29 Minutes | 92 | 8.7% |
| 30 to 34 Minutes | 157 | 14.9% |
| 35 to 39 Minutes | 11 | 1.0% |
| 40 to 44 Minutes | 75 | 7.1% |
| 45 to 59 Minutes | 19 | 1.8% |
| 60 to 89 Minutes | 26 | 2.5% |
| 90 or more Minutes | 22 | 2.1% |
Commute Time by Sex in Punta Santiago
The most common commute times in Punta Santiago are 10 to 14 minutes (156 commuters, 25.5%) for males and 20 to 24 minutes (149 commuters, 33.8%) for females.
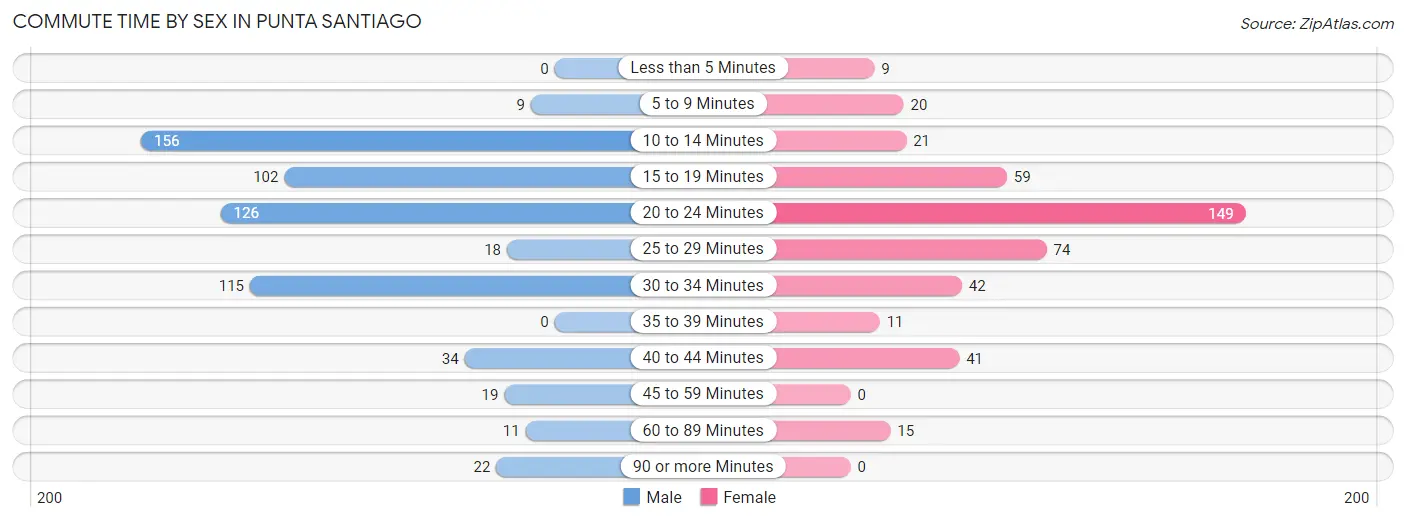
| Commute Time | Male | Female |
| Less than 5 Minutes | 0 (0.0%) | 9 (2.0%) |
| 5 to 9 Minutes | 9 (1.5%) | 20 (4.5%) |
| 10 to 14 Minutes | 156 (25.5%) | 21 (4.8%) |
| 15 to 19 Minutes | 102 (16.7%) | 59 (13.4%) |
| 20 to 24 Minutes | 126 (20.6%) | 149 (33.8%) |
| 25 to 29 Minutes | 18 (2.9%) | 74 (16.8%) |
| 30 to 34 Minutes | 115 (18.8%) | 42 (9.5%) |
| 35 to 39 Minutes | 0 (0.0%) | 11 (2.5%) |
| 40 to 44 Minutes | 34 (5.6%) | 41 (9.3%) |
| 45 to 59 Minutes | 19 (3.1%) | 0 (0.0%) |
| 60 to 89 Minutes | 11 (1.8%) | 15 (3.4%) |
| 90 or more Minutes | 22 (3.6%) | 0 (0.0%) |
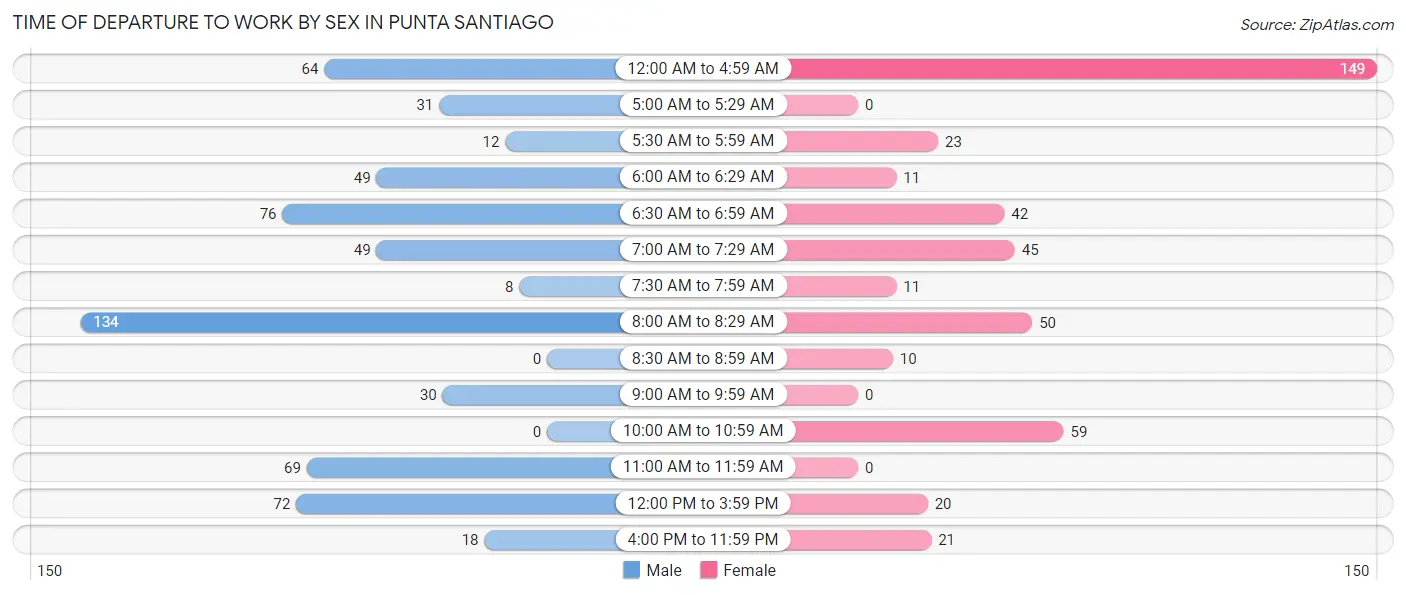
Time of Departure to Work by Sex in Punta Santiago
The most frequent times of departure to work in Punta Santiago are 8:00 AM to 8:29 AM (134, 21.9%) for males and 12:00 AM to 4:59 AM (149, 33.8%) for females.
| Time of Departure | Male | Female |
| 12:00 AM to 4:59 AM | 64 (10.5%) | 149 (33.8%) |
| 5:00 AM to 5:29 AM | 31 (5.1%) | 0 (0.0%) |
| 5:30 AM to 5:59 AM | 12 (2.0%) | 23 (5.2%) |
| 6:00 AM to 6:29 AM | 49 (8.0%) | 11 (2.5%) |
| 6:30 AM to 6:59 AM | 76 (12.4%) | 42 (9.5%) |
| 7:00 AM to 7:29 AM | 49 (8.0%) | 45 (10.2%) |
| 7:30 AM to 7:59 AM | 8 (1.3%) | 11 (2.5%) |
| 8:00 AM to 8:29 AM | 134 (21.9%) | 50 (11.3%) |
| 8:30 AM to 8:59 AM | 0 (0.0%) | 10 (2.3%) |
| 9:00 AM to 9:59 AM | 30 (4.9%) | 0 (0.0%) |
| 10:00 AM to 10:59 AM | 0 (0.0%) | 59 (13.4%) |
| 11:00 AM to 11:59 AM | 69 (11.3%) | 0 (0.0%) |
| 12:00 PM to 3:59 PM | 72 (11.8%) | 20 (4.5%) |
| 4:00 PM to 11:59 PM | 18 (2.9%) | 21 (4.8%) |
| Total | 612 (100.0%) | 441 (100.0%) |
Housing Occupancy in Punta Santiago
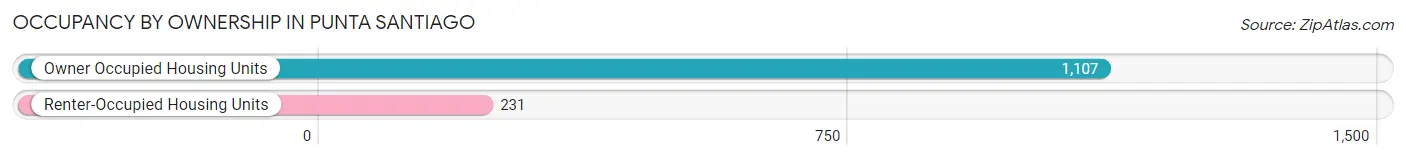
Occupancy by Ownership in Punta Santiago
Of the total 1,338 dwellings in Punta Santiago, owner-occupied units account for 1,107 (82.7%), while renter-occupied units make up 231 (17.3%).
| Occupancy | # Housing Units | % Housing Units |
| Owner Occupied Housing Units | 1,107 | 82.7% |
| Renter-Occupied Housing Units | 231 | 17.3% |
| Total Occupied Housing Units | 1,338 | 100.0% |
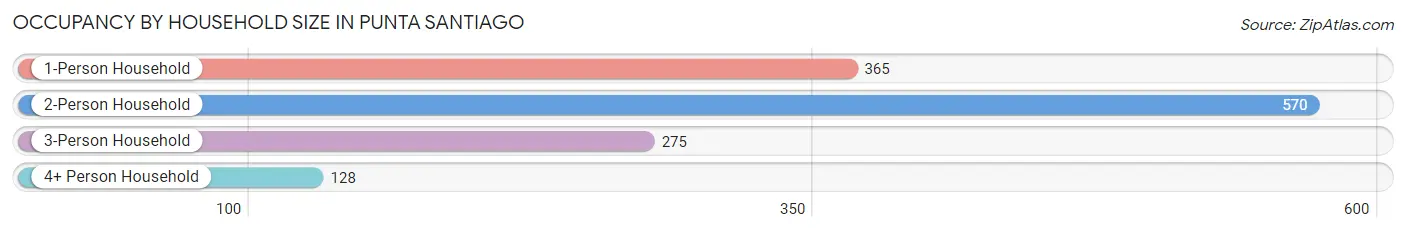
Occupancy by Household Size in Punta Santiago
| Household Size | # Housing Units | % Housing Units |
| 1-Person Household | 365 | 27.3% |
| 2-Person Household | 570 | 42.6% |
| 3-Person Household | 275 | 20.5% |
| 4+ Person Household | 128 | 9.6% |
| Total Housing Units | 1,338 | 100.0% |
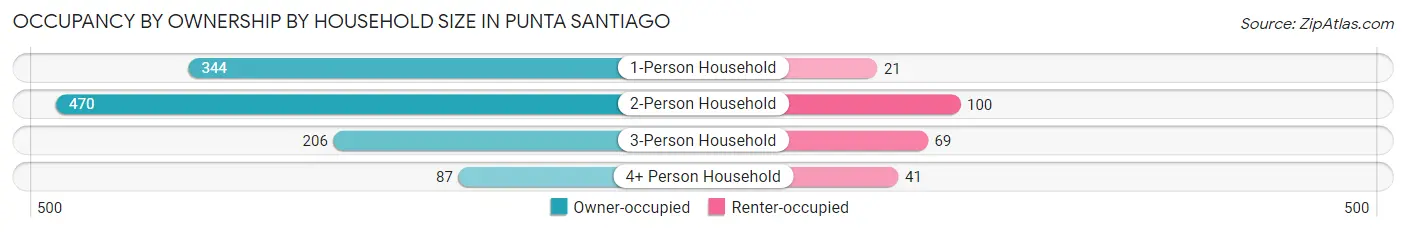
Occupancy by Ownership by Household Size in Punta Santiago
| Household Size | Owner-occupied | Renter-occupied |
| 1-Person Household | 344 (94.3%) | 21 (5.8%) |
| 2-Person Household | 470 (82.5%) | 100 (17.5%) |
| 3-Person Household | 206 (74.9%) | 69 (25.1%) |
| 4+ Person Household | 87 (68.0%) | 41 (32.0%) |
| Total Housing Units | 1,107 (82.7%) | 231 (17.3%) |
Occupancy by Educational Attainment in Punta Santiago
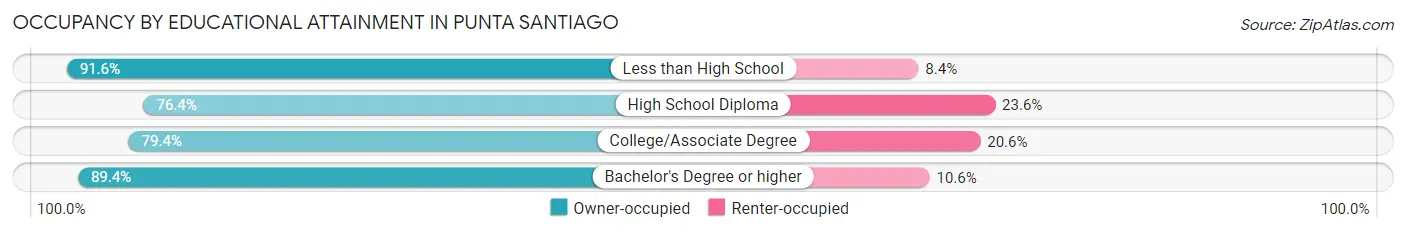
| Household Size | Owner-occupied | Renter-occupied |
| Less than High School | 230 (91.6%) | 21 (8.4%) |
| High School Diploma | 392 (76.4%) | 121 (23.6%) |
| College/Associate Degree | 223 (79.4%) | 58 (20.6%) |
| Bachelor's Degree or higher | 262 (89.4%) | 31 (10.6%) |
Occupancy by Age of Householder in Punta Santiago
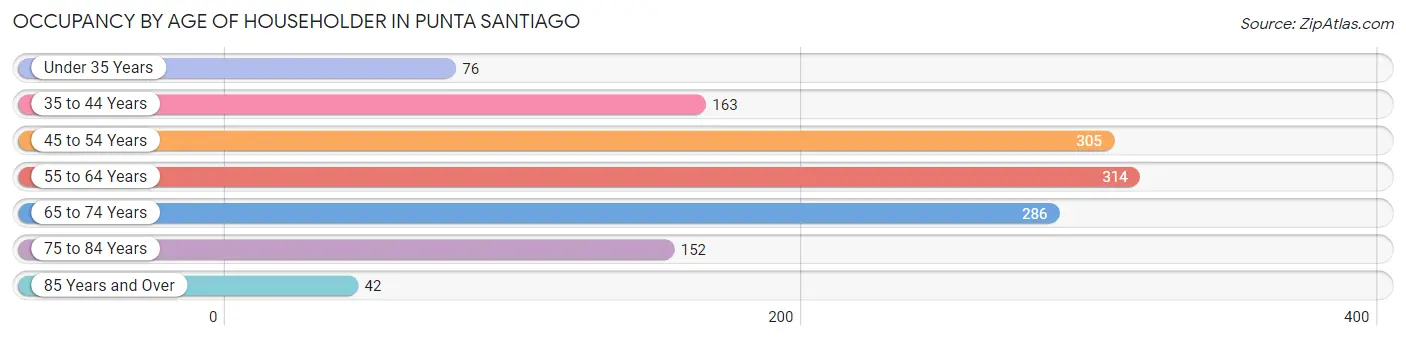
| Age Bracket | # Households | % Households |
| Under 35 Years | 76 | 5.7% |
| 35 to 44 Years | 163 | 12.2% |
| 45 to 54 Years | 305 | 22.8% |
| 55 to 64 Years | 314 | 23.5% |
| 65 to 74 Years | 286 | 21.4% |
| 75 to 84 Years | 152 | 11.4% |
| 85 Years and Over | 42 | 3.1% |
| Total | 1,338 | 100.0% |
Housing Finances in Punta Santiago
Median Income by Occupancy in Punta Santiago
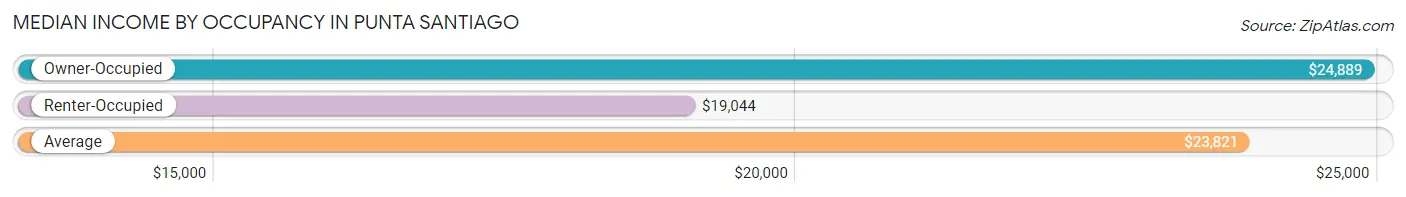
| Occupancy Type | # Households | Median Income |
| Owner-Occupied | 1,107 (82.7%) | $24,889 |
| Renter-Occupied | 231 (17.3%) | $19,044 |
| Average | 1,338 (100.0%) | $23,821 |
Occupancy by Householder Income Bracket in Punta Santiago
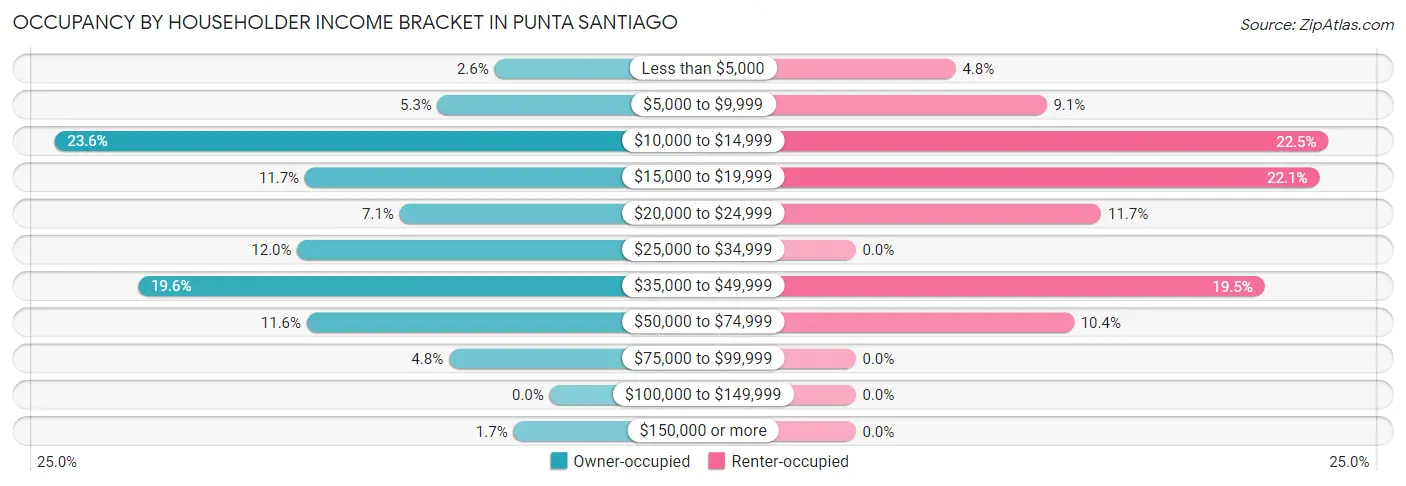
| Income Bracket | Owner-occupied | Renter-occupied |
| Less than $5,000 | 29 (2.6%) | 11 (4.8%) |
| $5,000 to $9,999 | 59 (5.3%) | 21 (9.1%) |
| $10,000 to $14,999 | 261 (23.6%) | 52 (22.5%) |
| $15,000 to $19,999 | 129 (11.7%) | 51 (22.1%) |
| $20,000 to $24,999 | 79 (7.1%) | 27 (11.7%) |
| $25,000 to $34,999 | 133 (12.0%) | 0 (0.0%) |
| $35,000 to $49,999 | 217 (19.6%) | 45 (19.5%) |
| $50,000 to $74,999 | 128 (11.6%) | 24 (10.4%) |
| $75,000 to $99,999 | 53 (4.8%) | 0 (0.0%) |
| $100,000 to $149,999 | 0 (0.0%) | 0 (0.0%) |
| $150,000 or more | 19 (1.7%) | 0 (0.0%) |
| Total | 1,107 (100.0%) | 231 (100.0%) |
Monthly Housing Cost Tiers in Punta Santiago
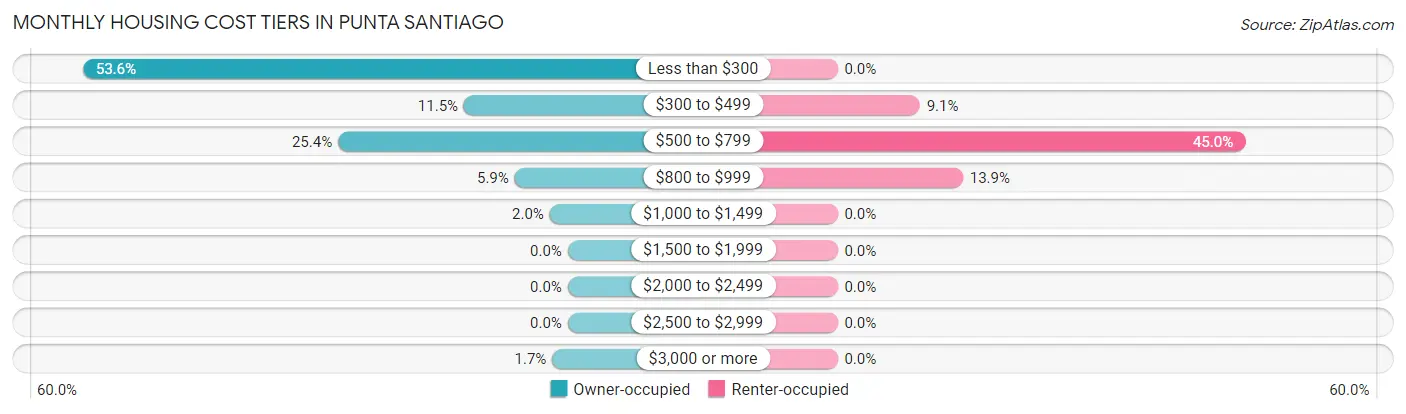
| Monthly Cost | Owner-occupied | Renter-occupied |
| Less than $300 | 593 (53.6%) | 0 (0.0%) |
| $300 to $499 | 127 (11.5%) | 21 (9.1%) |
| $500 to $799 | 281 (25.4%) | 104 (45.0%) |
| $800 to $999 | 65 (5.9%) | 32 (13.9%) |
| $1,000 to $1,499 | 22 (2.0%) | 0 (0.0%) |
| $1,500 to $1,999 | 0 (0.0%) | 0 (0.0%) |
| $2,000 to $2,499 | 0 (0.0%) | 0 (0.0%) |
| $2,500 to $2,999 | 0 (0.0%) | 0 (0.0%) |
| $3,000 or more | 19 (1.7%) | 0 (0.0%) |
| Total | 1,107 (100.0%) | 231 (100.0%) |
Physical Housing Characteristics in Punta Santiago
Housing Structures in Punta Santiago
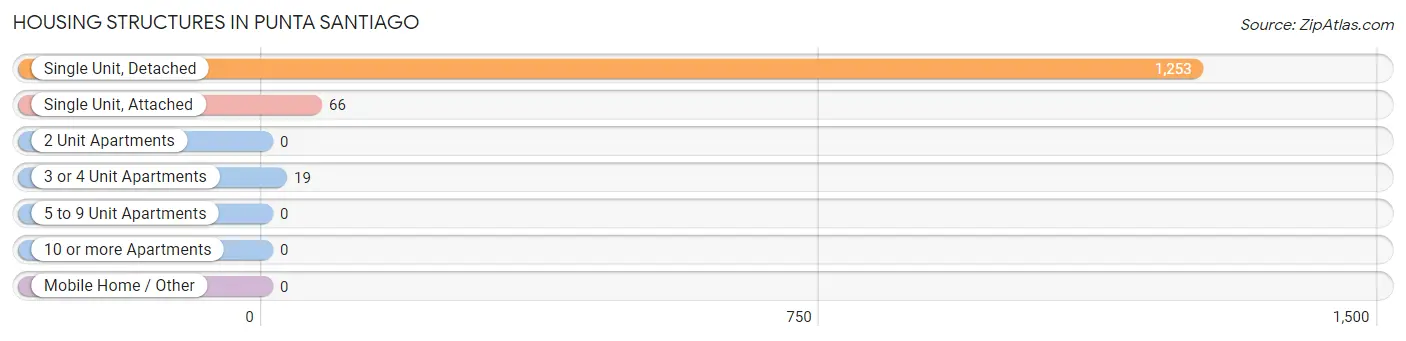
| Structure Type | # Housing Units | % Housing Units |
| Single Unit, Detached | 1,253 | 93.6% |
| Single Unit, Attached | 66 | 4.9% |
| 2 Unit Apartments | 0 | 0.0% |
| 3 or 4 Unit Apartments | 19 | 1.4% |
| 5 to 9 Unit Apartments | 0 | 0.0% |
| 10 or more Apartments | 0 | 0.0% |
| Mobile Home / Other | 0 | 0.0% |
| Total | 1,338 | 100.0% |
Housing Structures by Occupancy in Punta Santiago
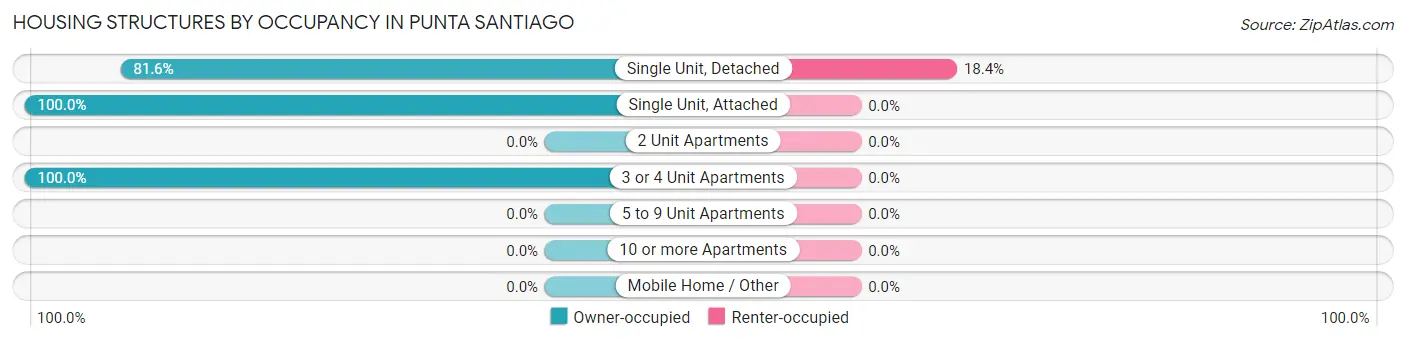
| Structure Type | Owner-occupied | Renter-occupied |
| Single Unit, Detached | 1,022 (81.6%) | 231 (18.4%) |
| Single Unit, Attached | 66 (100.0%) | 0 (0.0%) |
| 2 Unit Apartments | 0 (0.0%) | 0 (0.0%) |
| 3 or 4 Unit Apartments | 19 (100.0%) | 0 (0.0%) |
| 5 to 9 Unit Apartments | 0 (0.0%) | 0 (0.0%) |
| 10 or more Apartments | 0 (0.0%) | 0 (0.0%) |
| Mobile Home / Other | 0 (0.0%) | 0 (0.0%) |
| Total | 1,107 (82.7%) | 231 (17.3%) |
Housing Structures by Number of Rooms in Punta Santiago
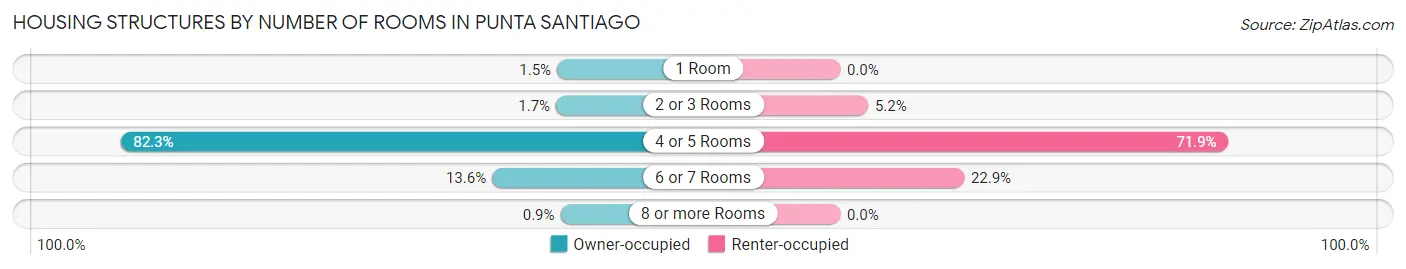
| Number of Rooms | Owner-occupied | Renter-occupied |
| 1 Room | 17 (1.5%) | 0 (0.0%) |
| 2 or 3 Rooms | 19 (1.7%) | 12 (5.2%) |
| 4 or 5 Rooms | 911 (82.3%) | 166 (71.9%) |
| 6 or 7 Rooms | 150 (13.6%) | 53 (22.9%) |
| 8 or more Rooms | 10 (0.9%) | 0 (0.0%) |
| Total | 1,107 (100.0%) | 231 (100.0%) |
Housing Structure by Heating Type in Punta Santiago
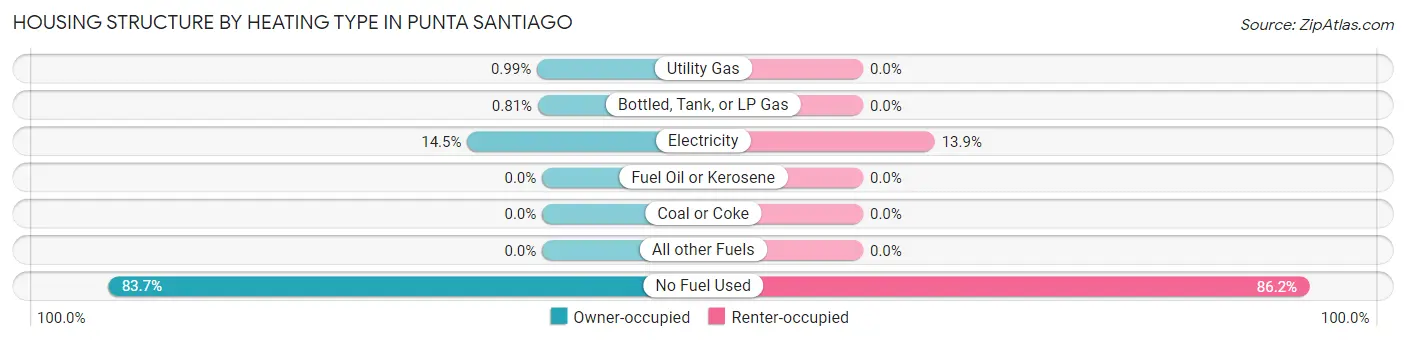
| Heating Type | Owner-occupied | Renter-occupied |
| Utility Gas | 11 (1.0%) | 0 (0.0%) |
| Bottled, Tank, or LP Gas | 9 (0.8%) | 0 (0.0%) |
| Electricity | 160 (14.4%) | 32 (13.9%) |
| Fuel Oil or Kerosene | 0 (0.0%) | 0 (0.0%) |
| Coal or Coke | 0 (0.0%) | 0 (0.0%) |
| All other Fuels | 0 (0.0%) | 0 (0.0%) |
| No Fuel Used | 927 (83.7%) | 199 (86.2%) |
| Total | 1,107 (100.0%) | 231 (100.0%) |
Household Vehicle Usage in Punta Santiago
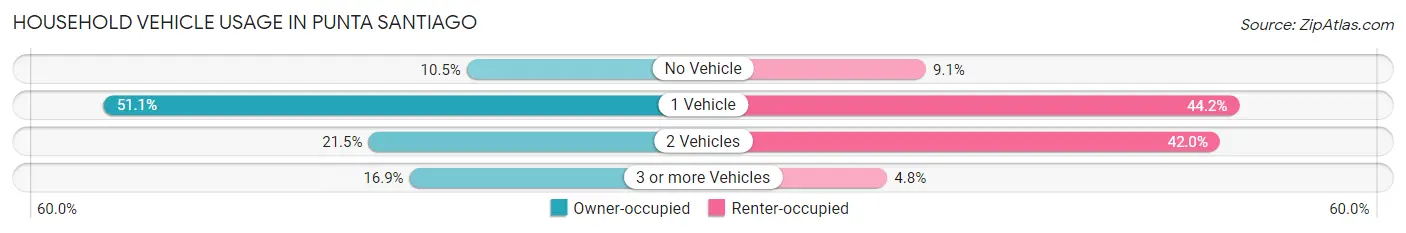
| Vehicles per Household | Owner-occupied | Renter-occupied |
| No Vehicle | 116 (10.5%) | 21 (9.1%) |
| 1 Vehicle | 566 (51.1%) | 102 (44.2%) |
| 2 Vehicles | 238 (21.5%) | 97 (42.0%) |
| 3 or more Vehicles | 187 (16.9%) | 11 (4.8%) |
| Total | 1,107 (100.0%) | 231 (100.0%) |
Real Estate & Mortgages in Punta Santiago
Real Estate and Mortgage Overview in Punta Santiago
| Characteristic | Without Mortgage | With Mortgage |
| Housing Units | 706 | 401 |
| Median Property Value | $87,800 | $96,200 |
| Median Household Income | $25,333 | $19 |
| Monthly Housing Costs | $184 | $19 |
| Real Estate Taxes | - | - |
Property Value by Mortgage Status in Punta Santiago
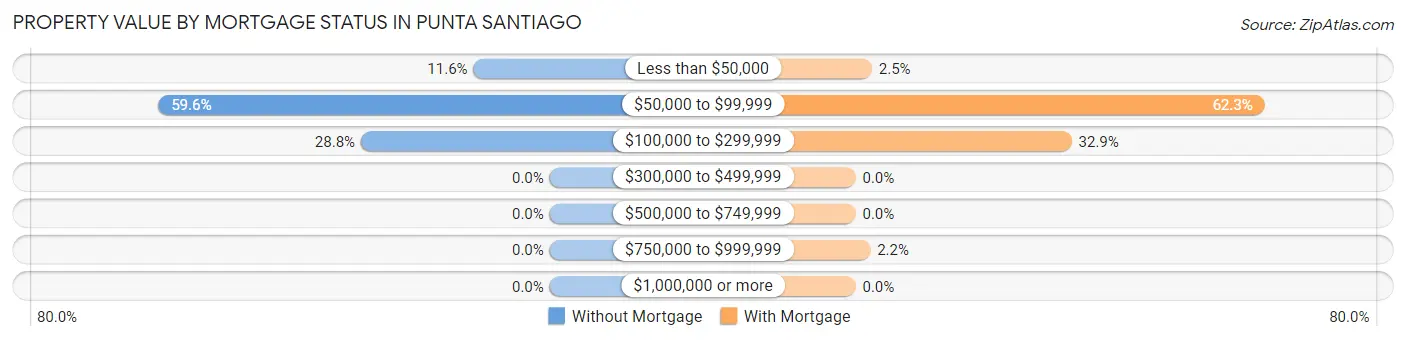
| Property Value | Without Mortgage | With Mortgage |
| Less than $50,000 | 82 (11.6%) | 10 (2.5%) |
| $50,000 to $99,999 | 421 (59.6%) | 250 (62.3%) |
| $100,000 to $299,999 | 203 (28.7%) | 132 (32.9%) |
| $300,000 to $499,999 | 0 (0.0%) | 0 (0.0%) |
| $500,000 to $749,999 | 0 (0.0%) | 0 (0.0%) |
| $750,000 to $999,999 | 0 (0.0%) | 9 (2.2%) |
| $1,000,000 or more | 0 (0.0%) | 0 (0.0%) |
| Total | 706 (100.0%) | 401 (100.0%) |
Household Income by Mortgage Status in Punta Santiago
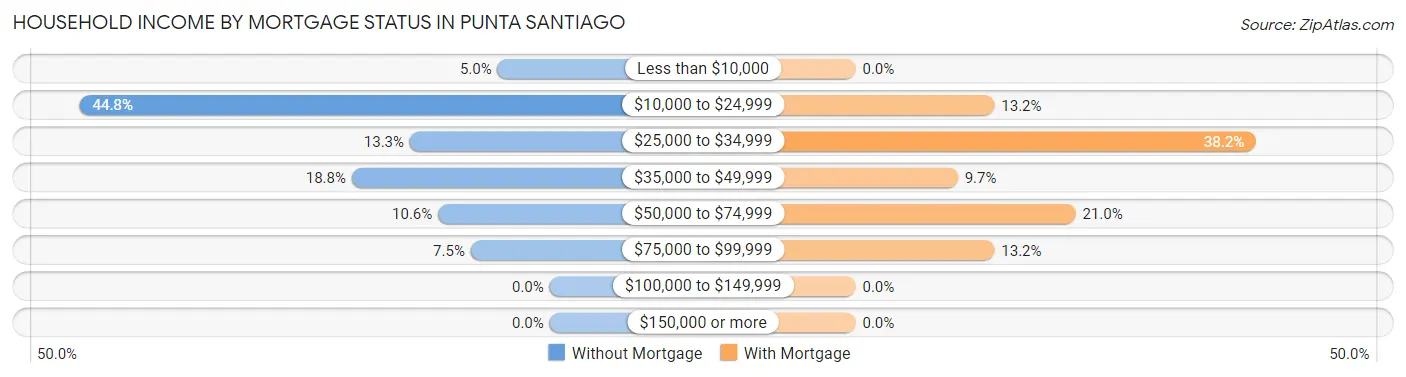
| Household Income | Without Mortgage | With Mortgage |
| Less than $10,000 | 35 (5.0%) | 0 (0.0%) |
| $10,000 to $24,999 | 316 (44.8%) | 53 (13.2%) |
| $25,000 to $34,999 | 94 (13.3%) | 153 (38.2%) |
| $35,000 to $49,999 | 133 (18.8%) | 39 (9.7%) |
| $50,000 to $74,999 | 75 (10.6%) | 84 (20.9%) |
| $75,000 to $99,999 | 53 (7.5%) | 53 (13.2%) |
| $100,000 to $149,999 | 0 (0.0%) | 0 (0.0%) |
| $150,000 or more | 0 (0.0%) | 0 (0.0%) |
| Total | 706 (100.0%) | 401 (100.0%) |
Property Value to Household Income Ratio in Punta Santiago
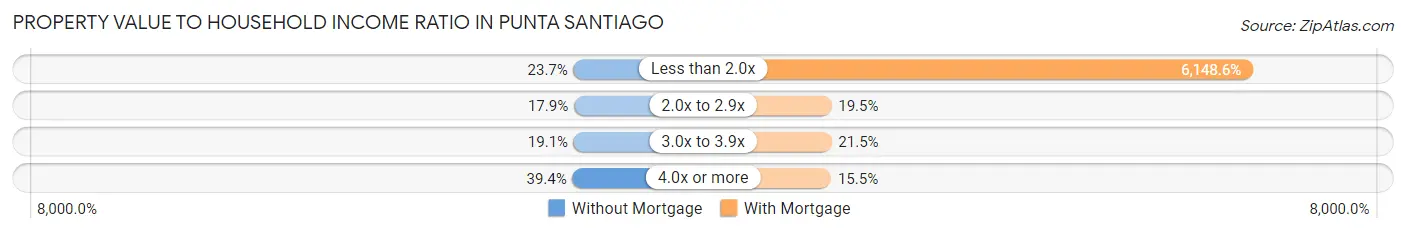
| Value-to-Income Ratio | Without Mortgage | With Mortgage |
| Less than 2.0x | 167 (23.6%) | 24,656 (6,148.6%) |
| 2.0x to 2.9x | 126 (17.8%) | 78 (19.5%) |
| 3.0x to 3.9x | 135 (19.1%) | 86 (21.4%) |
| 4.0x or more | 278 (39.4%) | 62 (15.5%) |
| Total | 706 (100.0%) | 401 (100.0%) |
Real Estate Taxes by Mortgage Status in Punta Santiago
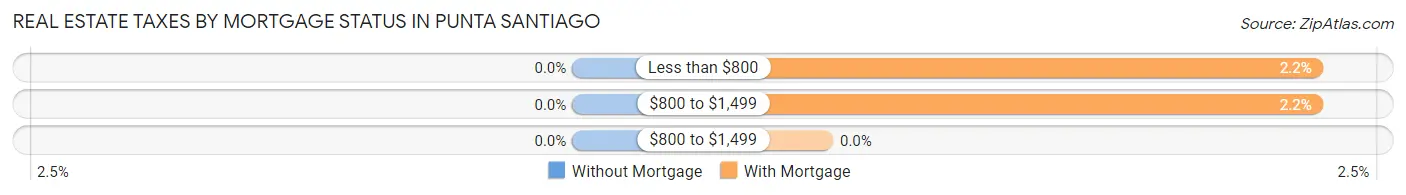
| Property Taxes | Without Mortgage | With Mortgage |
| Less than $800 | 0 (0.0%) | 9 (2.2%) |
| $800 to $1,499 | 0 (0.0%) | 9 (2.2%) |
| $800 to $1,499 | 0 (0.0%) | 0 (0.0%) |
| Total | 706 (100.0%) | 401 (100.0%) |
Health & Disability in Punta Santiago
Health Insurance Coverage by Age in Punta Santiago
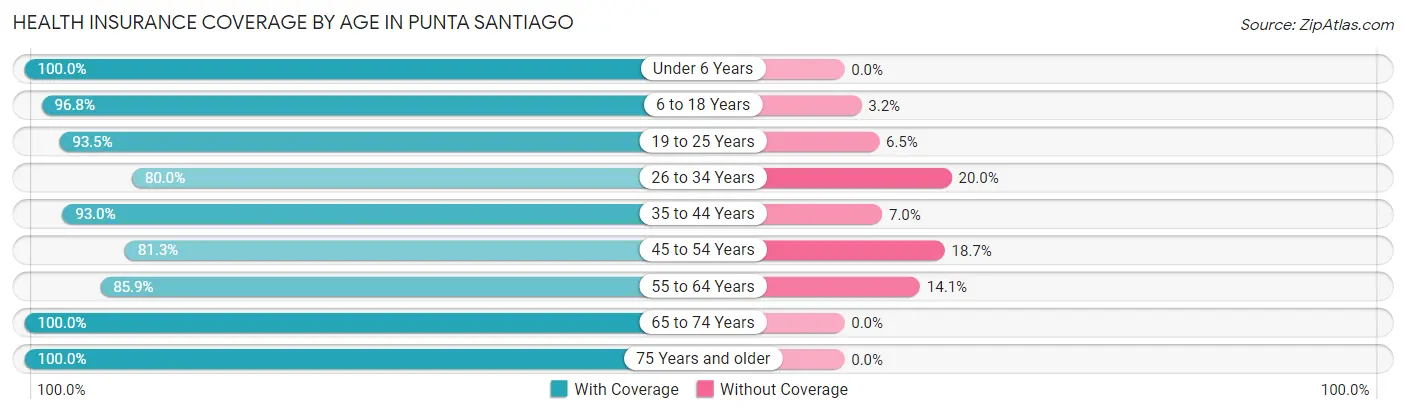
| Age Bracket | With Coverage | Without Coverage |
| Under 6 Years | 273 (100.0%) | 0 (0.0%) |
| 6 to 18 Years | 335 (96.8%) | 11 (3.2%) |
| 19 to 25 Years | 332 (93.5%) | 23 (6.5%) |
| 26 to 34 Years | 308 (80.0%) | 77 (20.0%) |
| 35 to 44 Years | 370 (93.0%) | 28 (7.0%) |
| 45 to 54 Years | 378 (81.3%) | 87 (18.7%) |
| 55 to 64 Years | 469 (85.9%) | 77 (14.1%) |
| 65 to 74 Years | 404 (100.0%) | 0 (0.0%) |
| 75 Years and older | 437 (100.0%) | 0 (0.0%) |
| Total | 3,306 (91.6%) | 303 (8.4%) |
Health Insurance Coverage by Citizenship Status in Punta Santiago
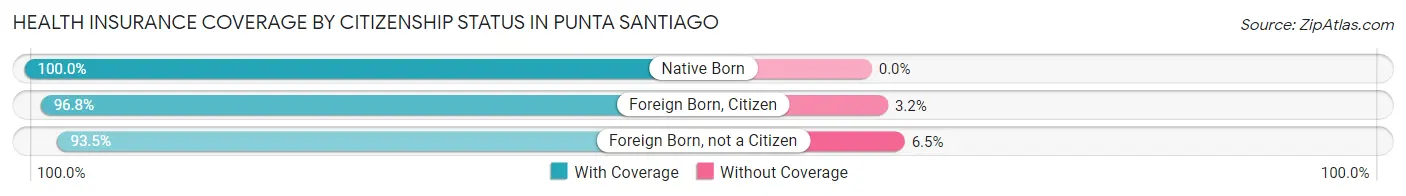
| Citizenship Status | With Coverage | Without Coverage |
| Native Born | 273 (100.0%) | 0 (0.0%) |
| Foreign Born, Citizen | 335 (96.8%) | 11 (3.2%) |
| Foreign Born, not a Citizen | 332 (93.5%) | 23 (6.5%) |
Health Insurance Coverage by Household Income in Punta Santiago
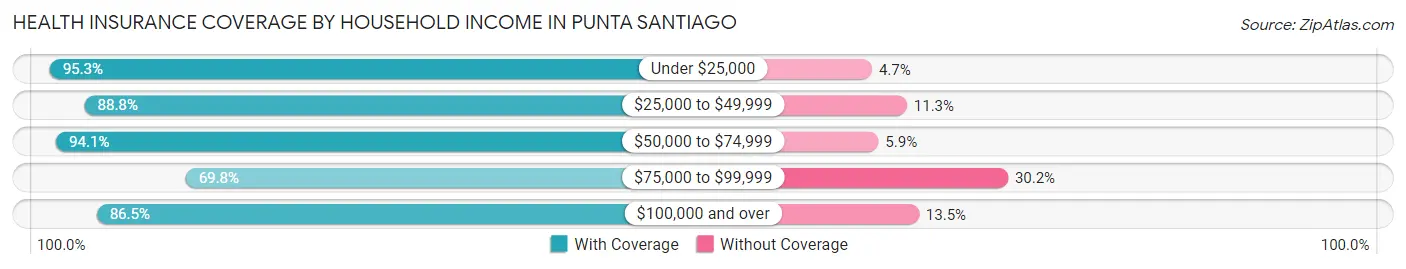
| Household Income | With Coverage | Without Coverage |
| Under $25,000 | 1,557 (95.3%) | 77 (4.7%) |
| $25,000 to $49,999 | 1,081 (88.7%) | 137 (11.3%) |
| $50,000 to $74,999 | 493 (94.1%) | 31 (5.9%) |
| $75,000 to $99,999 | 111 (69.8%) | 48 (30.2%) |
| $100,000 and over | 64 (86.5%) | 10 (13.5%) |
Public vs Private Health Insurance Coverage by Age in Punta Santiago
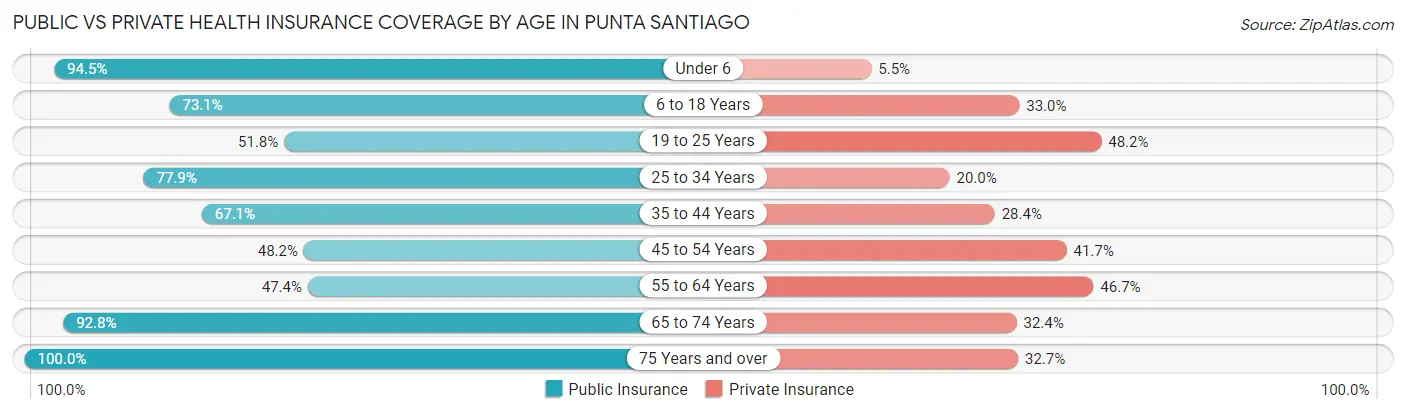
| Age Bracket | Public Insurance | Private Insurance |
| Under 6 | 258 (94.5%) | 15 (5.5%) |
| 6 to 18 Years | 253 (73.1%) | 114 (33.0%) |
| 19 to 25 Years | 184 (51.8%) | 171 (48.2%) |
| 25 to 34 Years | 300 (77.9%) | 77 (20.0%) |
| 35 to 44 Years | 267 (67.1%) | 113 (28.4%) |
| 45 to 54 Years | 224 (48.2%) | 194 (41.7%) |
| 55 to 64 Years | 259 (47.4%) | 255 (46.7%) |
| 65 to 74 Years | 375 (92.8%) | 131 (32.4%) |
| 75 Years and over | 437 (100.0%) | 143 (32.7%) |
| Total | 2,557 (70.9%) | 1,213 (33.6%) |
Disability Status by Sex by Age in Punta Santiago
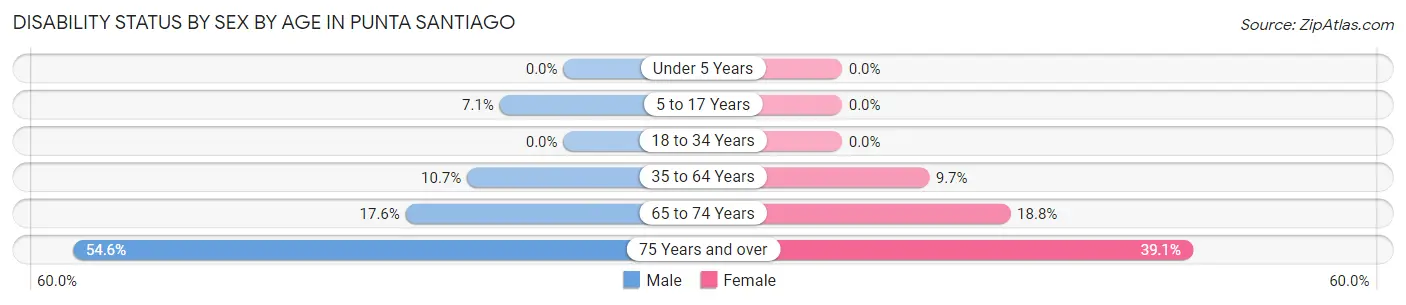
| Age Bracket | Male | Female |
| Under 5 Years | 0 (0.0%) | 0 (0.0%) |
| 5 to 17 Years | 9 (7.1%) | 0 (0.0%) |
| 18 to 34 Years | 0 (0.0%) | 0 (0.0%) |
| 35 to 64 Years | 67 (10.7%) | 76 (9.7%) |
| 65 to 74 Years | 26 (17.6%) | 48 (18.8%) |
| 75 Years and over | 71 (54.6%) | 120 (39.1%) |
Disability Class by Sex by Age in Punta Santiago
Disability Class: Hearing Difficulty
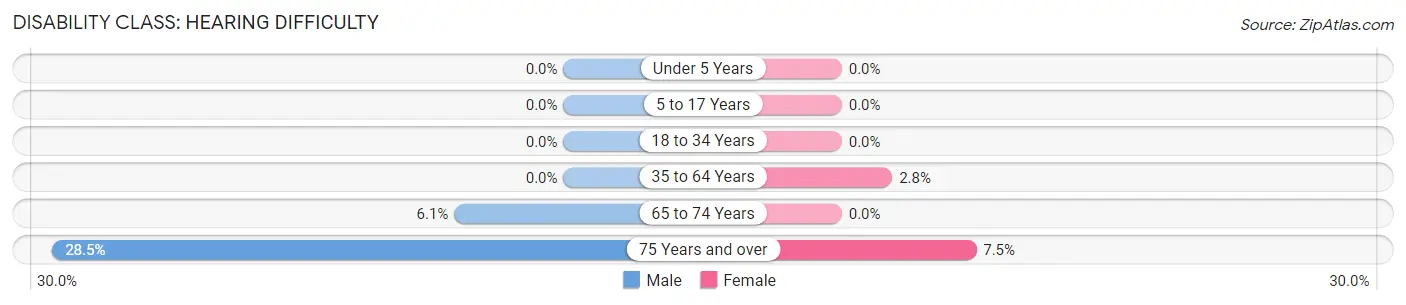
| Age Bracket | Male | Female |
| Under 5 Years | 0 (0.0%) | 0 (0.0%) |
| 5 to 17 Years | 0 (0.0%) | 0 (0.0%) |
| 18 to 34 Years | 0 (0.0%) | 0 (0.0%) |
| 35 to 64 Years | 0 (0.0%) | 22 (2.8%) |
| 65 to 74 Years | 9 (6.1%) | 0 (0.0%) |
| 75 Years and over | 37 (28.5%) | 23 (7.5%) |
Disability Class: Vision Difficulty
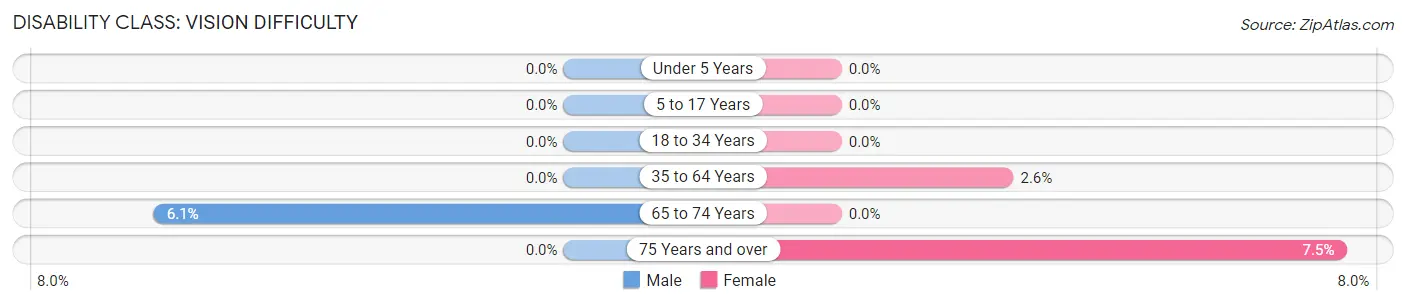
| Age Bracket | Male | Female |
| Under 5 Years | 0 (0.0%) | 0 (0.0%) |
| 5 to 17 Years | 0 (0.0%) | 0 (0.0%) |
| 18 to 34 Years | 0 (0.0%) | 0 (0.0%) |
| 35 to 64 Years | 0 (0.0%) | 20 (2.5%) |
| 65 to 74 Years | 9 (6.1%) | 0 (0.0%) |
| 75 Years and over | 0 (0.0%) | 23 (7.5%) |
Disability Class: Cognitive Difficulty
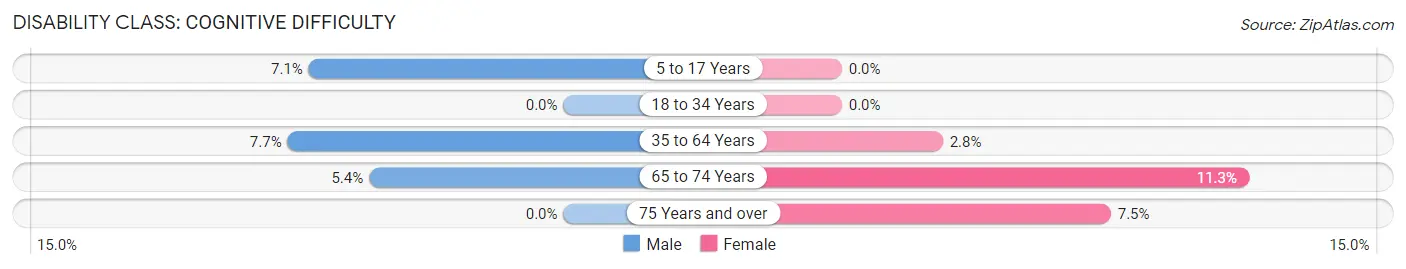
| Age Bracket | Male | Female |
| 5 to 17 Years | 9 (7.1%) | 0 (0.0%) |
| 18 to 34 Years | 0 (0.0%) | 0 (0.0%) |
| 35 to 64 Years | 48 (7.7%) | 22 (2.8%) |
| 65 to 74 Years | 8 (5.4%) | 29 (11.3%) |
| 75 Years and over | 0 (0.0%) | 23 (7.5%) |
Disability Class: Ambulatory Difficulty
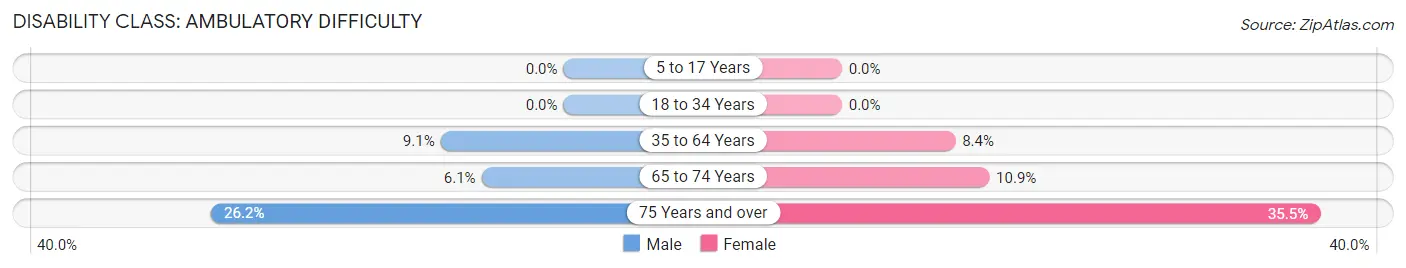
| Age Bracket | Male | Female |
| 5 to 17 Years | 0 (0.0%) | 0 (0.0%) |
| 18 to 34 Years | 0 (0.0%) | 0 (0.0%) |
| 35 to 64 Years | 57 (9.1%) | 66 (8.4%) |
| 65 to 74 Years | 9 (6.1%) | 28 (10.9%) |
| 75 Years and over | 34 (26.2%) | 109 (35.5%) |
Disability Class: Self-Care Difficulty
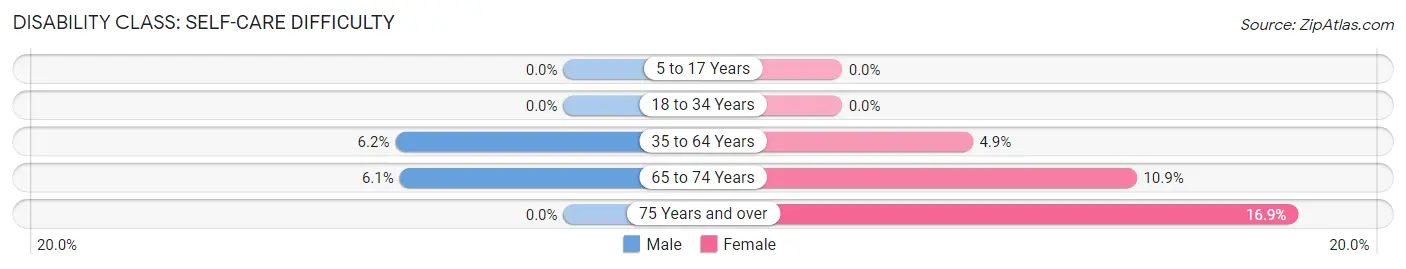
| Age Bracket | Male | Female |
| 5 to 17 Years | 0 (0.0%) | 0 (0.0%) |
| 18 to 34 Years | 0 (0.0%) | 0 (0.0%) |
| 35 to 64 Years | 39 (6.2%) | 38 (4.9%) |
| 65 to 74 Years | 9 (6.1%) | 28 (10.9%) |
| 75 Years and over | 0 (0.0%) | 52 (16.9%) |
Technology Access in Punta Santiago
Computing Device Access in Punta Santiago
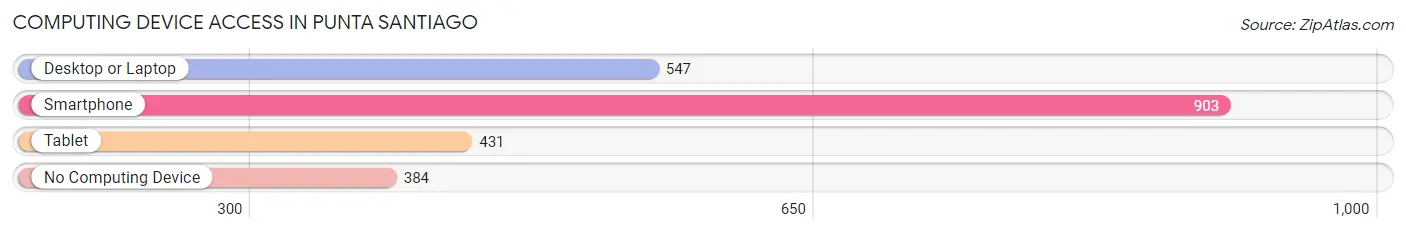
| Device Type | # Households | % Households |
| Desktop or Laptop | 547 | 40.9% |
| Smartphone | 903 | 67.5% |
| Tablet | 431 | 32.2% |
| No Computing Device | 384 | 28.7% |
| Total | 1,338 | 100.0% |
Internet Access in Punta Santiago
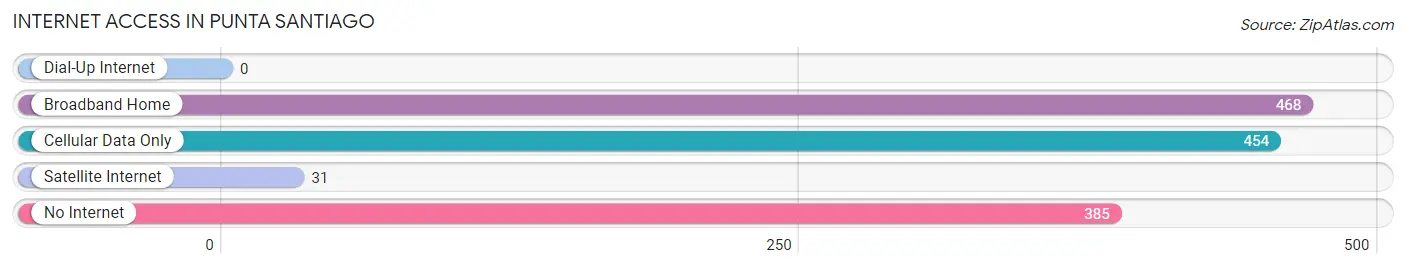
| Internet Type | # Households | % Households |
| Dial-Up Internet | 0 | 0.0% |
| Broadband Home | 468 | 35.0% |
| Cellular Data Only | 454 | 33.9% |
| Satellite Internet | 31 | 2.3% |
| No Internet | 385 | 28.8% |
| Total | 1,338 | 100.0% |
Punta Santiago Summary
Punta Santiago is a small fishing village located on the eastern coast of Puerto Rico, in the municipality of Humacao. It is situated on the north shore of the Humacao River, about 20 miles east of San Juan. The village is home to about 1,500 people, most of whom are of Puerto Rican descent.
History
Punta Santiago was founded in the late 19th century by fishermen from the nearby town of Humacao. The village was originally known as Punta de Santiago, named after the patron saint of fishermen, St. James. The village was a small fishing community, with a few small stores and a few houses.
In the early 20th century, the village began to grow and develop. The first school was built in the village in the 1920s, and the first church was built in the 1930s. The village also began to attract tourists, who came to enjoy the beautiful beaches and the fishing.
In the 1950s, the village was connected to the rest of Puerto Rico by a bridge, which allowed for easier access to the mainland. This led to an increase in tourism and development in the village.
Geography
Punta Santiago is located on the north shore of the Humacao River, about 20 miles east of San Juan. The village is situated on a small peninsula, surrounded by the Caribbean Sea on one side and the Humacao River on the other. The village is bordered by the towns of Humacao, Naguabo, and Yabucoa.
The village is home to several beaches, including Playa de Punta Santiago, Playa de Humacao, and Playa de Yabucoa. The beaches are popular with tourists and locals alike, and offer a variety of activities, such as swimming, snorkeling, and fishing.
Economy
The economy of Punta Santiago is largely based on fishing and tourism. The village is home to several small businesses, including restaurants, bars, and souvenir shops. The village also has a few small hotels and guesthouses, which cater to tourists.
The village is also home to several fishing boats, which are used to catch a variety of fish, including snapper, grouper, and mackerel. The fish are then sold to local restaurants and markets.
Demographics
As of the 2010 census, the population of Punta Santiago was 1,521. The majority of the population is of Puerto Rican descent, with a small minority of other ethnicities, including African, Dominican, and Cuban. The village is predominantly Roman Catholic, with a small minority of other religions, including Protestantism and Judaism.
The median household income in Punta Santiago is $17,000, and the median age is 37. The village has a high rate of poverty, with over 40% of the population living below the poverty line. The unemployment rate is also high, at around 20%.
Conclusion
Punta Santiago is a small fishing village located on the eastern coast of Puerto Rico. The village has a long history, and has been a popular destination for tourists for many years. The economy of the village is largely based on fishing and tourism, and the population is predominantly of Puerto Rican descent. The village has a high rate of poverty, and the median household income is low. Despite this, the village is a popular destination for tourists, and offers a variety of activities, such as swimming, snorkeling, and fishing.
Common Questions
What is Per Capita Income in Punta Santiago?
Per Capita income in Punta Santiago is $13,362.
What is the Median Family Income in Punta Santiago?
Median Family Income in Punta Santiago is $28,810.
What is the Median Household income in Punta Santiago?
Median Household Income in Punta Santiago is $23,821.
What is Income or Wage Gap in Punta Santiago?
Income or Wage Gap in Punta Santiago is 15.5%.
Women in Punta Santiago earn 84.5 cents for every dollar earned by a man.
What is Inequality or Gini Index in Punta Santiago?
Inequality or Gini Index in Punta Santiago is 0.39.
What is the Total Population of Punta Santiago?
Total Population of Punta Santiago is 3,627.
What is the Total Male Population of Punta Santiago?
Total Male Population of Punta Santiago is 1,615.
What is the Total Female Population of Punta Santiago?
Total Female Population of Punta Santiago is 2,012.
What is the Ratio of Males per 100 Females in Punta Santiago?
There are 80.27 Males per 100 Females in Punta Santiago.
What is the Ratio of Females per 100 Males in Punta Santiago?
There are 124.58 Females per 100 Males in Punta Santiago.
What is the Median Population Age in Punta Santiago?
Median Population Age in Punta Santiago is 47.1 Years.
What is the Average Family Size in Punta Santiago
Average Family Size in Punta Santiago is 3.2 People.
What is the Average Household Size in Punta Santiago
Average Household Size in Punta Santiago is 2.7 People.
How Large is the Labor Force in Punta Santiago?
There are 1,227 People in the Labor Forcein in Punta Santiago.
What is the Percentage of People in the Labor Force in Punta Santiago?
39.8% of People are in the Labor Force in Punta Santiago.
What is the Unemployment Rate in Punta Santiago?
Unemployment Rate in Punta Santiago is 10.4%.