San German, PR Map & Demographics
San German Overview
$13,115
PER CAPITA INCOME
$25,138
AVG FAMILY INCOME
$15,707
AVG HOUSEHOLD INCOME
11.3%
WAGE / INCOME GAP [ % ]
88.7¢/ $1
WAGE / INCOME GAP [ $ ]
$16,075
FAMILY INCOME DEFICIT
0.61
INEQUALITY / GINI INDEX
10,266
TOTAL POPULATION
4,538
MALE POPULATION
5,728
FEMALE POPULATION
79.22
MALES / 100 FEMALES
126.22
FEMALES / 100 MALES
42.1
MEDIAN AGE
3.7
AVG FAMILY SIZE
2.5
AVG HOUSEHOLD SIZE
2,392
LABOR FORCE [ PEOPLE ]
28.0%
PERCENT IN LABOR FORCE
7.7%
UNEMPLOYMENT RATE
San German Zip Codes
Income in San German
Income Overview in San German
Per Capita Income in San German is $13,115, while median incomes of families and households are $25,138 and $15,707 respectively.
| Characteristic | Number | Measure |
| Per Capita Income | 10,266 | $13,115 |
| Median Family Income | 2,100 | $25,138 |
| Mean Family Income | 2,100 | $38,283 |
| Median Household Income | 3,995 | $15,707 |
| Mean Household Income | 3,995 | $27,022 |
| Income Deficit | 2,100 | $16,075 |
| Wage / Income Gap (%) | 10,266 | 11.30% |
| Wage / Income Gap ($) | 10,266 | 88.70¢ per $1 |
| Gini / Inequality Index | 10,266 | 0.61 |
Earnings by Sex in San German
Average Earnings in San German are $16,628, $17,612 for men and $15,621 for women, a difference of 11.3%.
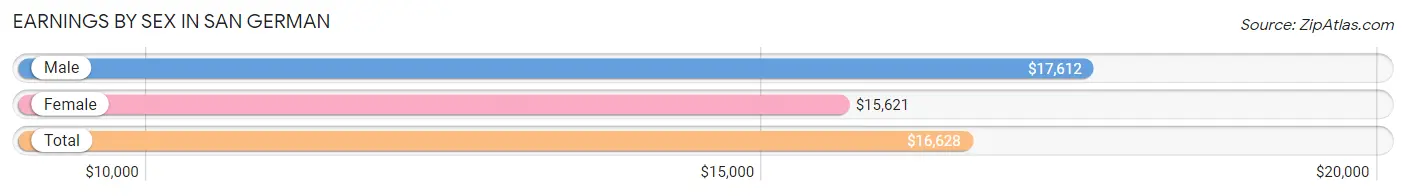
| Sex | Number | Average Earnings |
| Male | 1,172 (48.7%) | $17,612 |
| Female | 1,233 (51.3%) | $15,621 |
| Total | 2,405 (100.0%) | $16,628 |
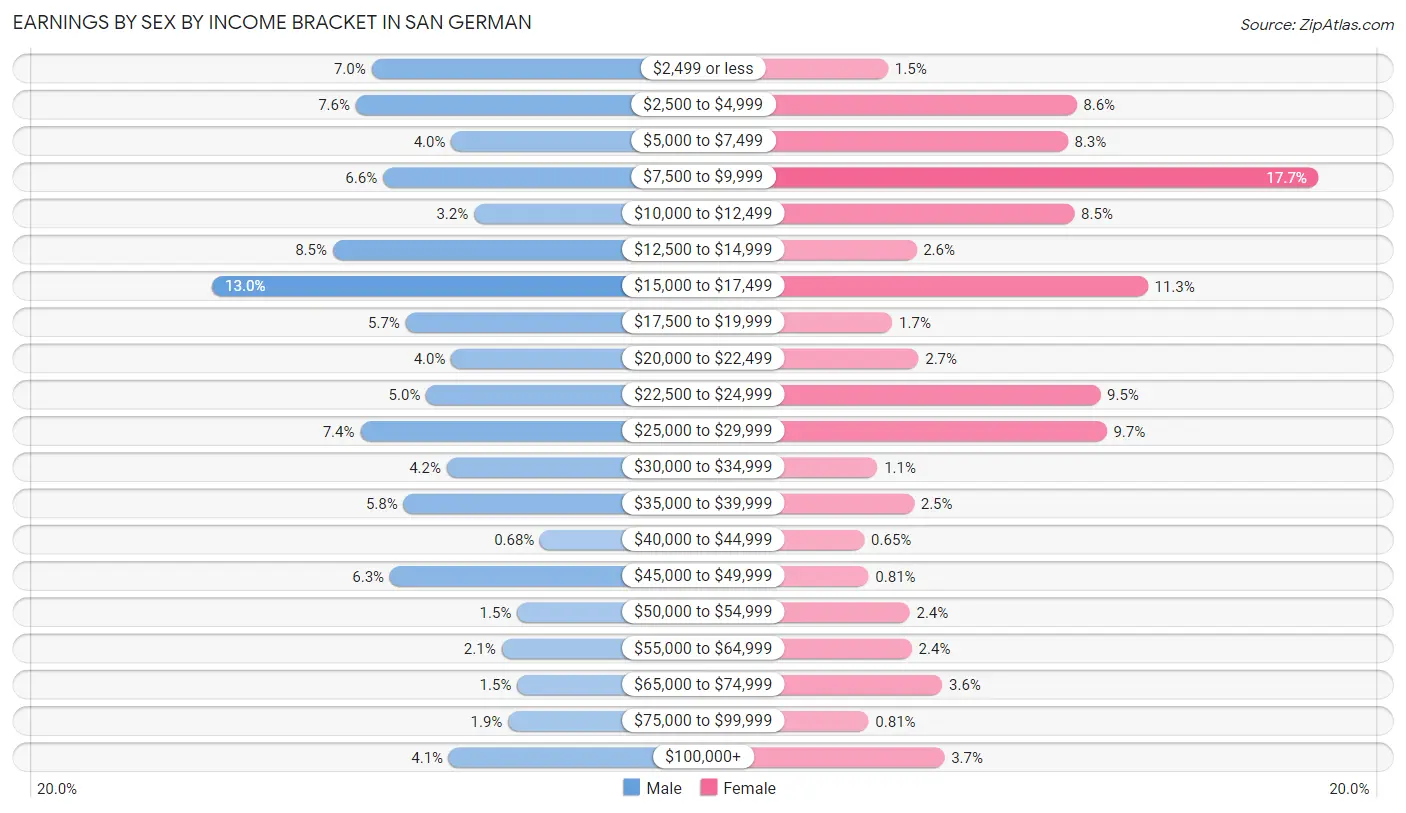
Earnings by Sex by Income Bracket in San German
The most common earnings brackets in San German are $15,000 to $17,499 for men (152 | 13.0%) and $7,500 to $9,999 for women (218 | 17.7%).
| Income | Male | Female |
| $2,499 or less | 82 (7.0%) | 19 (1.5%) |
| $2,500 to $4,999 | 89 (7.6%) | 106 (8.6%) |
| $5,000 to $7,499 | 47 (4.0%) | 102 (8.3%) |
| $7,500 to $9,999 | 77 (6.6%) | 218 (17.7%) |
| $10,000 to $12,499 | 37 (3.2%) | 105 (8.5%) |
| $12,500 to $14,999 | 99 (8.5%) | 32 (2.6%) |
| $15,000 to $17,499 | 152 (13.0%) | 139 (11.3%) |
| $17,500 to $19,999 | 67 (5.7%) | 21 (1.7%) |
| $20,000 to $22,499 | 47 (4.0%) | 33 (2.7%) |
| $22,500 to $24,999 | 58 (5.0%) | 117 (9.5%) |
| $25,000 to $29,999 | 87 (7.4%) | 120 (9.7%) |
| $30,000 to $34,999 | 49 (4.2%) | 14 (1.1%) |
| $35,000 to $39,999 | 68 (5.8%) | 31 (2.5%) |
| $40,000 to $44,999 | 8 (0.7%) | 8 (0.6%) |
| $45,000 to $49,999 | 74 (6.3%) | 10 (0.8%) |
| $50,000 to $54,999 | 18 (1.5%) | 29 (2.4%) |
| $55,000 to $64,999 | 25 (2.1%) | 30 (2.4%) |
| $65,000 to $74,999 | 18 (1.5%) | 44 (3.6%) |
| $75,000 to $99,999 | 22 (1.9%) | 10 (0.8%) |
| $100,000+ | 48 (4.1%) | 45 (3.6%) |
| Total | 1,172 (100.0%) | 1,233 (100.0%) |
Earnings by Sex by Educational Attainment in San German
Average earnings in San German are $19,739 for men and $17,014 for women, a difference of 13.8%. Men with an educational attainment of graduate degree enjoy the highest average annual earnings of $38,546, while those with high school diploma education earn the least with $16,382. Women with an educational attainment of graduate degree earn the most with the average annual earnings of $46,500, while those with high school diploma education have the smallest earnings of $12,096.
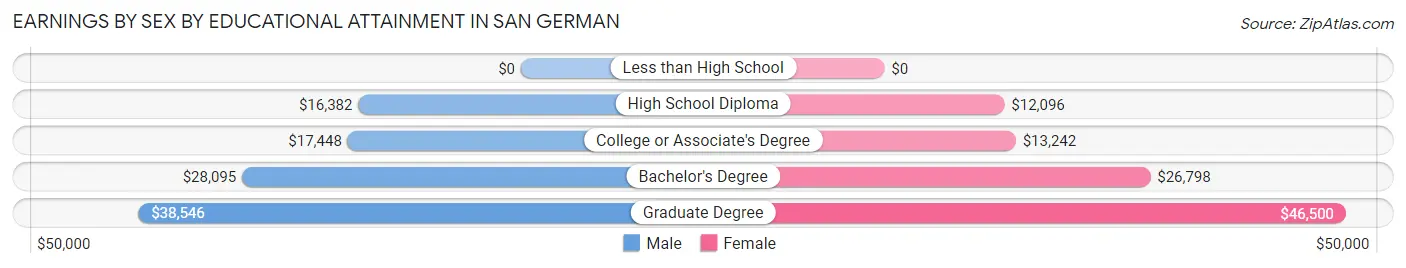
| Educational Attainment | Male Income | Female Income |
| Less than High School | - | - |
| High School Diploma | $16,382 | $12,096 |
| College or Associate's Degree | $17,448 | $13,242 |
| Bachelor's Degree | $28,095 | $26,798 |
| Graduate Degree | $38,546 | $46,500 |
| Total | $19,739 | $17,014 |
Family Income in San German
Family Income Brackets in San German
According to the San German family income data, there are 634 families falling into the less than $10,000 income range, which is the most common income bracket and makes up 30.2% of all families. Conversely, the $200,000+ income bracket is the least frequent group with only 8 families (0.4%) belonging to this category.
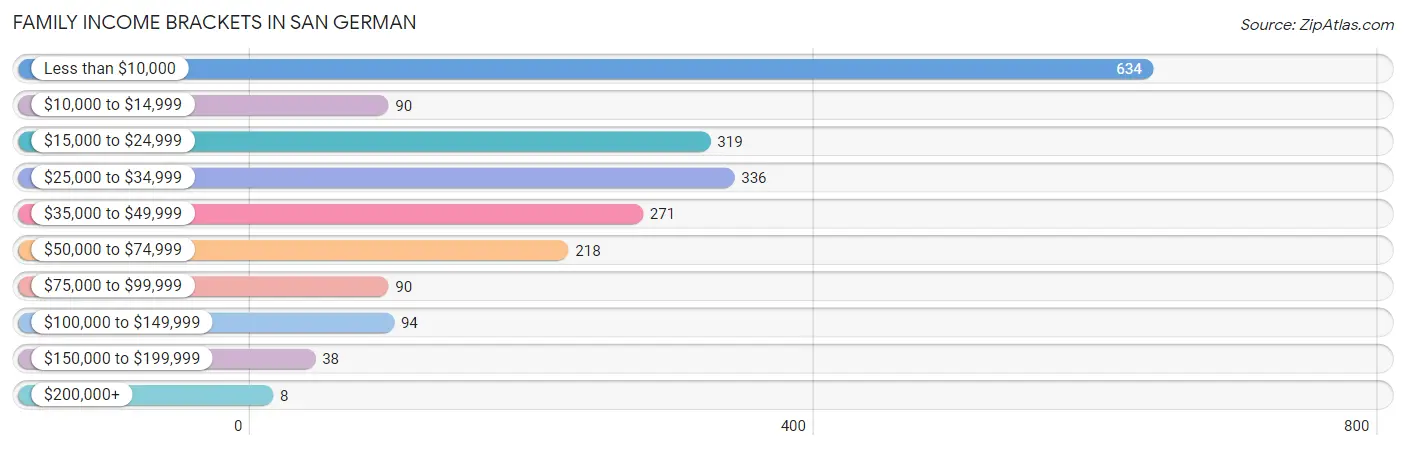
| Income Bracket | # Families | % Families |
| Less than $10,000 | 634 | 30.2% |
| $10,000 to $14,999 | 90 | 4.3% |
| $15,000 to $24,999 | 319 | 15.2% |
| $25,000 to $34,999 | 336 | 16.0% |
| $35,000 to $49,999 | 271 | 12.9% |
| $50,000 to $74,999 | 218 | 10.4% |
| $75,000 to $99,999 | 90 | 4.3% |
| $100,000 to $149,999 | 94 | 4.5% |
| $150,000 to $199,999 | 38 | 1.8% |
| $200,000+ | 8 | 0.4% |
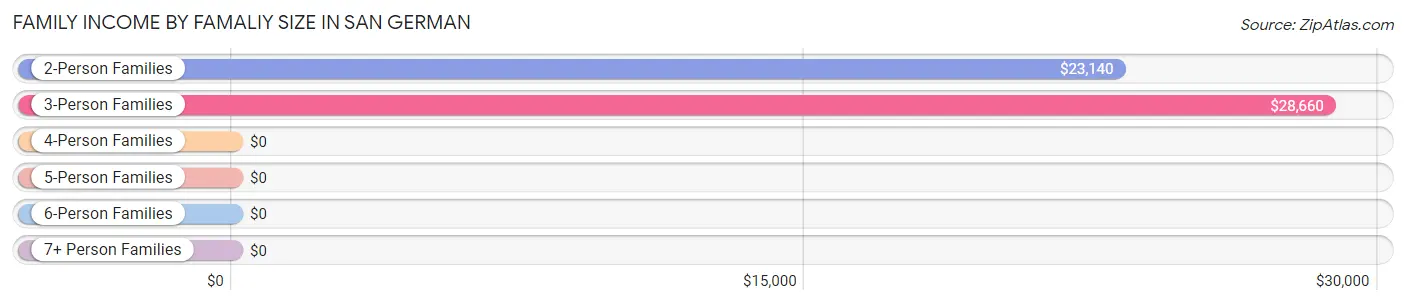
Family Income by Famaliy Size in San German
3-person families (609 | 29.0%) account for the highest median family income in San German with $28,660 per family, while 2-person families (1,099 | 52.3%) have the highest median income of $11,570 per family member.
| Income Bracket | # Families | Median Income |
| 2-Person Families | 1,099 (52.3%) | $23,140 |
| 3-Person Families | 609 (29.0%) | $28,660 |
| 4-Person Families | 198 (9.4%) | $0 |
| 5-Person Families | 119 (5.7%) | $0 |
| 6-Person Families | 61 (2.9%) | $0 |
| 7+ Person Families | 14 (0.7%) | $0 |
| Total | 2,100 (100.0%) | $25,138 |
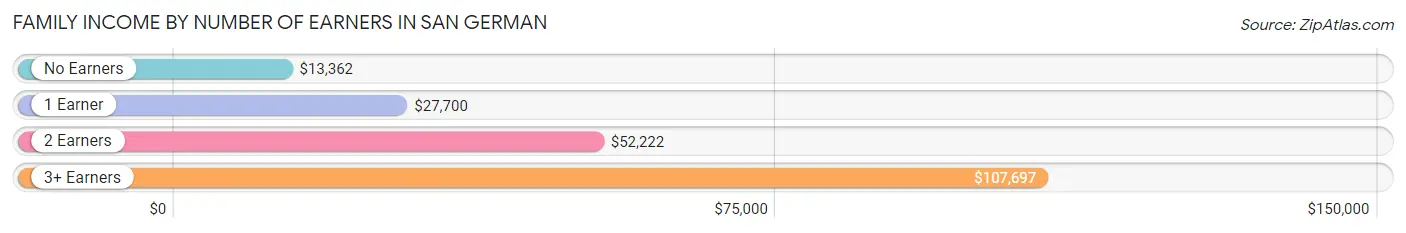
Family Income by Number of Earners in San German
The median family income in San German is $25,138, with families comprising 3+ earners (55) having the highest median family income of $107,697, while families with no earners (976) have the lowest median family income of $13,362, accounting for 2.6% and 46.5% of families, respectively.
| Number of Earners | # Families | Median Income |
| No Earners | 976 (46.5%) | $13,362 |
| 1 Earner | 753 (35.9%) | $27,700 |
| 2 Earners | 316 (15.0%) | $52,222 |
| 3+ Earners | 55 (2.6%) | $107,697 |
| Total | 2,100 (100.0%) | $25,138 |
Household Income in San German
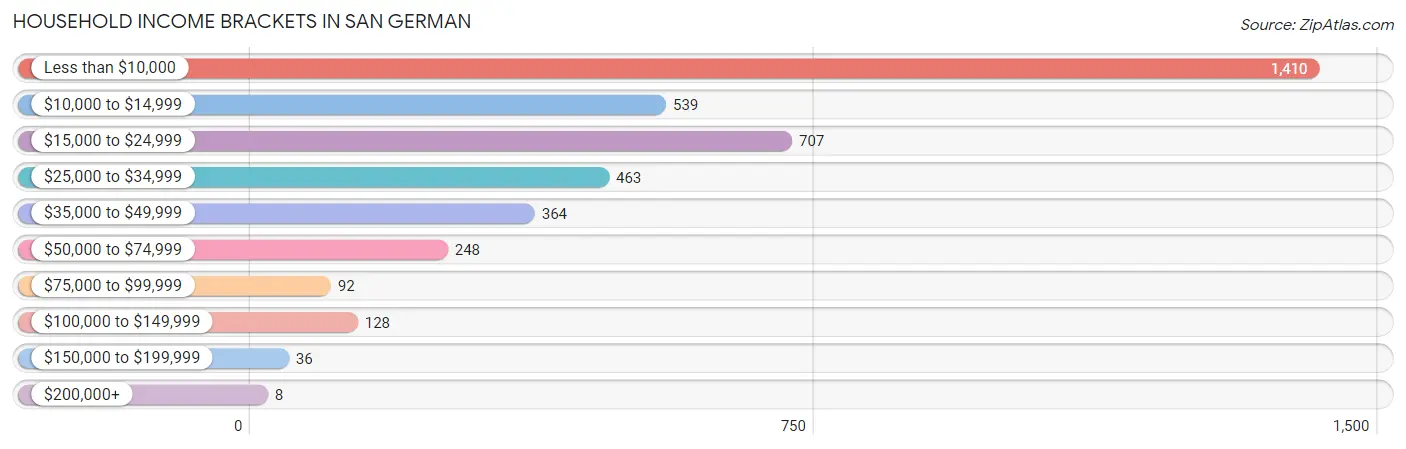
Household Income Brackets in San German
With 1,410 households falling in the category, the less than $10,000 income range is the most frequent in San German, accounting for 35.3% of all households. In contrast, only 8 households (0.2%) fall into the $200,000+ income bracket, making it the least populous group.
| Income Bracket | # Households | % Households |
| Less than $10,000 | 1,410 | 35.3% |
| $10,000 to $14,999 | 539 | 13.5% |
| $15,000 to $24,999 | 707 | 17.7% |
| $25,000 to $34,999 | 463 | 11.6% |
| $35,000 to $49,999 | 364 | 9.1% |
| $50,000 to $74,999 | 248 | 6.2% |
| $75,000 to $99,999 | 92 | 2.3% |
| $100,000 to $149,999 | 128 | 3.2% |
| $150,000 to $199,999 | 36 | 0.9% |
| $200,000+ | 8 | 0.2% |
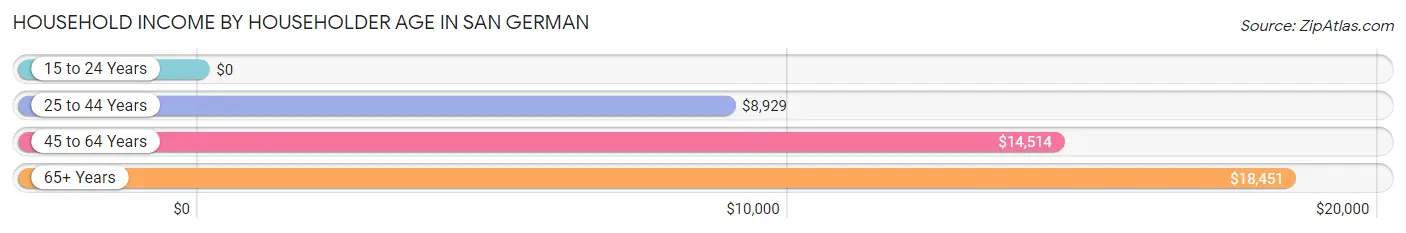
Household Income by Householder Age in San German
The median household income in San German is $15,707, with the highest median household income of $18,451 found in the 65+ years age bracket for the primary householder. A total of 1,753 households (43.9%) fall into this category. Meanwhile, the 15 to 24 years age bracket for the primary householder has the lowest median household income of $0, with 68 households (1.7%) in this group.
| Income Bracket | # Households | Median Income |
| 15 to 24 Years | 68 (1.7%) | $0 |
| 25 to 44 Years | 884 (22.1%) | $8,929 |
| 45 to 64 Years | 1,290 (32.3%) | $14,514 |
| 65+ Years | 1,753 (43.9%) | $18,451 |
| Total | 3,995 (100.0%) | $15,707 |
Poverty in San German
Income Below Poverty by Sex and Age in San German
With 50.2% poverty level for males and 51.9% for females among the residents of San German, 5 year old males and 5 year old females are the most vulnerable to poverty, with 48 males (100.0%) and 47 females (100.0%) in their respective age groups living below the poverty level.
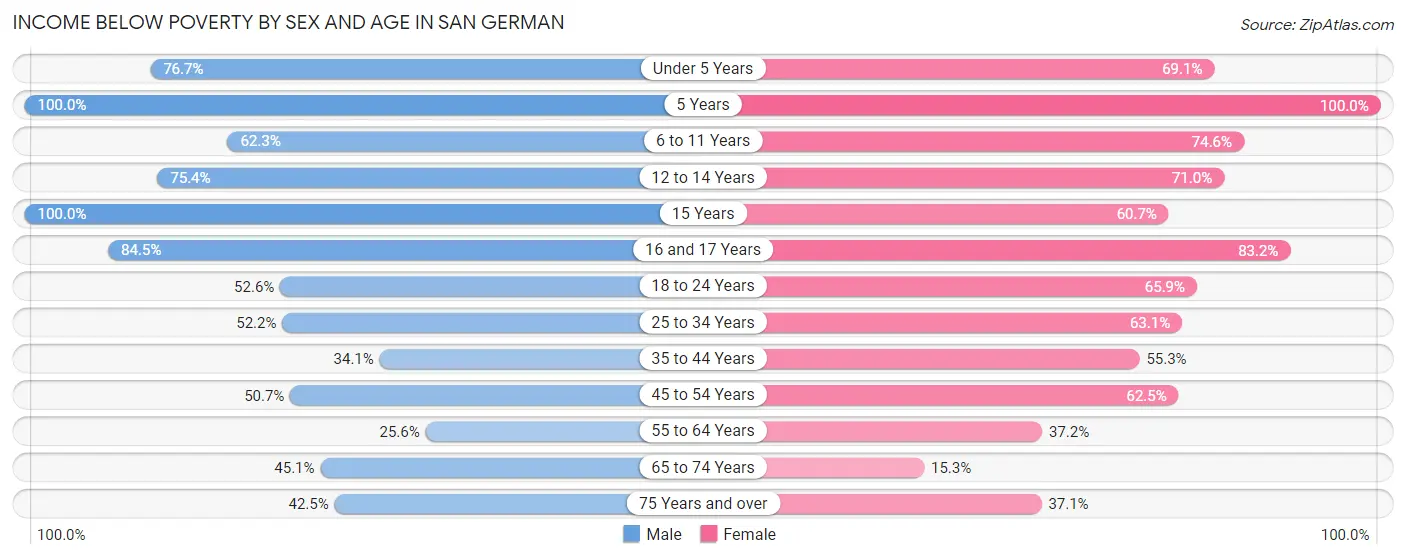
| Age Bracket | Male | Female |
| Under 5 Years | 194 (76.7%) | 94 (69.1%) |
| 5 Years | 48 (100.0%) | 47 (100.0%) |
| 6 to 11 Years | 144 (62.3%) | 291 (74.6%) |
| 12 to 14 Years | 217 (75.3%) | 149 (71.0%) |
| 15 Years | 21 (100.0%) | 54 (60.7%) |
| 16 and 17 Years | 60 (84.5%) | 124 (83.2%) |
| 18 to 24 Years | 215 (52.6%) | 286 (65.9%) |
| 25 to 34 Years | 324 (52.2%) | 447 (63.1%) |
| 35 to 44 Years | 164 (34.1%) | 337 (55.2%) |
| 45 to 54 Years | 216 (50.7%) | 355 (62.5%) |
| 55 to 64 Years | 100 (25.6%) | 226 (37.2%) |
| 65 to 74 Years | 244 (45.1%) | 92 (15.3%) |
| 75 Years and over | 279 (42.5%) | 345 (37.1%) |
| Total | 2,226 (50.2%) | 2,847 (51.9%) |
Income Above Poverty by Sex and Age in San German
According to the poverty statistics in San German, males aged 55 to 64 years and females aged 65 to 74 years are the age groups that are most secure financially, with 74.4% of males and 84.7% of females in these age groups living above the poverty line.
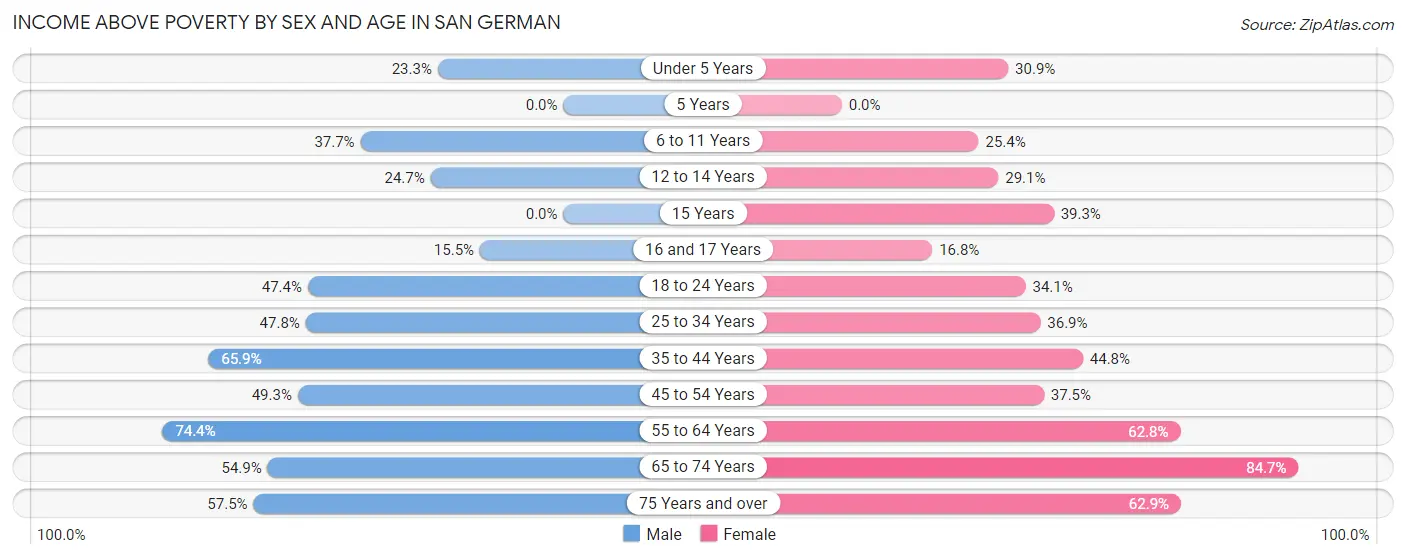
| Age Bracket | Male | Female |
| Under 5 Years | 59 (23.3%) | 42 (30.9%) |
| 5 Years | 0 (0.0%) | 0 (0.0%) |
| 6 to 11 Years | 87 (37.7%) | 99 (25.4%) |
| 12 to 14 Years | 71 (24.6%) | 61 (29.0%) |
| 15 Years | 0 (0.0%) | 35 (39.3%) |
| 16 and 17 Years | 11 (15.5%) | 25 (16.8%) |
| 18 to 24 Years | 194 (47.4%) | 148 (34.1%) |
| 25 to 34 Years | 297 (47.8%) | 261 (36.9%) |
| 35 to 44 Years | 317 (65.9%) | 273 (44.8%) |
| 45 to 54 Years | 210 (49.3%) | 213 (37.5%) |
| 55 to 64 Years | 291 (74.4%) | 382 (62.8%) |
| 65 to 74 Years | 297 (54.9%) | 511 (84.7%) |
| 75 Years and over | 378 (57.5%) | 586 (62.9%) |
| Total | 2,212 (49.8%) | 2,636 (48.1%) |
Income Below Poverty Among Married-Couple Families in San German
The poverty statistics for married-couple families in San German show that 28.7% or 341 of the total 1,188 families live below the poverty line. Families with 1 or 2 children have the highest poverty rate of 50.6%, comprising of 128 families. On the other hand, families with 3 or 4 children have the lowest poverty rate of 0.0%, which includes 0 families.
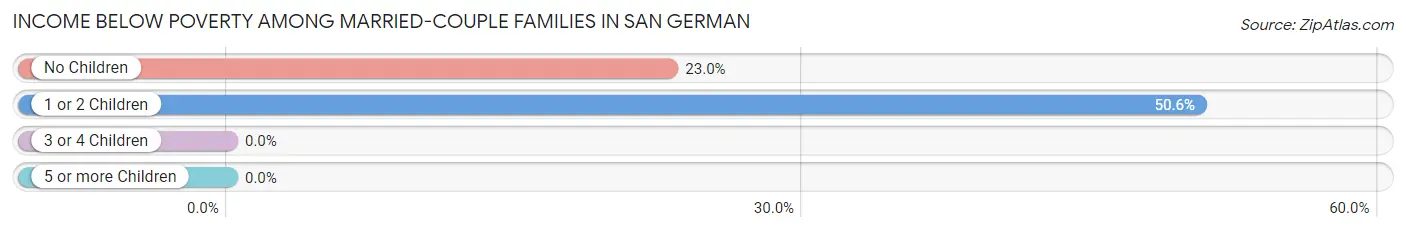
| Children | Above Poverty | Below Poverty |
| No Children | 713 (77.0%) | 213 (23.0%) |
| 1 or 2 Children | 125 (49.4%) | 128 (50.6%) |
| 3 or 4 Children | 9 (100.0%) | 0 (0.0%) |
| 5 or more Children | 0 (0.0%) | 0 (0.0%) |
| Total | 847 (71.3%) | 341 (28.7%) |
Income Below Poverty Among Single-Parent Households in San German
According to the poverty data in San German, 53.4% or 55 single-father households and 60.6% or 490 single-mother households are living below the poverty line. Among single-father households, those with 1 or 2 children have the highest poverty rate, with 35 households (100.0%) experiencing poverty. Likewise, among single-mother households, those with 3 or 4 children have the highest poverty rate, with 70 households (100.0%) falling below the poverty line.
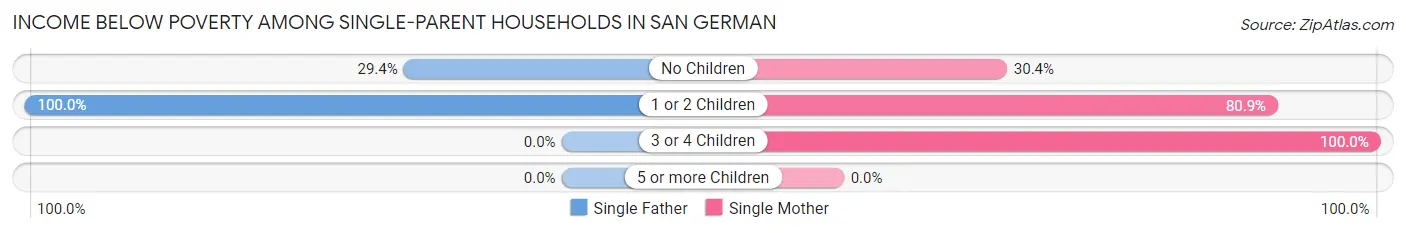
| Children | Single Father | Single Mother |
| No Children | 20 (29.4%) | 107 (30.4%) |
| 1 or 2 Children | 35 (100.0%) | 313 (80.9%) |
| 3 or 4 Children | 0 (0.0%) | 70 (100.0%) |
| 5 or more Children | 0 (0.0%) | 0 (0.0%) |
| Total | 55 (53.4%) | 490 (60.6%) |
Income Below Poverty Among Married-Couple vs Single-Parent Households in San German
The poverty data for San German shows that 341 of the married-couple family households (28.7%) and 545 of the single-parent households (59.8%) are living below the poverty level. Within the married-couple family households, those with 1 or 2 children have the highest poverty rate, with 128 households (50.6%) falling below the poverty line. Among the single-parent households, those with 3 or 4 children have the highest poverty rate, with 70 household (100.0%) living below poverty.
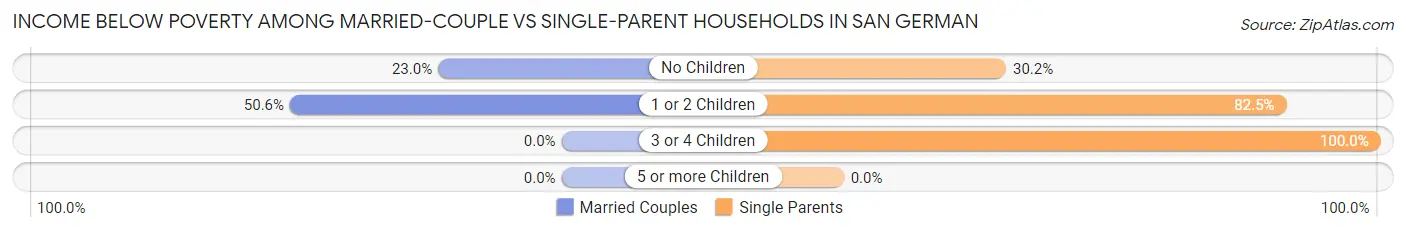
| Children | Married-Couple Families | Single-Parent Households |
| No Children | 213 (23.0%) | 127 (30.2%) |
| 1 or 2 Children | 128 (50.6%) | 348 (82.5%) |
| 3 or 4 Children | 0 (0.0%) | 70 (100.0%) |
| 5 or more Children | 0 (0.0%) | 0 (0.0%) |
| Total | 341 (28.7%) | 545 (59.8%) |
Race in San German
The most populous races in San German are Hispanic or Latino (10,213 | 99.5%), White / Caucasian (7,114 | 69.3%), and Some other Race (2,093 | 20.4%).
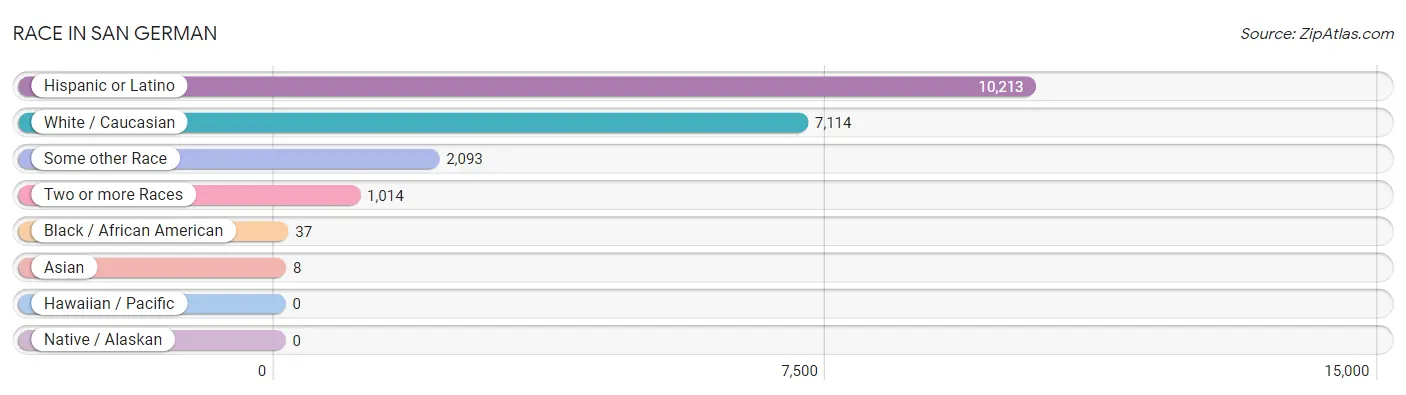
| Race | # Population | % Population |
| Asian | 8 | 0.1% |
| Black / African American | 37 | 0.4% |
| Hawaiian / Pacific | 0 | 0.0% |
| Hispanic or Latino | 10,213 | 99.5% |
| Native / Alaskan | 0 | 0.0% |
| White / Caucasian | 7,114 | 69.3% |
| Two or more Races | 1,014 | 9.9% |
| Some other Race | 2,093 | 20.4% |
| Total | 10,266 | 100.0% |
Ancestry in San German
The most populous ancestries reported in San German are Puerto Rican (10,108 | 98.5%), American (62 | 0.6%), West Indian (53 | 0.5%), South American (41 | 0.4%), and French (29 | 0.3%), together accounting for 100.3% of all San German residents.
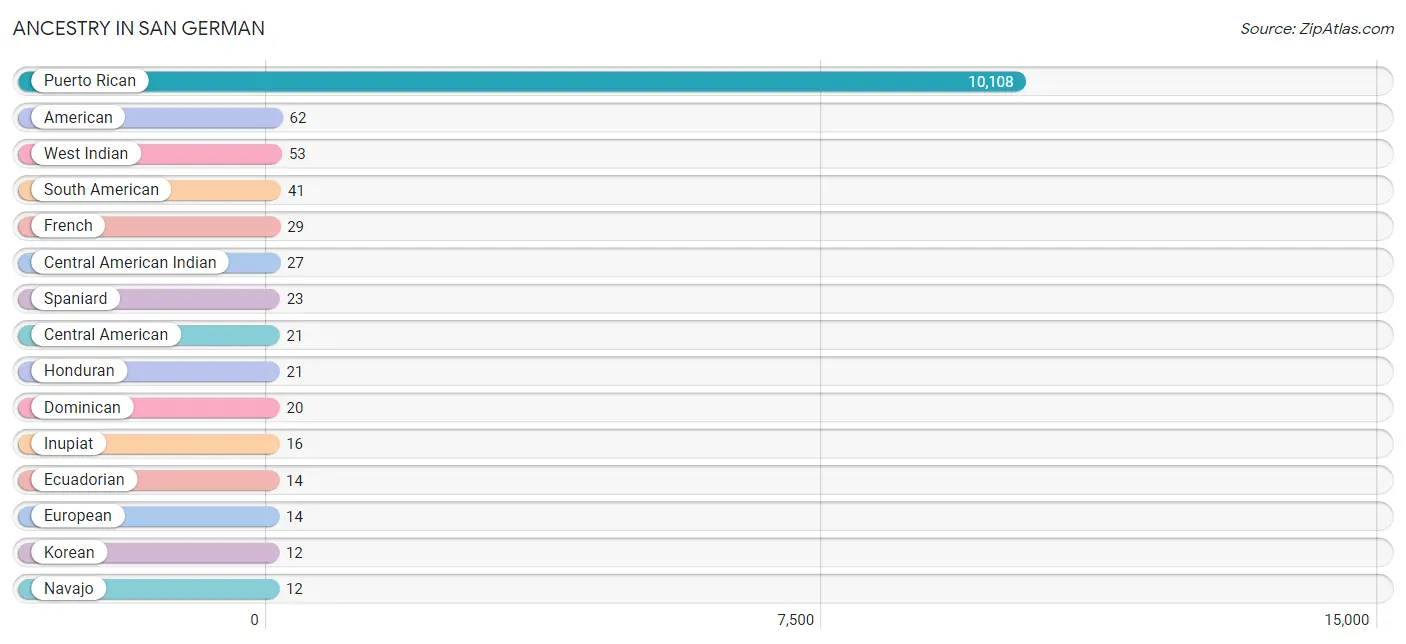
| Ancestry | # Population | % Population |
| American | 62 | 0.6% |
| Arab | 8 | 0.1% |
| Argentinean | 8 | 0.1% |
| Central American | 21 | 0.2% |
| Central American Indian | 27 | 0.3% |
| Colombian | 1 | 0.0% |
| Dominican | 20 | 0.2% |
| Ecuadorian | 14 | 0.1% |
| European | 14 | 0.1% |
| French | 29 | 0.3% |
| Honduran | 21 | 0.2% |
| Indian (Asian) | 4 | 0.0% |
| Inupiat | 16 | 0.2% |
| Korean | 12 | 0.1% |
| Navajo | 12 | 0.1% |
| Peruvian | 9 | 0.1% |
| Puerto Rican | 10,108 | 98.5% |
| Samoan | 12 | 0.1% |
| South American | 41 | 0.4% |
| Spaniard | 23 | 0.2% |
| Thai | 12 | 0.1% |
| Venezuelan | 9 | 0.1% |
| West Indian | 53 | 0.5% | View All 23 Rows |
Immigrants in San German

| Immigration Origin | # Population | % Population | View All 0 Rows |
Sex and Age in San German
Sex and Age in San German
The most populous age groups in San German are 20 to 24 Years (379 | 8.4%) for men and 10 to 14 Years (464 | 8.1%) for women.
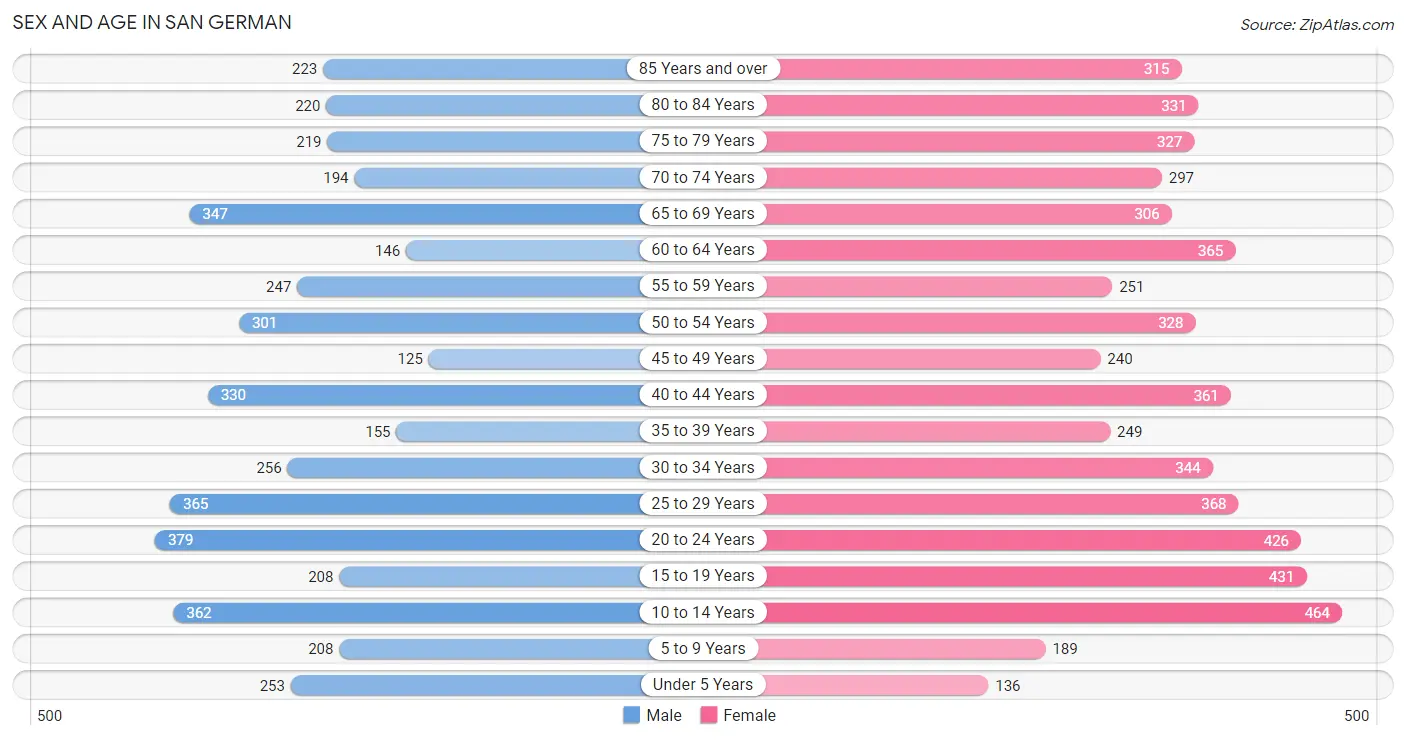
| Age Bracket | Male | Female |
| Under 5 Years | 253 (5.6%) | 136 (2.4%) |
| 5 to 9 Years | 208 (4.6%) | 189 (3.3%) |
| 10 to 14 Years | 362 (8.0%) | 464 (8.1%) |
| 15 to 19 Years | 208 (4.6%) | 431 (7.5%) |
| 20 to 24 Years | 379 (8.4%) | 426 (7.4%) |
| 25 to 29 Years | 365 (8.0%) | 368 (6.4%) |
| 30 to 34 Years | 256 (5.6%) | 344 (6.0%) |
| 35 to 39 Years | 155 (3.4%) | 249 (4.3%) |
| 40 to 44 Years | 330 (7.3%) | 361 (6.3%) |
| 45 to 49 Years | 125 (2.8%) | 240 (4.2%) |
| 50 to 54 Years | 301 (6.6%) | 328 (5.7%) |
| 55 to 59 Years | 247 (5.4%) | 251 (4.4%) |
| 60 to 64 Years | 146 (3.2%) | 365 (6.4%) |
| 65 to 69 Years | 347 (7.6%) | 306 (5.3%) |
| 70 to 74 Years | 194 (4.3%) | 297 (5.2%) |
| 75 to 79 Years | 219 (4.8%) | 327 (5.7%) |
| 80 to 84 Years | 220 (4.9%) | 331 (5.8%) |
| 85 Years and over | 223 (4.9%) | 315 (5.5%) |
| Total | 4,538 (100.0%) | 5,728 (100.0%) |
Families and Households in San German
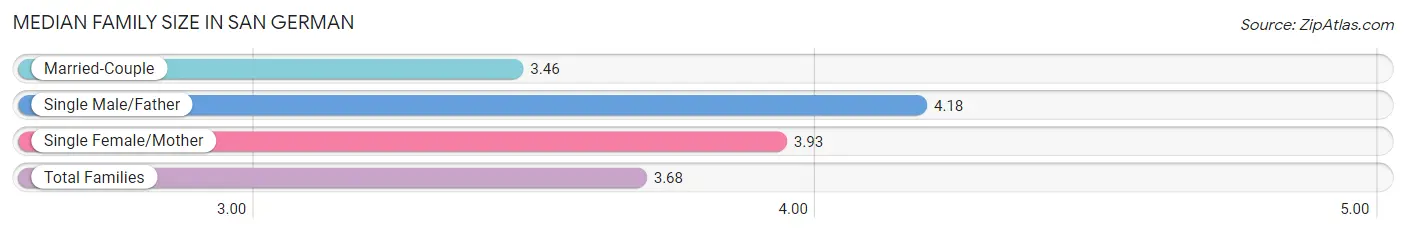
Median Family Size in San German
The median family size in San German is 3.68 persons per family, with single male/father families (103 | 4.9%) accounting for the largest median family size of 4.18 persons per family. On the other hand, married-couple families (1,188 | 56.6%) represent the smallest median family size with 3.46 persons per family.
| Family Type | # Families | Family Size |
| Married-Couple | 1,188 (56.6%) | 3.46 |
| Single Male/Father | 103 (4.9%) | 4.18 |
| Single Female/Mother | 809 (38.5%) | 3.93 |
| Total Families | 2,100 (100.0%) | 3.68 |
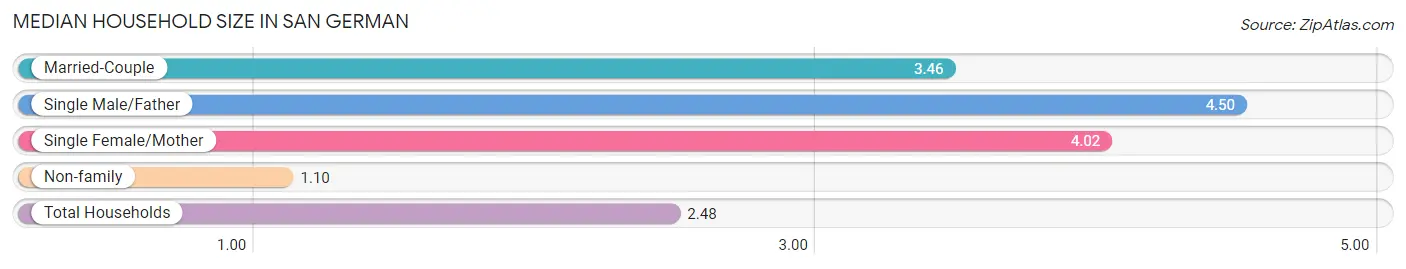
Median Household Size in San German
The median household size in San German is 2.48 persons per household, with single male/father households (103 | 2.6%) accounting for the largest median household size of 4.5 persons per household. non-family households (1,895 | 47.4%) represent the smallest median household size with 1.10 persons per household.
| Household Type | # Households | Household Size |
| Married-Couple | 1,188 (29.7%) | 3.46 |
| Single Male/Father | 103 (2.6%) | 4.50 |
| Single Female/Mother | 809 (20.3%) | 4.02 |
| Non-family | 1,895 (47.4%) | 1.10 |
| Total Households | 3,995 (100.0%) | 2.48 |
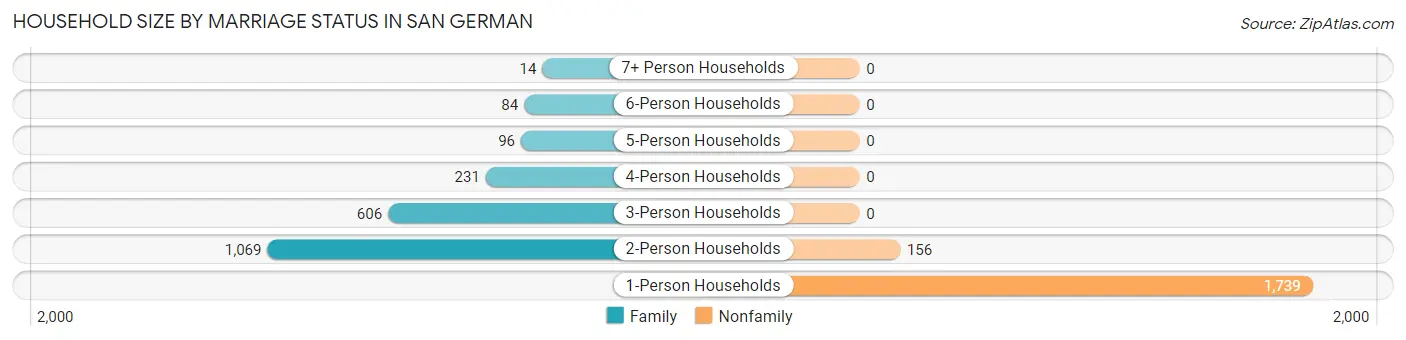
Household Size by Marriage Status in San German
Out of a total of 3,995 households in San German, 2,100 (52.6%) are family households, while 1,895 (47.4%) are nonfamily households. The most numerous type of family households are 2-person households, comprising 1,069, and the most common type of nonfamily households are 1-person households, comprising 1,739.
| Household Size | Family Households | Nonfamily Households |
| 1-Person Households | - | 1,739 (43.5%) |
| 2-Person Households | 1,069 (26.8%) | 156 (3.9%) |
| 3-Person Households | 606 (15.2%) | 0 (0.0%) |
| 4-Person Households | 231 (5.8%) | 0 (0.0%) |
| 5-Person Households | 96 (2.4%) | 0 (0.0%) |
| 6-Person Households | 84 (2.1%) | 0 (0.0%) |
| 7+ Person Households | 14 (0.4%) | 0 (0.0%) |
| Total | 2,100 (52.6%) | 1,895 (47.4%) |
Female Fertility in San German
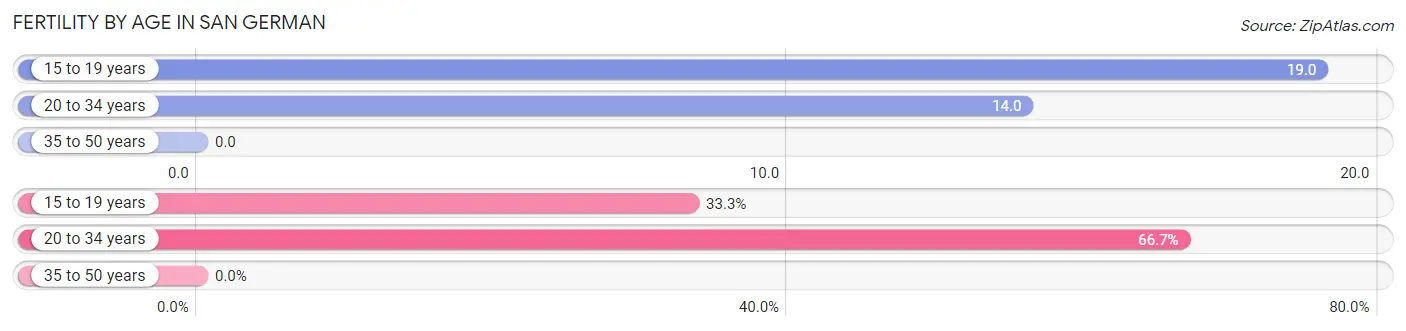
Fertility by Age in San German
Average fertility rate in San German is 9.0 births per 1,000 women. Women in the age bracket of 15 to 19 years have the highest fertility rate with 19.0 births per 1,000 women. Women in the age bracket of 20 to 34 years acount for 66.7% of all women with births.
| Age Bracket | Women with Births | Births / 1,000 Women |
| 15 to 19 years | 8 (33.3%) | 19.0 |
| 20 to 34 years | 16 (66.7%) | 14.0 |
| 35 to 50 years | 0 (0.0%) | 0.0 |
| Total | 24 (100.0%) | 9.0 |
Fertility by Age by Marriage Status in San German
66.7% of women with births (24) in San German are married. The highest percentage of unmarried women with births falls into 15 to 19 years age bracket with 100.0% of them unmarried at the time of birth, while the lowest percentage of unmarried women with births belong to 20 to 34 years age bracket with 0.0% of them unmarried.
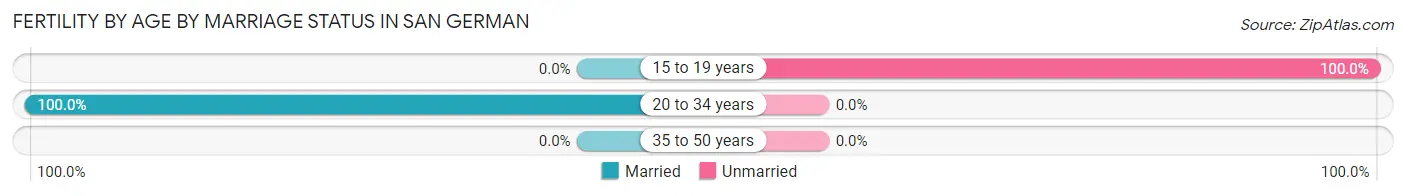
| Age Bracket | Married | Unmarried |
| 15 to 19 years | 0 (0.0%) | 8 (100.0%) |
| 20 to 34 years | 16 (100.0%) | 0 (0.0%) |
| 35 to 50 years | 0 (0.0%) | 0 (0.0%) |
| Total | 16 (66.7%) | 8 (33.3%) |
Fertility by Education in San German
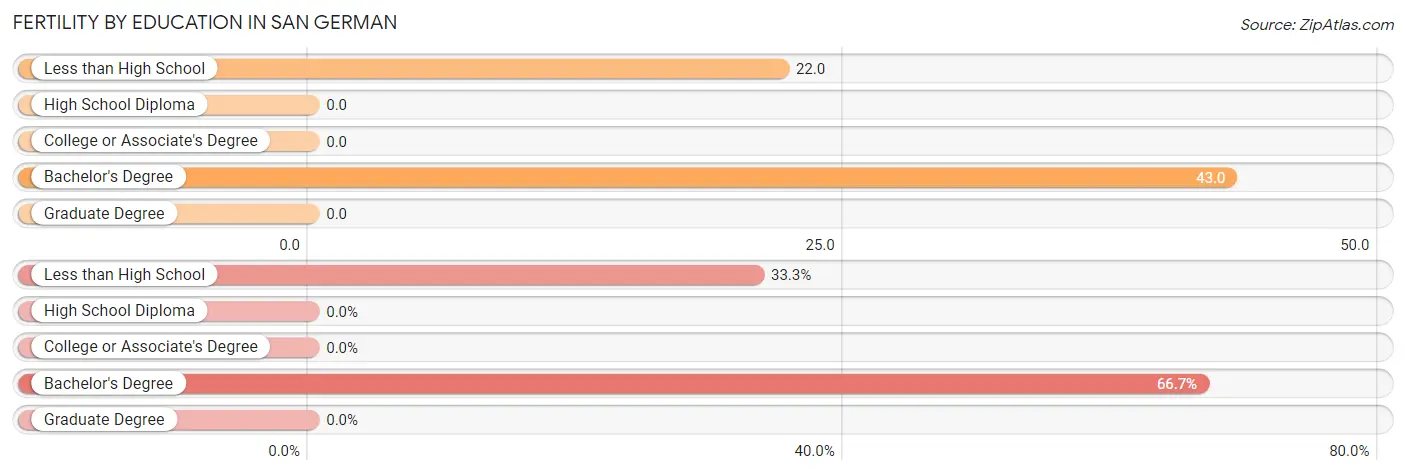
| Educational Attainment | Women with Births | Births / 1,000 Women |
| Less than High School | 8 (33.3%) | 22.0 |
| High School Diploma | 0 (0.0%) | 0.0 |
| College or Associate's Degree | 0 (0.0%) | 0.0 |
| Bachelor's Degree | 16 (66.7%) | 43.0 |
| Graduate Degree | 0 (0.0%) | 0.0 |
| Total | 24 (100.0%) | 9.0 |
Fertility by Education by Marriage Status in San German
33.3% of women with births in San German are unmarried. Women with the educational attainment of bachelor's degree are most likely to be married with 100.0% of them married at childbirth, while women with the educational attainment of less than high school are least likely to be married with 100.0% of them unmarried at childbirth.
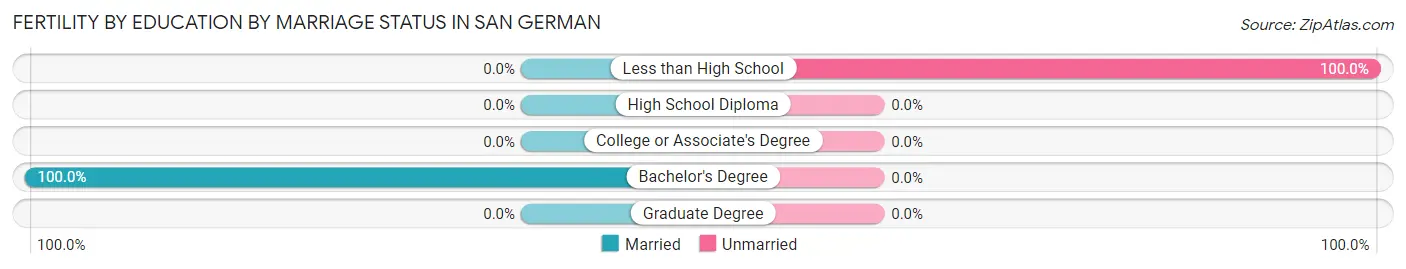
| Educational Attainment | Married | Unmarried |
| Less than High School | 0 (0.0%) | 8 (100.0%) |
| High School Diploma | 0 (0.0%) | 0 (0.0%) |
| College or Associate's Degree | 0 (0.0%) | 0 (0.0%) |
| Bachelor's Degree | 16 (100.0%) | 0 (0.0%) |
| Graduate Degree | 0 (0.0%) | 0 (0.0%) |
| Total | 16 (66.7%) | 8 (33.3%) |
Employment Characteristics in San German
Employment by Class of Employer in San German
Among the 2,141 employed individuals in San German, private company employees (1,246 | 58.2%), state government employees (323 | 15.1%), and self-employed (not incorporated) (172 | 8.0%) make up the most common classes of employment.
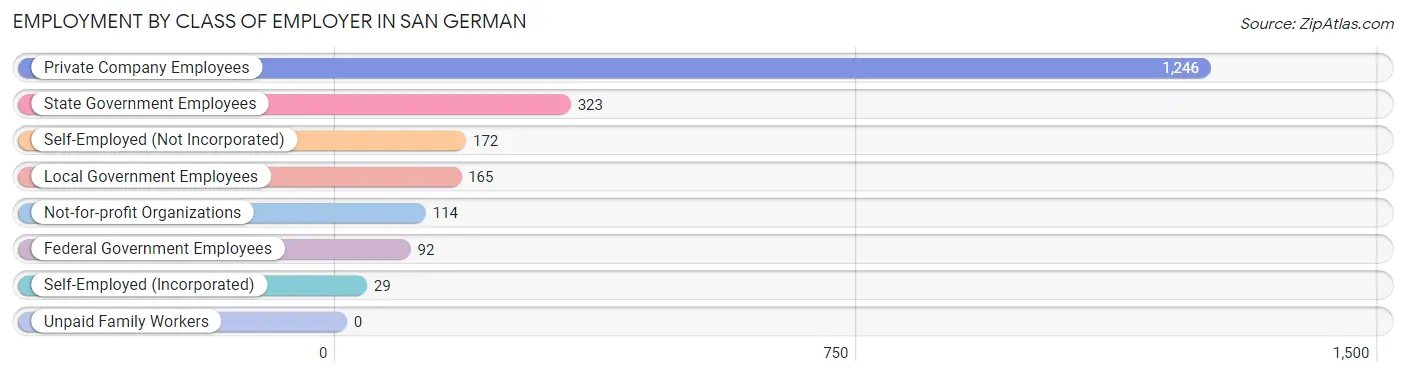
| Employer Class | # Employees | % Employees |
| Private Company Employees | 1,246 | 58.2% |
| Self-Employed (Incorporated) | 29 | 1.3% |
| Self-Employed (Not Incorporated) | 172 | 8.0% |
| Not-for-profit Organizations | 114 | 5.3% |
| Local Government Employees | 165 | 7.7% |
| State Government Employees | 323 | 15.1% |
| Federal Government Employees | 92 | 4.3% |
| Unpaid Family Workers | 0 | 0.0% |
| Total | 2,141 | 100.0% |
Employment Status by Age in San German
According to the labor force statistics for San German, out of the total population over 16 years of age (8,544), 28.0% or 2,392 individuals are in the labor force, with 7.7% or 184 of them unemployed. The age group with the highest labor force participation rate is 55 to 59 years, with 60.6% or 302 individuals in the labor force. Within the labor force, the 16 to 19 years age range has the highest percentage of unemployed individuals, with 45.5% or 10 of them being unemployed.
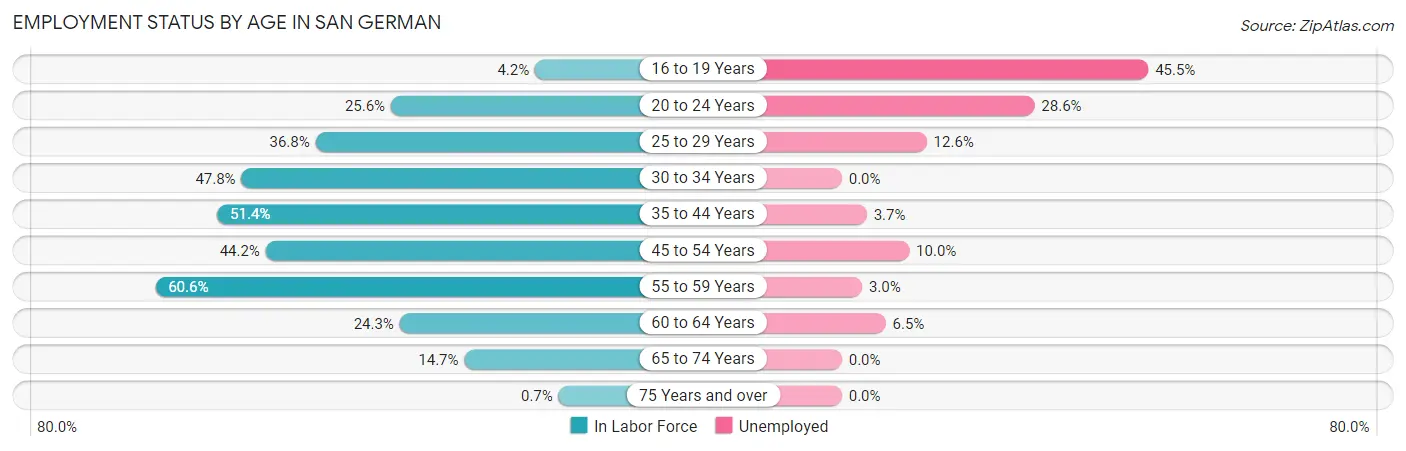
| Age Bracket | In Labor Force | Unemployed |
| 16 to 19 Years | 22 (4.2%) | 10 (45.5%) |
| 20 to 24 Years | 206 (25.6%) | 59 (28.6%) |
| 25 to 29 Years | 270 (36.8%) | 34 (12.6%) |
| 30 to 34 Years | 287 (47.8%) | 0 (0.0%) |
| 35 to 44 Years | 563 (51.4%) | 21 (3.7%) |
| 45 to 54 Years | 439 (44.2%) | 44 (10.0%) |
| 55 to 59 Years | 302 (60.6%) | 9 (3.0%) |
| 60 to 64 Years | 124 (24.3%) | 8 (6.5%) |
| 65 to 74 Years | 168 (14.7%) | 0 (0.0%) |
| 75 Years and over | 11 (0.7%) | 0 (0.0%) |
| Total | 2,392 (28.0%) | 184 (7.7%) |
Employment Status by Educational Attainment in San German
According to labor force statistics for San German, 44.8% of individuals (1,985) out of the total population between 25 and 64 years of age (4,431) are in the labor force, with 5.8% or 115 of them being unemployed. The group with the highest labor force participation rate are those with the educational attainment of bachelor's degree or higher, with 61.8% or 907 individuals in the labor force. Within the labor force, individuals with bachelor's degree or higher education have the highest percentage of unemployment, with 10.3% or 93 of them being unemployed.
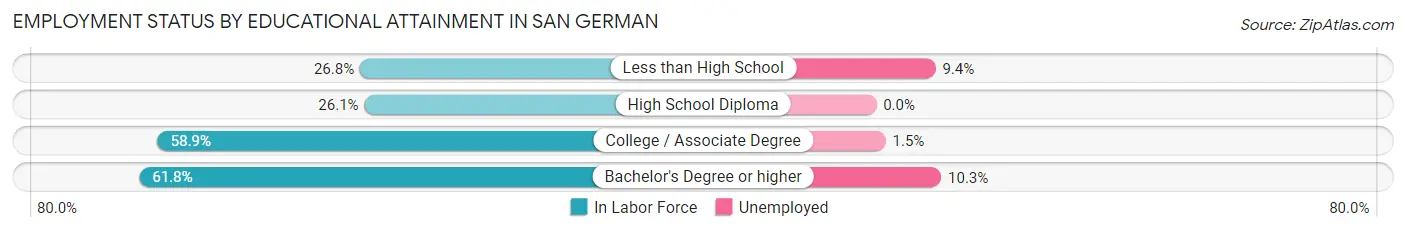
| Educational Attainment | In Labor Force | Unemployed |
| Less than High School | 159 (26.8%) | 56 (9.4%) |
| High School Diploma | 380 (26.1%) | 0 (0.0%) |
| College / Associate Degree | 539 (58.9%) | 14 (1.5%) |
| Bachelor's Degree or higher | 907 (61.8%) | 151 (10.3%) |
| Total | 1,985 (44.8%) | 257 (5.8%) |
Employment Occupations by Sex in San German
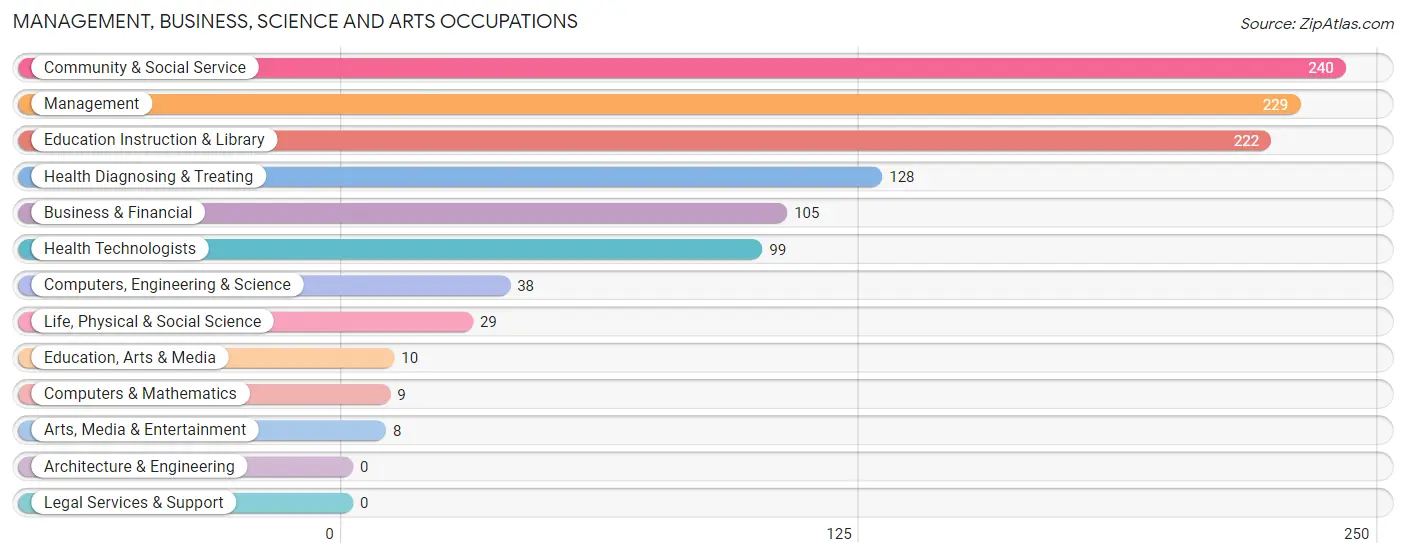
Management, Business, Science and Arts Occupations
The most common Management, Business, Science and Arts occupations in San German are Community & Social Service (240 | 10.9%), Management (229 | 10.4%), Education Instruction & Library (222 | 10.1%), Health Diagnosing & Treating (128 | 5.8%), and Business & Financial (105 | 4.8%).
Management, Business, Science and Arts Occupations by Sex
Within the Management, Business, Science and Arts occupations in San German, the most male-oriented occupations are Computers & Mathematics (100.0%), Education, Arts & Media (100.0%), and Arts, Media & Entertainment (100.0%), while the most female-oriented occupations are Health Diagnosing & Treating (100.0%), Health Technologists (100.0%), and Education Instruction & Library (53.1%).
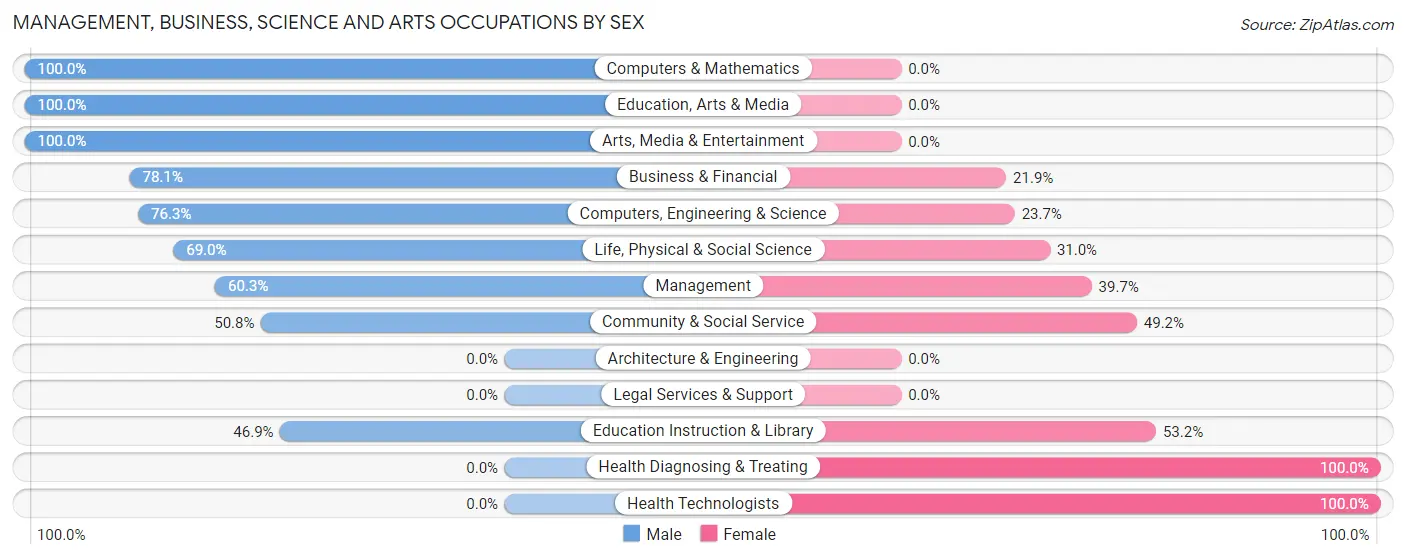
| Occupation | Male | Female |
| Management | 138 (60.3%) | 91 (39.7%) |
| Business & Financial | 82 (78.1%) | 23 (21.9%) |
| Computers, Engineering & Science | 29 (76.3%) | 9 (23.7%) |
| Computers & Mathematics | 9 (100.0%) | 0 (0.0%) |
| Architecture & Engineering | 0 (0.0%) | 0 (0.0%) |
| Life, Physical & Social Science | 20 (69.0%) | 9 (31.0%) |
| Community & Social Service | 122 (50.8%) | 118 (49.2%) |
| Education, Arts & Media | 10 (100.0%) | 0 (0.0%) |
| Legal Services & Support | 0 (0.0%) | 0 (0.0%) |
| Education Instruction & Library | 104 (46.9%) | 118 (53.1%) |
| Arts, Media & Entertainment | 8 (100.0%) | 0 (0.0%) |
| Health Diagnosing & Treating | 0 (0.0%) | 128 (100.0%) |
| Health Technologists | 0 (0.0%) | 99 (100.0%) |
| Total (Category) | 371 (50.1%) | 369 (49.9%) |
| Total (Overall) | 1,087 (49.2%) | 1,121 (50.8%) |
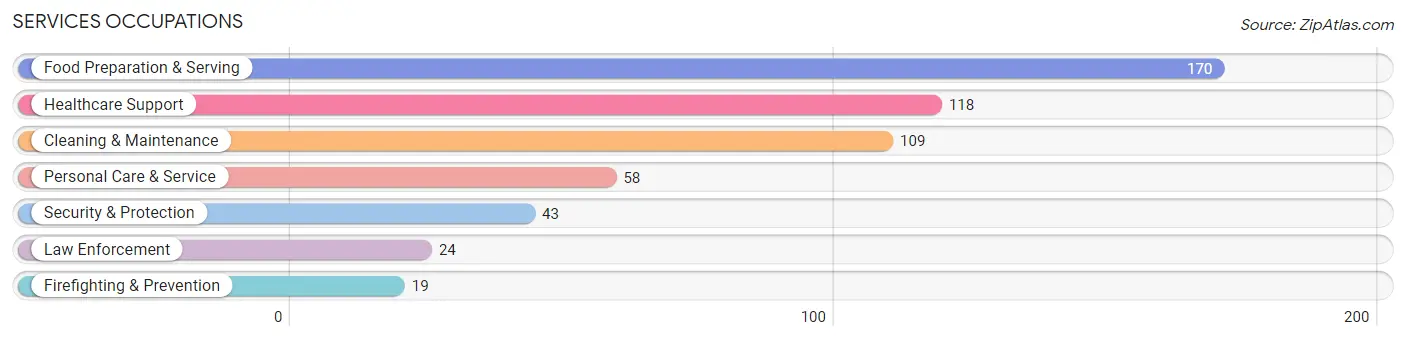
Services Occupations
The most common Services occupations in San German are Food Preparation & Serving (170 | 7.7%), Healthcare Support (118 | 5.3%), Cleaning & Maintenance (109 | 4.9%), Personal Care & Service (58 | 2.6%), and Security & Protection (43 | 1.9%).
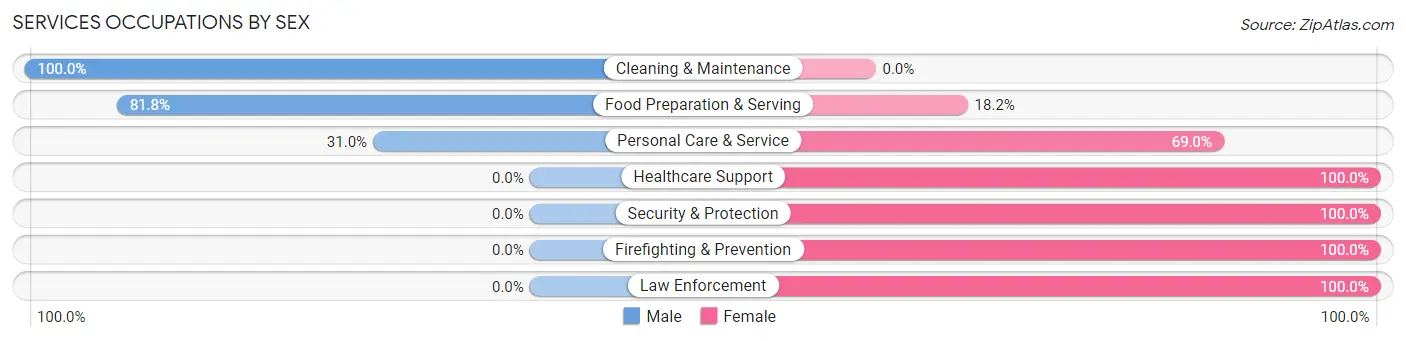
Services Occupations by Sex
Within the Services occupations in San German, the most male-oriented occupations are Cleaning & Maintenance (100.0%), Food Preparation & Serving (81.8%), and Personal Care & Service (31.0%), while the most female-oriented occupations are Healthcare Support (100.0%), Security & Protection (100.0%), and Firefighting & Prevention (100.0%).
| Occupation | Male | Female |
| Healthcare Support | 0 (0.0%) | 118 (100.0%) |
| Security & Protection | 0 (0.0%) | 43 (100.0%) |
| Firefighting & Prevention | 0 (0.0%) | 19 (100.0%) |
| Law Enforcement | 0 (0.0%) | 24 (100.0%) |
| Food Preparation & Serving | 139 (81.8%) | 31 (18.2%) |
| Cleaning & Maintenance | 109 (100.0%) | 0 (0.0%) |
| Personal Care & Service | 18 (31.0%) | 40 (69.0%) |
| Total (Category) | 266 (53.4%) | 232 (46.6%) |
| Total (Overall) | 1,087 (49.2%) | 1,121 (50.8%) |
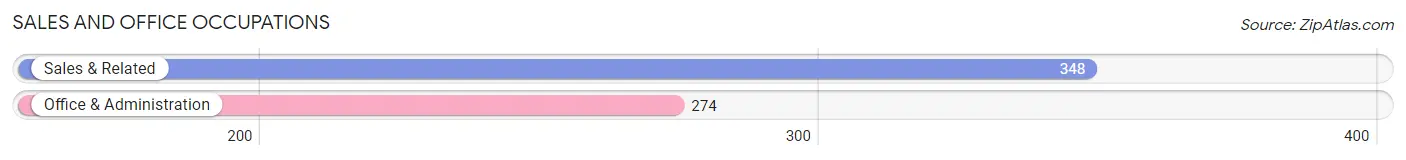
Sales and Office Occupations
The most common Sales and Office occupations in San German are Sales & Related (348 | 15.8%), and Office & Administration (274 | 12.4%).
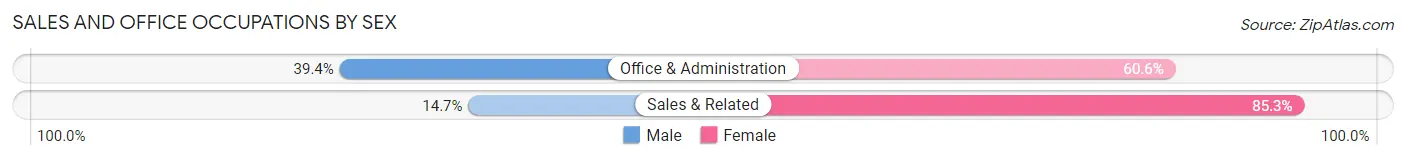
Sales and Office Occupations by Sex
| Occupation | Male | Female |
| Sales & Related | 51 (14.7%) | 297 (85.3%) |
| Office & Administration | 108 (39.4%) | 166 (60.6%) |
| Total (Category) | 159 (25.6%) | 463 (74.4%) |
| Total (Overall) | 1,087 (49.2%) | 1,121 (50.8%) |
Natural Resources, Construction and Maintenance Occupations
The most common Natural Resources, Construction and Maintenance occupations in San German are Construction & Extraction (61 | 2.8%), Installation, Maintenance & Repair (28 | 1.3%), and Farming, Fishing & Forestry (26 | 1.2%).
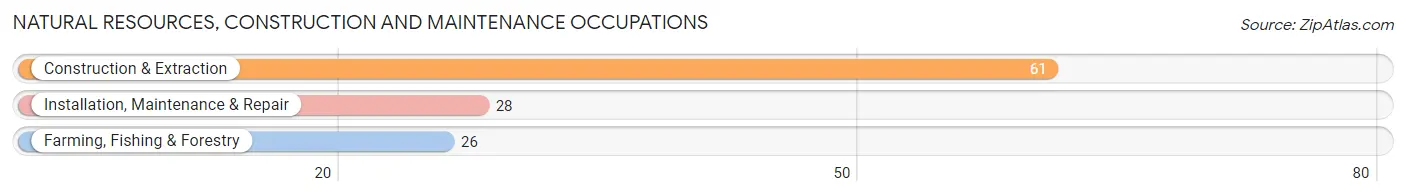
Natural Resources, Construction and Maintenance Occupations by Sex
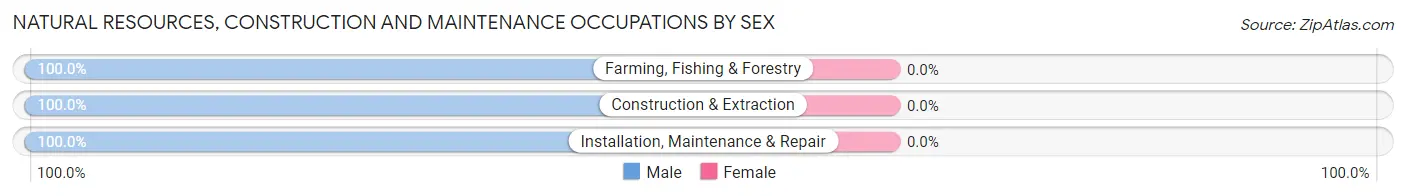
| Occupation | Male | Female |
| Farming, Fishing & Forestry | 26 (100.0%) | 0 (0.0%) |
| Construction & Extraction | 61 (100.0%) | 0 (0.0%) |
| Installation, Maintenance & Repair | 28 (100.0%) | 0 (0.0%) |
| Total (Category) | 115 (100.0%) | 0 (0.0%) |
| Total (Overall) | 1,087 (49.2%) | 1,121 (50.8%) |
Production, Transportation and Moving Occupations
The most common Production, Transportation and Moving occupations in San German are Production (189 | 8.6%), Material Moving (24 | 1.1%), and Transportation (20 | 0.9%).
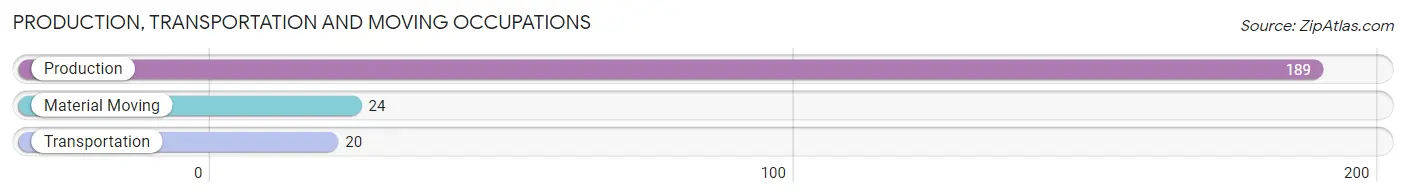
Production, Transportation and Moving Occupations by Sex
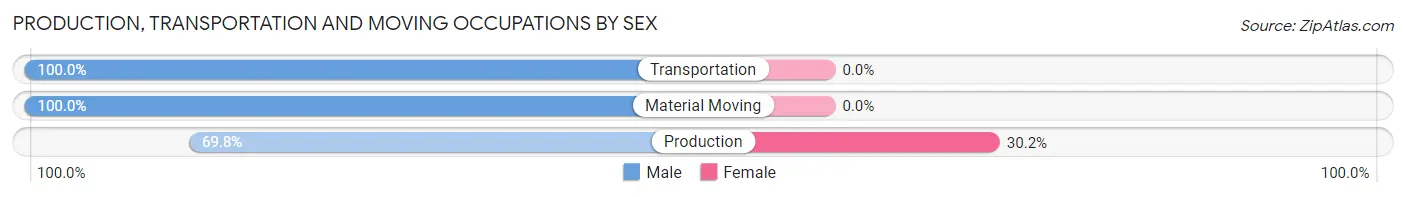
| Occupation | Male | Female |
| Production | 132 (69.8%) | 57 (30.2%) |
| Transportation | 20 (100.0%) | 0 (0.0%) |
| Material Moving | 24 (100.0%) | 0 (0.0%) |
| Total (Category) | 176 (75.5%) | 57 (24.5%) |
| Total (Overall) | 1,087 (49.2%) | 1,121 (50.8%) |
Employment Industries by Sex in San German
Employment Industries in San German
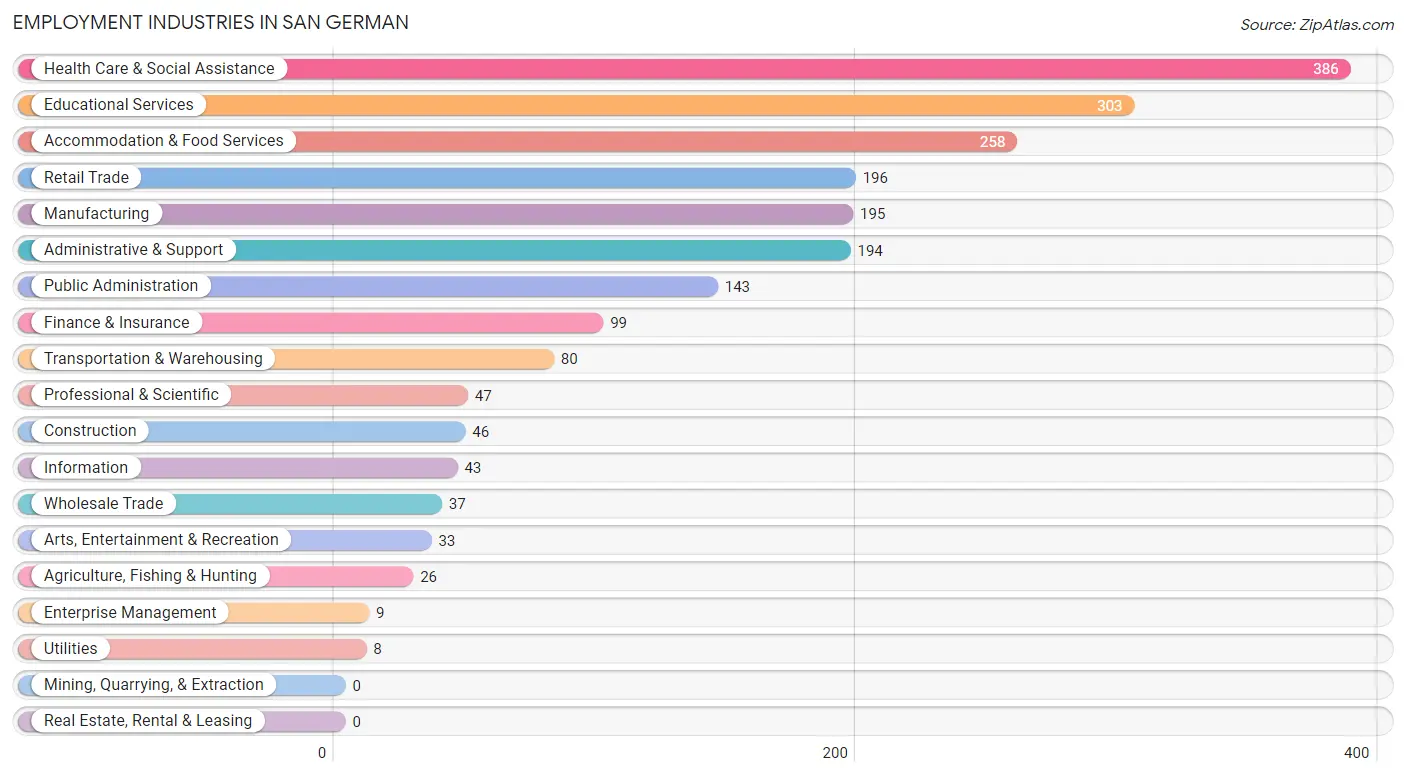
The major employment industries in San German include Health Care & Social Assistance (386 | 17.5%), Educational Services (303 | 13.7%), Accommodation & Food Services (258 | 11.7%), Retail Trade (196 | 8.9%), and Manufacturing (195 | 8.8%).
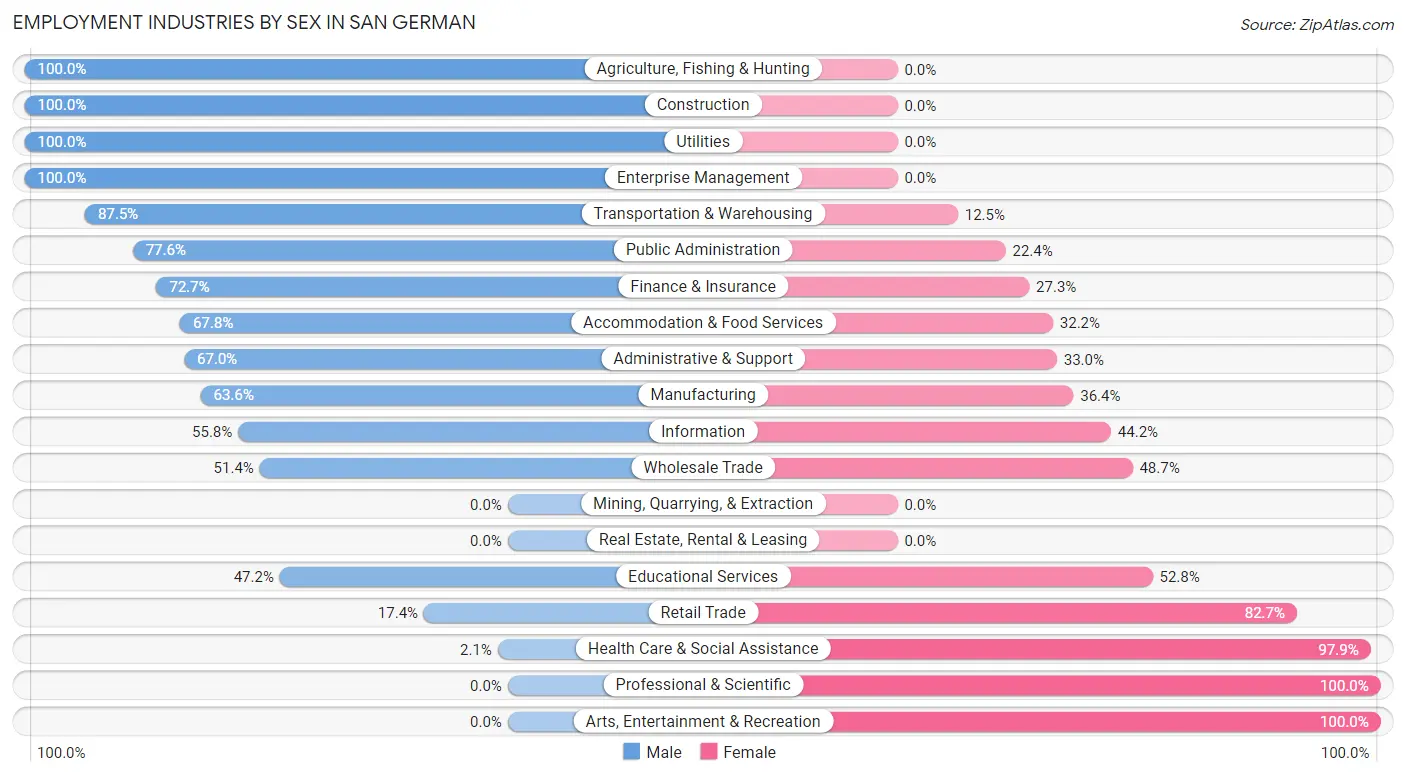
Employment Industries by Sex in San German
The San German industries that see more men than women are Agriculture, Fishing & Hunting (100.0%), Construction (100.0%), and Utilities (100.0%), whereas the industries that tend to have a higher number of women are Professional & Scientific (100.0%), Arts, Entertainment & Recreation (100.0%), and Health Care & Social Assistance (97.9%).
| Industry | Male | Female |
| Agriculture, Fishing & Hunting | 26 (100.0%) | 0 (0.0%) |
| Mining, Quarrying, & Extraction | 0 (0.0%) | 0 (0.0%) |
| Construction | 46 (100.0%) | 0 (0.0%) |
| Manufacturing | 124 (63.6%) | 71 (36.4%) |
| Wholesale Trade | 19 (51.3%) | 18 (48.6%) |
| Retail Trade | 34 (17.3%) | 162 (82.7%) |
| Transportation & Warehousing | 70 (87.5%) | 10 (12.5%) |
| Utilities | 8 (100.0%) | 0 (0.0%) |
| Information | 24 (55.8%) | 19 (44.2%) |
| Finance & Insurance | 72 (72.7%) | 27 (27.3%) |
| Real Estate, Rental & Leasing | 0 (0.0%) | 0 (0.0%) |
| Professional & Scientific | 0 (0.0%) | 47 (100.0%) |
| Enterprise Management | 9 (100.0%) | 0 (0.0%) |
| Administrative & Support | 130 (67.0%) | 64 (33.0%) |
| Educational Services | 143 (47.2%) | 160 (52.8%) |
| Health Care & Social Assistance | 8 (2.1%) | 378 (97.9%) |
| Arts, Entertainment & Recreation | 0 (0.0%) | 33 (100.0%) |
| Accommodation & Food Services | 175 (67.8%) | 83 (32.2%) |
| Public Administration | 111 (77.6%) | 32 (22.4%) |
| Total | 1,087 (49.2%) | 1,121 (50.8%) |
Education in San German
School Enrollment in San German
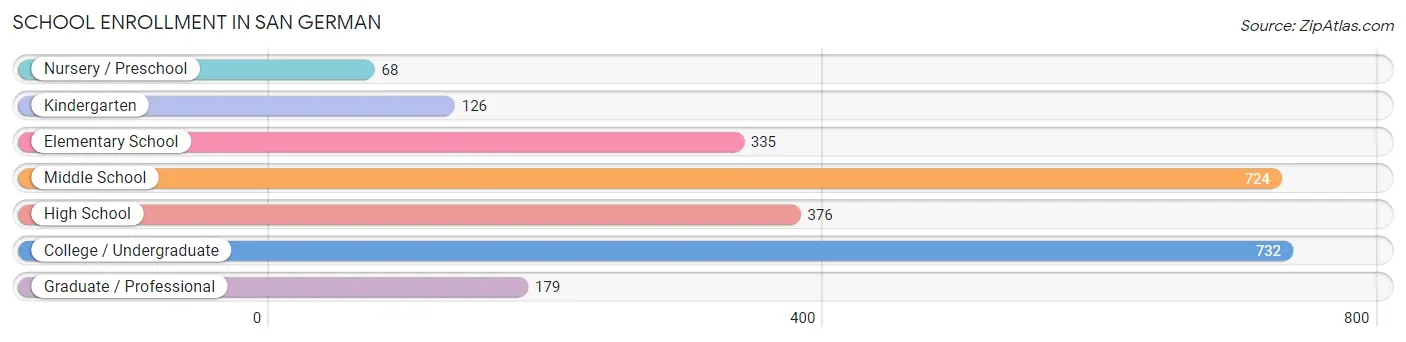
The most common levels of schooling among the 2,540 students in San German are college / undergraduate (732 | 28.8%), middle school (724 | 28.5%), and high school (376 | 14.8%).
| School Level | # Students | % Students |
| Nursery / Preschool | 68 | 2.7% |
| Kindergarten | 126 | 5.0% |
| Elementary School | 335 | 13.2% |
| Middle School | 724 | 28.5% |
| High School | 376 | 14.8% |
| College / Undergraduate | 732 | 28.8% |
| Graduate / Professional | 179 | 7.0% |
| Total | 2,540 | 100.0% |
School Enrollment by Age by Funding Source in San German
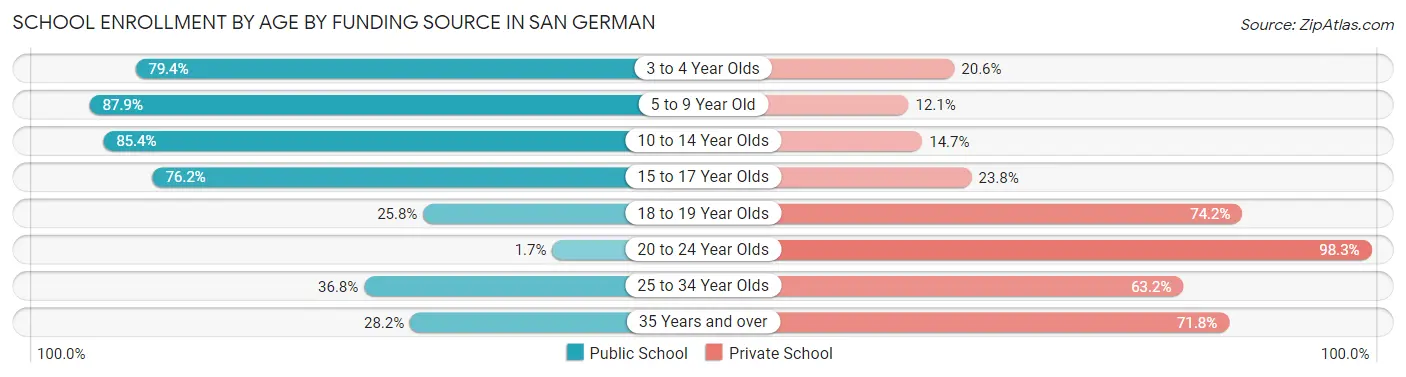
Out of a total of 2,540 students who are enrolled in schools in San German, 965 (38.0%) attend a private institution, while the remaining 1,575 (62.0%) are enrolled in public schools. The age group of 20 to 24 year olds has the highest likelihood of being enrolled in private schools, with 288 (98.3% in the age bracket) enrolled. Conversely, the age group of 5 to 9 year old has the lowest likelihood of being enrolled in a private school, with 349 (87.9% in the age bracket) attending a public institution.
| Age Bracket | Public School | Private School |
| 3 to 4 Year Olds | 77 (79.4%) | 20 (20.6%) |
| 5 to 9 Year Old | 349 (87.9%) | 48 (12.1%) |
| 10 to 14 Year Olds | 705 (85.4%) | 121 (14.6%) |
| 15 to 17 Year Olds | 243 (76.2%) | 76 (23.8%) |
| 18 to 19 Year Olds | 59 (25.8%) | 170 (74.2%) |
| 20 to 24 Year Olds | 5 (1.7%) | 288 (98.3%) |
| 25 to 34 Year Olds | 125 (36.8%) | 215 (63.2%) |
| 35 Years and over | 11 (28.2%) | 28 (71.8%) |
| Total | 1,575 (62.0%) | 965 (38.0%) |
Educational Attainment by Field of Study in San German
Education (436 | 19.3%), business (413 | 18.3%), science & technology (255 | 11.3%), bio, nature & agricultural (248 | 11.0%), and psychology (236 | 10.5%) are the most common fields of study among 2,254 individuals in San German who have obtained a bachelor's degree or higher.
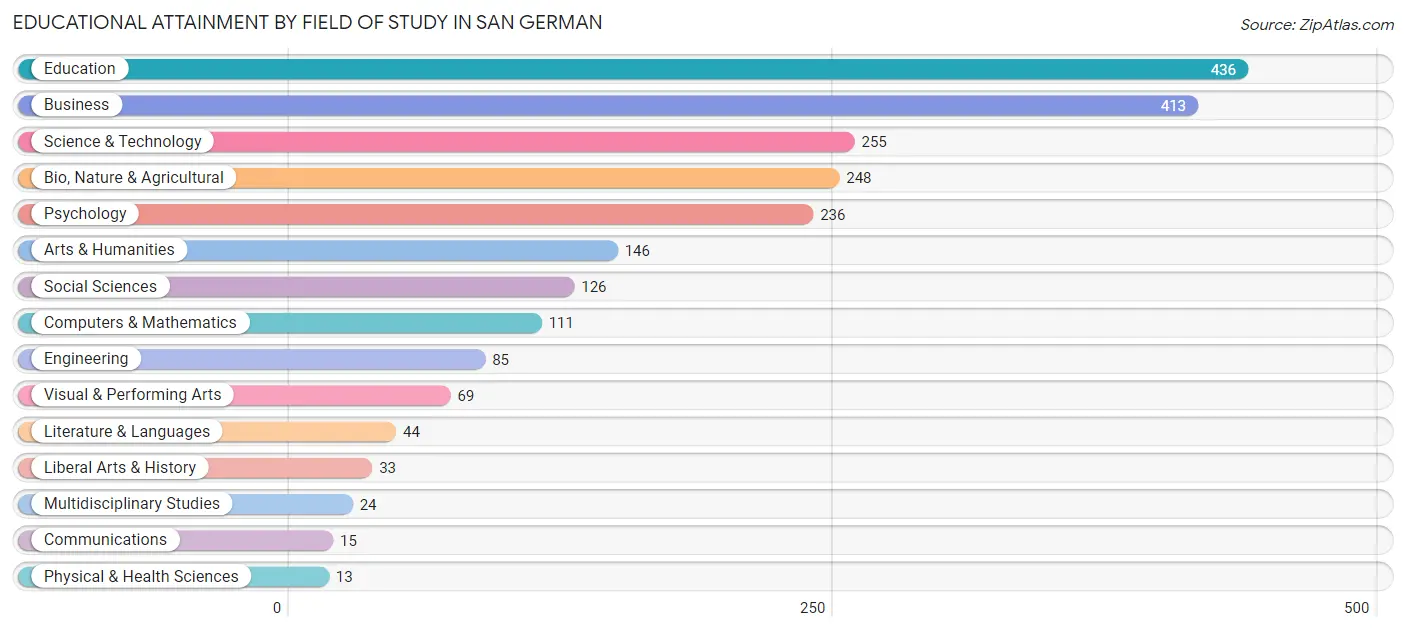
| Field of Study | # Graduates | % Graduates |
| Computers & Mathematics | 111 | 4.9% |
| Bio, Nature & Agricultural | 248 | 11.0% |
| Physical & Health Sciences | 13 | 0.6% |
| Psychology | 236 | 10.5% |
| Social Sciences | 126 | 5.6% |
| Engineering | 85 | 3.8% |
| Multidisciplinary Studies | 24 | 1.1% |
| Science & Technology | 255 | 11.3% |
| Business | 413 | 18.3% |
| Education | 436 | 19.3% |
| Literature & Languages | 44 | 1.9% |
| Liberal Arts & History | 33 | 1.5% |
| Visual & Performing Arts | 69 | 3.1% |
| Communications | 15 | 0.7% |
| Arts & Humanities | 146 | 6.5% |
| Total | 2,254 | 100.0% |
Transportation & Commute in San German
Vehicle Availability by Sex in San German
The most prevalent vehicle ownership categories in San German are males with 2 vehicles (423, accounting for 40.5%) and females with 2 vehicles (205, making up 40.0%).
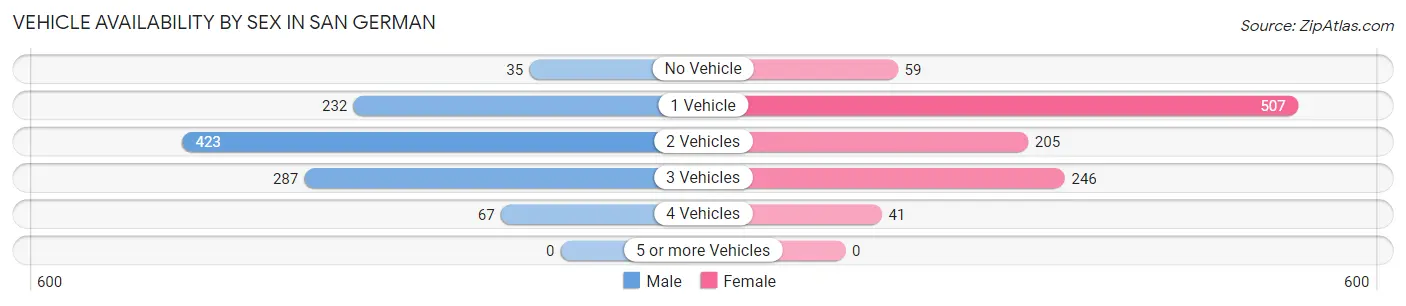
| Vehicles Available | Male | Female |
| No Vehicle | 35 (3.4%) | 59 (5.6%) |
| 1 Vehicle | 232 (22.2%) | 507 (47.9%) |
| 2 Vehicles | 423 (40.5%) | 205 (19.4%) |
| 3 Vehicles | 287 (27.5%) | 246 (23.3%) |
| 4 Vehicles | 67 (6.4%) | 41 (3.9%) |
| 5 or more Vehicles | 0 (0.0%) | 0 (0.0%) |
| Total | 1,044 (100.0%) | 1,058 (100.0%) |
Commute Time in San German
The most frequently occuring commute durations in San German are 10 to 14 minutes (490 commuters, 24.2%), 20 to 24 minutes (390 commuters, 19.3%), and 30 to 34 minutes (302 commuters, 14.9%).
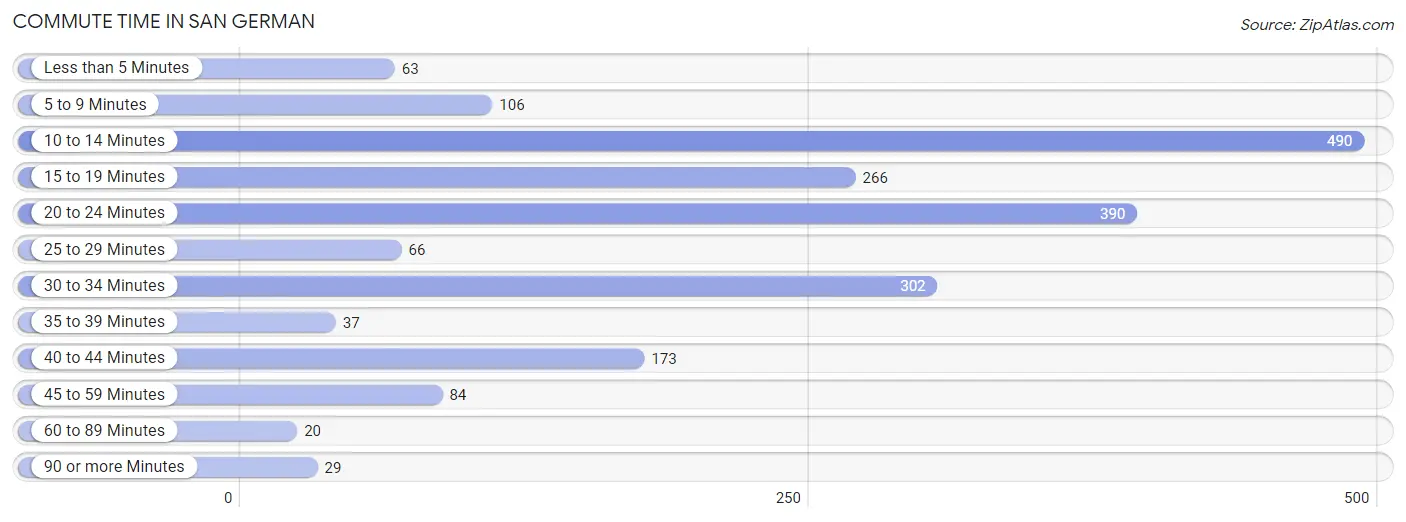
| Commute Time | # Commuters | % Commuters |
| Less than 5 Minutes | 63 | 3.1% |
| 5 to 9 Minutes | 106 | 5.2% |
| 10 to 14 Minutes | 490 | 24.2% |
| 15 to 19 Minutes | 266 | 13.1% |
| 20 to 24 Minutes | 390 | 19.3% |
| 25 to 29 Minutes | 66 | 3.3% |
| 30 to 34 Minutes | 302 | 14.9% |
| 35 to 39 Minutes | 37 | 1.8% |
| 40 to 44 Minutes | 173 | 8.5% |
| 45 to 59 Minutes | 84 | 4.2% |
| 60 to 89 Minutes | 20 | 1.0% |
| 90 or more Minutes | 29 | 1.4% |
Commute Time by Sex in San German
The most common commute times in San German are 20 to 24 minutes (183 commuters, 18.5%) for males and 10 to 14 minutes (337 commuters, 32.5%) for females.
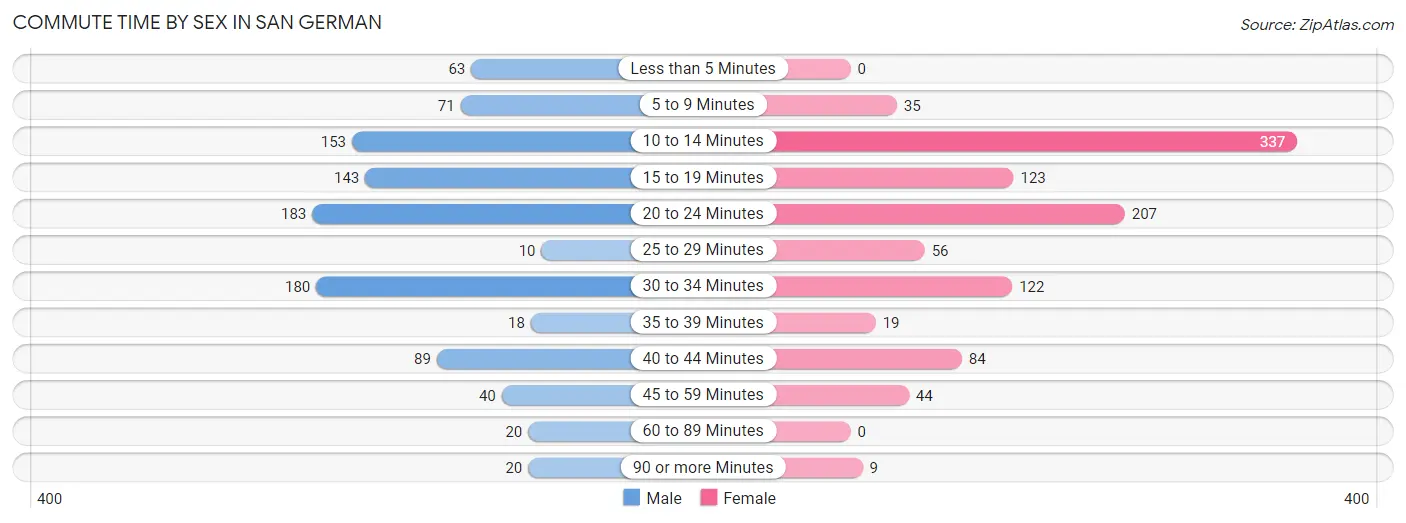
| Commute Time | Male | Female |
| Less than 5 Minutes | 63 (6.4%) | 0 (0.0%) |
| 5 to 9 Minutes | 71 (7.2%) | 35 (3.4%) |
| 10 to 14 Minutes | 153 (15.4%) | 337 (32.5%) |
| 15 to 19 Minutes | 143 (14.4%) | 123 (11.9%) |
| 20 to 24 Minutes | 183 (18.5%) | 207 (20.0%) |
| 25 to 29 Minutes | 10 (1.0%) | 56 (5.4%) |
| 30 to 34 Minutes | 180 (18.2%) | 122 (11.8%) |
| 35 to 39 Minutes | 18 (1.8%) | 19 (1.8%) |
| 40 to 44 Minutes | 89 (9.0%) | 84 (8.1%) |
| 45 to 59 Minutes | 40 (4.0%) | 44 (4.3%) |
| 60 to 89 Minutes | 20 (2.0%) | 0 (0.0%) |
| 90 or more Minutes | 20 (2.0%) | 9 (0.9%) |
Time of Departure to Work by Sex in San German
The most frequent times of departure to work in San German are 7:00 AM to 7:29 AM (283, 28.6%) for males and 7:30 AM to 7:59 AM (186, 17.9%) for females.
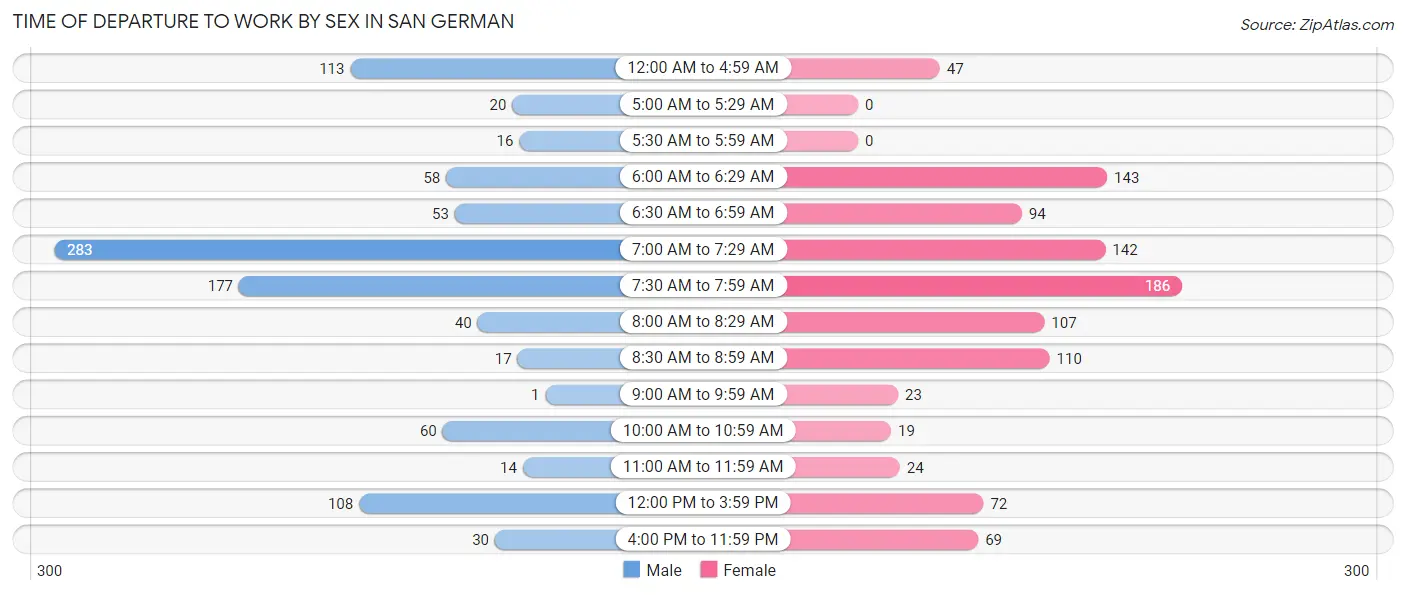
| Time of Departure | Male | Female |
| 12:00 AM to 4:59 AM | 113 (11.4%) | 47 (4.5%) |
| 5:00 AM to 5:29 AM | 20 (2.0%) | 0 (0.0%) |
| 5:30 AM to 5:59 AM | 16 (1.6%) | 0 (0.0%) |
| 6:00 AM to 6:29 AM | 58 (5.9%) | 143 (13.8%) |
| 6:30 AM to 6:59 AM | 53 (5.3%) | 94 (9.1%) |
| 7:00 AM to 7:29 AM | 283 (28.6%) | 142 (13.7%) |
| 7:30 AM to 7:59 AM | 177 (17.9%) | 186 (17.9%) |
| 8:00 AM to 8:29 AM | 40 (4.0%) | 107 (10.3%) |
| 8:30 AM to 8:59 AM | 17 (1.7%) | 110 (10.6%) |
| 9:00 AM to 9:59 AM | 1 (0.1%) | 23 (2.2%) |
| 10:00 AM to 10:59 AM | 60 (6.1%) | 19 (1.8%) |
| 11:00 AM to 11:59 AM | 14 (1.4%) | 24 (2.3%) |
| 12:00 PM to 3:59 PM | 108 (10.9%) | 72 (7.0%) |
| 4:00 PM to 11:59 PM | 30 (3.0%) | 69 (6.7%) |
| Total | 990 (100.0%) | 1,036 (100.0%) |
Housing Occupancy in San German
Occupancy by Ownership in San German
Of the total 3,995 dwellings in San German, owner-occupied units account for 1,959 (49.0%), while renter-occupied units make up 2,036 (51.0%).
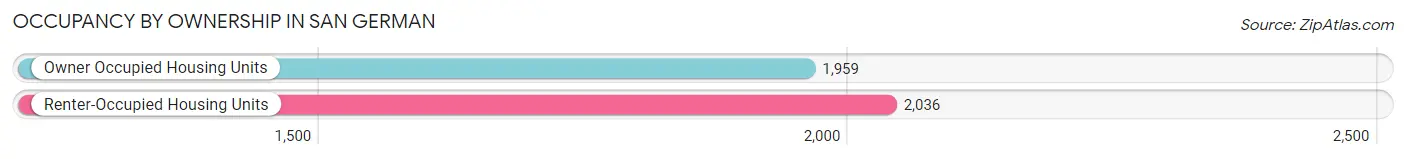
| Occupancy | # Housing Units | % Housing Units |
| Owner Occupied Housing Units | 1,959 | 49.0% |
| Renter-Occupied Housing Units | 2,036 | 51.0% |
| Total Occupied Housing Units | 3,995 | 100.0% |
Occupancy by Household Size in San German
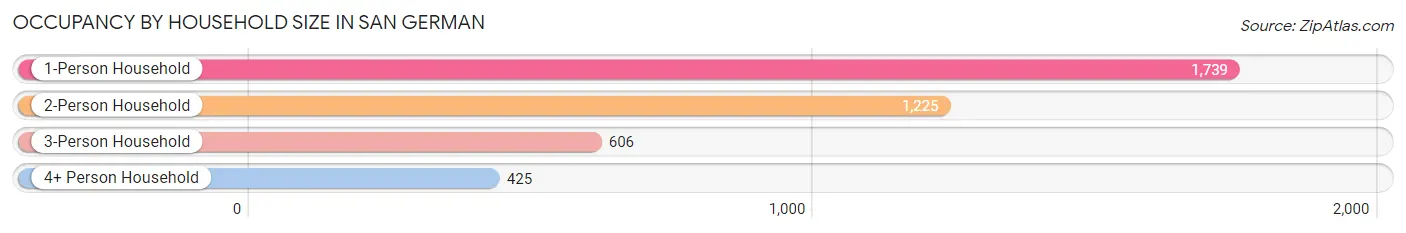
| Household Size | # Housing Units | % Housing Units |
| 1-Person Household | 1,739 | 43.5% |
| 2-Person Household | 1,225 | 30.7% |
| 3-Person Household | 606 | 15.2% |
| 4+ Person Household | 425 | 10.6% |
| Total Housing Units | 3,995 | 100.0% |
Occupancy by Ownership by Household Size in San German
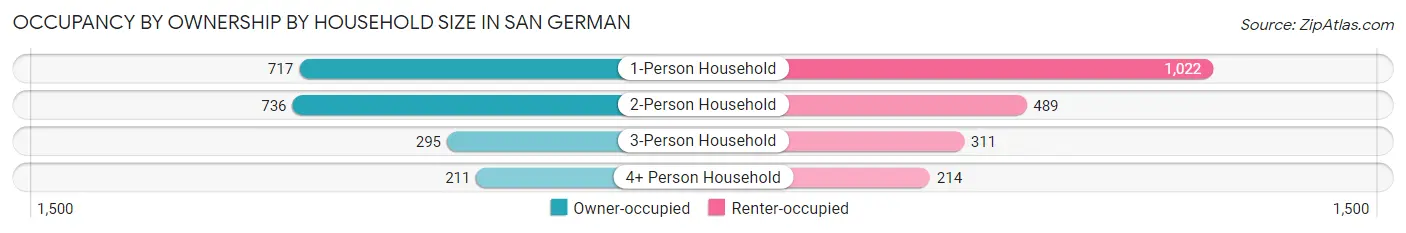
| Household Size | Owner-occupied | Renter-occupied |
| 1-Person Household | 717 (41.2%) | 1,022 (58.8%) |
| 2-Person Household | 736 (60.1%) | 489 (39.9%) |
| 3-Person Household | 295 (48.7%) | 311 (51.3%) |
| 4+ Person Household | 211 (49.6%) | 214 (50.3%) |
| Total Housing Units | 1,959 (49.0%) | 2,036 (51.0%) |
Occupancy by Educational Attainment in San German
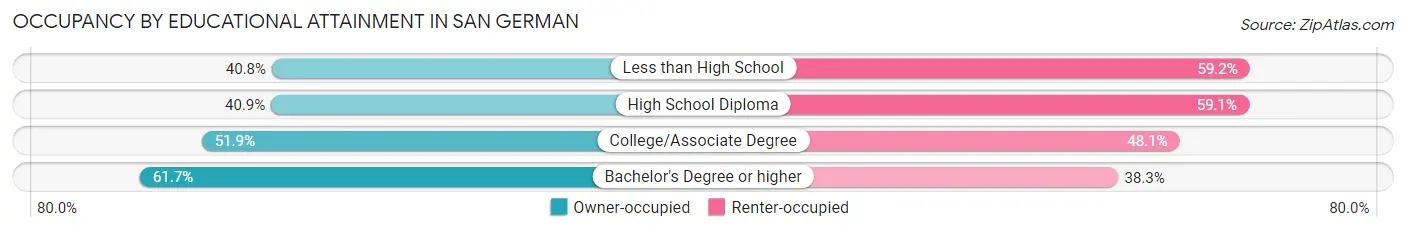
| Household Size | Owner-occupied | Renter-occupied |
| Less than High School | 305 (40.8%) | 443 (59.2%) |
| High School Diploma | 555 (40.9%) | 802 (59.1%) |
| College/Associate Degree | 356 (51.9%) | 330 (48.1%) |
| Bachelor's Degree or higher | 743 (61.7%) | 461 (38.3%) |
Occupancy by Age of Householder in San German
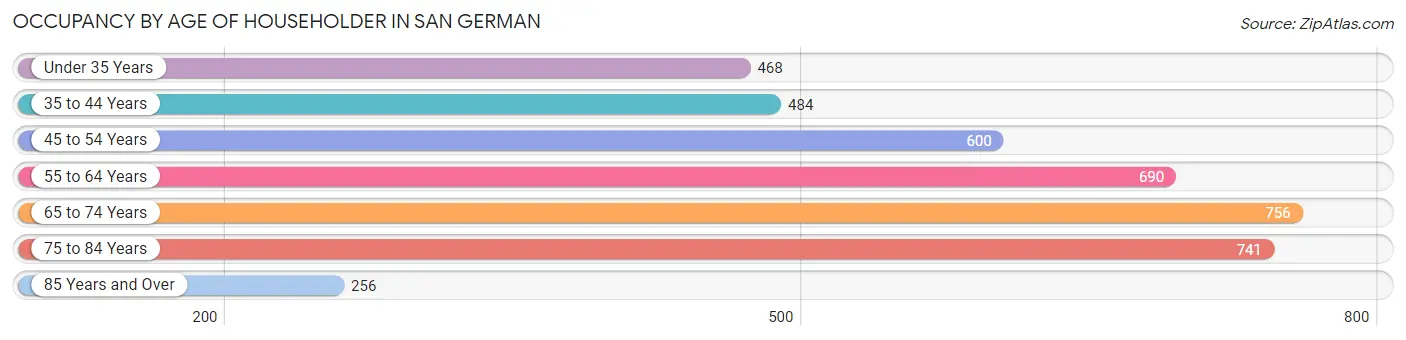
| Age Bracket | # Households | % Households |
| Under 35 Years | 468 | 11.7% |
| 35 to 44 Years | 484 | 12.1% |
| 45 to 54 Years | 600 | 15.0% |
| 55 to 64 Years | 690 | 17.3% |
| 65 to 74 Years | 756 | 18.9% |
| 75 to 84 Years | 741 | 18.5% |
| 85 Years and Over | 256 | 6.4% |
| Total | 3,995 | 100.0% |
Housing Finances in San German
Median Income by Occupancy in San German
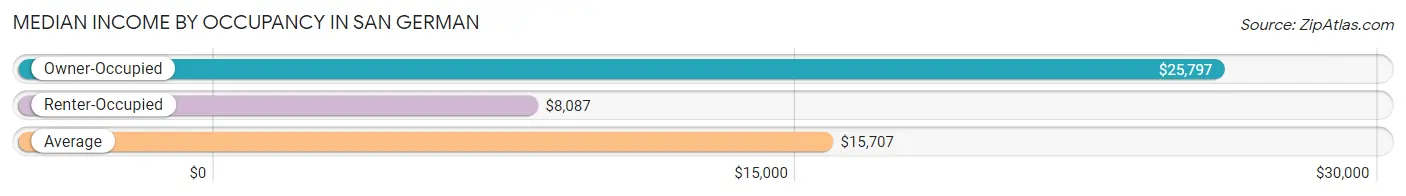
| Occupancy Type | # Households | Median Income |
| Owner-Occupied | 1,959 (49.0%) | $25,797 |
| Renter-Occupied | 2,036 (51.0%) | $8,087 |
| Average | 3,995 (100.0%) | $15,707 |
Occupancy by Householder Income Bracket in San German
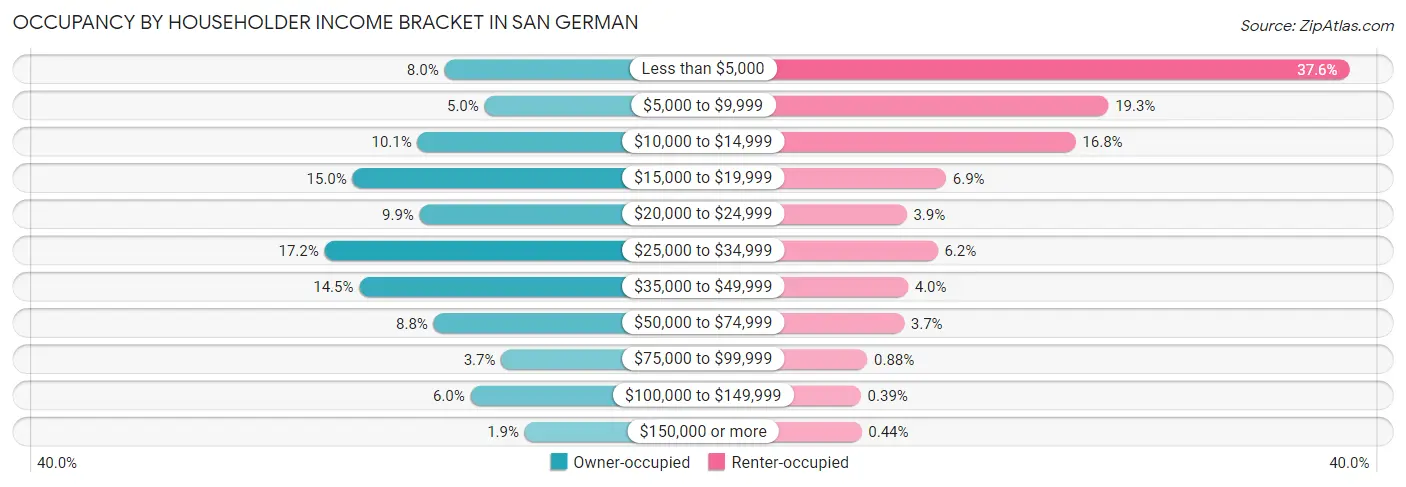
| Income Bracket | Owner-occupied | Renter-occupied |
| Less than $5,000 | 157 (8.0%) | 766 (37.6%) |
| $5,000 to $9,999 | 97 (5.0%) | 392 (19.3%) |
| $10,000 to $14,999 | 197 (10.1%) | 341 (16.8%) |
| $15,000 to $19,999 | 294 (15.0%) | 140 (6.9%) |
| $20,000 to $24,999 | 194 (9.9%) | 79 (3.9%) |
| $25,000 to $34,999 | 336 (17.2%) | 127 (6.2%) |
| $35,000 to $49,999 | 284 (14.5%) | 81 (4.0%) |
| $50,000 to $74,999 | 173 (8.8%) | 75 (3.7%) |
| $75,000 to $99,999 | 72 (3.7%) | 18 (0.9%) |
| $100,000 to $149,999 | 118 (6.0%) | 8 (0.4%) |
| $150,000 or more | 37 (1.9%) | 9 (0.4%) |
| Total | 1,959 (100.0%) | 2,036 (100.0%) |
Monthly Housing Cost Tiers in San German
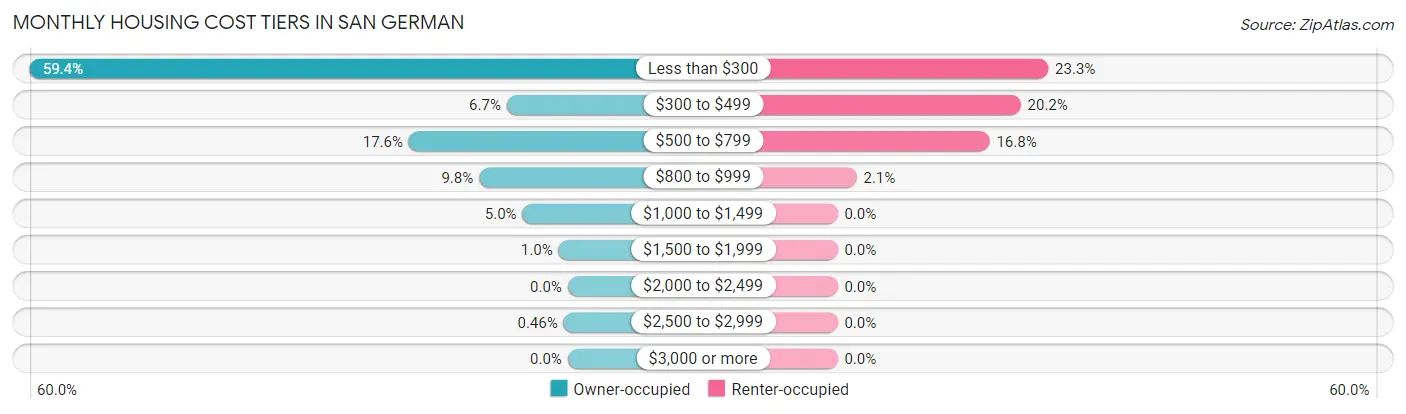
| Monthly Cost | Owner-occupied | Renter-occupied |
| Less than $300 | 1,164 (59.4%) | 474 (23.3%) |
| $300 to $499 | 132 (6.7%) | 412 (20.2%) |
| $500 to $799 | 344 (17.6%) | 342 (16.8%) |
| $800 to $999 | 192 (9.8%) | 43 (2.1%) |
| $1,000 to $1,499 | 98 (5.0%) | 0 (0.0%) |
| $1,500 to $1,999 | 20 (1.0%) | 0 (0.0%) |
| $2,000 to $2,499 | 0 (0.0%) | 0 (0.0%) |
| $2,500 to $2,999 | 9 (0.5%) | 0 (0.0%) |
| $3,000 or more | 0 (0.0%) | 0 (0.0%) |
| Total | 1,959 (100.0%) | 2,036 (100.0%) |
Physical Housing Characteristics in San German
Housing Structures in San German
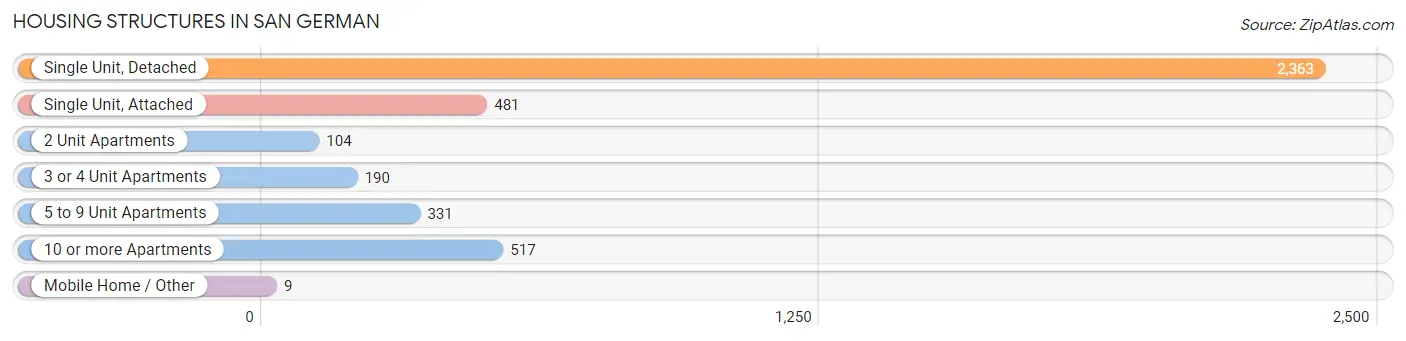
| Structure Type | # Housing Units | % Housing Units |
| Single Unit, Detached | 2,363 | 59.2% |
| Single Unit, Attached | 481 | 12.0% |
| 2 Unit Apartments | 104 | 2.6% |
| 3 or 4 Unit Apartments | 190 | 4.8% |
| 5 to 9 Unit Apartments | 331 | 8.3% |
| 10 or more Apartments | 517 | 12.9% |
| Mobile Home / Other | 9 | 0.2% |
| Total | 3,995 | 100.0% |
Housing Structures by Occupancy in San German
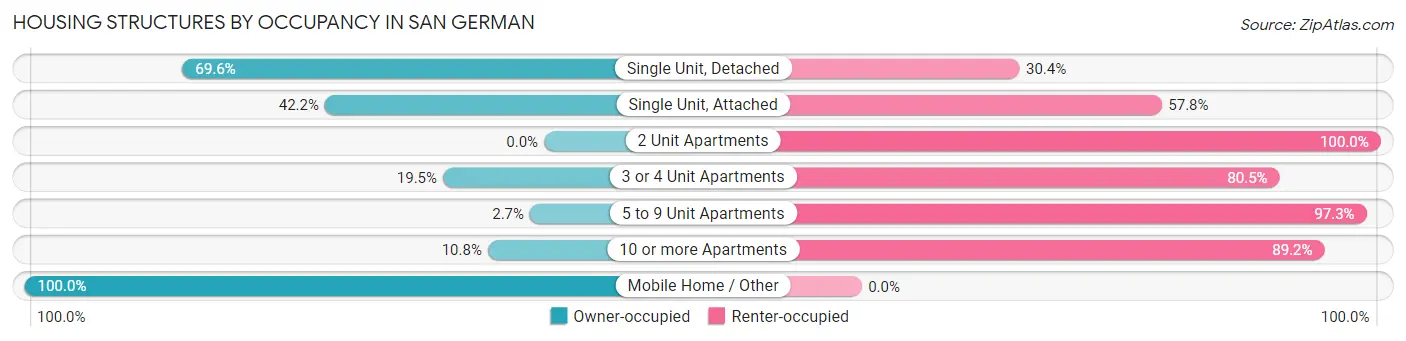
| Structure Type | Owner-occupied | Renter-occupied |
| Single Unit, Detached | 1,645 (69.6%) | 718 (30.4%) |
| Single Unit, Attached | 203 (42.2%) | 278 (57.8%) |
| 2 Unit Apartments | 0 (0.0%) | 104 (100.0%) |
| 3 or 4 Unit Apartments | 37 (19.5%) | 153 (80.5%) |
| 5 to 9 Unit Apartments | 9 (2.7%) | 322 (97.3%) |
| 10 or more Apartments | 56 (10.8%) | 461 (89.2%) |
| Mobile Home / Other | 9 (100.0%) | 0 (0.0%) |
| Total | 1,959 (49.0%) | 2,036 (51.0%) |
Housing Structures by Number of Rooms in San German
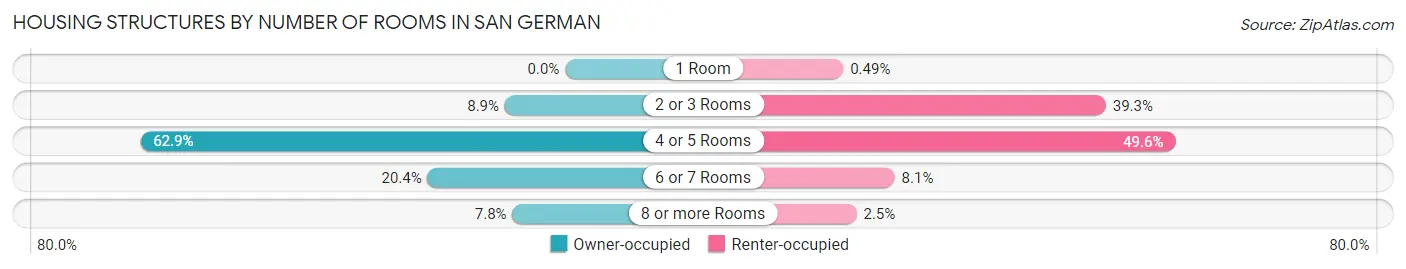
| Number of Rooms | Owner-occupied | Renter-occupied |
| 1 Room | 0 (0.0%) | 10 (0.5%) |
| 2 or 3 Rooms | 175 (8.9%) | 801 (39.3%) |
| 4 or 5 Rooms | 1,232 (62.9%) | 1,010 (49.6%) |
| 6 or 7 Rooms | 399 (20.4%) | 165 (8.1%) |
| 8 or more Rooms | 153 (7.8%) | 50 (2.5%) |
| Total | 1,959 (100.0%) | 2,036 (100.0%) |
Housing Structure by Heating Type in San German
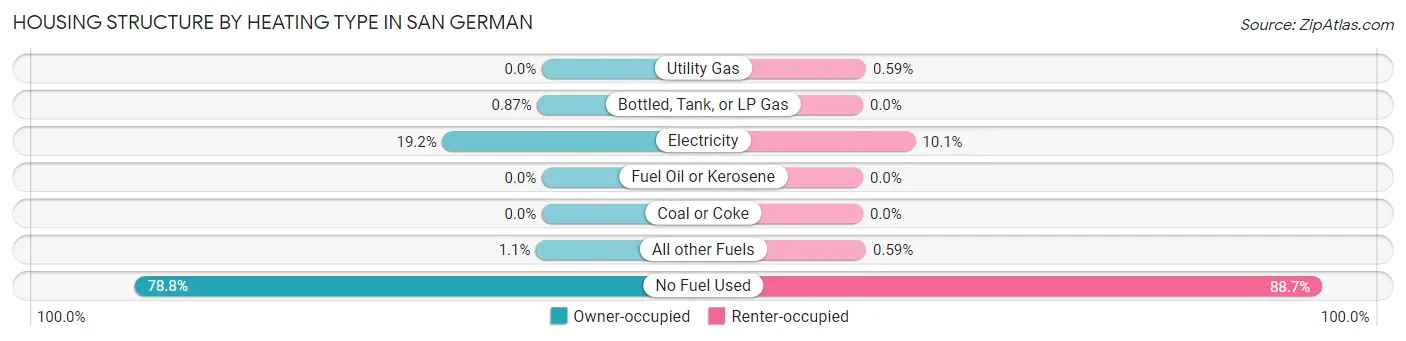
| Heating Type | Owner-occupied | Renter-occupied |
| Utility Gas | 0 (0.0%) | 12 (0.6%) |
| Bottled, Tank, or LP Gas | 17 (0.9%) | 0 (0.0%) |
| Electricity | 377 (19.2%) | 206 (10.1%) |
| Fuel Oil or Kerosene | 0 (0.0%) | 0 (0.0%) |
| Coal or Coke | 0 (0.0%) | 0 (0.0%) |
| All other Fuels | 22 (1.1%) | 12 (0.6%) |
| No Fuel Used | 1,543 (78.8%) | 1,806 (88.7%) |
| Total | 1,959 (100.0%) | 2,036 (100.0%) |
Household Vehicle Usage in San German
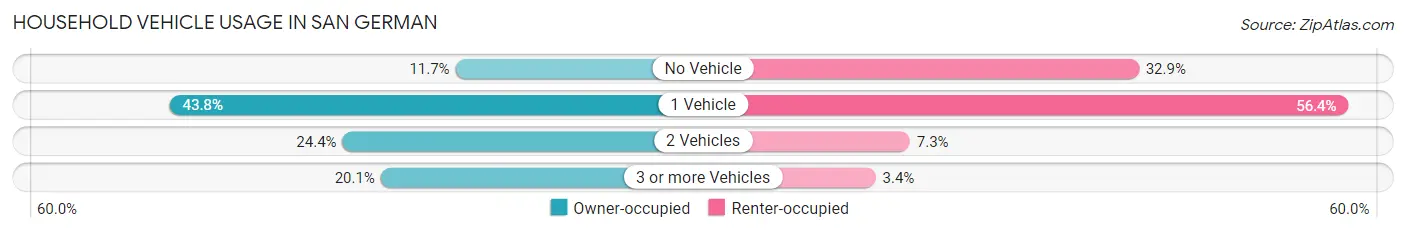
| Vehicles per Household | Owner-occupied | Renter-occupied |
| No Vehicle | 230 (11.7%) | 670 (32.9%) |
| 1 Vehicle | 857 (43.8%) | 1,148 (56.4%) |
| 2 Vehicles | 478 (24.4%) | 148 (7.3%) |
| 3 or more Vehicles | 394 (20.1%) | 70 (3.4%) |
| Total | 1,959 (100.0%) | 2,036 (100.0%) |
Real Estate & Mortgages in San German
Real Estate and Mortgage Overview in San German
| Characteristic | Without Mortgage | With Mortgage |
| Housing Units | 1,283 | 676 |
| Median Property Value | $99,200 | $123,500 |
| Median Household Income | $20,261 | $10 |
| Monthly Housing Costs | $136 | $0 |
| Real Estate Taxes | - | - |
Property Value by Mortgage Status in San German
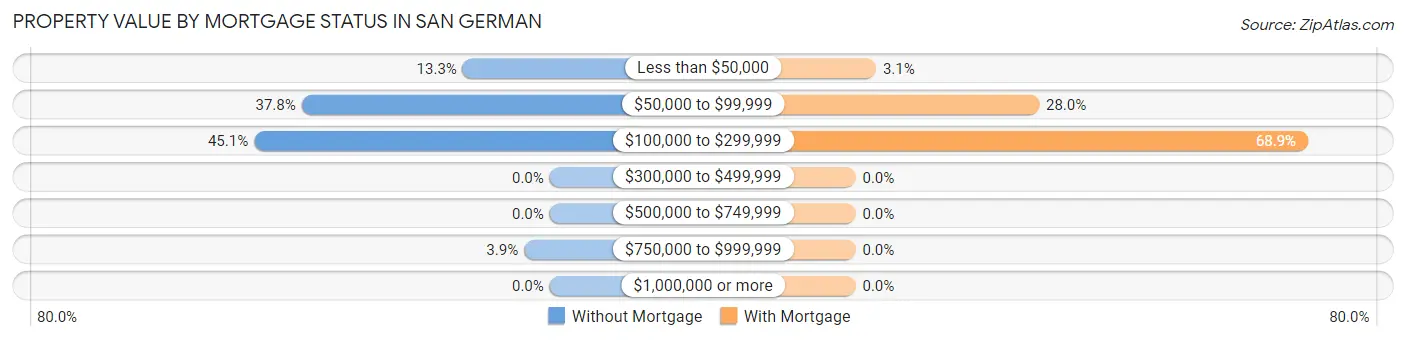
| Property Value | Without Mortgage | With Mortgage |
| Less than $50,000 | 170 (13.3%) | 21 (3.1%) |
| $50,000 to $99,999 | 485 (37.8%) | 189 (28.0%) |
| $100,000 to $299,999 | 578 (45.1%) | 466 (68.9%) |
| $300,000 to $499,999 | 0 (0.0%) | 0 (0.0%) |
| $500,000 to $749,999 | 0 (0.0%) | 0 (0.0%) |
| $750,000 to $999,999 | 50 (3.9%) | 0 (0.0%) |
| $1,000,000 or more | 0 (0.0%) | 0 (0.0%) |
| Total | 1,283 (100.0%) | 676 (100.0%) |
Household Income by Mortgage Status in San German
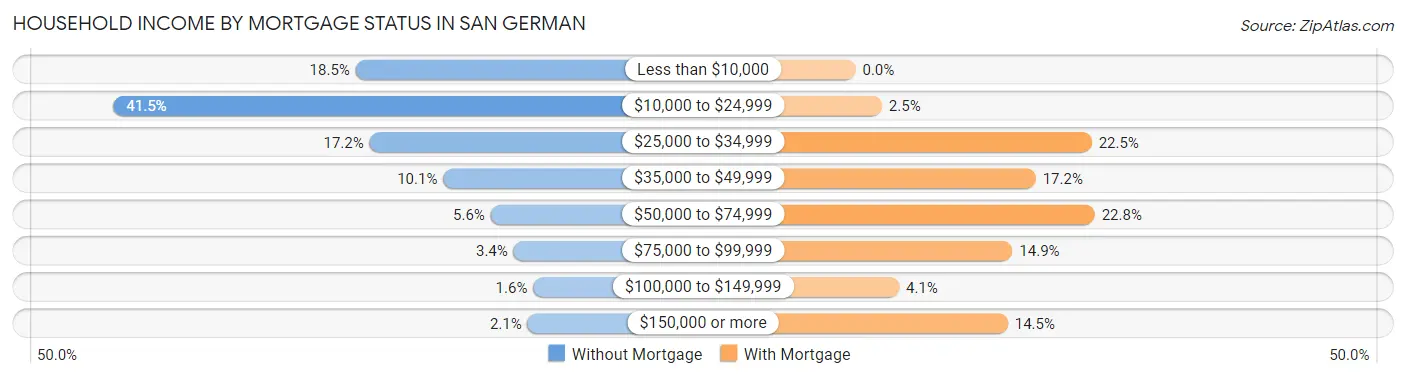
| Household Income | Without Mortgage | With Mortgage |
| Less than $10,000 | 237 (18.5%) | 0 (0.0%) |
| $10,000 to $24,999 | 533 (41.5%) | 17 (2.5%) |
| $25,000 to $34,999 | 220 (17.2%) | 152 (22.5%) |
| $35,000 to $49,999 | 130 (10.1%) | 116 (17.2%) |
| $50,000 to $74,999 | 72 (5.6%) | 154 (22.8%) |
| $75,000 to $99,999 | 44 (3.4%) | 101 (14.9%) |
| $100,000 to $149,999 | 20 (1.6%) | 28 (4.1%) |
| $150,000 or more | 27 (2.1%) | 98 (14.5%) |
| Total | 1,283 (100.0%) | 676 (100.0%) |
Property Value to Household Income Ratio in San German
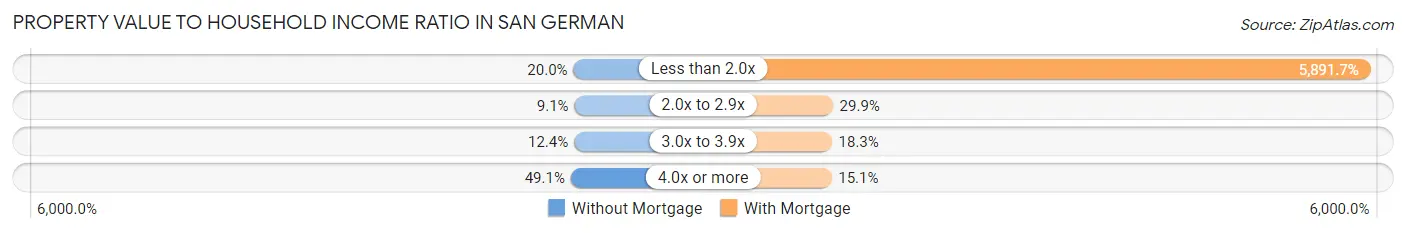
| Value-to-Income Ratio | Without Mortgage | With Mortgage |
| Less than 2.0x | 256 (20.0%) | 39,828 (5,891.7%) |
| 2.0x to 2.9x | 117 (9.1%) | 202 (29.9%) |
| 3.0x to 3.9x | 159 (12.4%) | 124 (18.3%) |
| 4.0x or more | 630 (49.1%) | 102 (15.1%) |
| Total | 1,283 (100.0%) | 676 (100.0%) |
Real Estate Taxes by Mortgage Status in San German
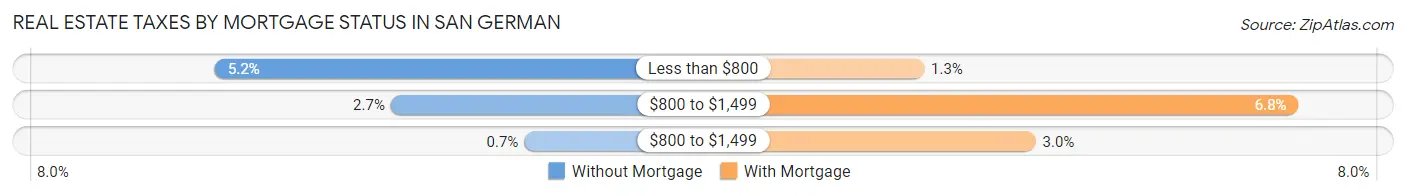
| Property Taxes | Without Mortgage | With Mortgage |
| Less than $800 | 67 (5.2%) | 9 (1.3%) |
| $800 to $1,499 | 34 (2.6%) | 46 (6.8%) |
| $800 to $1,499 | 9 (0.7%) | 20 (3.0%) |
| Total | 1,283 (100.0%) | 676 (100.0%) |
Health & Disability in San German
Health Insurance Coverage by Age in San German
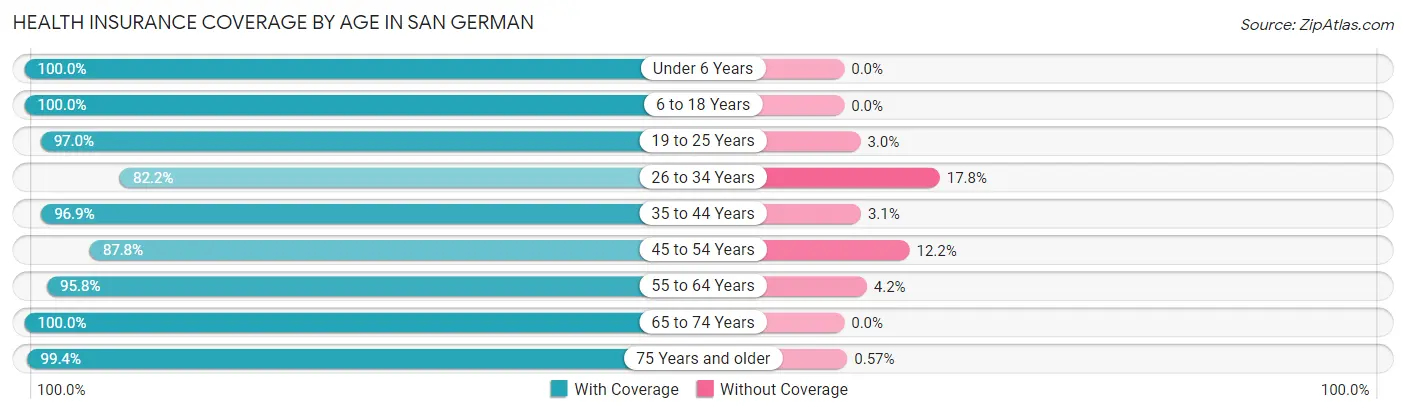
| Age Bracket | With Coverage | Without Coverage |
| Under 6 Years | 484 (100.0%) | 0 (0.0%) |
| 6 to 18 Years | 1,583 (100.0%) | 0 (0.0%) |
| 19 to 25 Years | 1,223 (97.0%) | 38 (3.0%) |
| 26 to 34 Years | 863 (82.2%) | 187 (17.8%) |
| 35 to 44 Years | 1,061 (96.9%) | 34 (3.1%) |
| 45 to 54 Years | 873 (87.8%) | 121 (12.2%) |
| 55 to 64 Years | 957 (95.8%) | 42 (4.2%) |
| 65 to 74 Years | 1,144 (100.0%) | 0 (0.0%) |
| 75 Years and older | 1,579 (99.4%) | 9 (0.6%) |
| Total | 9,767 (95.8%) | 431 (4.2%) |
Health Insurance Coverage by Citizenship Status in San German
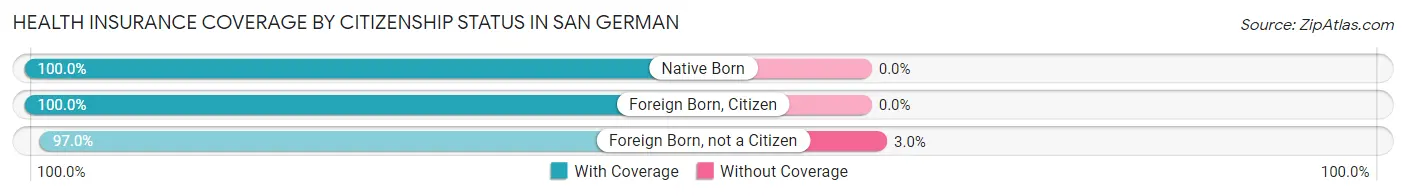
| Citizenship Status | With Coverage | Without Coverage |
| Native Born | 484 (100.0%) | 0 (0.0%) |
| Foreign Born, Citizen | 1,583 (100.0%) | 0 (0.0%) |
| Foreign Born, not a Citizen | 1,223 (97.0%) | 38 (3.0%) |
Health Insurance Coverage by Household Income in San German
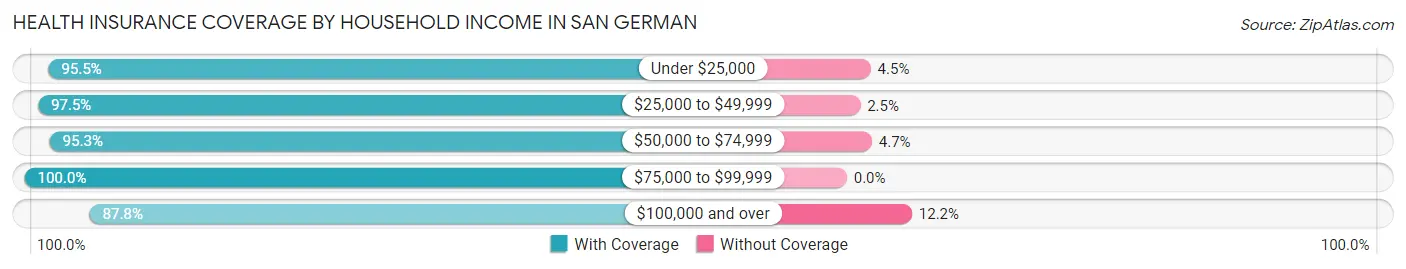
| Household Income | With Coverage | Without Coverage |
| Under $25,000 | 5,513 (95.5%) | 258 (4.5%) |
| $25,000 to $49,999 | 2,291 (97.5%) | 59 (2.5%) |
| $50,000 to $74,999 | 893 (95.3%) | 44 (4.7%) |
| $75,000 to $99,999 | 342 (100.0%) | 0 (0.0%) |
| $100,000 and over | 454 (87.8%) | 63 (12.2%) |
Public vs Private Health Insurance Coverage by Age in San German
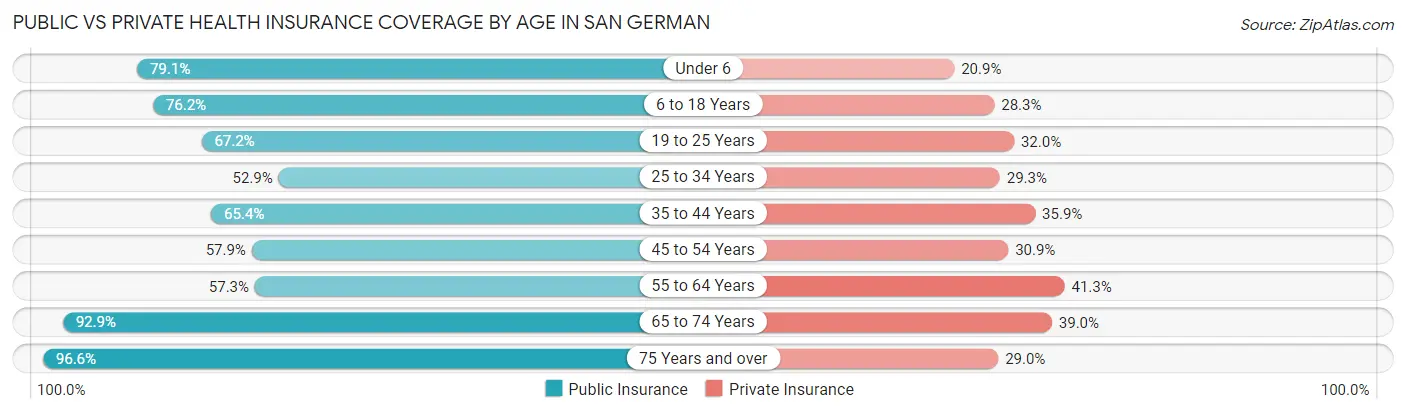
| Age Bracket | Public Insurance | Private Insurance |
| Under 6 | 383 (79.1%) | 101 (20.9%) |
| 6 to 18 Years | 1,206 (76.2%) | 448 (28.3%) |
| 19 to 25 Years | 847 (67.2%) | 403 (32.0%) |
| 25 to 34 Years | 555 (52.9%) | 308 (29.3%) |
| 35 to 44 Years | 716 (65.4%) | 393 (35.9%) |
| 45 to 54 Years | 575 (57.9%) | 307 (30.9%) |
| 55 to 64 Years | 572 (57.3%) | 413 (41.3%) |
| 65 to 74 Years | 1,063 (92.9%) | 446 (39.0%) |
| 75 Years and over | 1,534 (96.6%) | 461 (29.0%) |
| Total | 7,451 (73.1%) | 3,280 (32.2%) |
Disability Status by Sex by Age in San German
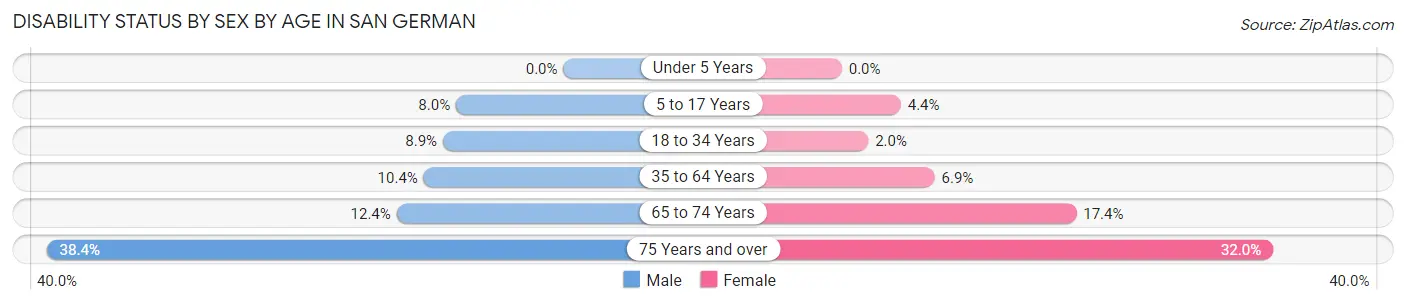
| Age Bracket | Male | Female |
| Under 5 Years | 0 (0.0%) | 0 (0.0%) |
| 5 to 17 Years | 53 (8.0%) | 39 (4.4%) |
| 18 to 34 Years | 99 (8.9%) | 26 (2.0%) |
| 35 to 64 Years | 135 (10.4%) | 123 (6.9%) |
| 65 to 74 Years | 67 (12.4%) | 105 (17.4%) |
| 75 Years and over | 252 (38.4%) | 298 (32.0%) |
Disability Class by Sex by Age in San German
Disability Class: Hearing Difficulty
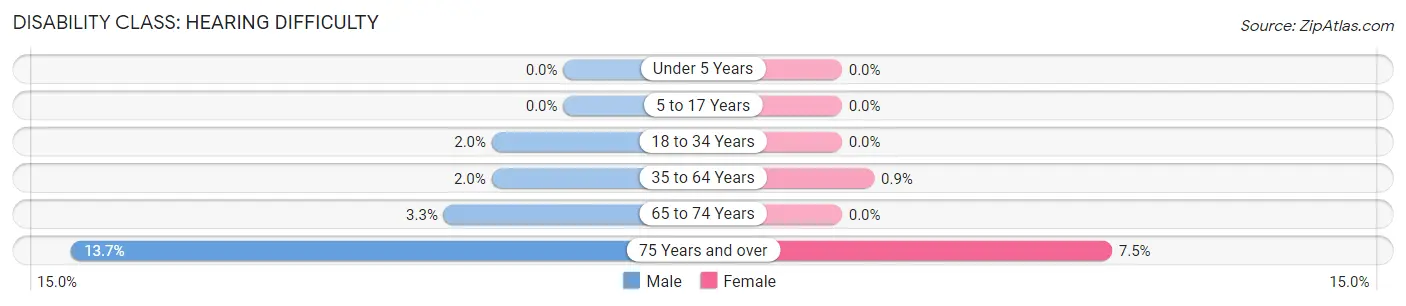
| Age Bracket | Male | Female |
| Under 5 Years | 0 (0.0%) | 0 (0.0%) |
| 5 to 17 Years | 0 (0.0%) | 0 (0.0%) |
| 18 to 34 Years | 22 (2.0%) | 0 (0.0%) |
| 35 to 64 Years | 26 (2.0%) | 16 (0.9%) |
| 65 to 74 Years | 18 (3.3%) | 0 (0.0%) |
| 75 Years and over | 90 (13.7%) | 70 (7.5%) |
Disability Class: Vision Difficulty
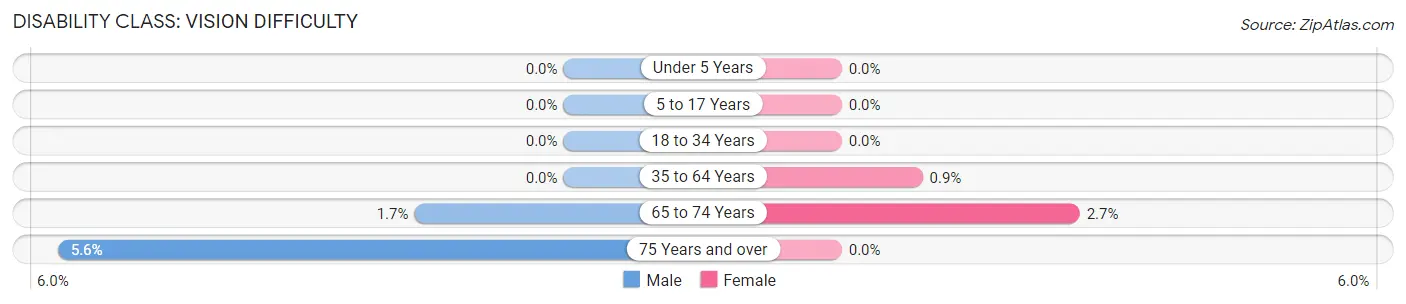
| Age Bracket | Male | Female |
| Under 5 Years | 0 (0.0%) | 0 (0.0%) |
| 5 to 17 Years | 0 (0.0%) | 0 (0.0%) |
| 18 to 34 Years | 0 (0.0%) | 0 (0.0%) |
| 35 to 64 Years | 0 (0.0%) | 16 (0.9%) |
| 65 to 74 Years | 9 (1.7%) | 16 (2.6%) |
| 75 Years and over | 37 (5.6%) | 0 (0.0%) |
Disability Class: Cognitive Difficulty
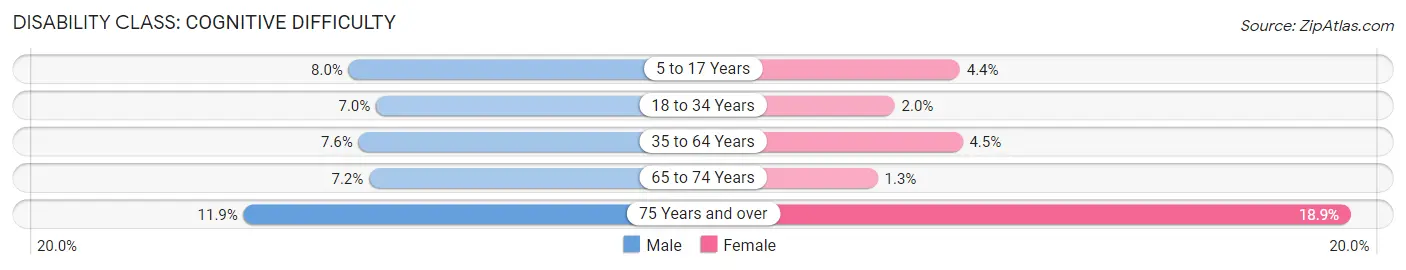
| Age Bracket | Male | Female |
| 5 to 17 Years | 53 (8.0%) | 39 (4.4%) |
| 18 to 34 Years | 77 (7.0%) | 26 (2.0%) |
| 35 to 64 Years | 99 (7.6%) | 80 (4.5%) |
| 65 to 74 Years | 39 (7.2%) | 8 (1.3%) |
| 75 Years and over | 78 (11.9%) | 176 (18.9%) |
Disability Class: Ambulatory Difficulty
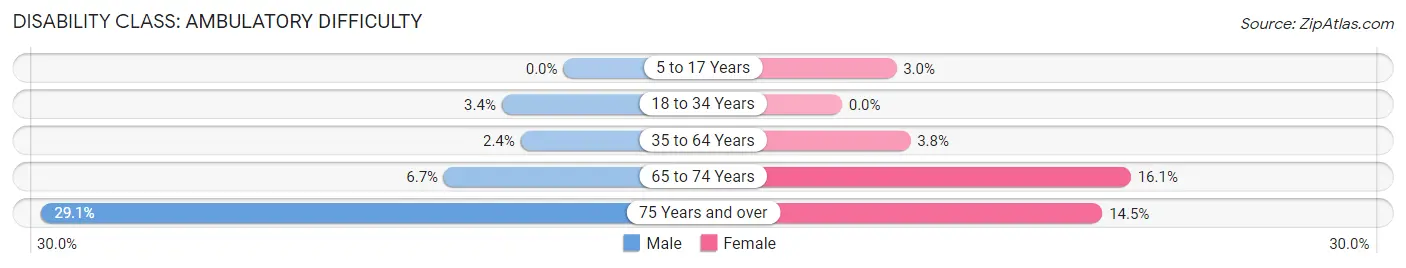
| Age Bracket | Male | Female |
| 5 to 17 Years | 0 (0.0%) | 27 (3.0%) |
| 18 to 34 Years | 38 (3.4%) | 0 (0.0%) |
| 35 to 64 Years | 31 (2.4%) | 68 (3.8%) |
| 65 to 74 Years | 36 (6.7%) | 97 (16.1%) |
| 75 Years and over | 191 (29.1%) | 135 (14.5%) |
Disability Class: Self-Care Difficulty
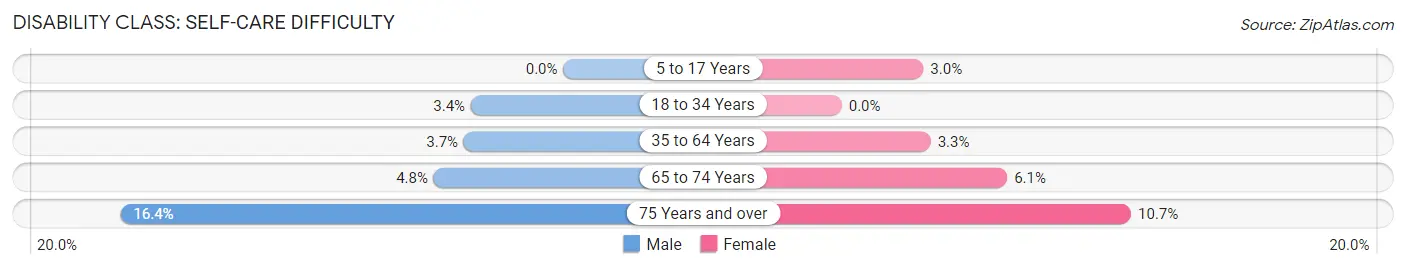
| Age Bracket | Male | Female |
| 5 to 17 Years | 0 (0.0%) | 27 (3.0%) |
| 18 to 34 Years | 38 (3.4%) | 0 (0.0%) |
| 35 to 64 Years | 48 (3.7%) | 59 (3.3%) |
| 65 to 74 Years | 26 (4.8%) | 37 (6.1%) |
| 75 Years and over | 108 (16.4%) | 100 (10.7%) |
Technology Access in San German
Computing Device Access in San German
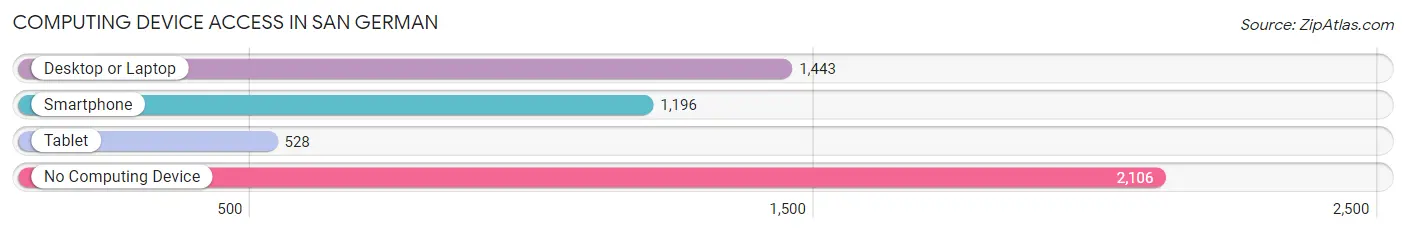
| Device Type | # Households | % Households |
| Desktop or Laptop | 1,443 | 36.1% |
| Smartphone | 1,196 | 29.9% |
| Tablet | 528 | 13.2% |
| No Computing Device | 2,106 | 52.7% |
| Total | 3,995 | 100.0% |
Internet Access in San German
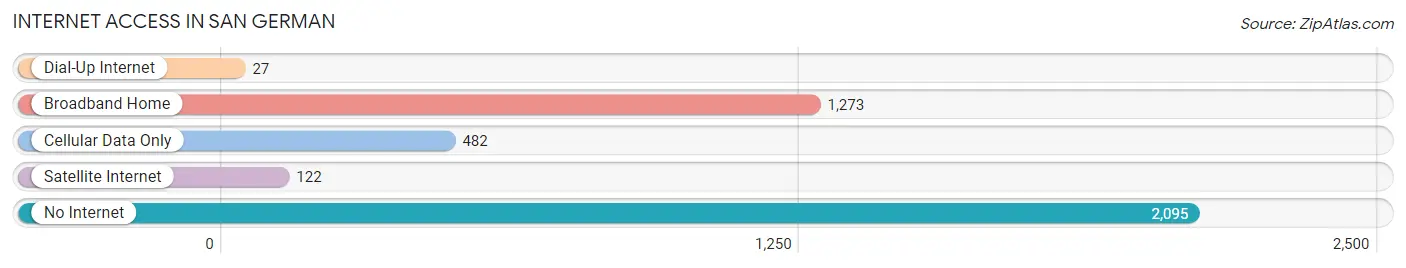
| Internet Type | # Households | % Households |
| Dial-Up Internet | 27 | 0.7% |
| Broadband Home | 1,273 | 31.9% |
| Cellular Data Only | 482 | 12.1% |
| Satellite Internet | 122 | 3.0% |
| No Internet | 2,095 | 52.4% |
| Total | 3,995 | 100.0% |
San German Summary
San German is a municipality located in the southwestern region of Puerto Rico. It is the second oldest city in the island, founded in 1570 by Spanish settlers. San German is known for its rich history, culture, and architecture. It is also known for its beautiful beaches, lush vegetation, and vibrant economy.
Geography
San German is located in the southwestern region of Puerto Rico, in the Mayagüez-San Germán-Cabo Rojo Metropolitan Statistical Area. It is bordered by the municipalities of Mayagüez, Cabo Rojo, and Lajas. The municipality covers an area of approximately 40 square miles and has a population of approximately 40,000 people. The terrain is mostly flat with some hills and mountains in the northern part of the municipality. The climate is tropical with an average temperature of 79°F.
Economy
San German’s economy is largely based on agriculture, tourism, and manufacturing. The main agricultural products are sugarcane, coffee, and tobacco. The tourism industry is centered around the city’s many beaches, historical sites, and cultural attractions. The manufacturing sector is focused on food processing, electronics, and textiles.
Demographics
As of the 2010 census, San German had a population of 39,945 people. The racial makeup of the population was 79.3% White, 15.2% Black, 0.3% Native American, 0.2% Asian, and 4.9% other. The median household income was $17,845 and the median family income was $20,945. The unemployment rate was 11.2%.
History
San German was founded in 1570 by Spanish settlers. It was originally named San German de Auxerre after the French city of Auxerre. The city was an important port during the colonial period and was the site of several battles during the Spanish-American War. In the 19th century, the city was a major center of the sugar industry. In the 20th century, the city experienced a period of economic decline due to the decline of the sugar industry. However, in recent years, the city has experienced a resurgence in its economy due to the growth of the tourism industry.
San German is known for its rich history, culture, and architecture. The city is home to several historical sites, including the San German Cathedral, the San German Municipal Palace, and the San German Museum. The city is also home to several cultural attractions, such as the San German Cultural Center and the San German Arts Center.
Conclusion
San German is a municipality located in the southwestern region of Puerto Rico. It is the second oldest city in the island, founded in 1570 by Spanish settlers. San German is known for its rich history, culture, and architecture. It is also known for its beautiful beaches, lush vegetation, and vibrant economy. The economy is largely based on agriculture, tourism, and manufacturing. As of the 2010 census, San German had a population of 39,945 people. The city is home to several historical sites, cultural attractions, and is a major center of the tourism industry.
Common Questions
What is Per Capita Income in San German?
Per Capita income in San German is $13,115.
What is the Median Family Income in San German?
Median Family Income in San German is $25,138.
What is the Median Household income in San German?
Median Household Income in San German is $15,707.
What is Income or Wage Gap in San German?
Income or Wage Gap in San German is 11.3%.
Women in San German earn 88.7 cents for every dollar earned by a man.
What is Family Income Deficit in San German?
Family Income Deficit in San German is $16,075.
Families that are below poverty line in San German earn $16,075 less on average than the poverty threshold level.
What is Inequality or Gini Index in San German?
Inequality or Gini Index in San German is 0.61.
What is the Total Population of San German?
Total Population of San German is 10,266.
What is the Total Male Population of San German?
Total Male Population of San German is 4,538.
What is the Total Female Population of San German?
Total Female Population of San German is 5,728.
What is the Ratio of Males per 100 Females in San German?
There are 79.22 Males per 100 Females in San German.
What is the Ratio of Females per 100 Males in San German?
There are 126.22 Females per 100 Males in San German.
What is the Median Population Age in San German?
Median Population Age in San German is 42.1 Years.
What is the Average Family Size in San German
Average Family Size in San German is 3.7 People.
What is the Average Household Size in San German
Average Household Size in San German is 2.5 People.
How Large is the Labor Force in San German?
There are 2,392 People in the Labor Forcein in San German.
What is the Percentage of People in the Labor Force in San German?
28.0% of People are in the Labor Force in San German.
What is the Unemployment Rate in San German?
Unemployment Rate in San German is 7.7%.