Anasco, PR Map & Demographics
Anasco Overview
$14,320
PER CAPITA INCOME
$29,892
AVG FAMILY INCOME
$25,233
AVG HOUSEHOLD INCOME
25.9%
WAGE / INCOME GAP [ % ]
74.1¢/ $1
WAGE / INCOME GAP [ $ ]
0.42
INEQUALITY / GINI INDEX
4,562
TOTAL POPULATION
2,105
MALE POPULATION
2,457
FEMALE POPULATION
85.67
MALES / 100 FEMALES
116.72
FEMALES / 100 MALES
50.7
MEDIAN AGE
3.6
AVG FAMILY SIZE
2.7
AVG HOUSEHOLD SIZE
1,710
LABOR FORCE [ PEOPLE ]
43.5%
PERCENT IN LABOR FORCE
13.0%
UNEMPLOYMENT RATE
Anasco Zip Codes
Anasco Area Codes
Income in Anasco
Income Overview in Anasco
Per Capita Income in Anasco is $14,320, while median incomes of families and households are $29,892 and $25,233 respectively.
| Characteristic | Number | Measure |
| Per Capita Income | 4,562 | $14,320 |
| Median Family Income | 1,031 | $29,892 |
| Mean Family Income | 1,031 | $35,865 |
| Median Household Income | 1,680 | $25,233 |
| Mean Household Income | 1,680 | $31,002 |
| Income Deficit | 1,031 | $0 |
| Wage / Income Gap (%) | 4,562 | 25.86% |
| Wage / Income Gap ($) | 4,562 | 74.14¢ per $1 |
| Gini / Inequality Index | 4,562 | 0.42 |
Earnings by Sex in Anasco
Average Earnings in Anasco are $16,790, $15,316 for men and $20,658 for women, a difference of 25.9%.
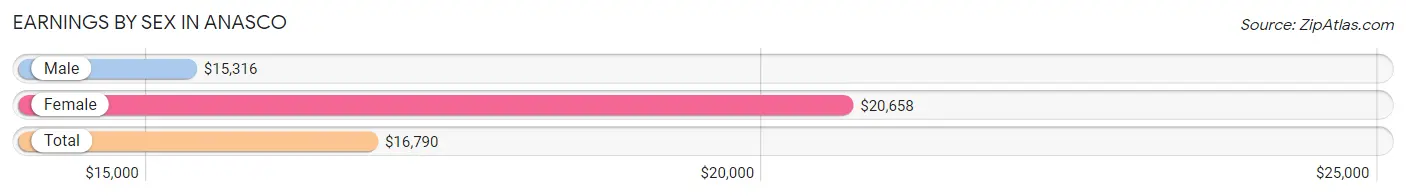
| Sex | Number | Average Earnings |
| Male | 869 (51.9%) | $15,316 |
| Female | 806 (48.1%) | $20,658 |
| Total | 1,675 (100.0%) | $16,790 |
Earnings by Sex by Income Bracket in Anasco
The most common earnings brackets in Anasco are $12,500 to $14,999 for men (171 | 19.7%) and $20,000 to $22,499 for women (152 | 18.9%).
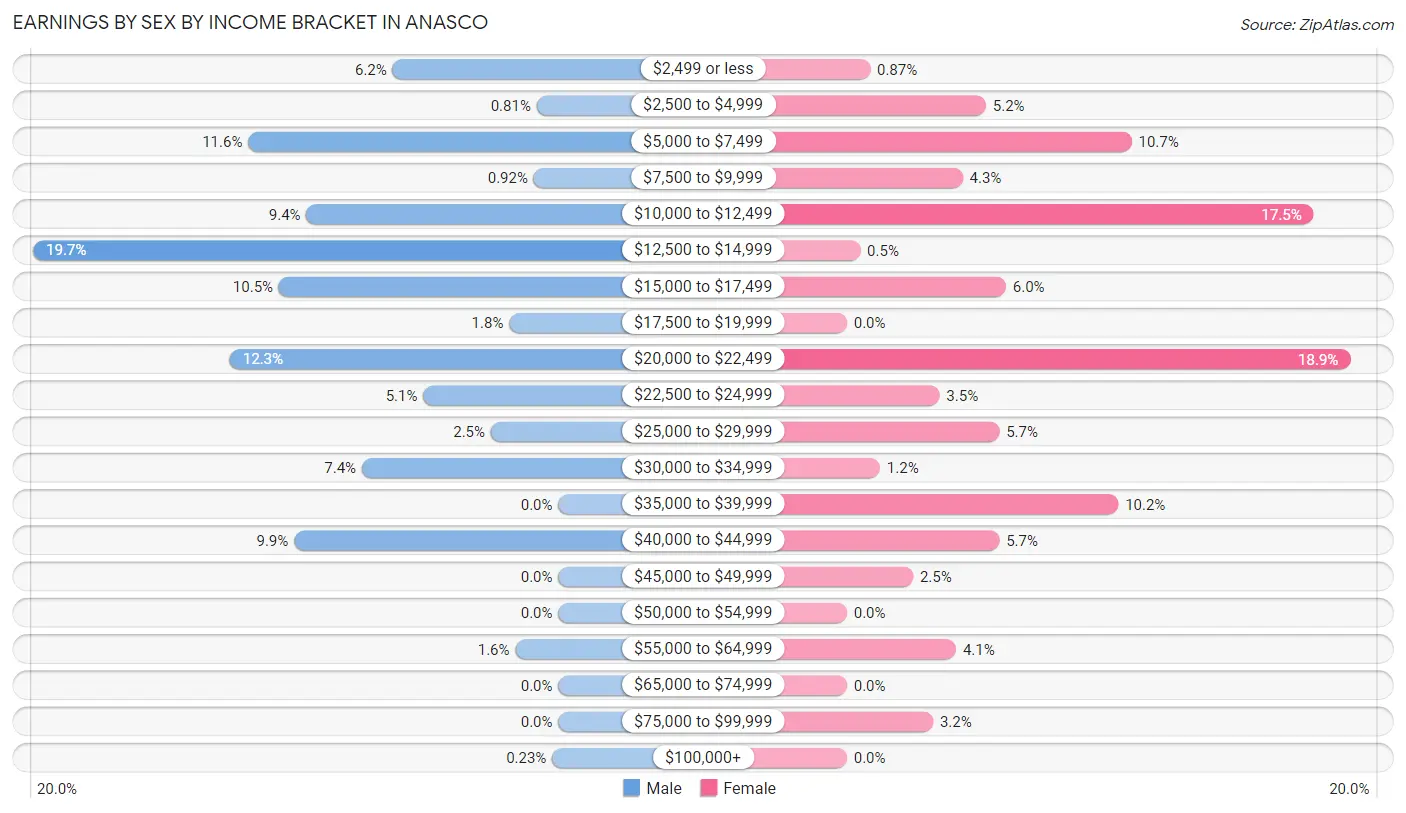
| Income | Male | Female |
| $2,499 or less | 54 (6.2%) | 7 (0.9%) |
| $2,500 to $4,999 | 7 (0.8%) | 42 (5.2%) |
| $5,000 to $7,499 | 101 (11.6%) | 86 (10.7%) |
| $7,500 to $9,999 | 8 (0.9%) | 35 (4.3%) |
| $10,000 to $12,499 | 82 (9.4%) | 141 (17.5%) |
| $12,500 to $14,999 | 171 (19.7%) | 4 (0.5%) |
| $15,000 to $17,499 | 91 (10.5%) | 48 (6.0%) |
| $17,500 to $19,999 | 16 (1.8%) | 0 (0.0%) |
| $20,000 to $22,499 | 107 (12.3%) | 152 (18.9%) |
| $22,500 to $24,999 | 44 (5.1%) | 28 (3.5%) |
| $25,000 to $29,999 | 22 (2.5%) | 46 (5.7%) |
| $30,000 to $34,999 | 64 (7.4%) | 10 (1.2%) |
| $35,000 to $39,999 | 0 (0.0%) | 82 (10.2%) |
| $40,000 to $44,999 | 86 (9.9%) | 46 (5.7%) |
| $45,000 to $49,999 | 0 (0.0%) | 20 (2.5%) |
| $50,000 to $54,999 | 0 (0.0%) | 0 (0.0%) |
| $55,000 to $64,999 | 14 (1.6%) | 33 (4.1%) |
| $65,000 to $74,999 | 0 (0.0%) | 0 (0.0%) |
| $75,000 to $99,999 | 0 (0.0%) | 26 (3.2%) |
| $100,000+ | 2 (0.2%) | 0 (0.0%) |
| Total | 869 (100.0%) | 806 (100.0%) |
Earnings by Sex by Educational Attainment in Anasco
Average earnings in Anasco are $16,415 for men and $20,997 for women, a difference of 21.8%. Men with an educational attainment of graduate degree enjoy the highest average annual earnings of $40,865, while those with high school diploma education earn the least with $13,875. Women with an educational attainment of graduate degree earn the most with the average annual earnings of $43,347, while those with college or associate's degree education have the smallest earnings of $24,659.
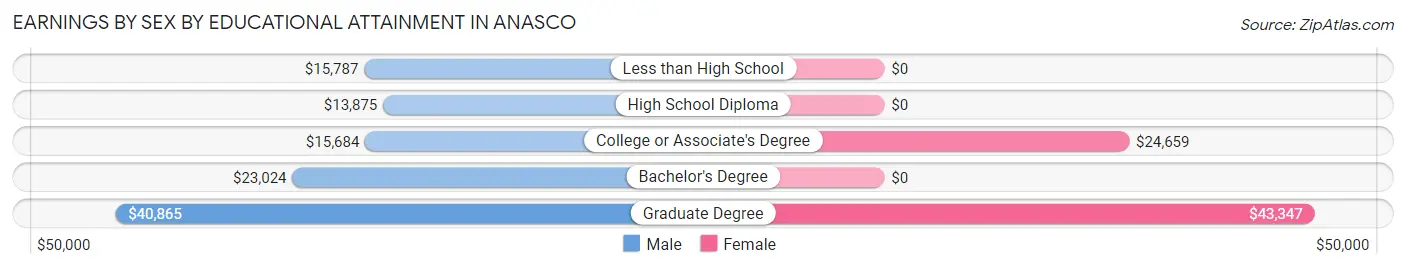
| Educational Attainment | Male Income | Female Income |
| Less than High School | $15,787 | $0 |
| High School Diploma | $13,875 | $0 |
| College or Associate's Degree | $15,684 | $24,659 |
| Bachelor's Degree | $23,024 | $0 |
| Graduate Degree | $40,865 | $43,347 |
| Total | $16,415 | $20,997 |
Family Income in Anasco
Family Income Brackets in Anasco
According to the Anasco family income data, there are 192 families falling into the $25,000 to $34,999 income range, which is the most common income bracket and makes up 18.6% of all families.
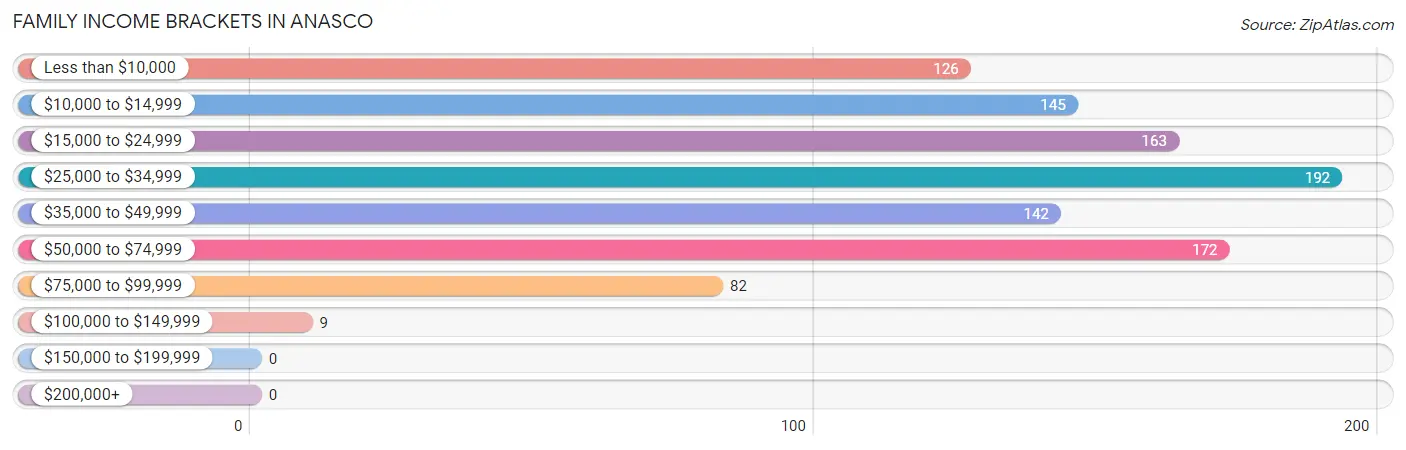
| Income Bracket | # Families | % Families |
| Less than $10,000 | 126 | 12.2% |
| $10,000 to $14,999 | 145 | 14.1% |
| $15,000 to $24,999 | 163 | 15.8% |
| $25,000 to $34,999 | 192 | 18.6% |
| $35,000 to $49,999 | 142 | 13.8% |
| $50,000 to $74,999 | 172 | 16.7% |
| $75,000 to $99,999 | 82 | 8.0% |
| $100,000 to $149,999 | 9 | 0.9% |
| $150,000 to $199,999 | 0 | 0.0% |
| $200,000+ | 0 | 0.0% |
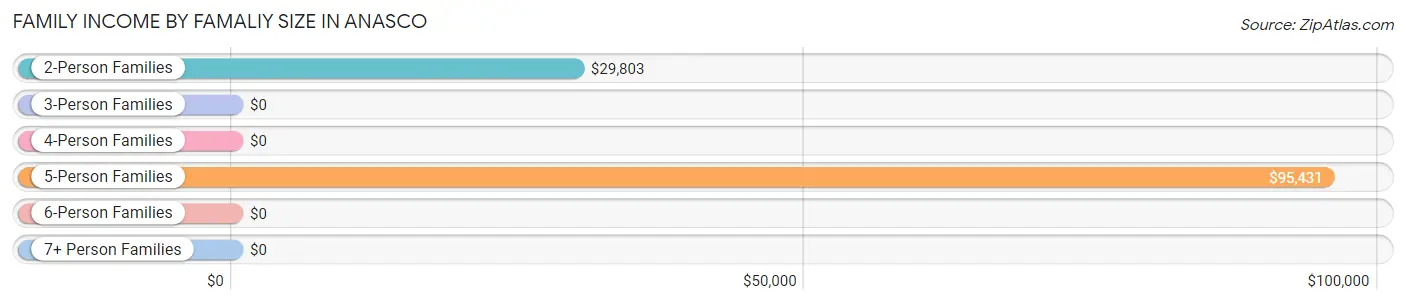
Family Income by Famaliy Size in Anasco
5-person families (48 | 4.7%) account for the highest median family income in Anasco with $95,431 per family, while 5-person families (48 | 4.7%) have the highest median income of $19,086 per family member.
| Income Bracket | # Families | Median Income |
| 2-Person Families | 560 (54.3%) | $29,803 |
| 3-Person Families | 254 (24.6%) | $0 |
| 4-Person Families | 169 (16.4%) | $0 |
| 5-Person Families | 48 (4.7%) | $95,431 |
| 6-Person Families | 0 (0.0%) | $0 |
| 7+ Person Families | 0 (0.0%) | $0 |
| Total | 1,031 (100.0%) | $29,892 |
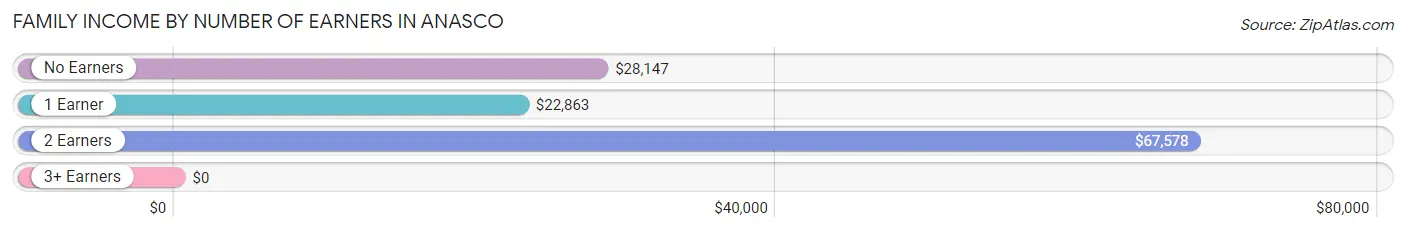
Family Income by Number of Earners in Anasco
| Number of Earners | # Families | Median Income |
| No Earners | 422 (40.9%) | $28,147 |
| 1 Earner | 475 (46.1%) | $22,863 |
| 2 Earners | 93 (9.0%) | $67,578 |
| 3+ Earners | 41 (4.0%) | $0 |
| Total | 1,031 (100.0%) | $29,892 |
Household Income in Anasco
Household Income Brackets in Anasco
With 334 households falling in the category, the $25,000 to $34,999 income range is the most frequent in Anasco, accounting for 19.9% of all households.

| Income Bracket | # Households | % Households |
| Less than $10,000 | 307 | 18.3% |
| $10,000 to $14,999 | 239 | 14.2% |
| $15,000 to $24,999 | 287 | 17.1% |
| $25,000 to $34,999 | 334 | 19.9% |
| $35,000 to $49,999 | 180 | 10.7% |
| $50,000 to $74,999 | 237 | 14.1% |
| $75,000 to $99,999 | 87 | 5.2% |
| $100,000 to $149,999 | 8 | 0.5% |
| $150,000 to $199,999 | 0 | 0.0% |
| $200,000+ | 0 | 0.0% |
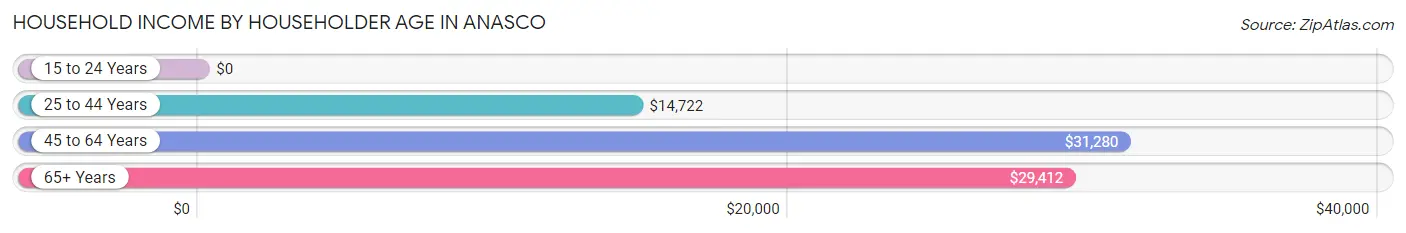
Household Income by Householder Age in Anasco
The median household income in Anasco is $25,233, with the highest median household income of $31,280 found in the 45 to 64 years age bracket for the primary householder. A total of 473 households (28.1%) fall into this category. Meanwhile, the 15 to 24 years age bracket for the primary householder has the lowest median household income of $0, with 11 households (0.6%) in this group.
| Income Bracket | # Households | Median Income |
| 15 to 24 Years | 11 (0.6%) | $0 |
| 25 to 44 Years | 450 (26.8%) | $14,722 |
| 45 to 64 Years | 473 (28.1%) | $31,280 |
| 65+ Years | 746 (44.4%) | $29,412 |
| Total | 1,680 (100.0%) | $25,233 |
Poverty in Anasco
Income Below Poverty by Sex and Age in Anasco
With 33.5% poverty level for males and 38.4% for females among the residents of Anasco, 12 to 14 year old males and 5 year old females are the most vulnerable to poverty, with 27 males (100.0%) and 38 females (100.0%) in their respective age groups living below the poverty level.
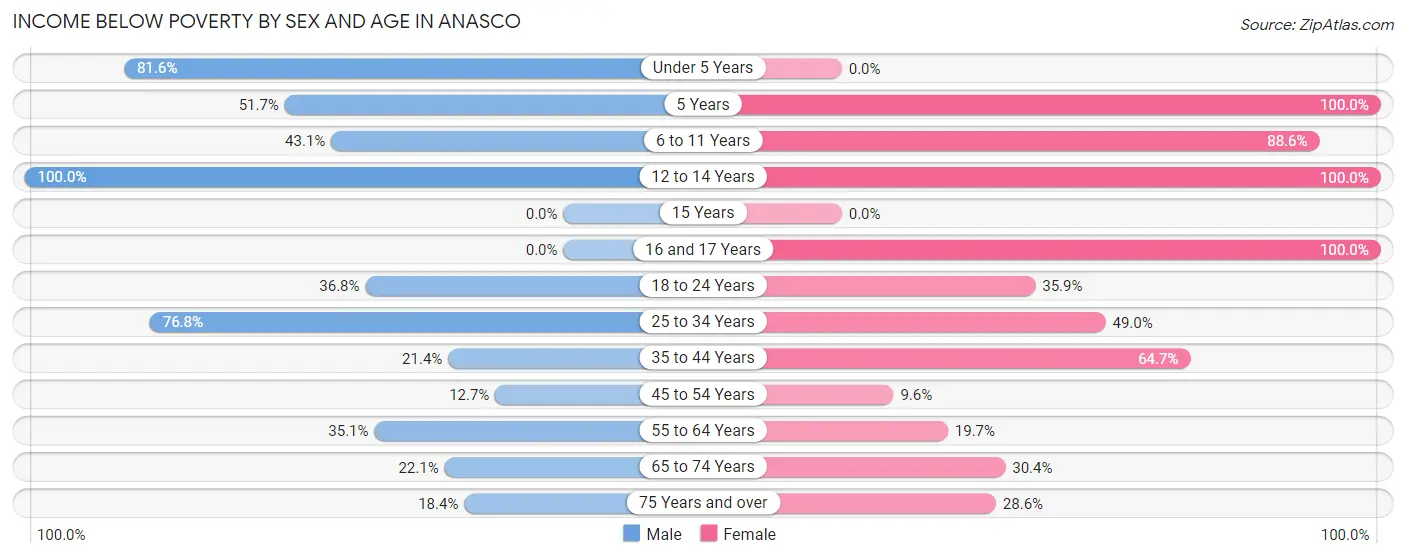
| Age Bracket | Male | Female |
| Under 5 Years | 84 (81.6%) | 0 (0.0%) |
| 5 Years | 15 (51.7%) | 38 (100.0%) |
| 6 to 11 Years | 100 (43.1%) | 117 (88.6%) |
| 12 to 14 Years | 27 (100.0%) | 69 (100.0%) |
| 15 Years | 0 (0.0%) | 0 (0.0%) |
| 16 and 17 Years | 0 (0.0%) | 15 (100.0%) |
| 18 to 24 Years | 61 (36.7%) | 51 (35.9%) |
| 25 to 34 Years | 109 (76.8%) | 164 (49.0%) |
| 35 to 44 Years | 59 (21.4%) | 150 (64.7%) |
| 45 to 54 Years | 32 (12.7%) | 33 (9.6%) |
| 55 to 64 Years | 114 (35.1%) | 64 (19.7%) |
| 65 to 74 Years | 45 (22.1%) | 122 (30.3%) |
| 75 Years and over | 60 (18.4%) | 121 (28.6%) |
| Total | 706 (33.5%) | 944 (38.4%) |
Income Above Poverty by Sex and Age in Anasco
According to the poverty statistics in Anasco, males aged 16 and 17 years and females aged 45 to 54 years are the age groups that are most secure financially, with 100.0% of males and 90.4% of females in these age groups living above the poverty line.
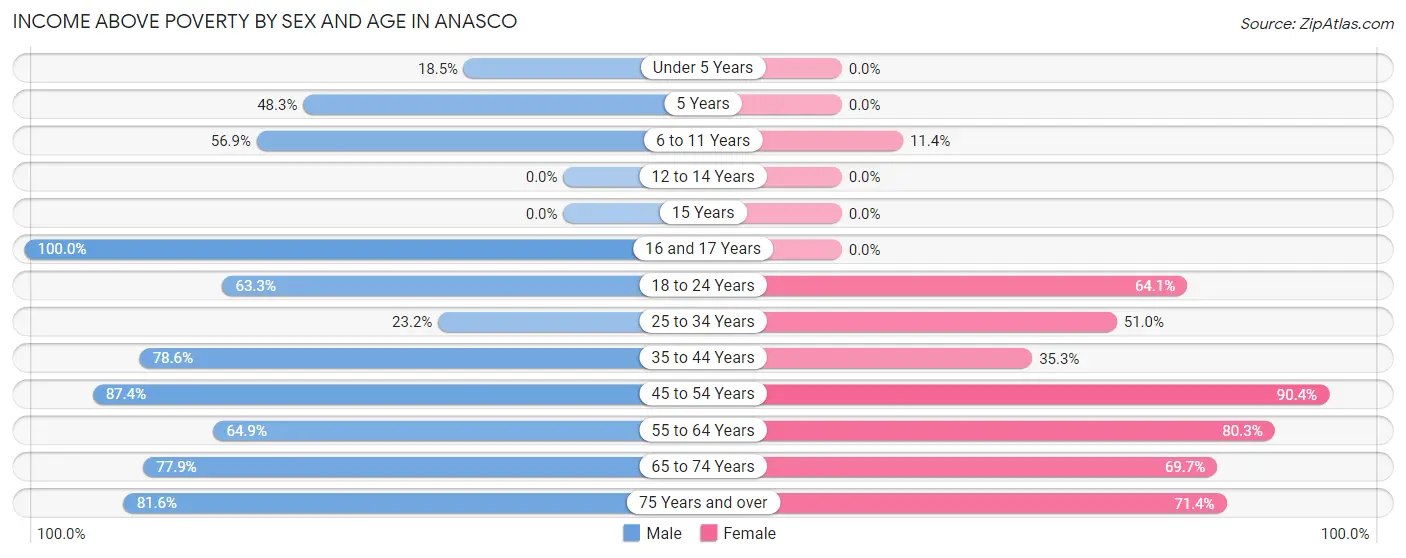
| Age Bracket | Male | Female |
| Under 5 Years | 19 (18.4%) | 0 (0.0%) |
| 5 Years | 14 (48.3%) | 0 (0.0%) |
| 6 to 11 Years | 132 (56.9%) | 15 (11.4%) |
| 12 to 14 Years | 0 (0.0%) | 0 (0.0%) |
| 15 Years | 0 (0.0%) | 0 (0.0%) |
| 16 and 17 Years | 22 (100.0%) | 0 (0.0%) |
| 18 to 24 Years | 105 (63.2%) | 91 (64.1%) |
| 25 to 34 Years | 33 (23.2%) | 171 (51.0%) |
| 35 to 44 Years | 217 (78.6%) | 82 (35.3%) |
| 45 to 54 Years | 221 (87.4%) | 311 (90.4%) |
| 55 to 64 Years | 211 (64.9%) | 261 (80.3%) |
| 65 to 74 Years | 159 (77.9%) | 280 (69.7%) |
| 75 Years and over | 266 (81.6%) | 302 (71.4%) |
| Total | 1,399 (66.5%) | 1,513 (61.6%) |
Income Below Poverty Among Married-Couple Families in Anasco
The poverty statistics for married-couple families in Anasco show that 22.6% or 107 of the total 473 families live below the poverty line. Families with 1 or 2 children have the highest poverty rate of 51.8%, comprising of 57 families. On the other hand, families with no children have the lowest poverty rate of 13.8%, which includes 50 families.
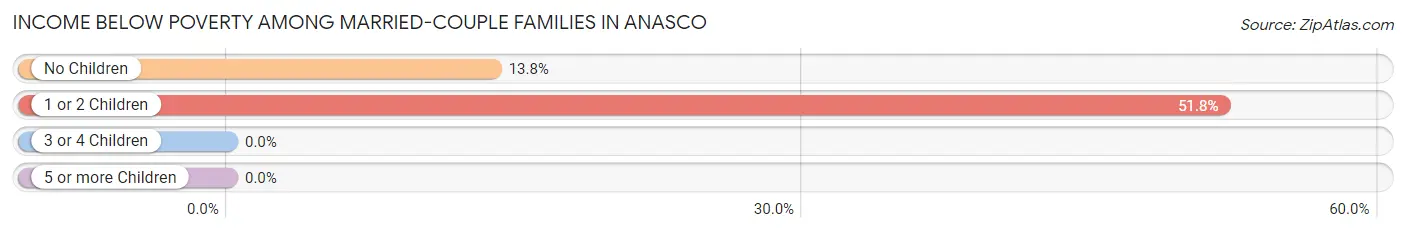
| Children | Above Poverty | Below Poverty |
| No Children | 313 (86.2%) | 50 (13.8%) |
| 1 or 2 Children | 53 (48.2%) | 57 (51.8%) |
| 3 or 4 Children | 0 (0.0%) | 0 (0.0%) |
| 5 or more Children | 0 (0.0%) | 0 (0.0%) |
| Total | 366 (77.4%) | 107 (22.6%) |
Income Below Poverty Among Single-Parent Households in Anasco
According to the poverty data in Anasco, 43.7% or 45 single-father households and 44.0% or 200 single-mother households are living below the poverty line. Among single-father households, those with 1 or 2 children have the highest poverty rate, with 31 households (72.1%) experiencing poverty. Likewise, among single-mother households, those with 3 or 4 children have the highest poverty rate, with 42 households (100.0%) falling below the poverty line.
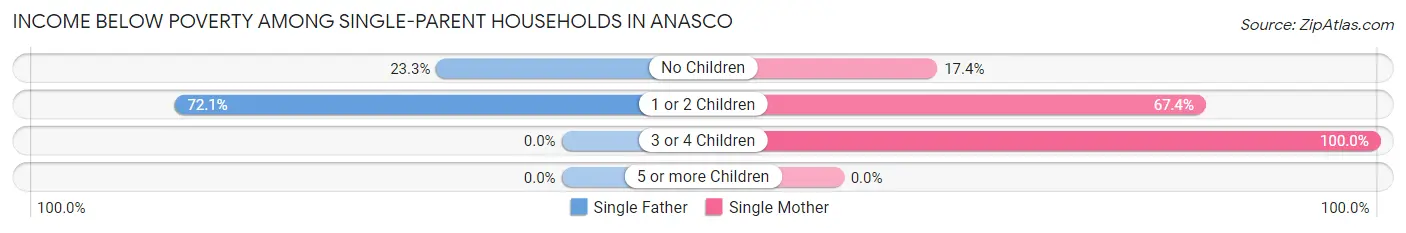
| Children | Single Father | Single Mother |
| No Children | 14 (23.3%) | 42 (17.4%) |
| 1 or 2 Children | 31 (72.1%) | 116 (67.4%) |
| 3 or 4 Children | 0 (0.0%) | 42 (100.0%) |
| 5 or more Children | 0 (0.0%) | 0 (0.0%) |
| Total | 45 (43.7%) | 200 (44.0%) |
Income Below Poverty Among Married-Couple vs Single-Parent Households in Anasco
The poverty data for Anasco shows that 107 of the married-couple family households (22.6%) and 245 of the single-parent households (43.9%) are living below the poverty level. Within the married-couple family households, those with 1 or 2 children have the highest poverty rate, with 57 households (51.8%) falling below the poverty line. Among the single-parent households, those with 3 or 4 children have the highest poverty rate, with 42 household (100.0%) living below poverty.
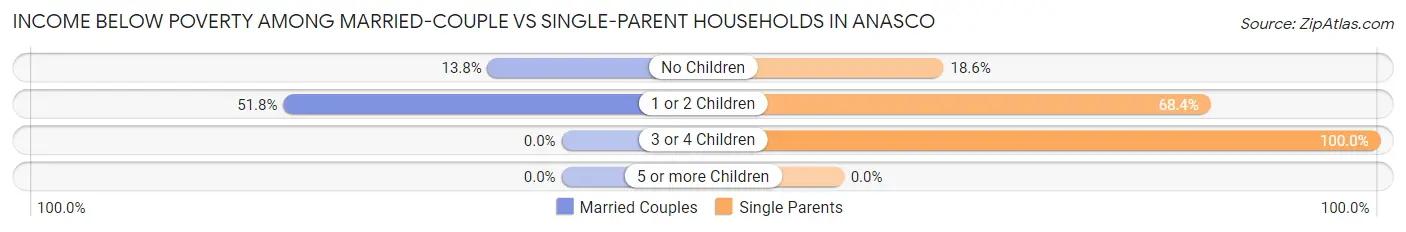
| Children | Married-Couple Families | Single-Parent Households |
| No Children | 50 (13.8%) | 56 (18.6%) |
| 1 or 2 Children | 57 (51.8%) | 147 (68.4%) |
| 3 or 4 Children | 0 (0.0%) | 42 (100.0%) |
| 5 or more Children | 0 (0.0%) | 0 (0.0%) |
| Total | 107 (22.6%) | 245 (43.9%) |
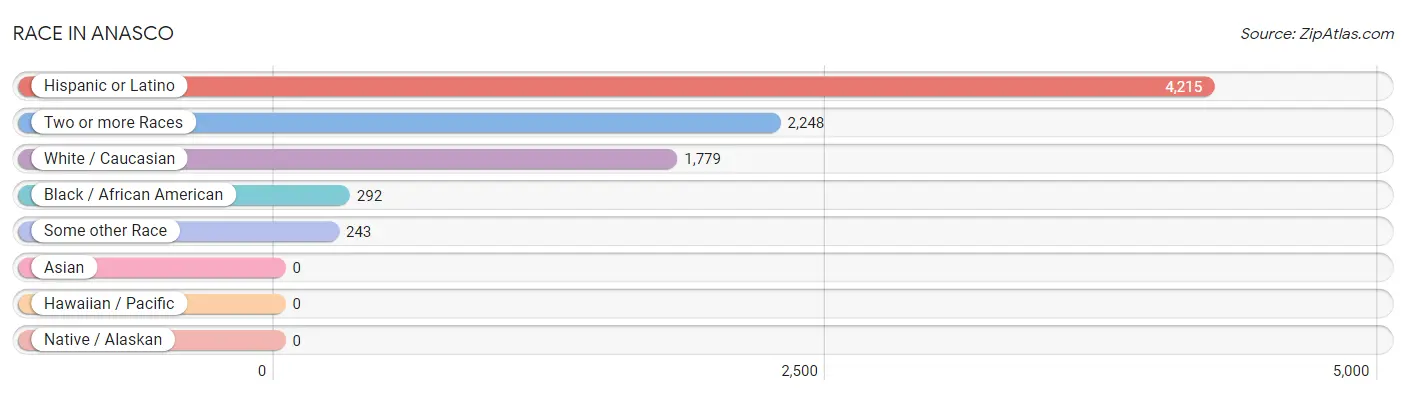
Race in Anasco
The most populous races in Anasco are Hispanic or Latino (4,215 | 92.4%), Two or more Races (2,248 | 49.3%), and White / Caucasian (1,779 | 39.0%).
| Race | # Population | % Population |
| Asian | 0 | 0.0% |
| Black / African American | 292 | 6.4% |
| Hawaiian / Pacific | 0 | 0.0% |
| Hispanic or Latino | 4,215 | 92.4% |
| Native / Alaskan | 0 | 0.0% |
| White / Caucasian | 1,779 | 39.0% |
| Two or more Races | 2,248 | 49.3% |
| Some other Race | 243 | 5.3% |
| Total | 4,562 | 100.0% |
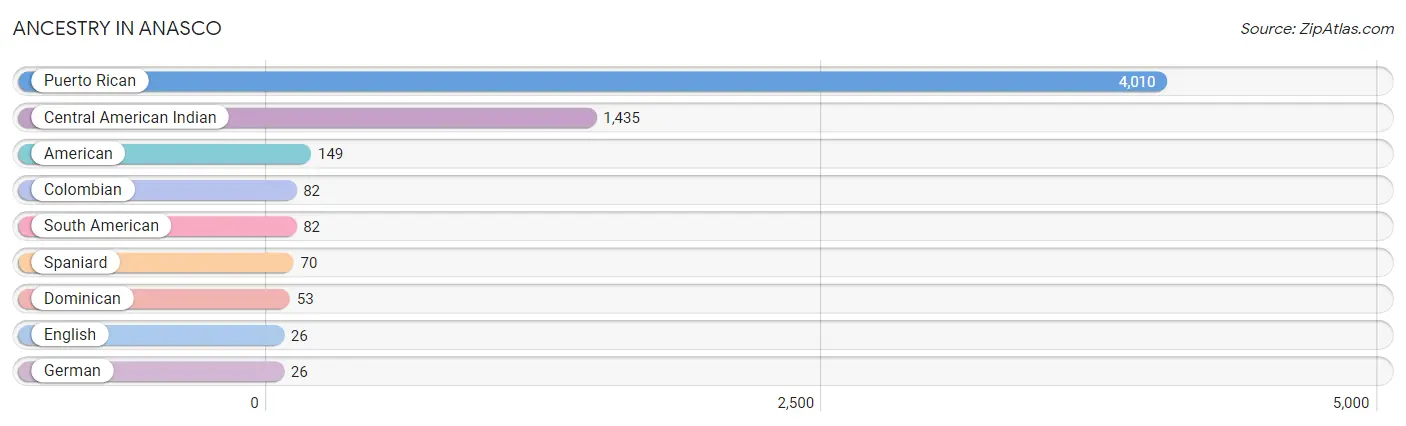
Ancestry in Anasco
The most populous ancestries reported in Anasco are Puerto Rican (4,010 | 87.9%), Central American Indian (1,435 | 31.5%), American (149 | 3.3%), Colombian (82 | 1.8%), and South American (82 | 1.8%), together accounting for 126.2% of all Anasco residents.
| Ancestry | # Population | % Population |
| American | 149 | 3.3% |
| Central American Indian | 1,435 | 31.5% |
| Colombian | 82 | 1.8% |
| Dominican | 53 | 1.2% |
| English | 26 | 0.6% |
| German | 26 | 0.6% |
| Puerto Rican | 4,010 | 87.9% |
| South American | 82 | 1.8% |
| Spaniard | 70 | 1.5% | View All 9 Rows |
Immigrants in Anasco

| Immigration Origin | # Population | % Population | View All 0 Rows |
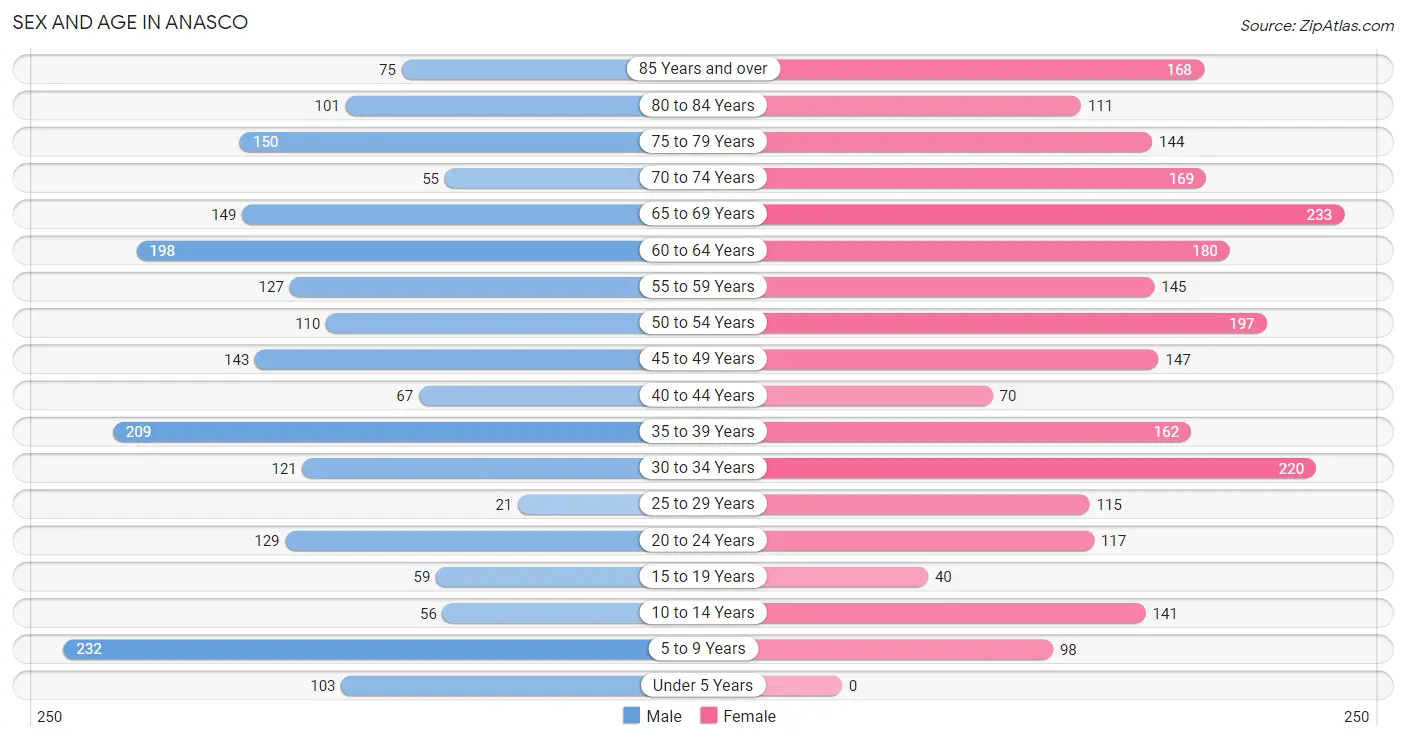
Sex and Age in Anasco
Sex and Age in Anasco
The most populous age groups in Anasco are 5 to 9 Years (232 | 11.0%) for men and 65 to 69 Years (233 | 9.5%) for women.
| Age Bracket | Male | Female |
| Under 5 Years | 103 (4.9%) | 0 (0.0%) |
| 5 to 9 Years | 232 (11.0%) | 98 (4.0%) |
| 10 to 14 Years | 56 (2.7%) | 141 (5.7%) |
| 15 to 19 Years | 59 (2.8%) | 40 (1.6%) |
| 20 to 24 Years | 129 (6.1%) | 117 (4.8%) |
| 25 to 29 Years | 21 (1.0%) | 115 (4.7%) |
| 30 to 34 Years | 121 (5.8%) | 220 (8.9%) |
| 35 to 39 Years | 209 (9.9%) | 162 (6.6%) |
| 40 to 44 Years | 67 (3.2%) | 70 (2.9%) |
| 45 to 49 Years | 143 (6.8%) | 147 (6.0%) |
| 50 to 54 Years | 110 (5.2%) | 197 (8.0%) |
| 55 to 59 Years | 127 (6.0%) | 145 (5.9%) |
| 60 to 64 Years | 198 (9.4%) | 180 (7.3%) |
| 65 to 69 Years | 149 (7.1%) | 233 (9.5%) |
| 70 to 74 Years | 55 (2.6%) | 169 (6.9%) |
| 75 to 79 Years | 150 (7.1%) | 144 (5.9%) |
| 80 to 84 Years | 101 (4.8%) | 111 (4.5%) |
| 85 Years and over | 75 (3.6%) | 168 (6.8%) |
| Total | 2,105 (100.0%) | 2,457 (100.0%) |
Families and Households in Anasco
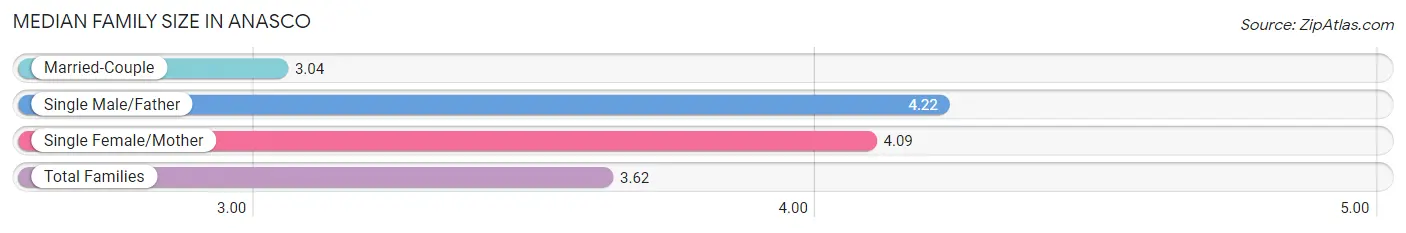
Median Family Size in Anasco
The median family size in Anasco is 3.62 persons per family, with single male/father families (103 | 10.0%) accounting for the largest median family size of 4.22 persons per family. On the other hand, married-couple families (473 | 45.9%) represent the smallest median family size with 3.04 persons per family.
| Family Type | # Families | Family Size |
| Married-Couple | 473 (45.9%) | 3.04 |
| Single Male/Father | 103 (10.0%) | 4.22 |
| Single Female/Mother | 455 (44.1%) | 4.09 |
| Total Families | 1,031 (100.0%) | 3.62 |
Median Household Size in Anasco
The median household size in Anasco is 2.71 persons per household, with single male/father households (103 | 6.1%) accounting for the largest median household size of 4.42 persons per household. non-family households (649 | 38.6%) represent the smallest median household size with 1.11 persons per household.
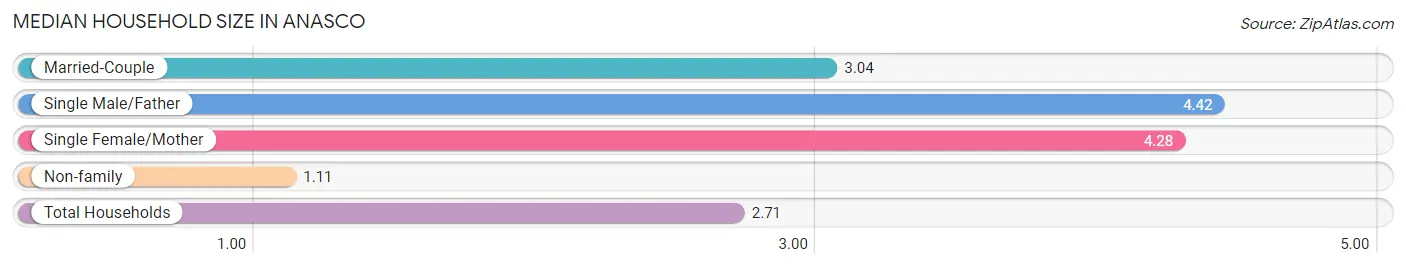
| Household Type | # Households | Household Size |
| Married-Couple | 473 (28.1%) | 3.04 |
| Single Male/Father | 103 (6.1%) | 4.42 |
| Single Female/Mother | 455 (27.1%) | 4.28 |
| Non-family | 649 (38.6%) | 1.11 |
| Total Households | 1,680 (100.0%) | 2.71 |
Household Size by Marriage Status in Anasco
Out of a total of 1,680 households in Anasco, 1,031 (61.4%) are family households, while 649 (38.6%) are nonfamily households. The most numerous type of family households are 2-person households, comprising 462, and the most common type of nonfamily households are 1-person households, comprising 580.
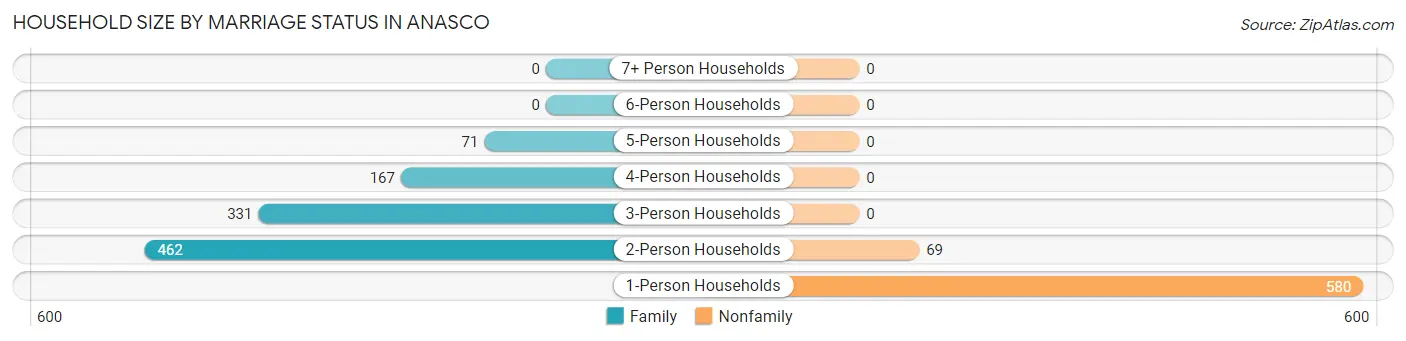
| Household Size | Family Households | Nonfamily Households |
| 1-Person Households | - | 580 (34.5%) |
| 2-Person Households | 462 (27.5%) | 69 (4.1%) |
| 3-Person Households | 331 (19.7%) | 0 (0.0%) |
| 4-Person Households | 167 (9.9%) | 0 (0.0%) |
| 5-Person Households | 71 (4.2%) | 0 (0.0%) |
| 6-Person Households | 0 (0.0%) | 0 (0.0%) |
| 7+ Person Households | 0 (0.0%) | 0 (0.0%) |
| Total | 1,031 (61.4%) | 649 (38.6%) |
Female Fertility in Anasco
Fertility by Age in Anasco
| Age Bracket | Women with Births | Births / 1,000 Women |
| 15 to 19 years | 0 (0.0%) | 0.0 |
| 20 to 34 years | 0 (0.0%) | 0.0 |
| 35 to 50 years | 0 (0.0%) | 0.0 |
| Total | 0 (0.0%) | 0.0 |
Fertility by Age by Marriage Status in Anasco
| Age Bracket | Married | Unmarried |
| 15 to 19 years | 0 (0.0%) | 0 (0.0%) |
| 20 to 34 years | 0 (0.0%) | 0 (0.0%) |
| 35 to 50 years | 0 (0.0%) | 0 (0.0%) |
| Total | 0 (0.0%) | 0 (0.0%) |
Fertility by Education in Anasco
| Educational Attainment | Women with Births | Births / 1,000 Women |
| Less than High School | 0 (0.0%) | 0.0 |
| High School Diploma | 0 (0.0%) | 0.0 |
| College or Associate's Degree | 0 (0.0%) | 0.0 |
| Bachelor's Degree | 0 (0.0%) | 0.0 |
| Graduate Degree | 0 (0.0%) | 0.0 |
| Total | 0 (0.0%) | 0.0 |
Fertility by Education by Marriage Status in Anasco
| Educational Attainment | Married | Unmarried |
| Less than High School | 0 (0.0%) | 0 (0.0%) |
| High School Diploma | 0 (0.0%) | 0 (0.0%) |
| College or Associate's Degree | 0 (0.0%) | 0 (0.0%) |
| Bachelor's Degree | 0 (0.0%) | 0 (0.0%) |
| Graduate Degree | 0 (0.0%) | 0 (0.0%) |
| Total | 0 (0.0%) | 0 (0.0%) |
Employment Characteristics in Anasco
Employment by Class of Employer in Anasco
Among the 1,464 employed individuals in Anasco, private company employees (828 | 56.6%), state government employees (253 | 17.3%), and self-employed (not incorporated) (164 | 11.2%) make up the most common classes of employment.
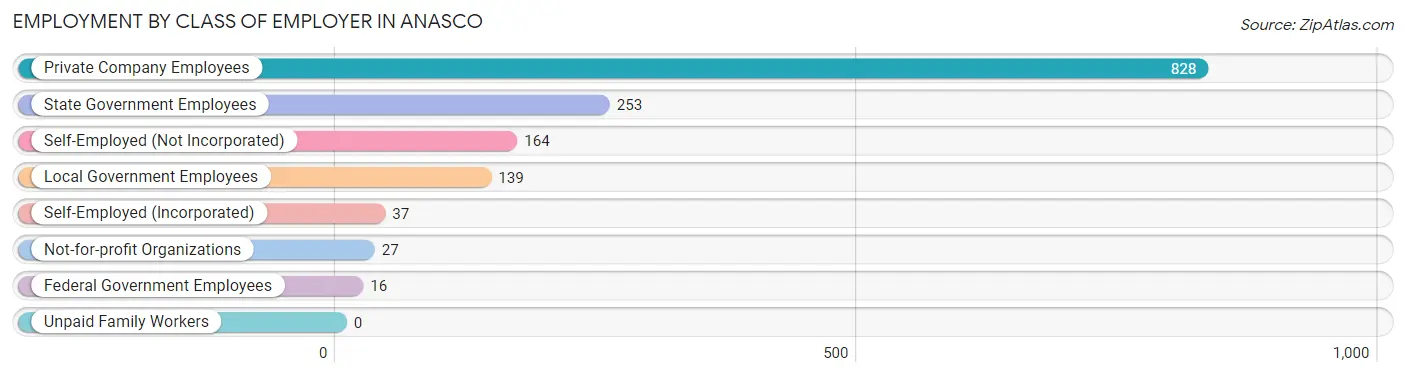
| Employer Class | # Employees | % Employees |
| Private Company Employees | 828 | 56.6% |
| Self-Employed (Incorporated) | 37 | 2.5% |
| Self-Employed (Not Incorporated) | 164 | 11.2% |
| Not-for-profit Organizations | 27 | 1.8% |
| Local Government Employees | 139 | 9.5% |
| State Government Employees | 253 | 17.3% |
| Federal Government Employees | 16 | 1.1% |
| Unpaid Family Workers | 0 | 0.0% |
| Total | 1,464 | 100.0% |
Employment Status by Age in Anasco
According to the labor force statistics for Anasco, out of the total population over 16 years of age (3,932), 43.5% or 1,710 individuals are in the labor force, with 13.0% or 222 of them unemployed. The age group with the highest labor force participation rate is 25 to 29 years, with 100.0% or 136 individuals in the labor force. Within the labor force, the 25 to 29 years age range has the highest percentage of unemployed individuals, with 25.0% or 34 of them being unemployed.
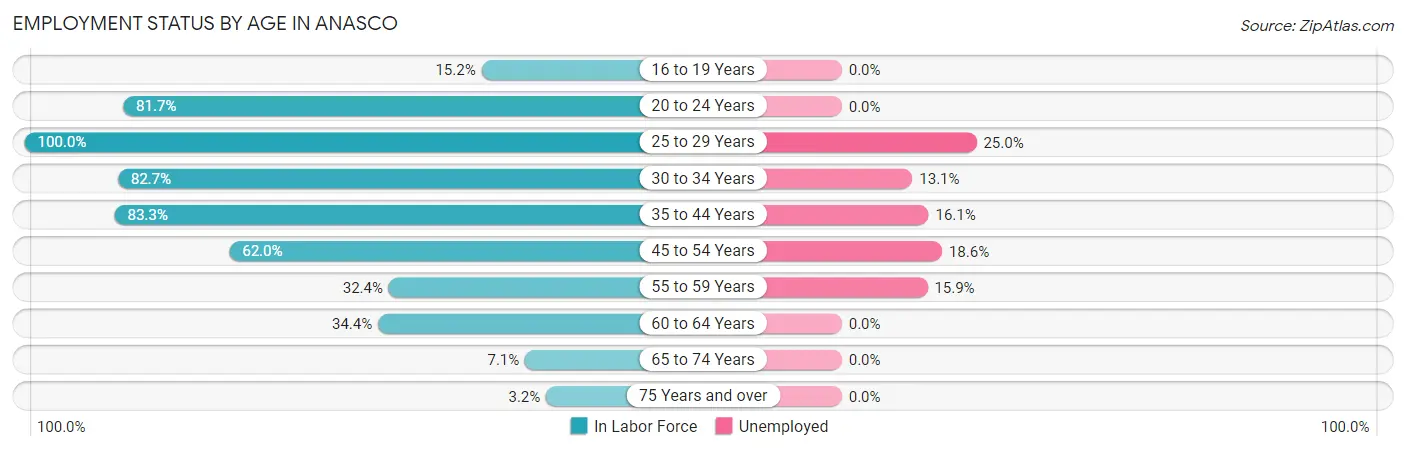
| Age Bracket | In Labor Force | Unemployed |
| 16 to 19 Years | 15 (15.2%) | 0 (0.0%) |
| 20 to 24 Years | 201 (81.7%) | 0 (0.0%) |
| 25 to 29 Years | 136 (100.0%) | 34 (25.0%) |
| 30 to 34 Years | 282 (82.7%) | 37 (13.1%) |
| 35 to 44 Years | 423 (83.3%) | 68 (16.1%) |
| 45 to 54 Years | 370 (62.0%) | 69 (18.6%) |
| 55 to 59 Years | 88 (32.4%) | 14 (15.9%) |
| 60 to 64 Years | 130 (34.4%) | 0 (0.0%) |
| 65 to 74 Years | 43 (7.1%) | 0 (0.0%) |
| 75 Years and over | 24 (3.2%) | 0 (0.0%) |
| Total | 1,710 (43.5%) | 222 (13.0%) |
Employment Status by Educational Attainment in Anasco
According to labor force statistics for Anasco, 64.0% of individuals (1,428) out of the total population between 25 and 64 years of age (2,232) are in the labor force, with 15.5% or 221 of them being unemployed. The group with the highest labor force participation rate are those with the educational attainment of college / associate degree, with 79.9% or 446 individuals in the labor force. Within the labor force, individuals with less than high school education have the highest percentage of unemployment, with 36.3% or 58 of them being unemployed.
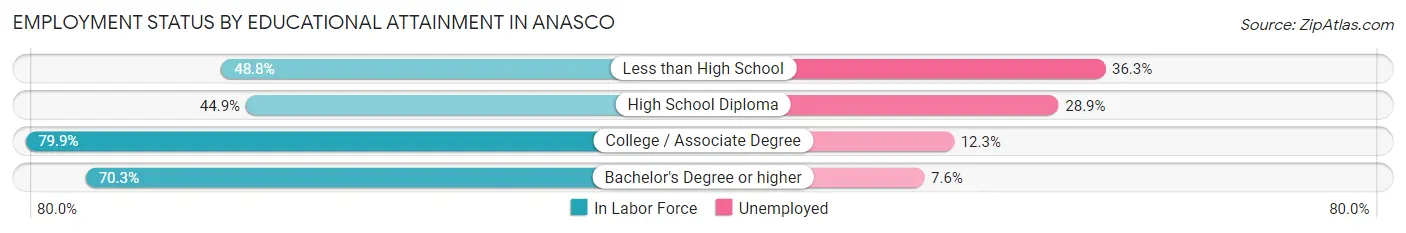
| Educational Attainment | In Labor Force | Unemployed |
| Less than High School | 160 (48.8%) | 119 (36.3%) |
| High School Diploma | 218 (44.9%) | 140 (28.9%) |
| College / Associate Degree | 446 (79.9%) | 69 (12.3%) |
| Bachelor's Degree or higher | 605 (70.3%) | 65 (7.6%) |
| Total | 1,428 (64.0%) | 346 (15.5%) |
Employment Occupations by Sex in Anasco
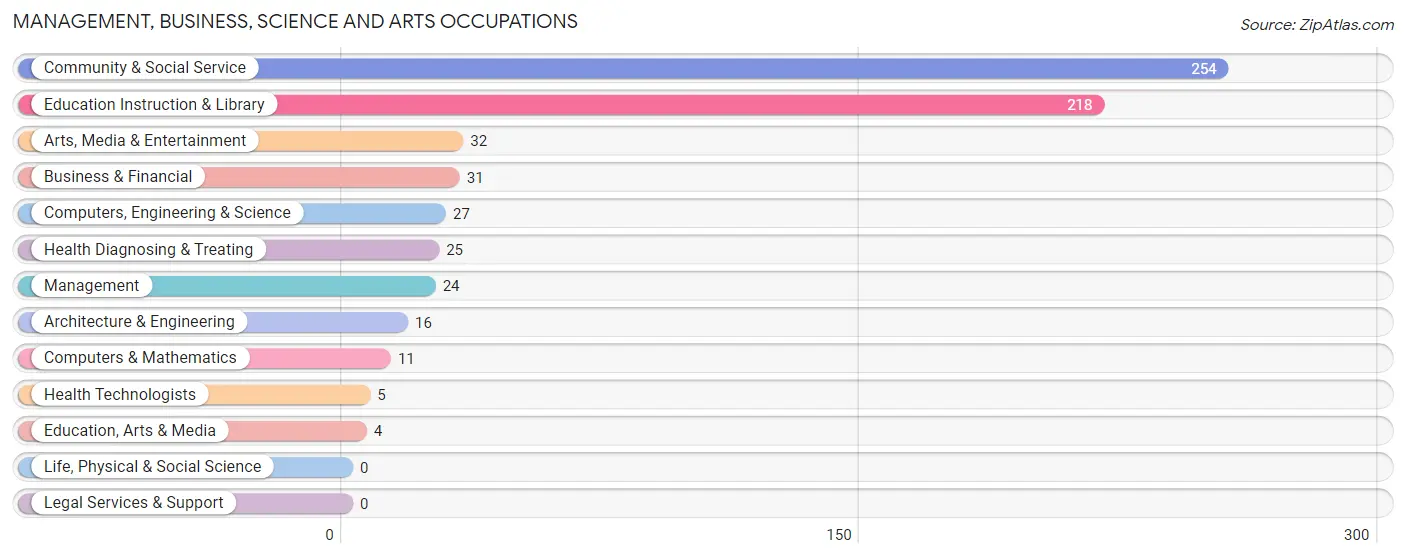
Management, Business, Science and Arts Occupations
The most common Management, Business, Science and Arts occupations in Anasco are Community & Social Service (254 | 17.1%), Education Instruction & Library (218 | 14.6%), Arts, Media & Entertainment (32 | 2.1%), Business & Financial (31 | 2.1%), and Computers, Engineering & Science (27 | 1.8%).
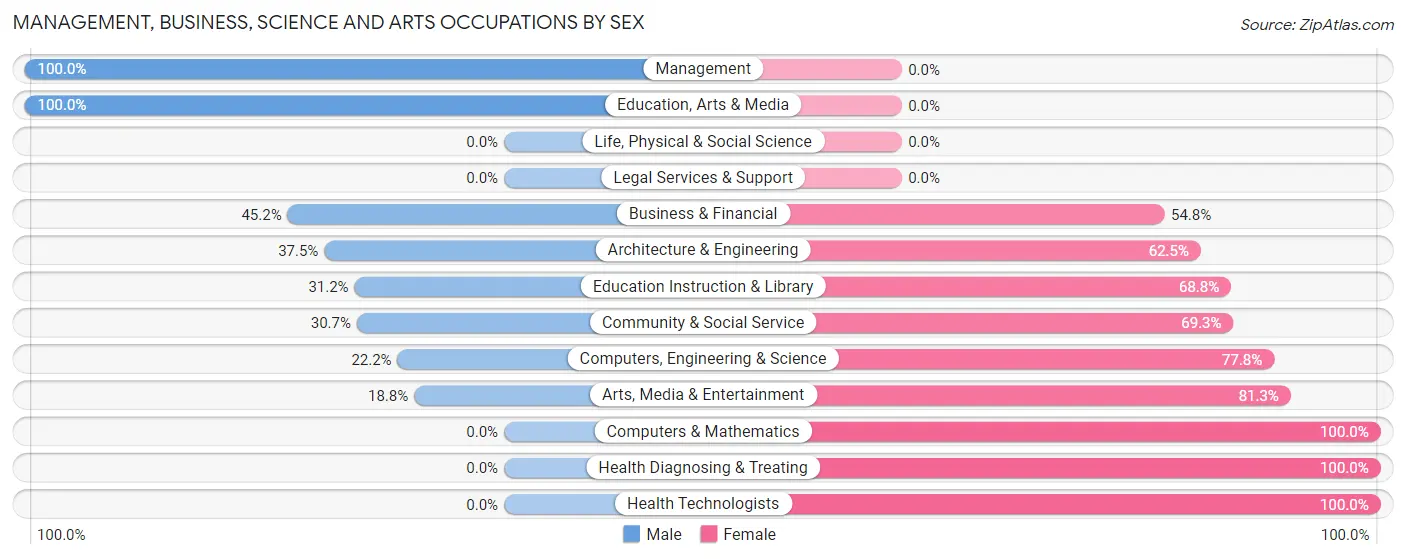
Management, Business, Science and Arts Occupations by Sex
Within the Management, Business, Science and Arts occupations in Anasco, the most male-oriented occupations are Management (100.0%), Education, Arts & Media (100.0%), and Business & Financial (45.2%), while the most female-oriented occupations are Computers & Mathematics (100.0%), Health Diagnosing & Treating (100.0%), and Health Technologists (100.0%).
| Occupation | Male | Female |
| Management | 24 (100.0%) | 0 (0.0%) |
| Business & Financial | 14 (45.2%) | 17 (54.8%) |
| Computers, Engineering & Science | 6 (22.2%) | 21 (77.8%) |
| Computers & Mathematics | 0 (0.0%) | 11 (100.0%) |
| Architecture & Engineering | 6 (37.5%) | 10 (62.5%) |
| Life, Physical & Social Science | 0 (0.0%) | 0 (0.0%) |
| Community & Social Service | 78 (30.7%) | 176 (69.3%) |
| Education, Arts & Media | 4 (100.0%) | 0 (0.0%) |
| Legal Services & Support | 0 (0.0%) | 0 (0.0%) |
| Education Instruction & Library | 68 (31.2%) | 150 (68.8%) |
| Arts, Media & Entertainment | 6 (18.8%) | 26 (81.2%) |
| Health Diagnosing & Treating | 0 (0.0%) | 25 (100.0%) |
| Health Technologists | 0 (0.0%) | 5 (100.0%) |
| Total (Category) | 122 (33.8%) | 239 (66.2%) |
| Total (Overall) | 726 (48.7%) | 764 (51.3%) |
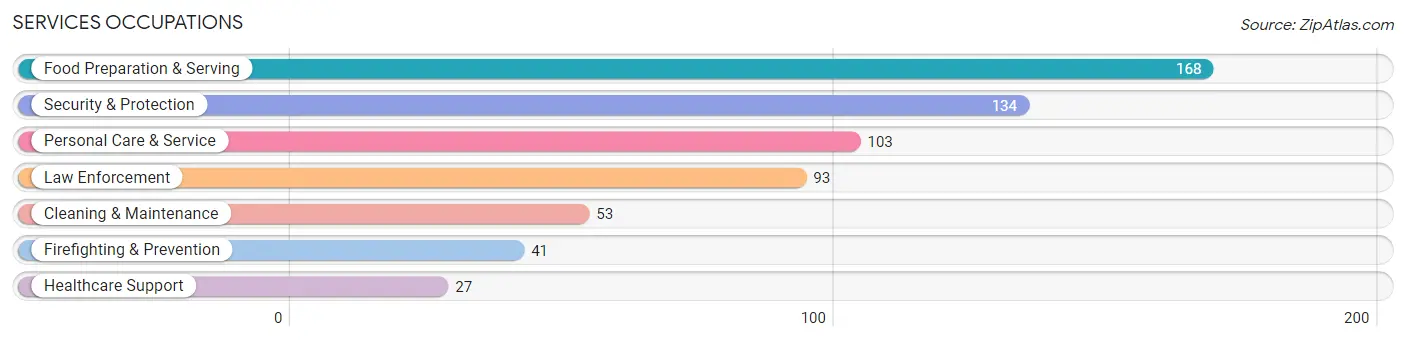
Services Occupations
The most common Services occupations in Anasco are Food Preparation & Serving (168 | 11.3%), Security & Protection (134 | 9.0%), Personal Care & Service (103 | 6.9%), Law Enforcement (93 | 6.2%), and Cleaning & Maintenance (53 | 3.6%).
Services Occupations by Sex
Within the Services occupations in Anasco, the most male-oriented occupations are Firefighting & Prevention (100.0%), Cleaning & Maintenance (83.0%), and Food Preparation & Serving (66.1%), while the most female-oriented occupations are Healthcare Support (100.0%), Law Enforcement (67.7%), and Security & Protection (47.0%).
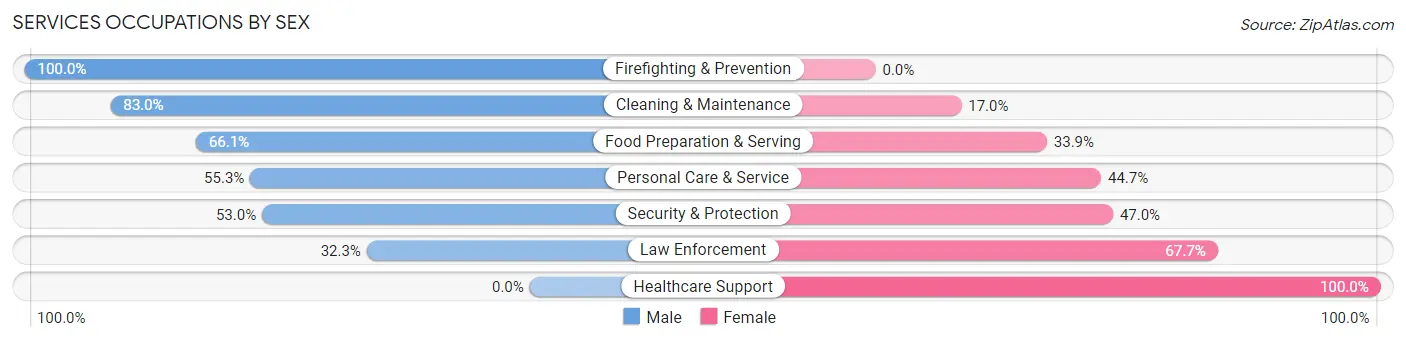
| Occupation | Male | Female |
| Healthcare Support | 0 (0.0%) | 27 (100.0%) |
| Security & Protection | 71 (53.0%) | 63 (47.0%) |
| Firefighting & Prevention | 41 (100.0%) | 0 (0.0%) |
| Law Enforcement | 30 (32.3%) | 63 (67.7%) |
| Food Preparation & Serving | 111 (66.1%) | 57 (33.9%) |
| Cleaning & Maintenance | 44 (83.0%) | 9 (17.0%) |
| Personal Care & Service | 57 (55.3%) | 46 (44.7%) |
| Total (Category) | 283 (58.4%) | 202 (41.6%) |
| Total (Overall) | 726 (48.7%) | 764 (51.3%) |
Sales and Office Occupations
The most common Sales and Office occupations in Anasco are Sales & Related (187 | 12.6%), and Office & Administration (164 | 11.0%).

Sales and Office Occupations by Sex

| Occupation | Male | Female |
| Sales & Related | 31 (16.6%) | 156 (83.4%) |
| Office & Administration | 11 (6.7%) | 153 (93.3%) |
| Total (Category) | 42 (12.0%) | 309 (88.0%) |
| Total (Overall) | 726 (48.7%) | 764 (51.3%) |
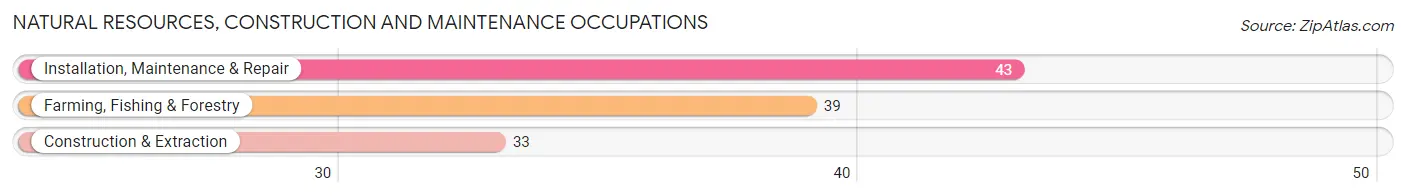
Natural Resources, Construction and Maintenance Occupations
The most common Natural Resources, Construction and Maintenance occupations in Anasco are Installation, Maintenance & Repair (43 | 2.9%), Farming, Fishing & Forestry (39 | 2.6%), and Construction & Extraction (33 | 2.2%).
Natural Resources, Construction and Maintenance Occupations by Sex
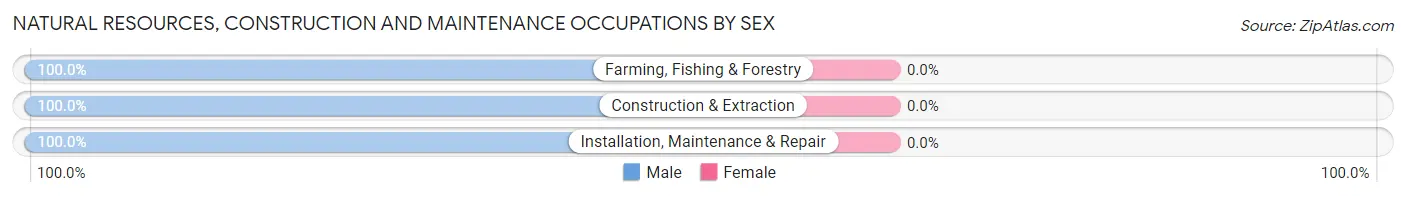
| Occupation | Male | Female |
| Farming, Fishing & Forestry | 39 (100.0%) | 0 (0.0%) |
| Construction & Extraction | 33 (100.0%) | 0 (0.0%) |
| Installation, Maintenance & Repair | 43 (100.0%) | 0 (0.0%) |
| Total (Category) | 115 (100.0%) | 0 (0.0%) |
| Total (Overall) | 726 (48.7%) | 764 (51.3%) |
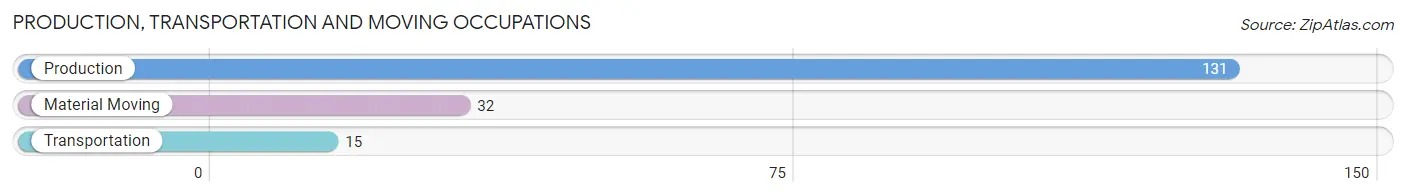
Production, Transportation and Moving Occupations
The most common Production, Transportation and Moving occupations in Anasco are Production (131 | 8.8%), Material Moving (32 | 2.1%), and Transportation (15 | 1.0%).
Production, Transportation and Moving Occupations by Sex
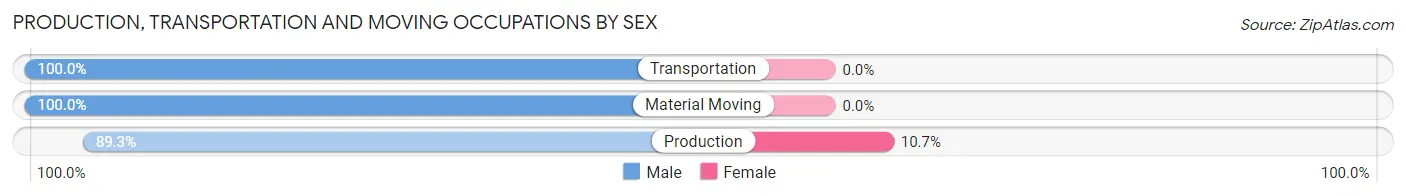
| Occupation | Male | Female |
| Production | 117 (89.3%) | 14 (10.7%) |
| Transportation | 15 (100.0%) | 0 (0.0%) |
| Material Moving | 32 (100.0%) | 0 (0.0%) |
| Total (Category) | 164 (92.1%) | 14 (7.9%) |
| Total (Overall) | 726 (48.7%) | 764 (51.3%) |
Employment Industries by Sex in Anasco
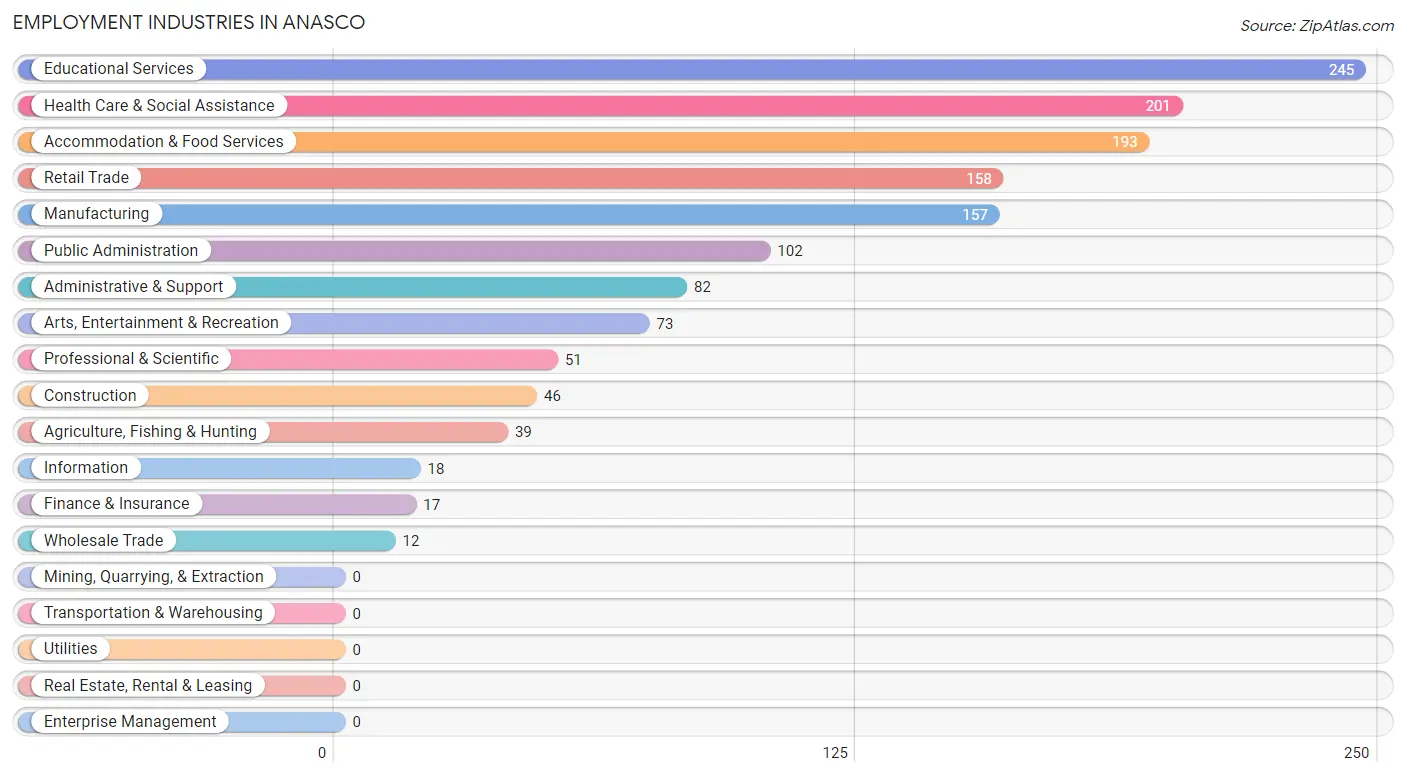
Employment Industries in Anasco
The major employment industries in Anasco include Educational Services (245 | 16.4%), Health Care & Social Assistance (201 | 13.5%), Accommodation & Food Services (193 | 13.0%), Retail Trade (158 | 10.6%), and Manufacturing (157 | 10.5%).
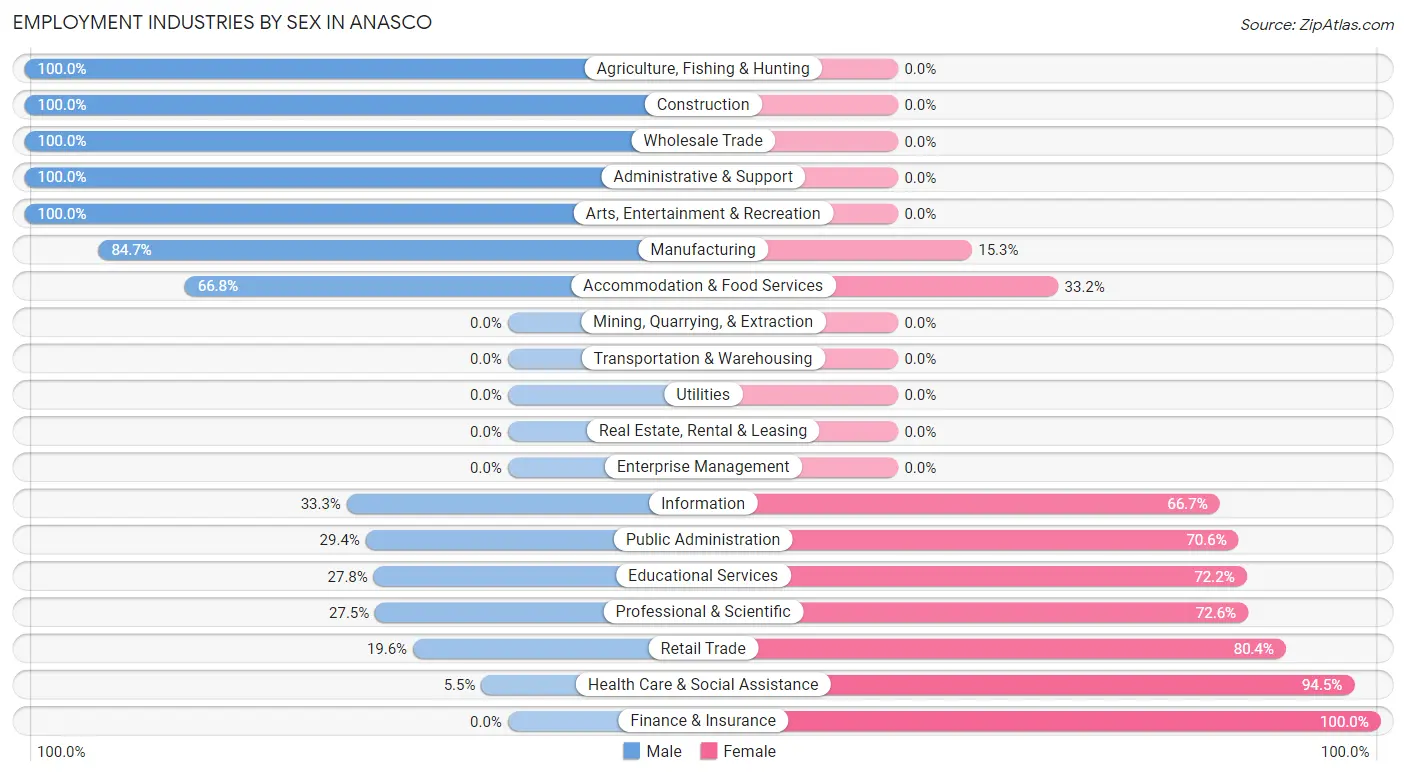
Employment Industries by Sex in Anasco
The Anasco industries that see more men than women are Agriculture, Fishing & Hunting (100.0%), Construction (100.0%), and Wholesale Trade (100.0%), whereas the industries that tend to have a higher number of women are Finance & Insurance (100.0%), Health Care & Social Assistance (94.5%), and Retail Trade (80.4%).
| Industry | Male | Female |
| Agriculture, Fishing & Hunting | 39 (100.0%) | 0 (0.0%) |
| Mining, Quarrying, & Extraction | 0 (0.0%) | 0 (0.0%) |
| Construction | 46 (100.0%) | 0 (0.0%) |
| Manufacturing | 133 (84.7%) | 24 (15.3%) |
| Wholesale Trade | 12 (100.0%) | 0 (0.0%) |
| Retail Trade | 31 (19.6%) | 127 (80.4%) |
| Transportation & Warehousing | 0 (0.0%) | 0 (0.0%) |
| Utilities | 0 (0.0%) | 0 (0.0%) |
| Information | 6 (33.3%) | 12 (66.7%) |
| Finance & Insurance | 0 (0.0%) | 17 (100.0%) |
| Real Estate, Rental & Leasing | 0 (0.0%) | 0 (0.0%) |
| Professional & Scientific | 14 (27.5%) | 37 (72.6%) |
| Enterprise Management | 0 (0.0%) | 0 (0.0%) |
| Administrative & Support | 82 (100.0%) | 0 (0.0%) |
| Educational Services | 68 (27.8%) | 177 (72.2%) |
| Health Care & Social Assistance | 11 (5.5%) | 190 (94.5%) |
| Arts, Entertainment & Recreation | 73 (100.0%) | 0 (0.0%) |
| Accommodation & Food Services | 129 (66.8%) | 64 (33.2%) |
| Public Administration | 30 (29.4%) | 72 (70.6%) |
| Total | 726 (48.7%) | 764 (51.3%) |
Education in Anasco
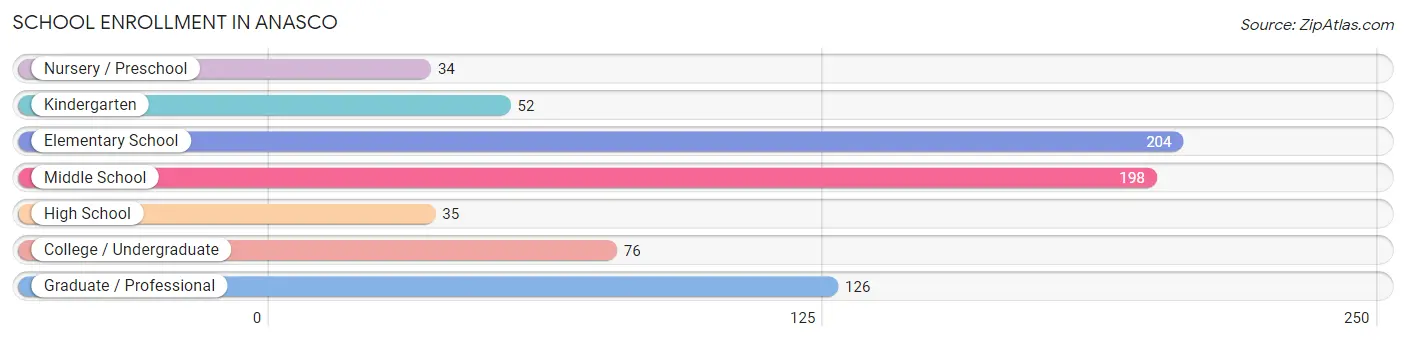
School Enrollment in Anasco
The most common levels of schooling among the 725 students in Anasco are elementary school (204 | 28.1%), middle school (198 | 27.3%), and graduate / professional (126 | 17.4%).
| School Level | # Students | % Students |
| Nursery / Preschool | 34 | 4.7% |
| Kindergarten | 52 | 7.2% |
| Elementary School | 204 | 28.1% |
| Middle School | 198 | 27.3% |
| High School | 35 | 4.8% |
| College / Undergraduate | 76 | 10.5% |
| Graduate / Professional | 126 | 17.4% |
| Total | 725 | 100.0% |
School Enrollment by Age by Funding Source in Anasco
Out of a total of 725 students who are enrolled in schools in Anasco, 196 (27.0%) attend a private institution, while the remaining 529 (73.0%) are enrolled in public schools. The age group of 3 to 4 year olds has the highest likelihood of being enrolled in private schools, with 19 (100.0% in the age bracket) enrolled. Conversely, the age group of 10 to 14 year olds has the lowest likelihood of being enrolled in a private school, with 139 (100.0% in the age bracket) attending a public institution.
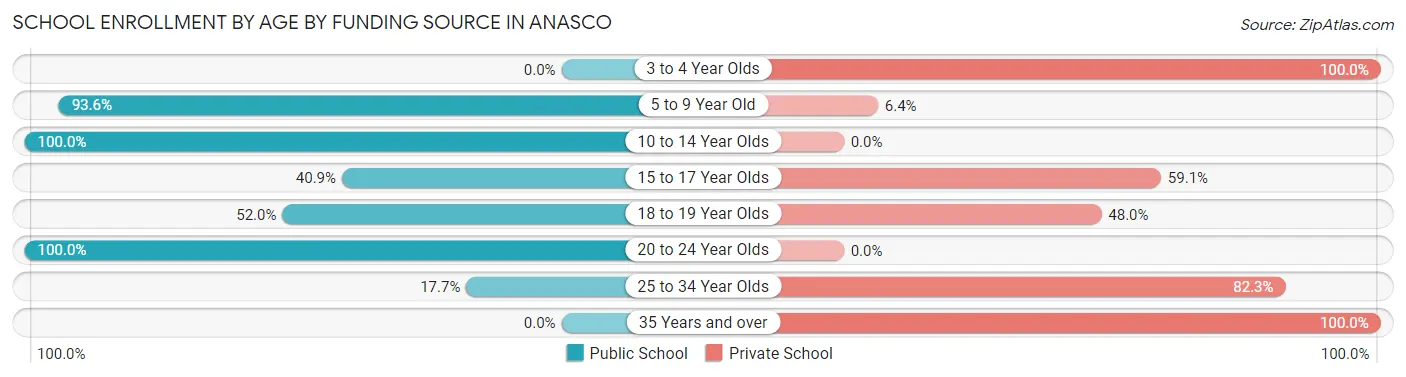
| Age Bracket | Public School | Private School |
| 3 to 4 Year Olds | 0 (0.0%) | 19 (100.0%) |
| 5 to 9 Year Old | 309 (93.6%) | 21 (6.4%) |
| 10 to 14 Year Olds | 139 (100.0%) | 0 (0.0%) |
| 15 to 17 Year Olds | 9 (40.9%) | 13 (59.1%) |
| 18 to 19 Year Olds | 13 (52.0%) | 12 (48.0%) |
| 20 to 24 Year Olds | 48 (100.0%) | 0 (0.0%) |
| 25 to 34 Year Olds | 11 (17.7%) | 51 (82.3%) |
| 35 Years and over | 0 (0.0%) | 80 (100.0%) |
| Total | 529 (73.0%) | 196 (27.0%) |
Educational Attainment by Field of Study in Anasco
Education (313 | 27.8%), science & technology (139 | 12.3%), arts & humanities (139 | 12.3%), bio, nature & agricultural (136 | 12.1%), and business (112 | 10.0%) are the most common fields of study among 1,126 individuals in Anasco who have obtained a bachelor's degree or higher.
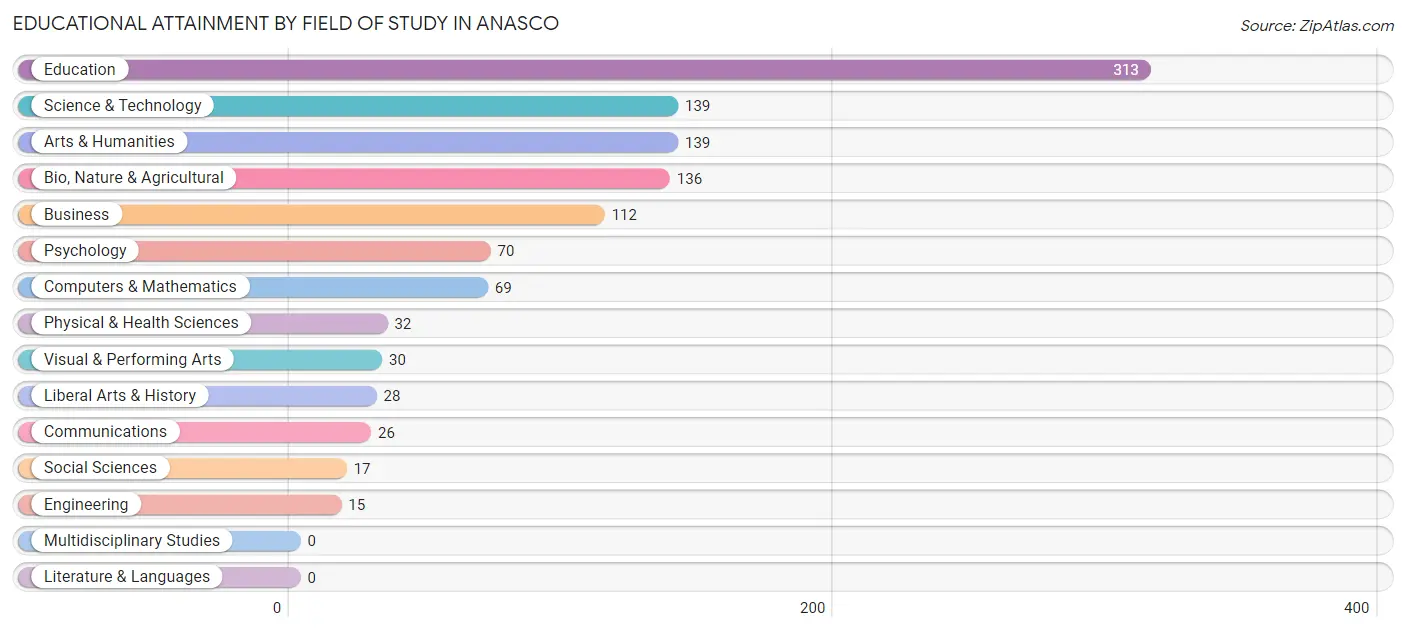
| Field of Study | # Graduates | % Graduates |
| Computers & Mathematics | 69 | 6.1% |
| Bio, Nature & Agricultural | 136 | 12.1% |
| Physical & Health Sciences | 32 | 2.8% |
| Psychology | 70 | 6.2% |
| Social Sciences | 17 | 1.5% |
| Engineering | 15 | 1.3% |
| Multidisciplinary Studies | 0 | 0.0% |
| Science & Technology | 139 | 12.3% |
| Business | 112 | 10.0% |
| Education | 313 | 27.8% |
| Literature & Languages | 0 | 0.0% |
| Liberal Arts & History | 28 | 2.5% |
| Visual & Performing Arts | 30 | 2.7% |
| Communications | 26 | 2.3% |
| Arts & Humanities | 139 | 12.3% |
| Total | 1,126 | 100.0% |
Transportation & Commute in Anasco
Vehicle Availability by Sex in Anasco
The most prevalent vehicle ownership categories in Anasco are males with 1 vehicle (227, accounting for 32.5%) and females with 1 vehicle (227, making up 29.7%).
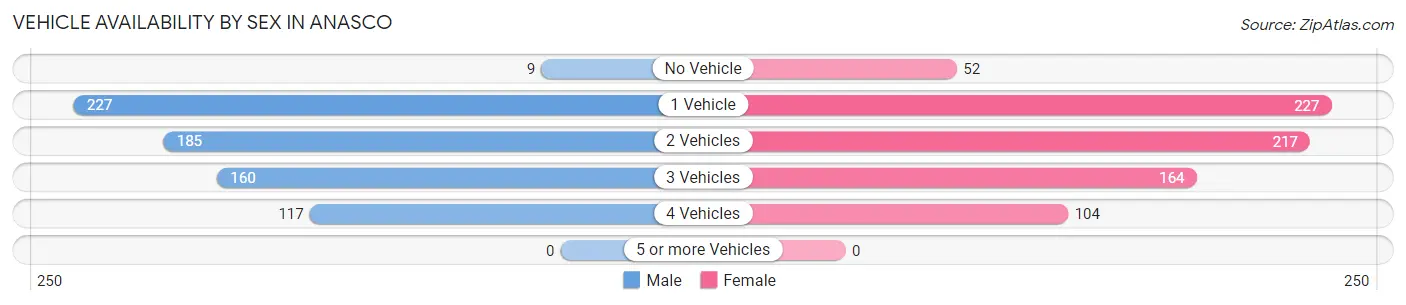
| Vehicles Available | Male | Female |
| No Vehicle | 9 (1.3%) | 52 (6.8%) |
| 1 Vehicle | 227 (32.5%) | 227 (29.7%) |
| 2 Vehicles | 185 (26.5%) | 217 (28.4%) |
| 3 Vehicles | 160 (22.9%) | 164 (21.5%) |
| 4 Vehicles | 117 (16.8%) | 104 (13.6%) |
| 5 or more Vehicles | 0 (0.0%) | 0 (0.0%) |
| Total | 698 (100.0%) | 764 (100.0%) |
Commute Time in Anasco
The most frequently occuring commute durations in Anasco are 5 to 9 minutes (268 commuters, 19.5%), 25 to 29 minutes (261 commuters, 19.0%), and 35 to 39 minutes (231 commuters, 16.8%).
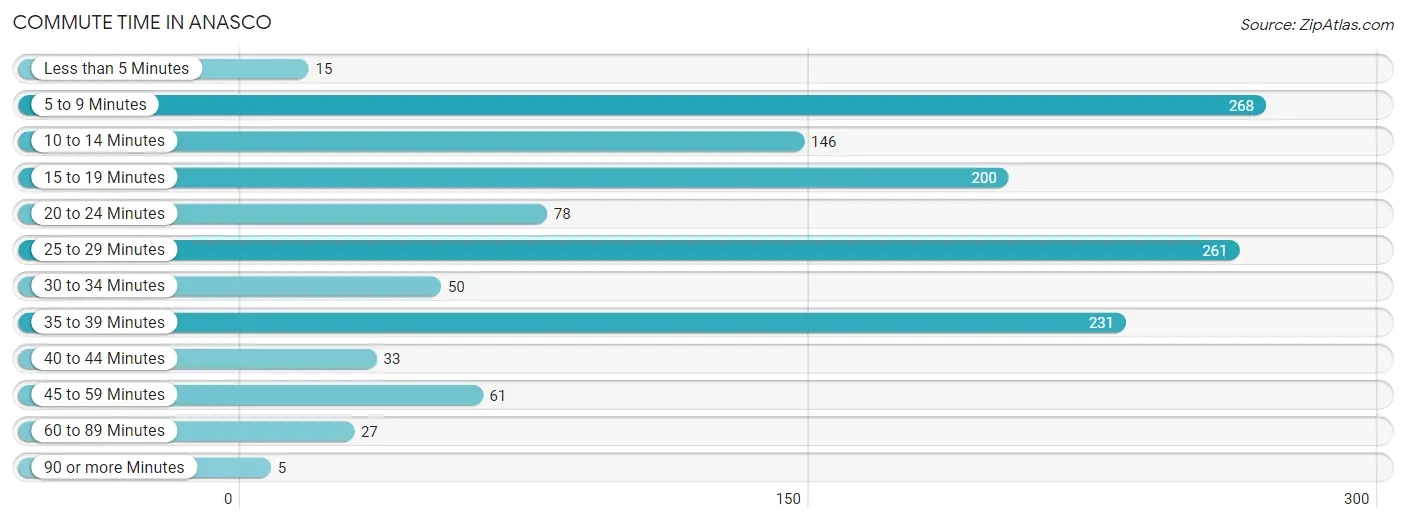
| Commute Time | # Commuters | % Commuters |
| Less than 5 Minutes | 15 | 1.1% |
| 5 to 9 Minutes | 268 | 19.5% |
| 10 to 14 Minutes | 146 | 10.6% |
| 15 to 19 Minutes | 200 | 14.5% |
| 20 to 24 Minutes | 78 | 5.7% |
| 25 to 29 Minutes | 261 | 19.0% |
| 30 to 34 Minutes | 50 | 3.6% |
| 35 to 39 Minutes | 231 | 16.8% |
| 40 to 44 Minutes | 33 | 2.4% |
| 45 to 59 Minutes | 61 | 4.4% |
| 60 to 89 Minutes | 27 | 2.0% |
| 90 or more Minutes | 5 | 0.4% |
Commute Time by Sex in Anasco
The most common commute times in Anasco are 5 to 9 minutes (188 commuters, 26.9%) for males and 35 to 39 minutes (154 commuters, 22.8%) for females.
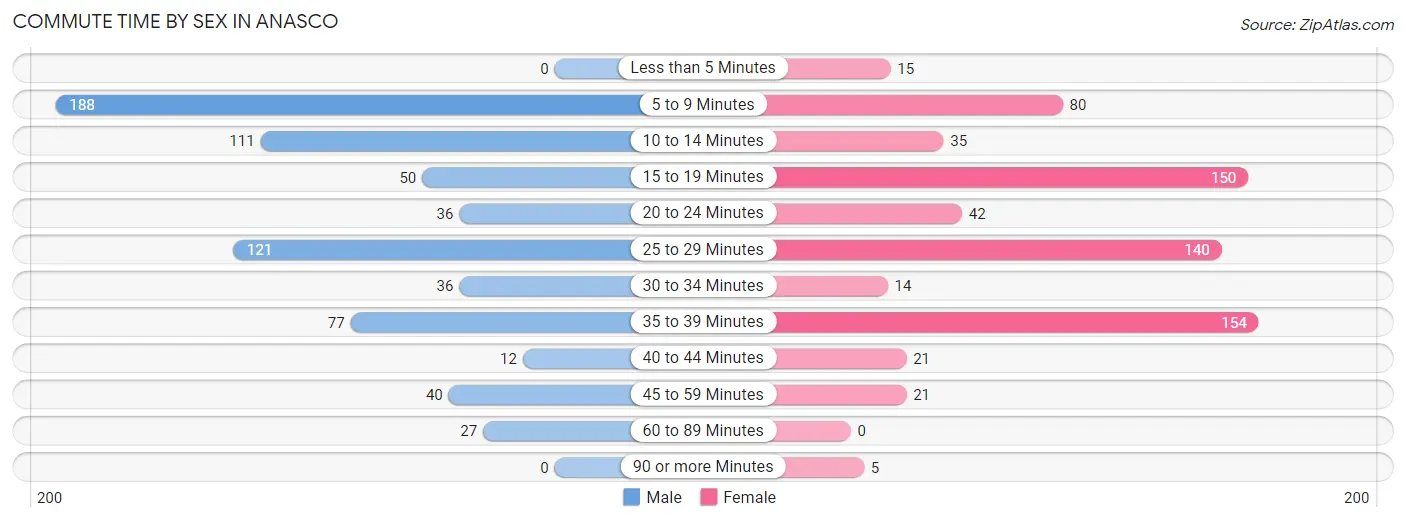
| Commute Time | Male | Female |
| Less than 5 Minutes | 0 (0.0%) | 15 (2.2%) |
| 5 to 9 Minutes | 188 (26.9%) | 80 (11.8%) |
| 10 to 14 Minutes | 111 (15.9%) | 35 (5.2%) |
| 15 to 19 Minutes | 50 (7.2%) | 150 (22.2%) |
| 20 to 24 Minutes | 36 (5.2%) | 42 (6.2%) |
| 25 to 29 Minutes | 121 (17.3%) | 140 (20.7%) |
| 30 to 34 Minutes | 36 (5.2%) | 14 (2.1%) |
| 35 to 39 Minutes | 77 (11.0%) | 154 (22.8%) |
| 40 to 44 Minutes | 12 (1.7%) | 21 (3.1%) |
| 45 to 59 Minutes | 40 (5.7%) | 21 (3.1%) |
| 60 to 89 Minutes | 27 (3.9%) | 0 (0.0%) |
| 90 or more Minutes | 0 (0.0%) | 5 (0.7%) |
Time of Departure to Work by Sex in Anasco
The most frequent times of departure to work in Anasco are 7:00 AM to 7:29 AM (149, 21.3%) for males and 7:00 AM to 7:29 AM (207, 30.6%) for females.
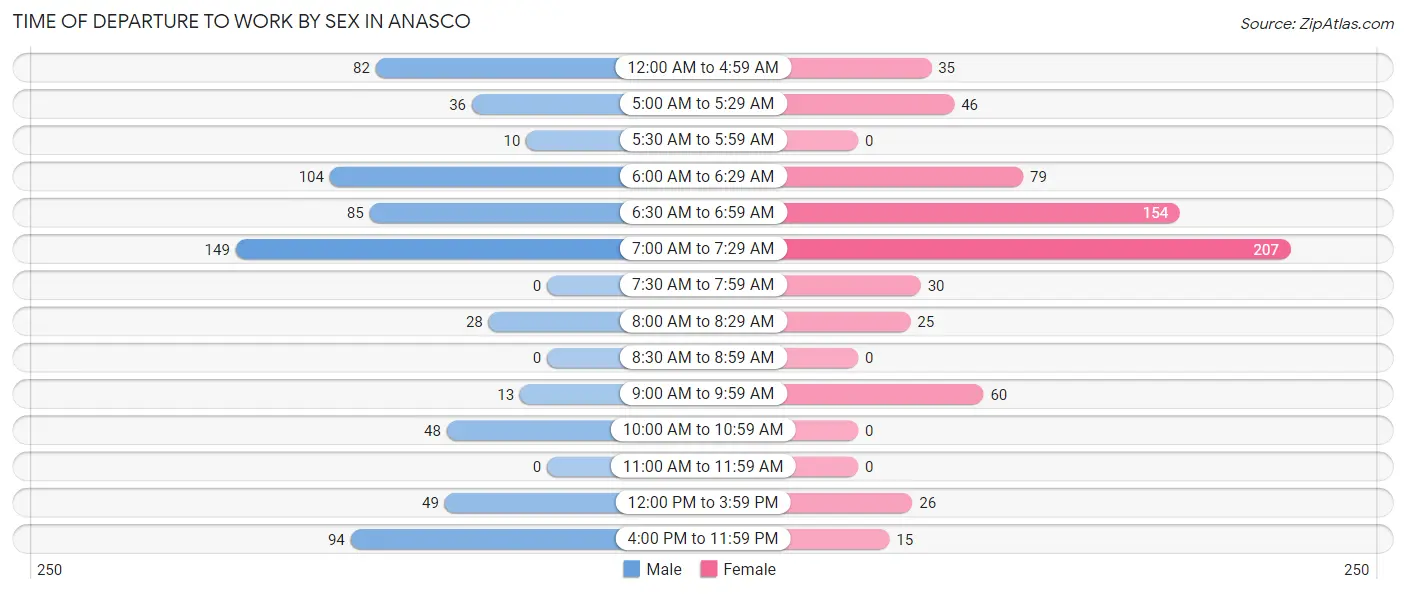
| Time of Departure | Male | Female |
| 12:00 AM to 4:59 AM | 82 (11.7%) | 35 (5.2%) |
| 5:00 AM to 5:29 AM | 36 (5.2%) | 46 (6.8%) |
| 5:30 AM to 5:59 AM | 10 (1.4%) | 0 (0.0%) |
| 6:00 AM to 6:29 AM | 104 (14.9%) | 79 (11.7%) |
| 6:30 AM to 6:59 AM | 85 (12.2%) | 154 (22.8%) |
| 7:00 AM to 7:29 AM | 149 (21.3%) | 207 (30.6%) |
| 7:30 AM to 7:59 AM | 0 (0.0%) | 30 (4.4%) |
| 8:00 AM to 8:29 AM | 28 (4.0%) | 25 (3.7%) |
| 8:30 AM to 8:59 AM | 0 (0.0%) | 0 (0.0%) |
| 9:00 AM to 9:59 AM | 13 (1.9%) | 60 (8.9%) |
| 10:00 AM to 10:59 AM | 48 (6.9%) | 0 (0.0%) |
| 11:00 AM to 11:59 AM | 0 (0.0%) | 0 (0.0%) |
| 12:00 PM to 3:59 PM | 49 (7.0%) | 26 (3.8%) |
| 4:00 PM to 11:59 PM | 94 (13.5%) | 15 (2.2%) |
| Total | 698 (100.0%) | 677 (100.0%) |
Housing Occupancy in Anasco
Occupancy by Ownership in Anasco
Of the total 1,680 dwellings in Anasco, owner-occupied units account for 995 (59.2%), while renter-occupied units make up 685 (40.8%).
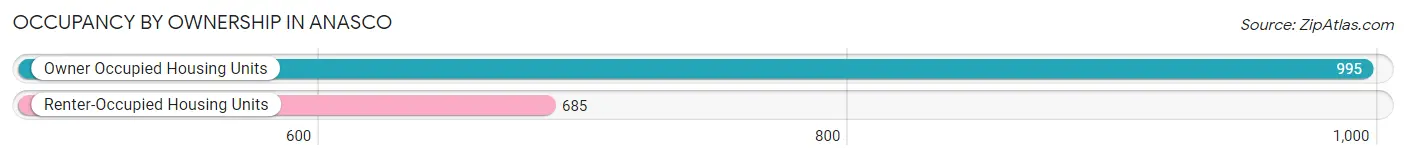
| Occupancy | # Housing Units | % Housing Units |
| Owner Occupied Housing Units | 995 | 59.2% |
| Renter-Occupied Housing Units | 685 | 40.8% |
| Total Occupied Housing Units | 1,680 | 100.0% |
Occupancy by Household Size in Anasco
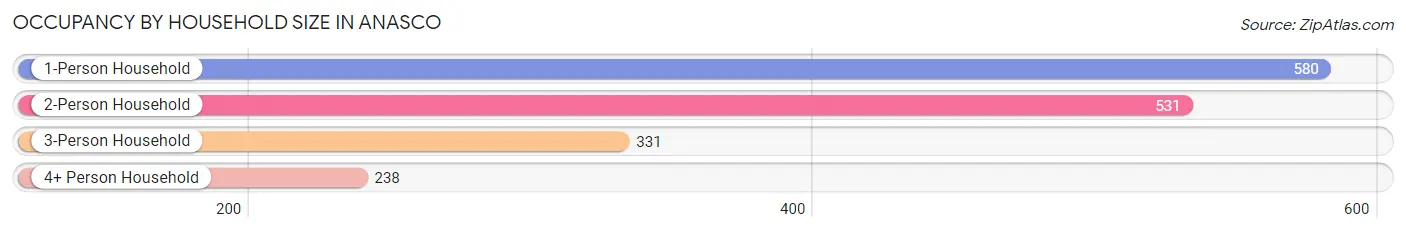
| Household Size | # Housing Units | % Housing Units |
| 1-Person Household | 580 | 34.5% |
| 2-Person Household | 531 | 31.6% |
| 3-Person Household | 331 | 19.7% |
| 4+ Person Household | 238 | 14.2% |
| Total Housing Units | 1,680 | 100.0% |
Occupancy by Ownership by Household Size in Anasco
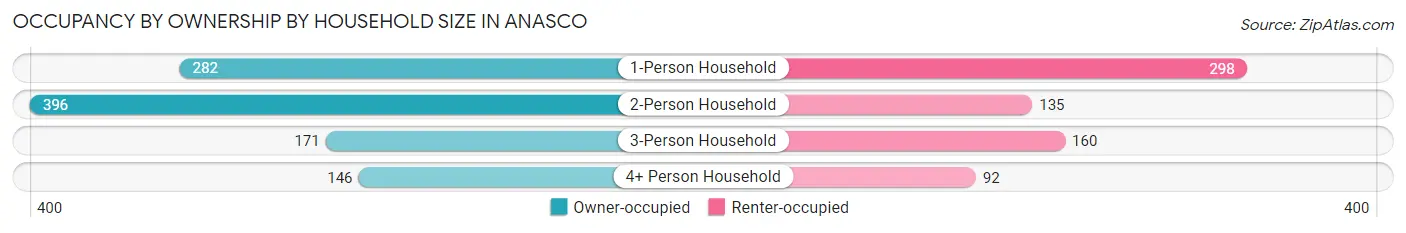
| Household Size | Owner-occupied | Renter-occupied |
| 1-Person Household | 282 (48.6%) | 298 (51.4%) |
| 2-Person Household | 396 (74.6%) | 135 (25.4%) |
| 3-Person Household | 171 (51.7%) | 160 (48.3%) |
| 4+ Person Household | 146 (61.3%) | 92 (38.7%) |
| Total Housing Units | 995 (59.2%) | 685 (40.8%) |
Occupancy by Educational Attainment in Anasco
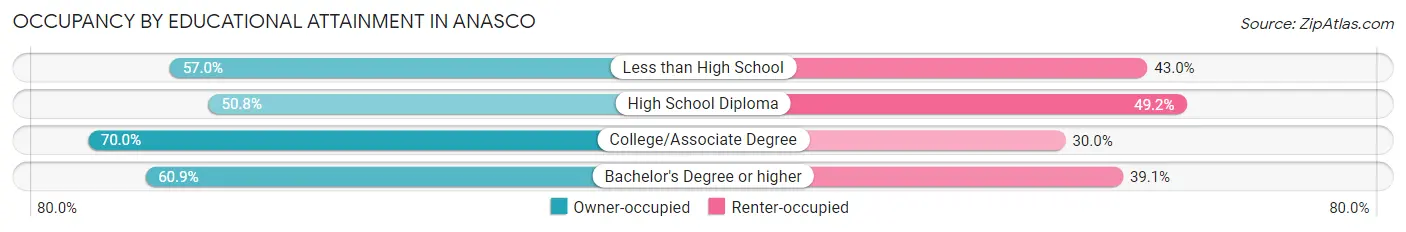
| Household Size | Owner-occupied | Renter-occupied |
| Less than High School | 196 (57.0%) | 148 (43.0%) |
| High School Diploma | 248 (50.8%) | 240 (49.2%) |
| College/Associate Degree | 268 (70.0%) | 115 (30.0%) |
| Bachelor's Degree or higher | 283 (60.9%) | 182 (39.1%) |
Occupancy by Age of Householder in Anasco
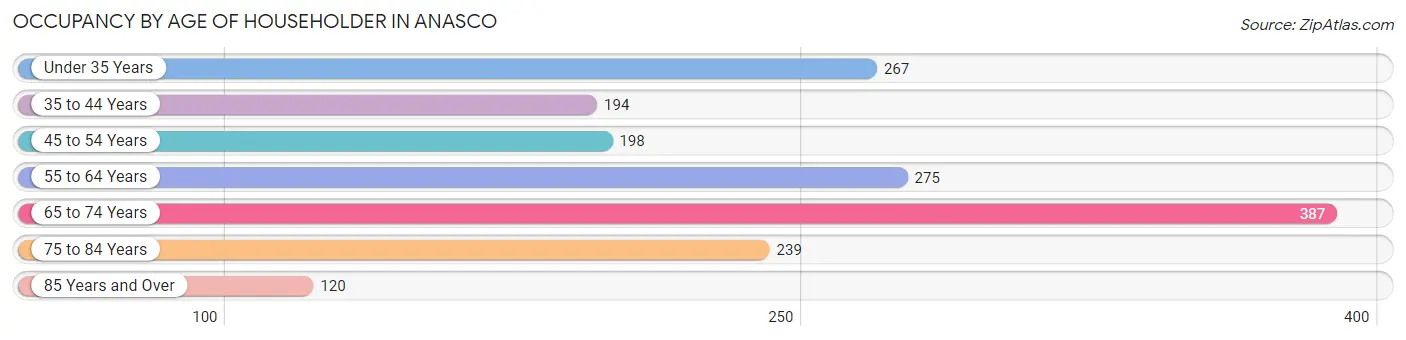
| Age Bracket | # Households | % Households |
| Under 35 Years | 267 | 15.9% |
| 35 to 44 Years | 194 | 11.6% |
| 45 to 54 Years | 198 | 11.8% |
| 55 to 64 Years | 275 | 16.4% |
| 65 to 74 Years | 387 | 23.0% |
| 75 to 84 Years | 239 | 14.2% |
| 85 Years and Over | 120 | 7.1% |
| Total | 1,680 | 100.0% |
Housing Finances in Anasco
Median Income by Occupancy in Anasco
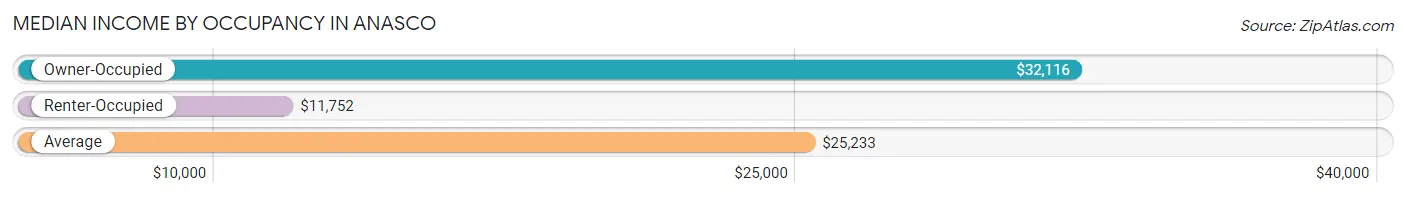
| Occupancy Type | # Households | Median Income |
| Owner-Occupied | 995 (59.2%) | $32,116 |
| Renter-Occupied | 685 (40.8%) | $11,752 |
| Average | 1,680 (100.0%) | $25,233 |
Occupancy by Householder Income Bracket in Anasco
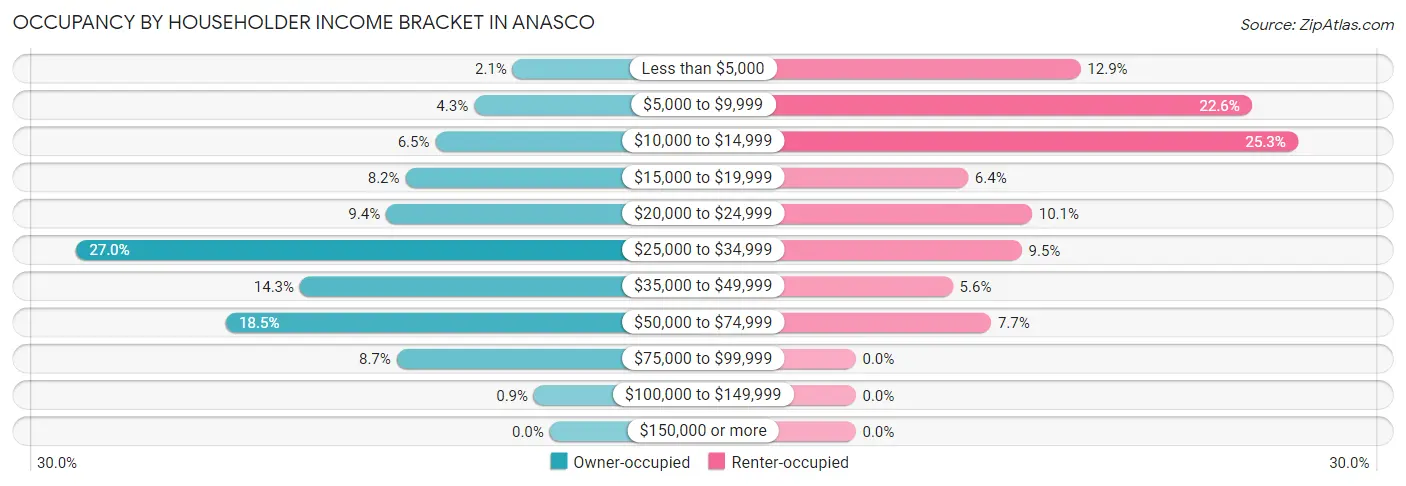
| Income Bracket | Owner-occupied | Renter-occupied |
| Less than $5,000 | 21 (2.1%) | 88 (12.9%) |
| $5,000 to $9,999 | 43 (4.3%) | 155 (22.6%) |
| $10,000 to $14,999 | 65 (6.5%) | 173 (25.3%) |
| $15,000 to $19,999 | 82 (8.2%) | 44 (6.4%) |
| $20,000 to $24,999 | 93 (9.3%) | 69 (10.1%) |
| $25,000 to $34,999 | 269 (27.0%) | 65 (9.5%) |
| $35,000 to $49,999 | 142 (14.3%) | 38 (5.6%) |
| $50,000 to $74,999 | 184 (18.5%) | 53 (7.7%) |
| $75,000 to $99,999 | 87 (8.7%) | 0 (0.0%) |
| $100,000 to $149,999 | 9 (0.9%) | 0 (0.0%) |
| $150,000 or more | 0 (0.0%) | 0 (0.0%) |
| Total | 995 (100.0%) | 685 (100.0%) |
Monthly Housing Cost Tiers in Anasco
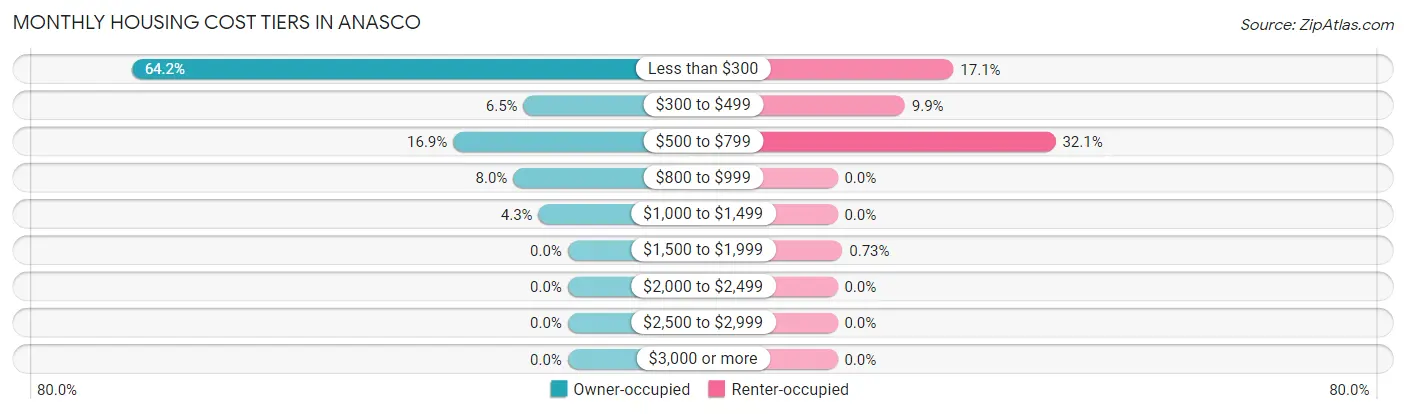
| Monthly Cost | Owner-occupied | Renter-occupied |
| Less than $300 | 639 (64.2%) | 117 (17.1%) |
| $300 to $499 | 65 (6.5%) | 68 (9.9%) |
| $500 to $799 | 168 (16.9%) | 220 (32.1%) |
| $800 to $999 | 80 (8.0%) | 0 (0.0%) |
| $1,000 to $1,499 | 43 (4.3%) | 0 (0.0%) |
| $1,500 to $1,999 | 0 (0.0%) | 5 (0.7%) |
| $2,000 to $2,499 | 0 (0.0%) | 0 (0.0%) |
| $2,500 to $2,999 | 0 (0.0%) | 0 (0.0%) |
| $3,000 or more | 0 (0.0%) | 0 (0.0%) |
| Total | 995 (100.0%) | 685 (100.0%) |
Physical Housing Characteristics in Anasco
Housing Structures in Anasco
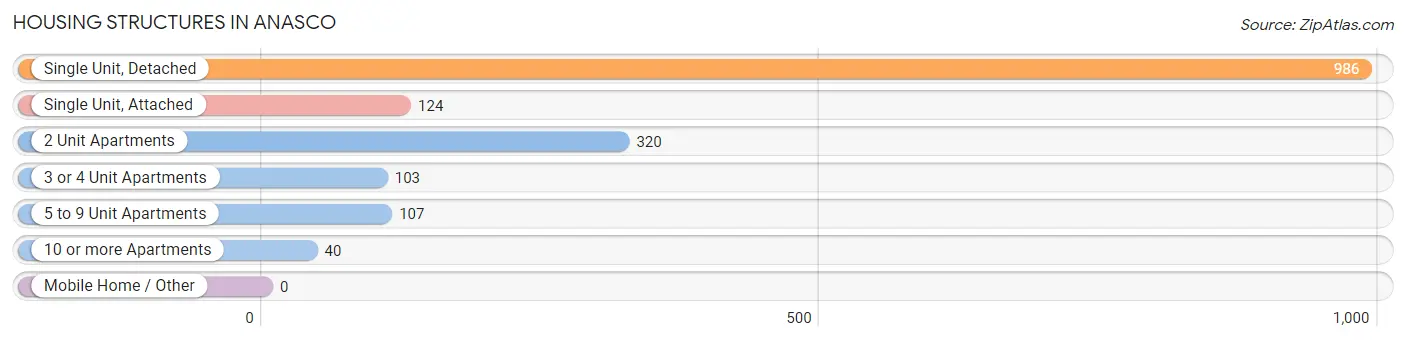
| Structure Type | # Housing Units | % Housing Units |
| Single Unit, Detached | 986 | 58.7% |
| Single Unit, Attached | 124 | 7.4% |
| 2 Unit Apartments | 320 | 19.1% |
| 3 or 4 Unit Apartments | 103 | 6.1% |
| 5 to 9 Unit Apartments | 107 | 6.4% |
| 10 or more Apartments | 40 | 2.4% |
| Mobile Home / Other | 0 | 0.0% |
| Total | 1,680 | 100.0% |
Housing Structures by Occupancy in Anasco
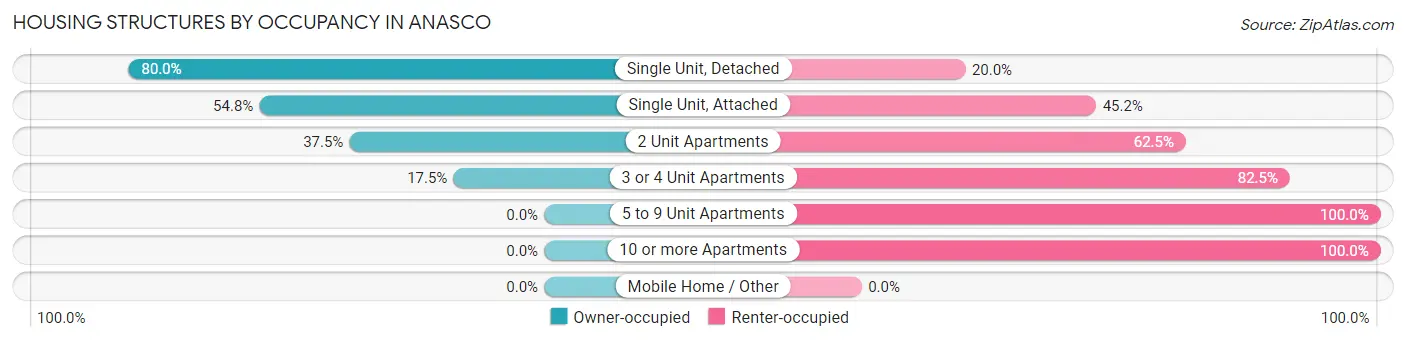
| Structure Type | Owner-occupied | Renter-occupied |
| Single Unit, Detached | 789 (80.0%) | 197 (20.0%) |
| Single Unit, Attached | 68 (54.8%) | 56 (45.2%) |
| 2 Unit Apartments | 120 (37.5%) | 200 (62.5%) |
| 3 or 4 Unit Apartments | 18 (17.5%) | 85 (82.5%) |
| 5 to 9 Unit Apartments | 0 (0.0%) | 107 (100.0%) |
| 10 or more Apartments | 0 (0.0%) | 40 (100.0%) |
| Mobile Home / Other | 0 (0.0%) | 0 (0.0%) |
| Total | 995 (59.2%) | 685 (40.8%) |
Housing Structures by Number of Rooms in Anasco
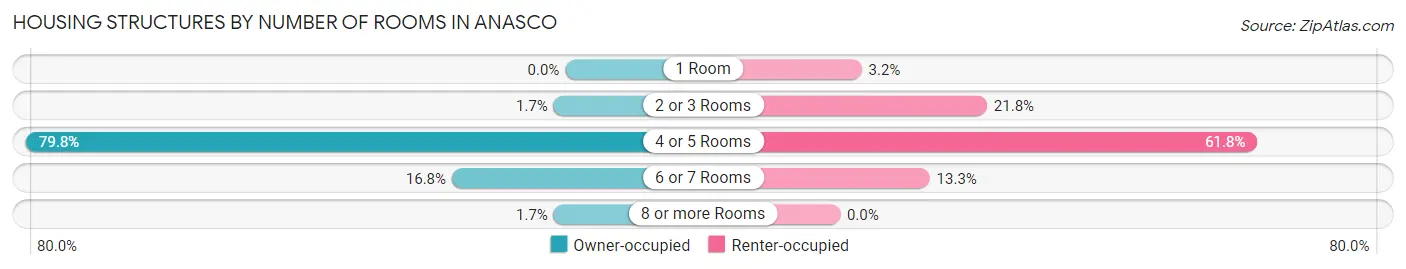
| Number of Rooms | Owner-occupied | Renter-occupied |
| 1 Room | 0 (0.0%) | 22 (3.2%) |
| 2 or 3 Rooms | 17 (1.7%) | 149 (21.7%) |
| 4 or 5 Rooms | 794 (79.8%) | 423 (61.8%) |
| 6 or 7 Rooms | 167 (16.8%) | 91 (13.3%) |
| 8 or more Rooms | 17 (1.7%) | 0 (0.0%) |
| Total | 995 (100.0%) | 685 (100.0%) |
Housing Structure by Heating Type in Anasco
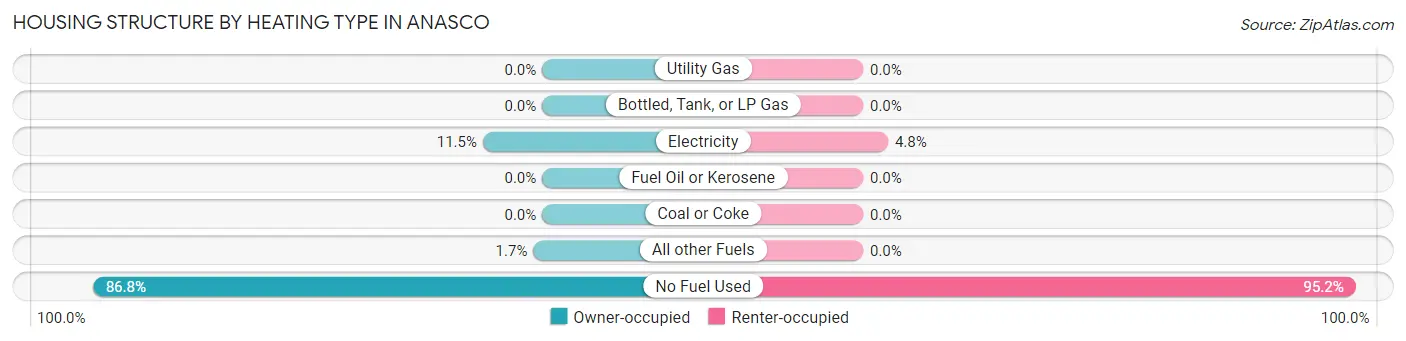
| Heating Type | Owner-occupied | Renter-occupied |
| Utility Gas | 0 (0.0%) | 0 (0.0%) |
| Bottled, Tank, or LP Gas | 0 (0.0%) | 0 (0.0%) |
| Electricity | 114 (11.5%) | 33 (4.8%) |
| Fuel Oil or Kerosene | 0 (0.0%) | 0 (0.0%) |
| Coal or Coke | 0 (0.0%) | 0 (0.0%) |
| All other Fuels | 17 (1.7%) | 0 (0.0%) |
| No Fuel Used | 864 (86.8%) | 652 (95.2%) |
| Total | 995 (100.0%) | 685 (100.0%) |
Household Vehicle Usage in Anasco
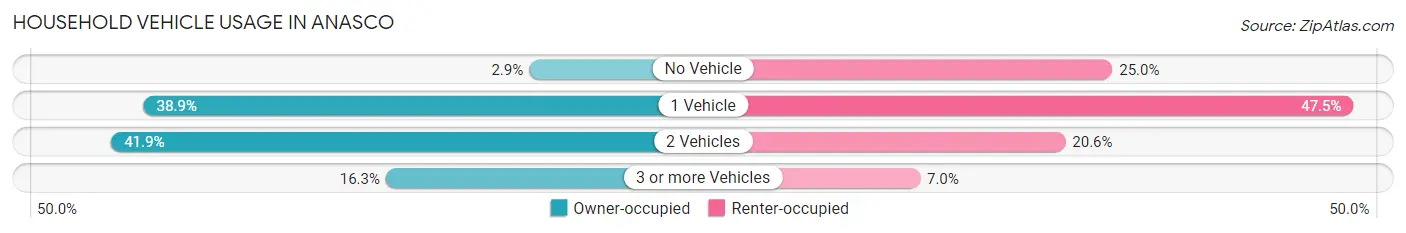
| Vehicles per Household | Owner-occupied | Renter-occupied |
| No Vehicle | 29 (2.9%) | 171 (25.0%) |
| 1 Vehicle | 387 (38.9%) | 325 (47.4%) |
| 2 Vehicles | 417 (41.9%) | 141 (20.6%) |
| 3 or more Vehicles | 162 (16.3%) | 48 (7.0%) |
| Total | 995 (100.0%) | 685 (100.0%) |
Real Estate & Mortgages in Anasco
Real Estate and Mortgage Overview in Anasco
| Characteristic | Without Mortgage | With Mortgage |
| Housing Units | 711 | 284 |
| Median Property Value | $105,300 | $134,100 |
| Median Household Income | $31,735 | $0 |
| Monthly Housing Costs | $140 | $0 |
| Real Estate Taxes | $1,172 | $279 |
Property Value by Mortgage Status in Anasco
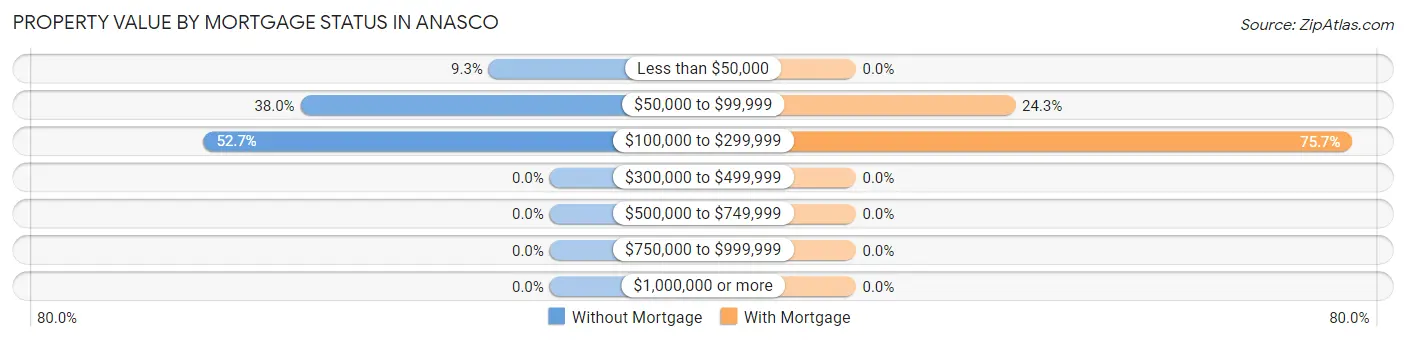
| Property Value | Without Mortgage | With Mortgage |
| Less than $50,000 | 66 (9.3%) | 0 (0.0%) |
| $50,000 to $99,999 | 270 (38.0%) | 69 (24.3%) |
| $100,000 to $299,999 | 375 (52.7%) | 215 (75.7%) |
| $300,000 to $499,999 | 0 (0.0%) | 0 (0.0%) |
| $500,000 to $749,999 | 0 (0.0%) | 0 (0.0%) |
| $750,000 to $999,999 | 0 (0.0%) | 0 (0.0%) |
| $1,000,000 or more | 0 (0.0%) | 0 (0.0%) |
| Total | 711 (100.0%) | 284 (100.0%) |
Household Income by Mortgage Status in Anasco
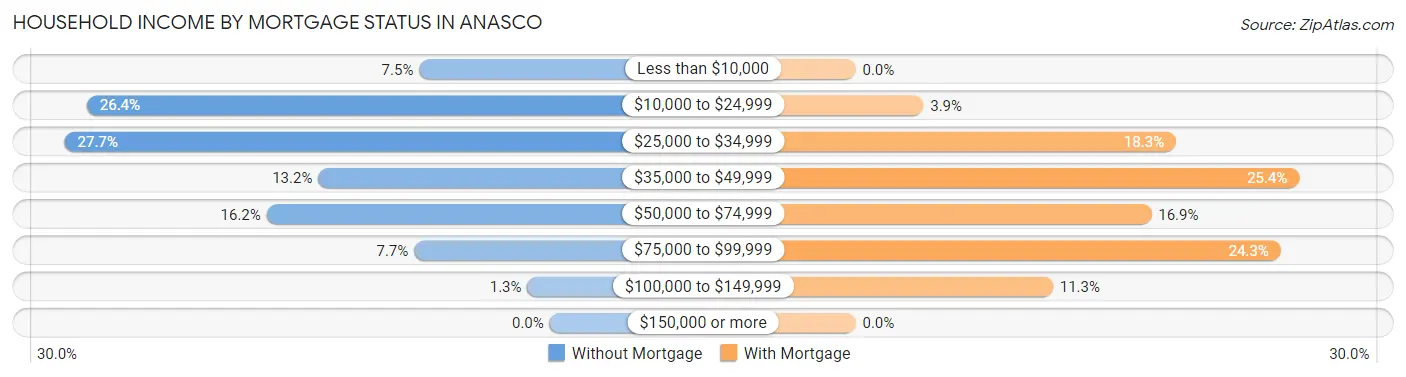
| Household Income | Without Mortgage | With Mortgage |
| Less than $10,000 | 53 (7.4%) | 0 (0.0%) |
| $10,000 to $24,999 | 188 (26.4%) | 11 (3.9%) |
| $25,000 to $34,999 | 197 (27.7%) | 52 (18.3%) |
| $35,000 to $49,999 | 94 (13.2%) | 72 (25.4%) |
| $50,000 to $74,999 | 115 (16.2%) | 48 (16.9%) |
| $75,000 to $99,999 | 55 (7.7%) | 69 (24.3%) |
| $100,000 to $149,999 | 9 (1.3%) | 32 (11.3%) |
| $150,000 or more | 0 (0.0%) | 0 (0.0%) |
| Total | 711 (100.0%) | 284 (100.0%) |
Property Value to Household Income Ratio in Anasco
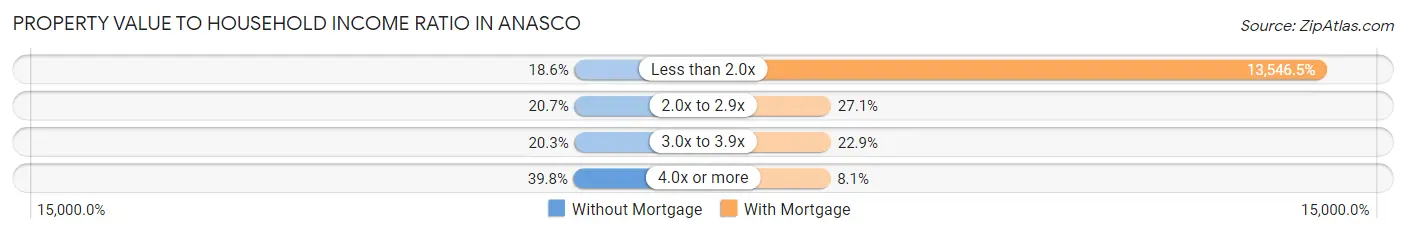
| Value-to-Income Ratio | Without Mortgage | With Mortgage |
| Less than 2.0x | 132 (18.6%) | 38,472 (13,546.5%) |
| 2.0x to 2.9x | 147 (20.7%) | 77 (27.1%) |
| 3.0x to 3.9x | 144 (20.3%) | 65 (22.9%) |
| 4.0x or more | 283 (39.8%) | 23 (8.1%) |
| Total | 711 (100.0%) | 284 (100.0%) |
Real Estate Taxes by Mortgage Status in Anasco
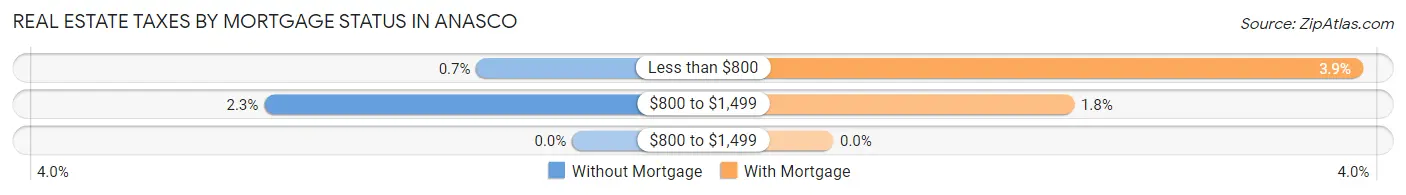
| Property Taxes | Without Mortgage | With Mortgage |
| Less than $800 | 5 (0.7%) | 11 (3.9%) |
| $800 to $1,499 | 16 (2.2%) | 5 (1.8%) |
| $800 to $1,499 | 0 (0.0%) | 0 (0.0%) |
| Total | 711 (100.0%) | 284 (100.0%) |
Health & Disability in Anasco
Health Insurance Coverage by Age in Anasco
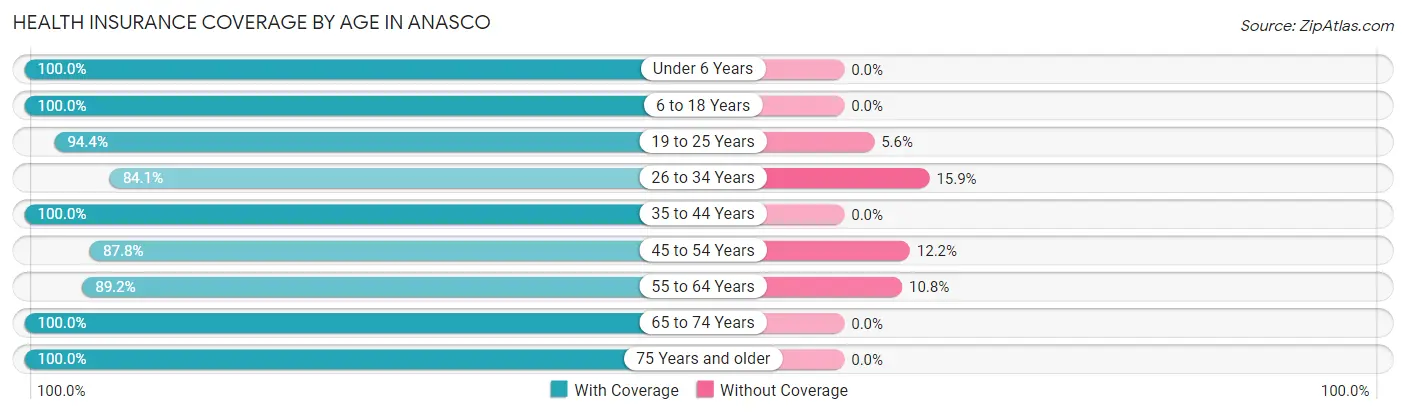
| Age Bracket | With Coverage | Without Coverage |
| Under 6 Years | 170 (100.0%) | 0 (0.0%) |
| 6 to 18 Years | 547 (100.0%) | 0 (0.0%) |
| 19 to 25 Years | 254 (94.4%) | 15 (5.6%) |
| 26 to 34 Years | 392 (84.1%) | 74 (15.9%) |
| 35 to 44 Years | 508 (100.0%) | 0 (0.0%) |
| 45 to 54 Years | 524 (87.8%) | 73 (12.2%) |
| 55 to 64 Years | 580 (89.2%) | 70 (10.8%) |
| 65 to 74 Years | 606 (100.0%) | 0 (0.0%) |
| 75 Years and older | 749 (100.0%) | 0 (0.0%) |
| Total | 4,330 (94.9%) | 232 (5.1%) |
Health Insurance Coverage by Citizenship Status in Anasco

| Citizenship Status | With Coverage | Without Coverage |
| Native Born | 170 (100.0%) | 0 (0.0%) |
| Foreign Born, Citizen | 547 (100.0%) | 0 (0.0%) |
| Foreign Born, not a Citizen | 254 (94.4%) | 15 (5.6%) |
Health Insurance Coverage by Household Income in Anasco
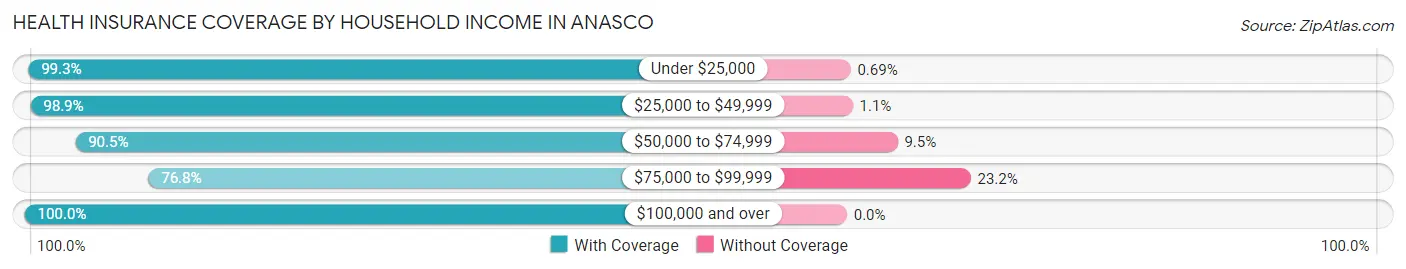
| Household Income | With Coverage | Without Coverage |
| Under $25,000 | 1,730 (99.3%) | 12 (0.7%) |
| $25,000 to $49,999 | 1,357 (98.9%) | 15 (1.1%) |
| $50,000 to $74,999 | 830 (90.5%) | 87 (9.5%) |
| $75,000 to $99,999 | 391 (76.8%) | 118 (23.2%) |
| $100,000 and over | 20 (100.0%) | 0 (0.0%) |
Public vs Private Health Insurance Coverage by Age in Anasco
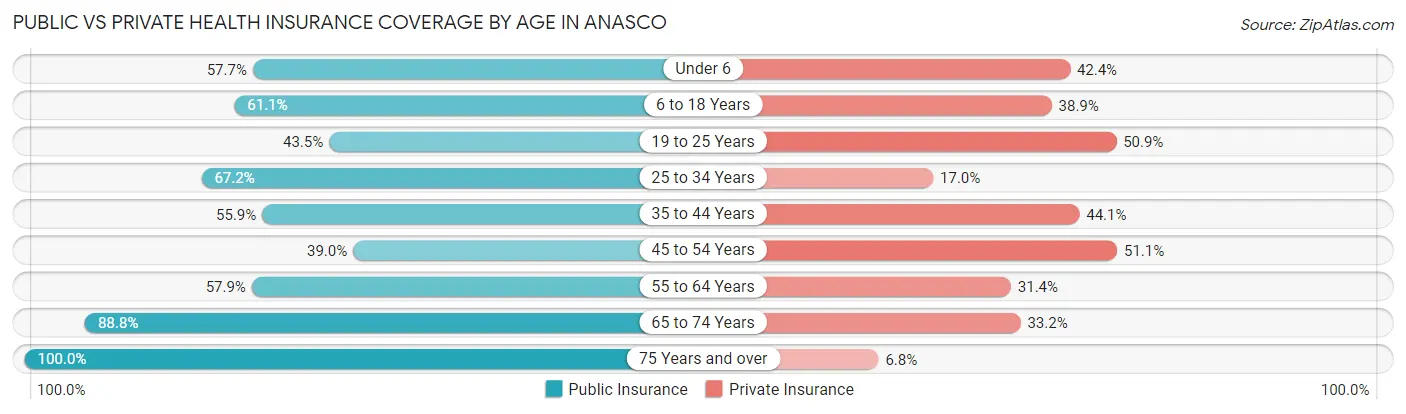
| Age Bracket | Public Insurance | Private Insurance |
| Under 6 | 98 (57.7%) | 72 (42.3%) |
| 6 to 18 Years | 334 (61.1%) | 213 (38.9%) |
| 19 to 25 Years | 117 (43.5%) | 137 (50.9%) |
| 25 to 34 Years | 313 (67.2%) | 79 (17.0%) |
| 35 to 44 Years | 284 (55.9%) | 224 (44.1%) |
| 45 to 54 Years | 233 (39.0%) | 305 (51.1%) |
| 55 to 64 Years | 376 (57.9%) | 204 (31.4%) |
| 65 to 74 Years | 538 (88.8%) | 201 (33.2%) |
| 75 Years and over | 749 (100.0%) | 51 (6.8%) |
| Total | 3,042 (66.7%) | 1,486 (32.6%) |
Disability Status by Sex by Age in Anasco
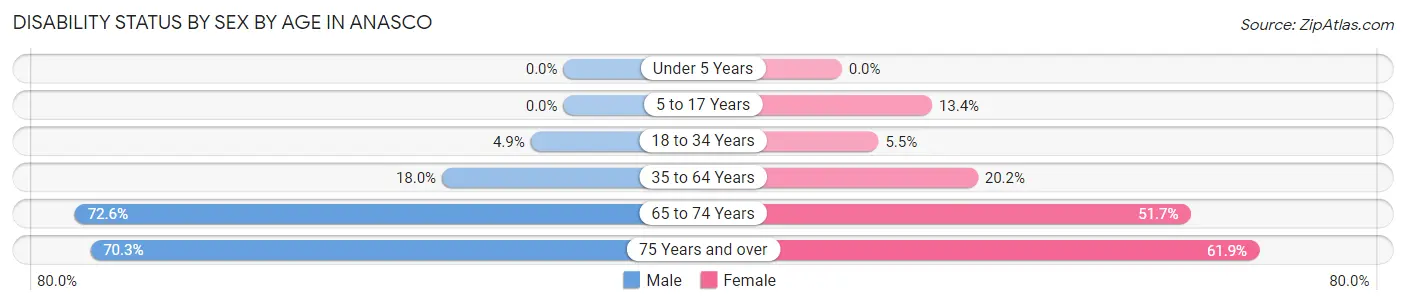
| Age Bracket | Male | Female |
| Under 5 Years | 0 (0.0%) | 0 (0.0%) |
| 5 to 17 Years | 0 (0.0%) | 34 (13.4%) |
| 18 to 34 Years | 15 (4.9%) | 26 (5.4%) |
| 35 to 64 Years | 154 (18.0%) | 182 (20.2%) |
| 65 to 74 Years | 148 (72.6%) | 208 (51.7%) |
| 75 Years and over | 229 (70.3%) | 262 (61.9%) |
Disability Class by Sex by Age in Anasco
Disability Class: Hearing Difficulty
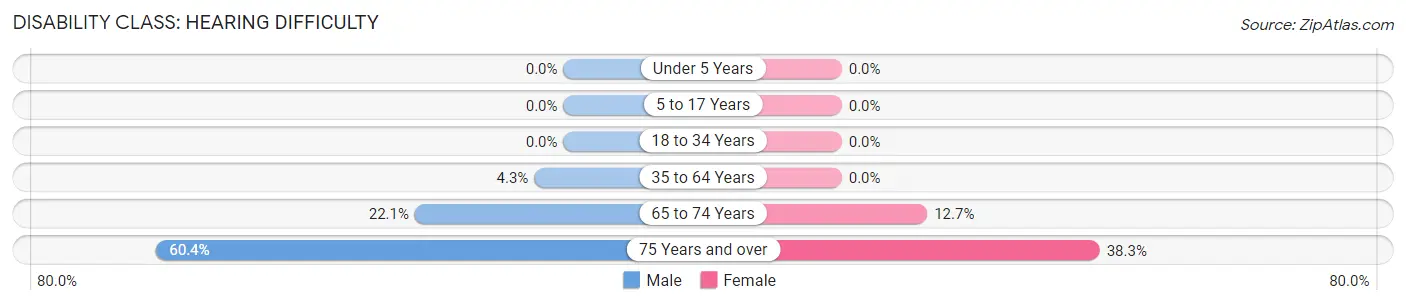
| Age Bracket | Male | Female |
| Under 5 Years | 0 (0.0%) | 0 (0.0%) |
| 5 to 17 Years | 0 (0.0%) | 0 (0.0%) |
| 18 to 34 Years | 0 (0.0%) | 0 (0.0%) |
| 35 to 64 Years | 37 (4.3%) | 0 (0.0%) |
| 65 to 74 Years | 45 (22.1%) | 51 (12.7%) |
| 75 Years and over | 197 (60.4%) | 162 (38.3%) |
Disability Class: Vision Difficulty
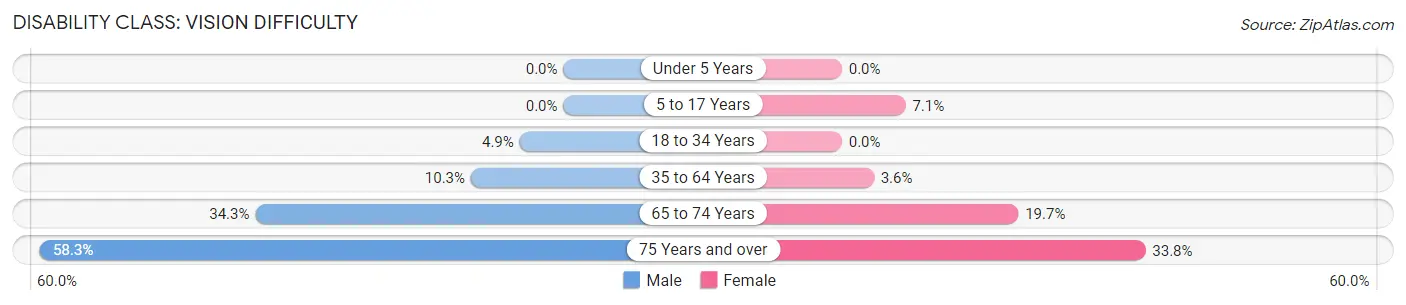
| Age Bracket | Male | Female |
| Under 5 Years | 0 (0.0%) | 0 (0.0%) |
| 5 to 17 Years | 0 (0.0%) | 18 (7.1%) |
| 18 to 34 Years | 15 (4.9%) | 0 (0.0%) |
| 35 to 64 Years | 88 (10.3%) | 32 (3.5%) |
| 65 to 74 Years | 70 (34.3%) | 79 (19.7%) |
| 75 Years and over | 190 (58.3%) | 143 (33.8%) |
Disability Class: Cognitive Difficulty
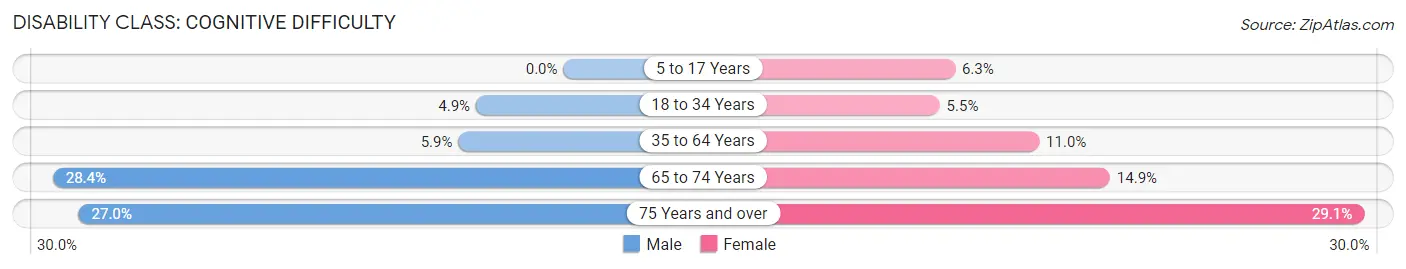
| Age Bracket | Male | Female |
| 5 to 17 Years | 0 (0.0%) | 16 (6.3%) |
| 18 to 34 Years | 15 (4.9%) | 26 (5.4%) |
| 35 to 64 Years | 50 (5.9%) | 99 (11.0%) |
| 65 to 74 Years | 58 (28.4%) | 60 (14.9%) |
| 75 Years and over | 88 (27.0%) | 123 (29.1%) |
Disability Class: Ambulatory Difficulty
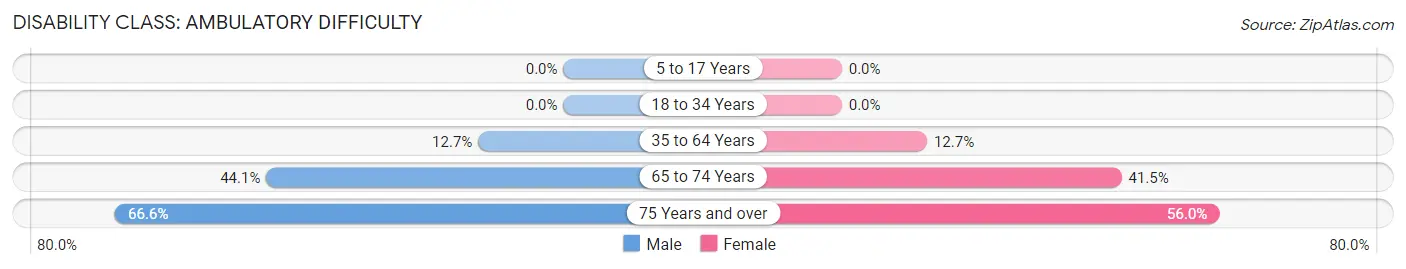
| Age Bracket | Male | Female |
| 5 to 17 Years | 0 (0.0%) | 0 (0.0%) |
| 18 to 34 Years | 0 (0.0%) | 0 (0.0%) |
| 35 to 64 Years | 108 (12.7%) | 114 (12.7%) |
| 65 to 74 Years | 90 (44.1%) | 167 (41.5%) |
| 75 Years and over | 217 (66.6%) | 237 (56.0%) |
Disability Class: Self-Care Difficulty
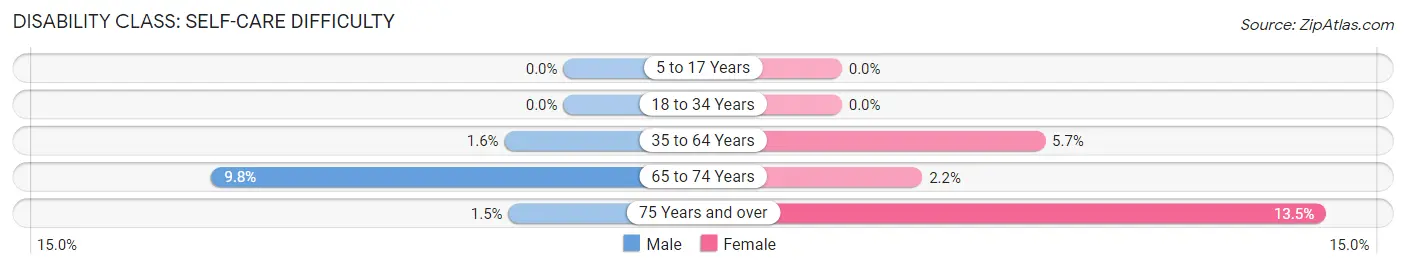
| Age Bracket | Male | Female |
| 5 to 17 Years | 0 (0.0%) | 0 (0.0%) |
| 18 to 34 Years | 0 (0.0%) | 0 (0.0%) |
| 35 to 64 Years | 14 (1.6%) | 51 (5.7%) |
| 65 to 74 Years | 20 (9.8%) | 9 (2.2%) |
| 75 Years and over | 5 (1.5%) | 57 (13.5%) |
Technology Access in Anasco
Computing Device Access in Anasco
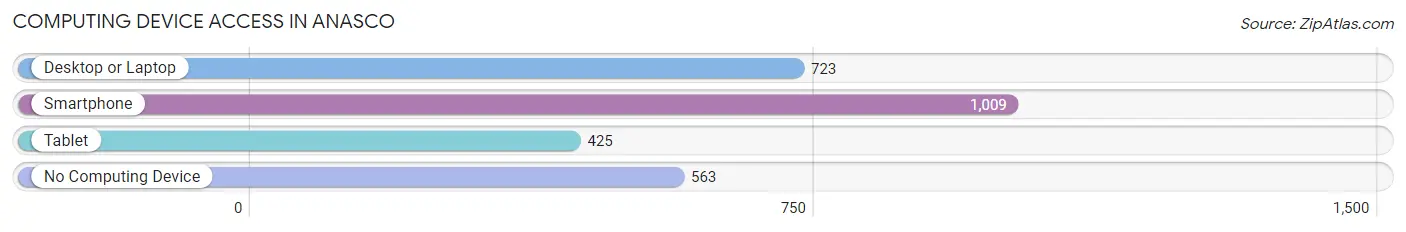
| Device Type | # Households | % Households |
| Desktop or Laptop | 723 | 43.0% |
| Smartphone | 1,009 | 60.1% |
| Tablet | 425 | 25.3% |
| No Computing Device | 563 | 33.5% |
| Total | 1,680 | 100.0% |
Internet Access in Anasco
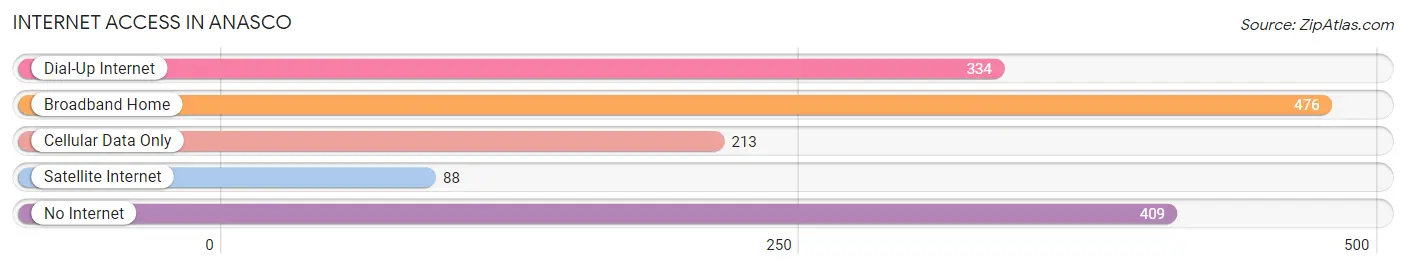
| Internet Type | # Households | % Households |
| Dial-Up Internet | 334 | 19.9% |
| Broadband Home | 476 | 28.3% |
| Cellular Data Only | 213 | 12.7% |
| Satellite Internet | 88 | 5.2% |
| No Internet | 409 | 24.3% |
| Total | 1,680 | 100.0% |
Anasco Summary
Anasco, Puerto Rico is a municipality located in the western region of the island of Puerto Rico. It is bordered by the municipalities of Mayaguez, Las Marias, San Sebastian, and Aguada. The town is located on the western coast of the island, and is known for its beautiful beaches and its rich history.
History
Anasco was founded in 1719 by Don Francisco de Anasco, a Spanish soldier who was sent to the area to protect the island from pirates. The town was originally called San Francisco de Anasco, but the name was later shortened to Anasco. The town was an important port during the colonial period, and was the site of several battles during the Spanish-American War.
Geography
Anasco is located in the western region of Puerto Rico, on the western coast of the island. The municipality covers an area of approximately 40 square miles, and is home to a population of approximately 25,000 people. The town is located in a valley surrounded by mountains, and is known for its beautiful beaches. The town is also home to several rivers, including the Anasco River, which flows through the town.
Economy
The economy of Anasco is largely based on agriculture and tourism. The town is home to several farms, which produce a variety of fruits and vegetables, including bananas, plantains, and avocados. The town is also home to several hotels and resorts, which attract tourists from all over the world. In addition, the town is home to several factories, which produce a variety of products, including clothing, furniture, and electronics.
Demographics
As of the 2010 census, the population of Anasco was 25,072. The population is largely of Puerto Rican descent, with a small percentage of people of other ethnic backgrounds. The town is predominantly Roman Catholic, with a small percentage of people of other faiths. The median household income in Anasco is $17,845, and the median age is 37.
Conclusion
Anasco, Puerto Rico is a municipality located in the western region of the island of Puerto Rico. It is bordered by the municipalities of Mayaguez, Las Marias, San Sebastian, and Aguada. The town is known for its beautiful beaches and its rich history, and is home to a population of approximately 25,000 people. The economy of Anasco is largely based on agriculture and tourism, and the town is predominantly Roman Catholic. Anasco is a beautiful town with a rich history and culture, and is a great place to visit or live.
Common Questions
What is Per Capita Income in Anasco?
Per Capita income in Anasco is $14,320.
What is the Median Family Income in Anasco?
Median Family Income in Anasco is $29,892.
What is the Median Household income in Anasco?
Median Household Income in Anasco is $25,233.
What is Income or Wage Gap in Anasco?
Income or Wage Gap in Anasco is 25.9%.
Women in Anasco earn 74.1 cents for every dollar earned by a man.
What is Inequality or Gini Index in Anasco?
Inequality or Gini Index in Anasco is 0.42.
What is the Total Population of Anasco?
Total Population of Anasco is 4,562.
What is the Total Male Population of Anasco?
Total Male Population of Anasco is 2,105.
What is the Total Female Population of Anasco?
Total Female Population of Anasco is 2,457.
What is the Ratio of Males per 100 Females in Anasco?
There are 85.67 Males per 100 Females in Anasco.
What is the Ratio of Females per 100 Males in Anasco?
There are 116.72 Females per 100 Males in Anasco.
What is the Median Population Age in Anasco?
Median Population Age in Anasco is 50.7 Years.
What is the Average Family Size in Anasco
Average Family Size in Anasco is 3.6 People.
What is the Average Household Size in Anasco
Average Household Size in Anasco is 2.7 People.
How Large is the Labor Force in Anasco?
There are 1,710 People in the Labor Forcein in Anasco.
What is the Percentage of People in the Labor Force in Anasco?
43.5% of People are in the Labor Force in Anasco.
What is the Unemployment Rate in Anasco?
Unemployment Rate in Anasco is 13.0%.