Gurabo, PR Map & Demographics
Gurabo Map
Gurabo Overview
$16,899
PER CAPITA INCOME
$24,583
AVG FAMILY INCOME
$22,153
AVG HOUSEHOLD INCOME
26.3%
WAGE / INCOME GAP [ % ]
73.7¢/ $1
WAGE / INCOME GAP [ $ ]
$10,435
FAMILY INCOME DEFICIT
0.57
INEQUALITY / GINI INDEX
6,966
TOTAL POPULATION
3,454
MALE POPULATION
3,512
FEMALE POPULATION
98.35
MALES / 100 FEMALES
101.68
FEMALES / 100 MALES
41.5
MEDIAN AGE
3.0
AVG FAMILY SIZE
2.5
AVG HOUSEHOLD SIZE
3,340
LABOR FORCE [ PEOPLE ]
54.7%
PERCENT IN LABOR FORCE
14.3%
UNEMPLOYMENT RATE
Gurabo Zip Codes
Gurabo Area Codes
Income in Gurabo
Income Overview in Gurabo
Per Capita Income in Gurabo is $16,899, while median incomes of families and households are $24,583 and $22,153 respectively.
| Characteristic | Number | Measure |
| Per Capita Income | 6,966 | $16,899 |
| Median Family Income | 1,828 | $24,583 |
| Mean Family Income | 1,828 | $40,200 |
| Median Household Income | 2,791 | $22,153 |
| Mean Household Income | 2,791 | $38,041 |
| Income Deficit | 1,828 | $10,435 |
| Wage / Income Gap (%) | 6,966 | 26.31% |
| Wage / Income Gap ($) | 6,966 | 73.69¢ per $1 |
| Gini / Inequality Index | 6,966 | 0.57 |
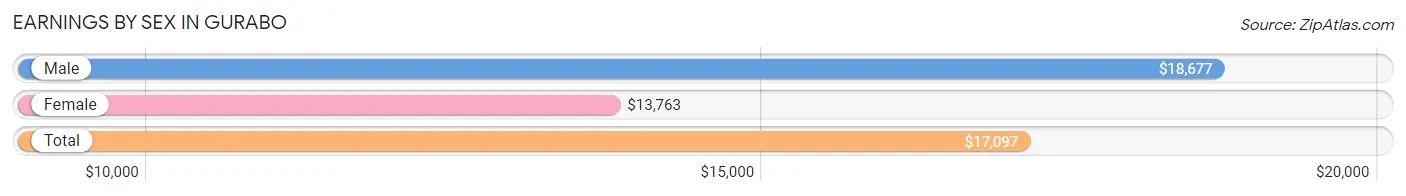
Earnings by Sex in Gurabo
Average Earnings in Gurabo are $17,097, $18,677 for men and $13,763 for women, a difference of 26.3%.
| Sex | Number | Average Earnings |
| Male | 1,735 (55.0%) | $18,677 |
| Female | 1,420 (45.0%) | $13,763 |
| Total | 3,155 (100.0%) | $17,097 |
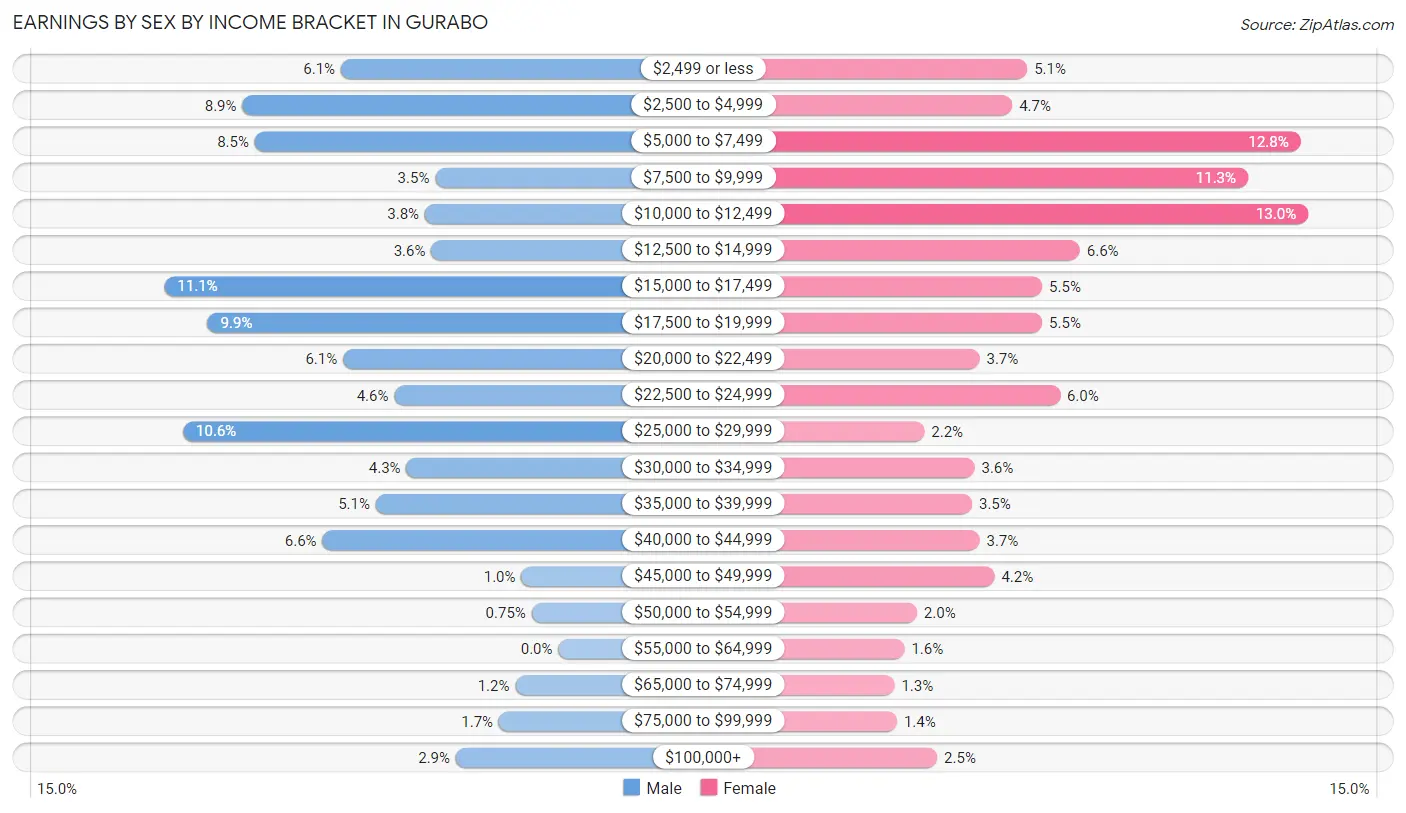
Earnings by Sex by Income Bracket in Gurabo
The most common earnings brackets in Gurabo are $15,000 to $17,499 for men (192 | 11.1%) and $10,000 to $12,499 for women (184 | 13.0%).
| Income | Male | Female |
| $2,499 or less | 106 (6.1%) | 72 (5.1%) |
| $2,500 to $4,999 | 154 (8.9%) | 66 (4.6%) |
| $5,000 to $7,499 | 148 (8.5%) | 181 (12.8%) |
| $7,500 to $9,999 | 60 (3.5%) | 160 (11.3%) |
| $10,000 to $12,499 | 65 (3.7%) | 184 (13.0%) |
| $12,500 to $14,999 | 62 (3.6%) | 93 (6.6%) |
| $15,000 to $17,499 | 192 (11.1%) | 78 (5.5%) |
| $17,500 to $19,999 | 171 (9.9%) | 78 (5.5%) |
| $20,000 to $22,499 | 105 (6.0%) | 53 (3.7%) |
| $22,500 to $24,999 | 80 (4.6%) | 85 (6.0%) |
| $25,000 to $29,999 | 183 (10.5%) | 31 (2.2%) |
| $30,000 to $34,999 | 74 (4.3%) | 51 (3.6%) |
| $35,000 to $39,999 | 89 (5.1%) | 50 (3.5%) |
| $40,000 to $44,999 | 115 (6.6%) | 53 (3.7%) |
| $45,000 to $49,999 | 18 (1.0%) | 59 (4.2%) |
| $50,000 to $54,999 | 13 (0.7%) | 28 (2.0%) |
| $55,000 to $64,999 | 0 (0.0%) | 23 (1.6%) |
| $65,000 to $74,999 | 21 (1.2%) | 19 (1.3%) |
| $75,000 to $99,999 | 29 (1.7%) | 20 (1.4%) |
| $100,000+ | 50 (2.9%) | 36 (2.5%) |
| Total | 1,735 (100.0%) | 1,420 (100.0%) |
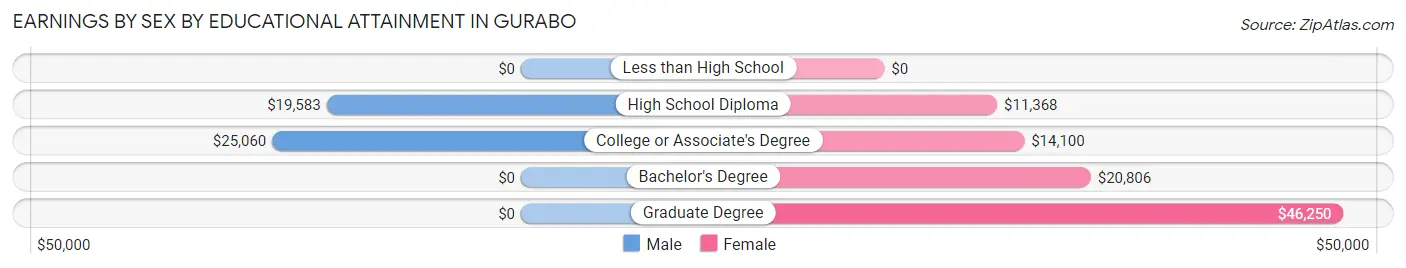
Earnings by Sex by Educational Attainment in Gurabo
Average earnings in Gurabo are $19,489 for men and $14,664 for women, a difference of 24.8%. Men with an educational attainment of college or associate's degree enjoy the highest average annual earnings of $25,060, while those with high school diploma education earn the least with $19,583. Women with an educational attainment of graduate degree earn the most with the average annual earnings of $46,250, while those with high school diploma education have the smallest earnings of $11,368.
| Educational Attainment | Male Income | Female Income |
| Less than High School | - | - |
| High School Diploma | $19,583 | $11,368 |
| College or Associate's Degree | $25,060 | $14,100 |
| Bachelor's Degree | - | - |
| Graduate Degree | - | - |
| Total | $19,489 | $14,664 |
Family Income in Gurabo
Family Income Brackets in Gurabo
According to the Gurabo family income data, there are 349 families falling into the $15,000 to $24,999 income range, which is the most common income bracket and makes up 19.1% of all families.
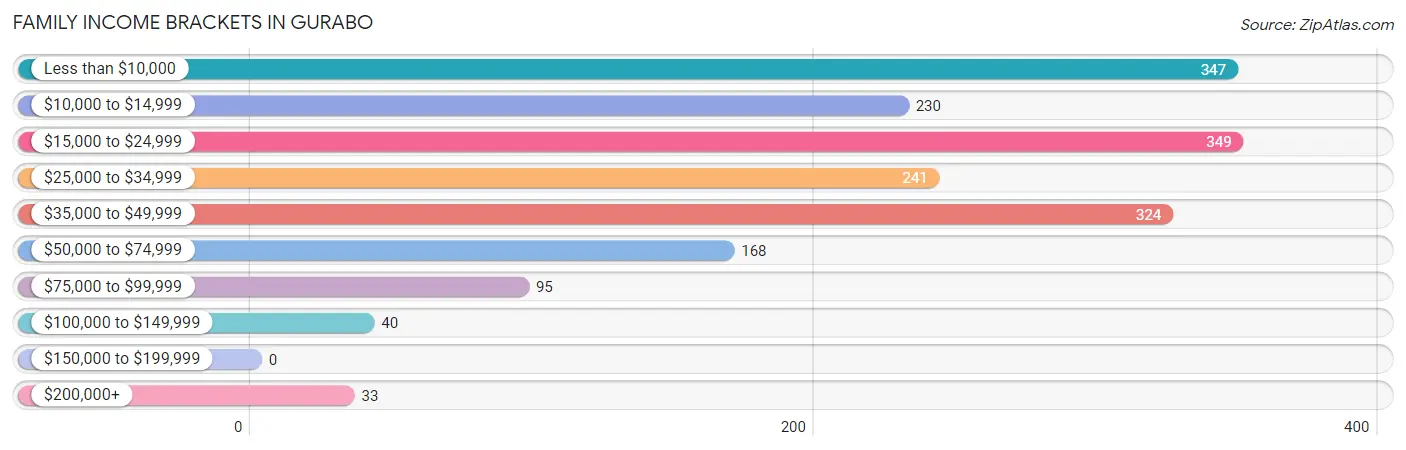
| Income Bracket | # Families | % Families |
| Less than $10,000 | 347 | 19.0% |
| $10,000 to $14,999 | 230 | 12.6% |
| $15,000 to $24,999 | 349 | 19.1% |
| $25,000 to $34,999 | 241 | 13.2% |
| $35,000 to $49,999 | 324 | 17.7% |
| $50,000 to $74,999 | 168 | 9.2% |
| $75,000 to $99,999 | 95 | 5.2% |
| $100,000 to $149,999 | 40 | 2.2% |
| $150,000 to $199,999 | 0 | 0.0% |
| $200,000+ | 33 | 1.8% |
Family Income by Famaliy Size in Gurabo
3-person families (416 | 22.8%) account for the highest median family income in Gurabo with $30,417 per family, while 3-person families (416 | 22.8%) have the highest median income of $10,139 per family member.
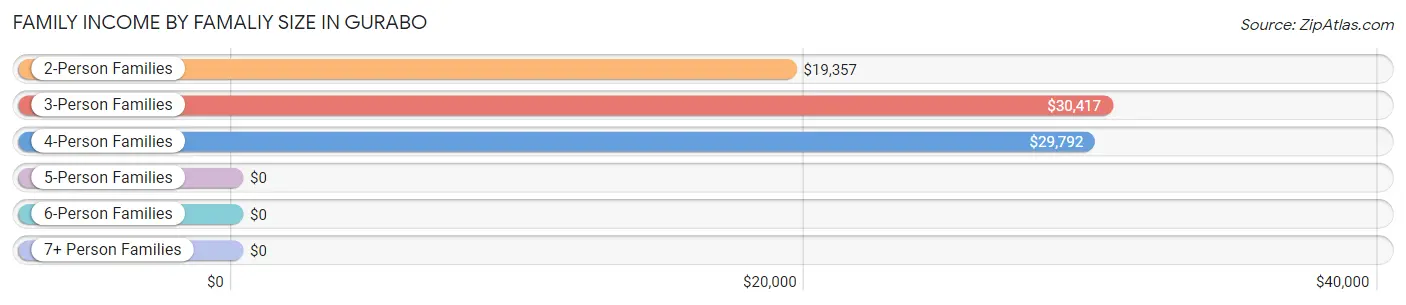
| Income Bracket | # Families | Median Income |
| 2-Person Families | 1,030 (56.4%) | $19,357 |
| 3-Person Families | 416 (22.8%) | $30,417 |
| 4-Person Families | 279 (15.3%) | $29,792 |
| 5-Person Families | 80 (4.4%) | $0 |
| 6-Person Families | 23 (1.3%) | $0 |
| 7+ Person Families | 0 (0.0%) | $0 |
| Total | 1,828 (100.0%) | $24,583 |
Family Income by Number of Earners in Gurabo
The median family income in Gurabo is $24,583, with families comprising 3+ earners (66) having the highest median family income of $77,250, while families with no earners (508) have the lowest median family income of $14,868, accounting for 3.6% and 27.8% of families, respectively.
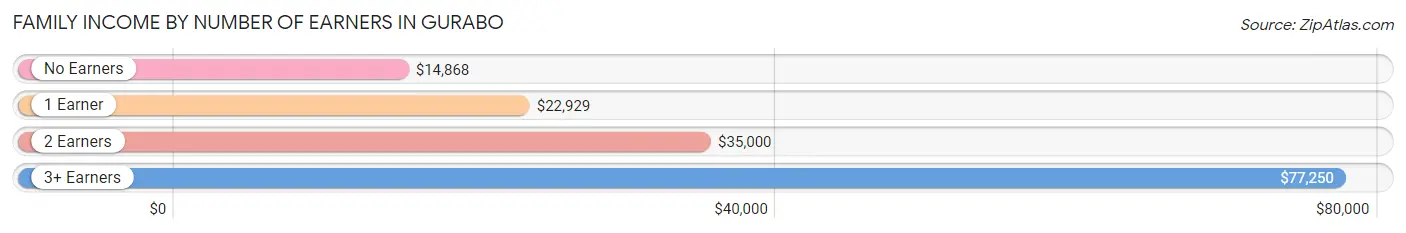
| Number of Earners | # Families | Median Income |
| No Earners | 508 (27.8%) | $14,868 |
| 1 Earner | 802 (43.9%) | $22,929 |
| 2 Earners | 452 (24.7%) | $35,000 |
| 3+ Earners | 66 (3.6%) | $77,250 |
| Total | 1,828 (100.0%) | $24,583 |
Household Income in Gurabo
Household Income Brackets in Gurabo
With 681 households falling in the category, the less than $10,000 income range is the most frequent in Gurabo, accounting for 24.4% of all households.
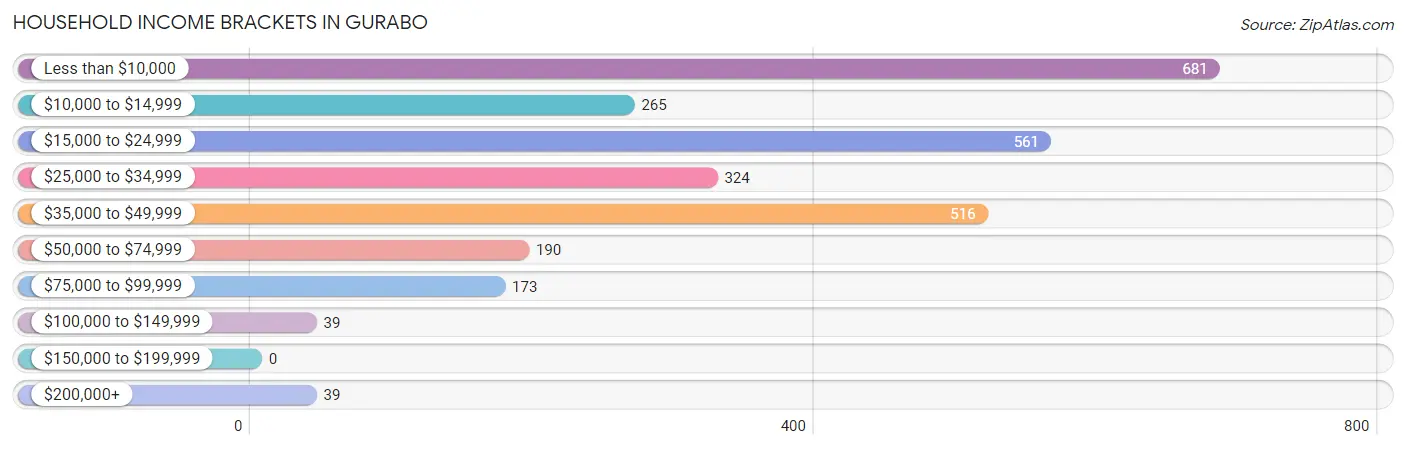
| Income Bracket | # Households | % Households |
| Less than $10,000 | 681 | 24.4% |
| $10,000 to $14,999 | 265 | 9.5% |
| $15,000 to $24,999 | 561 | 20.1% |
| $25,000 to $34,999 | 324 | 11.6% |
| $35,000 to $49,999 | 516 | 18.5% |
| $50,000 to $74,999 | 190 | 6.8% |
| $75,000 to $99,999 | 173 | 6.2% |
| $100,000 to $149,999 | 39 | 1.4% |
| $150,000 to $199,999 | 0 | 0.0% |
| $200,000+ | 39 | 1.4% |
Household Income by Householder Age in Gurabo
The median household income in Gurabo is $22,153, with the highest median household income of $33,333 found in the 25 to 44 years age bracket for the primary householder. A total of 778 households (27.9%) fall into this category. Meanwhile, the 15 to 24 years age bracket for the primary householder has the lowest median household income of $0, with 56 households (2.0%) in this group.
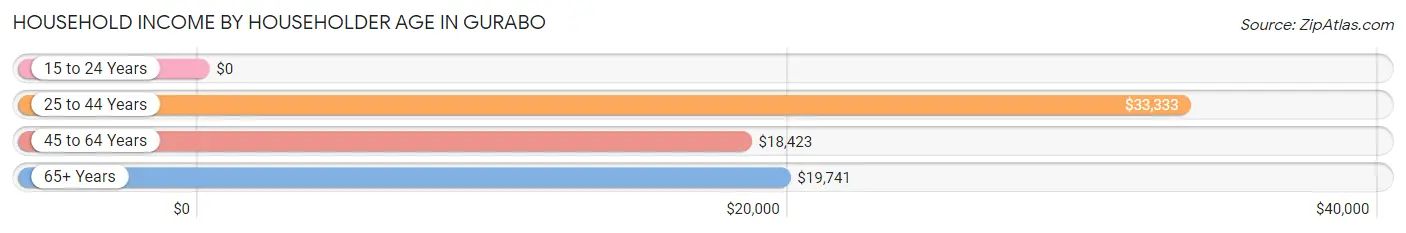
| Income Bracket | # Households | Median Income |
| 15 to 24 Years | 56 (2.0%) | $0 |
| 25 to 44 Years | 778 (27.9%) | $33,333 |
| 45 to 64 Years | 1,202 (43.1%) | $18,423 |
| 65+ Years | 755 (27.1%) | $19,741 |
| Total | 2,791 (100.0%) | $22,153 |
Poverty in Gurabo
Income Below Poverty by Sex and Age in Gurabo
With 42.4% poverty level for males and 55.7% for females among the residents of Gurabo, 6 to 11 year old males and 15 year old females are the most vulnerable to poverty, with 104 males (83.9%) and 42 females (100.0%) in their respective age groups living below the poverty level.
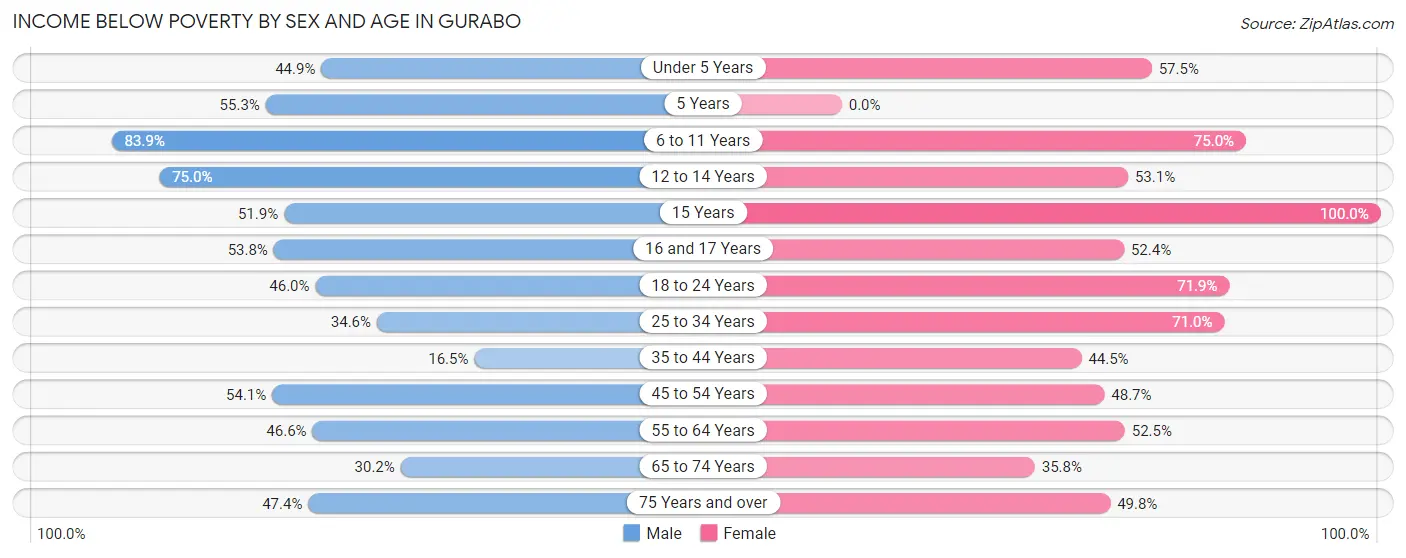
| Age Bracket | Male | Female |
| Under 5 Years | 40 (44.9%) | 42 (57.5%) |
| 5 Years | 21 (55.3%) | 0 (0.0%) |
| 6 to 11 Years | 104 (83.9%) | 186 (75.0%) |
| 12 to 14 Years | 111 (75.0%) | 34 (53.1%) |
| 15 Years | 14 (51.8%) | 42 (100.0%) |
| 16 and 17 Years | 50 (53.8%) | 77 (52.4%) |
| 18 to 24 Years | 238 (46.0%) | 228 (71.9%) |
| 25 to 34 Years | 189 (34.6%) | 311 (71.0%) |
| 35 to 44 Years | 78 (16.5%) | 141 (44.5%) |
| 45 to 54 Years | 193 (54.1%) | 291 (48.7%) |
| 55 to 64 Years | 204 (46.6%) | 353 (52.5%) |
| 65 to 74 Years | 113 (30.2%) | 110 (35.8%) |
| 75 Years and over | 107 (47.3%) | 140 (49.8%) |
| Total | 1,462 (42.4%) | 1,955 (55.7%) |
Income Above Poverty by Sex and Age in Gurabo
According to the poverty statistics in Gurabo, males aged 35 to 44 years and females aged 5 years are the age groups that are most secure financially, with 83.5% of males and 100.0% of females in these age groups living above the poverty line.
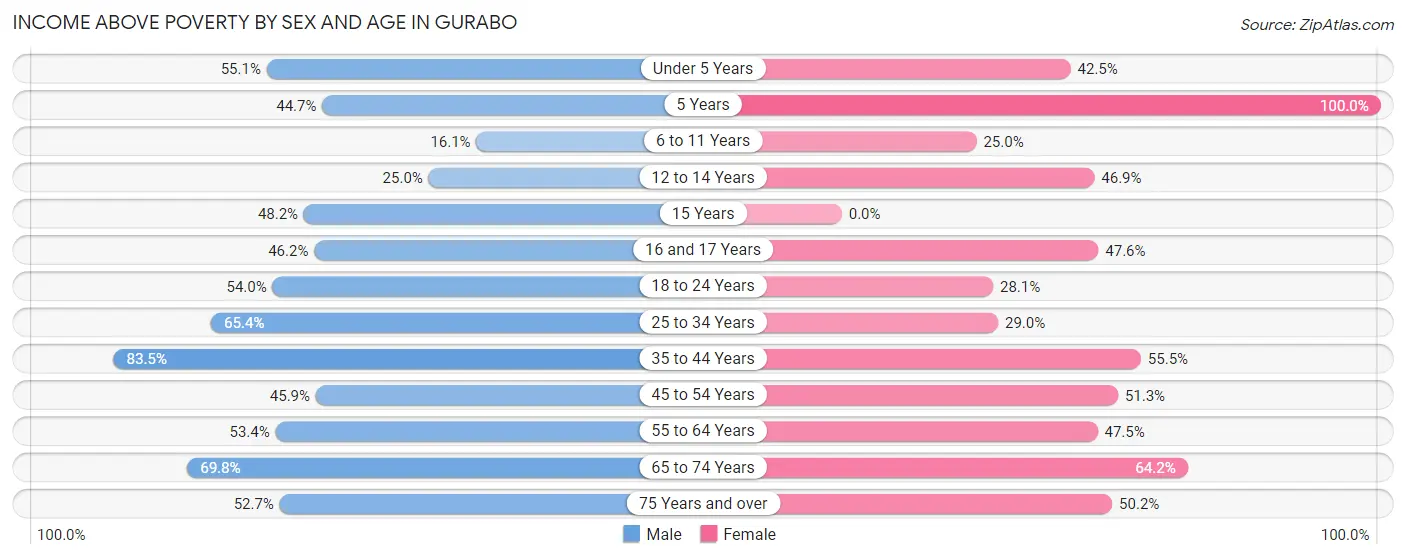
| Age Bracket | Male | Female |
| Under 5 Years | 49 (55.1%) | 31 (42.5%) |
| 5 Years | 17 (44.7%) | 7 (100.0%) |
| 6 to 11 Years | 20 (16.1%) | 62 (25.0%) |
| 12 to 14 Years | 37 (25.0%) | 30 (46.9%) |
| 15 Years | 13 (48.1%) | 0 (0.0%) |
| 16 and 17 Years | 43 (46.2%) | 70 (47.6%) |
| 18 to 24 Years | 279 (54.0%) | 89 (28.1%) |
| 25 to 34 Years | 357 (65.4%) | 127 (29.0%) |
| 35 to 44 Years | 394 (83.5%) | 176 (55.5%) |
| 45 to 54 Years | 164 (45.9%) | 306 (51.3%) |
| 55 to 64 Years | 234 (53.4%) | 319 (47.5%) |
| 65 to 74 Years | 261 (69.8%) | 197 (64.2%) |
| 75 Years and over | 119 (52.6%) | 141 (50.2%) |
| Total | 1,987 (57.6%) | 1,555 (44.3%) |
Income Below Poverty Among Married-Couple Families in Gurabo
The poverty statistics for married-couple families in Gurabo show that 34.2% or 235 of the total 687 families live below the poverty line. Families with 1 or 2 children have the highest poverty rate of 51.6%, comprising of 82 families. On the other hand, families with no children have the lowest poverty rate of 29.0%, which includes 153 families.
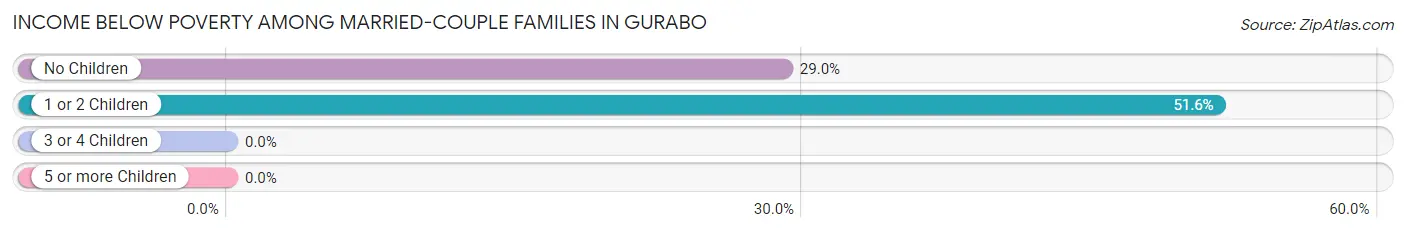
| Children | Above Poverty | Below Poverty |
| No Children | 375 (71.0%) | 153 (29.0%) |
| 1 or 2 Children | 77 (48.4%) | 82 (51.6%) |
| 3 or 4 Children | 0 (0.0%) | 0 (0.0%) |
| 5 or more Children | 0 (0.0%) | 0 (0.0%) |
| Total | 452 (65.8%) | 235 (34.2%) |
Income Below Poverty Among Single-Parent Households in Gurabo
According to the poverty data in Gurabo, 49.4% or 162 single-father households and 58.6% or 476 single-mother households are living below the poverty line. Among single-father households, those with 3 or 4 children have the highest poverty rate, with 18 households (100.0%) experiencing poverty. Likewise, among single-mother households, those with 3 or 4 children have the highest poverty rate, with 40 households (100.0%) falling below the poverty line.
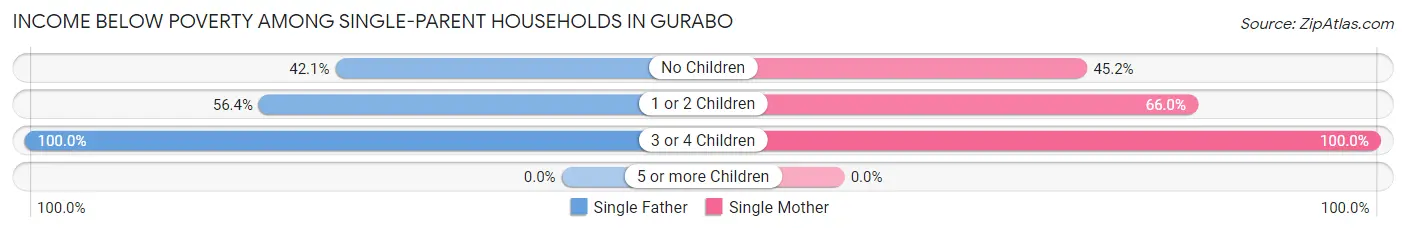
| Children | Single Father | Single Mother |
| No Children | 91 (42.1%) | 161 (45.2%) |
| 1 or 2 Children | 53 (56.4%) | 275 (65.9%) |
| 3 or 4 Children | 18 (100.0%) | 40 (100.0%) |
| 5 or more Children | 0 (0.0%) | 0 (0.0%) |
| Total | 162 (49.4%) | 476 (58.6%) |
Income Below Poverty Among Married-Couple vs Single-Parent Households in Gurabo
The poverty data for Gurabo shows that 235 of the married-couple family households (34.2%) and 638 of the single-parent households (55.9%) are living below the poverty level. Within the married-couple family households, those with 1 or 2 children have the highest poverty rate, with 82 households (51.6%) falling below the poverty line. Among the single-parent households, those with 3 or 4 children have the highest poverty rate, with 58 household (100.0%) living below poverty.
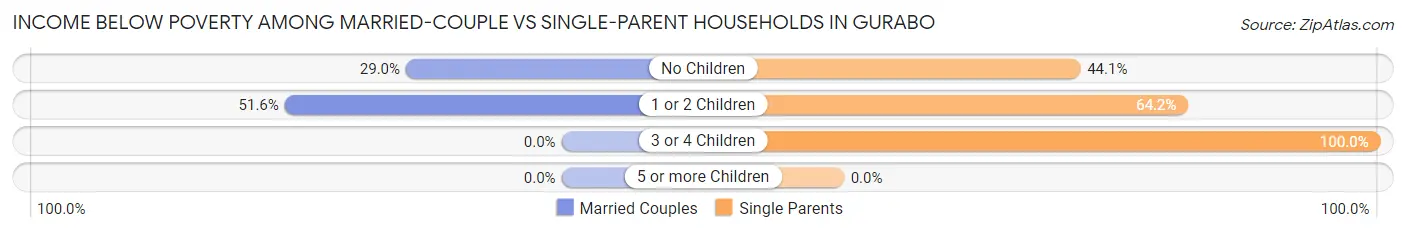
| Children | Married-Couple Families | Single-Parent Households |
| No Children | 153 (29.0%) | 252 (44.1%) |
| 1 or 2 Children | 82 (51.6%) | 328 (64.2%) |
| 3 or 4 Children | 0 (0.0%) | 58 (100.0%) |
| 5 or more Children | 0 (0.0%) | 0 (0.0%) |
| Total | 235 (34.2%) | 638 (55.9%) |
Race in Gurabo
The most populous races in Gurabo are Hispanic or Latino (6,773 | 97.2%), White / Caucasian (3,004 | 43.1%), and Some other Race (1,898 | 27.3%).
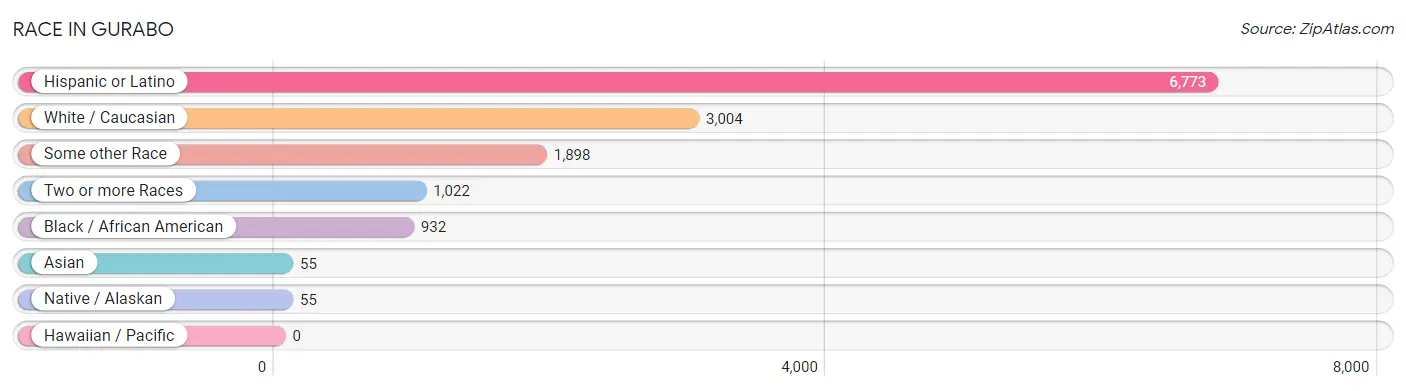
| Race | # Population | % Population |
| Asian | 55 | 0.8% |
| Black / African American | 932 | 13.4% |
| Hawaiian / Pacific | 0 | 0.0% |
| Hispanic or Latino | 6,773 | 97.2% |
| Native / Alaskan | 55 | 0.8% |
| White / Caucasian | 3,004 | 43.1% |
| Two or more Races | 1,022 | 14.7% |
| Some other Race | 1,898 | 27.3% |
| Total | 6,966 | 100.0% |
Ancestry in Gurabo
The most populous ancestries reported in Gurabo are Puerto Rican (6,675 | 95.8%), American (226 | 3.2%), African (37 | 0.5%), Subsaharan African (37 | 0.5%), and Indian (Asian) (34 | 0.5%), together accounting for 100.6% of all Gurabo residents.
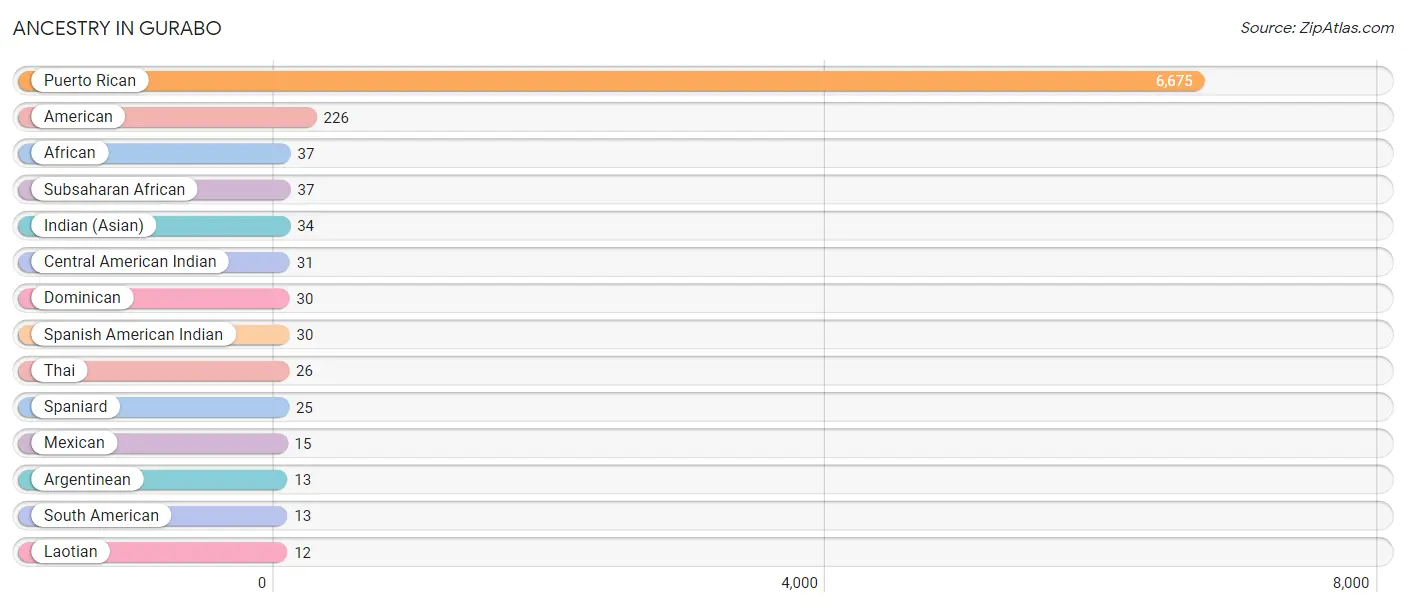
| Ancestry | # Population | % Population |
| African | 37 | 0.5% |
| American | 226 | 3.2% |
| Argentinean | 13 | 0.2% |
| Central American Indian | 31 | 0.4% |
| Dominican | 30 | 0.4% |
| Indian (Asian) | 34 | 0.5% |
| Laotian | 12 | 0.2% |
| Mexican | 15 | 0.2% |
| Puerto Rican | 6,675 | 95.8% |
| South American | 13 | 0.2% |
| Spaniard | 25 | 0.4% |
| Spanish American Indian | 30 | 0.4% |
| Subsaharan African | 37 | 0.5% |
| Thai | 26 | 0.4% | View All 14 Rows |
Immigrants in Gurabo

| Immigration Origin | # Population | % Population | View All 0 Rows |
Sex and Age in Gurabo
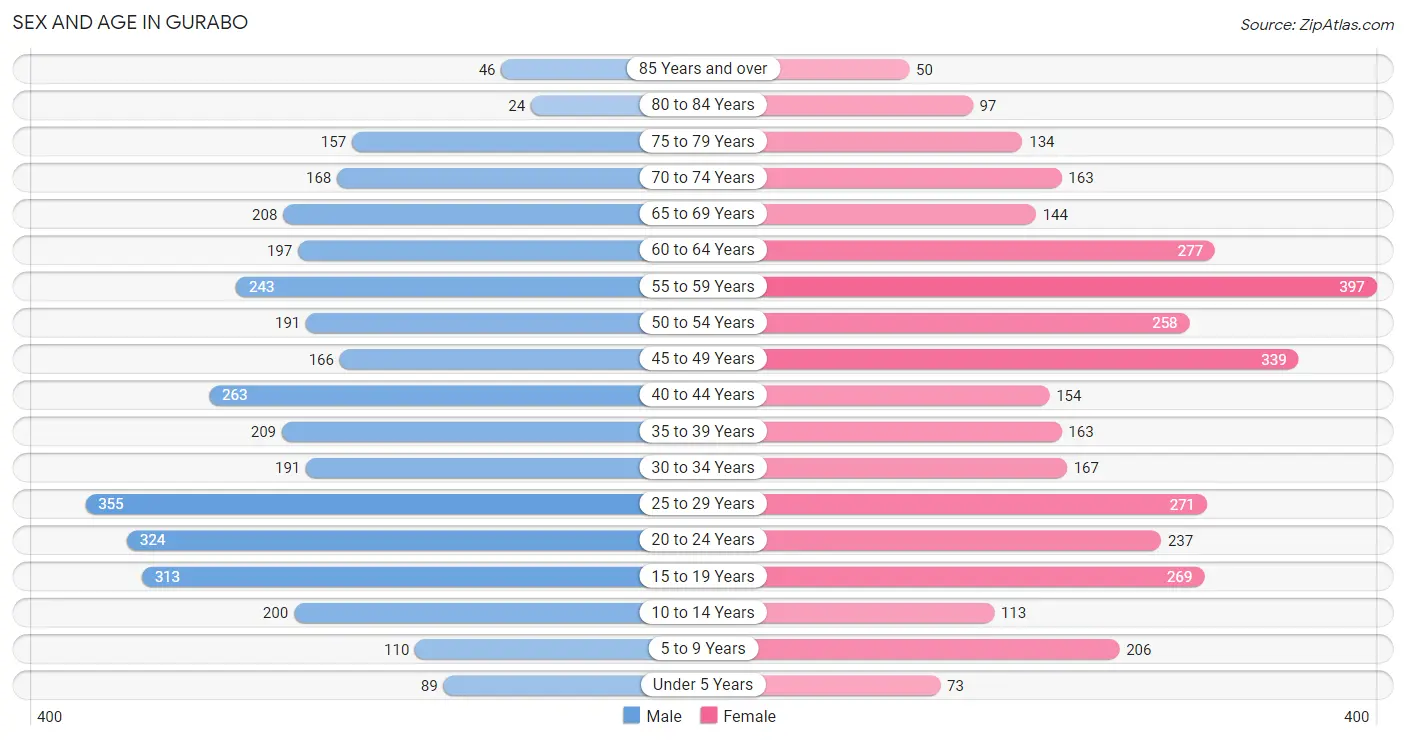
Sex and Age in Gurabo
The most populous age groups in Gurabo are 25 to 29 Years (355 | 10.3%) for men and 55 to 59 Years (397 | 11.3%) for women.
| Age Bracket | Male | Female |
| Under 5 Years | 89 (2.6%) | 73 (2.1%) |
| 5 to 9 Years | 110 (3.2%) | 206 (5.9%) |
| 10 to 14 Years | 200 (5.8%) | 113 (3.2%) |
| 15 to 19 Years | 313 (9.1%) | 269 (7.7%) |
| 20 to 24 Years | 324 (9.4%) | 237 (6.8%) |
| 25 to 29 Years | 355 (10.3%) | 271 (7.7%) |
| 30 to 34 Years | 191 (5.5%) | 167 (4.8%) |
| 35 to 39 Years | 209 (6.0%) | 163 (4.6%) |
| 40 to 44 Years | 263 (7.6%) | 154 (4.4%) |
| 45 to 49 Years | 166 (4.8%) | 339 (9.7%) |
| 50 to 54 Years | 191 (5.5%) | 258 (7.3%) |
| 55 to 59 Years | 243 (7.0%) | 397 (11.3%) |
| 60 to 64 Years | 197 (5.7%) | 277 (7.9%) |
| 65 to 69 Years | 208 (6.0%) | 144 (4.1%) |
| 70 to 74 Years | 168 (4.9%) | 163 (4.6%) |
| 75 to 79 Years | 157 (4.5%) | 134 (3.8%) |
| 80 to 84 Years | 24 (0.7%) | 97 (2.8%) |
| 85 Years and over | 46 (1.3%) | 50 (1.4%) |
| Total | 3,454 (100.0%) | 3,512 (100.0%) |
Families and Households in Gurabo
Median Family Size in Gurabo
The median family size in Gurabo is 2.97 persons per family, with single female/mother families (813 | 44.5%) accounting for the largest median family size of 3.06 persons per family. On the other hand, married-couple families (687 | 37.6%) represent the smallest median family size with 2.90 persons per family.
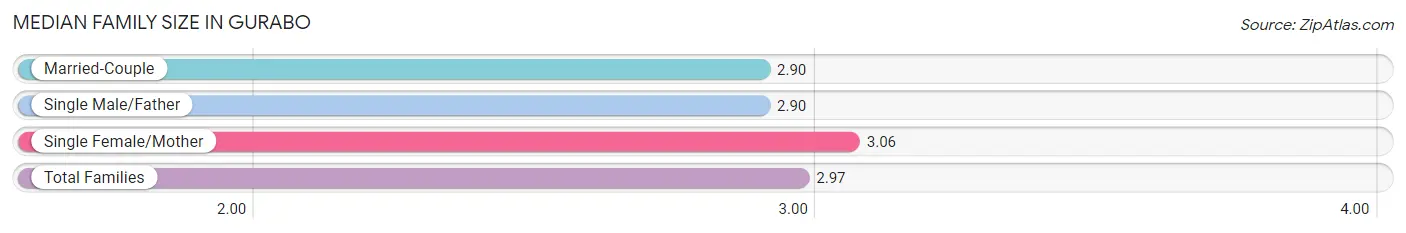
| Family Type | # Families | Family Size |
| Married-Couple | 687 (37.6%) | 2.90 |
| Single Male/Father | 328 (17.9%) | 2.90 |
| Single Female/Mother | 813 (44.5%) | 3.06 |
| Total Families | 1,828 (100.0%) | 2.97 |
Median Household Size in Gurabo
The median household size in Gurabo is 2.47 persons per household, with single male/father households (328 | 11.7%) accounting for the largest median household size of 3.47 persons per household. non-family households (963 | 34.5%) represent the smallest median household size with 1.16 persons per household.
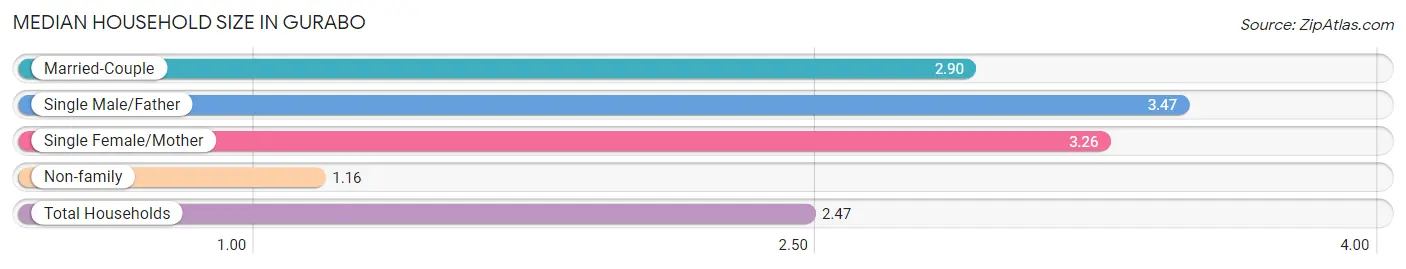
| Household Type | # Households | Household Size |
| Married-Couple | 687 (24.6%) | 2.90 |
| Single Male/Father | 328 (11.7%) | 3.47 |
| Single Female/Mother | 813 (29.1%) | 3.26 |
| Non-family | 963 (34.5%) | 1.16 |
| Total Households | 2,791 (100.0%) | 2.47 |
Household Size by Marriage Status in Gurabo
Out of a total of 2,791 households in Gurabo, 1,828 (65.5%) are family households, while 963 (34.5%) are nonfamily households. The most numerous type of family households are 2-person households, comprising 912, and the most common type of nonfamily households are 1-person households, comprising 834.
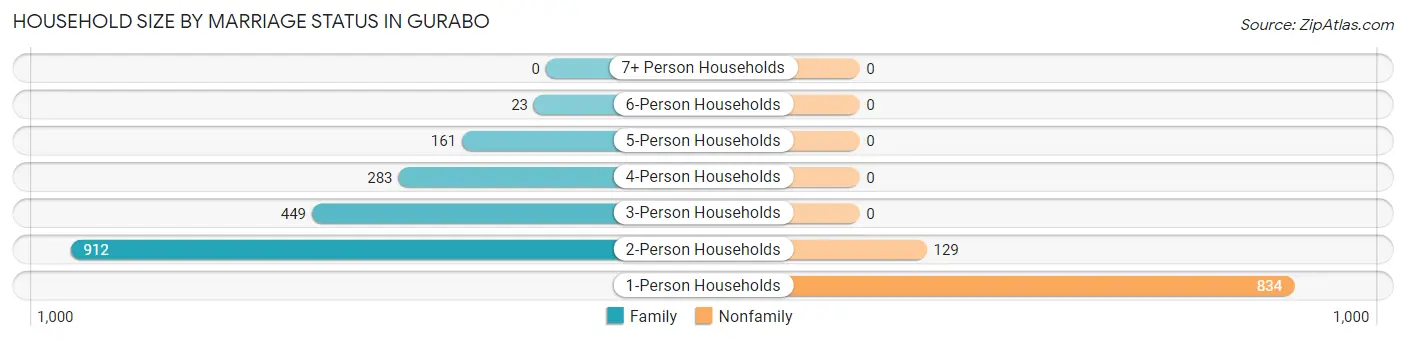
| Household Size | Family Households | Nonfamily Households |
| 1-Person Households | - | 834 (29.9%) |
| 2-Person Households | 912 (32.7%) | 129 (4.6%) |
| 3-Person Households | 449 (16.1%) | 0 (0.0%) |
| 4-Person Households | 283 (10.1%) | 0 (0.0%) |
| 5-Person Households | 161 (5.8%) | 0 (0.0%) |
| 6-Person Households | 23 (0.8%) | 0 (0.0%) |
| 7+ Person Households | 0 (0.0%) | 0 (0.0%) |
| Total | 1,828 (65.5%) | 963 (34.5%) |
Female Fertility in Gurabo
Fertility by Age in Gurabo
| Age Bracket | Women with Births | Births / 1,000 Women |
| 15 to 19 years | 0 (0.0%) | 0.0 |
| 20 to 34 years | 0 (0.0%) | 0.0 |
| 35 to 50 years | 0 (0.0%) | 0.0 |
| Total | 0 (0.0%) | 0.0 |
Fertility by Age by Marriage Status in Gurabo
| Age Bracket | Married | Unmarried |
| 15 to 19 years | 0 (0.0%) | 0 (0.0%) |
| 20 to 34 years | 0 (0.0%) | 0 (0.0%) |
| 35 to 50 years | 0 (0.0%) | 0 (0.0%) |
| Total | 0 (0.0%) | 0 (0.0%) |
Fertility by Education in Gurabo
| Educational Attainment | Women with Births | Births / 1,000 Women |
| Less than High School | 0 (0.0%) | 0.0 |
| High School Diploma | 0 (0.0%) | 0.0 |
| College or Associate's Degree | 0 (0.0%) | 0.0 |
| Bachelor's Degree | 0 (0.0%) | 0.0 |
| Graduate Degree | 0 (0.0%) | 0.0 |
| Total | 0 (0.0%) | 0.0 |
Fertility by Education by Marriage Status in Gurabo
| Educational Attainment | Married | Unmarried |
| Less than High School | 0 (0.0%) | 0 (0.0%) |
| High School Diploma | 0 (0.0%) | 0 (0.0%) |
| College or Associate's Degree | 0 (0.0%) | 0 (0.0%) |
| Bachelor's Degree | 0 (0.0%) | 0 (0.0%) |
| Graduate Degree | 0 (0.0%) | 0 (0.0%) |
| Total | 0 (0.0%) | 0 (0.0%) |
Employment Characteristics in Gurabo
Employment by Class of Employer in Gurabo
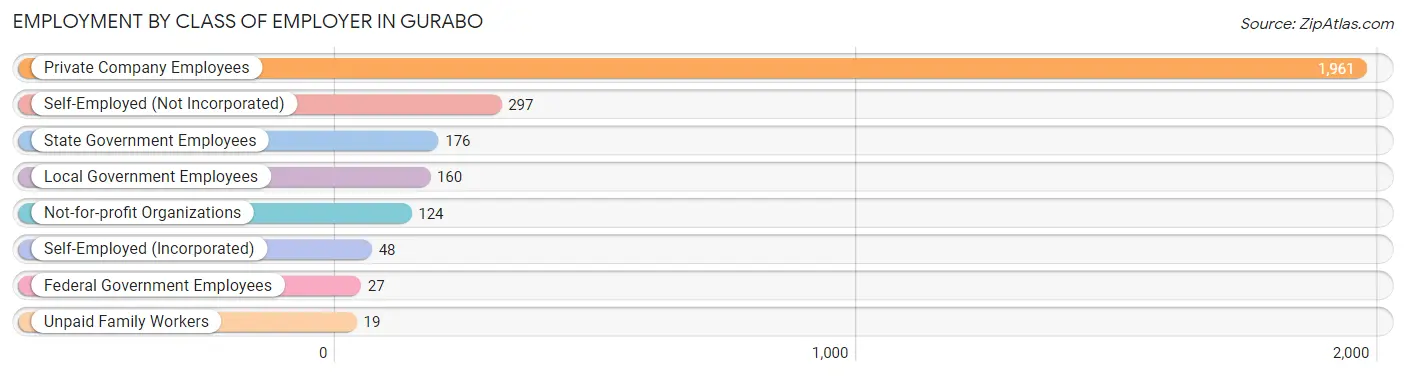
Among the 2,812 employed individuals in Gurabo, private company employees (1,961 | 69.7%), self-employed (not incorporated) (297 | 10.6%), and state government employees (176 | 6.3%) make up the most common classes of employment.
| Employer Class | # Employees | % Employees |
| Private Company Employees | 1,961 | 69.7% |
| Self-Employed (Incorporated) | 48 | 1.7% |
| Self-Employed (Not Incorporated) | 297 | 10.6% |
| Not-for-profit Organizations | 124 | 4.4% |
| Local Government Employees | 160 | 5.7% |
| State Government Employees | 176 | 6.3% |
| Federal Government Employees | 27 | 1.0% |
| Unpaid Family Workers | 19 | 0.7% |
| Total | 2,812 | 100.0% |
Employment Status by Age in Gurabo
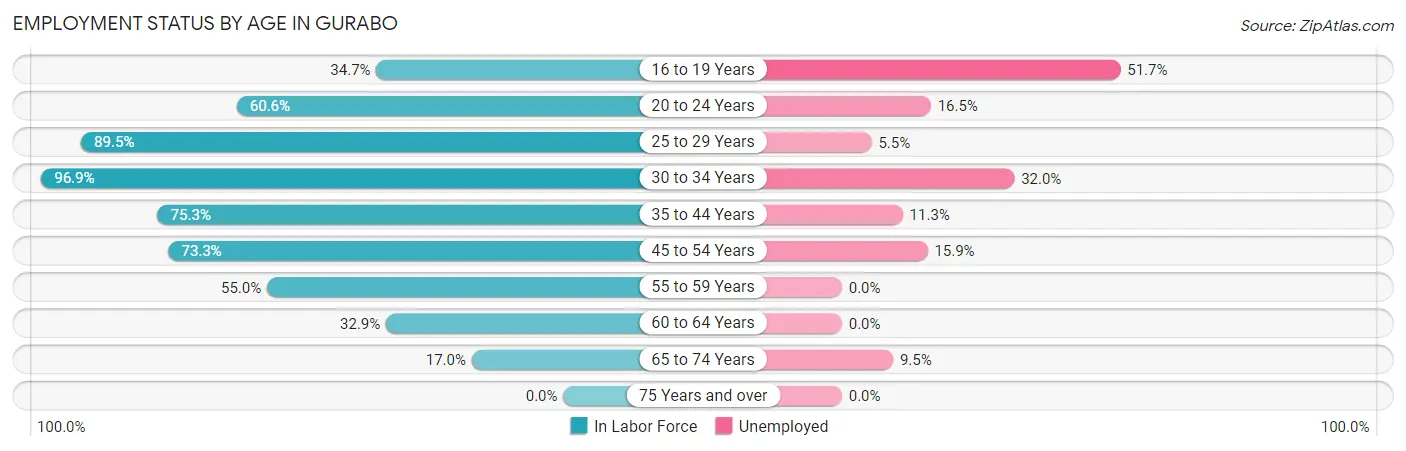
According to the labor force statistics for Gurabo, out of the total population over 16 years of age (6,106), 54.7% or 3,340 individuals are in the labor force, with 14.3% or 478 of them unemployed. The age group with the highest labor force participation rate is 30 to 34 years, with 96.9% or 347 individuals in the labor force. Within the labor force, the 16 to 19 years age range has the highest percentage of unemployed individuals, with 51.7% or 92 of them being unemployed.
| Age Bracket | In Labor Force | Unemployed |
| 16 to 19 Years | 178 (34.7%) | 92 (51.7%) |
| 20 to 24 Years | 340 (60.6%) | 56 (16.5%) |
| 25 to 29 Years | 560 (89.5%) | 31 (5.5%) |
| 30 to 34 Years | 347 (96.9%) | 111 (32.0%) |
| 35 to 44 Years | 594 (75.3%) | 67 (11.3%) |
| 45 to 54 Years | 699 (73.3%) | 111 (15.9%) |
| 55 to 59 Years | 352 (55.0%) | 0 (0.0%) |
| 60 to 64 Years | 156 (32.9%) | 0 (0.0%) |
| 65 to 74 Years | 116 (17.0%) | 11 (9.5%) |
| 75 Years and over | 0 (0.0%) | 0 (0.0%) |
| Total | 3,340 (54.7%) | 478 (14.3%) |
Employment Status by Educational Attainment in Gurabo
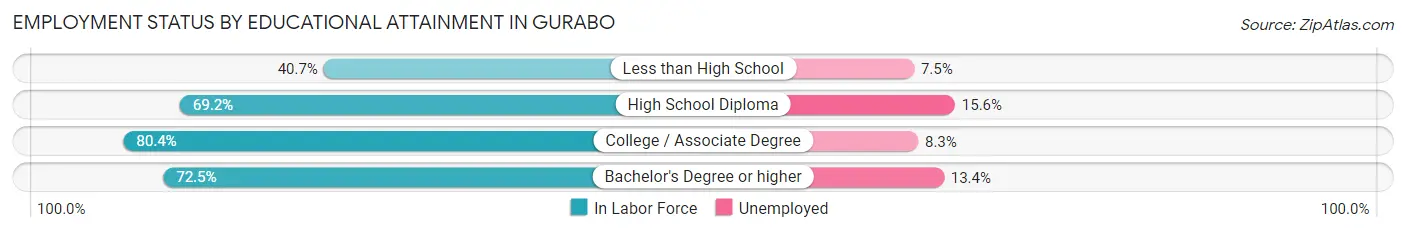
According to labor force statistics for Gurabo, 70.5% of individuals (2,708) out of the total population between 25 and 64 years of age (3,841) are in the labor force, with 11.8% or 320 of them being unemployed. The group with the highest labor force participation rate are those with the educational attainment of college / associate degree, with 80.4% or 1,019 individuals in the labor force. Within the labor force, individuals with high school diploma education have the highest percentage of unemployment, with 15.6% or 135 of them being unemployed.
| Educational Attainment | In Labor Force | Unemployed |
| Less than High School | 174 (40.7%) | 32 (7.5%) |
| High School Diploma | 866 (69.2%) | 195 (15.6%) |
| College / Associate Degree | 1,019 (80.4%) | 105 (8.3%) |
| Bachelor's Degree or higher | 648 (72.5%) | 120 (13.4%) |
| Total | 2,708 (70.5%) | 453 (11.8%) |
Employment Occupations by Sex in Gurabo
Management, Business, Science and Arts Occupations
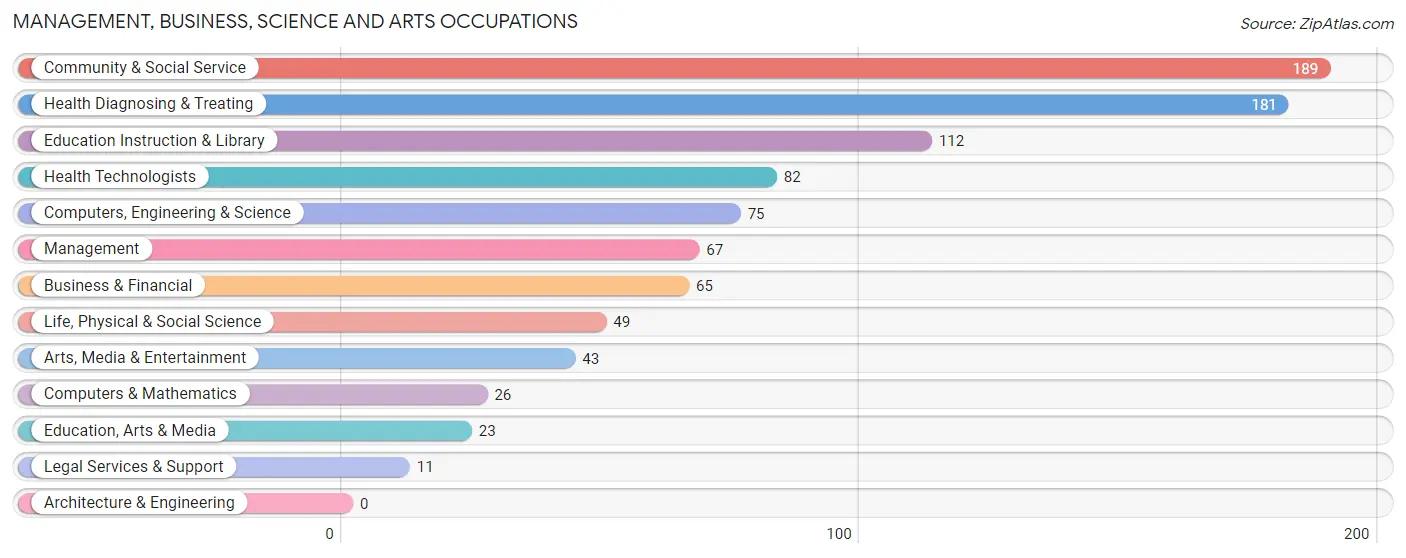
The most common Management, Business, Science and Arts occupations in Gurabo are Community & Social Service (189 | 6.6%), Health Diagnosing & Treating (181 | 6.3%), Education Instruction & Library (112 | 3.9%), Health Technologists (82 | 2.9%), and Computers, Engineering & Science (75 | 2.6%).
Management, Business, Science and Arts Occupations by Sex
Within the Management, Business, Science and Arts occupations in Gurabo, the most male-oriented occupations are Computers & Mathematics (100.0%), Education, Arts & Media (100.0%), and Computers, Engineering & Science (69.3%), while the most female-oriented occupations are Legal Services & Support (100.0%), Arts, Media & Entertainment (100.0%), and Education Instruction & Library (83.0%).
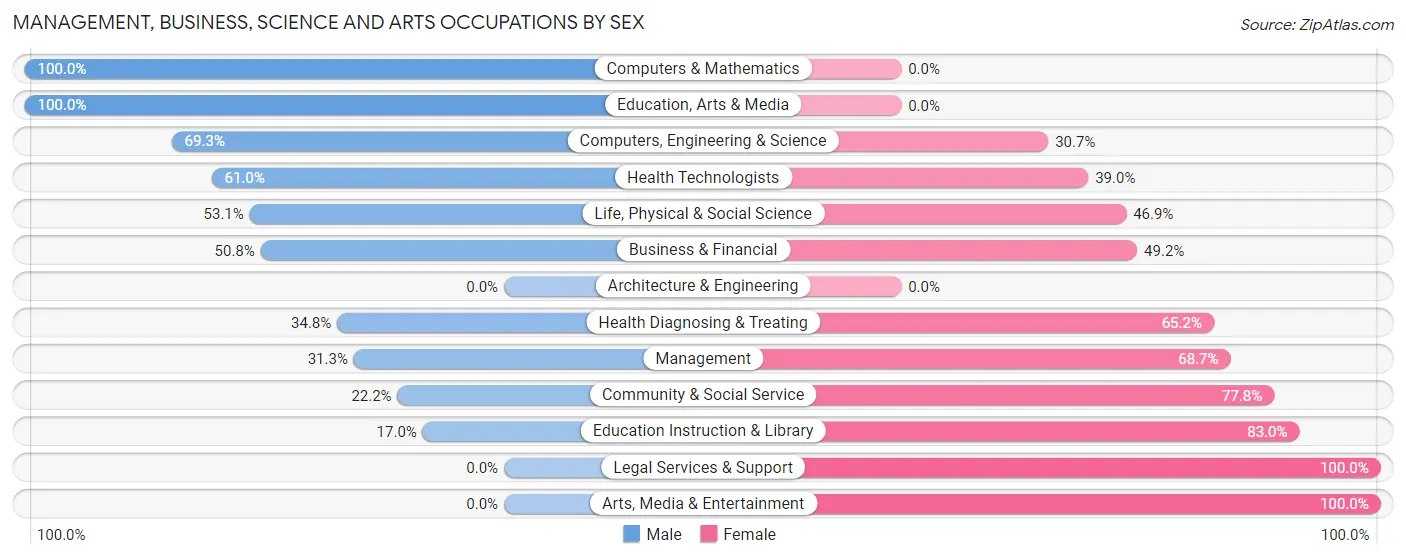
| Occupation | Male | Female |
| Management | 21 (31.3%) | 46 (68.7%) |
| Business & Financial | 33 (50.8%) | 32 (49.2%) |
| Computers, Engineering & Science | 52 (69.3%) | 23 (30.7%) |
| Computers & Mathematics | 26 (100.0%) | 0 (0.0%) |
| Architecture & Engineering | 0 (0.0%) | 0 (0.0%) |
| Life, Physical & Social Science | 26 (53.1%) | 23 (46.9%) |
| Community & Social Service | 42 (22.2%) | 147 (77.8%) |
| Education, Arts & Media | 23 (100.0%) | 0 (0.0%) |
| Legal Services & Support | 0 (0.0%) | 11 (100.0%) |
| Education Instruction & Library | 19 (17.0%) | 93 (83.0%) |
| Arts, Media & Entertainment | 0 (0.0%) | 43 (100.0%) |
| Health Diagnosing & Treating | 63 (34.8%) | 118 (65.2%) |
| Health Technologists | 50 (61.0%) | 32 (39.0%) |
| Total (Category) | 211 (36.6%) | 366 (63.4%) |
| Total (Overall) | 1,657 (57.9%) | 1,206 (42.1%) |
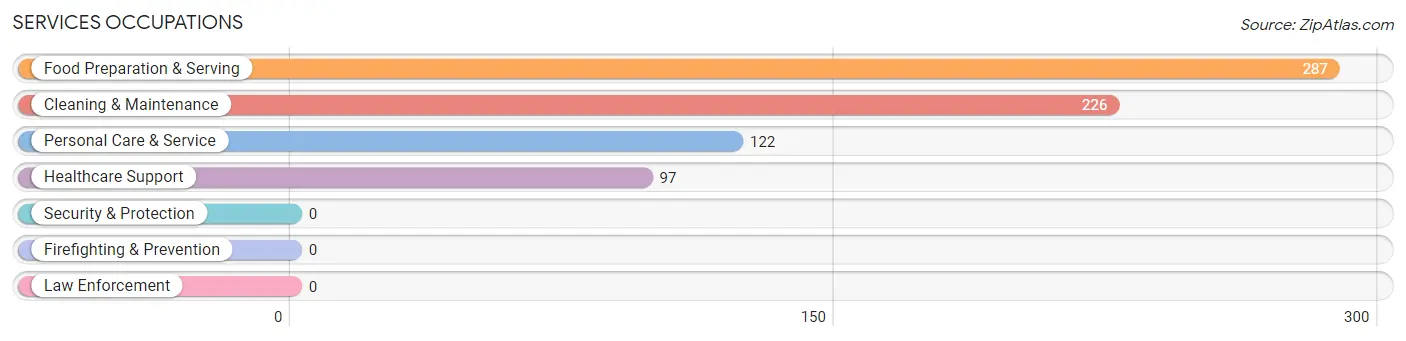
Services Occupations
The most common Services occupations in Gurabo are Food Preparation & Serving (287 | 10.0%), Cleaning & Maintenance (226 | 7.9%), Personal Care & Service (122 | 4.3%), and Healthcare Support (97 | 3.4%).
Services Occupations by Sex
Within the Services occupations in Gurabo, the most male-oriented occupations are Cleaning & Maintenance (84.5%), Personal Care & Service (57.4%), and Food Preparation & Serving (47.7%), while the most female-oriented occupations are Healthcare Support (82.5%), Food Preparation & Serving (52.3%), and Personal Care & Service (42.6%).
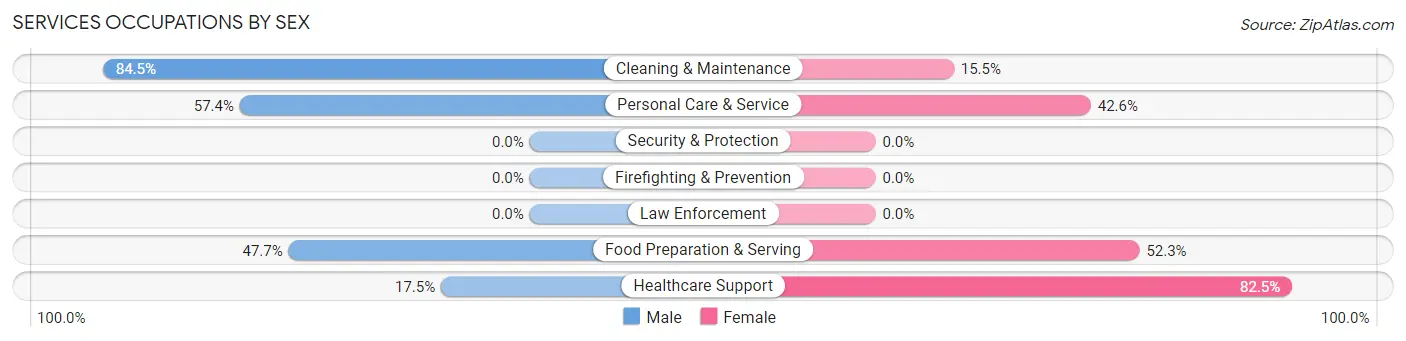
| Occupation | Male | Female |
| Healthcare Support | 17 (17.5%) | 80 (82.5%) |
| Security & Protection | 0 (0.0%) | 0 (0.0%) |
| Firefighting & Prevention | 0 (0.0%) | 0 (0.0%) |
| Law Enforcement | 0 (0.0%) | 0 (0.0%) |
| Food Preparation & Serving | 137 (47.7%) | 150 (52.3%) |
| Cleaning & Maintenance | 191 (84.5%) | 35 (15.5%) |
| Personal Care & Service | 70 (57.4%) | 52 (42.6%) |
| Total (Category) | 415 (56.7%) | 317 (43.3%) |
| Total (Overall) | 1,657 (57.9%) | 1,206 (42.1%) |
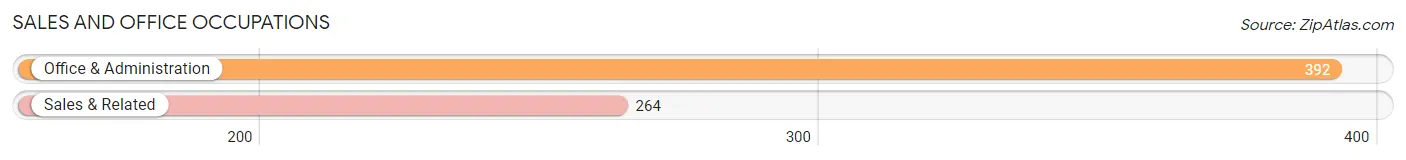
Sales and Office Occupations
The most common Sales and Office occupations in Gurabo are Office & Administration (392 | 13.7%), and Sales & Related (264 | 9.2%).
Sales and Office Occupations by Sex
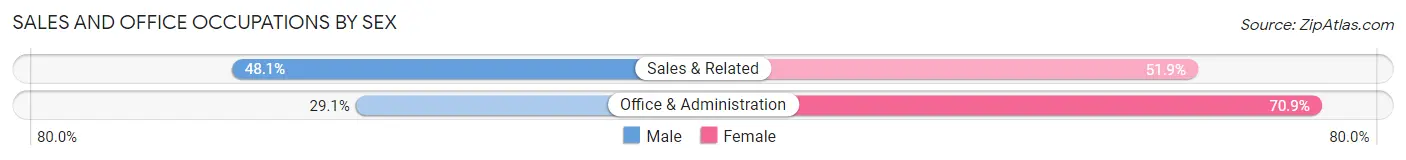
| Occupation | Male | Female |
| Sales & Related | 127 (48.1%) | 137 (51.9%) |
| Office & Administration | 114 (29.1%) | 278 (70.9%) |
| Total (Category) | 241 (36.7%) | 415 (63.3%) |
| Total (Overall) | 1,657 (57.9%) | 1,206 (42.1%) |
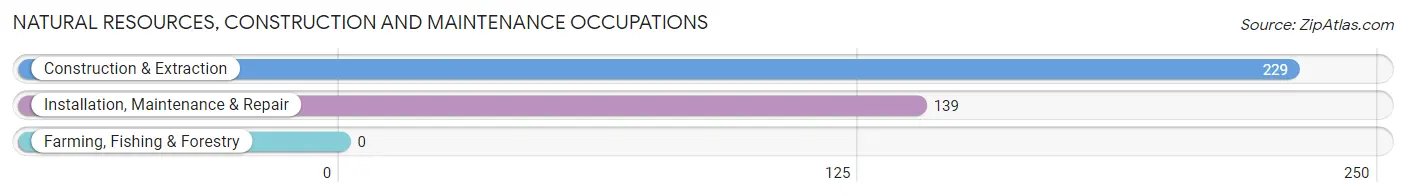
Natural Resources, Construction and Maintenance Occupations
The most common Natural Resources, Construction and Maintenance occupations in Gurabo are Construction & Extraction (229 | 8.0%), and Installation, Maintenance & Repair (139 | 4.9%).
Natural Resources, Construction and Maintenance Occupations by Sex
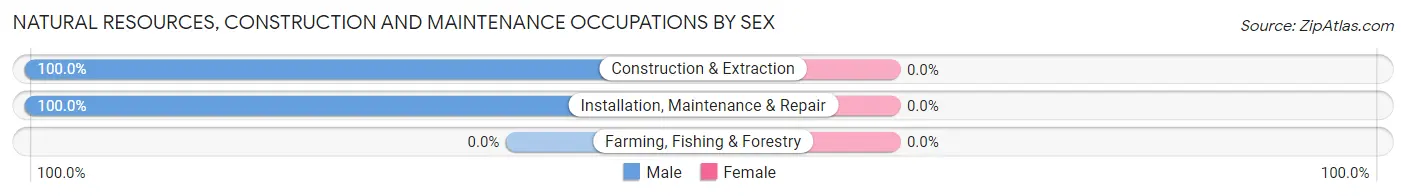
| Occupation | Male | Female |
| Farming, Fishing & Forestry | 0 (0.0%) | 0 (0.0%) |
| Construction & Extraction | 229 (100.0%) | 0 (0.0%) |
| Installation, Maintenance & Repair | 139 (100.0%) | 0 (0.0%) |
| Total (Category) | 368 (100.0%) | 0 (0.0%) |
| Total (Overall) | 1,657 (57.9%) | 1,206 (42.1%) |
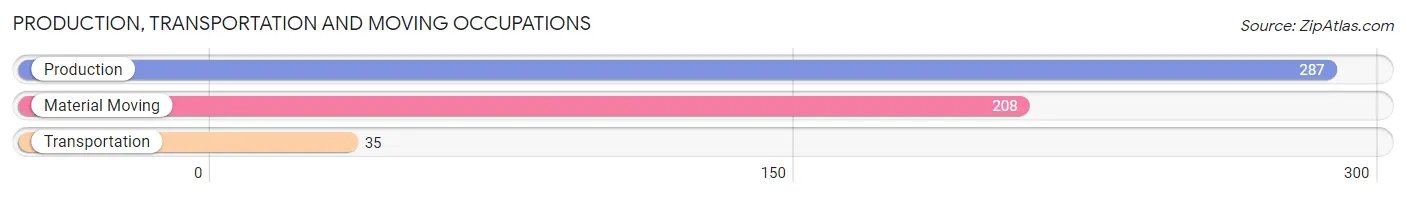
Production, Transportation and Moving Occupations
The most common Production, Transportation and Moving occupations in Gurabo are Production (287 | 10.0%), Material Moving (208 | 7.3%), and Transportation (35 | 1.2%).
Production, Transportation and Moving Occupations by Sex
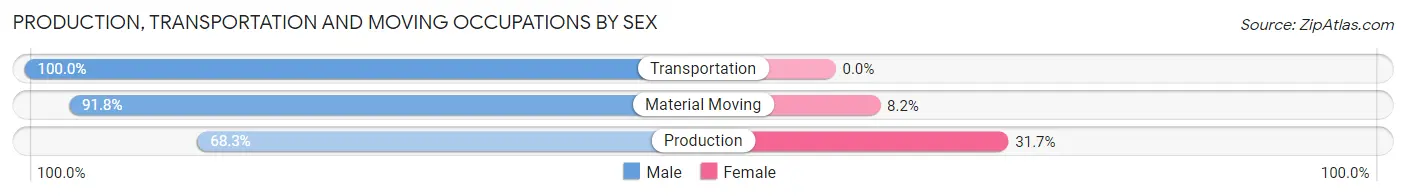
| Occupation | Male | Female |
| Production | 196 (68.3%) | 91 (31.7%) |
| Transportation | 35 (100.0%) | 0 (0.0%) |
| Material Moving | 191 (91.8%) | 17 (8.2%) |
| Total (Category) | 422 (79.6%) | 108 (20.4%) |
| Total (Overall) | 1,657 (57.9%) | 1,206 (42.1%) |
Employment Industries by Sex in Gurabo
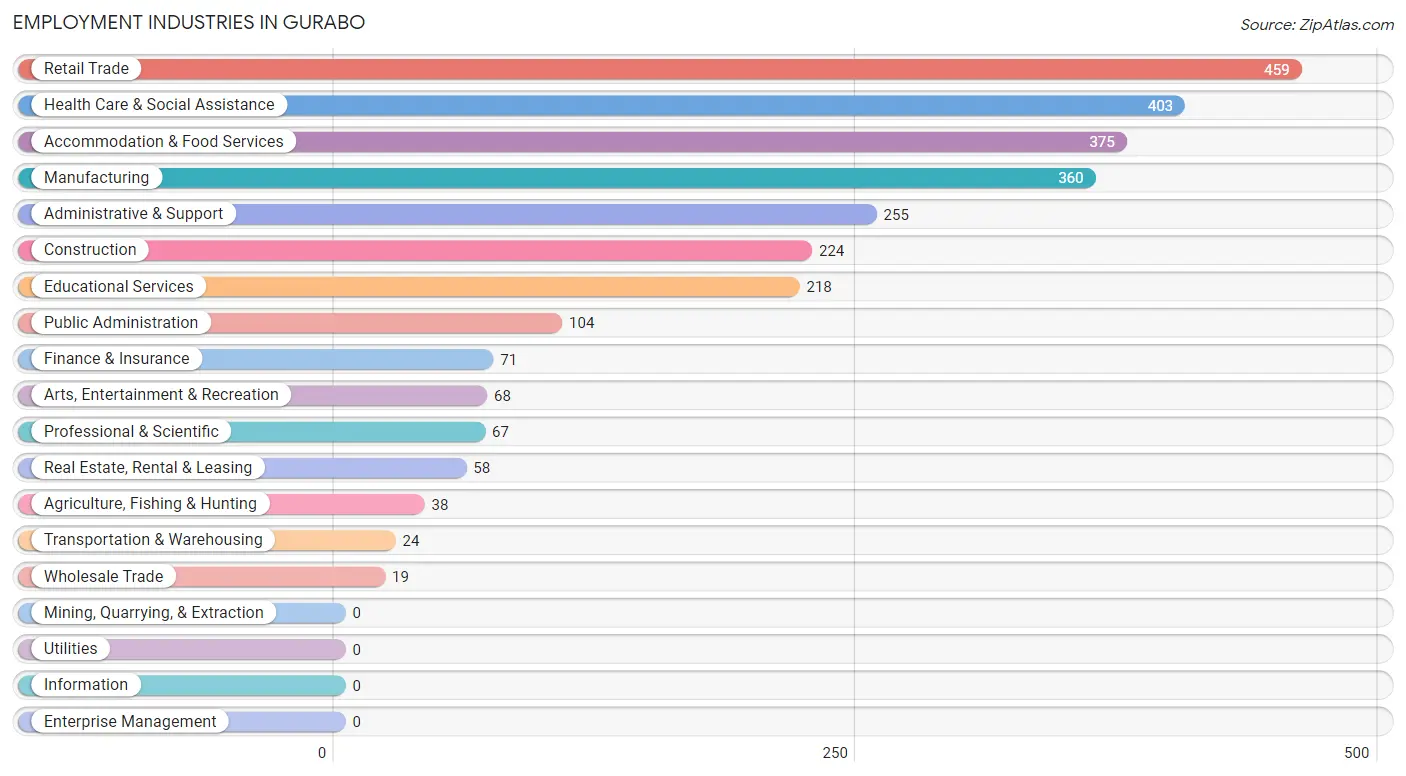
Employment Industries in Gurabo
The major employment industries in Gurabo include Retail Trade (459 | 16.0%), Health Care & Social Assistance (403 | 14.1%), Accommodation & Food Services (375 | 13.1%), Manufacturing (360 | 12.6%), and Administrative & Support (255 | 8.9%).
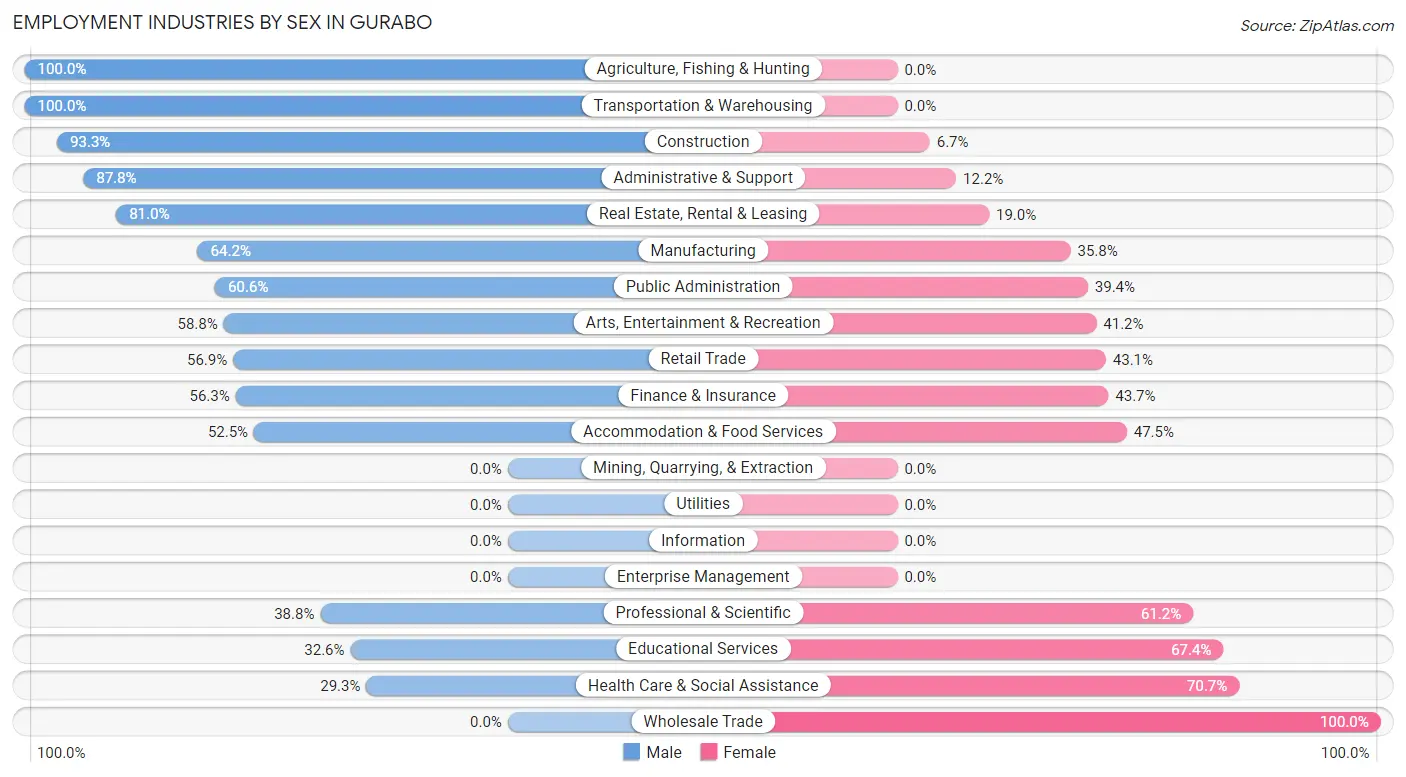
Employment Industries by Sex in Gurabo
The Gurabo industries that see more men than women are Agriculture, Fishing & Hunting (100.0%), Transportation & Warehousing (100.0%), and Construction (93.3%), whereas the industries that tend to have a higher number of women are Wholesale Trade (100.0%), Health Care & Social Assistance (70.7%), and Educational Services (67.4%).
| Industry | Male | Female |
| Agriculture, Fishing & Hunting | 38 (100.0%) | 0 (0.0%) |
| Mining, Quarrying, & Extraction | 0 (0.0%) | 0 (0.0%) |
| Construction | 209 (93.3%) | 15 (6.7%) |
| Manufacturing | 231 (64.2%) | 129 (35.8%) |
| Wholesale Trade | 0 (0.0%) | 19 (100.0%) |
| Retail Trade | 261 (56.9%) | 198 (43.1%) |
| Transportation & Warehousing | 24 (100.0%) | 0 (0.0%) |
| Utilities | 0 (0.0%) | 0 (0.0%) |
| Information | 0 (0.0%) | 0 (0.0%) |
| Finance & Insurance | 40 (56.3%) | 31 (43.7%) |
| Real Estate, Rental & Leasing | 47 (81.0%) | 11 (19.0%) |
| Professional & Scientific | 26 (38.8%) | 41 (61.2%) |
| Enterprise Management | 0 (0.0%) | 0 (0.0%) |
| Administrative & Support | 224 (87.8%) | 31 (12.2%) |
| Educational Services | 71 (32.6%) | 147 (67.4%) |
| Health Care & Social Assistance | 118 (29.3%) | 285 (70.7%) |
| Arts, Entertainment & Recreation | 40 (58.8%) | 28 (41.2%) |
| Accommodation & Food Services | 197 (52.5%) | 178 (47.5%) |
| Public Administration | 63 (60.6%) | 41 (39.4%) |
| Total | 1,657 (57.9%) | 1,206 (42.1%) |
Education in Gurabo
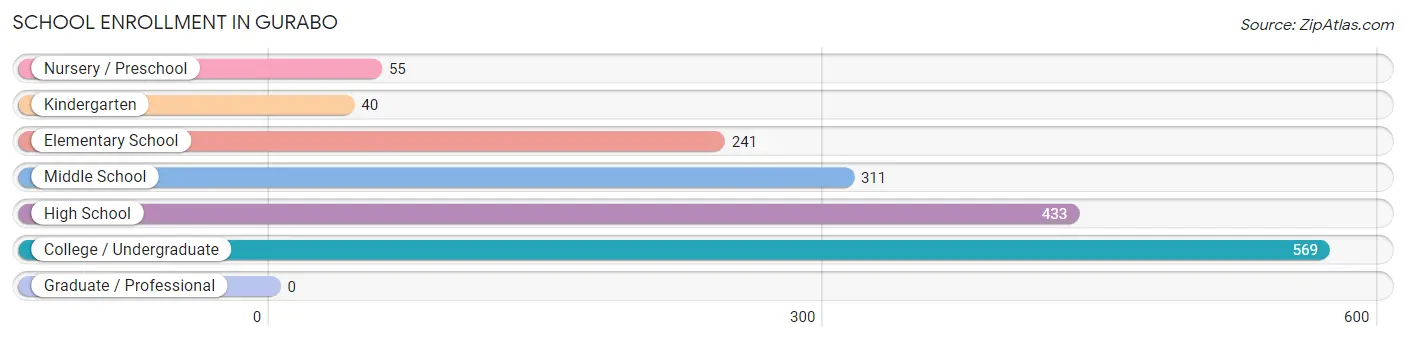
School Enrollment in Gurabo
The most common levels of schooling among the 1,649 students in Gurabo are college / undergraduate (569 | 34.5%), high school (433 | 26.3%), and middle school (311 | 18.9%).
| School Level | # Students | % Students |
| Nursery / Preschool | 55 | 3.3% |
| Kindergarten | 40 | 2.4% |
| Elementary School | 241 | 14.6% |
| Middle School | 311 | 18.9% |
| High School | 433 | 26.3% |
| College / Undergraduate | 569 | 34.5% |
| Graduate / Professional | 0 | 0.0% |
| Total | 1,649 | 100.0% |
School Enrollment by Age by Funding Source in Gurabo
Out of a total of 1,649 students who are enrolled in schools in Gurabo, 608 (36.9%) attend a private institution, while the remaining 1,041 (63.1%) are enrolled in public schools. The age group of 35 years and over has the highest likelihood of being enrolled in private schools, with 151 (94.4% in the age bracket) enrolled. Conversely, the age group of 5 to 9 year old has the lowest likelihood of being enrolled in a private school, with 291 (92.1% in the age bracket) attending a public institution.
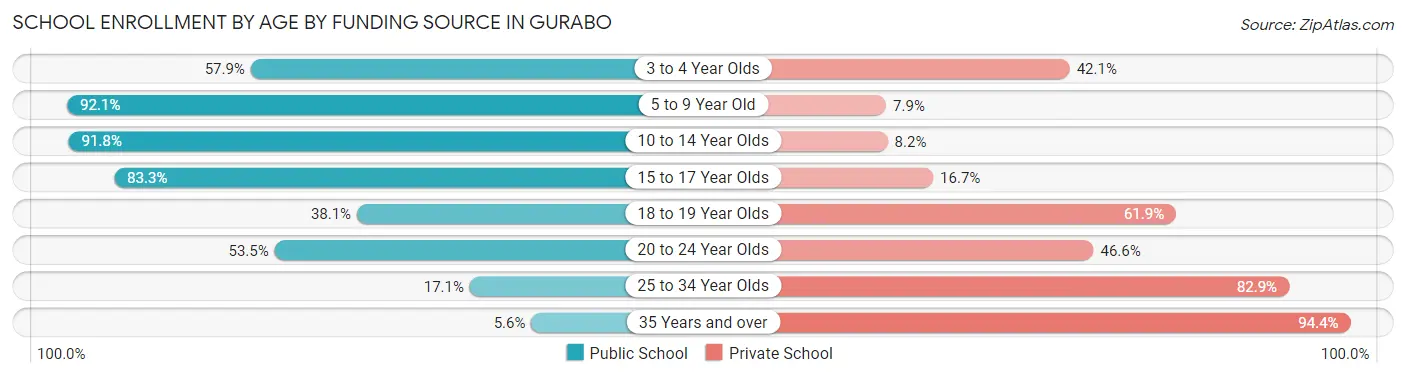
| Age Bracket | Public School | Private School |
| 3 to 4 Year Olds | 22 (57.9%) | 16 (42.1%) |
| 5 to 9 Year Old | 291 (92.1%) | 25 (7.9%) |
| 10 to 14 Year Olds | 269 (91.8%) | 24 (8.2%) |
| 15 to 17 Year Olds | 250 (83.3%) | 50 (16.7%) |
| 18 to 19 Year Olds | 40 (38.1%) | 65 (61.9%) |
| 20 to 24 Year Olds | 124 (53.4%) | 108 (46.6%) |
| 25 to 34 Year Olds | 35 (17.1%) | 170 (82.9%) |
| 35 Years and over | 9 (5.6%) | 151 (94.4%) |
| Total | 1,041 (63.1%) | 608 (36.9%) |
Educational Attainment by Field of Study in Gurabo
Business (350 | 34.3%), science & technology (185 | 18.1%), education (109 | 10.7%), arts & humanities (74 | 7.2%), and social sciences (67 | 6.6%) are the most common fields of study among 1,021 individuals in Gurabo who have obtained a bachelor's degree or higher.
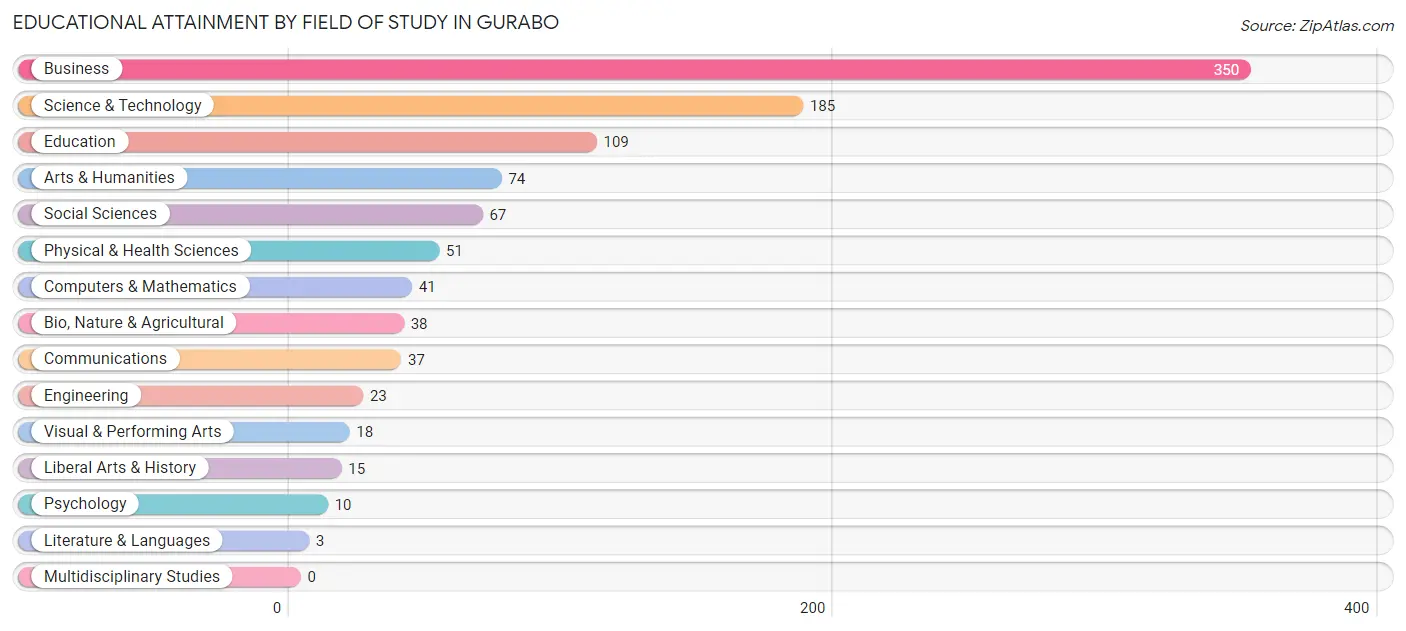
| Field of Study | # Graduates | % Graduates |
| Computers & Mathematics | 41 | 4.0% |
| Bio, Nature & Agricultural | 38 | 3.7% |
| Physical & Health Sciences | 51 | 5.0% |
| Psychology | 10 | 1.0% |
| Social Sciences | 67 | 6.6% |
| Engineering | 23 | 2.2% |
| Multidisciplinary Studies | 0 | 0.0% |
| Science & Technology | 185 | 18.1% |
| Business | 350 | 34.3% |
| Education | 109 | 10.7% |
| Literature & Languages | 3 | 0.3% |
| Liberal Arts & History | 15 | 1.5% |
| Visual & Performing Arts | 18 | 1.8% |
| Communications | 37 | 3.6% |
| Arts & Humanities | 74 | 7.2% |
| Total | 1,021 | 100.0% |
Transportation & Commute in Gurabo
Vehicle Availability by Sex in Gurabo
The most prevalent vehicle ownership categories in Gurabo are males with 2 vehicles (716, accounting for 44.6%) and females with 2 vehicles (493, making up 59.4%).
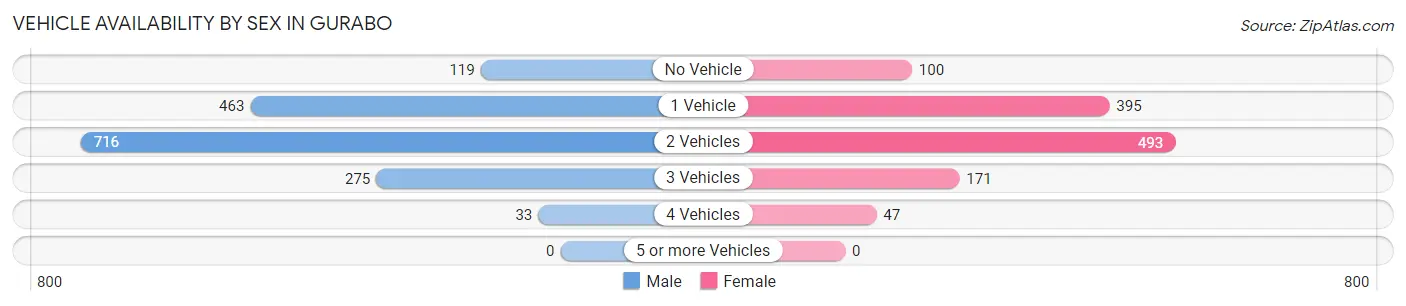
| Vehicles Available | Male | Female |
| No Vehicle | 119 (7.4%) | 100 (8.3%) |
| 1 Vehicle | 463 (28.8%) | 395 (32.8%) |
| 2 Vehicles | 716 (44.6%) | 493 (40.9%) |
| 3 Vehicles | 275 (17.1%) | 171 (14.2%) |
| 4 Vehicles | 33 (2.1%) | 47 (3.9%) |
| 5 or more Vehicles | 0 (0.0%) | 0 (0.0%) |
| Total | 1,606 (100.0%) | 1,206 (100.0%) |
Commute Time in Gurabo
The most frequently occuring commute durations in Gurabo are 10 to 14 minutes (533 commuters, 19.9%), 15 to 19 minutes (444 commuters, 16.6%), and 5 to 9 minutes (402 commuters, 15.0%).
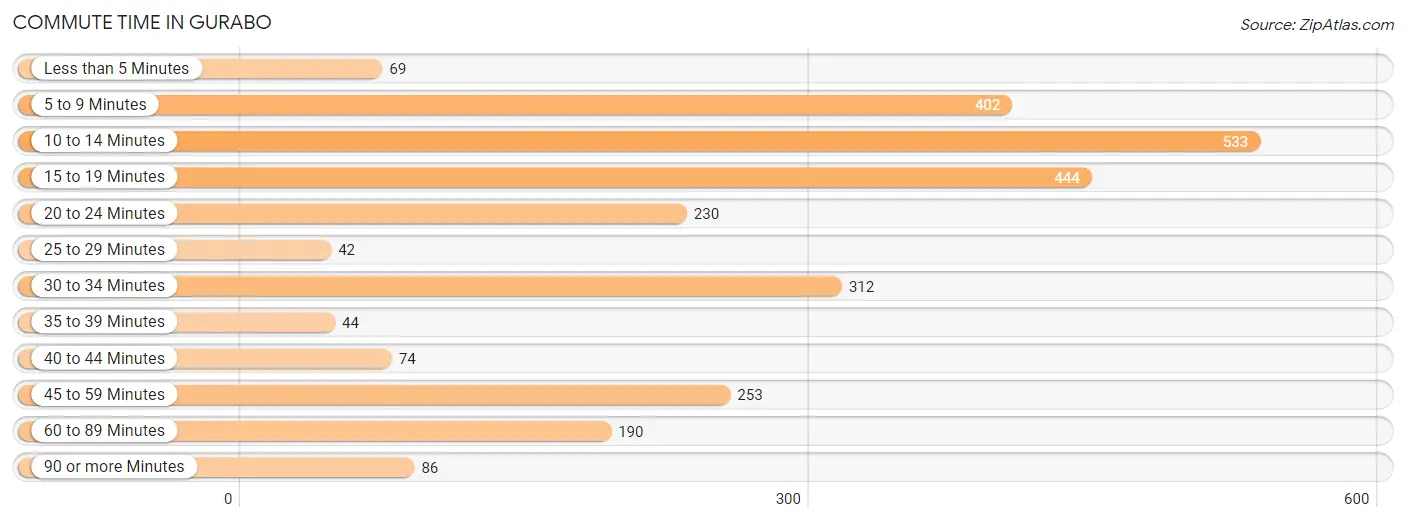
| Commute Time | # Commuters | % Commuters |
| Less than 5 Minutes | 69 | 2.6% |
| 5 to 9 Minutes | 402 | 15.0% |
| 10 to 14 Minutes | 533 | 19.9% |
| 15 to 19 Minutes | 444 | 16.6% |
| 20 to 24 Minutes | 230 | 8.6% |
| 25 to 29 Minutes | 42 | 1.6% |
| 30 to 34 Minutes | 312 | 11.7% |
| 35 to 39 Minutes | 44 | 1.6% |
| 40 to 44 Minutes | 74 | 2.8% |
| 45 to 59 Minutes | 253 | 9.4% |
| 60 to 89 Minutes | 190 | 7.1% |
| 90 or more Minutes | 86 | 3.2% |
Commute Time by Sex in Gurabo
The most common commute times in Gurabo are 10 to 14 minutes (286 commuters, 18.2%) for males and 10 to 14 minutes (247 commuters, 22.2%) for females.
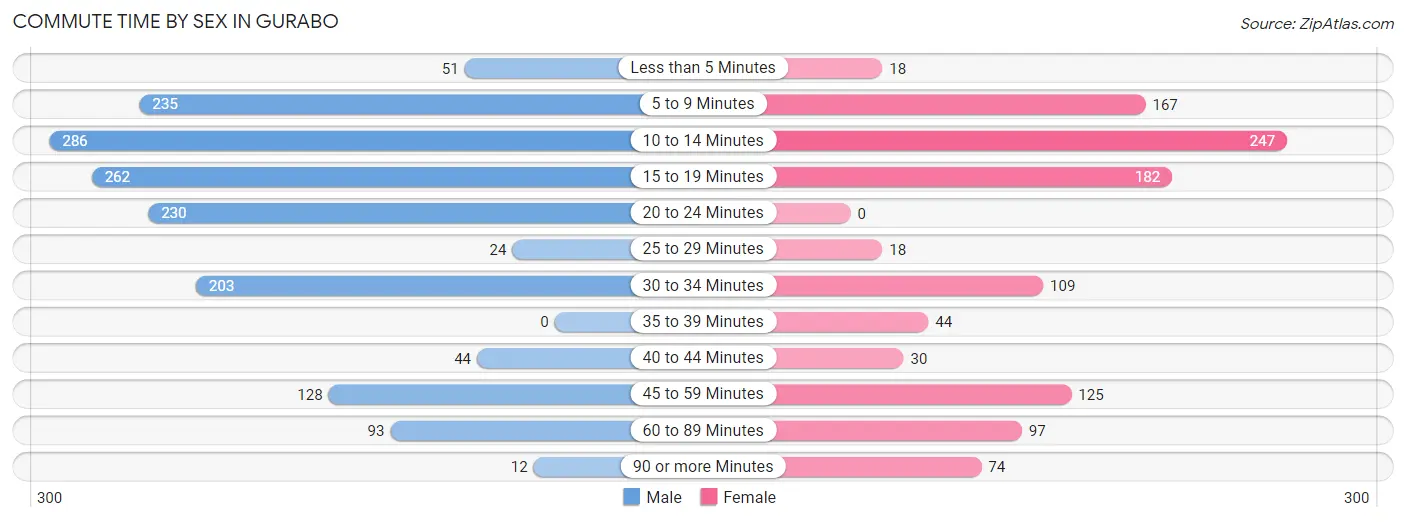
| Commute Time | Male | Female |
| Less than 5 Minutes | 51 (3.3%) | 18 (1.6%) |
| 5 to 9 Minutes | 235 (15.0%) | 167 (15.0%) |
| 10 to 14 Minutes | 286 (18.2%) | 247 (22.2%) |
| 15 to 19 Minutes | 262 (16.7%) | 182 (16.4%) |
| 20 to 24 Minutes | 230 (14.7%) | 0 (0.0%) |
| 25 to 29 Minutes | 24 (1.5%) | 18 (1.6%) |
| 30 to 34 Minutes | 203 (13.0%) | 109 (9.8%) |
| 35 to 39 Minutes | 0 (0.0%) | 44 (4.0%) |
| 40 to 44 Minutes | 44 (2.8%) | 30 (2.7%) |
| 45 to 59 Minutes | 128 (8.2%) | 125 (11.3%) |
| 60 to 89 Minutes | 93 (5.9%) | 97 (8.7%) |
| 90 or more Minutes | 12 (0.8%) | 74 (6.7%) |
Time of Departure to Work by Sex in Gurabo
The most frequent times of departure to work in Gurabo are 6:30 AM to 6:59 AM (271, 17.3%) for males and 7:00 AM to 7:29 AM (216, 19.4%) for females.
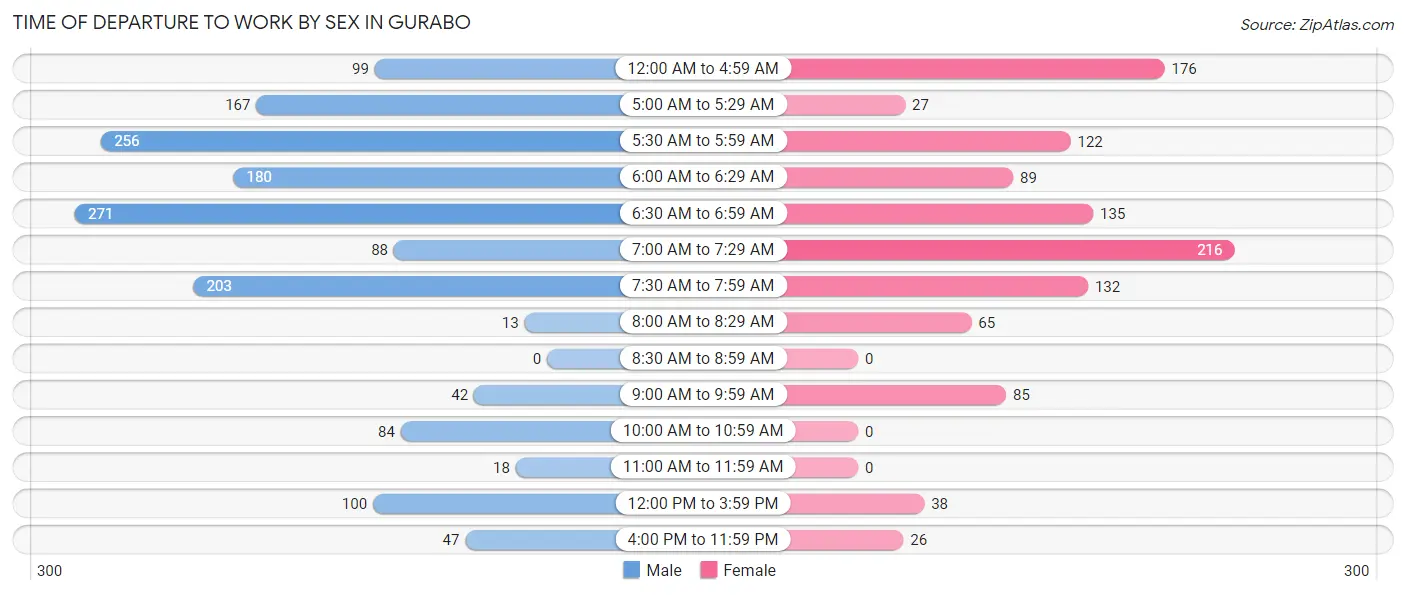
| Time of Departure | Male | Female |
| 12:00 AM to 4:59 AM | 99 (6.3%) | 176 (15.8%) |
| 5:00 AM to 5:29 AM | 167 (10.6%) | 27 (2.4%) |
| 5:30 AM to 5:59 AM | 256 (16.3%) | 122 (11.0%) |
| 6:00 AM to 6:29 AM | 180 (11.5%) | 89 (8.0%) |
| 6:30 AM to 6:59 AM | 271 (17.3%) | 135 (12.1%) |
| 7:00 AM to 7:29 AM | 88 (5.6%) | 216 (19.4%) |
| 7:30 AM to 7:59 AM | 203 (13.0%) | 132 (11.9%) |
| 8:00 AM to 8:29 AM | 13 (0.8%) | 65 (5.9%) |
| 8:30 AM to 8:59 AM | 0 (0.0%) | 0 (0.0%) |
| 9:00 AM to 9:59 AM | 42 (2.7%) | 85 (7.6%) |
| 10:00 AM to 10:59 AM | 84 (5.4%) | 0 (0.0%) |
| 11:00 AM to 11:59 AM | 18 (1.1%) | 0 (0.0%) |
| 12:00 PM to 3:59 PM | 100 (6.4%) | 38 (3.4%) |
| 4:00 PM to 11:59 PM | 47 (3.0%) | 26 (2.3%) |
| Total | 1,568 (100.0%) | 1,111 (100.0%) |
Housing Occupancy in Gurabo
Occupancy by Ownership in Gurabo
Of the total 2,791 dwellings in Gurabo, owner-occupied units account for 1,648 (59.1%), while renter-occupied units make up 1,143 (40.9%).
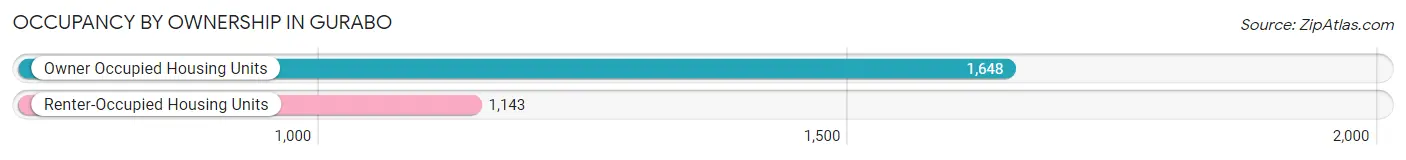
| Occupancy | # Housing Units | % Housing Units |
| Owner Occupied Housing Units | 1,648 | 59.1% |
| Renter-Occupied Housing Units | 1,143 | 40.9% |
| Total Occupied Housing Units | 2,791 | 100.0% |
Occupancy by Household Size in Gurabo
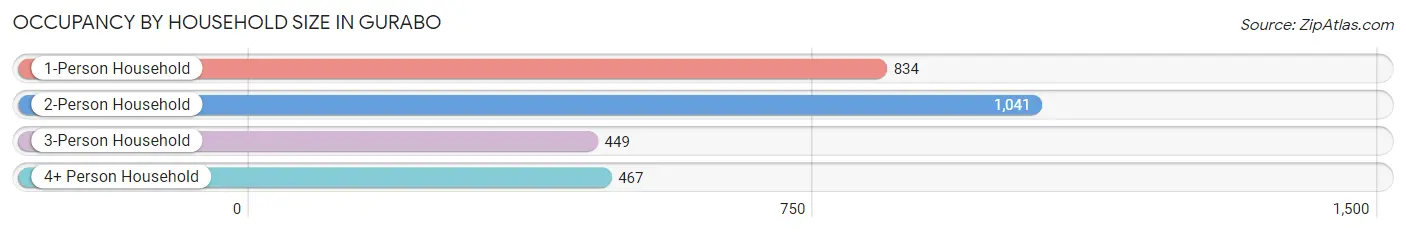
| Household Size | # Housing Units | % Housing Units |
| 1-Person Household | 834 | 29.9% |
| 2-Person Household | 1,041 | 37.3% |
| 3-Person Household | 449 | 16.1% |
| 4+ Person Household | 467 | 16.7% |
| Total Housing Units | 2,791 | 100.0% |
Occupancy by Ownership by Household Size in Gurabo
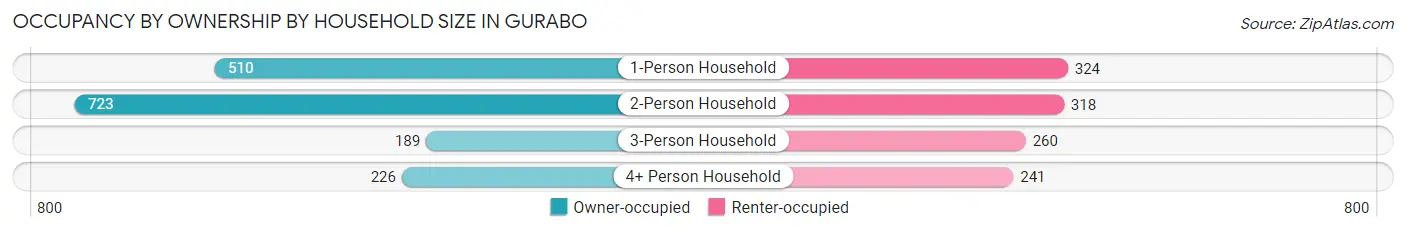
| Household Size | Owner-occupied | Renter-occupied |
| 1-Person Household | 510 (61.2%) | 324 (38.9%) |
| 2-Person Household | 723 (69.5%) | 318 (30.5%) |
| 3-Person Household | 189 (42.1%) | 260 (57.9%) |
| 4+ Person Household | 226 (48.4%) | 241 (51.6%) |
| Total Housing Units | 1,648 (59.1%) | 1,143 (40.9%) |
Occupancy by Educational Attainment in Gurabo
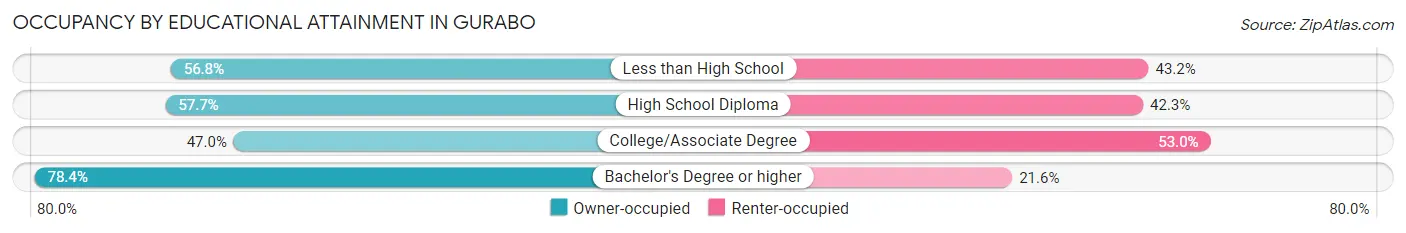
| Household Size | Owner-occupied | Renter-occupied |
| Less than High School | 309 (56.8%) | 235 (43.2%) |
| High School Diploma | 538 (57.7%) | 395 (42.3%) |
| College/Associate Degree | 343 (47.0%) | 387 (53.0%) |
| Bachelor's Degree or higher | 458 (78.4%) | 126 (21.6%) |
Occupancy by Age of Householder in Gurabo
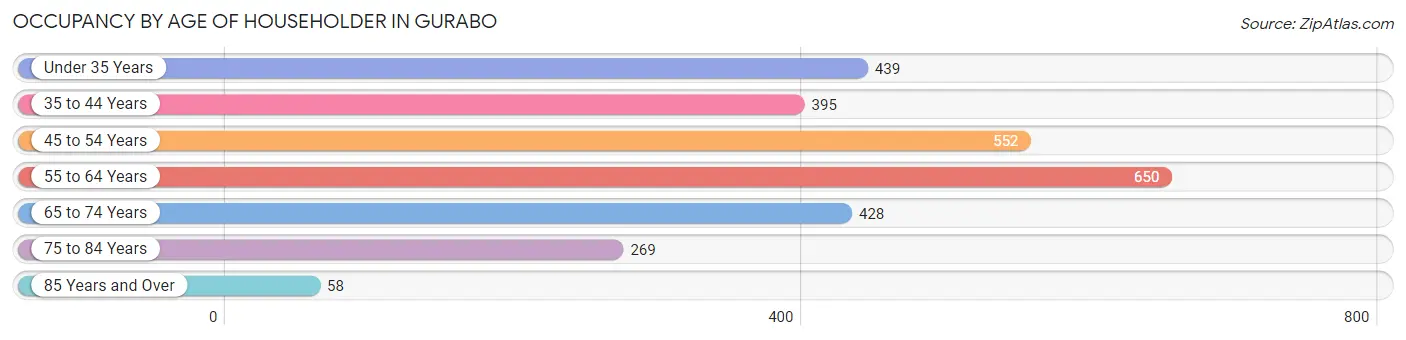
| Age Bracket | # Households | % Households |
| Under 35 Years | 439 | 15.7% |
| 35 to 44 Years | 395 | 14.1% |
| 45 to 54 Years | 552 | 19.8% |
| 55 to 64 Years | 650 | 23.3% |
| 65 to 74 Years | 428 | 15.3% |
| 75 to 84 Years | 269 | 9.6% |
| 85 Years and Over | 58 | 2.1% |
| Total | 2,791 | 100.0% |
Housing Finances in Gurabo
Median Income by Occupancy in Gurabo
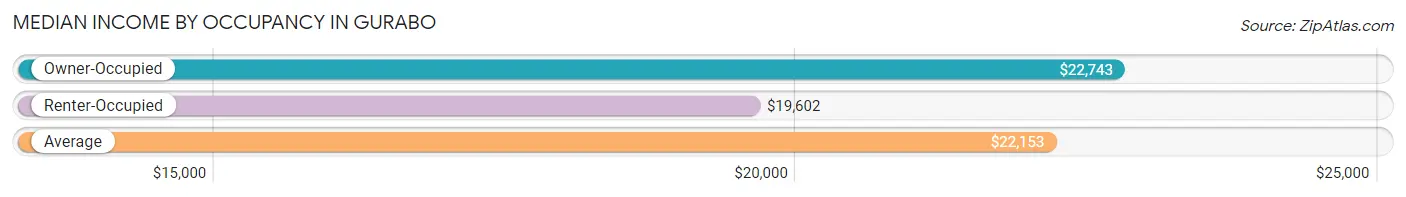
| Occupancy Type | # Households | Median Income |
| Owner-Occupied | 1,648 (59.1%) | $22,743 |
| Renter-Occupied | 1,143 (40.9%) | $19,602 |
| Average | 2,791 (100.0%) | $22,153 |
Occupancy by Householder Income Bracket in Gurabo
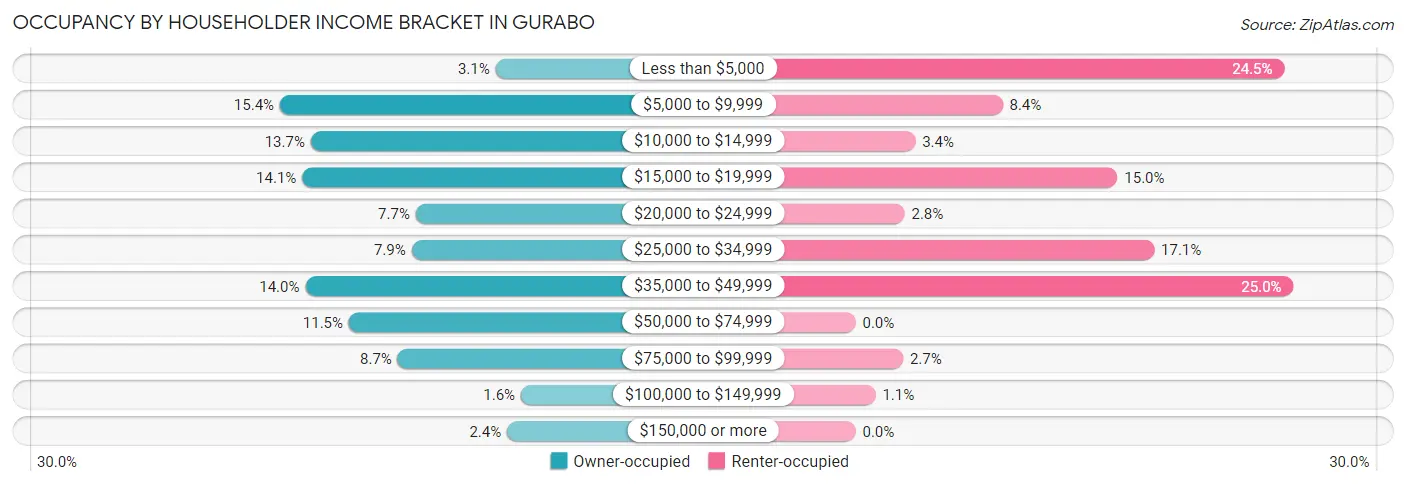
| Income Bracket | Owner-occupied | Renter-occupied |
| Less than $5,000 | 51 (3.1%) | 280 (24.5%) |
| $5,000 to $9,999 | 254 (15.4%) | 96 (8.4%) |
| $10,000 to $14,999 | 225 (13.7%) | 39 (3.4%) |
| $15,000 to $19,999 | 233 (14.1%) | 171 (15.0%) |
| $20,000 to $24,999 | 126 (7.6%) | 32 (2.8%) |
| $25,000 to $34,999 | 130 (7.9%) | 195 (17.1%) |
| $35,000 to $49,999 | 230 (14.0%) | 286 (25.0%) |
| $50,000 to $74,999 | 189 (11.5%) | 0 (0.0%) |
| $75,000 to $99,999 | 143 (8.7%) | 31 (2.7%) |
| $100,000 to $149,999 | 27 (1.6%) | 13 (1.1%) |
| $150,000 or more | 40 (2.4%) | 0 (0.0%) |
| Total | 1,648 (100.0%) | 1,143 (100.0%) |
Monthly Housing Cost Tiers in Gurabo
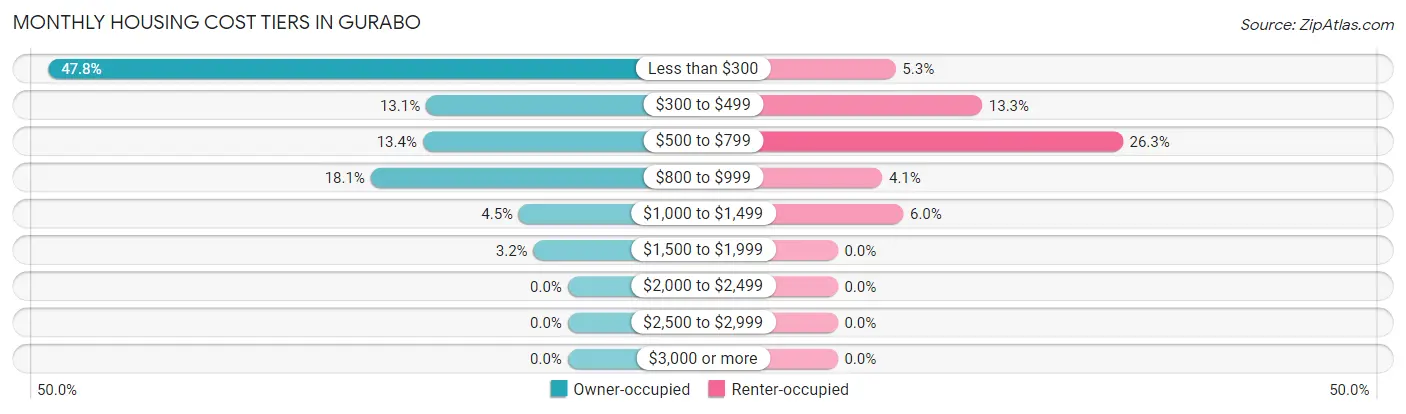
| Monthly Cost | Owner-occupied | Renter-occupied |
| Less than $300 | 788 (47.8%) | 61 (5.3%) |
| $300 to $499 | 215 (13.1%) | 152 (13.3%) |
| $500 to $799 | 220 (13.4%) | 300 (26.3%) |
| $800 to $999 | 299 (18.1%) | 47 (4.1%) |
| $1,000 to $1,499 | 74 (4.5%) | 69 (6.0%) |
| $1,500 to $1,999 | 52 (3.2%) | 0 (0.0%) |
| $2,000 to $2,499 | 0 (0.0%) | 0 (0.0%) |
| $2,500 to $2,999 | 0 (0.0%) | 0 (0.0%) |
| $3,000 or more | 0 (0.0%) | 0 (0.0%) |
| Total | 1,648 (100.0%) | 1,143 (100.0%) |
Physical Housing Characteristics in Gurabo
Housing Structures in Gurabo
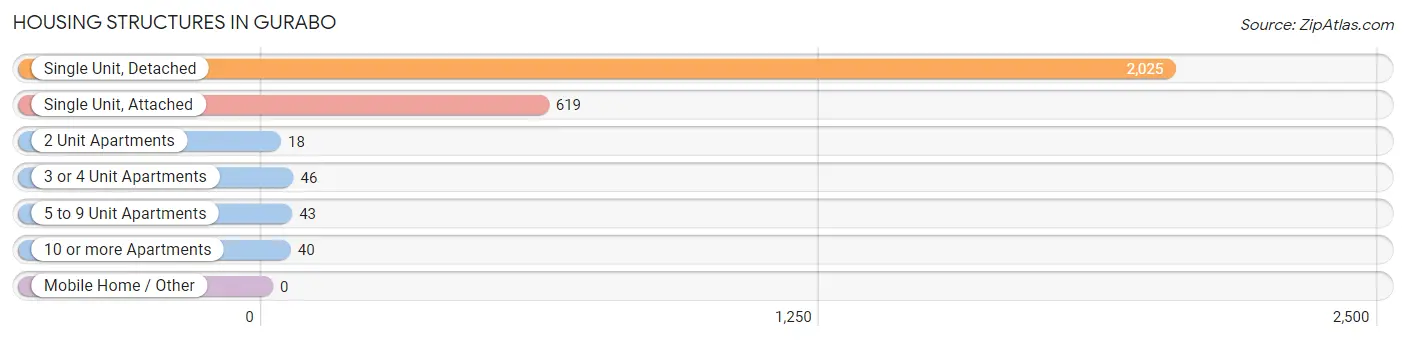
| Structure Type | # Housing Units | % Housing Units |
| Single Unit, Detached | 2,025 | 72.6% |
| Single Unit, Attached | 619 | 22.2% |
| 2 Unit Apartments | 18 | 0.6% |
| 3 or 4 Unit Apartments | 46 | 1.7% |
| 5 to 9 Unit Apartments | 43 | 1.5% |
| 10 or more Apartments | 40 | 1.4% |
| Mobile Home / Other | 0 | 0.0% |
| Total | 2,791 | 100.0% |
Housing Structures by Occupancy in Gurabo
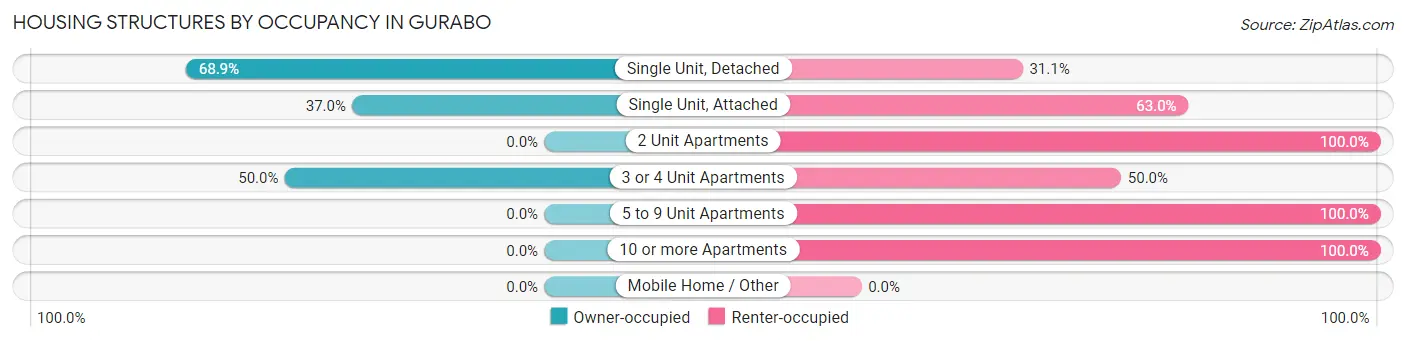
| Structure Type | Owner-occupied | Renter-occupied |
| Single Unit, Detached | 1,396 (68.9%) | 629 (31.1%) |
| Single Unit, Attached | 229 (37.0%) | 390 (63.0%) |
| 2 Unit Apartments | 0 (0.0%) | 18 (100.0%) |
| 3 or 4 Unit Apartments | 23 (50.0%) | 23 (50.0%) |
| 5 to 9 Unit Apartments | 0 (0.0%) | 43 (100.0%) |
| 10 or more Apartments | 0 (0.0%) | 40 (100.0%) |
| Mobile Home / Other | 0 (0.0%) | 0 (0.0%) |
| Total | 1,648 (59.1%) | 1,143 (40.9%) |
Housing Structures by Number of Rooms in Gurabo
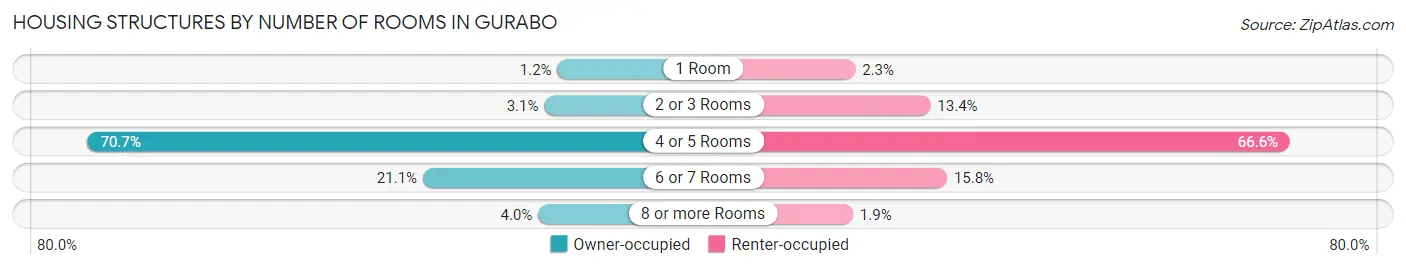
| Number of Rooms | Owner-occupied | Renter-occupied |
| 1 Room | 19 (1.1%) | 26 (2.3%) |
| 2 or 3 Rooms | 51 (3.1%) | 153 (13.4%) |
| 4 or 5 Rooms | 1,165 (70.7%) | 761 (66.6%) |
| 6 or 7 Rooms | 347 (21.1%) | 181 (15.8%) |
| 8 or more Rooms | 66 (4.0%) | 22 (1.9%) |
| Total | 1,648 (100.0%) | 1,143 (100.0%) |
Housing Structure by Heating Type in Gurabo
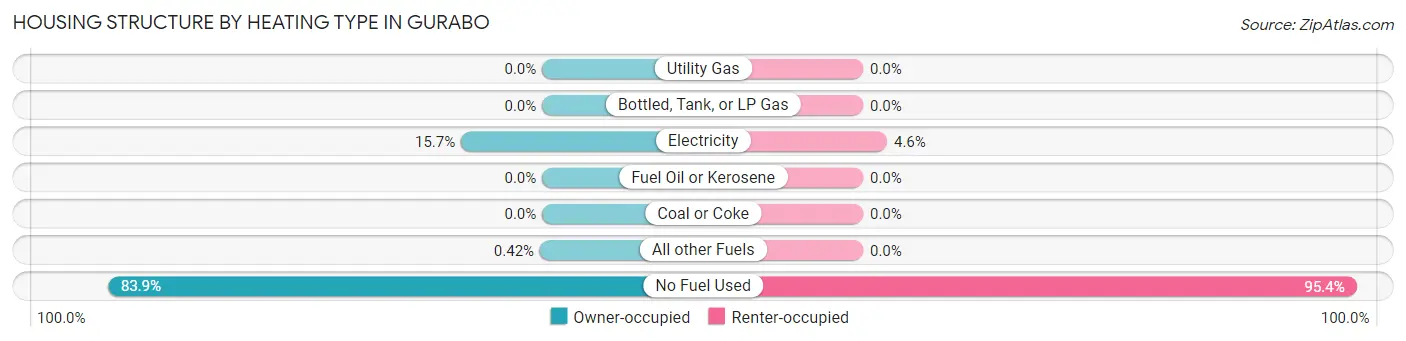
| Heating Type | Owner-occupied | Renter-occupied |
| Utility Gas | 0 (0.0%) | 0 (0.0%) |
| Bottled, Tank, or LP Gas | 0 (0.0%) | 0 (0.0%) |
| Electricity | 258 (15.7%) | 53 (4.6%) |
| Fuel Oil or Kerosene | 0 (0.0%) | 0 (0.0%) |
| Coal or Coke | 0 (0.0%) | 0 (0.0%) |
| All other Fuels | 7 (0.4%) | 0 (0.0%) |
| No Fuel Used | 1,383 (83.9%) | 1,090 (95.4%) |
| Total | 1,648 (100.0%) | 1,143 (100.0%) |
Household Vehicle Usage in Gurabo
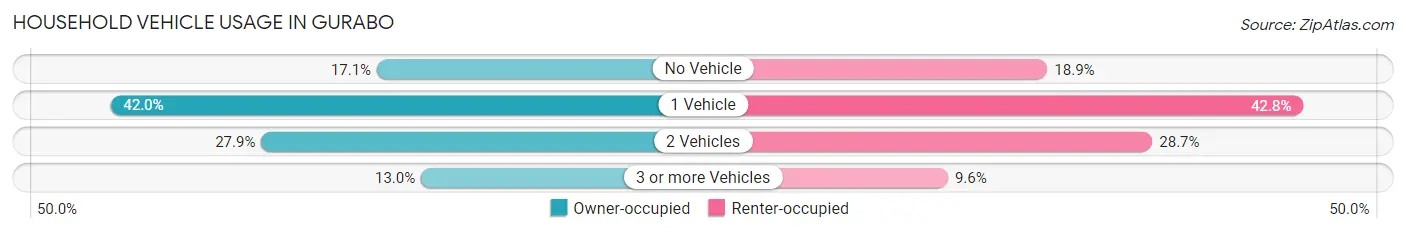
| Vehicles per Household | Owner-occupied | Renter-occupied |
| No Vehicle | 282 (17.1%) | 216 (18.9%) |
| 1 Vehicle | 692 (42.0%) | 489 (42.8%) |
| 2 Vehicles | 460 (27.9%) | 328 (28.7%) |
| 3 or more Vehicles | 214 (13.0%) | 110 (9.6%) |
| Total | 1,648 (100.0%) | 1,143 (100.0%) |
Real Estate & Mortgages in Gurabo
Real Estate and Mortgage Overview in Gurabo
| Characteristic | Without Mortgage | With Mortgage |
| Housing Units | 954 | 694 |
| Median Property Value | $101,800 | $112,600 |
| Median Household Income | $22,237 | $13 |
| Monthly Housing Costs | $149 | $0 |
| Real Estate Taxes | - | - |
Property Value by Mortgage Status in Gurabo
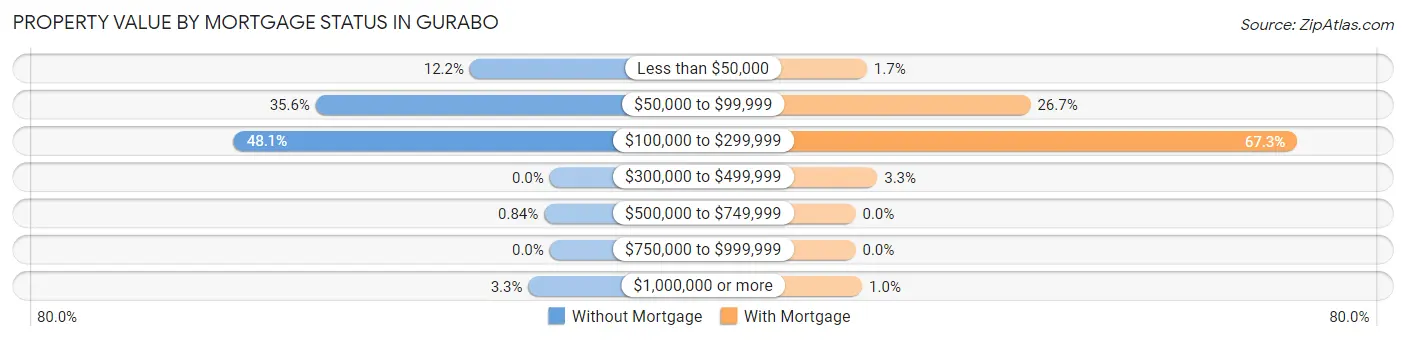
| Property Value | Without Mortgage | With Mortgage |
| Less than $50,000 | 116 (12.2%) | 12 (1.7%) |
| $50,000 to $99,999 | 340 (35.6%) | 185 (26.7%) |
| $100,000 to $299,999 | 459 (48.1%) | 467 (67.3%) |
| $300,000 to $499,999 | 0 (0.0%) | 23 (3.3%) |
| $500,000 to $749,999 | 8 (0.8%) | 0 (0.0%) |
| $750,000 to $999,999 | 0 (0.0%) | 0 (0.0%) |
| $1,000,000 or more | 31 (3.3%) | 7 (1.0%) |
| Total | 954 (100.0%) | 694 (100.0%) |
Household Income by Mortgage Status in Gurabo
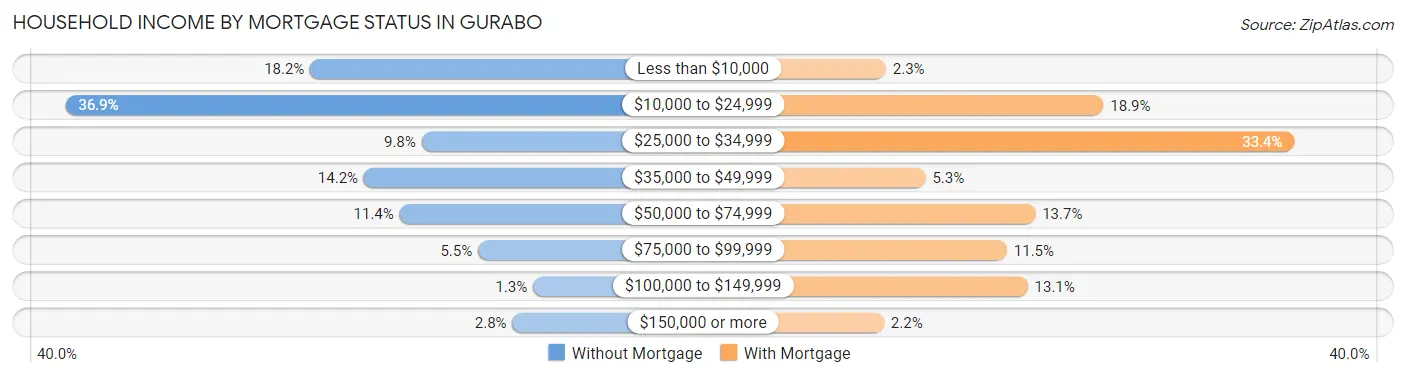
| Household Income | Without Mortgage | With Mortgage |
| Less than $10,000 | 174 (18.2%) | 16 (2.3%) |
| $10,000 to $24,999 | 352 (36.9%) | 131 (18.9%) |
| $25,000 to $34,999 | 93 (9.8%) | 232 (33.4%) |
| $35,000 to $49,999 | 135 (14.1%) | 37 (5.3%) |
| $50,000 to $74,999 | 109 (11.4%) | 95 (13.7%) |
| $75,000 to $99,999 | 52 (5.4%) | 80 (11.5%) |
| $100,000 to $149,999 | 12 (1.3%) | 91 (13.1%) |
| $150,000 or more | 27 (2.8%) | 15 (2.2%) |
| Total | 954 (100.0%) | 694 (100.0%) |
Property Value to Household Income Ratio in Gurabo
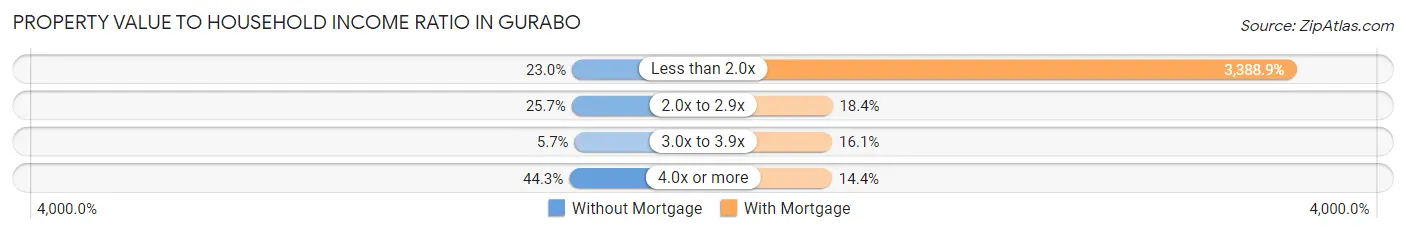
| Value-to-Income Ratio | Without Mortgage | With Mortgage |
| Less than 2.0x | 219 (23.0%) | 23,519 (3,388.9%) |
| 2.0x to 2.9x | 245 (25.7%) | 128 (18.4%) |
| 3.0x to 3.9x | 54 (5.7%) | 112 (16.1%) |
| 4.0x or more | 423 (44.3%) | 100 (14.4%) |
| Total | 954 (100.0%) | 694 (100.0%) |
Real Estate Taxes by Mortgage Status in Gurabo
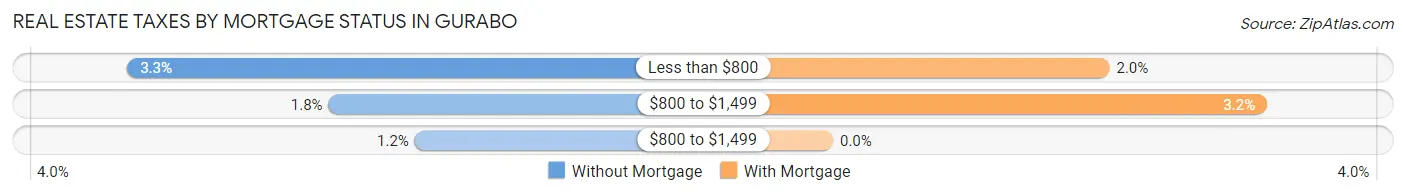
| Property Taxes | Without Mortgage | With Mortgage |
| Less than $800 | 31 (3.3%) | 14 (2.0%) |
| $800 to $1,499 | 17 (1.8%) | 22 (3.2%) |
| $800 to $1,499 | 11 (1.1%) | 0 (0.0%) |
| Total | 954 (100.0%) | 694 (100.0%) |
Health & Disability in Gurabo
Health Insurance Coverage by Age in Gurabo
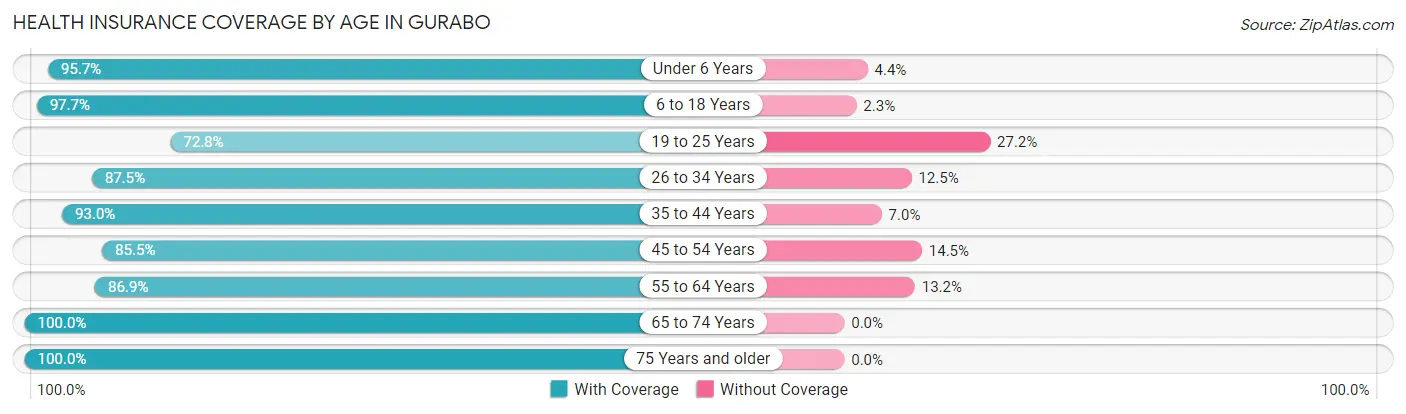
| Age Bracket | With Coverage | Without Coverage |
| Under 6 Years | 198 (95.7%) | 9 (4.3%) |
| 6 to 18 Years | 1,038 (97.7%) | 24 (2.3%) |
| 19 to 25 Years | 573 (72.8%) | 214 (27.2%) |
| 26 to 34 Years | 754 (87.5%) | 108 (12.5%) |
| 35 to 44 Years | 734 (93.0%) | 55 (7.0%) |
| 45 to 54 Years | 816 (85.5%) | 138 (14.5%) |
| 55 to 64 Years | 964 (86.9%) | 146 (13.2%) |
| 65 to 74 Years | 681 (100.0%) | 0 (0.0%) |
| 75 Years and older | 507 (100.0%) | 0 (0.0%) |
| Total | 6,265 (90.0%) | 694 (10.0%) |
Health Insurance Coverage by Citizenship Status in Gurabo
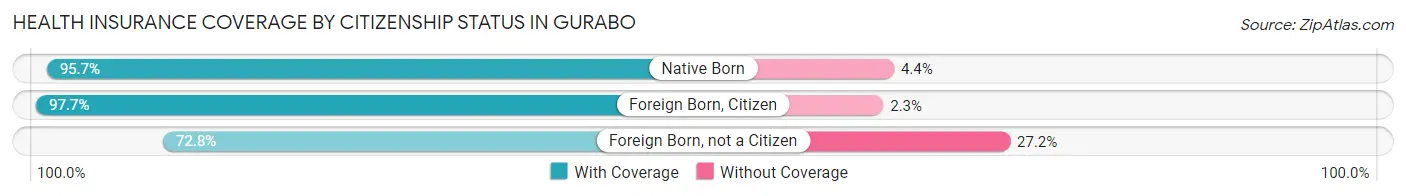
| Citizenship Status | With Coverage | Without Coverage |
| Native Born | 198 (95.7%) | 9 (4.3%) |
| Foreign Born, Citizen | 1,038 (97.7%) | 24 (2.3%) |
| Foreign Born, not a Citizen | 573 (72.8%) | 214 (27.2%) |
Health Insurance Coverage by Household Income in Gurabo
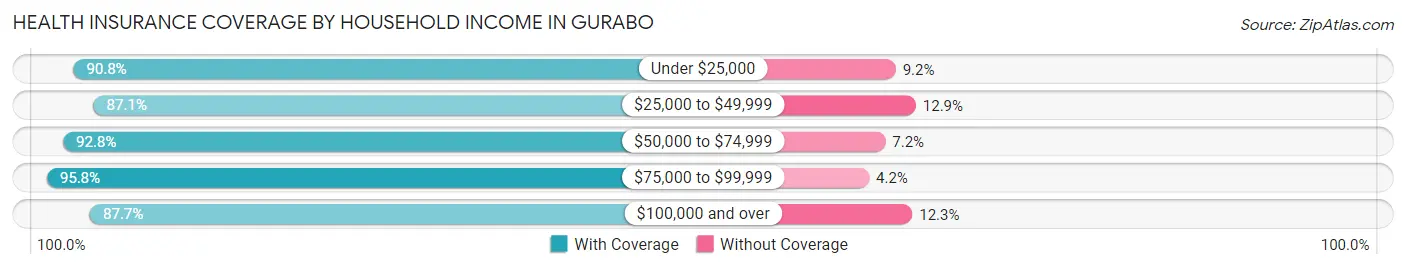
| Household Income | With Coverage | Without Coverage |
| Under $25,000 | 2,906 (90.8%) | 293 (9.2%) |
| $25,000 to $49,999 | 2,011 (87.1%) | 299 (12.9%) |
| $50,000 to $74,999 | 514 (92.8%) | 40 (7.2%) |
| $75,000 to $99,999 | 481 (95.8%) | 21 (4.2%) |
| $100,000 and over | 293 (87.7%) | 41 (12.3%) |
Public vs Private Health Insurance Coverage by Age in Gurabo
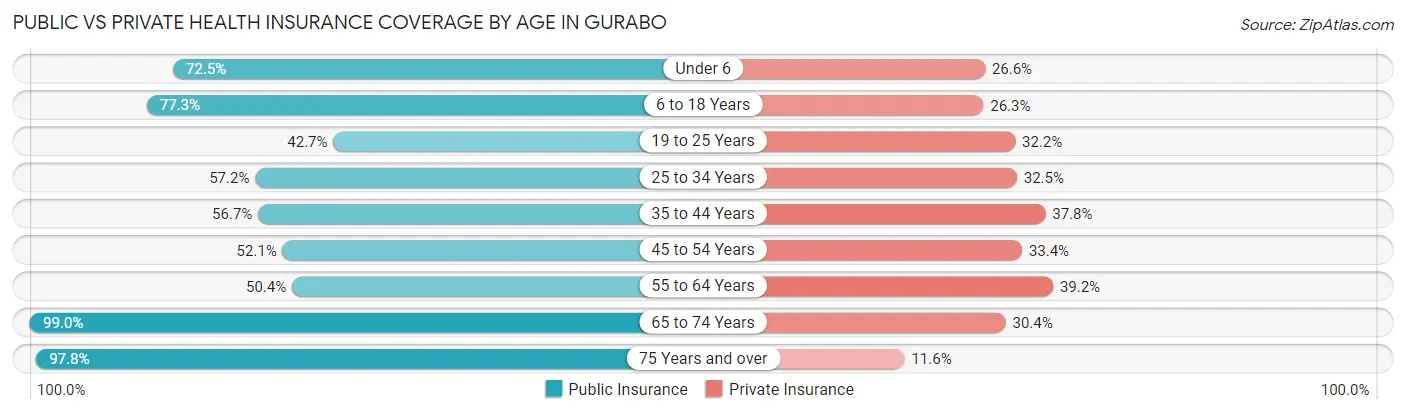
| Age Bracket | Public Insurance | Private Insurance |
| Under 6 | 150 (72.5%) | 55 (26.6%) |
| 6 to 18 Years | 821 (77.3%) | 279 (26.3%) |
| 19 to 25 Years | 336 (42.7%) | 253 (32.2%) |
| 25 to 34 Years | 493 (57.2%) | 280 (32.5%) |
| 35 to 44 Years | 447 (56.7%) | 298 (37.8%) |
| 45 to 54 Years | 497 (52.1%) | 319 (33.4%) |
| 55 to 64 Years | 559 (50.4%) | 435 (39.2%) |
| 65 to 74 Years | 674 (99.0%) | 207 (30.4%) |
| 75 Years and over | 496 (97.8%) | 59 (11.6%) |
| Total | 4,473 (64.3%) | 2,185 (31.4%) |
Disability Status by Sex by Age in Gurabo
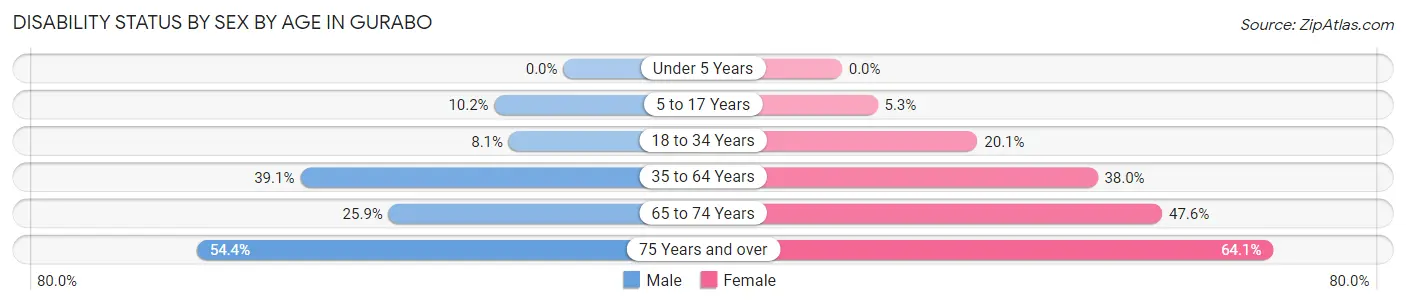
| Age Bracket | Male | Female |
| Under 5 Years | 0 (0.0%) | 0 (0.0%) |
| 5 to 17 Years | 44 (10.2%) | 27 (5.3%) |
| 18 to 34 Years | 86 (8.1%) | 152 (20.1%) |
| 35 to 64 Years | 495 (39.1%) | 602 (38.0%) |
| 65 to 74 Years | 97 (25.9%) | 146 (47.6%) |
| 75 Years and over | 123 (54.4%) | 180 (64.1%) |
Disability Class by Sex by Age in Gurabo
Disability Class: Hearing Difficulty
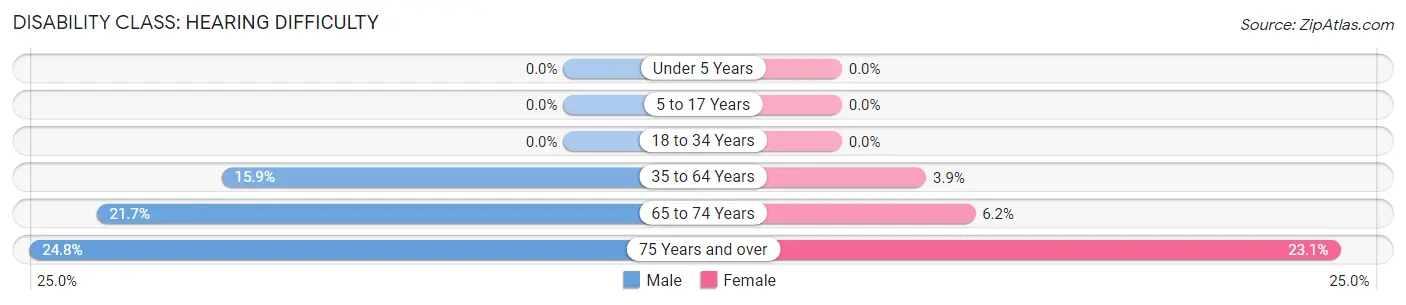
| Age Bracket | Male | Female |
| Under 5 Years | 0 (0.0%) | 0 (0.0%) |
| 5 to 17 Years | 0 (0.0%) | 0 (0.0%) |
| 18 to 34 Years | 0 (0.0%) | 0 (0.0%) |
| 35 to 64 Years | 201 (15.9%) | 62 (3.9%) |
| 65 to 74 Years | 81 (21.7%) | 19 (6.2%) |
| 75 Years and over | 56 (24.8%) | 65 (23.1%) |
Disability Class: Vision Difficulty
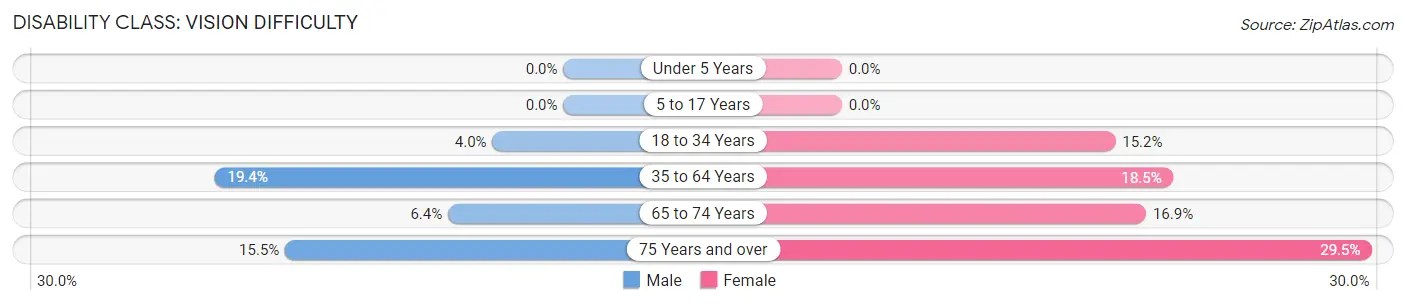
| Age Bracket | Male | Female |
| Under 5 Years | 0 (0.0%) | 0 (0.0%) |
| 5 to 17 Years | 0 (0.0%) | 0 (0.0%) |
| 18 to 34 Years | 42 (4.0%) | 115 (15.2%) |
| 35 to 64 Years | 246 (19.4%) | 293 (18.5%) |
| 65 to 74 Years | 24 (6.4%) | 52 (16.9%) |
| 75 Years and over | 35 (15.5%) | 83 (29.5%) |
Disability Class: Cognitive Difficulty
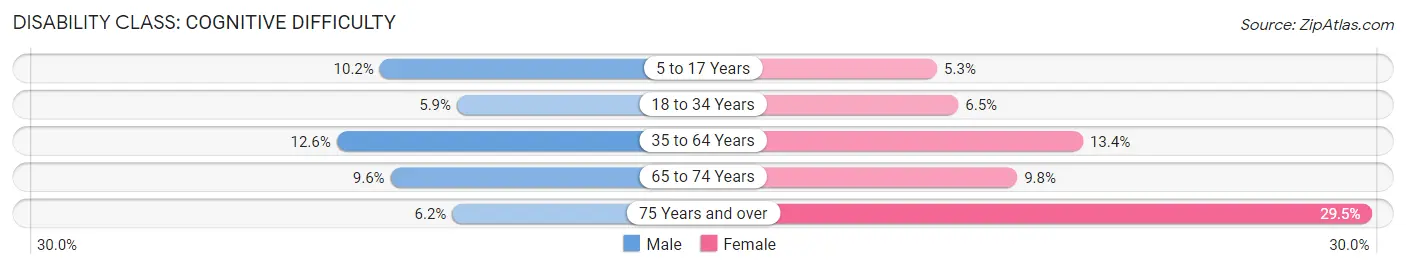
| Age Bracket | Male | Female |
| 5 to 17 Years | 44 (10.2%) | 27 (5.3%) |
| 18 to 34 Years | 63 (5.9%) | 49 (6.5%) |
| 35 to 64 Years | 160 (12.6%) | 213 (13.4%) |
| 65 to 74 Years | 36 (9.6%) | 30 (9.8%) |
| 75 Years and over | 14 (6.2%) | 83 (29.5%) |
Disability Class: Ambulatory Difficulty
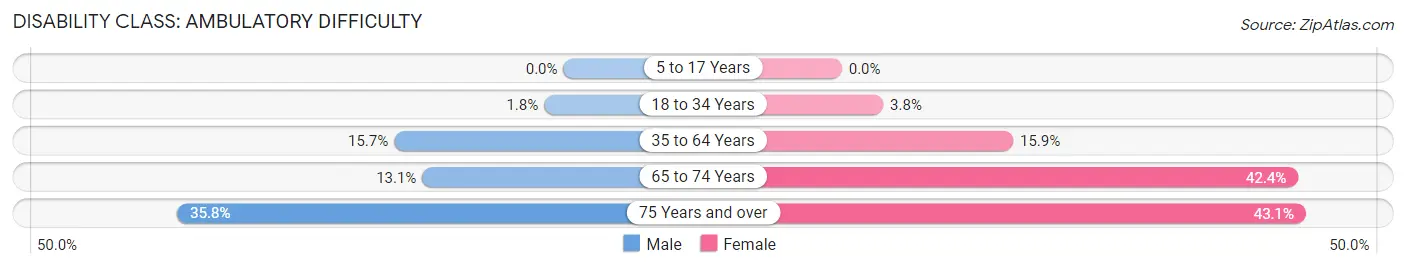
| Age Bracket | Male | Female |
| 5 to 17 Years | 0 (0.0%) | 0 (0.0%) |
| 18 to 34 Years | 19 (1.8%) | 29 (3.8%) |
| 35 to 64 Years | 199 (15.7%) | 252 (15.9%) |
| 65 to 74 Years | 49 (13.1%) | 130 (42.3%) |
| 75 Years and over | 81 (35.8%) | 121 (43.1%) |
Disability Class: Self-Care Difficulty
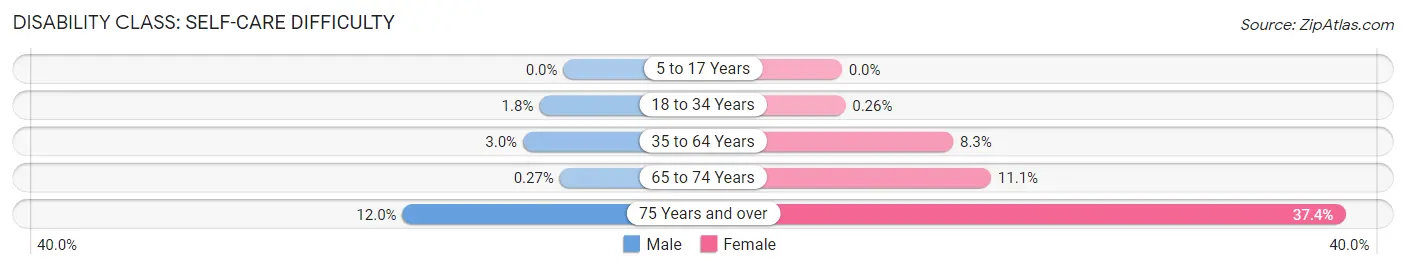
| Age Bracket | Male | Female |
| 5 to 17 Years | 0 (0.0%) | 0 (0.0%) |
| 18 to 34 Years | 19 (1.8%) | 2 (0.3%) |
| 35 to 64 Years | 38 (3.0%) | 131 (8.3%) |
| 65 to 74 Years | 1 (0.3%) | 34 (11.1%) |
| 75 Years and over | 27 (11.9%) | 105 (37.4%) |
Technology Access in Gurabo
Computing Device Access in Gurabo
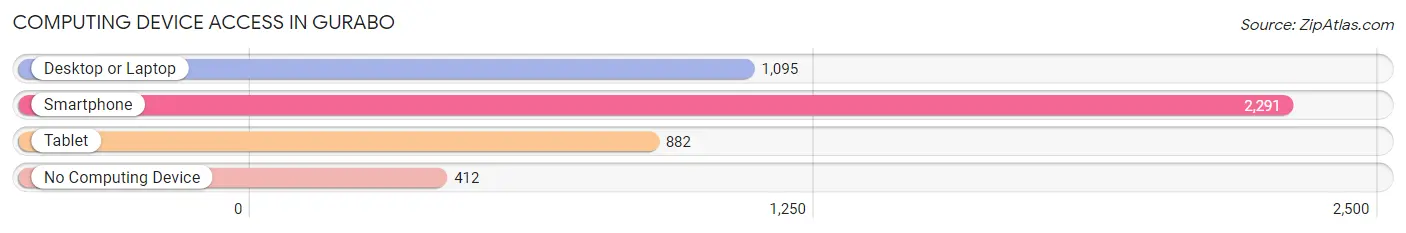
| Device Type | # Households | % Households |
| Desktop or Laptop | 1,095 | 39.2% |
| Smartphone | 2,291 | 82.1% |
| Tablet | 882 | 31.6% |
| No Computing Device | 412 | 14.8% |
| Total | 2,791 | 100.0% |
Internet Access in Gurabo
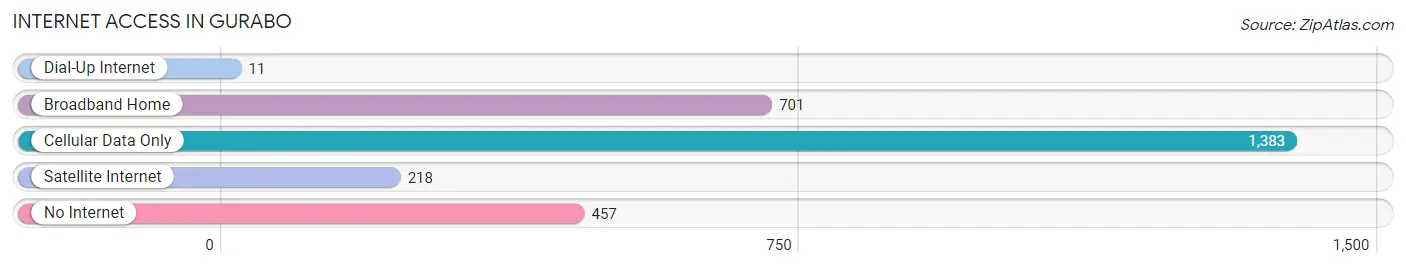
| Internet Type | # Households | % Households |
| Dial-Up Internet | 11 | 0.4% |
| Broadband Home | 701 | 25.1% |
| Cellular Data Only | 1,383 | 49.5% |
| Satellite Internet | 218 | 7.8% |
| No Internet | 457 | 16.4% |
| Total | 2,791 | 100.0% |
Gurabo Summary
Gurabo is a municipality located in the northeast region of Puerto Rico. It is part of the San Juan-Caguas-Guaynabo Metropolitan Statistical Area. As of the 2010 census, the population of Gurabo was 28,565.
History
Gurabo was founded in 1770 by Don Juan de Aponte y Díaz. The name of the town is derived from the Taino word “gurabot”, which means “place of the water”. The town was originally part of the municipality of San Lorenzo, but was established as an independent municipality in 1815.
Geography
Gurabo is located in the northeast region of Puerto Rico, about 20 miles east of San Juan. It is bordered by the municipalities of San Lorenzo, Trujillo Alto, Caguas, and Juncos. The town covers an area of approximately 24 square miles and is located at an elevation of approximately 500 feet above sea level.
Climate
Gurabo has a tropical climate, with temperatures ranging from the mid-70s to the mid-90s throughout the year. The town receives an average of about 60 inches of rain per year.
Economy
Gurabo’s economy is largely based on agriculture and manufacturing. The town is home to several large industrial parks, including the Gurabo Industrial Park, which is home to several major companies, including Johnson & Johnson, Pfizer, and Merck. The town is also home to several small businesses, including restaurants, retail stores, and service providers.
Demographics
As of the 2010 census, the population of Gurabo was 28,565. The population is largely of Puerto Rican descent, with a small percentage of other ethnicities, including African, Asian, and European. The median household income in Gurabo is $20,845, and the median age is 38.
Education
Gurabo is served by the Puerto Rico Department of Education. The town is home to several public schools, including the Escuela Superior de Gurabo, which serves students in grades 9-12. The town is also home to several private schools, including the Colegio San Antonio de Padua, which serves students in grades K-12.
Conclusion
Gurabo is a municipality located in the northeast region of Puerto Rico. It is part of the San Juan-Caguas-Guaynabo Metropolitan Statistical Area and has a population of 28,565. The town’s economy is largely based on agriculture and manufacturing, and it is home to several large industrial parks. The population is largely of Puerto Rican descent, with a small percentage of other ethnicities. Gurabo is served by the Puerto Rico Department of Education and is home to several public and private schools.
Common Questions
What is Per Capita Income in Gurabo?
Per Capita income in Gurabo is $16,899.
What is the Median Family Income in Gurabo?
Median Family Income in Gurabo is $24,583.
What is the Median Household income in Gurabo?
Median Household Income in Gurabo is $22,153.
What is Income or Wage Gap in Gurabo?
Income or Wage Gap in Gurabo is 26.3%.
Women in Gurabo earn 73.7 cents for every dollar earned by a man.
What is Family Income Deficit in Gurabo?
Family Income Deficit in Gurabo is $10,435.
Families that are below poverty line in Gurabo earn $10,435 less on average than the poverty threshold level.
What is Inequality or Gini Index in Gurabo?
Inequality or Gini Index in Gurabo is 0.57.
What is the Total Population of Gurabo?
Total Population of Gurabo is 6,966.
What is the Total Male Population of Gurabo?
Total Male Population of Gurabo is 3,454.
What is the Total Female Population of Gurabo?
Total Female Population of Gurabo is 3,512.
What is the Ratio of Males per 100 Females in Gurabo?
There are 98.35 Males per 100 Females in Gurabo.
What is the Ratio of Females per 100 Males in Gurabo?
There are 101.68 Females per 100 Males in Gurabo.
What is the Median Population Age in Gurabo?
Median Population Age in Gurabo is 41.5 Years.
What is the Average Family Size in Gurabo
Average Family Size in Gurabo is 3.0 People.
What is the Average Household Size in Gurabo
Average Household Size in Gurabo is 2.5 People.
How Large is the Labor Force in Gurabo?
There are 3,340 People in the Labor Forcein in Gurabo.
What is the Percentage of People in the Labor Force in Gurabo?
54.7% of People are in the Labor Force in Gurabo.
What is the Unemployment Rate in Gurabo?
Unemployment Rate in Gurabo is 14.3%.