Zip Codes with the Highest Percentage of Population Employed in Architecture & Engineering in Iowa
RELATED REPORTS & OPTIONS
Architecture & Engineering
Iowa
Compare Zip Codes
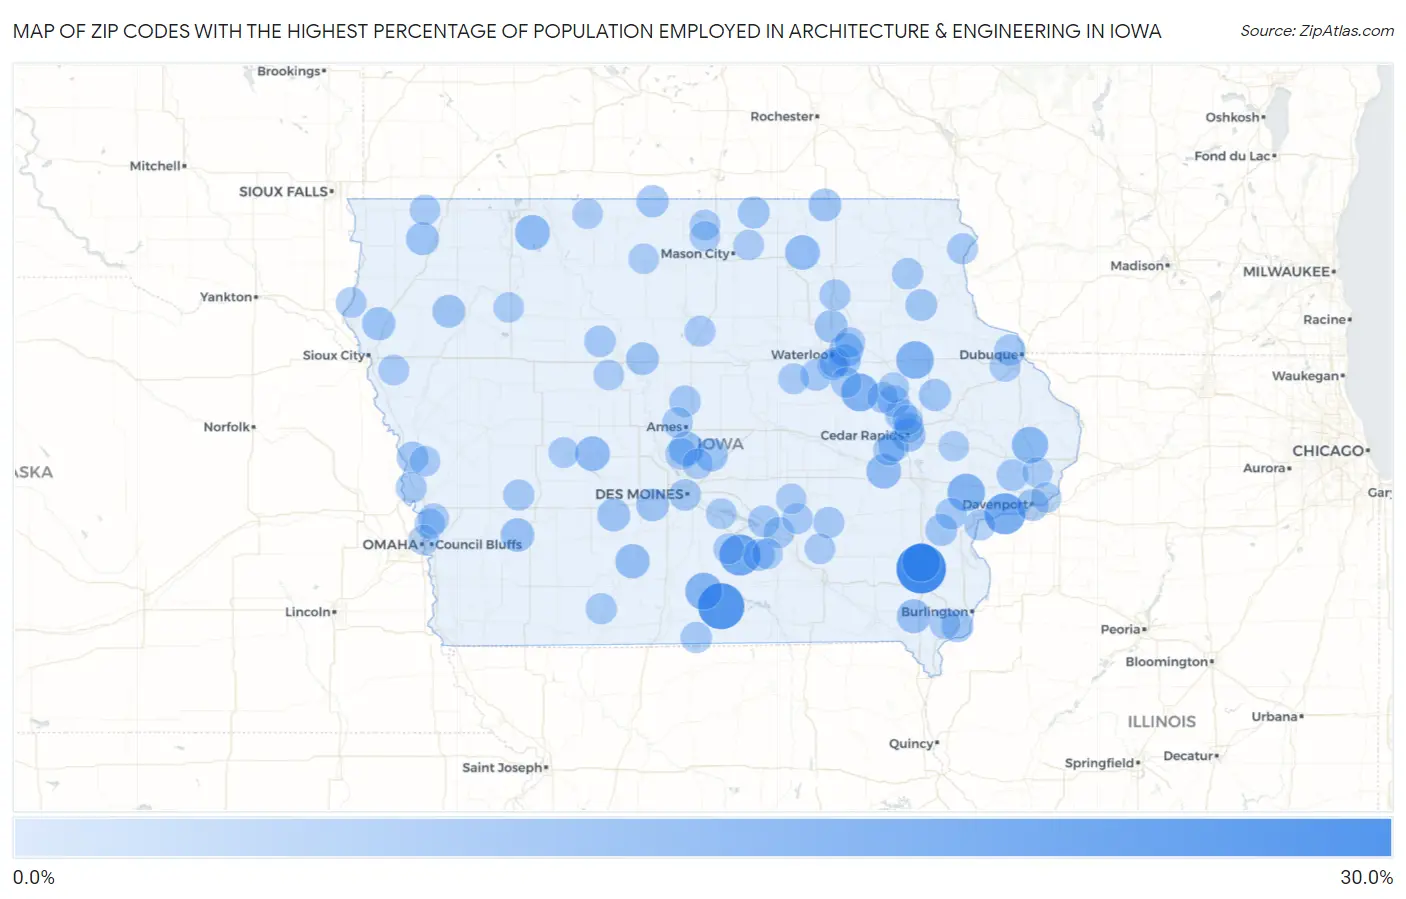
Map of Zip Codes with the Highest Percentage of Population Employed in Architecture & Engineering in Iowa
0.0%
30.0%
Zip Codes with the Highest Percentage of Population Employed in Architecture & Engineering in Iowa
| Zip Code | % Employed | vs State | vs National | |
| 1. | 52652 | 26.9% | 1.8%(+25.1)#1 | 2.1%(+24.8)#55 |
| 2. | 50165 | 22.7% | 1.8%(+20.9)#2 | 2.1%(+20.6)#81 |
| 3. | 50057 | 16.5% | 1.8%(+14.7)#3 | 2.1%(+14.3)#131 |
| 4. | 52759 | 16.2% | 1.8%(+14.4)#4 | 2.1%(+14.1)#135 |
| 5. | 52647 | 13.2% | 1.8%(+11.4)#5 | 2.1%(+11.0)#193 |
| 6. | 52313 | 12.6% | 1.8%(+10.8)#6 | 2.1%(+10.4)#217 |
| 7. | 50654 | 12.2% | 1.8%(+10.4)#7 | 2.1%(+10.1)#227 |
| 8. | 52720 | 12.1% | 1.8%(+10.3)#8 | 2.1%(+9.98)#235 |
| 9. | 50068 | 11.4% | 1.8%(+9.63)#9 | 2.1%(+9.26)#268 |
| 10. | 52774 | 10.7% | 1.8%(+8.88)#10 | 2.1%(+8.52)#299 |
| 11. | 51364 | 8.9% | 1.8%(+7.16)#11 | 2.1%(+6.80)#426 |
| 12. | 50026 | 8.7% | 1.8%(+6.97)#12 | 2.1%(+6.60)#451 |
| 13. | 52236 | 8.6% | 1.8%(+6.86)#13 | 2.1%(+6.49)#471 |
| 14. | 50620 | 8.6% | 1.8%(+6.79)#14 | 2.1%(+6.42)#479 |
| 15. | 50124 | 8.3% | 1.8%(+6.52)#15 | 2.1%(+6.15)#519 |
| 16. | 50149 | 8.2% | 1.8%(+6.44)#16 | 2.1%(+6.07)#531 |
| 17. | 50623 | 7.8% | 1.8%(+6.03)#17 | 2.1%(+5.66)#608 |
| 18. | 52631 | 7.7% | 1.8%(+5.91)#18 | 2.1%(+5.54)#624 |
| 19. | 51544 | 7.3% | 1.8%(+5.50)#19 | 2.1%(+5.13)#693 |
| 20. | 52401 | 7.2% | 1.8%(+5.45)#20 | 2.1%(+5.08)#702 |
| 21. | 51038 | 6.9% | 1.8%(+5.11)#21 | 2.1%(+4.74)#778 |
| 22. | 50161 | 6.6% | 1.8%(+4.84)#22 | 2.1%(+4.47)#846 |
| 23. | 51244 | 6.6% | 1.8%(+4.81)#23 | 2.1%(+4.44)#855 |
| 24. | 50070 | 6.5% | 1.8%(+4.72)#24 | 2.1%(+4.35)#886 |
| 25. | 50622 | 6.5% | 1.8%(+4.71)#25 | 2.1%(+4.34)#892 |
| 26. | 51014 | 6.5% | 1.8%(+4.69)#26 | 2.1%(+4.32)#899 |
| 27. | 50532 | 6.3% | 1.8%(+4.55)#27 | 2.1%(+4.19)#946 |
| 28. | 50038 | 6.3% | 1.8%(+4.52)#28 | 2.1%(+4.16)#955 |
| 29. | 52134 | 6.3% | 1.8%(+4.51)#29 | 2.1%(+4.14)#962 |
| 30. | 52219 | 5.7% | 1.8%(+3.96)#30 | 2.1%(+3.60)#1,198 |
| 31. | 50465 | 5.7% | 1.8%(+3.93)#31 | 2.1%(+3.57)#1,216 |
| 32. | 52341 | 5.4% | 1.8%(+3.59)#32 | 2.1%(+3.22)#1,406 |
| 33. | 52801 | 5.4% | 1.8%(+3.58)#33 | 2.1%(+3.21)#1,414 |
| 34. | 50426 | 5.4% | 1.8%(+3.57)#34 | 2.1%(+3.21)#1,418 |
| 35. | 50667 | 5.3% | 1.8%(+3.54)#35 | 2.1%(+3.17)#1,436 |
| 36. | 52658 | 5.3% | 1.8%(+3.48)#36 | 2.1%(+3.11)#1,472 |
| 37. | 52077 | 5.3% | 1.8%(+3.48)#37 | 2.1%(+3.11)#1,474 |
| 38. | 50116 | 5.3% | 1.8%(+3.48)#38 | 2.1%(+3.11)#1,475 |
| 39. | 52739 | 5.2% | 1.8%(+3.47)#39 | 2.1%(+3.10)#1,490 |
| 40. | 52213 | 5.2% | 1.8%(+3.39)#40 | 2.1%(+3.02)#1,537 |
| 41. | 50244 | 5.1% | 1.8%(+3.30)#41 | 2.1%(+2.94)#1,604 |
| 42. | 51545 | 5.1% | 1.8%(+3.28)#42 | 2.1%(+2.91)#1,621 |
| 43. | 50219 | 5.1% | 1.8%(+3.28)#43 | 2.1%(+2.91)#1,623 |
| 44. | 50309 | 5.0% | 1.8%(+3.23)#44 | 2.1%(+2.86)#1,649 |
| 45. | 52745 | 5.0% | 1.8%(+3.22)#45 | 2.1%(+2.85)#1,658 |
| 46. | 50643 | 5.0% | 1.8%(+3.20)#46 | 2.1%(+2.83)#1,679 |
| 47. | 52766 | 4.9% | 1.8%(+3.09)#47 | 2.1%(+2.73)#1,762 |
| 48. | 50524 | 4.9% | 1.8%(+3.09)#48 | 2.1%(+2.72)#1,770 |
| 49. | 50248 | 4.8% | 1.8%(+3.02)#49 | 2.1%(+2.65)#1,832 |
| 50. | 52135 | 4.6% | 1.8%(+2.86)#50 | 2.1%(+2.50)#1,985 |
| 51. | 52351 | 4.5% | 1.8%(+2.72)#51 | 2.1%(+2.36)#2,118 |
| 52. | 50147 | 4.5% | 1.8%(+2.71)#52 | 2.1%(+2.35)#2,129 |
| 53. | 50268 | 4.5% | 1.8%(+2.71)#53 | 2.1%(+2.34)#2,137 |
| 54. | 52002 | 4.5% | 1.8%(+2.69)#54 | 2.1%(+2.33)#2,158 |
| 55. | 51531 | 4.5% | 1.8%(+2.69)#55 | 2.1%(+2.32)#2,169 |
| 56. | 50845 | 4.4% | 1.8%(+2.60)#56 | 2.1%(+2.23)#2,281 |
| 57. | 50631 | 4.4% | 1.8%(+2.60)#57 | 2.1%(+2.23)#2,284 |
| 58. | 50143 | 4.3% | 1.8%(+2.52)#58 | 2.1%(+2.16)#2,363 |
| 59. | 52761 | 4.3% | 1.8%(+2.52)#59 | 2.1%(+2.15)#2,370 |
| 60. | 51556 | 4.2% | 1.8%(+2.45)#60 | 2.1%(+2.08)#2,455 |
| 61. | 52146 | 4.2% | 1.8%(+2.44)#61 | 2.1%(+2.07)#2,469 |
| 62. | 52068 | 4.1% | 1.8%(+2.33)#62 | 2.1%(+1.96)#2,603 |
| 63. | 52345 | 4.1% | 1.8%(+2.32)#63 | 2.1%(+1.95)#2,616 |
| 64. | 52624 | 4.1% | 1.8%(+2.30)#64 | 2.1%(+1.94)#2,634 |
| 65. | 50657 | 4.1% | 1.8%(+2.30)#65 | 2.1%(+1.93)#2,644 |
| 66. | 50071 | 4.1% | 1.8%(+2.29)#66 | 2.1%(+1.92)#2,667 |
| 67. | 50044 | 4.1% | 1.8%(+2.29)#67 | 2.1%(+1.92)#2,668 |
| 68. | 50163 | 4.0% | 1.8%(+2.27)#68 | 2.1%(+1.90)#2,701 |
| 69. | 51542 | 4.0% | 1.8%(+2.22)#69 | 2.1%(+1.86)#2,750 |
| 70. | 51007 | 4.0% | 1.8%(+2.22)#70 | 2.1%(+1.85)#2,763 |
| 71. | 51001 | 4.0% | 1.8%(+2.21)#71 | 2.1%(+1.85)#2,767 |
| 72. | 50207 | 4.0% | 1.8%(+2.18)#72 | 2.1%(+1.81)#2,828 |
| 73. | 52228 | 3.9% | 1.8%(+2.14)#73 | 2.1%(+1.78)#2,887 |
| 74. | 50701 | 3.9% | 1.8%(+2.11)#74 | 2.1%(+1.74)#2,952 |
| 75. | 50702 | 3.9% | 1.8%(+2.10)#75 | 2.1%(+1.73)#2,964 |
| 76. | 52561 | 3.8% | 1.8%(+2.06)#76 | 2.1%(+1.69)#3,024 |
| 77. | 50058 | 3.8% | 1.8%(+2.05)#77 | 2.1%(+1.69)#3,025 |
| 78. | 50446 | 3.8% | 1.8%(+2.05)#78 | 2.1%(+1.68)#3,040 |
| 79. | 51243 | 3.8% | 1.8%(+2.03)#79 | 2.1%(+1.67)#3,059 |
| 80. | 50651 | 3.8% | 1.8%(+1.99)#80 | 2.1%(+1.62)#3,151 |
| 81. | 50483 | 3.8% | 1.8%(+1.99)#81 | 2.1%(+1.62)#3,156 |
| 82. | 51564 | 3.8% | 1.8%(+1.98)#82 | 2.1%(+1.61)#3,178 |
| 83. | 50252 | 3.8% | 1.8%(+1.98)#83 | 2.1%(+1.61)#3,180 |
| 84. | 51526 | 3.7% | 1.8%(+1.92)#84 | 2.1%(+1.55)#3,281 |
| 85. | 50434 | 3.7% | 1.8%(+1.90)#85 | 2.1%(+1.54)#3,324 |
| 86. | 52756 | 3.7% | 1.8%(+1.89)#86 | 2.1%(+1.52)#3,357 |
| 87. | 50014 | 3.7% | 1.8%(+1.87)#87 | 2.1%(+1.50)#3,396 |
| 88. | 50523 | 3.7% | 1.8%(+1.87)#88 | 2.1%(+1.50)#3,398 |
| 89. | 52402 | 3.6% | 1.8%(+1.86)#89 | 2.1%(+1.49)#3,429 |
| 90. | 50514 | 3.6% | 1.8%(+1.85)#90 | 2.1%(+1.49)#3,435 |
| 91. | 50242 | 3.6% | 1.8%(+1.85)#91 | 2.1%(+1.49)#3,437 |
| 92. | 50467 | 3.6% | 1.8%(+1.85)#92 | 2.1%(+1.49)#3,439 |
| 93. | 50576 | 3.6% | 1.8%(+1.84)#93 | 2.1%(+1.47)#3,468 |
| 94. | 52722 | 3.5% | 1.8%(+1.74)#94 | 2.1%(+1.38)#3,663 |
| 95. | 50626 | 3.5% | 1.8%(+1.74)#95 | 2.1%(+1.38)#3,666 |
| 96. | 52328 | 3.5% | 1.8%(+1.74)#96 | 2.1%(+1.37)#3,675 |
| 97. | 52306 | 3.5% | 1.8%(+1.73)#97 | 2.1%(+1.36)#3,703 |
| 98. | 50073 | 3.5% | 1.8%(+1.72)#98 | 2.1%(+1.36)#3,724 |
| 99. | 51510 | 3.5% | 1.8%(+1.72)#99 | 2.1%(+1.35)#3,733 |
| 100. | 52352 | 3.5% | 1.8%(+1.70)#100 | 2.1%(+1.33)#3,778 |
Common Questions
What are the Top 10 Zip Codes with the Highest Percentage of Population Employed in Architecture & Engineering in Iowa?
Top 10 Zip Codes with the Highest Percentage of Population Employed in Architecture & Engineering in Iowa are:
What zip code has the Highest Percentage of Population Employed in Architecture & Engineering in Iowa?
52652 has the Highest Percentage of Population Employed in Architecture & Engineering in Iowa with 26.9%.
What is the Percentage of Population Employed in Architecture & Engineering in the State of Iowa?
Percentage of Population Employed in Architecture & Engineering in Iowa is 1.8%.
What is the Percentage of Population Employed in Architecture & Engineering in the United States?
Percentage of Population Employed in Architecture & Engineering in the United States is 2.1%.