Zip Codes with the Highest Percentage of Population Employed in Architecture & Engineering in Mckeesport, PA
RELATED REPORTS & OPTIONS
Architecture & Engineering
Mckeesport
Compare Zip Codes
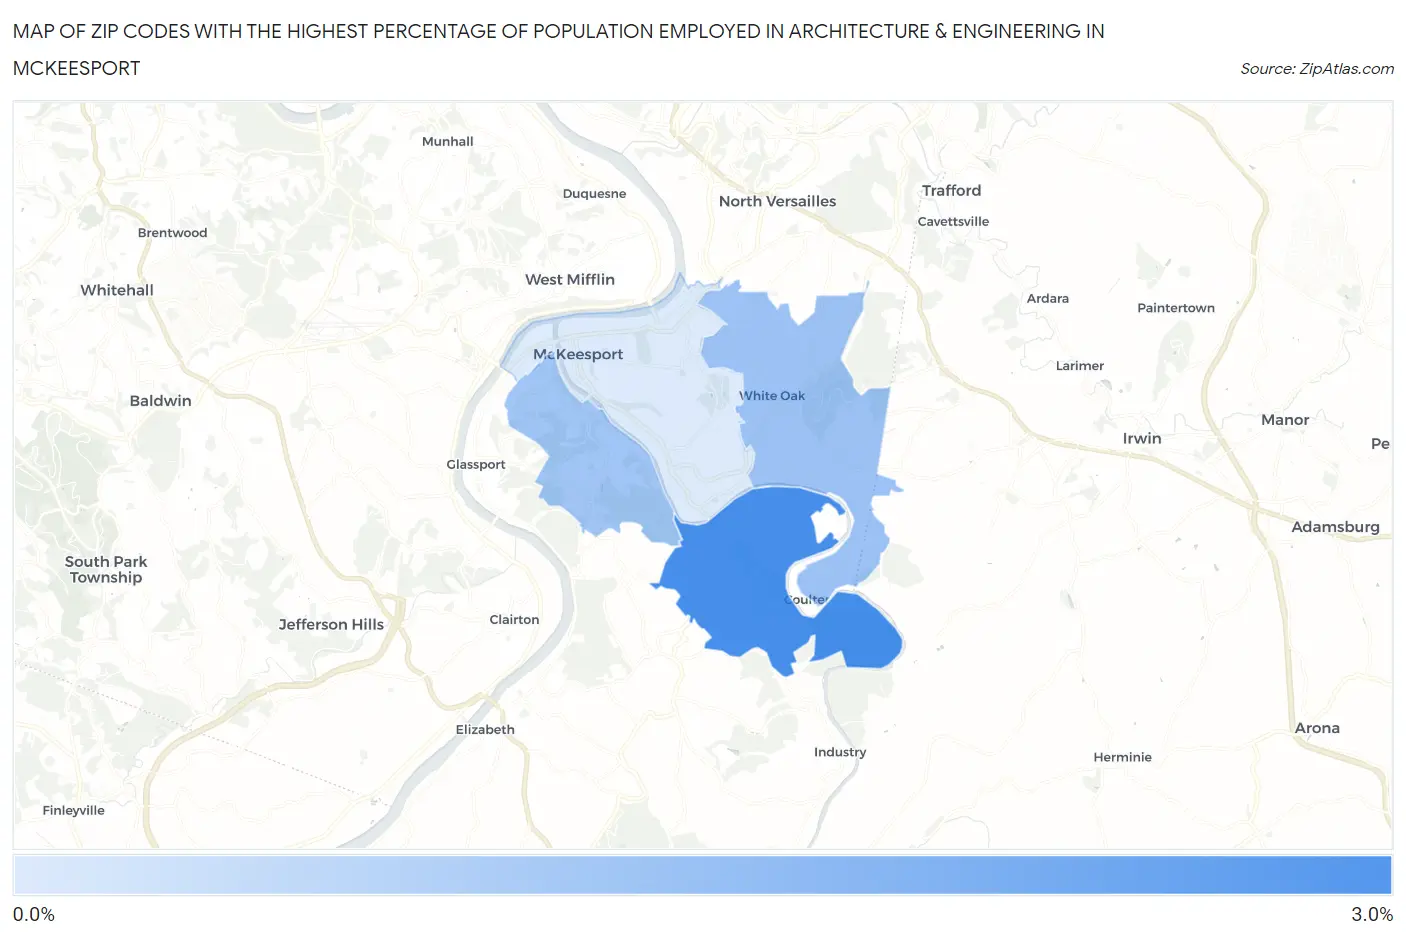
Map of Zip Codes with the Highest Percentage of Population Employed in Architecture & Engineering in Mckeesport
0.68%
2.8%
Zip Codes with the Highest Percentage of Population Employed in Architecture & Engineering in Mckeesport, PA
| Zip Code | % Employed | vs State | vs National | |
| 1. | 15135 | 2.8% | 2.0%(+0.709)#328 | 2.1%(+0.601)#5,966 |
| 2. | 15131 | 1.6% | 2.0%(-0.440)#707 | 2.1%(-0.548)#12,177 |
| 3. | 15133 | 1.5% | 2.0%(-0.526)#749 | 2.1%(-0.635)#12,778 |
| 4. | 15132 | 0.68% | 2.0%(-1.36)#1,085 | 2.1%(-1.47)#19,009 |
1
Common Questions
What are the Top 3 Zip Codes with the Highest Percentage of Population Employed in Architecture & Engineering in Mckeesport, PA?
Top 3 Zip Codes with the Highest Percentage of Population Employed in Architecture & Engineering in Mckeesport, PA are:
What zip code has the Highest Percentage of Population Employed in Architecture & Engineering in Mckeesport, PA?
15135 has the Highest Percentage of Population Employed in Architecture & Engineering in Mckeesport, PA with 2.8%.
What is the Percentage of Population Employed in Architecture & Engineering in Mckeesport, PA?
Percentage of Population Employed in Architecture & Engineering in Mckeesport is 0.71%.
What is the Percentage of Population Employed in Architecture & Engineering in Pennsylvania?
Percentage of Population Employed in Architecture & Engineering in Pennsylvania is 2.0%.
What is the Percentage of Population Employed in Architecture & Engineering in the United States?
Percentage of Population Employed in Architecture & Engineering in the United States is 2.1%.