Zip Codes with the Highest Percentage of Population Employed in Architecture & Engineering in Alaska
RELATED REPORTS & OPTIONS
Architecture & Engineering
Alaska
Compare Zip Codes
Map of Zip Codes with the Highest Percentage of Population Employed in Architecture & Engineering in Alaska
0.0%
30.0%
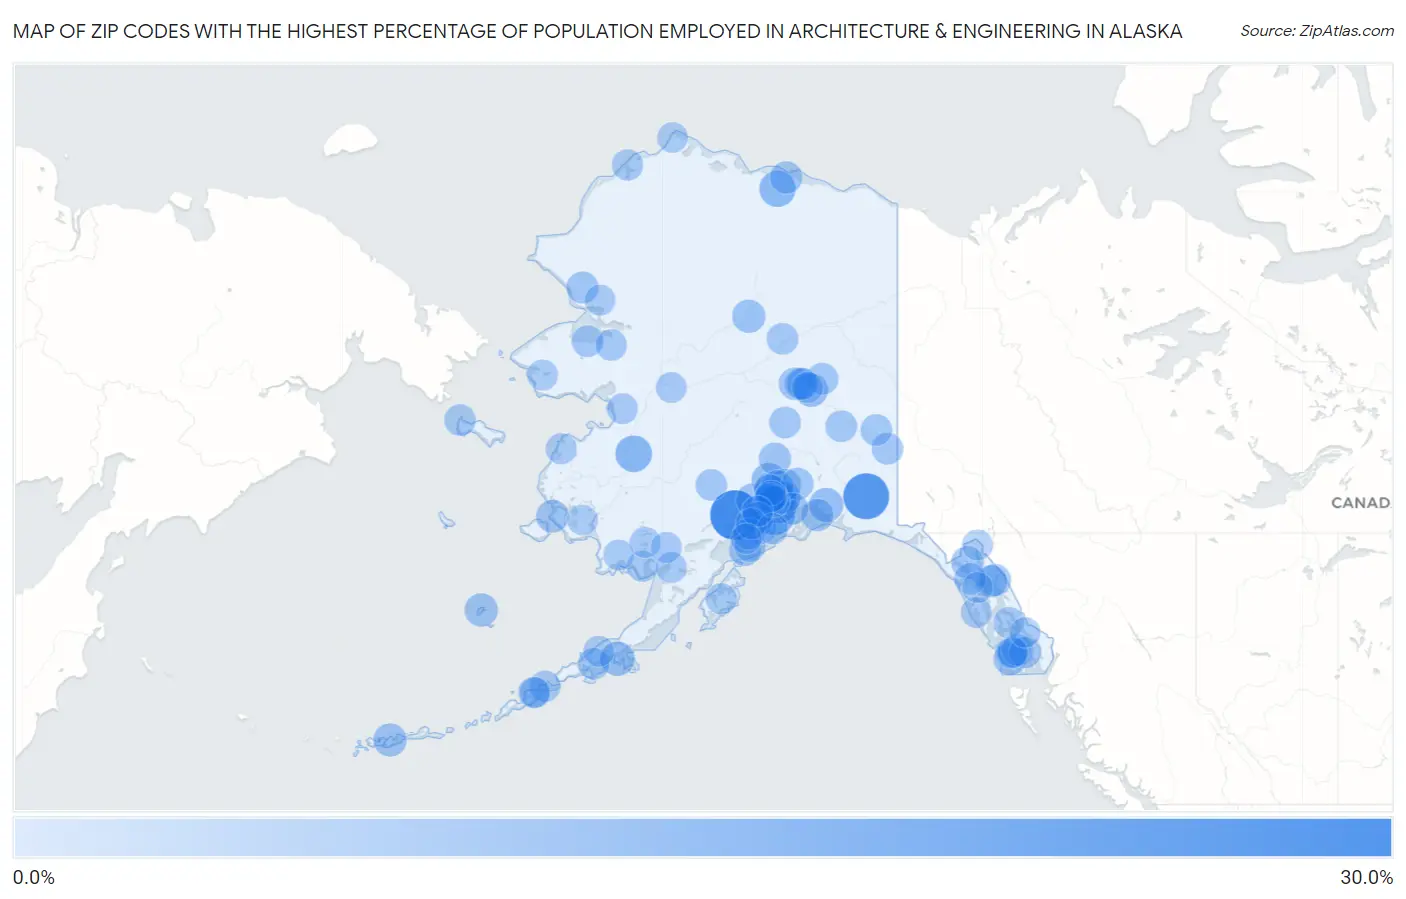
Zip Codes with the Highest Percentage of Population Employed in Architecture & Engineering in Alaska
| Zip Code | % Employed | vs State | vs National | |
| 1. | 99635 | 29.6% | 2.3%(+27.3)#1 | 2.1%(+27.5)#52 |
| 2. | 99566 | 23.8% | 2.3%(+21.5)#2 | 2.1%(+21.7)#73 |
| 3. | 99631 | 14.4% | 2.3%(+12.2)#3 | 2.1%(+12.3)#157 |
| 4. | 99540 | 14.1% | 2.3%(+11.8)#4 | 2.1%(+11.9)#172 |
| 5. | 99665 | 9.4% | 2.3%(+7.09)#5 | 2.1%(+7.23)#381 |
| 6. | 99505 | 9.2% | 2.3%(+6.87)#6 | 2.1%(+7.00)#397 |
| 7. | 99519 | 8.9% | 2.3%(+6.60)#7 | 2.1%(+6.73)#438 |
| 8. | 99661 | 5.9% | 2.3%(+3.64)#8 | 2.1%(+3.78)#1,115 |
| 9. | 99688 | 5.9% | 2.3%(+3.58)#9 | 2.1%(+3.71)#1,152 |
| 10. | 99686 | 5.6% | 2.3%(+3.33)#10 | 2.1%(+3.47)#1,273 |
| 11. | 99702 | 5.2% | 2.3%(+2.89)#11 | 2.1%(+3.03)#1,528 |
| 12. | 99660 | 4.5% | 2.3%(+2.23)#12 | 2.1%(+2.36)#2,109 |
| 13. | 99567 | 4.5% | 2.3%(+2.21)#13 | 2.1%(+2.35)#2,128 |
| 14. | 99568 | 4.2% | 2.3%(+1.90)#14 | 2.1%(+2.03)#2,510 |
| 15. | 99726 | 4.2% | 2.3%(+1.88)#15 | 2.1%(+2.02)#2,530 |
| 16. | 99546 | 4.1% | 2.3%(+1.86)#16 | 2.1%(+2.00)#2,562 |
| 17. | 99682 | 3.9% | 2.3%(+1.62)#17 | 2.1%(+1.76)#2,928 |
| 18. | 99501 | 3.8% | 2.3%(+1.49)#18 | 2.1%(+1.62)#3,149 |
| 19. | 99922 | 3.7% | 2.3%(+1.42)#19 | 2.1%(+1.55)#3,286 |
| 20. | 99681 | 3.6% | 2.3%(+1.37)#20 | 2.1%(+1.50)#3,406 |
| 21. | 99516 | 3.6% | 2.3%(+1.28)#21 | 2.1%(+1.42)#3,571 |
| 22. | 99577 | 3.4% | 2.3%(+1.13)#22 | 2.1%(+1.26)#3,942 |
| 23. | 99827 | 3.2% | 2.3%(+0.957)#23 | 2.1%(+1.09)#4,350 |
| 24. | 99652 | 3.2% | 2.3%(+0.952)#24 | 2.1%(+1.09)#4,365 |
| 25. | 99709 | 3.2% | 2.3%(+0.927)#25 | 2.1%(+1.06)#4,436 |
| 26. | 99574 | 3.1% | 2.3%(+0.783)#26 | 2.1%(+0.918)#4,823 |
| 27. | 99734 | 3.0% | 2.3%(+0.701)#27 | 2.1%(+0.836)#5,103 |
| 28. | 99504 | 2.9% | 2.3%(+0.654)#28 | 2.1%(+0.789)#5,283 |
| 29. | 99676 | 2.8% | 2.3%(+0.545)#29 | 2.1%(+0.680)#5,669 |
| 30. | 99925 | 2.7% | 2.3%(+0.377)#30 | 2.1%(+0.512)#6,326 |
| 31. | 99645 | 2.7% | 2.3%(+0.374)#31 | 2.1%(+0.509)#6,335 |
| 32. | 99654 | 2.6% | 2.3%(+0.337)#32 | 2.1%(+0.472)#6,487 |
| 33. | 99669 | 2.6% | 2.3%(+0.319)#33 | 2.1%(+0.454)#6,569 |
| 34. | 99801 | 2.6% | 2.3%(+0.303)#34 | 2.1%(+0.438)#6,635 |
| 35. | 99508 | 2.5% | 2.3%(+0.250)#35 | 2.1%(+0.385)#6,860 |
| 36. | 99824 | 2.4% | 2.3%(+0.149)#36 | 2.1%(+0.284)#7,320 |
| 37. | 99761 | 2.4% | 2.3%(+0.078)#37 | 2.1%(+0.213)#7,660 |
| 38. | 99518 | 2.3% | 2.3%(+0.050)#38 | 2.1%(+0.185)#7,783 |
| 39. | 99663 | 2.3% | 2.3%(+0.028)#39 | 2.1%(+0.163)#7,882 |
| 40. | 99515 | 2.3% | 2.3%(+0.007)#40 | 2.1%(+0.142)#7,997 |
| 41. | 99502 | 2.3% | 2.3%(+0.005)#41 | 2.1%(+0.140)#8,003 |
| 42. | 99775 | 2.3% | 2.3%(-0.032)#42 | 2.1%(+0.103)#8,191 |
| 43. | 99674 | 2.2% | 2.3%(-0.057)#43 | 2.1%(+0.078)#8,330 |
| 44. | 99693 | 2.2% | 2.3%(-0.074)#44 | 2.1%(+0.061)#8,433 |
| 45. | 99712 | 2.2% | 2.3%(-0.107)#45 | 2.1%(+0.028)#8,615 |
| 46. | 99517 | 2.1% | 2.3%(-0.166)#46 | 2.1%(-0.031)#8,930 |
| 47. | 99507 | 2.0% | 2.3%(-0.322)#47 | 2.1%(-0.187)#9,833 |
| 48. | 99703 | 1.9% | 2.3%(-0.338)#48 | 2.1%(-0.203)#9,937 |
| 49. | 99755 | 1.9% | 2.3%(-0.377)#49 | 2.1%(-0.242)#10,188 |
| 50. | 99919 | 1.9% | 2.3%(-0.390)#50 | 2.1%(-0.255)#10,290 |
| 51. | 99736 | 1.9% | 2.3%(-0.397)#51 | 2.1%(-0.262)#10,326 |
| 52. | 99623 | 1.8% | 2.3%(-0.461)#52 | 2.1%(-0.326)#10,703 |
| 53. | 99764 | 1.8% | 2.3%(-0.498)#53 | 2.1%(-0.363)#10,910 |
| 54. | 99826 | 1.8% | 2.3%(-0.514)#54 | 2.1%(-0.379)#11,007 |
| 55. | 99701 | 1.7% | 2.3%(-0.538)#55 | 2.1%(-0.403)#11,191 |
| 56. | 99780 | 1.7% | 2.3%(-0.546)#56 | 2.1%(-0.411)#11,249 |
| 57. | 99503 | 1.7% | 2.3%(-0.610)#57 | 2.1%(-0.475)#11,669 |
| 58. | 99612 | 1.7% | 2.3%(-0.623)#58 | 2.1%(-0.488)#11,759 |
| 59. | 99901 | 1.6% | 2.3%(-0.648)#59 | 2.1%(-0.513)#11,937 |
| 60. | 99737 | 1.6% | 2.3%(-0.664)#60 | 2.1%(-0.529)#12,051 |
| 61. | 99742 | 1.6% | 2.3%(-0.671)#61 | 2.1%(-0.536)#12,105 |
| 62. | 99506 | 1.6% | 2.3%(-0.733)#62 | 2.1%(-0.598)#12,495 |
| 63. | 99672 | 1.5% | 2.3%(-0.743)#63 | 2.1%(-0.608)#12,556 |
| 64. | 99603 | 1.5% | 2.3%(-0.768)#64 | 2.1%(-0.633)#12,762 |
| 65. | 99639 | 1.4% | 2.3%(-0.864)#65 | 2.1%(-0.729)#13,432 |
| 66. | 99727 | 1.4% | 2.3%(-0.933)#66 | 2.1%(-0.798)#13,945 |
| 67. | 99553 | 1.3% | 2.3%(-1.01)#67 | 2.1%(-0.874)#14,486 |
| 68. | 99705 | 1.2% | 2.3%(-1.05)#68 | 2.1%(-0.911)#14,769 |
| 69. | 99610 | 1.2% | 2.3%(-1.09)#69 | 2.1%(-0.952)#15,094 |
| 70. | 99692 | 1.2% | 2.3%(-1.09)#70 | 2.1%(-0.957)#15,143 |
| 71. | 99664 | 1.2% | 2.3%(-1.10)#71 | 2.1%(-0.962)#15,186 |
| 72. | 99611 | 1.1% | 2.3%(-1.14)#72 | 2.1%(-1.01)#15,549 |
| 73. | 99615 | 1.1% | 2.3%(-1.22)#73 | 2.1%(-1.09)#16,152 |
| 74. | 99628 | 1.0% | 2.3%(-1.26)#74 | 2.1%(-1.12)#16,428 |
| 75. | 99833 | 1.0% | 2.3%(-1.27)#75 | 2.1%(-1.13)#16,473 |
| 76. | 99782 | 1.0% | 2.3%(-1.27)#76 | 2.1%(-1.14)#16,526 |
| 77. | 99633 | 1.0% | 2.3%(-1.28)#77 | 2.1%(-1.14)#16,564 |
| 78. | 99576 | 0.92% | 2.3%(-1.37)#78 | 2.1%(-1.23)#17,251 |
| 79. | 99581 | 0.85% | 2.3%(-1.43)#79 | 2.1%(-1.30)#17,747 |
| 80. | 99636 | 0.85% | 2.3%(-1.44)#80 | 2.1%(-1.30)#17,778 |
| 81. | 99762 | 0.74% | 2.3%(-1.55)#81 | 2.1%(-1.41)#18,641 |
| 82. | 99556 | 0.71% | 2.3%(-1.57)#82 | 2.1%(-1.44)#18,819 |
| 83. | 99752 | 0.69% | 2.3%(-1.60)#83 | 2.1%(-1.46)#18,985 |
| 84. | 99571 | 0.68% | 2.3%(-1.61)#84 | 2.1%(-1.47)#19,067 |
| 85. | 99741 | 0.60% | 2.3%(-1.69)#85 | 2.1%(-1.55)#19,650 |
| 86. | 99685 | 0.57% | 2.3%(-1.71)#86 | 2.1%(-1.58)#19,815 |
| 87. | 99835 | 0.52% | 2.3%(-1.76)#87 | 2.1%(-1.62)#20,118 |
| 88. | 99684 | 0.50% | 2.3%(-1.78)#88 | 2.1%(-1.65)#20,262 |
| 89. | 99829 | 0.46% | 2.3%(-1.82)#89 | 2.1%(-1.69)#20,519 |
| 90. | 99678 | 0.40% | 2.3%(-1.88)#90 | 2.1%(-1.75)#20,937 |
| 91. | 99840 | 0.39% | 2.3%(-1.90)#91 | 2.1%(-1.76)#21,055 |
| 92. | 99921 | 0.21% | 2.3%(-2.08)#92 | 2.1%(-1.94)#22,015 |
| 93. | 99559 | 0.20% | 2.3%(-2.09)#93 | 2.1%(-1.95)#22,055 |
| 94. | 99723 | 0.19% | 2.3%(-2.09)#94 | 2.1%(-1.96)#22,073 |
| 95. | 99929 | 0.12% | 2.3%(-2.16)#95 | 2.1%(-2.03)#22,329 |
Common Questions
What are the Top 10 Zip Codes with the Highest Percentage of Population Employed in Architecture & Engineering in Alaska?
Top 10 Zip Codes with the Highest Percentage of Population Employed in Architecture & Engineering in Alaska are:
What zip code has the Highest Percentage of Population Employed in Architecture & Engineering in Alaska?
99635 has the Highest Percentage of Population Employed in Architecture & Engineering in Alaska with 29.6%.
What is the Percentage of Population Employed in Architecture & Engineering in the State of Alaska?
Percentage of Population Employed in Architecture & Engineering in Alaska is 2.3%.
What is the Percentage of Population Employed in Architecture & Engineering in the United States?
Percentage of Population Employed in Architecture & Engineering in the United States is 2.1%.